Embed Size (px)
Citation preview
DRIVING RETAIL STORE PERFORMANCE:A SERVICE PROFIT CHAIN PERSPECTIVE
DISSERTATION
Presented in Partial Fulfillment of the Requirements for
the Degree Doctor of Philosophy in the Graduate School
of The Ohio State University
By
Todd Michael Stodnick, M.A.
*****
The Ohio State University
2005
Dissertation Committee:
Professor David A. Collier, Ph.D., Adviser Approved by
Professor W.C. Benton, Ph.D.
Len Schlesinger, Ph.D., Limited Brands Adviser
Graduate Program in Business Administration
ii
ABSTRACT
One service management model that has been gaining momentum in academic
and practitioner circles alike is the service profit chain. First introduced in the early
1990’s, the service profit chain offers a structural framework to service management
(Heskett et al, 1994). The theory basically asserts that providing employees with a
superior internal working environment will lead to satisfied employees who are both
loyal to the organization and able to provide the customer with an excellent service
experience. Customers will recognize and value the outstanding service afforded them.
Over time they will exhibit loyalty behaviors such as continued purchasing and increased
referrals. These loyalty behaviors will generate both market share and profitability
increases for the service firm.
Despite its widespread adoption by many service industry leaders (e.g. Southwest
Airlines, Progressive Insurance, etc) and a growing amount of academic literary attention
to the topic, very little empirical research has attempted to validate the basic tenets within
the service profit chain. As such, the primary objective of this research is to test the
structural framework presented in the service profit chain. Two structural models,
incorporating nine distinct hypotheses, are the means by which this objective is carried
out. To support this primary objective, several secondary objectives must be met.
Because this research will use several constructs that have yet to be rigorously validated,
much time and attention must be devoted to scale development. The population frame
iii
used in this study will be one large retail chain within the women’s specialty apparel
industry.
Seven of the nine hypotheses are supported, two are not. The overall fit statistics
of the two models employed suggest that the models do fit the data well, indicating
support for the underlying theory behind the service profit chain. A summary of the
hypotheses includes: 1.) internal service quality drives both employee satisfaction and
loyalty, 2.) employee satisfaction drives employee loyalty 3.) total retail experience
drives a customer’s perception of retail value and their satisfaction, 4.) customer
satisfaction drives customer loyalty.

iv
Dedicated to Our Jacqueline, There is A Light That Never Goes Out
I dreamt about you last night,and I fell out of bed twice….
VVHo will believe my verse in time to come,If it were filled with your most high deserts?
Though yet heaven knows it is but as a tombWhich hides your life , and shows not half your parts:
If I could write the beauty of your eyes,And in fresh numbers number all your graces,
The age to come would say this Poet lies,Such heavenly touches nere toucht earthly faces.So should my papers (yellowed with their age)
Be scorn'd,like old men of less truth then tongue,And your true rights be termed a Poets rage,
And stretched meter of an Antique song. But were some child of yours alive that time, You should live twice in it,and in my rhyme.
(Shakespeare, Sonnet XVII)

v
ACKNOWLEDGMENTS
I would like to thank first my advisor David Collier for his invaluable support
throughout this entire dissertation process. His willingness to share his wealth of
knowledge and expertise has made my work all the better. I would also like to extend my
gratitude to my committee members, W.C. Benton and Len Schlesinger, for their
assistance and guidance. Both have positively shaped this work and contributed to my
growth as a researcher.
For their financial contributions to this research, I am grateful to the
LimitedBrands, Inc. I owe thanks to many people throughout the organization who made
the data collection process not only possible but also trouble free. Special thanks are
extended to Dave Klein and Julie Beckman for their tireless efforts.
I would like to thank the Ohio State University, and specifically the Fisher
College of Business and the Management Science Department, for their support over the
last four and half years. I am grateful for all the educational possibilities offered to me.
Finally, I would be remiss not to mention the endless support of my family and
friends throughout this process. They provided inspiration and encouragement in times
of need without which this work would not have been possible.
vi
VITA
June 28, 1972………………………..Born, Cleveland, Ohio
1994…………………………………B.A., Business Administration (Honors), MountUnion College
1996…………………………………M.A., English, University of Manchester, England
1996 – 2000…………………………Materials Manager, Dexter Axle, Elkhart, Indiana
2002…………………………………M.A., Business Administration, The Ohio StateUniversity
2000 – 2004…………………………Graduate Research and Teaching Associate, TheOhio State University
2004 – current .................................. Visiting Assistant Professor, University of NorthTexas
PUBLICATIONS
REFEREED PROCEEDINGS:
Stodnick, M. and Collier, D. “What contributes to total retail experience?” Proceedingsof the 35th National Decision Sciences Institute Annual Meeting, Boston, 2004.
vii
Stodnick, M. and Collier. D. “Defining internal service quality – Results of a pilot studyin specialty retailing.” Proceedings of the Midwest Regional Decision SciencesInstitute Annual Meeting, Toledo, Ohio 2004.
FIELDS OF STUDY
Major Field: Business Administration
Concentration: Operations Management
Minor Field: Industrial Engineering
viii
TABLE OF CONTENTS
PageAbstract............................................................................................................... ii
Dedication.......................................................................................................... iv
Acknowledgements ............................................................................................. v
Vita .................................................................................................................... vi
List of Tables ..................................................................................................... xi
List of Figures .................................................................................................. xiii
Chapters:
1. Introduction.................................................................................................... 11.1. Research motivation....................................................................... 101.2. Research objectives........................................................................ 121.3. Research theory and hypotheses ..................................................... 161.4. Research methods .......................................................................... 171.5. Layout of dissertation..................................................................... 19
2. Literature Review – Operating Strategy and Service Delivery System .......... 222.1. Service profit chain ........................................................................ 24
2.1.1. Empirical support ............................................................ 262.1.2. Service profit chain parallels............................................ 31
2.2. Internal service quality ................................................................... 382.2.1. Internal service quality parallels....................................... 412.2.2. Linking internal service quality to employee indicators.... 522.2.3. Individual dimensions of internal service quality ............. 58
2.3. Employee satisfaction, loyalty and productivity.............................. 70
ix
2.4. Summary........................................................................................ 75
3. Literature Review – Service Concept and Target Market .............................. 773.1. Total retail experience.................................................................... 77
3.1.1. Parallels to total retail experience..................................... 813.1.2. Individual dimensions of total retail experience ............... 83
3.2. Value ............................................................................................. 953.3. Customer satisfaction and loyalty................................................... 983.4. Summary.......................................................................................103
4. Measurement Model Development ..............................................................1054.1. Methodology.................................................................................106
4.1.1. Pilot study ......................................................................1064.1.2. Main study......................................................................110
4.2. Population frame...........................................................................1134.2.1. Sampling plan – pilot study ............................................1154.2.2. Sampling plan – main study............................................116
4.3. Survey development......................................................................1174.4. Measurement model ......................................................................118
4.4.1. Pilot study factor development........................................1184.4.2. Main study factor development.......................................129
4.5. Summary.......................................................................................140
5. Structural Models and Analysis ...................................................................1435.1. Structural equation modeling.........................................................1455.2. Employee model ...........................................................................146
5.2.1. Composition of internal service quality...........................1475.2.2. Linking internal service quality to satisfaction, loyalty and productivity..............................................................153
5.3. Customer model ............................................................................1665.3.1. Composition of total retail experience.............................1675.3.2. Linearity between customer satisfaction and customer loyalty ............................................................................1735.3.3. Linking total retail experience, value, satisfaction and loyalty......................................................................175
5.4. Summary.......................................................................................185
6. Summary and future research ......................................................................1886.1. Research objective ........................................................................1886.2. Overview of the study ...................................................................1896.3. Summary of research findings .......................................................192
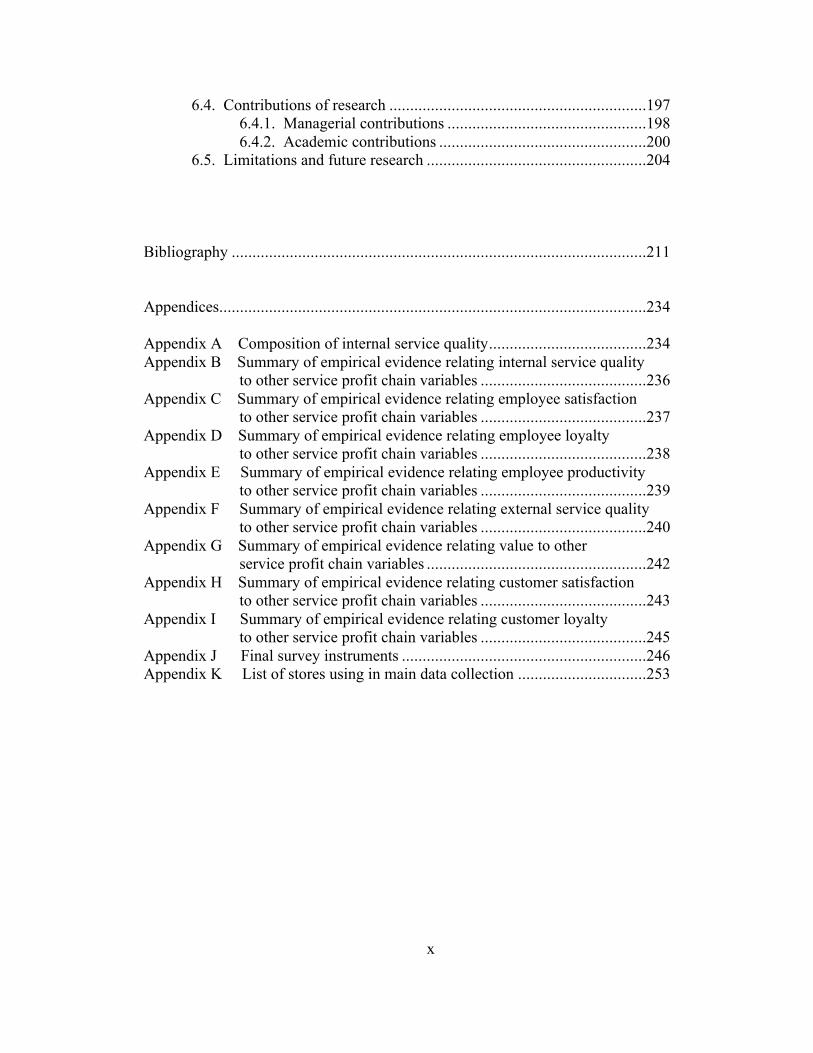
x
6.4. Contributions of research ..............................................................1976.4.1. Managerial contributions ................................................1986.4.2. Academic contributions ..................................................200
6.5. Limitations and future research .....................................................204
Bibliography ....................................................................................................211
Appendices.......................................................................................................234
Appendix A Composition of internal service quality......................................234Appendix B Summary of empirical evidence relating internal service quality to other service profit chain variables ........................................236Appendix C Summary of empirical evidence relating employee satisfaction to other service profit chain variables ........................................237Appendix D Summary of empirical evidence relating employee loyalty to other service profit chain variables ........................................238Appendix E Summary of empirical evidence relating employee productivity to other service profit chain variables ........................................239Appendix F Summary of empirical evidence relating external service quality to other service profit chain variables ........................................240Appendix G Summary of empirical evidence relating value to other service profit chain variables .....................................................242Appendix H Summary of empirical evidence relating customer satisfaction to other service profit chain variables ........................................243Appendix I Summary of empirical evidence relating customer loyalty to other service profit chain variables ........................................245Appendix J Final survey instruments ...........................................................246Appendix K List of stores using in main data collection ...............................253
xi
LIST OF TABLES
Table Page
1.1. Anecdotal evidence supporting the service profit chain .............................. 9
2.1. Wright and Boswell (2002) HRM typology................................................ 46
3.1. Service quality paradigms .......................................................................... 85
3.2. Effects generated by customer satisfaction and loyalty............................... 101
4.1. Summary of structural equation modeling fit indices.................................. 112
4.2. Results of pilot study construct development -- Empowerment .................. 119
4.3. Results of pilot study construct development – Work Design ..................... 120
4.4. Results of pilot study construct development -- Rewards and Recognition 121
4.5. Results of pilot study construct development -- Employee Satisfaction ..... 122
4.6. Results of pilot study construct development -- Employee Productivity .... 123
4.7. Results of pilot study construct development -- Servicescape .................... 124
4.8. Summary of pilot study construct development – Employee Portion .......... 125
4.9 Summary of pilot study construct development – Customer Portion........... 126
4.10. Factor correlation analysis between internal service quality dimensions andemployee outcome measures...................................................................... 128
4.11. Factor correlation analysis between total retail experience dimensions andcustomer outcome measures....................................................................... 129
xii
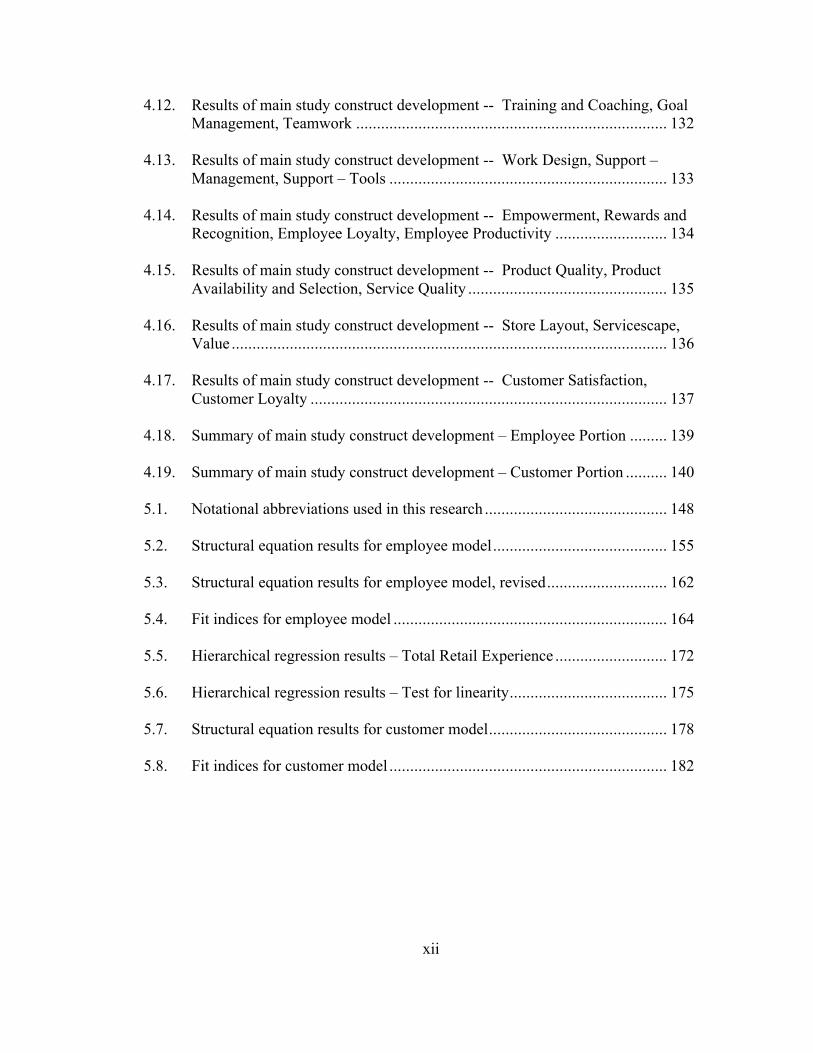
4.12. Results of main study construct development -- Training and Coaching, GoalManagement, Teamwork ........................................................................... 132
4.13. Results of main study construct development -- Work Design, Support –Management, Support – Tools ................................................................... 133
4.14. Results of main study construct development -- Empowerment, Rewards andRecognition, Employee Loyalty, Employee Productivity ........................... 134
4.15. Results of main study construct development -- Product Quality, ProductAvailability and Selection, Service Quality ................................................ 135
4.16. Results of main study construct development -- Store Layout, Servicescape,Value ......................................................................................................... 136
4.17. Results of main study construct development -- Customer Satisfaction,Customer Loyalty ...................................................................................... 137
4.18. Summary of main study construct development – Employee Portion ......... 139
4.19. Summary of main study construct development – Customer Portion .......... 140
5.1. Notational abbreviations used in this research ............................................ 148
5.2. Structural equation results for employee model.......................................... 155
5.3. Structural equation results for employee model, revised............................. 162
5.4. Fit indices for employee model .................................................................. 164
5.5. Hierarchical regression results – Total Retail Experience ........................... 172
5.6. Hierarchical regression results – Test for linearity...................................... 175
5.7. Structural equation results for customer model........................................... 178
5.8. Fit indices for customer model ................................................................... 182
xiii
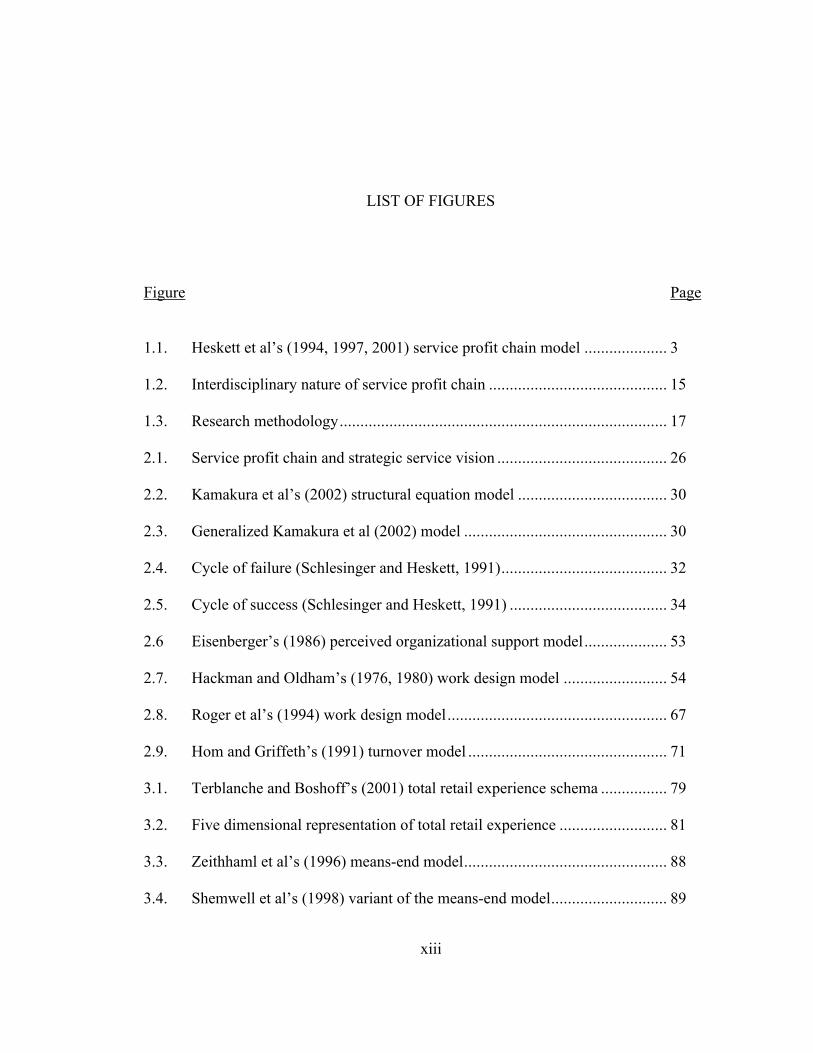
LIST OF FIGURES
Figure Page
1.1. Heskett et al’s (1994, 1997, 2001) service profit chain model .................... 3
1.2. Interdisciplinary nature of service profit chain ........................................... 15
1.3. Research methodology............................................................................... 17
2.1. Service profit chain and strategic service vision ......................................... 26
2.2. Kamakura et al’s (2002) structural equation model .................................... 30
2.3. Generalized Kamakura et al (2002) model ................................................. 30
2.4. Cycle of failure (Schlesinger and Heskett, 1991)........................................ 32
2.5. Cycle of success (Schlesinger and Heskett, 1991) ...................................... 34
2.6 Eisenberger’s (1986) perceived organizational support model.................... 53
2.7. Hackman and Oldham’s (1976, 1980) work design model ......................... 54
2.8. Roger et al’s (1994) work design model..................................................... 67
2.9. Hom and Griffeth’s (1991) turnover model ................................................ 71
3.1. Terblanche and Boshoff’s (2001) total retail experience schema ................ 79
3.2. Five dimensional representation of total retail experience .......................... 81
3.3. Zeithhaml et al’s (1996) means-end model................................................. 88
3.4. Shemwell et al’s (1998) variant of the means-end model............................ 89
xiv
3.5. McDougall and Levesque’s (2000) means-end variant ............................... 90
3.6. Bitner’s (1992) servicescape model............................................................ 94
3.7. Common value paradigm (Patterson and Spreng, 1997) ............................. 97
5.1. Generic representation of employee model................................................. 147
5.2. Internal service quality composition, part I................................................. 149
5.3. Internal service quality composition, part II ............................................... 150
5.4. Structural equation results for employee model.......................................... 154
5.5. Structural equation results for employee model, revised............................. 161
5.6. Generic representation of customer model ................................................. 167
5.7. Total retail experience composition............................................................ 168
5.8. A potential non-linear effect ...................................................................... 174
5.9. Structural equation results for customer model........................................... 177
1
CHAPTER 1
INTRODUCTION
The principles contained within the service profit chain seem so simple, yet the
end results of their applications can be extremely powerful. Providing an excellent
working environment will boost employee satisfaction. Happy employees become loyal
employees. Over time, loyal employees learn the service processes more thoroughly and
become more productive. Productive employees enhance the quality of the customer’s
shopping experience. Customers value a high-quality shopping experience and become
very satisfied. Satisfied customers become loyal customers. Loyal customers shop more
frequently and purchase both larger volumes of their regular products and more ancillary
products. Overall, this dynamic eventually leads to increased sales and profitability.
The logic of this reasoning seems patently obvious yet the first time it was put
together into one comprehensive framework was only a decade ago. It was at that time
that a group of researchers fashioned the service management model called “the service
profit chain” (Schlesinger and Heskett, 1991; Schlesinger and Zornitsky, 1991; Heskett et
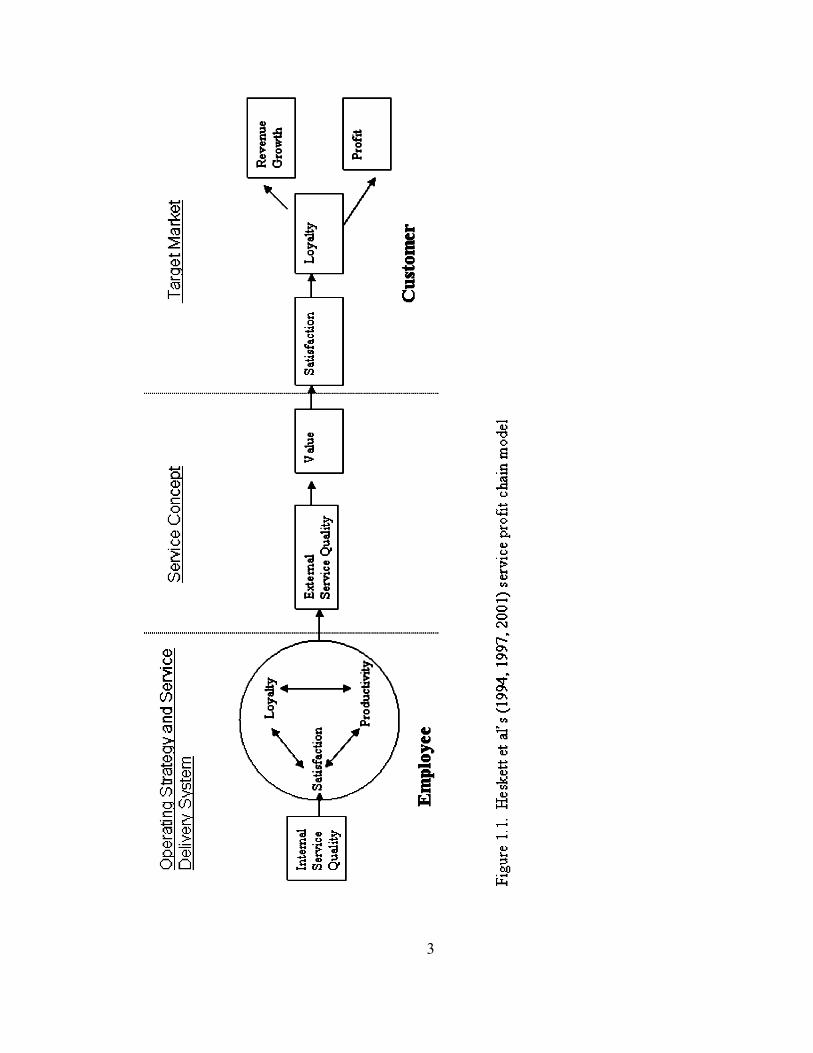
al, 1994; Heskett et al, 1997). The service profit chain was developed from an analysis of
service organizations with the aim of linking operational resource investments to
marketing, operating and financial outcomes. Specifically, the framework, depicted in
2
Figure 1.1, lays the foundation for determining the causal relationship among four
distinct groups of variables – management practices (such as training), employee
outcomes (such as satisfaction), customer outcomes (such as perceived quality and value)
and market outcomes (such as revenue growth and profitability). For example, what
effect does increasing employee satisfaction have on the customer’s perception of value?
Furthermore, by what path does this effect occur?
3
4
In a time of increased service industry competition, coupled with more demanding
customers, the service profit chain “helps managers target new investments to develop
service and satisfaction levels for maximum competitive impact, widening the gap
between service leaders and their merely good competitors” (Heskett et al, 1994). As
will be discussed in chapter 2, the service profit chain focuses on creating both employee
and customer loyalty – recognizing that each is mirrored by the other. Both groups,
employees and customers, create value for the organization; as such, they need to be the
“center of management concern.”
Each link within the service profit chain will be briefly introduced here.
Following the organizational strategy of Heskett et al (1994), the review will start at the
end of the service profit chain and will move backwards towards its origin.
Customer Loyalty Drivers Profitability and Growth
Until recently the driving priority of most service firms has been to target most of
their investments and resources towards gaining new customers in hopes of expanding
market share. However, over the past fifteen years, a new theory is emerging – defensive
marketing (Fornell and Wernerfelt, 1987). Defensive marketing theorists note that one
significant drawback to a strategy of focusing solely on winning new customers is that
current customers feel neglected and have a much higher potential to defect to a rival
service provider. Reichheld and Sasser (1990) echo this thought in their work on
customer defections. They basically conclude that quality of market share, measured in
terms of customer loyalty, is a far better predictor of future business success than quantity
of market share. Their analysis shows that a 5% increase in customer loyalty can lead to
5
profitability increases of between 25% and 85%. Numerous reasons have been given in
justifying the link between customer loyalty and profitability, see chapter 3 for a full
review. The most salient reasons predict that increased customer loyalty leads to:
decreased advertising costs (Nowack and Washburn, 1998; Remler and Brown, 1999;
Anderson and Fornell, 2000), increased referrals (Anderson et al, 1997; Remler and
Brown, 1999; McDougal and Levesque, 2000), more frequent purchases (Anderson et al,
1994; Sirohi et al, 1998) and reduced transaction costs (Potts, 1988; Anderson et al, 1994;
Anderson et al, 1997, Mittal and Lasser, 1998).
Customer Satisfaction Drives Customer Loyalty
The best way to increase customer loyalty is to create what Heskett et al (1994)
call “apostles” – customers that are so satisfied that they not only continue buying from
an organization but they also “convert the uninitiated”. Customer satisfaction has been
anecdotally and empirically shown to be the best predictor of customer loyalty (e.g.
Soderlund, 1998; see section __ for a thorough discussion of this claim). A study carried
out at Xerox corporation showed that when surveyed, customer who answered a perfect
score of “5” on a satisfaction question where six times more likely to repurchase Xerox
equipment than those who answered “4” (Heskett et al, 1994).
Value and External Service Quality Drive Customer Satisfaction
Customers today are more value driven than they ever have been in the past
(Patterson and Spreng, 1997). They are looking to derive more benefit from a product or
service while seeking to minimize their investment. The most traditional definitions of

6
value bear this out. The benefits received can come in the form of product quality,
friendly service, rapid service, attractive storefronts, wide selection of merchandise
and/or a convenient location. Customer investment in a product or service includes not
only direct costs, such as price, but also indirect costs, such as time. Companies such as
Progressive Insurance have become leaders known for having extraordinarily high levels
of customer satisfaction based on the value they deliver to their customers – in their case,
Progressive’s CAT (catastrophe) team provides rapid handling of all accident claims
(Heskett et al, 1994).
Employee Productivity Drives External Service Quality and Value
What can be more frustrating for a business person who has one hour for lunch
than to sit at a restaurant waiting thirty minutes to even be welcomed by a
waiter/waitress? Or after an extensive wait, the order to be incorrect? As discussed
above, customers value good service quality. And who is more likely to be capable of
delivering exceptional service encounters than employees who are highly productive? By
definition, productive employees will be able to provide a better benefits to cost ratio
than average or non-productive employees. Whether “productive” means working more
quickly or being able to accomplish many different tasks, productive employees will
enhance the customer’s service experience.
Employee Loyalty Drives Employee Productivity
All else being equal, e.g. motivation, desire, career goals, etc., employees who
have worked for a service firm for extended periods of time will be more familiar with
7
not only the service execution task but also with customers’ unique needs than their
newly hired counterparts. As such, employee loyalty, manifested in the form of tenure,
has been shown to be one of the strongest predictors of employee productivity (Sheridan,
1992; Wayne et al, 1997; Eisenberger et al, 2001). Heskett et al (1994) point to a study
that has determined that the cost of replacing an automobile sales agent with five to eight
years of experience with a new employee could be as much as $36,000 in lost sales, not
withstanding the additional hiring and training costs. Other studies have shown that
customer satisfaction, a possible surrogate for employee productivity, is heavily
influenced by employee loyalty – customers feel more confident that a long standing
employee will be able to meet their unique needs than a newly hired employee (Schneider
and Bowen, 1985; Silvestro and Cross, 2000).
Employee Satisfaction Drives Employee Loyalty
In their meta-analysis, Petty et al (1984) showed that the number one predictor of
employee loyalty is employee satisfaction. Employees who are happy and satisfied with
their work, co-workers, pay and overall surroundings are much more likely to remain
with an organization. News exposes are filled with stories about the best places in
America to work, and what do all these places have in common? – extremely low
employee turnover. Southwest Airlines, recently named one of the top ten places to
work, has annual turnover rates of less than 5%, and this is within an industry known for
its high turnover (Heskett et al, 1994).
8
Internal Service Quality Drives Employee Satisfaction?
Internal service quality can be defined as “feelings that employees have towards
their jobs, colleagues, and companies” (Heskett et al, 1994). It results from high quality
support services and organizational policies that enable employees to deliver results to
customers. As will be discussed in chapter 2, employees who feel that their organization
cares about their well being and invests in their development will become more satisfied
with their jobs. Some of the basic practices that lead to a supportive internal working
environment include: high quality training programs, superior support from management
in terms of tools and resources to serve customers, reward and recognition programs
based on merit and employee involvement and empowerment programs.
Service profit chain theory has gained tremendous velocity in both practitioner
and academic literature alike. Much of the research supporting the theory is case based
and anecdotal. Below is a brief listing of some of the supporting evidence used in service
profit chain research. This list begins with evidence of individual links within the chain
and moves toward an overall application of service profit chain theory itself.
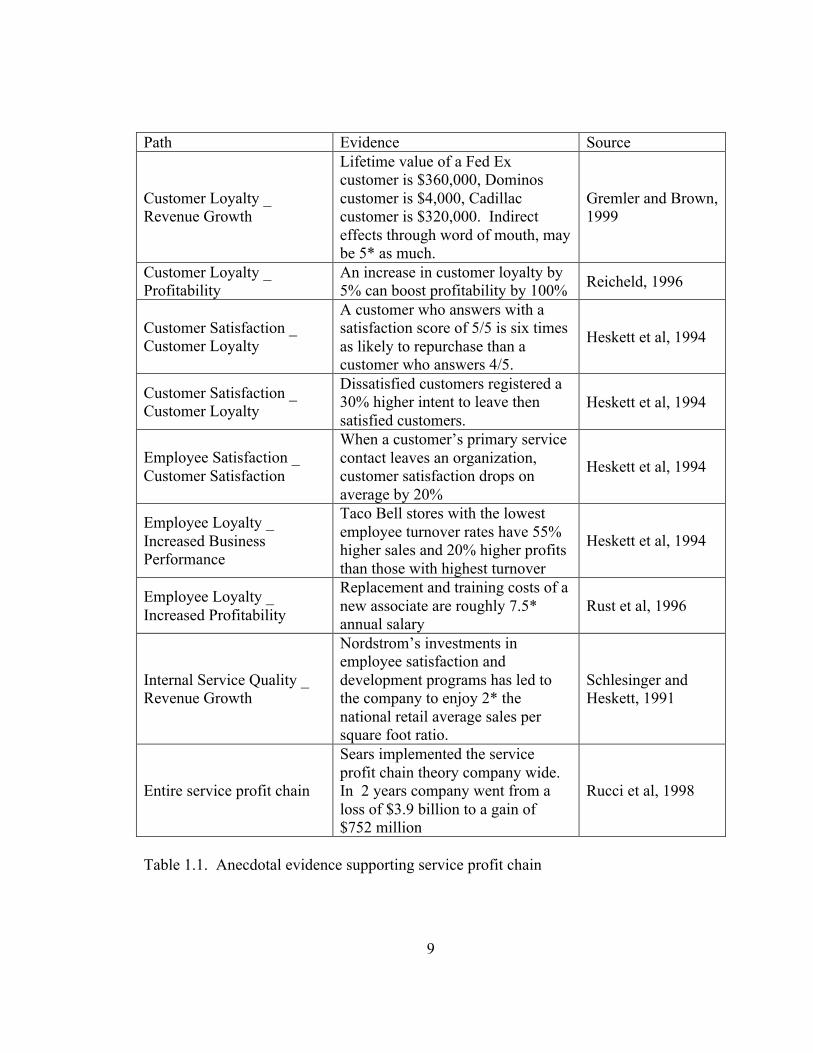
9
Path Evidence Source
Customer Loyalty _Revenue Growth
Lifetime value of a Fed Excustomer is $360,000, Dominoscustomer is $4,000, Cadillaccustomer is $320,000. Indirecteffects through word of mouth, maybe 5* as much.
Gremler and Brown,1999
Customer Loyalty _Profitability
An increase in customer loyalty by5% can boost profitability by 100% Reicheld, 1996
Customer Satisfaction _Customer Loyalty
A customer who answers with asatisfaction score of 5/5 is six timesas likely to repurchase than acustomer who answers 4/5.
Heskett et al, 1994
Customer Satisfaction _Customer Loyalty
Dissatisfied customers registered a30% higher intent to leave thensatisfied customers.
Heskett et al, 1994
Employee Satisfaction _Customer Satisfaction
When a customer’s primary servicecontact leaves an organization,customer satisfaction drops onaverage by 20%
Heskett et al, 1994
Employee Loyalty _Increased BusinessPerformance
Taco Bell stores with the lowestemployee turnover rates have 55%higher sales and 20% higher profitsthan those with highest turnover
Heskett et al, 1994
Employee Loyalty _Increased Profitability
Replacement and training costs of anew associate are roughly 7.5*annual salary
Rust et al, 1996
Internal Service Quality _Revenue Growth
Nordstrom’s investments inemployee satisfaction anddevelopment programs has led tothe company to enjoy 2* thenational retail average sales persquare foot ratio.
Schlesinger andHeskett, 1991
Entire service profit chain
Sears implemented the serviceprofit chain theory company wide.In 2 years company went from aloss of $3.9 billion to a gain of$752 million
Rucci et al, 1998
Table 1.1. Anecdotal evidence supporting service profit chain

10
While these anecdotes begin to pave a path into the validation of service profit
chain theory, the path they clear is quite rough. Detailed empirical evidence is now
needed at this crucial stage in the development of service profit chain theory (Loveman,
1998). Utilizing structural equation modeling, this research provides the most fine
grained analysis to date of the linkages found in the service profit chain within one
service setting, thus providing a more rigorous test of the theory’s validity.
1.1. Research Motivation
The main motivation for this research is to help a women’s specialty fashion retail
chain determine the most important drivers of retail store performance. Using a service
profit chain framework, in essence, this study will try to establish what operational
practices lead to improved store performance – with performance being measured on
several different dimensions. The problem is a common one faced by many large retail
chains – if all of the retail outlets carry the same lines of merchandise and have primarily
the same operating procedures, why does store performance differ so significantly from
one store unit to the next? Obtaining an answer to this question can lead to significant
improvements in competitive capability. One of the deliverables of this study will be a
list of the most salient predictors of store performance. A service firm can use this list as
a resource allocation tool when faced with limited budgets. Furthermore, a service firm
can get the highest marginal benefit of its operational investments if it can somehow tie
those investments to operating and market based performance measures. A second
deliverable of this study will be the illumination of the paths through which performance
improvements occur.
11
In illuminating such paths, the study will show retail organizations what aspects
of the shopping experience the customers weigh most heavily in determining satisfaction,
e.g. product quality, service quality, store layout, etc. It will also show the importance of
the role of perceived value in driving customer satisfaction and loyalty. The same types
of questions will be investigated as pertaining to the employees. What are the main
drivers of employee satisfaction? How do those factors affect not only employee
satisfaction but also employee loyalty – is the path direct, indirect or a combination? As
will be shown, solving these issues can lead to higher retail store competitiveness.
The second motivation stems from a desire to fill a notable gap in academic
literature on service management. Despite its widespread use in management practice, as
evidenced by firms such as Taco Bell, Southwest Airlines, Sears, Progressive Insurance,
MCI, SAS, and Fairfield Inn (Heskett et al, 2001) and the acceptance of its theory in
academic literature, no study to date has comprehensively verified the causal linkages of
the service profit chain in one setting (Loveman, 1998; Silvestro and Cross, 2000;
Kamurka et al, 2002). There are two underlying causes behind this paucity of empirical
studies. The first reason stems from the interdisciplinary nature of the framework itself –
service/operations management, marketing, human resource theory, organizational
behavior, personnel psychology, etc. There is a wealth of information in each of these
fields that must be studied before any modeling attempts are taken. The second reason is
the sample size required to validate the service profit chain model. Because of the
multitude of constructs used in the service profit chain, a very large data set is needed.
This study has overcome these obstacles to provide the most comprehensive look at the
service profit chain to date.
12
1.2. Research Objectives
The primary objective of this research stems directly from the motivation
described in the previous section – namely, to determine the drivers of specialty retail
store performance and illuminate the paths by which those drivers affect performance.
This study uses service profit chain theory as the organizing framework to research the
drivers and the paths. Will the driver prescribed by the service profit chain, internal
service quality, drive employee outcome measures, which in turn drive operational
performance metrics, which in turn drive market related performance metrics? This
research will use two structural equation models to test these questions, in essence,
testing the validity of the service profit chain theory.
In order to achieve the primary objective of validating service profit chain theory,
several supporting objectives must be obtained. First, two new second order factors must
be created. As Heskett et al (1994, 1997, 2001) posit, internal service quality is the
primary driver of the entire service profit chain model. Yet to date there has not been a
comprehensive empirical construction of this factor, see section 2.2 for a complete
elucidation of this argument. As such, a literature survey is needed to identify the main
dimensions of internal service quality so that a rigorous empirical definition can be
derived. This research will devise and validate an eight dimensional, second order
internal service quality construct.
The second higher level construct that needs to be developed is what Heskett et al
(1994) refer to as external service quality -- the “results” that are delivered to the
customer. The results include concepts that are captured in traditional service quality
definitions, e.g. process quality and product quality, but furthermore, include concepts
13
that fall outside of the traditional service quality definitions, e.g. servicescape, product
selection and availability, and store layout. One emerging stream of research that closely
resembles the anecdotes Heskett et al (1994, 1997, 2001) provide in their description of
external service quality is total retail experience (Terblance and Boshoff, 2001). Total
retail experience can be defined as “all the elements that encourage or inhibit consumers
during their contact with the retailer” (Berman and Evans, 1998). This research will
couple Terblance and Boshooff’s (2001) preliminary work into total retail experience
with other empirically tested theory from service management and marketing fields to
create a valid second order construct that can be used in structural models testing service
profit chain theory.
As well as creating these new second order constructs, first order constructs that
have been developed outside of the service management literature will have to be applied
in the retail setting. Some of the constructs that have been developed outside of the
services management area that will be used in this study include: value, perceived
organizational support, work design, employee satisfaction, employee loyalty, customer
satisfaction and customer loyalty. This research will provide a ground to the validation
of these constructs in a service management setting.
In creating these constructs, a secondary objective will be to provide an extensive
literature review of several different disciplines: operations/service management,
marketing, human resource management, organizational behavior and personnel
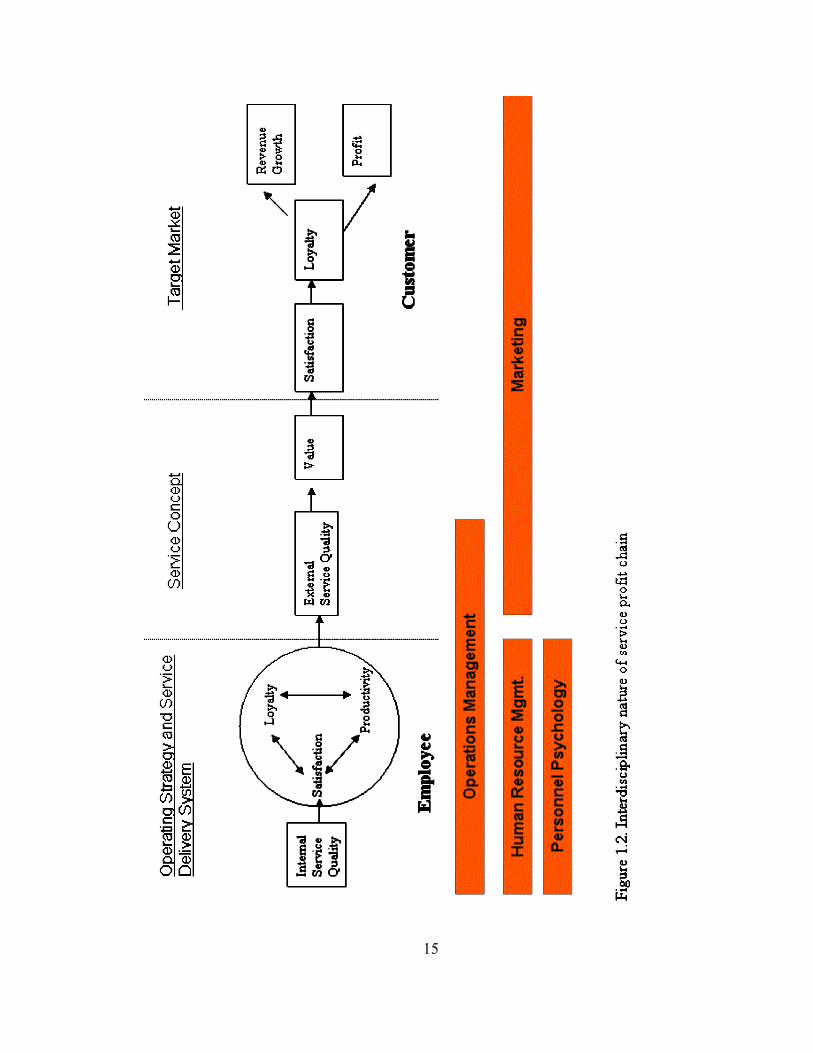
psychology. As shown in Figure 1.2 all of these disciplines play an important role in
shaping the service profit chain framework. The literature review must blend all of these
disciplines together, drawing parallels when possible. Extent theory from these various

14
disciplines, as well as their constructs, will be integrated into a retail business context.
This inter-disciplinary approach will yield a more comprehensive understanding of
traditional service management theories and constructs as well as lighting the path for
future researchers to expand upon.
15
16
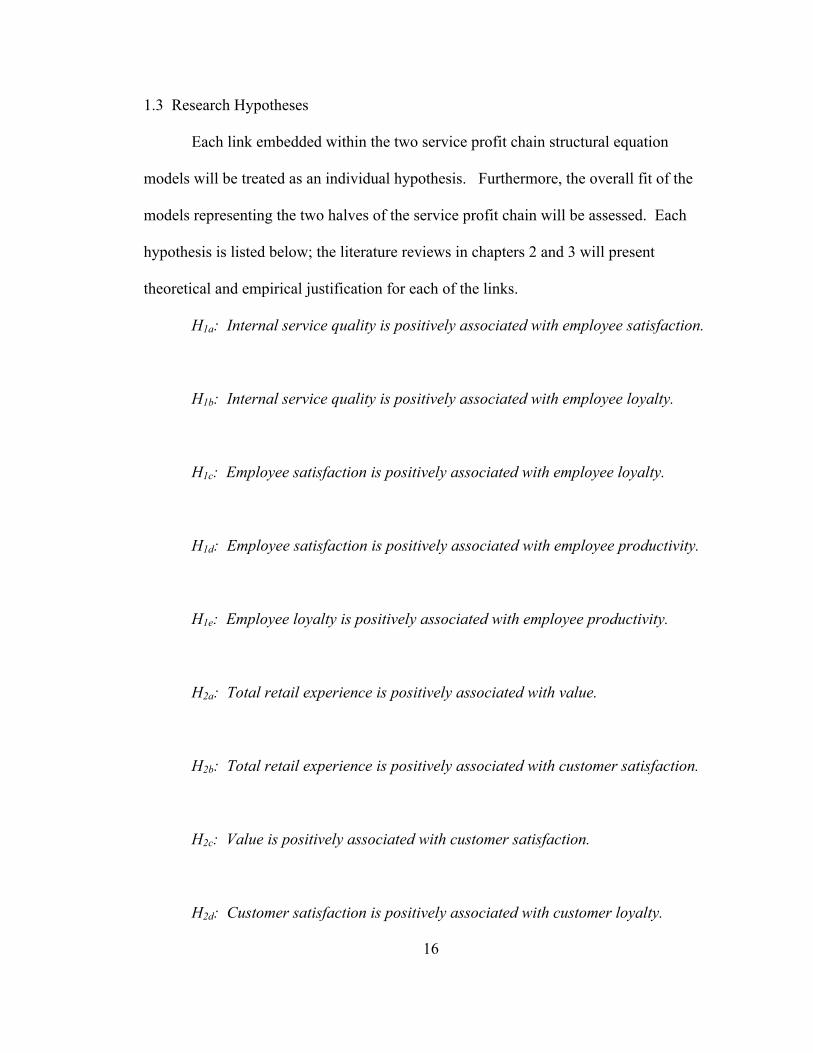
1.3 Research Hypotheses
Each link embedded within the two service profit chain structural equation
models will be treated as an individual hypothesis. Furthermore, the overall fit of the
models representing the two halves of the service profit chain will be assessed. Each
hypothesis is listed below; the literature reviews in chapters 2 and 3 will present
theoretical and empirical justification for each of the links.
H1a: Internal service quality is positively associated with employee satisfaction.
H1b: Internal service quality is positively associated with employee loyalty.
H1c: Employee satisfaction is positively associated with employee loyalty.
H1d: Employee satisfaction is positively associated with employee productivity.
H1e: Employee loyalty is positively associated with employee productivity.
H2a: Total retail experience is positively associated with value.
H2b: Total retail experience is positively associated with customer satisfaction.
H2c: Value is positively associated with customer satisfaction.
H2d: Customer satisfaction is positively associated with customer loyalty.
17
1.4. Research Methods
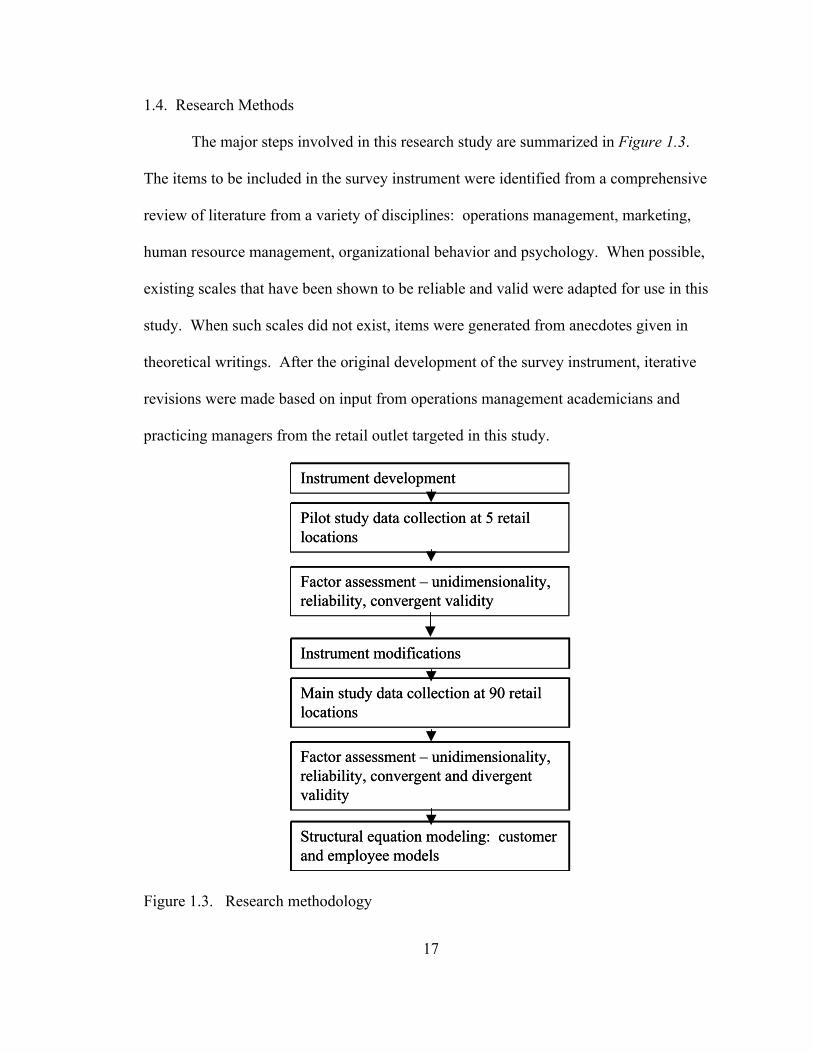
The major steps involved in this research study are summarized in Figure 1.3.
The items to be included in the survey instrument were identified from a comprehensive
review of literature from a variety of disciplines: operations management, marketing,
human resource management, organizational behavior and psychology. When possible,
existing scales that have been shown to be reliable and valid were adapted for use in this
study. When such scales did not exist, items were generated from anecdotes given in
theoretical writings. After the original development of the survey instrument, iterative
revisions were made based on input from operations management academicians and
practicing managers from the retail outlet targeted in this study.
Instrument development
Pilot study data collection at 5 retail locations
Factor assessment – unidimensionality, reliability, convergent validity
Instrument modifications
Main study data collection at 90 retail locations
Factor assessment – unidimensionality, reliability, convergent and divergent validity
Structural equation modeling: customer and employee models
Figure 1.3. Research methodology
18
Pilot data was collected from five retail locations in the Dayton, OH and
Cincinnati, OH areas. Sixty-two customer surveys were collected, representing a
response rate of 25%, and fifty employee surveys were collected, a response rate of 77%.
Before subjecting the data to factor development, reverse coded items were fixed,
descriptive statistics were computed and checks for normality were conducted. Factor
development began with reliability assessment via Cronbach alpha calculations.
Unidimensionality and convergent validity were assessed through confirmatory factor
analysis using a maximum likelihood approach.
Based on the results of the pilot study factor development modifications to the
survey instrument needed to be made, section 4.4 details these changes. After the
necessary modifications, data was collected from ninety locations of the women’s
specialty retailer. In total, 872 employee responses were gathered, resulting in a response
rate of 65%, 1,076 customer responses were gathered, resulting in a response rate of 24%.
Factor development followed the same methodology that was used in the pilot study
development with the exception that the larger sample sizes gathered through the main
data collection allowed for the assessment of divergent validity as well.
Following factor development, the two portions of the service profit chain are
tested using structural equation modeling. Individual path coefficients are analyzed and
the results are used to test the hypotheses laid out in section 1.3. A more macroscopic
approach is taken by assessing overall model fit to see if the overall framework of the
service profit chain is supported.
19
1.5. Layout of dissertation.
Chapter 1 of this dissertation provides an introduction to the motivations,
objectives, hypotheses and methodologies used in this study. The service profit chain
theory, and its implied causal chain, is introduced and anecdotal evidence is given as to
its plausibility. The motivation of the research is laid out both from an academic and
practitioner standpoint. Nine different hypotheses are explicitly stated. A summary of
the methodologies used to develop the factors and to test the hypotheses is then given.
Chapter 2 is the first of two literature review chapters. The first portion of this
chapter is dedicated to reviewing the literature on the service profit chain itself. This
section is further divided into theoretical works that contribute to the service profit chain
concept, empirical evidence for the service profit chain and a review of parallel theories
to the service profit chain. The next major section within this chapter, section 2.2., looks
exclusively at the driver of the service profit chain – internal service quality. Internal
service quality is defined and parallels to similar concepts are drawn. Empirical evidence
of the existence of internal service quality is given. The eight dimensions of internal
service quality are elucidated and each is briefly treated. The final section surveys
literature that investiages the employee outcome variables in the service profit chain:
satisfaction, loyalty and productivity. The variables are looked at singly, and then their
inter-relationships are explored. Throughout this chapter, when factors are being
discussed, special mention is made as to where the items that are used in this research’s
survey instrument are generated from. When possible, earlier studies that used the scales
are explicitly referenced. The chapter ends with a summary of the first five research
hypotheses.
20
Chapter 3 is the second literature review chapter. It looks exclusively at the
customer response to the service offering of the retailer. The chapter begins by
introducing the driver of the customer portion of the service profit chain model – total
retail experience. This factor is analyzed from a holistic perspective and is hypothesized
to be five dimensional. Parallels are drawn between total retail experience and other
customer oriented valuation frameworks. Each of the five total retail experience
dimensions is then analyzed individually. The second half of chapter 3 introduces three
other constructs: value, customer satisfaction and customer loyalty. Each of these
constructs is again developed individually followed by a discussion detailing their inter-
relationships. In a method similar to that used in chapter 2, explicit references are given
for survey item generation. The chapter concludes with a summary of four research
hypotheses.
The first portion of chapter 4 details the sampling plans used in both the pilot and
main studies. The pilot study and main study methodologies are both detailed. The next
section discusses the population frame of this research. One large retailer of women’s
specialty apparel is chosen. Advantages and disadvantages of the population frame are
discussed. The next section within this chapter, section 4.3, describes the steps involved
in the survey instrument development. This section is followed by an analysis of the
measurement model. Factor development is done on the pilot data. As the results
indicate, minor changes needed to be made to the survey instrument. The results of the
measurement model of the main survey data show that the changes were successful –the
factors are shown to be reliable, uni-dimensional and valid. The chapter ends with a
discussion of the contributions made by the measurement model.

21
The penultimate chapter, chapter 5, begins with a discussion of why structural
equation modeling was chosen as the data analytic tool to be used in this research.
Advantages and disadvantages of the methodology are given. Structural equation
modeling is then applied to the two models embedded within the service profit chain: the
employee model and the customer model. The structural equation results are used to test
each of the individual hypotheses described in chapters 2 and 3 as well as testing the
overall fit of the service profit chain theory. Discussion of the results of each model is
focused on the contributions made to both academic and practitioner literature.
Chapter 6 concludes this research with a summary of the research objectives and
methodologies used to support those objectives. The research findings are again
presented with special emphasis on how our results compliment and develop previous
research. The contributions of this research are reviewed from both a managerial and
academic perspective. The dissertation ends with a discussion of the limitations of this
work and future research ideas.
22
CHAPTER 2
LITERATURE REVIEW: OPERATING STRATEGY AND SERVICE
DELIVERY SYSTEM
A substantial literature review of the service profit chain requires the survey of
many different disciplines: operations management, human resource management,
personnel psychology, organizational behavior and marketing, just to name a few.
Figure 1.2 illustrates where each of the aforementioned disciplines contributes most
saliently. Clearly there is substantial overlap between the disciplines. The complexity of
surveying the literature does not stop there. Many times researchers in two different
disciplines study the same concept and/or theory but attach different labels and
terminology, hence time will be dedicated to elucidating these parallels when they occur.
To make matters even more convoluted, the constructs within the service profit chain
itself also overlap to a remarkable extent. For this literature review to be of worth, it
must look at constructs singly as well as their interaction. Significant time will thus be
dedicated to both.
In order to simplify the complexity of the literature review task we take pains to
organize the material as clearly and formally as possible. The first part of this chapter
23
lays out the general framework of the literature review; each section within the review
itself details its organization more precisely. Chapter 2 deals exclusively with the first
portion of the service profit chain: “the operating strategy and service delivery system”,
herein simplified to “the employee model” . The chapter begins with a discussion of the
theory of the service profit chain and how the concept came into being. This section is
followed by a treatment of empirical studies of the comprehensive service profit chain
model. A section detailing enterprise models similar to the service profit chain follows.
The notion of internal service quality is then introduced from a theoretical standpoint,
followed by a review of empirical research into the holistic concept. Concepts similar to
internal service quality are then discussed. This section is followed by a presentation of
the operationalization of internal service quality as an eight dimensional construct. Each
dimension is analyzed independently. The chapter ends with discussions of employee
satisfaction, loyalty and productivity.
Chapter 3 is dedicated to explicating the latter portion of the service profit chain,
focusing on the notions of external service quality (which we will call total retail
experience), value, customer satisfaction and customer loyalty. The chapter begins with
an analysis of the different dimensions of total retail experience in the extant literature.
Within this discussion we show how our rendering is a merging of several of the most
widely accepted definitions. The relationship between total retail experience and external
measures such as customer satisfaction, customer loyalty and business performance is
then explored. Following this section is an in-depth review of the relationships among
the external measures themselves.
24
2.1. Service profit chain
The service profit chain was developed from an analysis of service organizations
with the aim of linking operational resource investments to marketing, operational and
financial outcomes. Specifically, the framework lays the foundation for putting hard
numbers to traditionally soft measures. For example, what effect does increasing
employee satisfaction have on operational and financial outcomes? This question begs
the follow up: what operational investments can an organization make to improve
employee satisfaction? Previous literature has suggested that increasing employee
satisfaction would indeed boost sales and profitability, but no work has yet shown the
route by which those increases would occur. The service profit chain allows managers to
visualize the exact causal linkages between operational investment programs aimed at
increasing employee satisfaction and business performance (among other relationships).
An application of the service profit chain at Sears illustrates that a five unit increase in
employee attitude (as measured through Sears’ TPI survey) leads to a 1.3 unit increase in
customer satisfaction, which would in turn leads to a 0.5% increase in revenue growth
(Rucci et al, 1998).
Loveman and Heskett (1999) describe the idea trail that led to the development of
the causal structure of the chain itself. Basically, the service profit chain combines three
distinct, but closely related, streams of research: the cycle of employee capability, the
customer quality/value equation and the cycle of customer loyalty. The cycle of
employee capability takes a human resource perspective on the relationships between
employee satisfaction, turnover and productivity; this portion is described in more detail
in the remaining sections in this chapter. The quality/value equation describes how
25
customers perceive and assess service offerings. The cycle of customer loyalty examines
the effect that customer satisfaction has on customer loyalty and how they both play a
vital role in determining financial outcomes; these latter two sections are described more
fully in Chapter 3. Much had previously been written on these three streams individually
but it was not until the mid 1990’s that a group of Harvard researchers consolidated them
to form one comprehensive service management model.
As indicated in the introduction, the service profit chain, in essence, is an
enterprise model that theorizes that the investment in and development of employees
leads to satisfied service personnel. These satisfied employees remain with the
organization for extended periods of time and become very good at what they do,
enhancing their own productivity and the customer’s service experience. Customers not
only recognize but also become extremely satisfied with the increased quality and value
of the service offering. Satisfied customers become loyal customers and continue their
relationship with the service providing organization long into the future, increasing both
the organization’s market share and profitability.
To understand best the service profit chain beyond the simple anecdotes it is
important that one is able to place it within the context of the overall operating strategy of
a service organization. Heskett et al (1997) assert that the service profit chain provides
the means for implementing a firm’s strategic service vision. The strategic service vision
includes developing an operating strategy and service concept and segmenting the
customer market. This vision determines the goals and performance expectations of the
organization. Once these goals have been established, the service profit chain is a tool

26
that can be used to execute the goals. Figure 2.1 is a simplified illustration of how the
service profit chain model can be used within an organization.
Operating Strategy
Service Concept
Target Market
Strategic Service Vision
Cycle of employee capability
Quality and Value Equation
Cycle of customer loyalty
Service Profit Chain
Profit Model
Operating Strategy
Service Concept
Target Market
Strategic Service Vision
Cycle of employee capability
Quality and Value Equation
Cycle of customer loyalty
Service Profit Chain
Profit Model
Figure 2.1. Service profit chain and strategic service vision
This diagram indicates that the service profit chain, in essence, outlines the operational
execution of a firm’s strategy.
2.1.1. Empirical support
To date, only three attempts have been made to validate empirically large portions
of the service profit chain framework: Loveman (1998), Silvestro and Cross (2001) and
Kamakura et al (2002). While the three studies have collectively laid the foundation of
testing the causal linkages, their findings are tempered by limitations. As a group they
suffer from limited construct development and methodological weaknesses. Because of
their importance, in relation to this study, each paper is examined on an individual basis.
27
The setting for Loveman’s (1998) study of the service profit chain is the
commercial bank industry. For the main study, Loveman analyzes 450 bank branches,
gathering data from employees, customers and the banks themselves. Because the
authors are unconvinced of the exact causal nature between the variables in the service
profit chain they use regression analysis and avoid methods that imply causality. Our
contention with their choice is twofold. First, performing one at a time correlation
analysis (e.g. regression) does not control for family wise error. Although the 95%
confidence level is used for each test independently, there are 25 total correlation tests
conducted. The family wise error for the twenty-five tests is much larger than their stated
.05; in fact, it is nearly .70, calculated as [1 – (1 – _)n], where n = the number of
correlation tests. Moreover, any significant correlations found between two variables
may be a result of mediating variables that are not included in the individual regressions.
For example, suppose a significant correlation is found between variables A and B; it is
entirely possible that A has no direct effect on B, but rather A influences C which in turn
influences B. One at a time correlation analysis will incorrectly attribute a direct effect of
A onto B. Our second contention with their choice is that while there may certainly be
some reciprocation in the service profit chain model, these effects are minimal; there is
enough theoretical and empirical evidence of the causal nature of the relationships to
begin testing causal models of the framework (the following sections will detail all of this
evidence).
With two minor exceptions, the hypotheses tested by Loveman (1998) are
generally supported. The two exceptions are: 1.) customer satisfaction is not positively
correlated with employee satisfaction and 2.) revenue growth and profitability are not
28
correlated with customer loyalty. All the other relationships theorized in the service
profit chain are supported. However, it is important to note that Loveman (1998) does not
specifically test all the causal linkages in the service profit chain framework. For
example, the study does not create an external service quality construct. Instead,
employee satisfaction and loyalty are used as surrogates. This is a major weakness
because no indicator of a “deliverable” to the customer is used – a central tenet in Heskett
et al’s (1997, 2001) work. Furthermore, although several questions are asked for each
construct, no scale development is done: no tests are performed for reliability, validity,
uni-dimensionality, etc.
Silvestro and Cross’s (2000) research into UK supermarkets suffers from many of
the same limitations as Loveman’s (1998) earlier work. Due to their limited sample size
of six stores, Silvestro and Cross (2000) are restricted to using one at a time correlations.
With a sample size of six, a correlation of 0.81 is needed to achieve significance using an
alpha level of 0.05. There are dire consequences to this methodology. First, power is
extremely low. With only six observations it is hard to detect significant correlations.
This weakness may shed some light on their results – 25% of the hypotheses that they test
are insignificant. Second, if a correlation between two variables is greater than 0.81,
serious consideration must be given as to whether the two variables are independent. For
those pairs of variables where the correlation is above 0.81, no confidence interval is
given around the parameter estimate. The confidence interval could contain 1.0,
indicating that the two variables are actually the same. A correlation coefficient of 0.98
between service value and customer loyalty is only one of the many examples where
parameter estimates are well over 0.95. Tests of divergent validity would resolve this
29
second limitation and show whether two independent constructs are being measured or
whether the two constructs really merge into a single one. Like the Loveman (1998)
study, no construct development is done.
Similar to Loveman (1998), the correlation analysis does not map directly onto
the service profit chain framework. Silvestro and Cross (2000) test correlations between
every set of variables, even those that are not theorized to influence each other directly.
Again, this could lead to misguided findings. The effect of mediating variables should be
included when testing whether there is a significant correlation between items on
opposite ends of the service profit chain framework. In total, twenty-one correlation tests
are carried out. Only nine of the twenty-one hypotheses are supported. Five of the
twenty-one hypotheses actually have negative relationships where positive ones are
predicted. Lack of construct development, choice of methodology and limited sample
size all call into question the validity and generalizability of the findings.
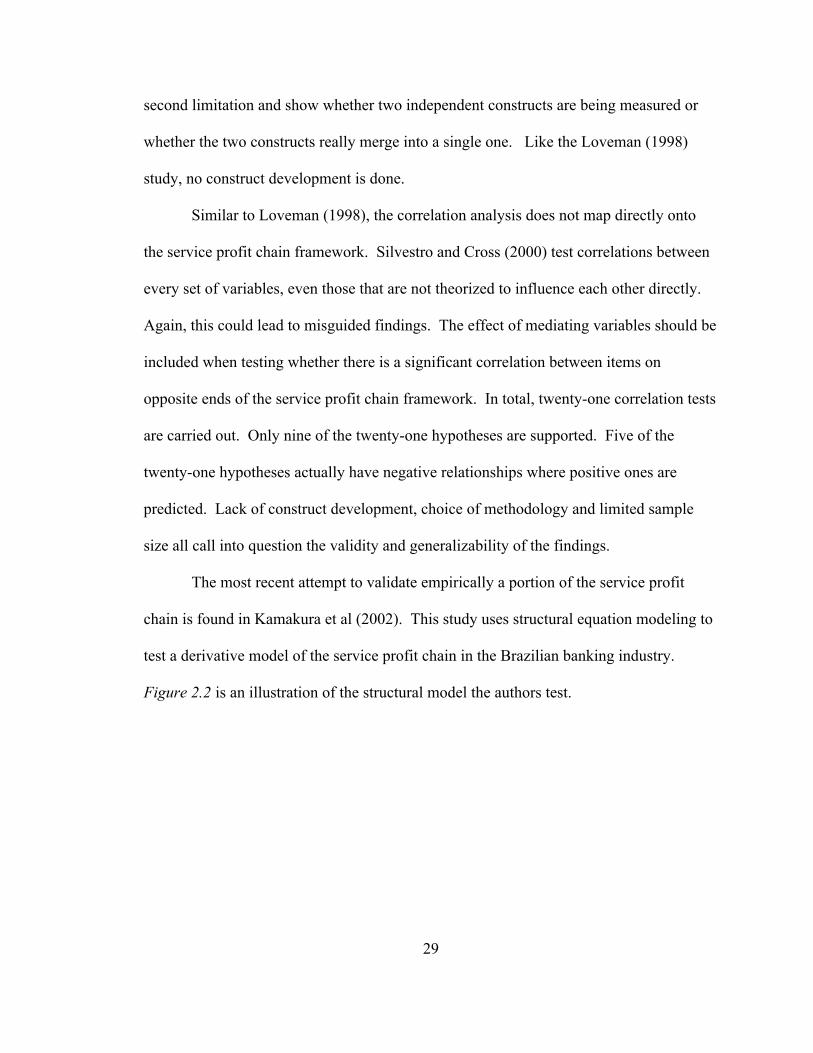
The most recent attempt to validate empirically a portion of the service profit
chain is found in Kamakura et al (2002). This study uses structural equation modeling to
test a derivative model of the service profit chain in the Brazilian banking industry.
Figure 2.2 is an illustration of the structural model the authors test.
30
# of PersonnelPerceptions
of Personnel
Perceptions of
Equipment
Customer Behavior
# of Equipment
Profit
.22.62
.19.08
.13
-.04
-.12
# of PersonnelPerceptions
of Personnel
Perceptions of
Equipment
Customer Behavior
# of Equipment
Profit
.22.62
.19.08
.13
-.04
-.12
Figure 2.2. Kamakura et al’s (2002) structural equation model
Essentially this study focuses only on portions of the latter half of the service profit chain.
The variables # of personnel, # of equipment, perceptions of personnel and perceptions of
equipment more closely resemble a customer contact construct than anything else.
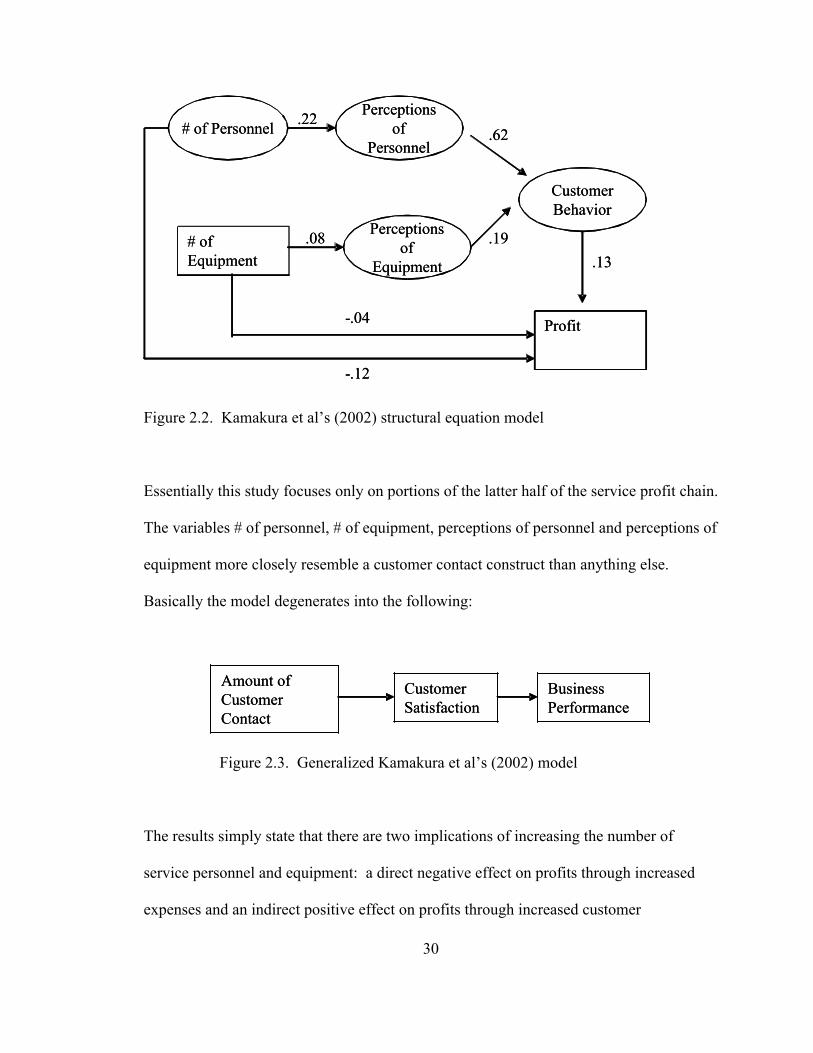
Basically the model degenerates into the following:
Amount of Customer Contact
Customer Satisfaction
Business Performance
Amount of Customer Contact
Customer Satisfaction
Business Performance
Figure 2.3. Generalized Kamakura et al’s (2002) model
The results simply state that there are two implications of increasing the number of
service personnel and equipment: a direct negative effect on profits through increased
expenses and an indirect positive effect on profits through increased customer
31
satisfaction. The interpretation of the findings, as well as the model itself, is a far cry
from that originally proposed by Heskett et al (1994). In fact, the study does not even
survey employees, arguably the most important group within the service profit chain.
Taken collectively, these three research attempts still leave much to be desired in
service profit chain research. All three attempts acknowledge the difficulty of pursuing
rigorous service profit chain research: large sample sizes, new construct development,
three different sampling populations (employees, customers, business unit) and
sophisticated data analysis tools. These three articles have beaten a trail into service
profit chain research but much of the terrain still needs to be explored.
2.1.2. Service profit chain parallels
Relatively speaking, service profit chain research is still in its infancy; it has had
only a decade to take root. Because of this, a thorough review of the principles contained
within its framework requires one to look to other models whose theory parallels that
proposed by Heskett et al (1994, 1997). The models that will be discussed in this section
include: the cycles of failure/success, relationship value management, the Malcolm
Baldrige quality model, the European Excellence quality model and the attachment
framework. Although each of these models has its own nuances, they are all
fundamentally grounded in the same concept as the service profit chain: developing
supportive human resource policies, policies that view employees as valuable resources,
will have a positive impact on both intermediate customer satisfaction measures and long
term financial performance measures. Because this tenet is also the cornerstone of the
32
service profit chain theory; all these parallels serve to justify Heskett et al’s (1994, 1997)
framework and increase its face validity.
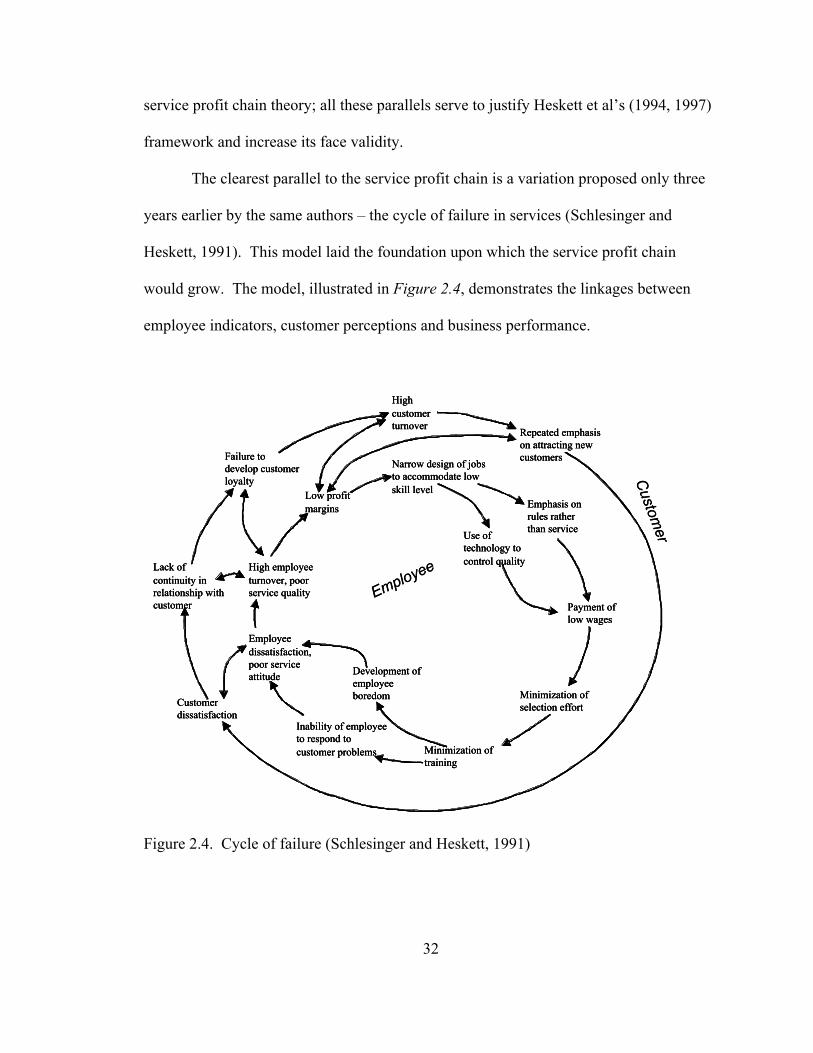
The clearest parallel to the service profit chain is a variation proposed only three
years earlier by the same authors – the cycle of failure in services (Schlesinger and
Heskett, 1991). This model laid the foundation upon which the service profit chain
would grow. The model, illustrated in Figure 2.4, demonstrates the linkages between
employee indicators, customer perceptions and business performance.
High customer turnover
Repeated emphasis on attracting new customers
Emphasis on rules rather than service
Use of technology to control quality
Payment of low wages
Minimization of training
Development of employee boredom
Inability of employee to respond to customer problems
Employee dissatisfaction, poor service attitude
Customer dissatisfaction
Lack of continuity in relationship with customer
High employee turnover, poor service quality
Failure to develop customer loyalty
Low profit margins
Narrow design of jobs to accommodate low skill level
Minimization of selection effort
Employee
Custom
er
High customer turnover
Repeated emphasis on attracting new customers
Emphasis on rules rather than service
Use of technology to control quality
Payment of low wages
Minimization of training
Development of employee boredom
Inability of employee to respond to customer problems
Employee dissatisfaction, poor service attitude
Customer dissatisfaction
Lack of continuity in relationship with customer
High employee turnover, poor service quality
Failure to develop customer loyalty
Low profit margins
Narrow design of jobs to accommodate low skill level
Minimization of selection effort
Employee
Custom
er
Figure 2.4. Cycle of failure (Schlesinger and Heskett, 1991)
33
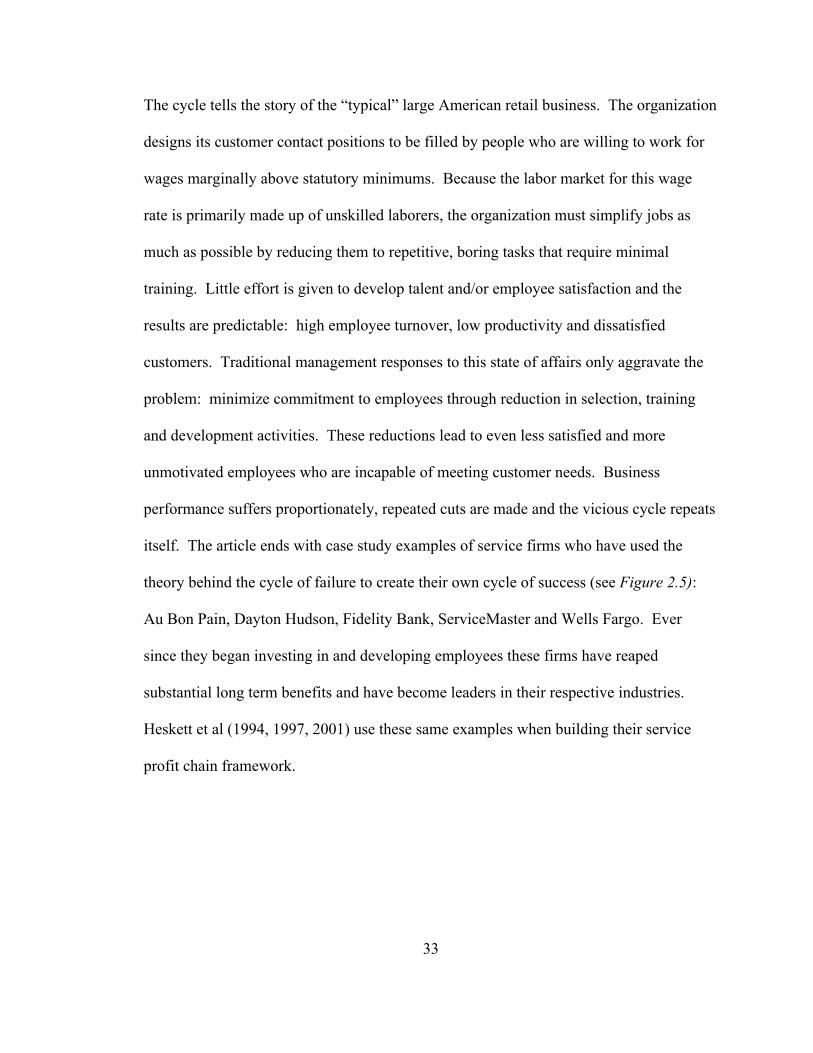
The cycle tells the story of the “typical” large American retail business. The organization
designs its customer contact positions to be filled by people who are willing to work for
wages marginally above statutory minimums. Because the labor market for this wage
rate is primarily made up of unskilled laborers, the organization must simplify jobs as
much as possible by reducing them to repetitive, boring tasks that require minimal
training. Little effort is given to develop talent and/or employee satisfaction and the
results are predictable: high employee turnover, low productivity and dissatisfied
customers. Traditional management responses to this state of affairs only aggravate the
problem: minimize commitment to employees through reduction in selection, training
and development activities. These reductions lead to even less satisfied and more
unmotivated employees who are incapable of meeting customer needs. Business
performance suffers proportionately, repeated cuts are made and the vicious cycle repeats
itself. The article ends with case study examples of service firms who have used the
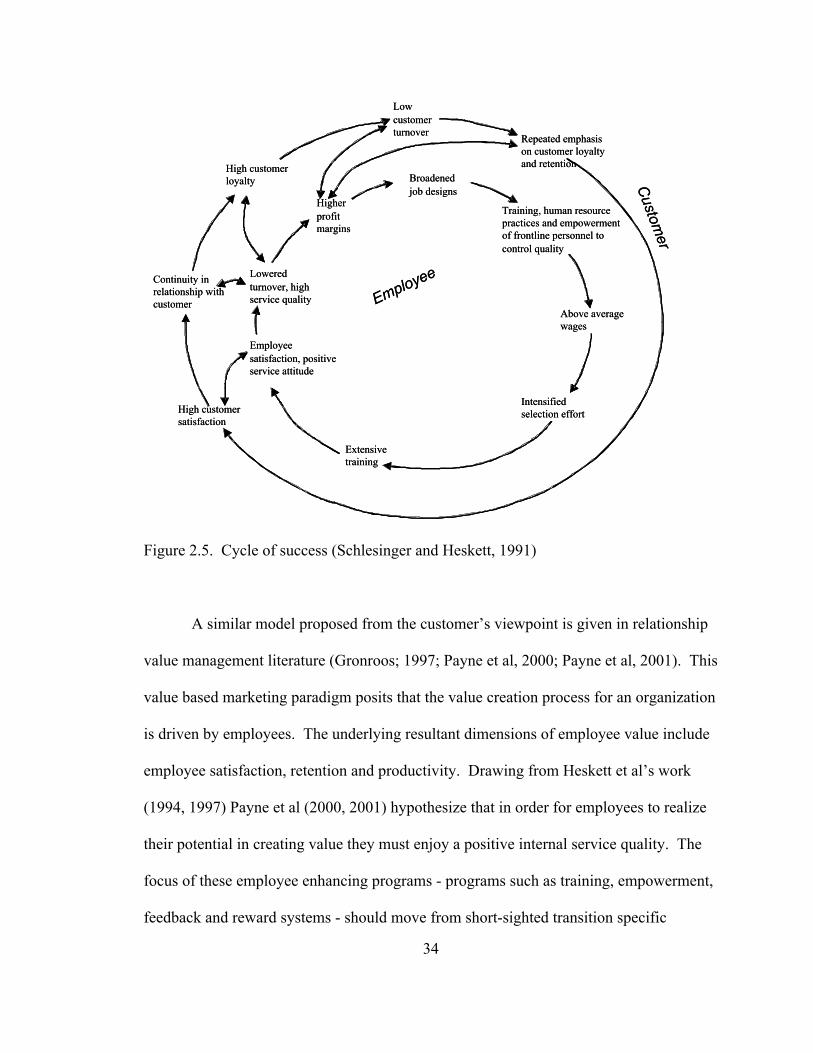
theory behind the cycle of failure to create their own cycle of success (see Figure 2.5):
Au Bon Pain, Dayton Hudson, Fidelity Bank, ServiceMaster and Wells Fargo. Ever
since they began investing in and developing employees these firms have reaped
substantial long term benefits and have become leaders in their respective industries.
Heskett et al (1994, 1997, 2001) use these same examples when building their service
profit chain framework.
34
Low customer turnover
Repeated emphasis on customer loyalty and retention
Training, human resource practices and empowerment of frontline personnel to control quality
Above average wages
Extensive training
Employee satisfaction, positive service attitude
High customer satisfaction
Continuity in relationship with customer
Lowered turnover, high service quality
High customer loyalty
Higher profit margins
Broadened job designs
Intensified selection effort
Employee
Custom
er
Figure 2.5. Cycle of success (Schlesinger and Heskett, 1991)
A similar model proposed from the customer’s viewpoint is given in relationship
value management literature (Gronroos; 1997; Payne et al, 2000; Payne et al, 2001). This
value based marketing paradigm posits that the value creation process for an organization
is driven by employees. The underlying resultant dimensions of employee value include
employee satisfaction, retention and productivity. Drawing from Heskett et al’s work
(1994, 1997) Payne et al (2000, 2001) hypothesize that in order for employees to realize
their potential in creating value they must enjoy a positive internal service quality. The
focus of these employee enhancing programs - programs such as training, empowerment,
feedback and reward systems - should move from short-sighted transition specific
35
perspectives to a holistic long term view of relationship building. As such, investing in
employees will, in the long term, build resources that can provide value and competitive
advantage.
Relationship marketing goes beyond focus on the employee; it also
simultaneously looks to the customer, another key component in the marketing mix. Just
as employees can create value, customers can too. Customers assess the value that
employees create in service delivery process and, if satisfied, will continue to purchase
from the organization. Their continued purchase patterns in themselves create value
through increased frequency of purchases and referrals – eventually leading to higher
revenue growth and increased profitability. Repeat customers are the key to
organizational success and as such organizations should be striving to make this group as
satisfied as possible. But as Payne et al (2001) point out, more often than not,
organizations direct their marketing and service efforts simply towards attaining new
customers at the expense of keeping the older, more profitable customers happy. So, just
as the service profit chain posits, a satisfaction mirror exists between employees and
customers and both images in the mirror are positively correlated with business
performance.
The service quality literature contains two enterprise models that have much in
common with the service profit chain model: the Malcolm Baldrige National Quality
Award (MBNQA) and the European Excellence Quality model (EFQM) models. Both of
these models theorize that the focus on and the development of employees will lead to
improved customer satisfaction measures, which in turn will result in improved business
performance. The Malcolm Baldrige National Quality Award was developed in 1987 by
36
the National Institute of Standards and Technology as a means of promoting quality
awareness and practices among U.S. firms. Among other things, the model asserts that
human resource development/management is part of the ‘system’ that drives business
performance. Included in its classification of human resource development practices are
many of the same practices put forth in Heskett et al’s service profit chain: training,
development, communication, etc. The MBNQA framework has been validated in both
manufacturing and service settings (Wilson and Collier, 2000; Meyer and Collier, 2001;
Goldstein and Schweikhart, 2002).
The European Excellence Quality Model is the European brother of the MBNQA
award and based on many of the same underlying theories. In this model, ‘people
management’ is seen as an enabler of three different performance dimensions: employee,
customer and business. In short, the model asserts that creating supportive human
resource policies aimed at developing employees will have direct effects on employee
satisfaction, employee loyalty and employee productivity. Like the service profit chain,
it also declares that such policies will have positive indirect effects on customer
satisfaction and loyalty, which eventually impacts business performance. The links in the
EFQM model have also been validated using structural equation modeling (Eskildsen and
Dahlgaard, 2000).
An early precursor of the service profit chain can be found in what is known as
the attachment framework (Ulrich et al, 1991). The basic premise of the attachment
framework is that employee attachment leads to customer attachment which leads to
competitive advantage. Attachment usually manifests itself through commitment
behavior. Customers who see employees who are committed to their organization will
37
notice their dedication and use it to form a positive opinion about the organization itself.
The logic is simple: only high quality organizations could produce truly dedicated
employees. Over time, a shared mind-set develops between customer and employee,
resulting first in attached customers who become satisfied and loyal and, second, in
increased revenues and margins.
Similar to the service profit chain’s linkages between internal service quality and
employee satisfaction, employee attachment is a function of an organization’s investment
in their employees. Human resource practices that influence attachment include many of
the same practices found in Heskett et al’s (1994, 1997) internal service quality: work
design, reward systems, training programs, empowerment, goal management and
management support. So, in essence, the attachment theory suggests a framework nearly
identical to the service profit chain: supportive human resource practices influence
employee indicators which influence customer indicators which in turn lead to improved
business performance.
In summary, these five frameworks (cycle of failure/success, relationship value
marketing, MBNQA, EFQM and attachment) closely parallel the model set forth in
service profit chain research. Collectively, they lend support and validation for the
service profit chain theory. It is also interesting to note that the models discussed are
from the three different research streams that Heskett et al (1997) claim to be combining;
employee management, customer management and service quality.
38
2.2. Internal service quality
Roughly defined, internal service quality results from high quality support
services and organizational policies that enable employees to deliver results, in terms of
service quality and value, to customers (Hallowell et al, 1996). In another light, internal
service quality encapsulates all of those factors that contribute to employee satisfaction
while also fostering the creation of customer value (Heskett et al, 1997). Researchers
have tended to focus on providing anecdotal evidence of what they call internal service
quality rather than cataloguing a precise set of practices that compose the construct itself.
Schlesinger and Heskett (1991) describe Nordstrom’s “obsession” with internal service
quality dimensions, such as communicating store goals to employees, empowering
employees to handle all sorts of customer needs and complaints and rewarding
salespeople for a job well done. Heskett et al (1997) give dozens of examples of
organizations building support for their front line service workers – Fairfield’s dedication
to hiring and training team players, Au Bon Pain’s commitment to providing
advancement and growth opportunities to its employees and Sears’ overall commitment
to making itself a compelling place to work are just a few examples. Although each of
these organizations use different sets of practices to express it, they all understand the
criticality of investing in employees as resources to be valued, rather than costs to be
minimized.
To date, there are only two studies that seek to develop an internal service quality
construct. Neither of the studies does so systematically or rigorously. Hallowell et al
(1991) are the first to embark on empirical research using an internal service quality
framework. They theorize that there are eight dimensions to internal service quality:
39
communication, teamwork, training, management support, tools, policies and procedures,
rewards/recognition and goal alignment. The reference list used to justify their selection
is extremely light. Using the insurance industry as their sampling frame, the researchers
ask two to three questions for each of the eight dimensions. Principal components
analysis is used to check the uni-dimensionality of each of the eight dimensions, although
the results are not given. Furthermore, no mention is made of reliability assessment,
convergent, divergent or nomological (or predictive) validity. Even though the authors
have a very large sample size, approximately 7,500 respondents, they do not use factor
analysis to test whether the eight individual dimensions do indeed load onto a single
second order internal service quality factor; for all the reader can tell, the eight
dimensions could be completely independent. Single summated variables representing
each of the eight dimensions are then entered independently into regression equations and
shown to be positive predictors of job satisfaction. It is important to note that their
regression equations show significant signs of multi-collinearity between the eight
dimensions. This problem could easily be overcome by using a second order factor
model. In testing a second hypothesis, six of the eight dimensions, all but
communication and rewards, are shown to be positive predictors of employees’
perceptions of their capability to meet customer needs (a surrogate measure for employee
productivity and/or service quality).
The other attempt to explore the composition of internal service quality is work
by Edvardsson et al (1997). In their study of the psychosocial work environment
surrounding Swedish employees of a computer service company, they propose a fifteen
dimensional representation of internal service quality. Borrowing from research into
40
stress profiles and quality profiles, Edvardsson et al (1997) use factor analysis to develop
the fifteen following factors: responsiveness, ergonomical conditions, workload,
relationship to immediate supervisor, physical work environment, relationship to co-
workers, worry about employment, relationship to management, decision latitude, salary,
stimulation from work, personal and material resources, goals and information,
interpersonal consideration and reliability. All fifteen factors are shown to be
unidimensional, but again reliability and validity tests are not performed. An exploratory
second order factor analysis is done on the fifteen factors and, as the authors point out,
the resultant four factor solution is neither simple nor meaningful. After seeing the
results, the authors basically give up trying to form a higher order internal service quality
construct.
Two later studies take very cursory looks at internal service quality: Silvestro
and Cross (2000) and Kamakura et al (2002). In their superficial one-at-a-time
correlation analysis of the service profit chain, Silvestro and Cross (2000) find that
internal service quality is positively correlated with financial performance, measured as
profitability. However, the multi-faceted concept of internal service quality is measured
through a single objective question – ratio of planned working hours to actual working
hours. The researchers make the argument that as the ratio of planned hours to actual
hours increases (meaning less time is given to carry out the actual work), the workplace is
perceived to become more stressful; hence, internal service quality will diminish.
Therefore, there will be a negative association between the measured ratio and
profitability. Kamakura et al (2002) use a similar strategy when measuring internal
service quality. Within the banking industry, they employ the number of service
41
personnel and number of ATM’s as a surrogate for representing internal service quality.
Again, they claim that fewer employees leads to more stressful workplaces. There is no
theoretical support or justification for use of these measures. Their representation of
internal service quality is tenuous at best.
2.2.1. Internal service quality parallels
The idea of creating a supportive internal environment to boost employee
satisfaction, loyalty and/or productivity is certainly not unique to Heskett et al’s notion of
internal service quality. For several decades researchers have explored how to create
supportive work environments. This section discusses some ideas similar to the concept
of internal service quality. Included in this section is a discussion of: organizational
culture, organizational climate, human resource management, high commitment human
resource practices, supportive human resources, innovative human resources, quality of
work life, perceived organizational support and the work design model. Although none
of these systems map one to one onto internal service quality, they all do lend support for
the notion of long term investment in employees as resources to be valued rather than as
constraints to be minimized. Each of the corollaries is treated only briefly; further
reading is suggested for those wishing to pursue additional research. For each parallel,
discussion includes a conceptual definition of the research stream followed by a summary
of construct development and empirical evidence of its relationship with various other
employee, customer and business performance indicators.
Organizational culture has been heavily studied since Schneider, in
Organizational Climate and Culture (1990), notes a lack of scholarly criticism. Most
42
organizational researchers agree that culture can be thought of as a set of cognitions
shared by members of a social unit. It is comprised of the assumptions, values, norms
and tangible artifacts of the leading organizational members. These assumptions, values,
norms and tangible artifacts are shaped by an organization’s human resource policies
regarding internal service quality elements. The values of the organization have been
shown to influence the behavioral norms and attitudes of its employees, which in turn,
influence the behavior of the organization’s customers (cf. Chatman and Jehn, 1991;
O’Reilly et al, 1991; Sheridan, 1992;). Specifically, Kerr and Slocum (1987) show that
organizational culture influences human resource policies, such as reward systems and
development programs, which in turn influence employees’ organizational commitment,
tenure and productivity. In a similar vein, Sheridan (1992) shows that positive
organizational culture impacts employee voluntary survival rates and employee
productivity. O’Reilly et al (1991) demonstrate that the effect of organizational culture
on turnover rates may be mediated by employee job satisfaction, a concept identical to
that found within the service profit chain.
Much like internal service quality, organizational culture has been shown to be a
multidimensional construct; in fact, the two upper level constructs are comprised of
similar dimensions. A brief summary of the seven traditional culture dimensions is given
below. To a great extent, these seven dimensions overlap the eight dimensions of internal
service quality.
• Detail – A ‘work task’ dimension stressing the values of analytical aptitude andorientations toward precision and accuracy.
• Stability – A ‘work task’ dimension stressing the values of predictability, qualitywork and rule orientation.
43
• Innovation – A ‘work task’ dimension emphasizing an organization’s focus onrisk taking, responsiveness and learning.
• Team orientation – An ‘interpersonal dimension’ focusing on the norms ofcollaboration, helpfulness and teamwork.
• Respect for people – An ‘interpersonal dimension’ stressing norms of fairness,equitability and tolerance.
• Outcome – An ‘individual actions’ dimension regarding norms of highexpectations, personal achievement and reward structure.
• Aggressiveness – An ‘individual actions’ dimension focusing on the norms ofcompetition in an organization.
Unlike internal service quality, this construct has been well developed and empirically
validated. O’Reilly, et al (1991) developed the Organizational Culture Profile (OCP) in
1991. The scale consists of 54 items which represent the seven distinct factors. The
scale has been validated in dozens of different settings and industries (O’Reilly et al,
1991; Sheridan, 1992; Cooper-Thomas et al, 2004).
The clearest parallel to organizational culture is organizational climate. Rogg et
al (2001) define organizational climate as a “set of shared attitudes, values and beliefs
about how an organization operates.” Relative to organizational culture, climate
perceptions are temporary and changeable. Climate is shaped by an organization’s
history, expectations, unwritten rules and social mores. Taken jointly this collection
affects the behavior of everyone within, and to a certain degree outside of, the
organization. Schneider et al (1980) propose two distinct types of climatic orientations
for service providing firms– ‘bureaucratic orientation’ and ‘enthusiastic orientation’. A
bureaucratic orientation is a climate wherein rules and procedures are stressed, often
diverting energy away from the actual servicing of customers. Enthusiastic orientations
44
incorporate philosophies of highly flexible, interpersonal communities. Researchers have
primarily agreed on the dimensions that create organizational climate (cf. Schneider et al,
1980; Schneider and Bowen, 1985; Rogg et al, 2001). The four most common
dimensions are listed below; again, these dimensions map quite nicely onto the internal
service quality construct.
• Managerial behavior – Planning, organizing and managing standards ofservice for customer satisfaction and quality.
• Systems support – Personnel, operations, systems, technical and otherancillary support to employees.
• Cooperation/Coordination – Teamwork, helpfulness and communication insupport of satisfying customers.
• Work Design – Job enrichment, rotation and flexibility programs.
Schneider and Bowen (1980) demonstrate that enthusiastic climate orientations
are positively correlated with customers’ perceptions of service quality and customer
satisfaction. Schneider and Bowen (1985) and Rogg et al (2001) both expand upon this
study to show that climate in fact mediates the relationship between human resource
policies and customer satisfaction. It is important to note that the human resource
practices used in these studies are also a subset of Heskett et al’s (1994) definition of
internal service quality. The practices include quality training programs, selective hiring
practices, job enrichment programs, work design methods and performance management.
One stream of research actually investigates the interaction of organizational
climate, organizational culture and human resource practices – the social context model
(Rogg et al, 2001). The social context model avers that climate and culture serve to
mediate the linkages between human resource systems and organizational effectiveness.

45
Specifically, the theoretical model asserts that an organization’s cultural values influence
the type of human resource systems that are developed, which in turn shape the
organization’s climate. And it is the dynamic synergies between the three constructs that
affect employee satisfaction, loyalty, productivity and ultimately organizational
effectiveness. The following sections discuss some of the human resource systems that
can be incorporated into social context model or can stand on their own as effectors of
organizational performance.
Several different human resource management (HRM) frameworks closely
resemble the notions found in the service profit chain, specifically those within internal
service quality. This research briefly touches upon four of the most common HRM
frameworks: high performance human resources, high commitment human resources,
supportive human resources and innovative human resources. Before describing these
frameworks it is important to put them in context. Wright and Boswell (2002) propose a
typology of human resource management research. They suggest a two dimensional
categorization using number of human resource practices and level of analysis as the two
axes. Table 2.1 is an illustration of their typology.
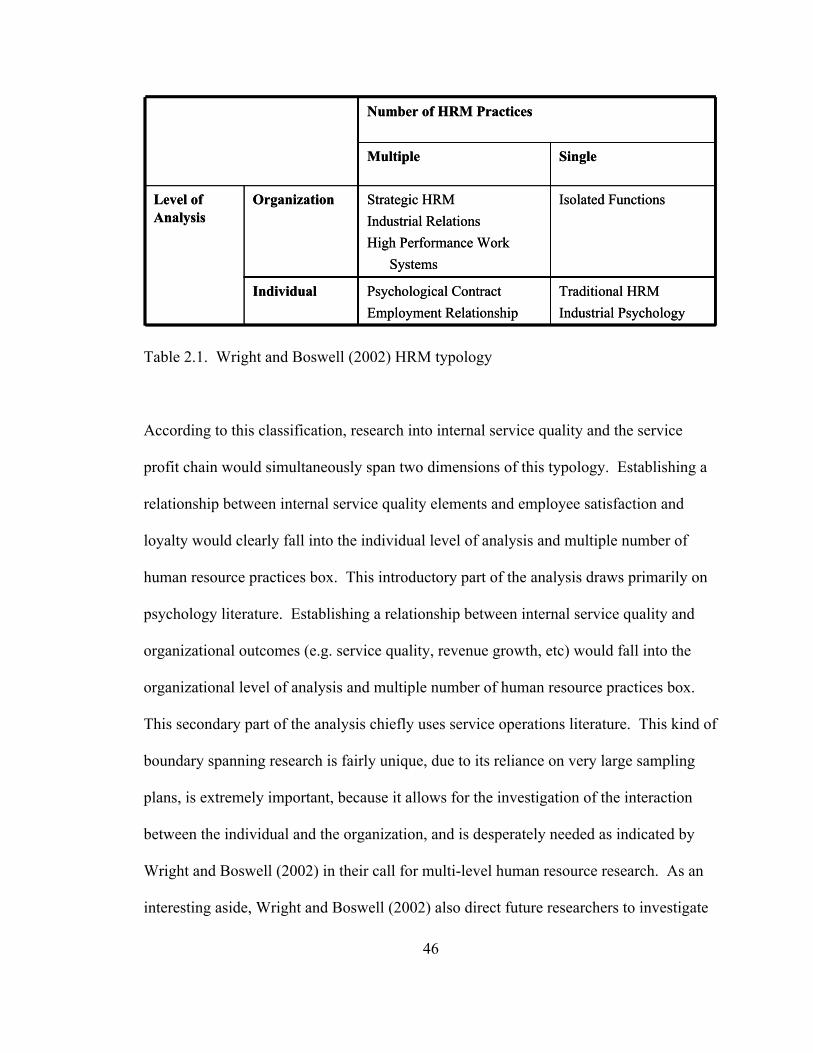
46
Traditional HRM
Industrial Psychology
Psychological Contract
Employment Relationship
Individual
Isolated Functions Strategic HRM
Industrial Relations
High Performance Work
Systems
OrganizationLevel of Analysis
SingleMultiple
Number of HRM Practices
Traditional HRM
Industrial Psychology
Psychological Contract
Employment Relationship
Individual
Isolated Functions Strategic HRM
Industrial Relations
High Performance Work
Systems
OrganizationLevel of Analysis
SingleMultiple
Number of HRM Practices
Table 2.1. Wright and Boswell (2002) HRM typology
According to this classification, research into internal service quality and the service
profit chain would simultaneously span two dimensions of this typology. Establishing a
relationship between internal service quality elements and employee satisfaction and
loyalty would clearly fall into the individual level of analysis and multiple number of
human resource practices box. This introductory part of the analysis draws primarily on
psychology literature. Establishing a relationship between internal service quality and
organizational outcomes (e.g. service quality, revenue growth, etc) would fall into the
organizational level of analysis and multiple number of human resource practices box.
This secondary part of the analysis chiefly uses service operations literature. This kind of
boundary spanning research is fairly unique, due to its reliance on very large sampling
plans, is extremely important, because it allows for the investigation of the interaction
between the individual and the organization, and is desperately needed as indicated by
Wright and Boswell (2002) in their call for multi-level human resource research. As an
interesting aside, Wright and Boswell (2002) also direct future researchers to investigate
47
variance in human resource practices within organizations, noting that there is a
recognizable difference between corporate policy and unit level implementation. This
research takes just such a perspective.
The term “high performance” work system is relatively new in academic
literature. Huselid (1995) introduces the term when he applies Barney’s (1991) resource-
based theory of the firm to human resource management. Huselid argues that high
performance human resource practices can lead to sustainable competitive advantage
because they 1.) add value, 2.) are rare, 3.) can not easily be imitated and 4.) are not
subject to replacement. This theory is even more salient given the setting, ie. specialty
retailing, of the current study – a service based organization where customer contact is
high.
Huselid breaks down his system of high performance human resource practices
into two major categories: those that improve employee skills and organizational
structures, and those that improve employee motivation. Within the former group he
includes specific practices such as formal information sharing programs, comprehensive
training programs, selective recruitment and hiring and employee participation in quality
of work life programs. The latter group consists of formal performance appraisal systems
and performance based promotion and wage raise increase programs. These two
categories, which together include many internal service quality dimensions, are shown
to impact both intermediate employee outcomes, such as turnover and productivity, as
well as short and long term measures of corporate financial performance, both market
based, Tobin’s q, and accounting based, return on capital. In fact, Huselid’s (1991)
results are very similar to the theory proposed by the service profit chain; namely, that
48
employee turnover, satisfaction and productivity mediate the relationship between human
resource practices and organizational performance. In addition, employees under these
high performance conditions are thought to be more likely to engage in organizational
citizenship behaviors and unrewarded behaviors that are believed to be critical to
organizational success.
A research stream that borrows from both high performance human resources and
organizational climate is that of high commitment human resource management, a field
that has been gaining velocity in academic literature. The origin of this research stream
can be traced to Arthur’s (1992, 1994) empirical work classifying different types of
human resource systems. His two categories of ‘control’ and ‘commitment’ practices
closely resemble Schneider’s (1980) ‘enthusiastic’ and ‘bureaucratic’ climate groups.
Control approaches aim to increase efficiency and reduce labor costs by imposing
regulations, strict work rules and standardized procedures. In contrast, commitment
systems shape preferred employee behaviors by forging psychological bonds between
organizational and individual needs and goals. In general, commitment systems are
characterized by high levels of employee involvement and empowerment, comprehensive
training programs, equitable internal and external rewards and emphasis on teamwork
and participation.
To date the best operationalized model of high commitment work systems is
given by Whitener (2001). High commitment human resource management is shown to
be a five dimensional construct made up of developmental appraisal, selective staffing,
comprehensive training, internally equitable rewards and externally competitive awards.
Arthur’s (1994) view is a little broader, including decentralization and participation.
49
Taken together, these two operationalizations closely resemble the internal service
quality construct used in this study. In terms of performance implications, Arthur (1994)
finds that high commitment systems lead to higher employee productivity, lower costs
and lower employee turnover. Whitener’s (2001) findings are similar; she demonstrates
that high commitment systems lead to increased employee loyalty and productivity, as
measured through organizational commitment.
Building on commitment research, Allen et al (2003) focus on human resource
practices that suggest investment in employees and show recognition for employee
contributions, signaling that a company is generally supportive of its employees. These
‘supportive’ human resource practices include participation in decision making, fairness
of rewards and growth opportunities; again, all three are elements of internal service
quality. Using a social exchange theory framework (Blau, 1964), Allen et al’s (2003)
analysis reveals a positive relationship between supportive human resource practices and
employee satisfaction and loyalty.
MacDuffie (1995) takes one of the most holistic approaches to human resource
management in his research into ‘innovative’ human resource practices. MacDuffie
(1995) argues that human resource practices affect performance, not individually, but as
interrelated elements in an internally consistent ‘bundle’. The bundles mutually reinforce
conditions that support employee motivation and skill acquisition. Employee knowledge
about products, processes, organizational goals and customers can create organizational
capabilities more difficult to imitate than readily purchased technological advancements
in the processes or products themselves. MacDuffie distinguishes between practices that
affect the organization of work and those that affect the employees as individuals. Work
50
system practices are geared towards increasing organizational knowledge and include use
of work teams and problem-solving groups, job rotation and work design. Whilst
innovative human resource policies aimed at individuals, e.g. training programs,
empowerment, selective hiring, etc, primarily drive employee motivation and
commitment. Collectively, these innovative human resource bundles, made up almost
exclusive of internal service quality dimensions, improve employee productivity and
service quality.
A practitioner oriented research stream that closely parallels internal service
quality is found in the quality of work life literature (QWL). The term quality of work
life was first introduced in 1972 during an international labor relations conference. Lau
(2001) recently defines quality of work life as “the favorable conditions and
environments of a workplace that support and promote employee satisfaction.” Quality
of work life programs generally focus on reward management, job security, promotion
and advancement opportunities and employee involvement, teamwork and job
enrichment programs – all central tenets of Heskett et al’s (1994, 1997) internal service
quality construct. Using longitudinal data, Havlovic (1991) demonstrates that quality of
work life programs can dramatically reduce employee turnover, absentee rate, accident
rate and the number of grievances filed. Lau (2001) takes a broader perspective and
shows that firms who actively pursue quality of work life programs outperform those that
do not on several key business performance metrics: sales growth, asset growth, return
on asset growth and average profit margin. Lau (2001) tests these relationships directly
but references the service profit chain framework as the causal structure that captures all
51
of the indirect links between quality of work life, which he notes is a surrogate for
measuring internal service quality, and business performance.
Psychology literature abounds with employee satisfaction research; specifically,
research into the precursors of employee satisfaction. One of the most popular research
streams within psychology and organizational behavior is the idea of ‘perceived
organizational support’ (POS). Rhoades et al (1986) are credited with developing the
term perceived organizational support. In their seminal work they attach the following
description: “employees form general beliefs concerning how much the organization
values their contributions and cares about their well-being.” Such perceived support
depends on the same attributional processes that people generally use to infer the
commitment by others to social relationships. Perceived organizational support is
influenced by the frequency, extremity and judged sincerity of statements of praise and
approval (Blau, 1964). Other rewards and signals of commitment include pay,
recognition, job enrichment, promotion opportunities and training programs. Basically,
any program or practice that contributes to employees’ impressions of how dedicated
their company is to their development and growth as individuals can be classified as a
dimension of perceived organizational support. Heskett et al (1994, 1997) use this same
argument as a basis of their conjectured link between internal service quality and
employee satisfaction.
Perceived organizational support is generally measured using the survey of
perceived organizational support (SPOS) scale which was originally developed by
Eisenberger et al (1986). The original scale contains 36 items, but most research uses
only a subset; anywhere from five to twenty questions (cf. Rhoades and Eisenberger,
52
2002). Perceived organizational support has been linked to many different outcomes.
The earliest work shows that perceived organizational support can increase employee
satisfaction and productivity while also decreasing employee turnover and absentee rates
(Eisenberger and Huntington, 1986; Eisenberger et al 1986). However, over the last
eighteen years, researchers have shown that perceived organizational support can
influence many other wide reaching outcomes. These outcomes include, but are not
limited to: affective commitment, extra-role performance, in-role performance, withdraw
cognitions, organizational citizenship behavior and employee tenure (see Rhoades and
Eisenberger (2002) for a summary). Figure 2.6 provides an illustration of the most
widely accepted causal model of perceived organizational support (Eisenberger et al,
1986). Please note that perceived organizational support is measured using elements very
similar to internal service quality elements: organizational support – management,
organizational support – tools, rewards and recognition, training, empowerment and work
design.
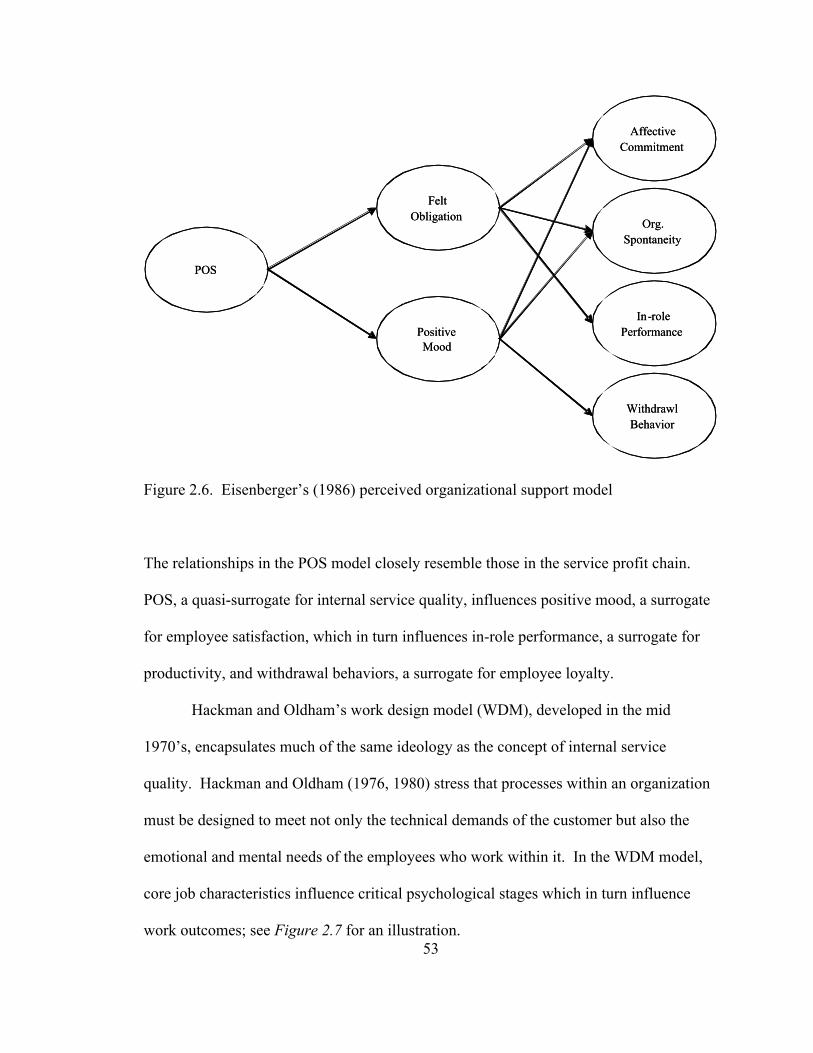
53
POS
Felt Obligation
Positive Mood
Affective Commitment
Org. Spontaneity
In-role Performance
WithdrawlBehavior
POS
Felt Obligation
Positive Mood
Affective Commitment
Org. Spontaneity
In-role Performance
WithdrawlBehavior
Figure 2.6. Eisenberger’s (1986) perceived organizational support model
The relationships in the POS model closely resemble those in the service profit chain.
POS, a quasi-surrogate for internal service quality, influences positive mood, a surrogate
for employee satisfaction, which in turn influences in-role performance, a surrogate for
productivity, and withdrawal behaviors, a surrogate for employee loyalty.
Hackman and Oldham’s work design model (WDM), developed in the mid
1970’s, encapsulates much of the same ideology as the concept of internal service
quality. Hackman and Oldham (1976, 1980) stress that processes within an organization
must be designed to meet not only the technical demands of the customer but also the
emotional and mental needs of the employees who work within it. In the WDM model,
core job characteristics influence critical psychological stages which in turn influence
work outcomes; see Figure 2.7 for an illustration.
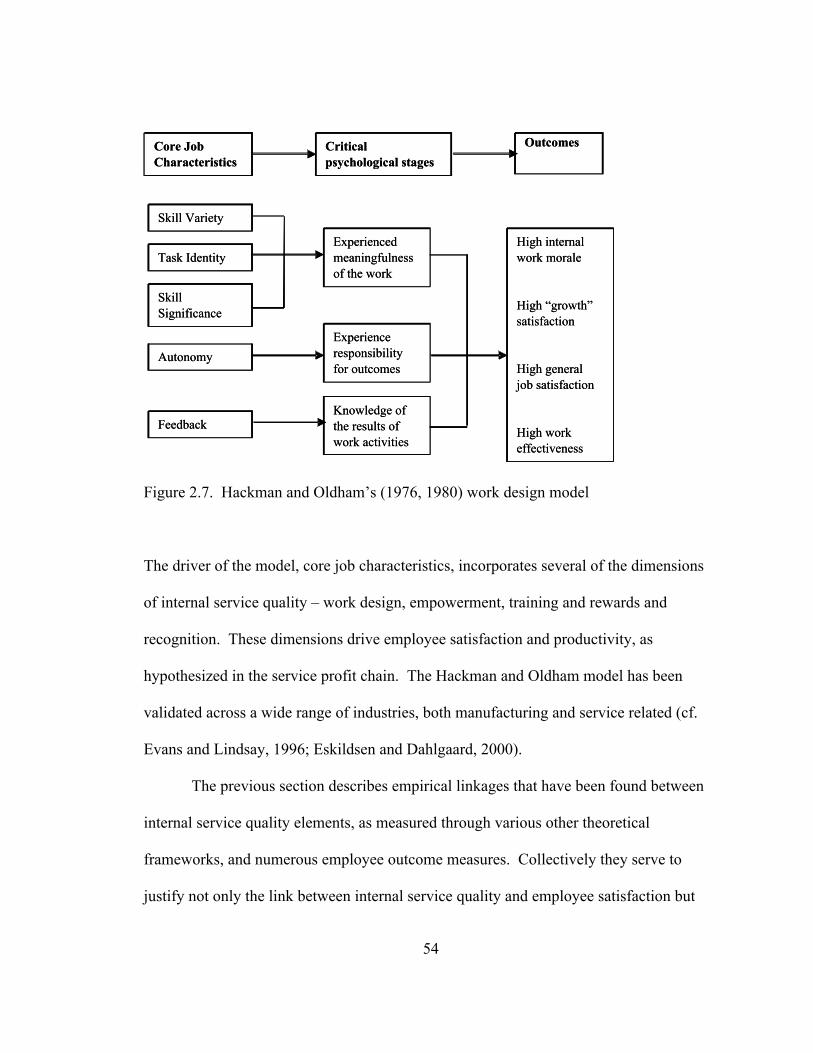
54
Core Job Characteristics
Critical psychological stages
Outcomes
Skill Variety
Task Identity
Skill Significance
Autonomy
Feedback
Experienced meaningfulness of the work
Experience responsibility for outcomes
Knowledge of the results of work activities
High internal work morale
High “growth” satisfaction
High general job satisfaction
High work effectiveness
Figure 2.7. Hackman and Oldham’s (1976, 1980) work design model
The driver of the model, core job characteristics, incorporates several of the dimensions
of internal service quality – work design, empowerment, training and rewards and
recognition. These dimensions drive employee satisfaction and productivity, as
hypothesized in the service profit chain. The Hackman and Oldham model has been
validated across a wide range of industries, both manufacturing and service related (cf.
Evans and Lindsay, 1996; Eskildsen and Dahlgaard, 2000).
The previous section describes empirical linkages that have been found between
internal service quality elements, as measured through various other theoretical
frameworks, and numerous employee outcome measures. Collectively they serve to
justify not only the link between internal service quality and employee satisfaction but
55
also our specific rendering of the internal service quality construct (as will be discussed
in detail in Section 2.2.3). The eight dimensions we are using for internal service quality
are by far the most common practices found throughout the literature we surveyed,
regardless of discipline.
The following section will provide theoretical justification on two different yet
similar theoretical grounds for these relationships – specifically, the relationship between
internal service quality and employee satisfaction and loyalty. The two theories that will
be explored, namely social exchange theory and the inducements/contributions
framework, both originate in social psychology where they were used to explain
relationships among individuals; over the last forty years, they have found their way into
economic and business management literature as methods of describing the relationships
between individuals and business organizations.
2.2.2. Theory linking internal service quality to employee indicators
The most commonly cited theory used as justification for a positive link between
human resource management and employee related outcomes is social exchange theory
(Homans, 1961; Blau, 1964; Schneider et al, 1980; Wayne et al 1997; Rhoades and
Eisenberger, 2002). Social exchange theory originally explained the motivation behind
the attitudes and behaviors exchanged between individuals (Homans, 1961; Blau, 1964).
The key premise of social exchange theory is that human behavior in essence is an
exchange of social and material resources; to put it in economic terms, social interaction
is an exchange of costs and rewards. In deciding what is fair, humans develop a
perception of the outcome level of their relationship with another individual. There are
56
primarily two ways to evaluate outcome levels: a comparison level (CL) and a
comparison level of alternatives (CLalt). CL is an absolute judgment as to whether the
social exchange (ie. the relationship) provides benefits that outweigh costs. CLalt
considers the best payoffs available outside of the current relationship. Regardless of
which outcome level is used to base judgments, humans will strive to minimize costs and
maximize rewards resulting in a positive ‘balance of trade’. An individual will seek to
maintain a relationship whose outcome is positive; in order to maintain the relationship
the individual will try to give beneficial results back to the other party. The exchange
between two individuals will continue indefinitely as long as both individuals have
positive outcome levels. If an individual has a negative balance of trade, they will
quickly look to terminate the exchange. Clearly there are direct parallels to modern
economic theory – power aside, trade between two parties will occur when both parties
benefit from the trade itself.
A group of researchers, most notably Eisenberger et al (1986), later expand upon
this theory and apply it to relationships between individuals and the organizations they
work for. Drawing on psychology literature, they note that employees form general
perceptions about the intentions and attitudes of the organization that employs them from
the policies and procedures that directly affect the employees themselves. In effect,
employees attribute human-like characteristics to their employing organization on the
basis of the treatment they receive (Levinson, 1965). Eisenberger et al (1986) predict that
beneficial actions directed at employees by the organization and/or its representatives
will increase the likelihood of reciprocal benefit flow from individual back to
organization. Moreover, the benefit to employees need not be strictly monetary in the
57
form of high wage rates and ancillary benefits. Benefits could include practices that lead
to personal growth, including training and empowerment, to personal well-being and to
personal recognition. When employees perceive that their organizations are valuing them
and investing in them, they will feel obliged to return the value they obtained by
becoming more productive and loyal. Wayne et al (1997) suggest that a pattern of
reciprocity develops over time between the employee and the organization; sometimes
this pattern is referred to as the norm of reciprocity (Gouldner, 1960). Putting it back into
the service profit chain perspective, organizations that invest in internal service quality
(positive benefit to employees) will in return see increases in employee loyalty, employee
productivity and service levels (positive benefit to the organization).
The argument behind social exchange theory is consistent with the inducements-
contributions framework of voluntary turnover, proposed by March and Simon in 1958.
The inducements-contributions framework serves as the foundation of much of
contemporary turnover theory (Hom and Griffeth, 1995; Allen et al, 2003). March and
Simon argue that an employee’s decision to continue participation in an organization is
based on the balance between the inducements offered by the organization and the
contributions expected of the employee. An employee who perceives greater
inducements is less likely to terminate the working relationship. Again, an organization
that offers support in the form of greater internal service quality may be seen as offering
an inducement to the employee. In return employees will be willing to repay the
organization by increasing their contributions.
58
2.2.3. Individual dimensions of internal service quality
In order to detail a specific measurement of internal service quality we blend the
theoretical, descriptive work of the service profit chain with the more rigorously
grounded, academically validated work of those parallel fields described in section 2.2.1.
The service profit chain anecdotes are used to generate a list of potential internal service
quality elements and then that list is validated with empirical support derived from other
disciplines (e.g. human resource management, personnel psychology, organizational
behavior, etc). Specifically, we look for empirical justification that each of the potential
internal service quality practices influences employee satisfaction as theorized in the
service profit chain model. Appendix A details empirical support for the eight most
commonly cited effectors of employee satisfaction. Appendix B details support of
empirical research that validates the relationship between internal service quality and the
other variables in the service profit chain model. From this analysis we have decided to
use an eight dimensional representation of internal service quality. Each dimension is
listed below and briefly described; each will be discussed in more detail in the following
sections.
1. Training and Coaching – the amount and quality of training programs as wellas on the job performance feedback
2. Goal Management – store goals in line with customer needs andcommunicated to employees
3. Teamwork – employees work in teams to serve customers
4. Empowerment – employees have latitude and authority to meet uniquecustomer needs
5. Work Design – amount of workload, stress and ambiguity involved inemployees’ job responsibilities
59
6. Support – Management – managements’ valuation of employees opinions andwell being
7. Support – Tools – technology, information and operating policies supportfront line workers ability to serve customers
8. Rewards and Recognition – monetary awards and recognition programs areadequate and linked to performance
Sections 2.2. and 2.2.1. offer a literature review of internal service quality, and its
parallels, from a holistic point of view; namely, as a set of interrelated practices. The
following sections provide a cursory review of our eight internal service quality
dimensions independently. The sections serve to enhance the validity not only of our
definition and operationalization of the internal quality construct itself but also for the
link between internal service quality and the other variables in the service profit chain
model. The discussion of each dimension begins with a summary of the evidence linking
it to employee measures such as satisfaction and loyalty. A summary and justification of
the survey instrument apropos of each dimension is then given.
TRAINING:
One of the most widely studied human resource practices in the service segment
is employee training. Vast amounts of research have demonstrated that the training of
frontline employees in both job-related and behavior-related skill sets can have wide
ranging personal and organizational effects. Some of these effects include those
predicted by the service profit chain model: increased job satisfaction (Ulrich et al, 1991;
Hallowell et al, 1996; Wright and Boswell, 2002), increased loyalty (Havlovic, 1991;
60
Wayne et al, 1997), increased ability to meet customer needs (Wayne et al, 1997;
Silvestro and Cross, 2000), improved service quality (Silvestro and Cross, 2000;
Kamakura et al, 2002), increased customer satisfaction (Tornow and Wiley, 1991; Rogg
et al, 2001) and improved business performance (Tornow and Wiley, 1991; Huselid,
1995). Employees who are well trained and are capable of meeting customer needs feel
better and more satisfied with their jobs and are more likely to remain with their
employer. Furthermore, employee knowledge about products, processes and customer
needs helps to create organizational capabilities that are difficult to imitate and cannot be
readily substituted by technological advancements.
Two recent trends are emerging in training literature. The first is a shift towards
research exploring the interaction of training and service failures (Hart et al 1990). A
study by Bitner et al (1990) shows that more than 40% of unsatisfactory service
encounters result from employees’ inability to respond to service failures – this inability
stems from lack of proper training. Boshoff and Allen (2000) demonstrate that
employees who do not possess the requisite job skills, skills developed through training,
fail to provide satisfactory service when dealing with customer complaints. As service
recovery and failure analysis gains more attention in both academic circles and business
practice, research into the effect of training on employees’ service capability will
continue to grow exponentially. A more recent development in training literature is the
impact training programs have on team performance (Wright and Boswell, 2002).
Environments where employees work in teams necessitate training not only in product
and process attributes but also in interpersonal skills. Mathieu et al (2000) find that
61
training and job rotation positively influence team performance. Frayne and Geringer
(2000) show similar results in an insurance setting.
This research relies heavily on previous empirical research in regards to
measuring employee training. In order to be as comprehensive as possible, several
different aspects of training are surveyed. The most obvious and common question used
in training research is whether an employee receives enough initial training when first
taking a job (Huselid, 1995; MacDuffie, 1995). However, the amount of initial training
certainly does not guarantee an employee’s success. In a retail environment, new
products and processes are continually being introduced; therefore, it is crucial that
employees receive adequate additional training throughout the term of their employment
(MacDuffie, 1995; Babakus et al, 2003). In addition to measuring the amount of training
given, it is critical to measure the quality of the training programs (Wayne et al, 1997).
For training to be effective it is essential that management gives feedback regarding an
employee’s job performance and specific recommendations on how to improve (Huselid,
1995).
GOALS:
Borrowing from research into manufacturing strategy and goal setting, Heskett et
al (1994, 1997) describe the importance a service organization should place on goal
setting. Organizational goals should be clearly communicated to employees on a regular
basis so that the entire employment team is working towards the same objectives.
Employees who understand their organizational values are more likely to go out of their
way to fulfill these goals. Employees who do not understand their organization’s goals
62
are more likely to feel conflicted, limiting their ability to satisfy customer needs.
Organizational goal setting and management have been positively linked to immediate
employee measures as well as long term business performance. Schlesinger and Bowen
(1985) show that goal management can have a positive effect on employee satisfaction.
Havlovic (1991) and Huselid (1995) show that goal management can increase employee
loyalty. Tornow and Wiley (1991) and Arthur (1994) demonstrate a positive association
with employee productivity. Zeithaml et al (1988) and Schneider and Bowen (1993)
illustrate the positive link between goal management and customers’ perceptions of
service quality. Meyer et al (1999) and Rogg et al (2001) both demonstrate the
importance of goal management and leadership in positively influencing customer
satisfaction measures. Taking the analysis a step further, Silvestro and Cross (2000) and
Kamakura et al (2002) show how goal management can affect business performance.
There are no comprehensive scales in extant literature to measure goal
management in service organizations. When developing the survey instrument we rely,
when possible, on items that other researchers have used but have had to supplement
these questions with additional ones prescribed by the anecdotes found in Heskett et al
(1994, 1997). The instrument measures goal management with five questions based on
eliciting employee feelings regarding management’s communication of goals, procedures
and policy changes (Hallowell et al, 1997). However, communicating goals is not
enough; the goals of the company must also be aligned with customer needs (Hallowell et
al, 1997). An obvious link exists between organizational goals being in line with
customer needs and customer satisfaction. Research has also shown a secondary effect of
goal management: employees who work in an environment of conflicting organizational

63
and customer needs are less satisfied and productive and more likely to leave the
company (Rogers et al, 1994; Varca, 1997).
TEAMWORK:
Work teams have been extolled as one of the most significant business
innovations of the 1990’s, helping organizations achieve productivity and service
breakthroughs. The past fifteen years have seen an explosion not only in academic
research of work teams but also in practical implementations of the teaming model. One
reason for this increase is that work team structures play a vital supporting role in
emerging and advanced business practices such as total quality management, just-in-time
production, lean manufacturing, business process reengineering, etc. (Wisner and Feist,
2001). Teaming, often combined with cross-training, creates flexibility for an
organization, especially in retail environments where demand and the need for customer
service can fluctuate drastically within very small time intervals. The use of work teams
has been positively linked to employee measures such as satisfaction (Rucci et al, 1998;
Rhoades and Eisenberger, 2002), productivity (Schlesinger and Zornitsky, 1991;
Sheridan, 1992) and loyalty (Havlovic, 1991; Arthur, 1994). Teaming has also been
linked to intermediate performance measures such as external quality (Zeithaml et al,
1988; MacDuffie, 1995) and customer satisfaction (Silvestro and Cross, 2000; Rogg et al,
2001). Finally, overall business performance has also been shown to be positively related
to the use of work teams (Lau, 2000; Kamakura et al, 2002).
The survey instrument used in this study is designed to capture not only the
emphasis that management places on teamwork but also the actual amount of teamwork
64
that takes place on a regular basis. While this particular retailer assigns sales associates
to distinct zones within a store, customer demand is in no way evenly spread out across
the zones at all times. Therefore, it is necessary for idle sales associates to help in work
zones that are overburdened. Work by Hallowell et al (1991) and MacDuffie (1995)
provides a basis for the specific items used in this survey.
EMPOWERMENT:
Empowerment has been defined in many different ways, but one common thread
running through all the definitions is that it involves giving employees latitude and
discretion over certain task-related activities (Schlesinger and Heskett, 1991; Bowen and
Lawler, 1992; Rafiq and Ahmed, 1998; Babakus et al, 2003). Customers play active
roles in many service processes, and with this increased involvement comes increased
variability. Organizations cannot often control or predict how customers will behave
during the service process. Due to this lack of control over the external environment,
organizations often find it helpful to empower their employees. Front-line employees are
often given discretion during the service delivery process. Many customers will have
unique needs than cannot be fulfilled by scripted responses from employees. Employees
must be capable of handling these situations when they arise. Moreover, customers may
find it tiresome if every request they have of an employee is met with a standard “let me
check with my manager” response. Empowerment is especially crucial when service
failures occur (Bitner, 1990; Bowen and Lawler, 1992; Spreng et al, 1995; Boshoff and
Allen, 2000). Because of their boundary-spanning roles, front line employees can
65
provide quick, appropriate and equitable responses to dissatisfied customers (Babakus et
al, 2003).
Empowerment has been linked to a wealth of outcomes, behavioral and business
alike. There is substantial evidence that empowerment leads to increased employee
satisfaction as employees tend to feel more important in their jobs (Zeithaml et al, 1988;
Niehoff et al, 1990; Spreitzer et al, 1997). Lau (2000) demonstrates that higher levels of
empowerment increase employee productivity and loyalty. Using more of a customer-
oriented framework, other researchers also show that empowerment can lead to increased
service quality (Zeithaml et al, 1988; Silvestro and Cross, 2000), customer satisfaction
(Rafiq and Ahmed, 1998) and business performance (Kamakura et al, 2002). These latter
findings result from empowered employees being able to respond quickly to unique
customization needs often required in service settings. Empowerment, much like
teamwork and training, is also a fundamental cornerstone of modern business practices
such as just-in-time production, total quality management and lean manufacturing. As
such, it has been indirectly tied to operational outcomes over the past twenty years in
these respective streams of research.
Although empowerment has been shown to be a multi-dimensional construct
(Spreitzer et al, 1997; Kraimer et al, 1999) most research that investigates its short and
long term implications uses only general type questions to assess degree of employee
empowerment (Babakus et al, 2003). Because of the extensive length of the survey
instrument used in this study, this simpler approach to measure empowerment is taken.
Five survey items based on those used by Edvardsson et al (1997), Rafiq and Ahmed
66
(1998) and Meyer et al (1999) are used. Specifically, the items ask questions regarding
authority, latitude and independence.
WORK DESIGN
One aspect of internal service quality often overlooked in business literature but
very prevalent in psychology literature as an influencer of employee satisfaction, loyalty
and productivity is work design. By work design, we do not mean the technical aspects
of balancing job activities to form equivalent job tasks, but rather the behavioral facets of
work design related to stress, ambiguity, tension and conflict. Rogers et al (1994)
provides definitions of these terms. Role conflict occurs when an individual is expected
to engage in inconsistent behavior as a result of receiving contradictory demands – most
often between their manager’s instruction and their own value system. Role clarity has
been defined as the degree to which individuals understand the exact requirements of
their job. Ambiguity is simply the opposite of clarity; it occurs when individuals are
confused as to their specific responsibilities. Stress, which can be caused by any number
of working conditions, is a general feeling of emotional or physical tension. All four of
these dimensions have been linked to employee satisfaction, loyalty and productivity
(Rogers et al, 1994; Spreitzer et al, 1997; Varca, 1999). One common work design
model is proposed, and validated empirically, by Rogers et al (1994), see Figure 2.8.
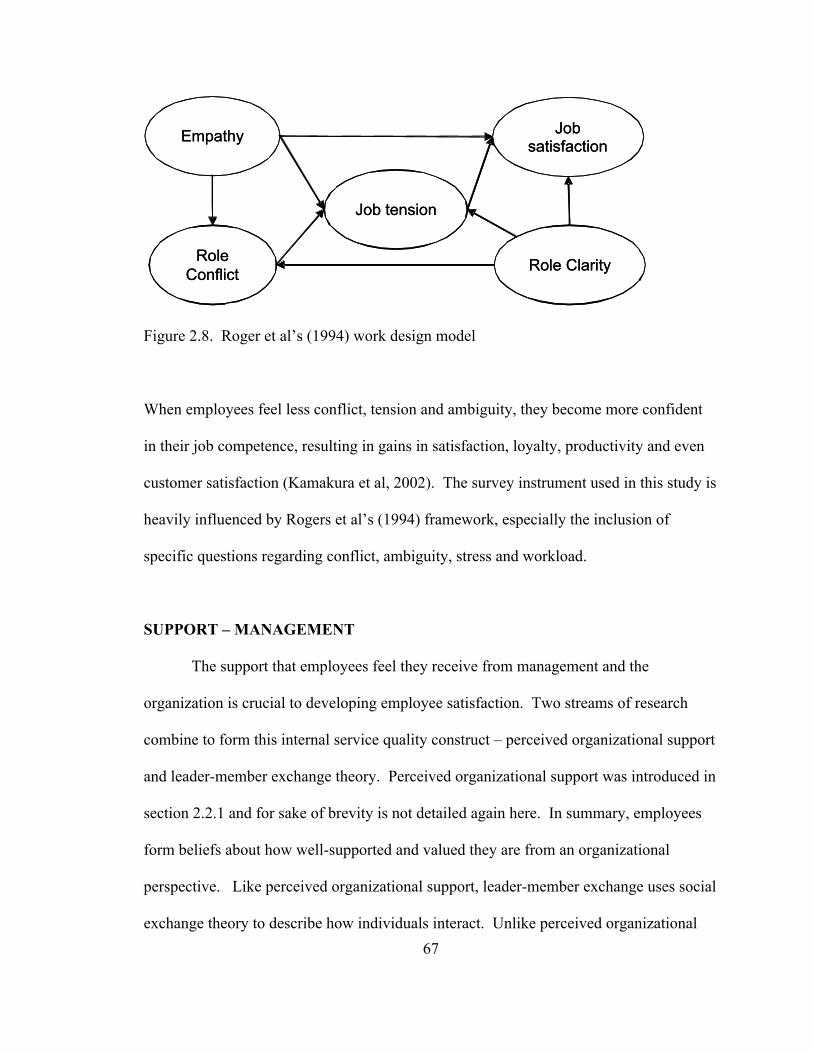
67
Empathy
Role Conflict
Job tension
Job satisfaction
Role Clarity
Empathy
Role Conflict
Job tension
Job satisfaction
Role Clarity
Figure 2.8. Roger et al’s (1994) work design model
When employees feel less conflict, tension and ambiguity, they become more confident
in their job competence, resulting in gains in satisfaction, loyalty, productivity and even
customer satisfaction (Kamakura et al, 2002). The survey instrument used in this study is
heavily influenced by Rogers et al’s (1994) framework, especially the inclusion of
specific questions regarding conflict, ambiguity, stress and workload.
SUPPORT – MANAGEMENT
The support that employees feel they receive from management and the
organization is crucial to developing employee satisfaction. Two streams of research
combine to form this internal service quality construct – perceived organizational support
and leader-member exchange theory. Perceived organizational support was introduced in
section 2.2.1 and for sake of brevity is not detailed again here. In summary, employees
form beliefs about how well-supported and valued they are from an organizational
perspective. Like perceived organizational support, leader-member exchange uses social
exchange theory to describe how individuals interact. Unlike perceived organizational
68
support, which focuses on interactions between the organization and the employee,
leader-member exchange focuses on interactions between the employee and his/her
immediate supervisor. Leader-member exchange proponents claim that an employee’s
immediate supervisor plays a larger role in influencing the employee’s behavior and
satisfaction than the more tacit role played by the organization as an entity (Sparrowe and
Linden, 1997; Kacmar et al, 2003).
The survey instrument used in this research asks two questions from each frame
of reference: perceived organization support and leader-member exchange. The
perceived organizational support questions elicit employee responses concerning their
perception of the organization in general and how it values and supports them. We draw
on research from Eisenberger et al (1986) for the development of these items. The two
leader-member exchange questions educe an employee’s perception of the relationship
they have with their immediate supervisor. The questions are based on those proposed by
Wayne et al (1997).
SUPPORT – TOOLS
Heskett et al (1994, 1997) write about how discouraging it can be for well-
intended employees, who want to serve the customer to the best of their ability, to feel
that they do not have the given resources or tools needed to carry out their job. They give
numerous examples of instances where organizations actually hand-cuff themselves by
not giving employees the capability to serve the customer. In these instances, not only is
productivity immediately reduced, but in addition, over time, employees become
discouraged with their jobs and decreases in employee satisfaction, and hence customer
69
satisfaction, soon follow. Schneider et al (1980) validate this theory in their study of
employee support services in bank branches. Employees who felt that the organization
did not give them the appropriate tools required to carry out their job experienced less job
satisfaction and thus the organizational itself suffered a higher degree of turnover.
The survey instrument is designed to elicit employee perceptions of the support
they are given in the form of resources and information they need to service the customer.
In addition, employee perceptions of whether store policies and procedures inhibit their
ability to satisfy unique customer needs are also explore. The work of Hallowell et al
(1991) and Edvardsson et al (1997) provides a basis for constructing the specific survey
items.
REWARDS and RECOGNITION
Compensation management is one of the most widely studied topics within
human resource management literature; it is especially prevalent within service
frameworks (Wright and Boswell, 2002). Researchers have explored both the monetary
and non-monetary reward systems used by organizations. Within the monetary
categories, most studies focus on wage rates, pay for performance, bonus pay, incentive
pay and/or merit raises. Non-monetary reward systems generally focus on recognizing
outstanding employees with non-financial awards. The awards can be either formal
programs, such as employee of the month, or informal, such as congratulatory remarks
from a supervisor for a job well done. Both of these dimensions have been positively
linked to job satisfaction and loyalty (Brown and Peterson, 1993; Bowen et al, 1999;
Lawler, 2000). They have also been linked to external measures such as service quality
70
(Bowen and Johnston, 1999) and customer satisfaction (Tornow and Wiley, 1991;
Kamakura et al, 2002).
This survey blends both monetary and non-monetary award items. Monetary
items include wage rate, benefits and promotion opportunities (Babakus et al, 2003; Allen
et al, 2003). We draw on previous work from Rhoades et al (2001) and Zemke (2002) to
craft the non-monetary rewards and recognition items.
2.3. Employee satisfaction, loyalty and productivity
One of the most heavily researched areas in human resource management and
personnel psychology is the study of the relationships among employee satisfaction,
employee loyalty and employee productivity. Because of the interaction between the
three variables it is nearly impossible to look at each independently through a
microscopic lens. As such, this section details the linkages among the set of employee
indicators. The section begins with a discussion of the relationship between employee
satisfaction and employee loyalty, then moves to a review of the connection between
employee satisfaction and employee productivity and ends with an examination of the
association between employee loyalty and employee productivity. The section concludes
by detailing the scales used to measure each of the three constructs.
The link between employee satisfaction and employee loyalty is as intuitive as it
is validated, see Appendix C for a listing of empirical support. From a logical perspective
the reasoning is simple: as an employee becomes more satisfied with their job, they are
more likely to continue working at that job. Numerous meta-analyses have empirically
validated this link from a ‘bird’s eye’ perspective: Carsten and Spector (1987), Hom and
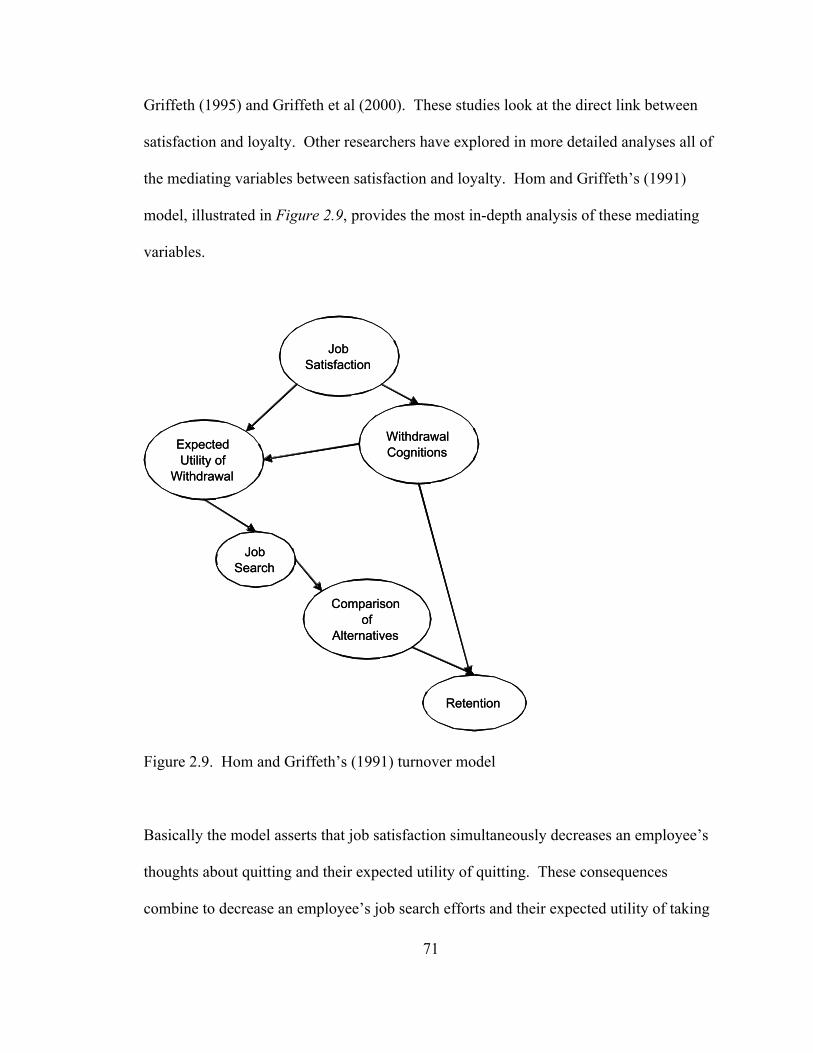
71
Griffeth (1995) and Griffeth et al (2000). These studies look at the direct link between
satisfaction and loyalty. Other researchers have explored in more detailed analyses all of
the mediating variables between satisfaction and loyalty. Hom and Griffeth’s (1991)
model, illustrated in Figure 2.9, provides the most in-depth analysis of these mediating
variables.
Job Satisfaction
Withdrawal Cognitions
Expected Utility of
Withdrawal
Job Search
Comparison of
Alternatives
Retention
Job Satisfaction
Withdrawal Cognitions
Expected Utility of
Withdrawal
Job Search
Comparison of
Alternatives
Retention
Figure 2.9. Hom and Griffeth’s (1991) turnover model
Basically the model asserts that job satisfaction simultaneously decreases an employee’s
thoughts about quitting and their expected utility of quitting. These consequences
combine to decrease an employee’s job search efforts and their expected utility of taking
72
one of the available alternatives. The end result of this entire model is that, as employee
loyalty increases, the organization will enjoy higher retention rates. Allen et al (2003)
propose a simplified version of this model: job satisfaction decreases turnover intentions
which in turn decrease turnover. Both of these studies argue that an organization can
build employee job satisfaction through the use of supportive human resource practices.
Just as satisfied employees tend to work for the same organization longer, they
also tend to put forth more effort and work harder, thus becoming more productive. A
meta-analysis by Petty et al (1984) surveyed dozens of studies that show correlations
ranging from 0.04 to 0.70. The mean correlation across all studies, studies that totaled
over 3,000 employees, is shown to be 0.31. Recently, several researchers have revealed
similar findings by using organizational citizenship behavior as a surrogate for employee
productivity (Moorman et al, 1998). These studies have demonstrated that employee
satisfaction drives factors such as individual initiative, personal industry and
interpersonal helping, all of which are different forms of productivity.
The link between employee loyalty and productivity is even stronger and more
direct than that between satisfaction and productivity. As employees continue working
with an organization, they become more familiar with the service processes and the needs
of the customer. Both of these results lead to increased efficiency and productivity.
Heskett et al (1994) give many anecdotes as evidence of this relationship. For one firm
they surveyed, the average monthly difference between a sales representative with five to
eight years of experience and one with less than one year of experience was
approximately $36,000 in sales. Similar evidence abounds in Heskett et al (1997, 2001)
and Schlesinger and Zornitsky (1991). The support for this linkage extends beyond case
73
studies. McEvoy and Cascio (1987) use a meta-analytic approach of twenty four studies
to demonstrate a significant positive correlation between productivity and loyalty. More
recent work by Sheridan (1992) and Kamakura et al (2002) support these claims.
Appendix D provides a more comprehensive listing of empirical support linking
employee loyalty to the other service profit chain variables; Appendix E does likewise for
employee productivity.
The survey instrument used in this research includes two different measures of
employee satisfaction. Both scales have been well validated and are generally considered
to be the best measures. The first measure is simply one overall question about an
employee’s general satisfaction. The second measure is the job facets scale. This scale
measures five different facets of an employee’s satisfaction: pay and benefits,
opportunities for promotion, relationship with supervisor, relationship with co-workers
and amount of job responsibilities. Both scales have been used extensively in literature.
The former has been used in studies by Schneider et al (1980), Schlesinger and Zornitsky
(1991), Rust et al (1996), Silvestro and Cross (2000) and Eisenberger et al (2001). The
latter has been used by Petty et al (1984), Schneider and Bowen (1985), Hom and
Griffeth (1991), Shore and Tetrick (1991) and Judge et al (2002). A recent study by
Nagy (2002) demonstrates that the two scales are highly correlated and can be used
interchangeably, although he does note that problems could arise with the facets scale if
an employee does not weigh the five satisfaction dimensions equally when forming an
overall satisfaction score.
There are also two different ways in which to measure employee loyalty, and
again, both are quite popular. The first is simply to quantify the length of time an
74
employee has worked for a company. Huselid and Day (1991), Schlesinger and
Zornitsky (1991) and Rhodes et al (2001), among many others, prefer this method. Other
researchers argue that too many contextual factors, which cannot be accounted for in a
study, influence actual duration of employment; these researchers thus prefer to measure
an employee’s intent to remain loyal (Hom and Griffeth, 1991; Wayne et al, 1997; Allen
et al, 2003). Using the theory of reasoned action, Allen et al (2003) argue for the validity
of both methods and demonstrate a very high correlation between intent measures and
objective measures of loyalty. We will use intent measures in our modeling but will also
include length of employment to validate our perceptual scale.
The ideal method to measure employee productivity in the retail sector is to use
an objective measure such as sales per shift or sales per hour (Huselid, 1995; Silvestro
and Cross, 2000). However, because of the work design of this particular retailer - that
is, employees are not assigned to customers, but rather zones - using an objective
measure is impossible since employee sales are not individually tracked. A secondary
measure would be a manager’s assessment of an employee’s productivity (Eisenberger et
al, 2001). However, since the surveys are confidential there is no way to match
employees to their manager’s perceptions. Instead, employees’ perceptions of their own
productivity and capability is used. The individual survey items are drawn from Denison
et al (1995) and Spreitzer et al (1997). We do acknowledge a drawback to this approach
in that it suffers from common method bias, since employees are effectively grading
themselves. This approach has also had questionable results in terms of correlating with
objective measures, as well as managerial perception measures.
75
2.4. Summary
This chapter surveys the literature from several different disciplines in reviewing
theoretical and empirical work into the service profit chain; specifically, the first half of
the chain, the service delivery system. The chapter draws parallels from Heskett et al’s
(1994, 1997) service profit chain framework to other commonly accepted theoretical
management frameworks – relationship value management, relational marketing, the
cycle of success, perceived organizational support, the Malcolm Baldrige National
Quality Award and the employee attachment framework. Empirical research into the
service profit chain is reviewed and a substantial research gap is identified.
Another result of this review is an eight dimensional representation of internal
service quality, a latent variable representing the quality of work life and the amount of
support front line workers receive from their organization. The eight dimensions used
include: training and coaching, goal management, teamwork, empowerment, work
design, support – management, support – tools and rewards and recognition. Section
2.2.1. draws parallels between internal service quality and other supportive human
resource theories, some of which include: quality of work life, perceived organizational
support, innovative human resource practices, high performance human resource
practices, organizational climate and organizational culture. Using social exchange
theory and the inducements/contributions framework, sections 2.2.2 and 2.2.3. give
theoretical and empirical justification for the expected linkages between internal service
quality (and all of its eight dimensions) and employee satisfaction and employee loyalty.
As such the following two hypotheses, embedded within the service profit chain, will be
tested:
76
H1a: Internal service quality is positively associated with employeesatisfaction.
H1b: Internal service quality is positively associated with employeeloyalty.
Section 2.3. draws on a strong stream of research to suggest that satisfied, loyal
employees become more familiar with the service process, and as such, become more
productive. These links have been well validated in both operations and human resource
literature. As such, they lay the foundation for the following three hypotheses (again,
both of which are embedded within the service profit chain):
H1c: Employee satisfaction is positively associated with employeeloyalty.
H1d: Employee satisfaction is positively associated with employeeproductivity.
H1e: Employee loyalty is positively associated with employeeproductivity.
77
CHAPTER 3
LITERATURE REVIEW: SERVICE CONCEPT AND TARGET MARKET
Chapter 3 will be dedicated to the customer portion of the service profit chain and
will focus on how customers assess and value an organization’s service offering and the
business implications of these assessments. It will be organized in a similar manner to
chapter 2. Specifically, it will begin by introducing the driver of the customer portion of
the service profit chain – total retail experience. This multidimensional construct will
first be looked at from a collective standpoint, and then each of its five dimensions will
be individually analyzed. Section 3.1.1 will draw parallels between total retail
experience and other customer valuation frameworks. Section 3.2 will detail research
into customers’ perceptions of value. Following this section, section 3.3 will be
dedicated to reviews of customer satisfaction and customer loyalty literature. The
chapter ends with a summary provided in section 3.4.
3.1. Total retail experience
In their work on the service profit chain Heskett et al (1994, 1997, 2001) use the
terms “external service quality” and “external service value” as ways to describe how
78
customers assess service operations. Regardless of what term they use to designate the
concept, they give many far-reaching examples to illustrate the notion. For instance, at
Southwest Airlines customers appreciate frequent departures, on-time service and
friendly employees in addition to the low prices they receive (1997). Progressive
insurance customers value quick-response damage assessment and claims processing
(1994). With each example, while the precise criteria of what makes good “service
quality” or “service value” may change, some common categories continually re-occur.
Some of the typical customer demands include: rapid service, knowledgeable and
friendly employees, high quality products, convenient service and aesthetically pleasing
surroundings. These demands are quite comprehensive and extend far beyond traditional
customer assessment scales found within service management literature (e.g. “service”
quality). As such a new assessment tool will be needed.
One emerging research construct that closely resembles all of the concepts found
within Heskett et al’s (1994) notion of external service quality is total retail experience.
Berman and Evans (1998) define total retail experience as “all the elements that
encourage or inhibit consumers during their contact with the retailer.” The examples they
include in their theoretical work closely resemble those used by Heskett et al in their
work on the service profit chain: superior customer service, knowledgeable and friendly
employees, etc. Terblanche and Boshoff (2001a, b) provide further structure for
assessing the dimensions of total retail experience. Their framework breaks total retail
experience into controllable and non-controllable elements. Figure 3.1 illustrates their
structural schema.
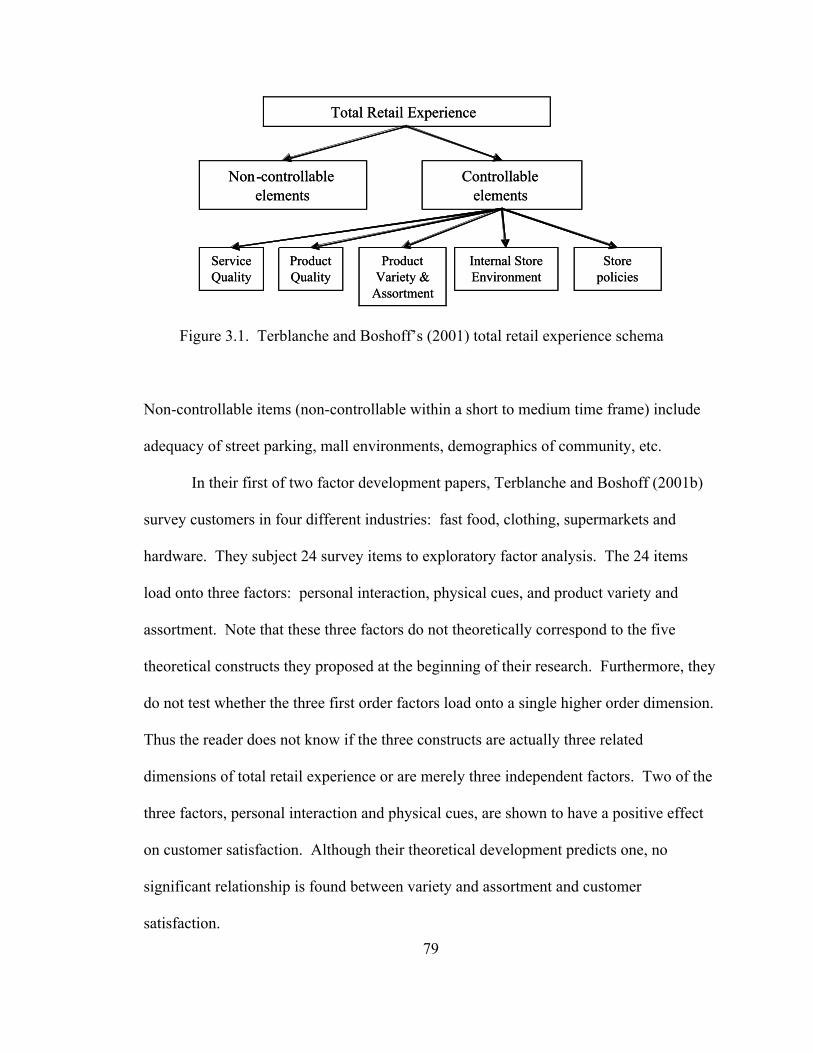
79
Total Retail Experience
Non-controllable elements
Controllable elements
Service Quality
Product Quality
Product Variety &
Assortment
Internal Store Environment
Store policies
Total Retail Experience
Non-controllable elements
Controllable elements
Service Quality
Product Quality
Product Variety &
Assortment
Internal Store Environment
Store policies
Figure 3.1. Terblanche and Boshoff’s (2001) total retail experience schema
Non-controllable items (non-controllable within a short to medium time frame) include
adequacy of street parking, mall environments, demographics of community, etc.
In their first of two factor development papers, Terblanche and Boshoff (2001b)
survey customers in four different industries: fast food, clothing, supermarkets and
hardware. They subject 24 survey items to exploratory factor analysis. The 24 items
load onto three factors: personal interaction, physical cues, and product variety and
assortment. Note that these three factors do not theoretically correspond to the five
theoretical constructs they proposed at the beginning of their research. Furthermore, they
do not test whether the three first order factors load onto a single higher order dimension.
Thus the reader does not know if the three constructs are actually three related
dimensions of total retail experience or are merely three independent factors. Two of the
three factors, personal interaction and physical cues, are shown to have a positive effect
on customer satisfaction. Although their theoretical development predicts one, no
significant relationship is found between variety and assortment and customer
satisfaction.
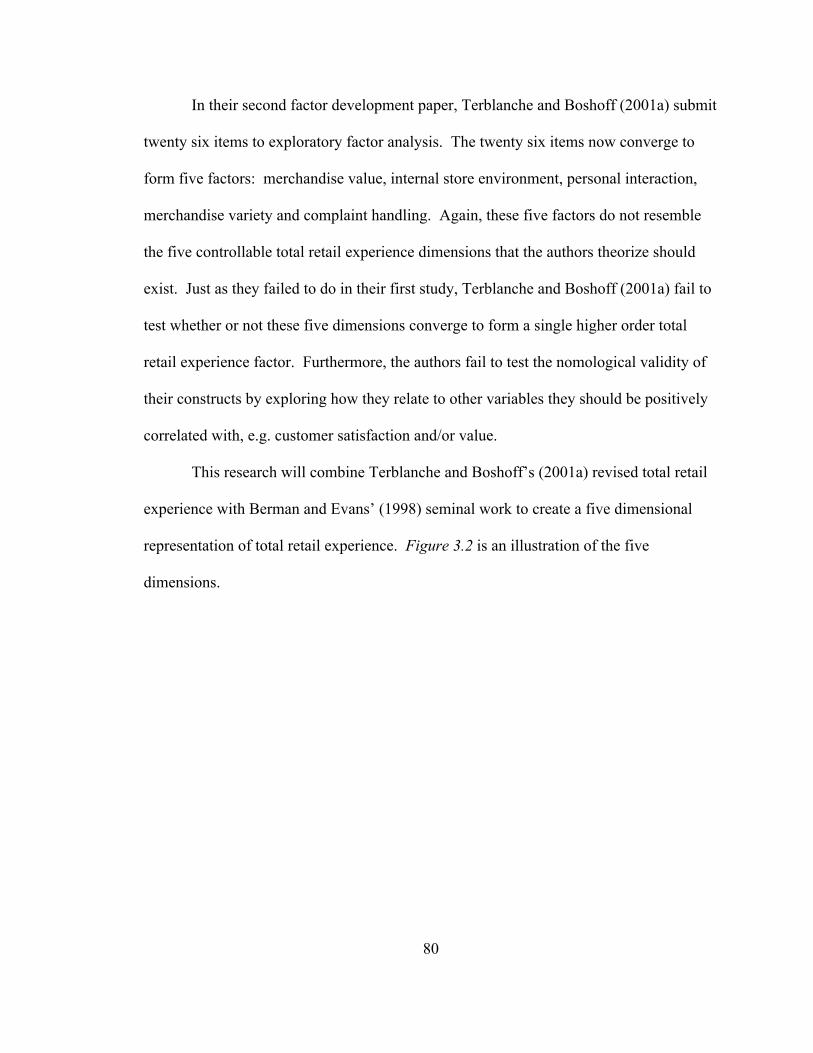
80
In their second factor development paper, Terblanche and Boshoff (2001a) submit
twenty six items to exploratory factor analysis. The twenty six items now converge to
form five factors: merchandise value, internal store environment, personal interaction,
merchandise variety and complaint handling. Again, these five factors do not resemble
the five controllable total retail experience dimensions that the authors theorize should
exist. Just as they failed to do in their first study, Terblanche and Boshoff (2001a) fail to
test whether or not these five dimensions converge to form a single higher order total
retail experience factor. Furthermore, the authors fail to test the nomological validity of
their constructs by exploring how they relate to other variables they should be positively
correlated with, e.g. customer satisfaction and/or value.
This research will combine Terblanche and Boshoff’s (2001a) revised total retail
experience with Berman and Evans’ (1998) seminal work to create a five dimensional
representation of total retail experience. Figure 3.2 is an illustration of the five
dimensions.
81
Total Retail Experience
Servicescape
Product Quality
Product Availability & Selection
Store Layout
Process Quality
Total Retail Experience
Servicescape
Product Quality
Product Availability & Selection
Store Layout
Process Quality
Figure 3.2. Five dimensional representation of total retail experience
Because of the lack of construct development of the total retail experience scale much
care and devotion will be spent in chapter 4 in developing the factor. Furthermore, this
will be the first research that explicitly explores whether a second order factor exists.
The next section of this chapter will lend content and face validity to our rendering of
total retail experience by describing parallels to similar customer assessment frameworks.
Following that section, each of the five dimensions will be analyzed individually.
3.1.1. Parallels to total retail experience.
Although research into total retail experience is still in its infancy, much past
research has been dedicated to developing a comprehensive customer assessment
framework in the service industry. Two of the most closely related concepts are store
82
shopping experience and store image. As they add to the face validity of total retail
experience, each will be briefly treated here.
The first parallel, store shopping experience, was introduced by Kerin et al (1992)
in their study of consumer perceptions of retail stores. Kerin et al (1992) posit that “store
shopping experience emerges from a consumer’s interaction with a store’s physical
surroundings, personnel and customer-related policies and practices.” Using theory from
environmental psychology, they theorize that store shopping experience can influence
patronage decisions, satisfaction and purchase intentions – a proposition that is nearly
identical to the theory proposed within the service profit chain. The authors suggest that
store shopping experience is five dimensional in nature: 1.) store cleanliness, 2.) overall
product variety and selection, 3.) check cashing policy, 4.) friendliness of employees,
and 5.) waiting time. These five dimensions closely resemble those put forward within
this study’s five dimensional rendering of total retail experience.
In their study, Kerin et al (1992) use only one question to assess customer
impressions of each of the five dimensions. They do show, however, that these five
questions form a reliable, valid store shopping experience factor. Furthermore, their
structural equation results indicate that store shopping experience is positively related to a
consumer’s perceptions of store value, path estimate of 0.41 (p < .01).
The second customer assessment framework that parallels total retail experience
is one of the most heavily studied research topics in marketing literature – the concept of
store image. Because of the depth of the store image research stream, only a few major
highlights will be discussed here; the reader should consult Zimmer and Golden (1988)
for a more complete review. As far back as Martineau in 1958, retail stores have been
83
thought to have “images”. Martineau defines image as “the way in which the store is
defined in the shopper’s mind, partly by its functional qualities and partly by an aura of
psychological activities” (Martineau, 1958). Linquist (1974) added precision to the
definition by stating that store image is comprised of the following seven components:
merchandise (quality and selection), service process, clientele (helpfulness, courtesy, etc),
convenience, promotion and store atmosphere. Since Linquist’s (1974) work, one
common store image scale has developed – INDSCAL (Fenwick, 1974; Stanely and
Sewell, 1976). Zimmer and Golden (1988) let customers openly define store image.
They found that customer responses could be grouped into the following categories:
product quality, process quality, product selection, price, advertising and physical
appearance of the store. Again, these categories closely resemble the five dimensions of
total retail experience that this research will use.
3.1.2. Individual dimensions of total retail experience.
To further understand how total retail experience is related to the other variables
in the service profit chain, each of its components will be analyzed individually, with one
notable exception. Because product quality and service quality continuously appear
together in service management literature, the two dimensions will be reviewed together.
The organization of this section will closely resemble that used in section 2.2.3 which
looked at the individual dimensions of internal service quality. Each of the four
subsections will begin with a theoretical description of the total retail experience
dimension. This will be followed by a review of empirical support that shows how each
dimension is related to the other variables in the service profit chain. When possible,
84
specific references will indicate where the survey items used in this research are
generated from.
PRODUCT QUALTITY AND SERVICE QUALITY
One of the most widely researched topics in service management is the concept of
service quality. Several service quality frameworks have been proposed over the past
two decades. The three most common frameworks are the technical quality / functional
quality schema proposed by Gronroos (1984), the SERVQUAL framework proposed by
Parasuraman et al (1985) and the SERVPERF framework proposed by Cronin and Taylor
(1992). Since their inceptions, each of these three frameworks, or slight variations of
them, have been used extensively. Table 3.1 references studies that have used each of the
frameworks. Each of the frameworks will be briefly reviewed. We will then discuss why
we chose to employ a mix of the three quality frameworks.
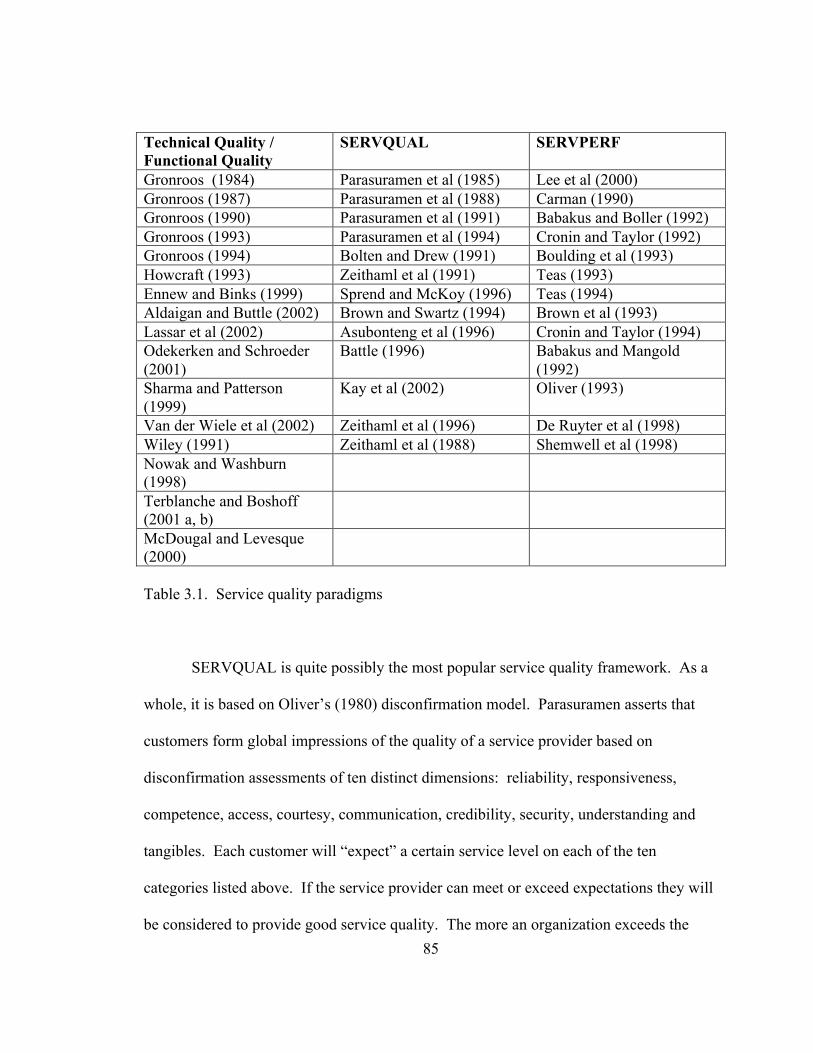
85
Technical Quality /Functional Quality
SERVQUAL SERVPERF
Gronroos (1984) Parasuramen et al (1985) Lee et al (2000)Gronroos (1987) Parasuramen et al (1988) Carman (1990)Gronroos (1990) Parasuramen et al (1991) Babakus and Boller (1992)Gronroos (1993) Parasuramen et al (1994) Cronin and Taylor (1992)Gronroos (1994) Bolten and Drew (1991) Boulding et al (1993)Howcraft (1993) Zeithaml et al (1991) Teas (1993)Ennew and Binks (1999) Sprend and McKoy (1996) Teas (1994)Aldaigan and Buttle (2002) Brown and Swartz (1994) Brown et al (1993)Lassar et al (2002) Asubonteng et al (1996) Cronin and Taylor (1994)Odekerken and Schroeder(2001)
Battle (1996) Babakus and Mangold(1992)
Sharma and Patterson(1999)
Kay et al (2002) Oliver (1993)
Van der Wiele et al (2002) Zeithaml et al (1996) De Ruyter et al (1998)Wiley (1991) Zeithaml et al (1988) Shemwell et al (1998)Nowak and Washburn(1998)Terblanche and Boshoff(2001 a, b)McDougal and Levesque(2000)
Table 3.1. Service quality paradigms
SERVQUAL is quite possibly the most popular service quality framework. As a
whole, it is based on Oliver’s (1980) disconfirmation model. Parasuramen asserts that
customers form global impressions of the quality of a service provider based on
disconfirmation assessments of ten distinct dimensions: reliability, responsiveness,
competence, access, courtesy, communication, credibility, security, understanding and
tangibles. Each customer will “expect” a certain service level on each of the ten
categories listed above. If the service provider can meet or exceed expectations they will
be considered to provide good service quality. The more an organization exceeds the
86
customer’s expectations, the higher the customer will rate it. Parasuramen et al (1988)
quickly reduce the ten dimensional list to five dimensions. It is this five dimensional
representation of service quality that is most prevalently used. Each of the dimensions is
briefly described below.
• Reliability – the ability to perform the promised service dependently andaccurately.
• Assurance – The knowledge and courtesy of employees and their abilityto convey trust and confidence.
• Tangibles – The appearance of the physical facilities, equipment, personneland communication materials.
• Empathy – The provision of caring, individualized attention to customers.
• Responsiveness – The willingness to help customers and to provide promptservice.
Four of these five dimensions (reliability, assurance, empathy and responsiveness) focus
on the process of delivering a service; the remaining dimension focuses on the
environment in which the service is carried out.
To operationalize this framework, several items are generated for each of the
dimensions. Each item is then divided into two separate questions by first assessing what
service level is expected, then assessing what service level is delivered. For example,
within the empathy dimension, survey item 1A might read: “I expect employees at ABC
to provide superior individualized attention.” Survey item 1B would then read:
“Employees at ABC provide superior individualized attention.” Each response could be
signaled using a 1 to 7 likert scale, with 7 indicating total agreement with the statement.
A disconfirmation score would be calculated for item 1 by subtracting the score on item
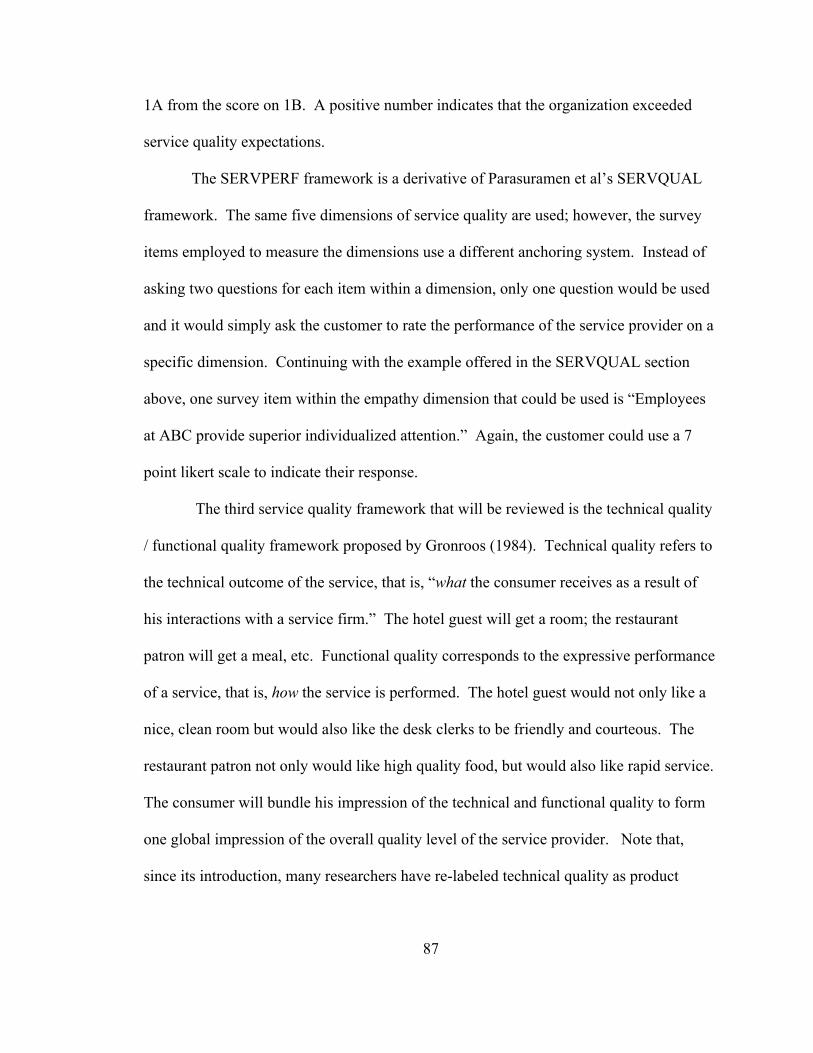
87
1A from the score on 1B. A positive number indicates that the organization exceeded
service quality expectations.
The SERVPERF framework is a derivative of Parasuramen et al’s SERVQUAL
framework. The same five dimensions of service quality are used; however, the survey
items employed to measure the dimensions use a different anchoring system. Instead of
asking two questions for each item within a dimension, only one question would be used
and it would simply ask the customer to rate the performance of the service provider on a
specific dimension. Continuing with the example offered in the SERVQUAL section
above, one survey item within the empathy dimension that could be used is “Employees
at ABC provide superior individualized attention.” Again, the customer could use a 7
point likert scale to indicate their response.
The third service quality framework that will be reviewed is the technical quality
/ functional quality framework proposed by Gronroos (1984). Technical quality refers to
the technical outcome of the service, that is, “what the consumer receives as a result of
his interactions with a service firm.” The hotel guest will get a room; the restaurant
patron will get a meal, etc. Functional quality corresponds to the expressive performance
of a service, that is, how the service is performed. The hotel guest would not only like a
nice, clean room but would also like the desk clerks to be friendly and courteous. The
restaurant patron not only would like high quality food, but would also like rapid service.
The consumer will bundle his impression of the technical and functional quality to form
one global impression of the overall quality level of the service provider. Note that,
since its introduction, many researchers have re-labeled technical quality as product

88
quality and functional quality as service quality. This research will use the updated
verbiage.
All three different service frameworks have been linked to many different
performance measures, see Appendix F for a detailed listing. The most common
measures include both customer oriented measures, such as perceived value, satisfaction,
and loyalty, and business oriented measures, such as revenue, sales growth and
profitability. Because of its importance in relation to this study’s objectives, one research
stream will be detailed here: the means-end service quality model.
The means-end model was first proposed in a theoretical paper by Zeithaml in
1988. The model relates perceived quality, value and customer behavior. In its original
form, the model asserts that perceived quality, made up of both service quality and
product quality, drives perceived value, which in turn drives future purchase behavior.
Eight years after its inception, Zeithaml et al (1996) test the validity of a variant of their
original model. The model they test is depicted below in Figure 3.3.
Figure 3.3. Zeithaml et al’s (1996) means-end model
Behavioral intentions include willingness to pay more for the product, propensity to
switch to another service provider and willingness to recommend the organization to
family and friends. While their regression analysis provides partial support for the
PerceivedQuality
BehavioralIntention
Actual purchasebehavior
Financialconsequences
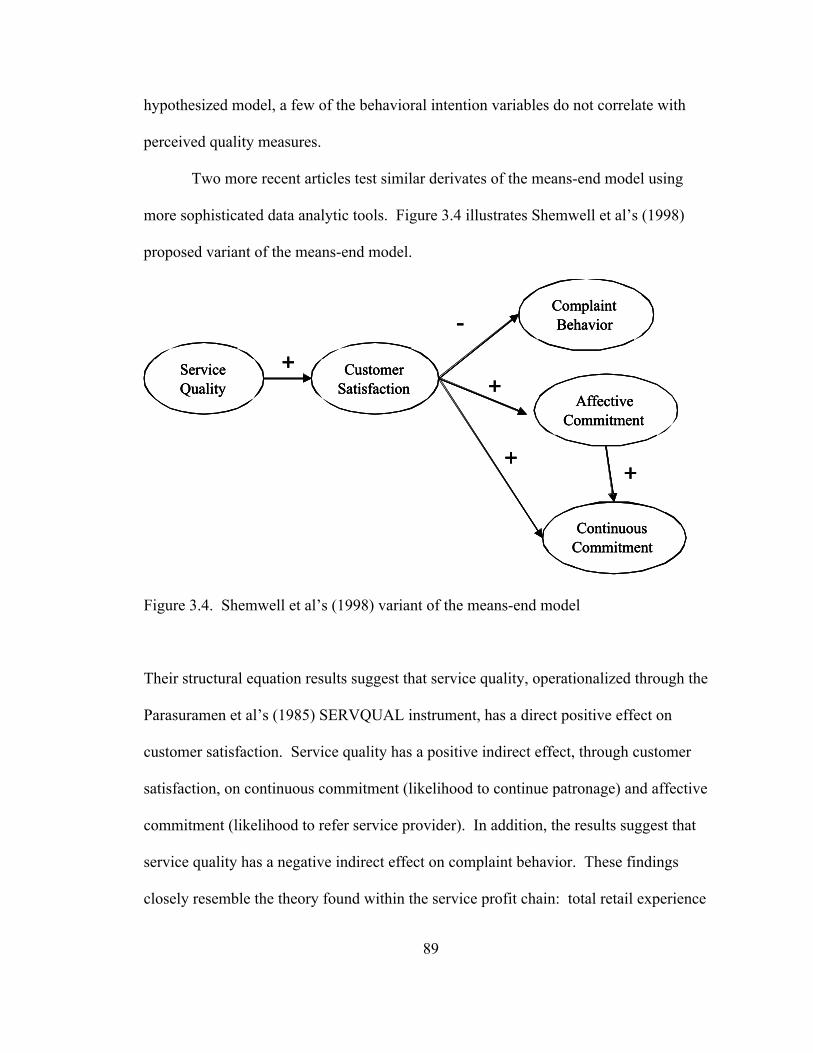
89
hypothesized model, a few of the behavioral intention variables do not correlate with
perceived quality measures.
Two more recent articles test similar derivates of the means-end model using
more sophisticated data analytic tools. Figure 3.4 illustrates Shemwell et al’s (1998)
proposed variant of the means-end model.
Service Quality
Customer Satisfaction
Complaint Behavior
Affective Commitment
Continuous Commitment
++
++
-
Service Quality
Customer Satisfaction
Complaint Behavior
Affective Commitment
Continuous Commitment
Service Quality
Customer Satisfaction
Complaint Behavior
Affective Commitment
Continuous Commitment
++
++
-
Figure 3.4. Shemwell et al’s (1998) variant of the means-end model
Their structural equation results suggest that service quality, operationalized through the
Parasuramen et al’s (1985) SERVQUAL instrument, has a direct positive effect on
customer satisfaction. Service quality has a positive indirect effect, through customer
satisfaction, on continuous commitment (likelihood to continue patronage) and affective
commitment (likelihood to refer service provider). In addition, the results suggest that
service quality has a negative indirect effect on complaint behavior. These findings
closely resemble the theory found within the service profit chain: total retail experience
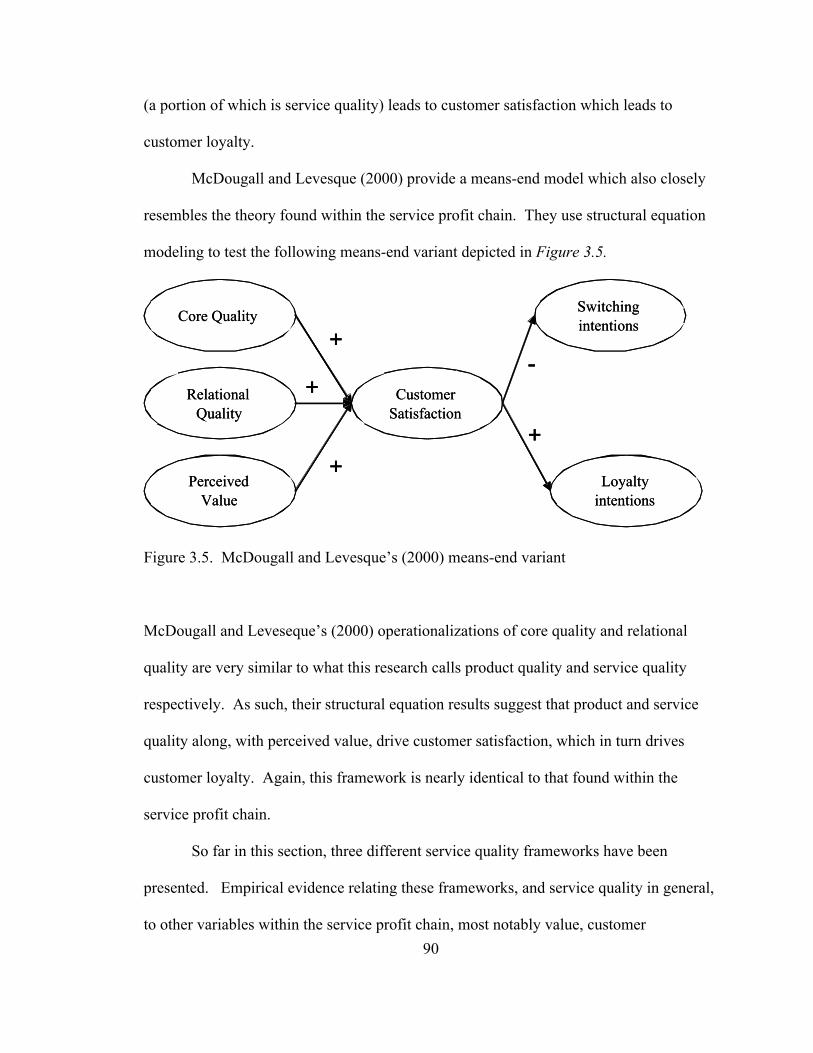
90
(a portion of which is service quality) leads to customer satisfaction which leads to
customer loyalty.
McDougall and Levesque (2000) provide a means-end model which also closely
resembles the theory found within the service profit chain. They use structural equation
modeling to test the following means-end variant depicted in Figure 3.5.
Core Quality
Relational Quality
Perceived Value
Customer Satisfaction
Switching intentions
Loyalty intentions
+
+
++
-
Core Quality
Relational Quality
Perceived Value
Customer Satisfaction
Switching intentions
Loyalty intentions
+
+
++
-
Figure 3.5. McDougall and Levesque’s (2000) means-end variant
McDougall and Leveseque’s (2000) operationalizations of core quality and relational
quality are very similar to what this research calls product quality and service quality
respectively. As such, their structural equation results suggest that product and service
quality along, with perceived value, drive customer satisfaction, which in turn drives
customer loyalty. Again, this framework is nearly identical to that found within the
service profit chain.
So far in this section, three different service quality frameworks have been
presented. Empirical evidence relating these frameworks, and service quality in general,
to other variables within the service profit chain, most notably value, customer
91
satisfaction and customer loyalty has been reviewed. The remainder of this section will
be dedicated to describing which framework this research will use and how its constructs
will be operationalized.
Deciding which of the three frameworks to use is fairly straightforward in this
study. The industry we have chosen to survey is women’s specialty fashion – an industry
where the product itself, in addition to the way in which it is provided, plays an important
role. Of the three frameworks, Gronroos’ (1984) is the only one explicitly to include
product quality; as such, this research will use his technical / functional quality
framework. As discussed earlier, what Gronroos calls technical quality, this study will
label product quality; what Gronroos calls functional quality, this study will label service
quality. The specific survey items used to capture product quality are derived from
Gronroos’ items (1985, 1987, 1990, 1993). They are tailored to fit into a women’s
apparel setting. The specific survey items used to capture service quality draw on
Parasuramen et al’s (1985, 1988, 1991) work. Specifically we ask questions pertaining to
four of their five dimensions: reliability, assurance, empathy and responsiveness. As
will be discussed later, their fifth service quality dimension, tangibles, is capture in
another total retail experience construct, servicescape. Because of the extended length of
the survey, our survey items will use the simpler performance approach to assessing
quality, as opposed to the lengthier method of calculating disconfirmation scores. So, in
essence, this study actually blends pieces of all three of the most common service quality
frameworks: technical / functional quality, SERVQUAL and SERVPERF.
92
PRODUCT AVAILABILITY AND SELECTION
Product selection (variety) and availability are components of the conventional
retail marketing mix (Bitner, 1990). Shoppers would like to be able to choose from an
assortment of different products; both in terms of different styles and different
colors/sizes within one style. This type of assortment has also been hypothesized to build
retail store image (Lindquist, 1974; Zimmer and Golden, 1988). Since one of the most
widely cited customer turnoffs is out-of-stock merchandise, it is also important that stores
keep their merchandise adequately stocked. Customer search costs increase if the
product they want is out of stock; as search costs increase, total costs increase, therefore
perceived value decreases. Both availability and selection have been linked to customer
satisfaction and loyalty behaviors (Wu and Petroshuis, 1987; Sweenty and Stampfl, 1988;
Zimmer and Golden, 1988; Kerin et al, 1992). Some service management researchers
have even included product variety and selection as specific components of product
quality (Yoo et al, 1998; Oderkerken-Schroder et al, 2001). This research will use one
general question to measure each product availability and merchandise selection.
STORE LAYOUT
While it is essential that specialty retailers carry ample selection and stock of
merchandise, it is also important that the store does not become over-crowded, leaving
the customer little room to browse. Aisles should be wide and open to facilitate traffic
flow and allow for comfortable browsing. The layout should make “sense” to the
customer, making it easy for customers to find what they want. Similarly, like items
93
should be grouped near each other. Stor layout has been included in marketing mix
research (Bitner, 1990) and store image research (Lindquist, 1974; Zimmer and Golden,
1988). And, as will be shown in the next section, store layout has often been included in
servicescape literature (Bitner, 1990; Bitner, 1992). Past research has linked store layout
to both increased financial performance and customer satisfaction (Bitner, 1990; Bitner,
1992; Wakefield and Blodgett, 1994; Wakefield and Blodgett, 1996; Sirohi et al, 1998).
SERVICESCAPE
The effect of store atmosphere is widely recognized as one of the strongest
influences on consumers’ impressions of their shopping experience. One particular
research stream that is gaining widespread attention in service management literature is
the idea of store servicescape. Bitner (1992) popularized the term servicescape as a way
of describing the man-made physical surroundings of a store. The servicescape has two
distinct influences on the customer. First, relying on Bloom and Reve’s signal theory
(1990) Bitner asserts that consumers use the physical environment as a rich source for
obtaining cues, cues that can predict the service firm’s capability and quality. Second,
using environmental psychology theory, Bitner theorizes that the servicescape will have a
direct, immediate effect on consumers’ moods. For example, vibrant lighting and up
tempo music will create positive, energetic sensations within customers.
As shown in Figure 3.6, servicescape can be broken into three distinct categories:
ambient conditions (temperature, air quality, noise, music, odor), space/function (layout,
equipment, furnishings) and signs, symbols and artifacts (signage, personal artifacts, style
of décor). As discussed in the previous section, store layout will be an independent
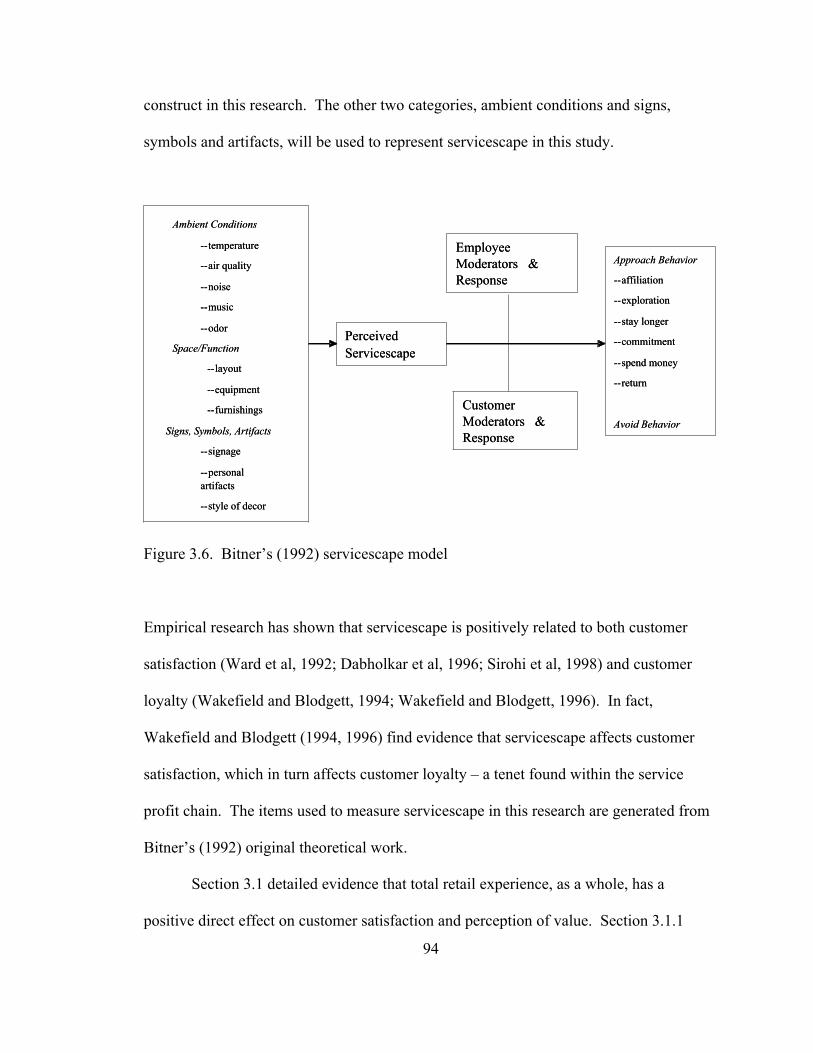
94
construct in this research. The other two categories, ambient conditions and signs,
symbols and artifacts, will be used to represent servicescape in this study.
Ambient Conditions
--temperature
--air quality
--noise
--music
--odor
Space/Function
--layout
--equipment
--furnishings
Signs, Symbols, Artifacts
--signage
--personal artifacts
--style of decor
Perceived Servicescape
Customer Moderators & Response
Employee Moderators & Response
Approach Behavior
--affiliation
--exploration
--stay longer
--commitment
--spend money
--return
Avoid Behavior
Figure 3.6. Bitner’s (1992) servicescape model
Empirical research has shown that servicescape is positively related to both customer
satisfaction (Ward et al, 1992; Dabholkar et al, 1996; Sirohi et al, 1998) and customer
loyalty (Wakefield and Blodgett, 1994; Wakefield and Blodgett, 1996). In fact,
Wakefield and Blodgett (1994, 1996) find evidence that servicescape affects customer
satisfaction, which in turn affects customer loyalty – a tenet found within the service
profit chain. The items used to measure servicescape in this research are generated from
Bitner’s (1992) original theoretical work.
Section 3.1 detailed evidence that total retail experience, as a whole, has a
positive direct effect on customer satisfaction and perception of value. Section 3.1.1
95
added support to these claims by detailing evidence of how constructs that parallel total
retail experience are positively associated with customer satisfaction and value
perceptions. Section 3.1.2 summarizes evidence of how the five individual dimensions of
total retail experience all positively affect customer satisfaction and value perceptions.
As such, the following two hypotheses are proposed:
H2a: Total retail experience is positively associated with value
H2b: Total retail experience is positively associated with customer satisfaction.
3.2. Value
The original service profit chain model did not include a value variable, but in
response to emerging “return on quality” research, Heskett et al (1997) added it in. The
reason for its inclusion is quite straight-forward. The financial benefits of heightened
quality improvement efforts (in this study referred to as total retail experience), which
had been assumed as a matter of faith, came under serious attack in the early 1990’s.
During that time, there were many highly publicized financial failures of companies who
had been at the leading edge of the quality revolution. For example, the Wallace
Company won the Malcolm Baldrige National Quality Award in 1990. However, the
high levels of spending on quality that enabled them to win this award soon produced
unsustainable losses. Two short years later, the Wallace Company filed for bankruptcy
(Hill, 1993). This is just one of the many examples where quality improvement efforts
did not result in increased competitive advantage.
96
In response to these highly publicized failures of quality initiatives, Rust et al
(1995) proposed a return on quality framework. The authors basically assert that the
reason for failed quality initiatives is that many initiatives lack justified economic
grounding – the “quality for quality’s sake” view is just too simplistic and naïve. Rust et
al’s (1995) model is based on four assumptions: 1.) quality is an investment, 2.) quality
efforts must be financially accountable, 3.) it is possible to spend too much on quality,
and 4.) not all quality expenditures are equally valid. Basically, the authors claim that all
quality improvement projects should undergo the same financial scrutiny that all the other
expenditure proposals with an organization go through. Just as a firm would calculate a
return on investment for the purchase of new equipment/machinery, it should do the same
for quality projects – hence the term “return on quality”. Heskett et al (1997) use this
reasoning as justification for the inclusion of the value variable. If the variable is left out,
the model would suggest that all quality improvement efforts, regardless of whether or
not they are financially justified or in line with customer needs, will lead to increased
customer satisfaction, and ultimately increased business performance.
The above discussion illustrates that quality is indeed one component of value,
but a more precise definition is needed. Zeithaml (1988) suggests that “perceived value
is the customer’s overall assessment of the utility of a product based on perceptions of
what is received and what is given.” Researchers have quantified this definition into the
following equation (Liljander and Strandvik, 1992; Sweeney, 1994; Rust et al, 1995;
Patterson and Spreng, 1997)
Perceived Value = Perceived Benefits / Perceived Sacrifice.
97
Perceived benefits often include, but are not limited to, product quality, service quality,
the emotional state of the customer during/after the purchase, etc (perceived benefits
could also be construed as total retail experience). Perceived sacrifice not only includes
purchase price but also acquisition costs, such as transportation costs and travel and
shopping time, and the risk of failure or poor performance. From the customer’s
viewpoint, obtaining value is a fundamental purchase goal and essential to a successful
exchange. Clearly, customers would like to increase benefits received while minimizing
costs incurred.
Research over the past fifteen years has consistently identified value as one of the
most important measures for gaining competitive advantage (Parasuramen et al, 1997;
Payne and Holt, 1999; Payne et al, 2001). It has been positively linked to customer
satisfaction measures, customer loyalty measures, such as intent to continue purchasing
from the same organization and willingness to recommend the organization to family and
friends, as well as overall business performance measures such as sales growth and
margin increases, see Appendix G for a summary of empirical evidence. Patterson and
Spreng (1997) test the validity of one of the most common value paradigms, illustrated
below in Figure 3.7.
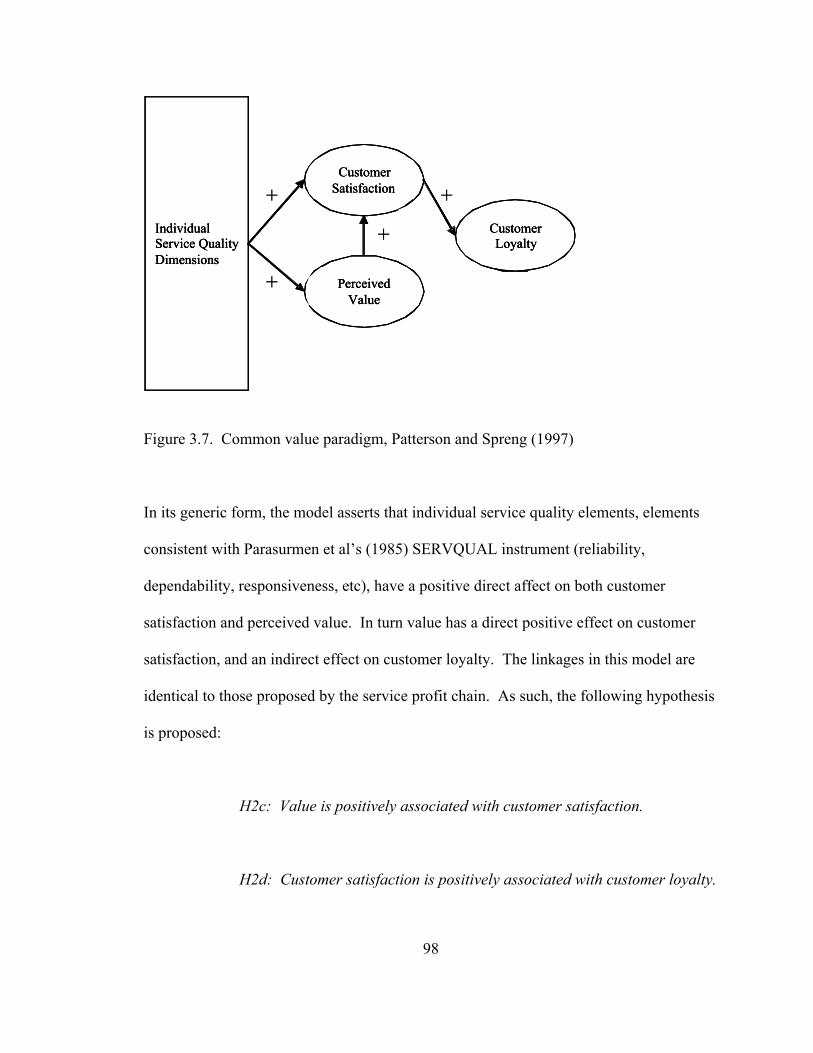
98
Perceived Value
Customer Loyalty
Individual Service Quality Dimensions
Customer Satisfaction+
+
+
+
Perceived Value
Customer Loyalty
Individual Service Quality Dimensions
Customer Satisfaction
Perceived Value
Customer Loyalty
Individual Service Quality Dimensions
Customer Satisfaction+
+
+
+
Figure 3.7. Common value paradigm, Patterson and Spreng (1997)
In its generic form, the model asserts that individual service quality elements, elements
consistent with Parasurmen et al’s (1985) SERVQUAL instrument (reliability,
dependability, responsiveness, etc), have a positive direct affect on both customer
satisfaction and perceived value. In turn value has a direct positive effect on customer
satisfaction, and an indirect effect on customer loyalty. The linkages in this model are
identical to those proposed by the service profit chain. As such, the following hypothesis
is proposed:
H2c: Value is positively associated with customer satisfaction.
H2d: Customer satisfaction is positively associated with customer loyalty.
99
In terms of survey item generation for the value construct, this work relies on items from
Patterson and Spreng (1997) and Sirohi et al (1998). More theoretical justification is
presented for hypothesis “H2d” in the next section, section 3.3. Section 3.3 will also
detail how both variables are operationalized.
3.3. Customer satisfaction and loyalty
Customer satisfaction literature has undergone a dramatic change over the last
fifteen to twenty years. Ittner and Larcker (1998) point toward 1.) a shift “from the cost
of satisfying customers to the value of doing so”, and 2.) how an organization’s focus
should be on satisfying current customers rather than solely on attaining new ones. The
service profit chain uses these same two philosophies. The second aspect will be covered
through a discussion of defensive marketing; the first aspect will be covered through a
discussion of customer lifetime value.
Defensive marketing theorists, such as Fornell and Wernerfelt (1987), have long
argued that companies who focus simply on creating new customers will do so at the
expense of current customers. When an organization’s current customer base feels that
they are exploited and/or neglected, they will soon become disgruntled and look to switch
to other service providers. Hart et al (1990) hypothesize the cost of attracting a new
customer can be over five times higher than the costs of satisfying and keeping a current
customer. Defection analysts such as Reicheld (1990) and Reicheld and Sasser (1996)
support this assertion.
In responding to Ittner and Larker’s (1998) first claim, one must answer the
question of what benefits loyal customers provide that a firm should focus so much
100
attention onto them? Heskett et al’s (1994, 1997) service profit chain research posits that
just as satisfied, loyal employees create value for customers, satisfied and loyal customers
create value for the organization. Customers who are extremely satisfied with a service
provider have been labeled “loyalists” (Jones and Sasser, 1995), “champions” (Wilson,
1991) and “apostles” (Heskett et al, 1994). And customers with this high degree of
attachment to a firm exert what Gremler and Brown (1999) the loyalty ripple effect – “the
influence, both direct and indirect, customers have on a firm through (1) generating
interest in the firm by encouraging new customer patronage and (2) other actions or
behavior that create value for an organization.” A thorough literature review of customer
satisfaction research has identified a list, Table 3.2, of some of the potential “other
actions or behaviors” that Gremler and Brown (1999) elude to.
101
Effect ReferencesDecrease in # of complaints Reicheld and Sasser (1990), Anderson et al
(1997), Anderson and Fornell (2000)Decrease in # of returns Anderson et al (1997)Reduced transaction cost Potts (1998)Reicheld and Sasser (1990),
Heskett et al (1994), Anderson et al (1994),Anderson et al (1997), Nowack and Washburn(1998), Mittal and Lasser (1998)
Decreased price sensitivity / Abilityto charge price premium
Reicheld and Sasser (1990), Anderson andSullivan (1993), Anderson et al (1994),Anderson et al (1997)
Increased references / word-of-mouth
Reicheld and Sasser (1990), Heskett et al(1994), Reicheld (1996), Anderson et al(1997), Nowack and Washburn (1998), Sirohiet al (1998), Gremler and Brown (1999),McDougal and Levesque (2000)
Decreased cost of attracting newcustomers
Heskett et al (1994), Anderson et al (1994),Anderson et al (1997), McDougal andLevesque (2000)
More frequent purchases of sameproduct/service
Reicheld and Sasser (1990), Clark and Payne(1994), Anderson et al (1997), Sirohi et al(1998), Gremler and Brown (1999)
More ancillary purchases Reicheld and Sasser (1990), Clark and Payne(1994), Anderson et al (1997), Sirohi et al(1998), Gremler and Brown (1999)
Decrease in failure costs /warranties / rework
Anderson et al (1994), Heskett et al (1994),Anderson et al (1997)
Decreased advertising cost Reicheld and Sasser (1990), Heskett et al(1994), Nowack and Washburn (1998),Gremler and Brown (1999), McDougal andLevesque (2000), Anderson and Fornell(2000)
Increased voluntary performance Zeithaml and Bitner (1996), Bettencourt(1997), Gremler and Brown (1999)
Increased co-production Longreick-Hall (1992), Gremler and Brown(1999), Anderson and Fornell (2000)
Increased reputation Anderson et al (1994), Anderson et al (1997)
Table 3.2. Effects generated by customer satisfaction and loyalty
102
In terms of the important role that customer satisfaction and loyalty play in
overall business performance, Anderson and Fornell (2000) argue that customer
satisfaction “measures future capacity to provide wealth.” The balanced scorecard
research of Kaplan and Norton (1992, 2001) echo this idea as they include customer
satisfaction among the non-financial leading indicators that can best predict future
organizational performance. Kaplan and Norton are not alone, since their seminal work
in 1992, many researchers have advocated that customer satisfaction and loyalty
indicators should be a component of the next generation accounting principles (Reicheld,
1996; Ittner and Larcker, 1998; Anderson and Fornell, 2000; Rust et al, 2001). These
researchers point to a growing wealth of empirical evidence to support their claims.
Researchers have shown that customer satisfaction and/or customer loyalty is positively
associated with accounting returns (Fornell, 1995), market value of common equity
(Ittner and Larcker, 1998), price to earning rations (Ittner and Larcker, 1998), stock
market performance (Martin, 1998), Tobin’s Q (Mazvancheryl, et al, 1998), sales growth
(Nowak and Washburn, 1998), profitability (Soderlund, 1998) and risk measures (Ittner
and Larcker, 1998). These effects are all predicted in various other customer satisfaction
research streams: customer equity framework (Blattberg and Deighton, 1996), customer
asset management (Rust, 2000; Bolton, 2001), and customer lifetime value (Keane and
Way, 1995; Beyer and Nasr, 1998; Rust et al, 2001).
A great deal of research has investigated the best way to operationalize the
customer satisfaction and customer loyalty constructs. Our customer satisfaction survey
items are developed from similar items used by Wakefield and Blodgett (1994), Voss et
al (1998), Mittal and Kamakura (2001), and Taylor and Hunter (2002). They are general
103
questions aimed at elucidating long-term, higher level abstractions than the more
transaction specific items used to measure the total retail experience and value constructs
(Soderlund, 1998). The questions used to measure loyalty include repurchase intent
(Wakefield and Blodgett, 1999; Taylor and Hunter 2002), share of wallet (Hallowell,
1996; Odekerken-Schroder et al, 2001) and likelihood to recommend (Lee et al, 2000;
McDougal and Levesque 2000).
3.4. Summary
This chapter provides a literature review of the principles contained within the
latter portion of the service profit chain, the service concept and target market portions.
The review begins in section 3.1 of customer assessment frameworks of service
providers. Specifically one comprehensive valuation model is proposed: total retail
experience. Because the concept is still in its infancy and lacks a major research stream,
parallel assessment frameworks are analyzed in section 3.1.1 in order to enhance the face
and content validity of total retail experience. Section 3.1.2 then reviews the five
dimensions of total retail experience independently with specific references given to
survey item generation: product quality, service quality, servicescape, product
availability and selection and store layout. The following two hypotheses, embedded
within the service profit chain, are then proposed:
H2a: Total retail experience is positively associated with value.
H2b: Total retail experience is positively associated with customer satisfaction.
104
Section 3.2 reviews literature into how customers value a service offering. A
precise definition of perceived value is given and one of the most widely accepted
frameworks relating quality, value, customer satisfaction and customer loyalty is
presented (Patterson and Spreng, 1997). Section 3.3 blends concepts from defensive
marketing, the balanced scorecard, lifetime value of a customer, defection analysis and
the customer equity framework to describe how customer satisfaction and customer
loyalty measures affect both operational and financial indicators. Specific references are
given as to how this study operationalizes these constructs as the final two hypotheses are
presented:
H2c: Value is positively associated with customer satisfaction
H2d: Customer satisfaction is positively associated with customer loyalty.
105
CHAPTER 4
MEASUREMENT MODEL DEVELOPMENT
This chapter will begin with a discussion of the methodologies employed in this
research. Section 4.1 reviews the theory behind, as well as the steps involved, in the
methodology of this study. Section 4.1.1 deals exclusively with the methodology used
for the pilot study, section 4.1.2 looks at the methodology for the main study. This
chapter will also lay the framework for the sampling plans and population frame to be
used in this research. In particular, section 4.2 will begin by detailing the population to
be used for this study of the service profit chain. Advantages and disadvantages of the
population frame will be discussed. Section 4.2.1 will review the sampling plan used for
the pilot study. Section 4.2.2 will perform a similar task this time referring to the main
study. Section 4.3 details the iterative steps taken to generate the survey instruments
used in the pilot study as well as discussing how revisions are incorporated to produce
instruments for the main study.
Section 4.4.1 presents the results of the pilot study measurement model. Every
factor used in this research is subjected to rigorous tests of reliability and uni-
dimensionality. Because of limited sample sizes, tests of discriminant validity and
106
nomological validity are delayed until the main data collection. Several changes need to
be made to the survey instrument before finalizing it for the main study. All of these
proposed changes are given in detail throughout the section. In order to avoid excessive
repetition only those constructs that required revision are detailed in section 4.4.1. All
constructs are detailed in section 4.4.2, a section that looks at the measurement models
used within the main data analysis. The larger sample of the main survey allows for
testing of the discriminant validity of each construct. The results of the data analysis
conducted in section 4.4.2 suggest that the constructs used in the structural equation
models in chapter 5 are reliable, uni-dimensional and valid. The chapter ends with
section 4.5 providing a summary of the measurement model findings.
4.1. Methodology
4.1.1. Pilot study
The main purpose of the pilot study is to gather valuable information about the
survey instrument. It gives a chance to undertake preliminary analysis of the reliability
and validity of the constructs used in the research. As such, the pilot study allows for
purification of the survey instrument and the scales contained therein.
The first step in the pilot study is to develop the survey instrument and to generate
specific items for each construct. Section 4.3 details the steps involved in the survey
construction. The surveys are then distributed according to the process described in
Section 4.2.1. The data from completed surveys is entered into SYSTAT 10.2.
107
Prior to conducting any sophisticated factor development, exploratory data
analysis is conducted to understand the basic properties of the data. This analysis
includes, but is not limited to, the following steps:
• Fixing the direction of reverse coded items• Missing data analysis• Analyzing descriptive statistics such as mean, median, mode, range, standard
deviation and variance• Measuring departures from normality based on skewness and kurtosis.
Missing value analysis indicates that items are not systematically omitted. Because of the
very low percentage of missing data, .16% for the employee survey, .11% for the
customer survey, missing observations are deleted list-wise. As a reliability check, two
imputation methods are used for missing data, regression scores and mean substitution.
Both of these methods resulted in similar findings across all statistical tests carried out, as
such, only the results of using the list-wise deletion method are given. Furthermore,
before conducting factor analysis, bivariate correlations are analyzed for all items within
a hypothesized construct. Items within one scale should all be highly correlated.
In terms of factor development the first step is to assess the reliability of each
construct. According to Droge (1996) reliability “is concerned with the extent to which
the measurement process yields consistent results when the process is repeated in some
way.” In other words, it is the degree of consistency or stability of a scale (Ahire and
Devaraj, 2001). If the items of a scale account for a significant part of the variation in the
construct vis-à-vis measurement error, the scale is said to be reliable. The most popular
method of evaluating reliability is calculating a scale’s Cronbach alpha (_) coefficient
(Cronbach, 1951). Although there is no strict threshold of statistical significance using
this method, two popular thresholds have emerged during the last thirty years: 0.60 for
108
emerging constructs and 0.70 for maturing constructs (Nunnally, 1978; Hair et al, 2001).
Beyond merely looking at the absolute level of the _ value to assess a scale’s reliability,
we also look at the effect that removing each item individually has on the _ value – this is
sometimes called the “_ if item deleted” method. We specifically look for items the
deletion of which will significantly increase the scale’s reliability.
A common second step in assessing reliability is to calculate an item’s corrected
item to total correlation (CITC) value. Each item within a construct should be highly
correlated with the construct itself. Various different standards are used to assess CITC
values. Kerlinger’s (1978) suggestion of 0.40 is used in this study. We also check to see
if one individual item, or a group of items, within a scale has a relatively weak CITC
score compared to the rest of the group. In such cases, removing the item may be
warranted.
After reliability is established, validity can be assessed. Within this study, three
different types of validity will be investigated: unidimensionality, discriminant and
nomological. Due to sample size limitations of the pilot study, the assessments of
discriminant and nomological validity are reserved until the main data is collected.
However, each type of validity is briefly defined here. Unidimensionality is the extent to
which indicators are associated with each other and represent a single concept (Hattie,
1985). Ideally, all the indicators should measure a single underlying latent concept.
Divergent validity is the degree to which a construct and its indicators differ from other
constructs and their indicators (Campbell and Fiske, 1959). In other words, each
construct should be significantly different from other constructs. Nomological validity,
sometimes referred to as predictive validity, is the extent to which constructs within one
109
framework relate to each other in a manner consistent with theory and/or prior research
(Ahire and Devaraj, 2001).
The most common method of assessing unidimensionality is to perform factor
analysis. Factor analysis can aid in determining if a single factor emerges from many
indicators. Several different guidelines will be used in determining the unidimensionality
of a construct.
• Scree plot – A scree plot will be performed for each construct; specifically, welook for the rugged elbow in the plot.
• Eigenvalues – If the factor is indeed unidimensional only a single eigenvalue willbe greater than one.
• Percent of variance explained (%VE) – The items should account for at least 40%of the variance in the factor.
• Factor loadings – All items should have a factor loading above 0.40.
• Communality – All items should exhibit high communality. There is no standardcut-off; researcher judgment is used.
Taken together, this set of five guidelines is a comprehensive test of the
unidimensionality of each factor.
Divergent validity is assessed using several different methods. First, average
inter-scale correlation (AVISC) of items not included in the factor is compared to the _ of
the factor itself. Divergent validity is established if this difference is substantially higher
than zero (Ahire and Devaraj, 2001). Second, the square root of the %VE of the scale is
compared to the AVISC. Again the difference should be substantially greater than zero
(Spreng and MacKoy, 1996; McDougal and Levesque, 2000; Petrick, 2002). Although
there is no statistical cut-off for either of these methods, values of 0.2 and 0.3 have been
used in the past (Ahire and Devaraj, 2001). Finally, using structural equation modeling,

110
we calculate a correlation coefficient between each pair of constructs within the study. If
the 95% confidence interval around the estimate does not contain 1.0, there is sufficient
justification that the two scales are distinct (McDougal and Levesque, 2000; Anderson
and Fornell, 2000; Bergozzi and Heatherton, 1994).
4.1.2. Main study
The methodology of the main study closely resembles that of the pilot study. In
fact, the exploratory data analysis and factor development procedures are identical to
those described in Section 4.1.1. However, the larger sample size of the main data
collection allows for the testing of the discriminant and nomological validities of the
constructs used in the research. Nomological validity is established if the two
hypothesized structural equation models are supported.
Our structural equation models are run using the RAMONA procedure embedded
within the SYSTAT 10.2 software. The structural equation analysis begins with an
investigation of all the standardized path coefficients within the two models. Each
individual path should not only be significant but also be in the direction theorized by the
service profit chain. A standard t-test procedure is conducted for each path.
Overall model fit is analyzed comprehensively using several different categories
of fit indices as suggested by Hu and Bentler (1998). This research uses three different
types of incremental fit measures as well as absolute measures. Absolute fit measures
directly assess how well an a priori model reproduces the sample data. Although no
reference model is used to assess the amount of increment in model fit, an implicit or
explicit comparison may be made to a saturated model that exactly reproduces the
111
observed covariance matrix, ie. a model that gives “perfect” fit. Incremental fit indices,
sometimes called comparative fit indices, measure the proportionate improvement in fit
by comparing a target model with a more restricted, nested baseline model. The most
commonly used baseline model is a null model in which all the observed variables are
allowed to have variances but are uncorrelated with each other (Bentler and Bonnet,
1980). Table 4.1 gives a summary of the fit indices employed - see Hu and Bentler
(1998) for a more detailed description of each measure. The table lists the fit index itself
along with the range of possible values, the first research to propose the index and the
suggested threshold of acceptable model fit.
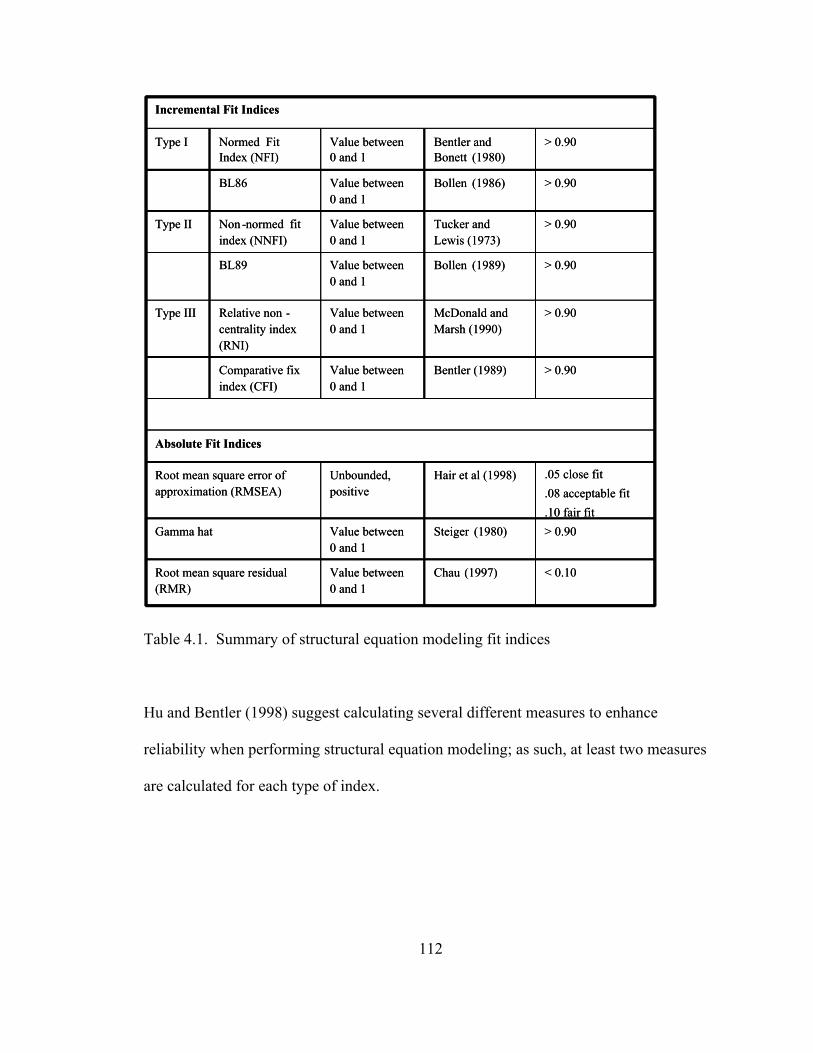
112
.05 close fit
.08 acceptable fit
.10 fair fit
Hair et al (1998)Unbounded, positive
Root mean square error of approximation (RMSEA)
> 0.90 Steiger (1980)Value between 0 and 1
Gamma hat
< 0.10Chau (1997)Value between 0 and 1
Root mean square residual (RMR)
Absolute Fit Indices
> 0.90 Bentler (1989)Value between 0 and 1
Comparative fix index (CFI)
> 0.90 McDonald and Marsh (1990)
Value between 0 and 1
Relative non -centrality index (RNI)
Type III
> 0.90 Bollen (1989)Value between 0 and 1
BL89
> 0.90 Tucker and Lewis (1973)
Value between 0 and 1
Non-normed fit index (NNFI)
Type II
> 0.90 Bollen (1986)Value between 0 and 1
BL86
> 0.90 Bentler and Bonett (1980)
Value between 0 and 1
Normed Fit Index (NFI)
Type I
Incremental Fit Indices
Table 4.1. Summary of structural equation modeling fit indices
Hu and Bentler (1998) suggest calculating several different measures to enhance
reliability when performing structural equation modeling; as such, at least two measures
are calculated for each type of index.
113
4.2. Population frame
This study works exclusively with one large retailer of women’s specialty apparel.
The retailer has over 1,000 stores located throughout the U.S. and is considered the
industry leader in its market. Selecting just one organization as the population for this
dissertation has several advantages. First, many of the links within the service profit
chain have been shown to be influenced heavily by contextual factors that this sampling
frame controls. For example, customer satisfaction and customer loyalty are significantly
influenced by industry (Lynch and Schuler, 1990; Fornell, 1992; Cronin and Taylor,
1992; de Ruyter et al, 1998), competition (Jones and Sasser, 1995; Fornell et al, 1996)
and switching costs (Fornell, 1992; Anderson and Fornell, 1994; Gremler and Brown,
1999; Sharma and Patterson, 2000). The link between external service quality and
customer satisfaction is also influenced by industry (Parasuraman et al, 1994; Zeithaml et
al, 1996; Mittal and Lasser, 1998) and switching costs (de Ruyter et al, 1998). Similar
findings occur on the employee portion of the service profit chain. The link between
employee satisfaction and employee loyalty is significantly impacted by industry (Van
Looy et al, 1998; Wong and Kanji, 2001), company size (Huselid, 1995) and unionization
(Huselid, 1995). All of these effects are partialled out with this work’s particular choice
of population frame.
A second advantage of working with one retail organization is the enhanced
ability to collect vast amounts of data. For the purposes of this study, it is necessary to
survey both employees and customers at each participating location. This step would
have been extremely difficult if a blind survey method was employed. Instead, we
obtained commitment from the management team of one retail chain. This division level
114
commitment was then filtered down to individual retail locations. The high response
rates and resulting large database sets are a direct product of the selection of population
frame. A final advantage is the extra control we had over the entire survey process. The
retail chain went to great lengths to ensure the integrity of the data collection process.
Corporate managers met with all the district managers involved to make sure everyone
completely understood the data collection requirements. The district managers then met
with individual store managers to ensure that proper guidelines were in place for
implementing the data collection process.
The selection of the population frame does not come without its drawbacks. First,
because of measurement issues within the retail corporation and numerous uncontrolled
for contextual effects (e.g. location, age of store, local competition), it will be impossible
to capture store performance with traditional “hard” measures such as profitability and
sales, thus, this research will not be able to include business performance variables. This
limitation is not devastating because of the high correlation between customer
satisfaction/loyalty measures and traditional accounting measures. This link is one of the
most validated in marketing literature, and there is no reason to believe it would behave
differently in this study than in previous studies (see section 3.3 for a review of this link).
Second, because the influence of brand image is so strong, it is impossible to tie together
the two halves of the service profit chain. In the specialty retail industry, customers’
brand loyalty far outweighs their store loyalty (Bloemer and Lemmick, 1992; Korte,
1995; Huber and Herrman, 2001). This factor makes it nearly impossible to link a
customer to a specific store; hence, impossible to tie them to employees of the same
store. In fact, over the last six months, over 60% of customers shopped at more than one
115
retail location. Complicating the matter even further, the retail chain also generates
extensive sales on-line as well as through a print catalogue – in fact, over the last six
months, 23% of the organization’s customers made a purchase through the catalogue and
19% made a purchase on-line. A customer’s image of the retail organization will be
formed by all three outlets, not just one particular retail location. The only way around
these effects would be to survey employees and customers immediately after an in-depth
service encounter, asking only specific questions about that particular encounter (Cronin
and Taylor, 1992; Storbacka et al, 1998). This method is not a consideration in this
research study because many of the variables in the study are based on perceptions that
have been built up over time (e.g. satisfaction, loyalty) and are not the direct result of a
single service encounter (Oliver, 1989; Yi, 1990; Woodruff et al, 1993; Spreng and
MacKoy, 1996).
4.2.1. Sampling plan – pilot study
Five retail locations in the Cincinnati (OH) and Dayton (OH) areas were selected
for the pilot study. The research team administered the study on site at each of the
locations. Approximately three to four hours were spent at each of the five sites. The
four page employee surveys were given to the store managers who then distributed them
to all employees who had been employed by the organization for at least three months.
To facilitate accurate responses, anonymity was guaranteed to all employees. Employees
were instructed to fill out the surveys during working hours over the next seven days.
Responses were sealed in confidential envelopes and returned to managers. In total, 50
of the 65 eligible employees returned usable surveys – a response rate of 77%.
116
The research team approached shoppers as they exited the store in the traditional
exit interview manner. Every shopper was approached. Due to the lengthy nature of the
survey (three pages) it was impossible to elicit verbal responses on site. Instead, the
survey was designed to be taken home. The research team told each shopper the purpose
of the study and asked if they would be willing to participate. Completed surveys were
sent back to the research team in self-addressed pre-stamped envelopes. In order to
achieve an adequate response rate, shoppers who filled out and returned surveys were
entered into a drawing to win a $50 gift certificate. Fifty surveys were given at each of
the five locations. Sixty-two of the 250 surveys were returned, yielding a response rate
of 25%.
4.1.2. Sampling plan – main study
Ten districts were chosen at random to participate in the main study. The ten
districts, including ninety stores in total, spanned the entire United States. A listing of the
ninety stores is given in Appendix K. Each store was sent a packet of materials. The
following items were included in each packet: twenty employee surveys, fifty customer
surveys and an instruction sheet for the manager. The packets were distributed in early
April. The process of surveying employees was identical to the process used in the pilot
study. In total, 872 of the 1,350 eligible employees returned usable surveys – a response
rate of 65%. It was impossible for the research team to go to all ninety stores to
distribute surveys to customers. Instead, store management was responsible for handing
out the surveys, fifty at each store. With this single exception, the main study process
117
was again identical to the pilot study process. In total, 1,076 of the 4,500 surveys were
returned usable, yielding a response rate of 24%.
4.3. Survey development
This study uses two research instruments. The first is a survey designed to obtain
employee responses about the internal working environment of their retail location. The
second is a survey intended to elicit customer responses to their shopping experiences.
The development of each of the two surveys follows the same iterative approach.
When possible, items for each construct are generated from past empirical research (see
Chapters 2 and 3 for specifics for each construct). When items could not be identified,
questions are generated from the multitude of anecdotes and case-studies for each of the
constructs. After this stage, the proposed questions are reviewed by an academic
committee as well as by the corporate and division level managers of the retail chain.
Items are then reworded, added and deleted as necessary.
The two surveys are then used as part of the pilot study. Using the methodology
described in Section 4.1.1 the surveys are refined where needed. Section 4.4.1 details the
results of the pilot data analysis. To avoid excessive replication, only constructs that need
to be modified are discussed in Section 4.4.1. However, all constructs will be discussed
in detail when reviewing with the main survey results in Section 4.4.2. Appendix J
provides a copy of the final survey instrument.
118
4.4. Measurement model
This section details the results of the measurement model (that is, factor
development), for both the pilot survey data and the main survey data. It deals
exclusively with all the first order factors. Second order factors are tested through the
structural equation models.
4.4.1. Pilot study factor development
As indicated earlier, this section will treat in detail only the factors that need to be
modified. All other factors will only be summarized in this chapter; they will be explored
more thoroughly in section 4.4.2. The first factor that needed modification is the
employee empowerment factor. The pilot study instrument asked five questions in order
to assess the degree of empowerment of the retail store employees. Table 4.2 illustrates
the results of the factor development. The initial reliability analysis results in a Cronbach
alpha value of 0.672, which is only slightly less than the suggested 0.70 cut-off.
However, when individual CITC values were analyzed, item E4 clearly does not correlate
highly with the other four empowerment questions. The CITC value of .115 and the
squared multiple correlation value of .029 seem to indicate that this question is indeed
substantially different from the other four. The “alpha if deleted” value, shows that the
overall factor reliability can be increased to 0.746 if item E4 is dropped. Furthermore,
when subjected to maximum likelihood factor analysis, question E4 clearly loads onto a
separate secondary factor. It is interesting to note that question E4 is a reverse coded
item. A “good score” on this item is indicated by a response of “1”, all other items are
worded so a “good score” is indicated by responding with “7”. In their studies of service
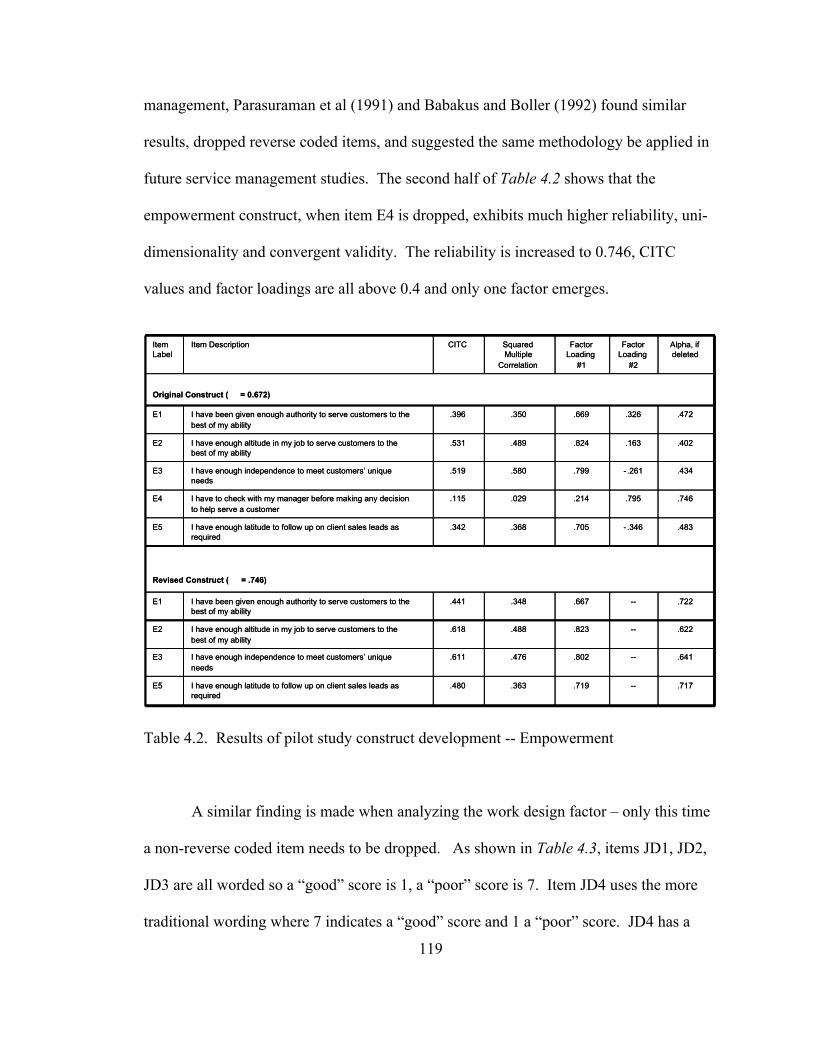
119
management, Parasuraman et al (1991) and Babakus and Boller (1992) found similar
results, dropped reverse coded items, and suggested the same methodology be applied in
future service management studies. The second half of Table 4.2 shows that the
empowerment construct, when item E4 is dropped, exhibits much higher reliability, uni-
dimensionality and convergent validity. The reliability is increased to 0.746, CITC
values and factor loadings are all above 0.4 and only one factor emerges.
E5
E3
E2
E1
Revised Construct (
?
= .746)
E5
E4
E3
E2
E1
Original Construct (
?
= 0.672)
Item Label
.717--.719.363.480I have enough latitude to follow up on client sales leads as required
.641--.802.476.611I have enough independence to meet customers’ unique needs
.622--.823.488.618I have enough altitude in my job to serve customers to the best of my ability
.722--.667.348.441I have been given enough authority to serve customers to the best of my ability
.483- .346.705.368.342I have enough latitude to follow up on client sales leads as required
.746.795.214.029.115I have to check with my manager before making any decision to help serve a customer
.434- .261.799.580.519I have enough independence to meet customers’ unique needs
.402.163.824.489.531I have enough altitude in my job to serve customers to the best of my ability
.472.326.669.350.396I have been given enough authority to serve customers to the best of my ability
Alpha, if deleted
Factor Loading
#2
Factor Loading
#1
Squared Multiple
Correlation
CITCItem Description
E5
E3
E2
E1
Revised Construct (
?
= .746)
E5
E4
E3
E2
E1
Original Construct (
?
= 0.672)
Item Label
.717--.719.363.480I have enough latitude to follow up on client sales leads as required
.641--.802.476.611I have enough independence to meet customers’ unique needs
.622--.823.488.618I have enough altitude in my job to serve customers to the best of my ability
.722--.667.348.441I have been given enough authority to serve customers to the best of my ability
.483- .346.705.368.342I have enough latitude to follow up on client sales leads as required
.746.795.214.029.115I have to check with my manager before making any decision to help serve a customer
.434- .261.799.580.519I have enough independence to meet customers’ unique needs
.402.163.824.489.531I have enough altitude in my job to serve customers to the best of my ability
.472.326.669.350.396I have been given enough authority to serve customers to the best of my ability
Alpha, if deleted
Factor Loading
#2
Factor Loading
#1
Squared Multiple
Correlation
CITCItem Description
Table 4.2. Results of pilot study construct development -- Empowerment
A similar finding is made when analyzing the work design factor – only this time
a non-reverse coded item needs to be dropped. As shown in Table 4.3, items JD1, JD2,
JD3 are all worded so a “good” score is 1, a “poor” score is 7. Item JD4 uses the more
traditional wording where 7 indicates a “good” score and 1 a “poor” score. JD4 has a
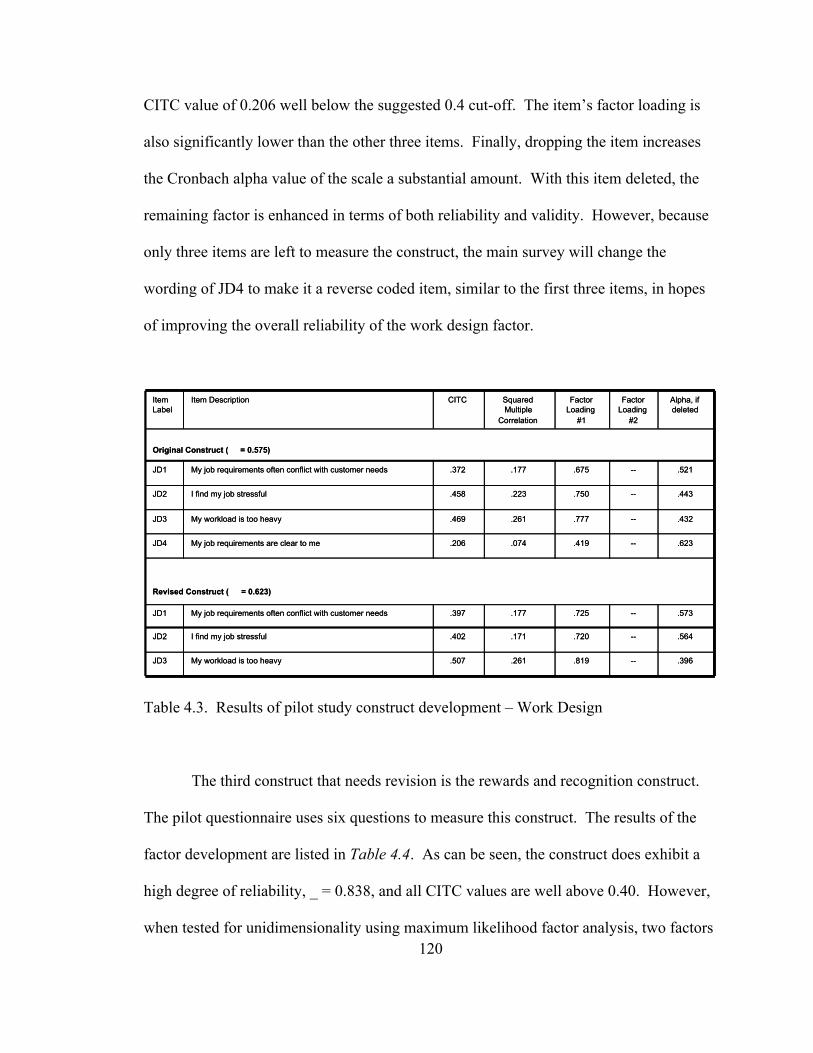
120
CITC value of 0.206 well below the suggested 0.4 cut-off. The item’s factor loading is
also significantly lower than the other three items. Finally, dropping the item increases
the Cronbach alpha value of the scale a substantial amount. With this item deleted, the
remaining factor is enhanced in terms of both reliability and validity. However, because
only three items are left to measure the construct, the main survey will change the
wording of JD4 to make it a reverse coded item, similar to the first three items, in hopes
of improving the overall reliability of the work design factor.
JD3
JD2
JD1
Revised Construct (
?
= 0.623)
JD4
JD3
JD2
JD1
Original Construct (
?
= 0.575)
Item Label
.396--.819.261.507My workload is too heavy
.564--.720.171.402I find my job stressful
.573--.725.177.397My job requirements often conflict with customer needs
.623--.419.074.206My job requirements are clear to me
.432--.777.261.469My workload is too heavy
.443--.750.223.458I find my job stressful
.521--.675.177.372My job requirements often conflict with customer needs
Alpha, if deleted
Factor Loading
#2
Factor Loading
#1
Squared Multiple
Correlation
CITCItem Description
JD3
JD2
JD1
Revised Construct (
?
= 0.623)
JD4
JD3
JD2
JD1
Original Construct (
?
= 0.575)
Item Label
.396--.819.261.507My workload is too heavy
.564--.720.171.402I find my job stressful
.573--.725.177.397My job requirements often conflict with customer needs
.623--.419.074.206My job requirements are clear to me
.432--.777.261.469My workload is too heavy
.443--.750.223.458I find my job stressful
.521--.675.177.372My job requirements often conflict with customer needs
Alpha, if deleted
Factor Loading
#2
Factor Loading
#1
Squared Multiple
Correlation
CITCItem Description
Table 4.3. Results of pilot study construct development – Work Design
The third construct that needs revision is the rewards and recognition construct.
The pilot questionnaire uses six questions to measure this construct. The results of the
factor development are listed in Table 4.4. As can be seen, the construct does exhibit a
high degree of reliability, _ = 0.838, and all CITC values are well above 0.40. However,
when tested for unidimensionality using maximum likelihood factor analysis, two factors
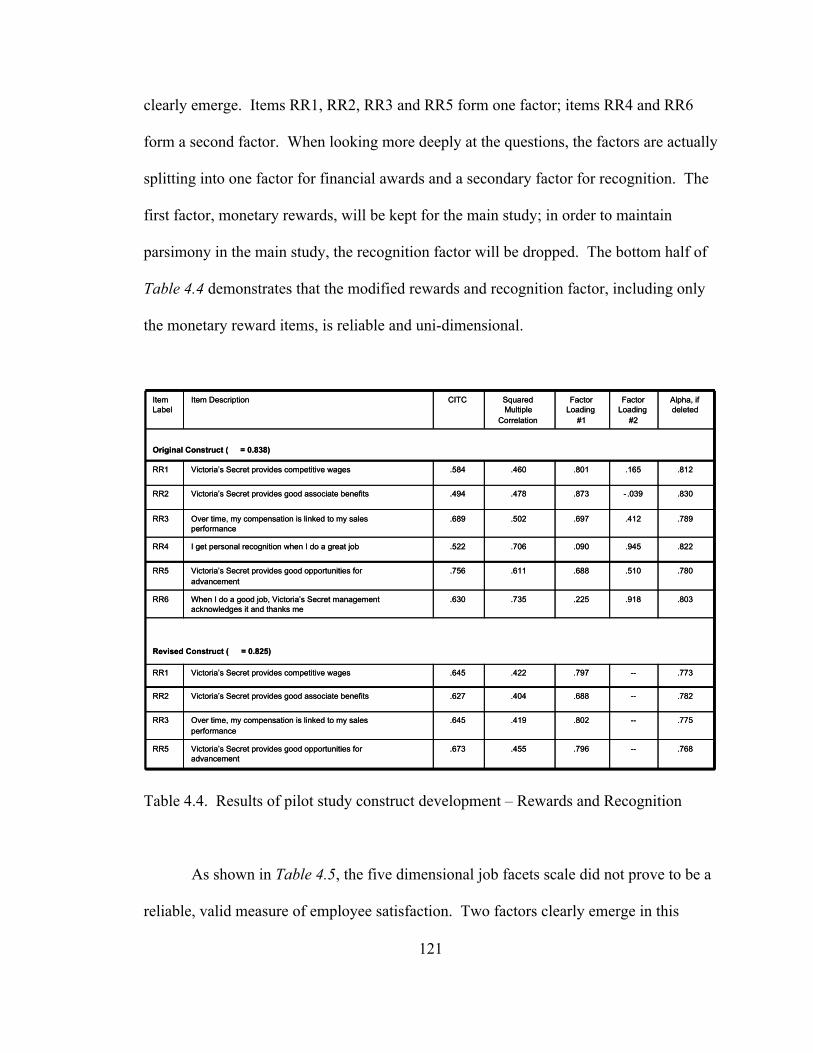
121
clearly emerge. Items RR1, RR2, RR3 and RR5 form one factor; items RR4 and RR6
form a second factor. When looking more deeply at the questions, the factors are actually
splitting into one factor for financial awards and a secondary factor for recognition. The
first factor, monetary rewards, will be kept for the main study; in order to maintain
parsimony in the main study, the recognition factor will be dropped. The bottom half of
Table 4.4 demonstrates that the modified rewards and recognition factor, including only
the monetary reward items, is reliable and uni-dimensional.
.830- .039.873.478.494Victoria’s Secret provides good associate benefitsRR2
RR5
RR3
RR2
RR1
Revised Construct (
?
= 0.825)
RR6
RR5
RR4
RR3
RR1
Original Construct (
?
= 0.838)
Item Label
.768--.796.455.673Victoria’s Secret provides good opportunities for advancement
.775--.802.419.645Over time, my compensation is linked to my sales performance
.782--.688.404.627Victoria’s Secret provides good associate benefits
.773--.797.422.645Victoria’s Secret provides competitive wages
.803.918.225.735.630When I do a good job, Victoria’s Secret management acknowledges it and thanks me
.780.510.688.611.756Victoria’s Secret provides good opportunities for advancement
.822.945.090.706.522I get personal recognition when I do a great job
.789.412.697.502.689Over time, my compensation is linked to my sales performance
.812.165.801.460.584Victoria’s Secret provides competitive wages
Alpha, if deleted
Factor Loading
#2
Factor Loading
#1
Squared Multiple
Correlation
CITCItem Description
Table 4.4. Results of pilot study construct development – Rewards and Recognition
As shown in Table 4.5, the five dimensional job facets scale did not prove to be a
reliable, valid measure of employee satisfaction. Two factors clearly emerge in this
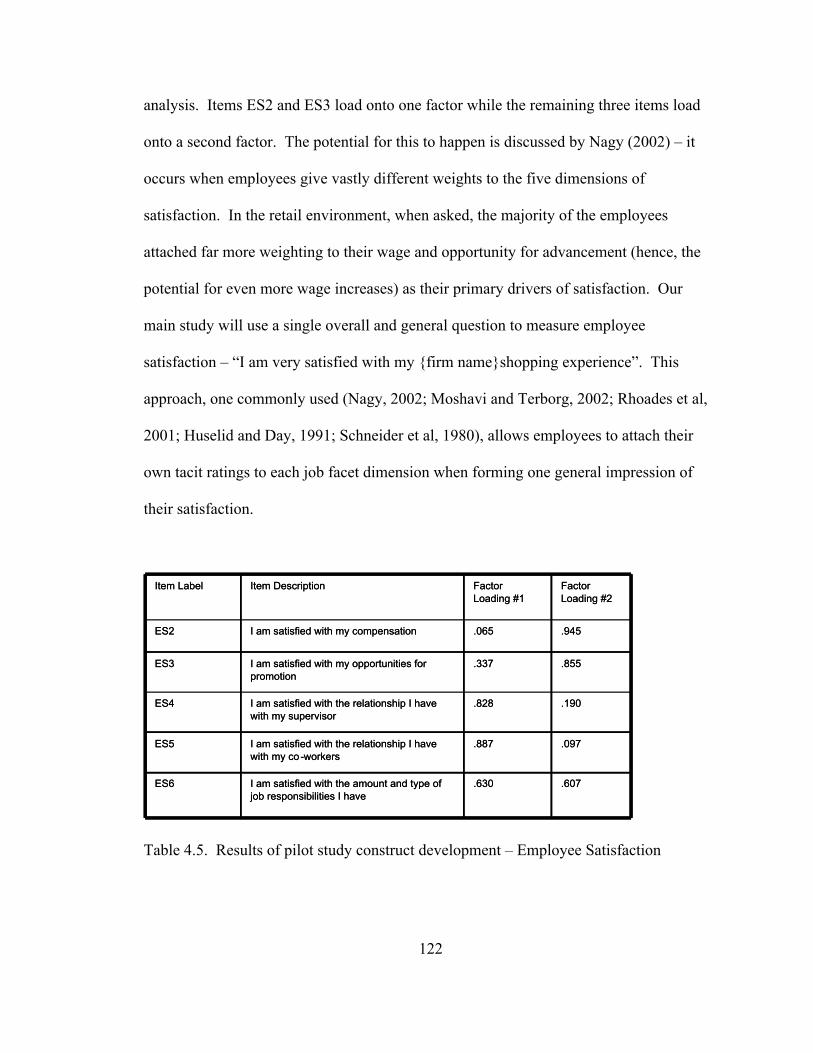
122
analysis. Items ES2 and ES3 load onto one factor while the remaining three items load
onto a second factor. The potential for this to happen is discussed by Nagy (2002) – it
occurs when employees give vastly different weights to the five dimensions of
satisfaction. In the retail environment, when asked, the majority of the employees
attached far more weighting to their wage and opportunity for advancement (hence, the
potential for even more wage increases) as their primary drivers of satisfaction. Our
main study will use a single overall and general question to measure employee
satisfaction – “I am very satisfied with my {firm name}shopping experience”. This
approach, one commonly used (Nagy, 2002; Moshavi and Terborg, 2002; Rhoades et al,
2001; Huselid and Day, 1991; Schneider et al, 1980), allows employees to attach their
own tacit ratings to each job facet dimension when forming one general impression of
their satisfaction.
.607.630I am satisfied with the amount and type of job responsibilities I have
ES6
.097.887I am satisfied with the relationship I have with my co-workers
ES5
.190.828I am satisfied with the relationship I have with my supervisor
ES4
.855.337I am satisfied with my opportunities for promotion
ES3
.945.065I am satisfied with my compensationES2
Factor Loading #2
Factor Loading #1
Item DescriptionItem Label
Table 4.5. Results of pilot study construct development – Employee Satisfaction
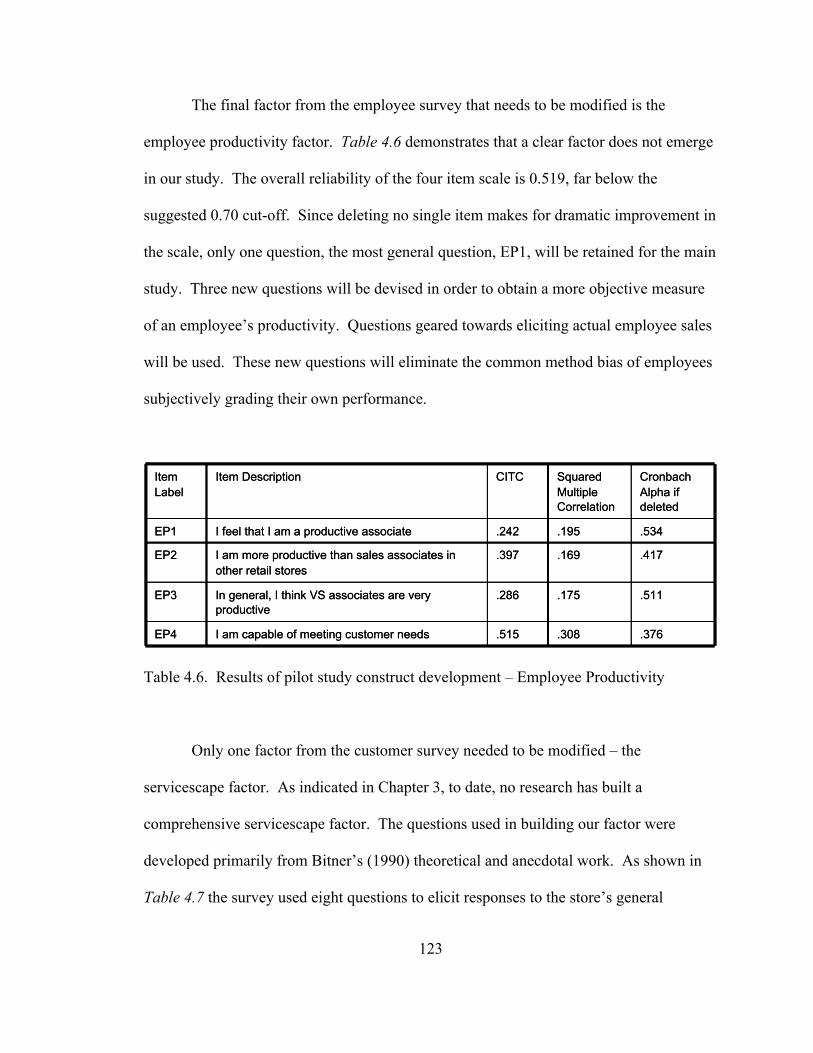
123
The final factor from the employee survey that needs to be modified is the
employee productivity factor. Table 4.6 demonstrates that a clear factor does not emerge
in our study. The overall reliability of the four item scale is 0.519, far below the
suggested 0.70 cut-off. Since deleting no single item makes for dramatic improvement in
the scale, only one question, the most general question, EP1, will be retained for the main
study. Three new questions will be devised in order to obtain a more objective measure
of an employee’s productivity. Questions geared towards eliciting actual employee sales
will be used. These new questions will eliminate the common method bias of employees
subjectively grading their own performance.
.376.308.515I am capable of meeting customer needsEP4
.511.175.286In general, I think VS associates are very productive
EP3
.417.169.397I am more productive than sales associates in other retail stores
EP2
.534.195.242I feel that I am a productive associateEP1
CronbachAlpha if deleted
Squared Multiple Correlation
CITCItem DescriptionItem Label
Table 4.6. Results of pilot study construct development – Employee Productivity
Only one factor from the customer survey needed to be modified – the
servicescape factor. As indicated in Chapter 3, to date, no research has built a
comprehensive servicescape factor. The questions used in building our factor were
developed primarily from Bitner’s (1990) theoretical and anecdotal work. As shown in
Table 4.7 the survey used eight questions to elicit responses to the store’s general
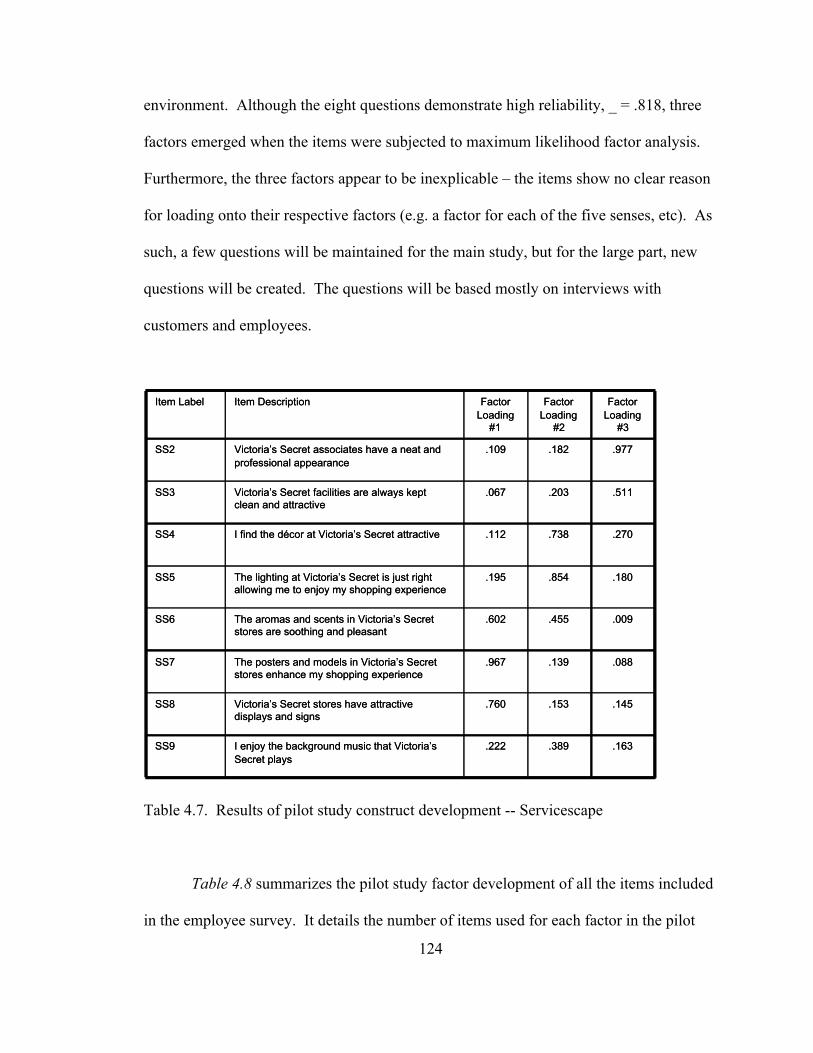
124
environment. Although the eight questions demonstrate high reliability, _ = .818, three
factors emerged when the items were subjected to maximum likelihood factor analysis.
Furthermore, the three factors appear to be inexplicable – the items show no clear reason
for loading onto their respective factors (e.g. a factor for each of the five senses, etc). As
such, a few questions will be maintained for the main study, but for the large part, new
questions will be created. The questions will be based mostly on interviews with
customers and employees.
.163.389.222I enjoy the background music that Victoria’s Secret plays
SS9
.145.153.760Victoria’s Secret stores have attractive displays and signs
SS8
.088.139.967The posters and models in Victoria’s Secret stores enhance my shopping experience
SS7
.009.455.602The aromas and scents in Victoria’s Secret stores are soothing and pleasant
SS6
.180.854.195The lighting at Victoria’s Secret is just right allowing me to enjoy my shopping experience
SS5
.270.738.112I find the décor at Victoria’s Secret attractiveSS4
.511.203.067Victoria’s Secret facilities are always kept clean and attractive
SS3
.977.182.109Victoria’s Secret associates have a neat and professional appearance
SS2
Factor Loading
#3
Factor Loading
#2
Factor Loading
#1
Item DescriptionItem Label
Table 4.7. Results of pilot study construct development -- Servicescape
Table 4.8 summarizes the pilot study factor development of all the items included
in the employee survey. It details the number of items used for each factor in the pilot
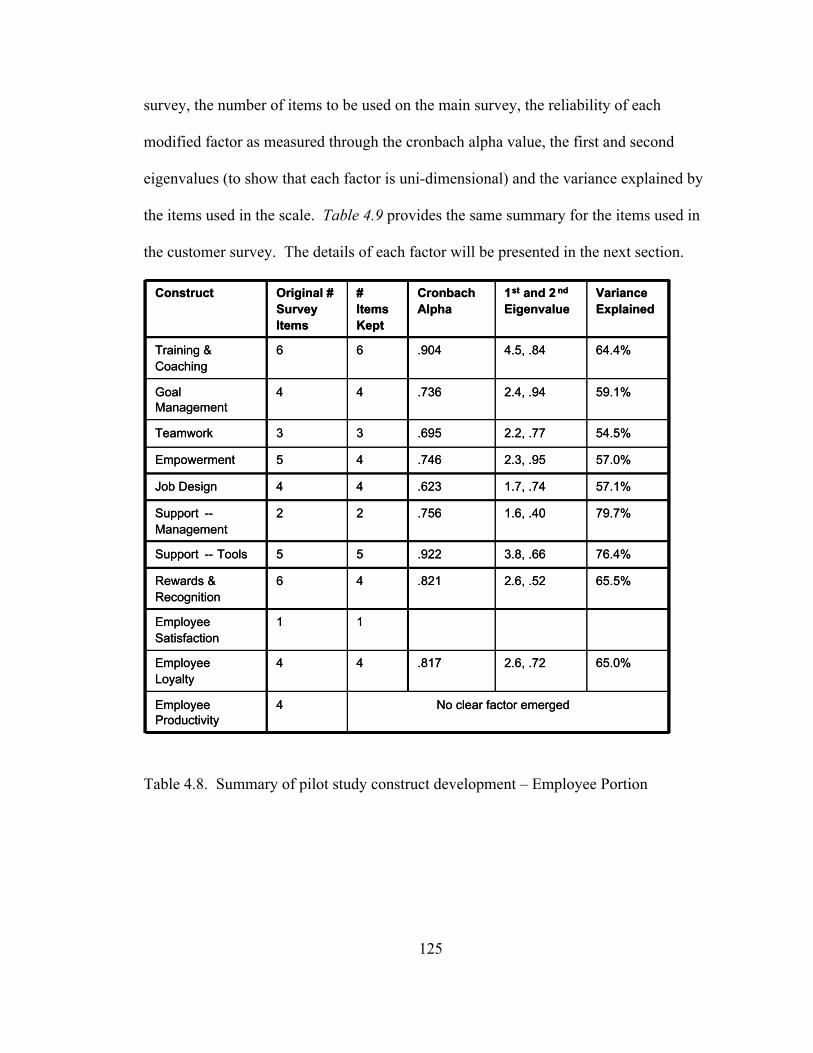
125
survey, the number of items to be used on the main survey, the reliability of each
modified factor as measured through the cronbach alpha value, the first and second
eigenvalues (to show that each factor is uni-dimensional) and the variance explained by
the items used in the scale. Table 4.9 provides the same summary for the items used in
the customer survey. The details of each factor will be presented in the next section.
No clear factor emerged4Employee Productivity
65.0%2.6, .72.81744Employee Loyalty
11Employee Satisfaction
65.5%2.6, .52.82146Rewards & Recognition
76.4%3.8, .66.92255Support -- Tools
79.7%1.6, .40.75622Support --Management
57.1%1.7, .74.62344Job Design
57.0%2.3, .95.74645Empowerment
54.5%2.2, .77.69533Teamwork
59.1%2.4, .94.73644Goal Management
64.4%4.5, .84.90466Training & Coaching
Variance Explained
1st and 2 nd
EigenvalueCronbachAlpha
# Items Kept
Original # Survey Items
Construct
Table 4.8. Summary of pilot study construct development – Employee Portion
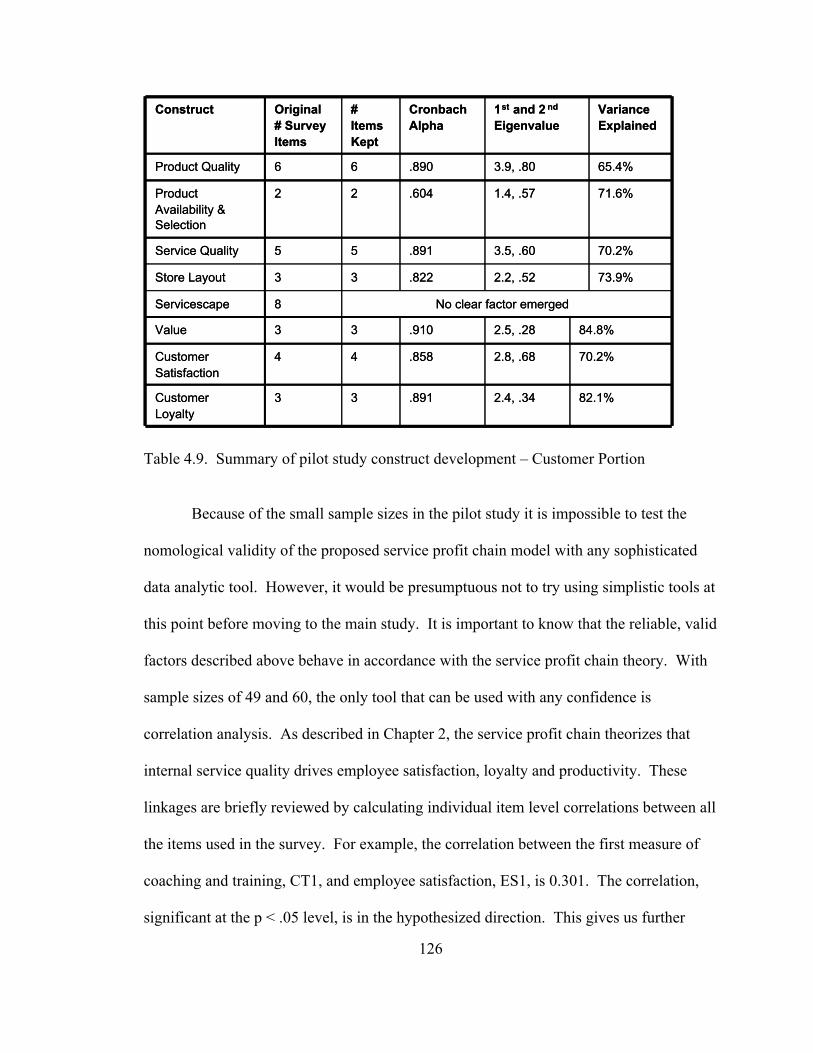
126
82.1%2.4, .34.89133Customer Loyalty
70.2%2.8, .68.85844Customer Satisfaction
84.8%2.5, .28.91033Value
No clear factor emerged8Servicescape
73.9%2.2, .52.82233Store Layout
70.2%3.5, .60.89155Service Quality
71.6%1.4, .57.60422Product Availability & Selection
65.4%3.9, .80.89066Product Quality
Variance Explained
1st and 2 nd
EigenvalueCronbachAlpha
# Items Kept
Original # Survey Items
Construct
Table 4.9. Summary of pilot study construct development – Customer Portion
Because of the small sample sizes in the pilot study it is impossible to test the
nomological validity of the proposed service profit chain model with any sophisticated
data analytic tool. However, it would be presumptuous not to try using simplistic tools at
this point before moving to the main study. It is important to know that the reliable, valid
factors described above behave in accordance with the service profit chain theory. With
sample sizes of 49 and 60, the only tool that can be used with any confidence is
correlation analysis. As described in Chapter 2, the service profit chain theorizes that
internal service quality drives employee satisfaction, loyalty and productivity. These
linkages are briefly reviewed by calculating individual item level correlations between all
the items used in the survey. For example, the correlation between the first measure of
coaching and training, CT1, and employee satisfaction, ES1, is 0.301. The correlation,
significant at the p < .05 level, is in the hypothesized direction. This gives us further
127
confidence not only in the service profit chain theory but also in the survey instrument.
Similar calculations are made for each pair of variables in the study; they are presented in
Table 4.10. To save space, correlations are averaged between factors. All individual
correlations are significant at the p<.05 level and in the expected directions, except for
the correlations between employee satisfaction and employee productivity, and employee
loyalty and employee productivity, where none of the correlations are significant. The
insignificant findings between these constructs may be the result of the items used to
measure employee productivity – as indicated earlier, the employee productivity factor
does not appear to be a strong one. This finding gives all the more justification to modify
the employee productivity items for the main study.
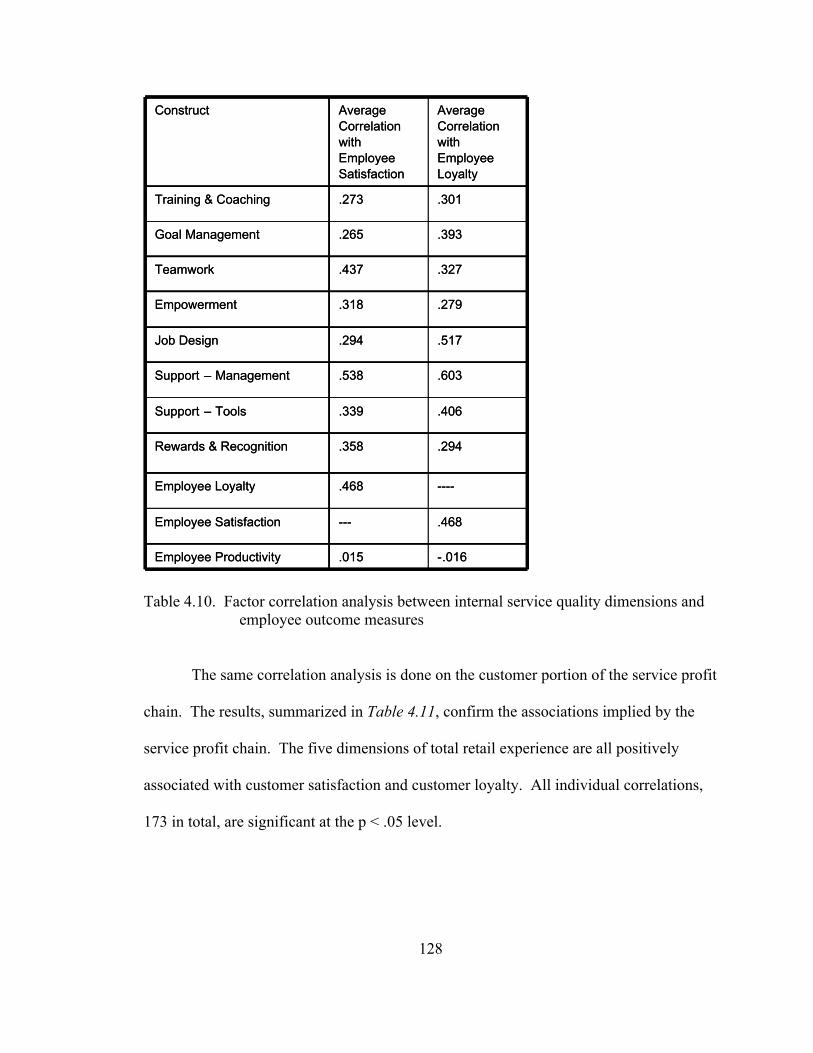
128
----.468Employee Loyalty
.468---Employee Satisfaction
.294.358Rewards & Recognition
-.016.015Employee Productivity
.406.339Support – Tools
.603.538Support – Management
.517.294Job Design
.279.318Empowerment
.327.437Teamwork
.393.265Goal Management
.301.273Training & Coaching
Average Correlation with Employee Loyalty
Average Correlation with Employee Satisfaction
Construct
Table 4.10. Factor correlation analysis between internal service quality dimensions andemployee outcome measures
The same correlation analysis is done on the customer portion of the service profit
chain. The results, summarized in Table 4.11, confirm the associations implied by the
service profit chain. The five dimensions of total retail experience are all positively
associated with customer satisfaction and customer loyalty. All individual correlations,
173 in total, are significant at the p < .05 level.
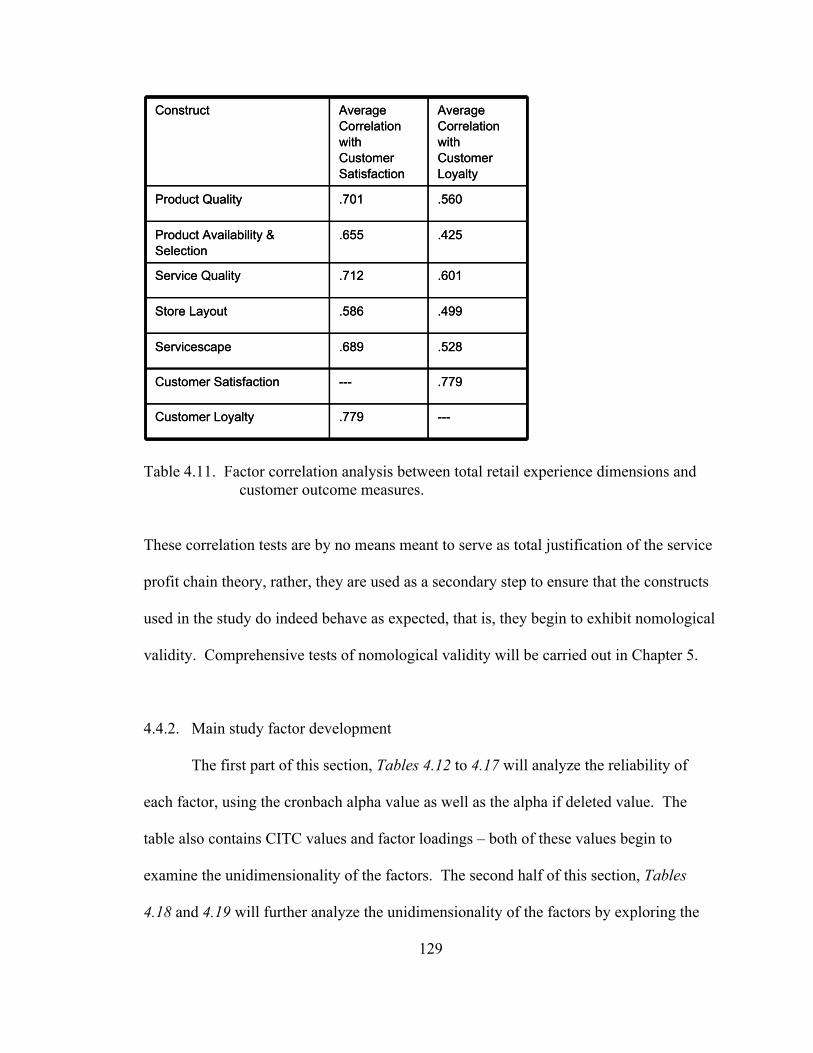
129
---.779Customer Loyalty
.779---Customer Satisfaction
.528.689Servicescape
.499.586Store Layout
.601.712Service Quality
.425.655Product Availability & Selection
.560.701Product Quality
Average Correlation with Customer Loyalty
Average Correlation with Customer Satisfaction
Construct
---.779Customer Loyalty
.779---Customer Satisfaction
.528.689Servicescape
.499.586Store Layout
.601.712Service Quality
.425.655Product Availability & Selection
.560.701Product Quality
Average Correlation with Customer Loyalty
Average Correlation with Customer Satisfaction
Construct
Table 4.11. Factor correlation analysis between total retail experience dimensions andcustomer outcome measures.
These correlation tests are by no means meant to serve as total justification of the service
profit chain theory, rather, they are used as a secondary step to ensure that the constructs
used in the study do indeed behave as expected, that is, they begin to exhibit nomological
validity. Comprehensive tests of nomological validity will be carried out in Chapter 5.
4.4.2. Main study factor development
The first part of this section, Tables 4.12 to 4.17 will analyze the reliability of
each factor, using the cronbach alpha value as well as the alpha if deleted value. The
table also contains CITC values and factor loadings – both of these values begin to
examine the unidimensionality of the factors. The second half of this section, Tables
4.18 and 4.19 will further analyze the unidimensionality of the factors by exploring the
130
first and second eigenvalues of each construct and the percent of variance explained
(%VE) by the items within a factor. The last three columns of Tables 4.18 and 4.19 will
explore the discriminant validity of the factors. As indicated earlier, the average inter-
scale correlation (AVISC) between items within one factor and the remaining items in the
study should be significantly different from 1.0. Another measure of divergent validity is
whether the cronbach alpha value minus the AVISC (_ - AVISC) is sufficiently greater
than 0.0. A final measure of discriminant validity is whether the percent of variance
explained by the items within a factor is sufficiently greater than the squared average
inter-scale correlation (%VE – AVISC2). There is no statistical test for the last two
methods, but values of 0.2 and 0.3 have been used in the past (Ahire and Devaraj, 2001).
As illustrated in Tables 4.12 through 4.14, the ten employee factors to be used in
the main study all appear to be highly reliable. In fact, the minimum cronbach alpha
value is 0.7979. Furthermore, each item within each scale has substantial CITC values
and factor loadings, all well above the suggested 0.40 cut-off. A special mention will be
made for those factors that needed to be revised after the pilot study. As indicated in the
pilot study, item JD4 had to be reverse-worded in order for it to be anchored at the same
end point as the other three work design questions. With this adjustment, the work
design scale achieved a reliability of 0.8426. Moreover, item JD4 itself had a CITC value
of 0.6405 and a factor loading of 0.796. Taken together these findings indicate that the
revision resulted in a much stronger work design factor than that presented in the pilot
study.
The pilot study suggested dropping item E4 from the employee survey. As the
results in Table 4.14 indicate, this revision results in an empowerment factor whose
131
reliability is 0.8685. Furthermore, the remaining four items all have the necessary CITC
values and factor loadings. Items RR4 and RR6, two tacit recognition questions, were
dropped from the rewards and recognition scale as suggested by the pilot study. The
resulting factor, made up of four reward oriented items, RR1, RR2, RR3 and RR5, is uni-
dimensional and highly reliable, _ = 0.8079.
Only one of the four items used to measure employee productivity in the pilot
survey was retained for the main survey, item EP1. Three new items were added, EP2,
EP3 and EP4. All three items were designed explicitly to capture objective productivity
measures, in this case measured by sales dollars generated. As demonstrated in Table
4.14, these four items combined to form a highly reliable and uni-dimensional scale.
Tables 4.15 through 4.17 show the results of the main factor development of the
customer survey items. Of the eight factors developed, only one, product availability and
selection, does not have a reliability that exceeds 0.70 – however its cronbach alpha value
is very close, _ = 0.6815. The construct will be used in this study; future researchers
could improve the reliability of the construct by adding additional questions to it – this
study used only two items, MS1 and MS2, to measure the factor. The CITC values and
the factor loadings of the two items both indicate that the factor is uni-dimensional.
A new servicescape factor is introduced in the main survey; the factor is measured
with seven items: SS2, SS3, SS5, SS6, SS7, SS8, SS10. These seven items form a
reliable scale, _ = 0.8770, and all individually meet the CITC and factor loading cut-offs.
In fact, all 33 items used in the customer portion of the main survey meet those respective
thresholds.
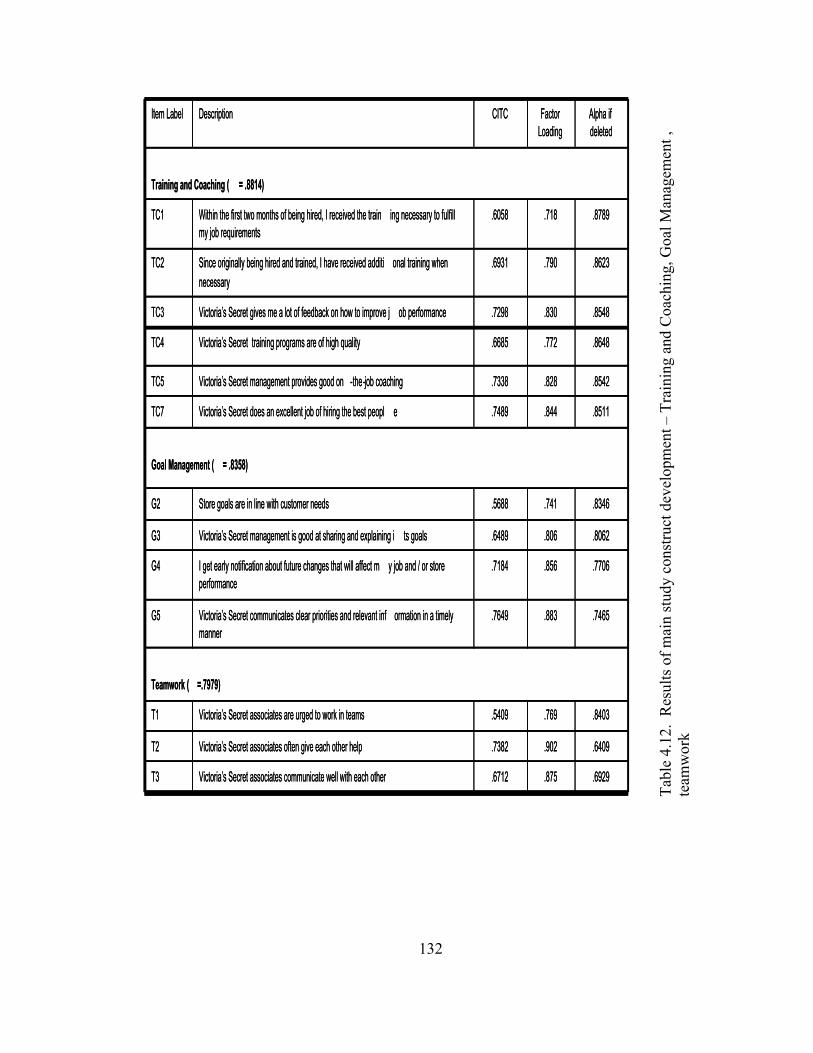
132
.6929.875.6712Victoria’s Secret associates communicate well with each otherT3
.6409.902.7382Victoria’s Secret associates often give each other helpT2
.8403.769.5409Victoria’s Secret associates are urged to work in teamsT1
Teamwork (
?
=.7979)
.7465.883.7649Victoria’s Secret communicates clear priorities and relevant inf ormation in a timely manner
G5
.7706.856.7184I get early notification about future changes that will affect m y job and / or store performance
G4
.8062.806.6489Victoria’s Secret management is good at sharing and explaining i ts goalsG3
.8346.741.5688Store goals are in line with customer needsG2
Goal Management (
?
= .8358)
.8511.844.7489Victoria’s Secret does an excellent job of hiring the best peopl eTC7
.8542.828.7338Victoria’s Secret management provides good on -the-job coachingTC5
.8648.772.6685Victoria’s Secret training programs are of high qualityTC4
.8548.830.7298Victoria’s Secret gives me a lot of feedback on how to improve j ob performanceTC3
.8623.790.6931Since originally being hired and trained, I have received additi onal training when necessary
TC2
.8789.718.6058Within the first two months of being hired, I received the train ing necessary to fulfill my job requirements
TC1
Training and Coaching (
?
= .8814)
Alpha if deleted
Factor Loading
CITCDescriptionItem Label
Tab
le 4
.12.
Res
ults
of
mai
n st
udy
cons
truc
t dev
elop
men
t – T
rain
ing
and
Coa
chin
g, G
oal M
anag
emen
t ,te
amw
ork
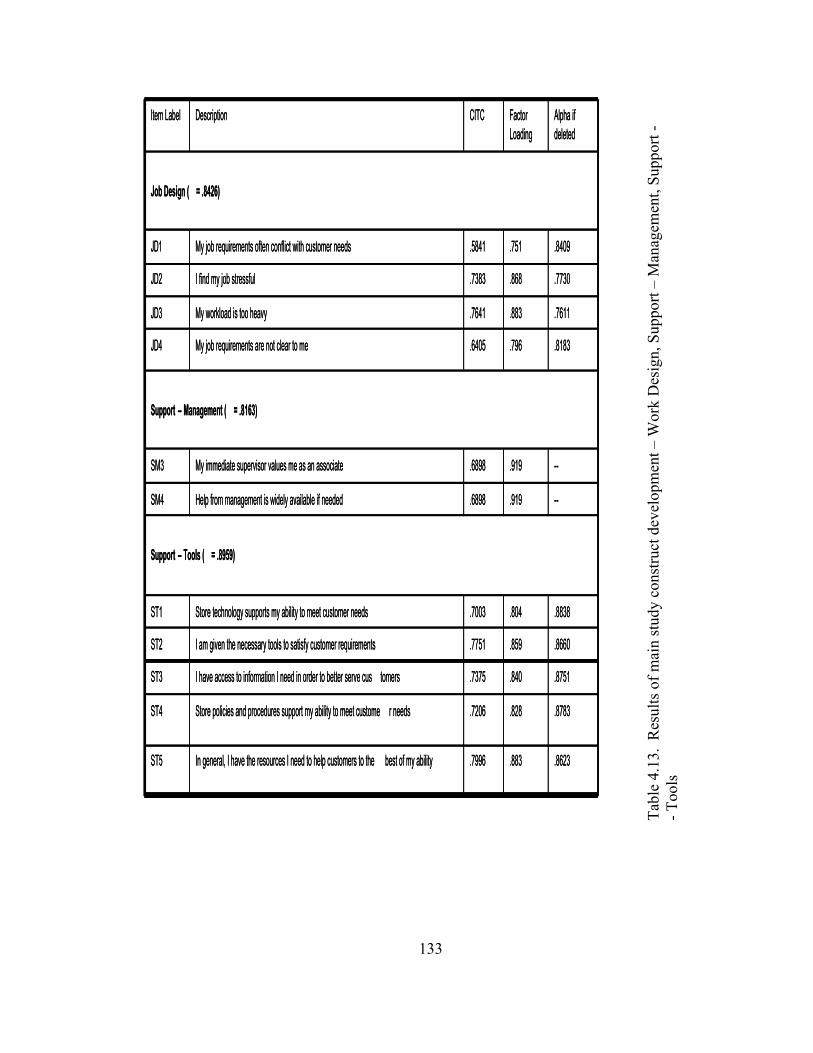
133
.8783.828.7206Store policies and procedures support my ability to meet custome r needsST4
.8623.883.7996In general, I have the resources I need to help customers to the best of my abilityST5
.8751.840.7375I have access to information I need in order to better serve cus tomersST3
.8660.859.7751I am given the necessary tools to satisfy customer requirementsST2
.8838.804.7003Store technology supports my ability to meet customer needsST1
Support – Tools (
?
= .8959)
--.919.6898Help from management is widely available if neededSM4
--.919.6898My immediate supervisor values me as an associateSM3
Support – Management (
?
= .8163)
.8183.796.6405My job requirements are not clear to meJD4
.7611.883.7641My workload is too heavyJD3
.7730.868.7383I find my job stressfulJD2
.8409.751.5841My job requirements often conflict with customer needsJD1
Job Design (
?
= .8426)
Alpha if deleted
Factor Loading
CITCDescriptionItem Label
Tab
le 4
.13.
Res
ults
of
mai
n st
udy
cons
truc
t dev
elop
men
t – W
ork
Des
ign,
Sup
port
– M
anag
emen
t, Su
ppor
t --
Too
ls
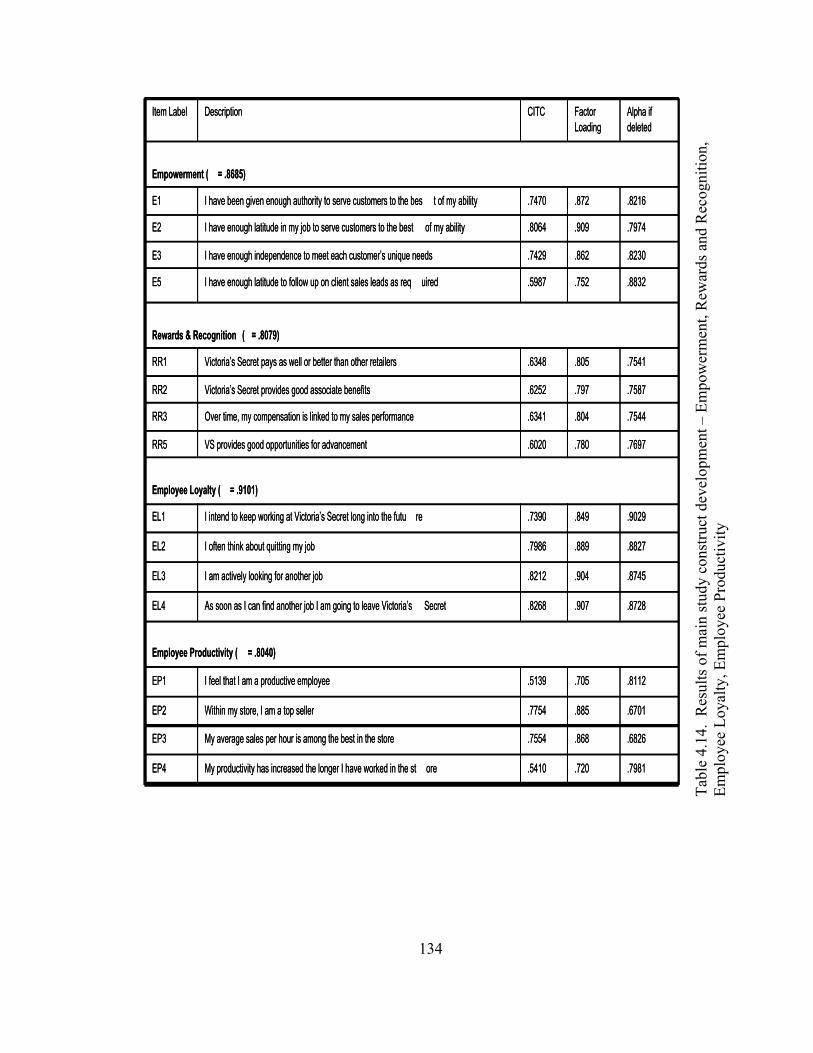
134
Employee Productivity (
?
= .8040)
.8112.705.5139I feel that I am a productive employeeEP1
.6701.885.7754Within my store, I am a top sellerEP2
.6826.868.7554My average sales per hour is among the best in the storeEP3
.8728.907.8268As soon as I can find another job I am going to leave Victoria’s SecretEL4
.7981.720.5410My productivity has increased the longer I have worked in the st oreEP4
.8745.904.8212I am actively looking for another jobEL3
.9029.849.7390I intend to keep working at Victoria’s Secret long into the futu reEL1
.8827.889.7986I often think about quitting my jobEL2
Employee Loyalty (
?
= .9101)
.7697.780.6020VS provides good opportunities for advancementRR5
.7544.804.6341Over time, my compensation is linked to my sales performanceRR3
.7587.797.6252Victoria’s Secret provides good associate benefitsRR2
.7541.805.6348Victoria’s Secret pays as well or better than other retailersRR1
Rewards & Recognition (
?
= .8079)
.8832.752.5987I have enough latitude to follow up on client sales leads as req uiredE5
.8230.862.7429I have enough independence to meet each customer’s unique needsE3
.7974.909.8064I have enough latitude in my job to serve customers to the best of my abilityE2
.8216.872.7470I have been given enough authority to serve customers to the bes t of my abilityE1
Empowerment (
?
= .8685)
Alpha if deleted
Factor Loading
CITCDescriptionItem Label
Tab
le 4
.14.
Res
ults
of
mai
n st
udy
cons
truc
t dev
elop
men
t – E
mpo
wer
men
t, R
ewar
ds a
nd R
ecog
nitio
n,E
mpl
oyee
Loy
alty
, Em
ploy
ee P
rodu
ctiv
ity
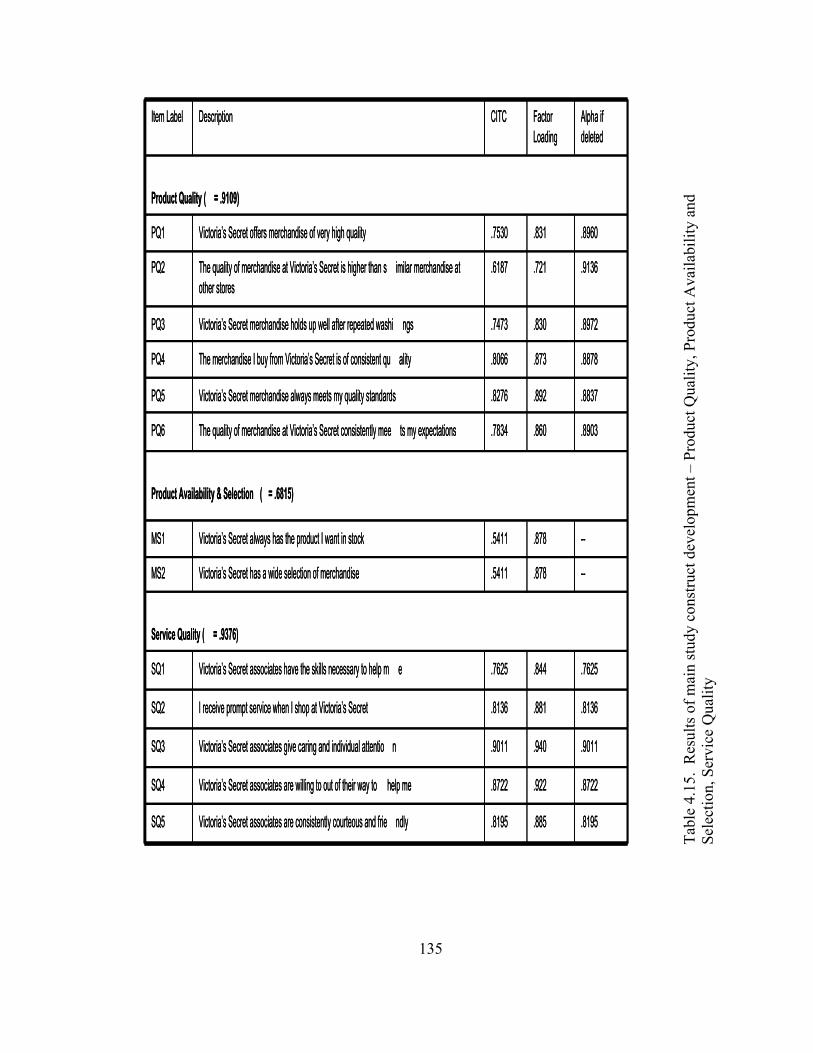
135
.8722.922.8722Victoria’s Secret associates are willing to out of their way to help meSQ4
.9136.721.6187The quality of merchandise at Victoria’s Secret is higher than s imilar merchandise at other stores
PQ2
.8837.892.8276Victoria’s Secret merchandise always meets my quality standardsPQ5
.9011.940.9011Victoria’s Secret associates give caring and individual attentio nSQ3
.7625.844.7625Victoria’s Secret associates have the skills necessary to help m eSQ1
.8136.881.8136I receive prompt service when I shop at Victoria’s SecretSQ2
.8195.885.8195Victoria’s Secret associates are consistently courteous and frie ndlySQ5
Service Quality (
?
= .9376)
--.878.5411Victoria’s Secret has a wide selection of merchandiseMS2
--.878.5411Victoria’s Secret always has the product I want in stockMS1
Product Availability & Selection (
?
= .6815)
.8903.860.7834The quality of merchandise at Victoria’s Secret consistently mee ts my expectationsPQ6
.8878.873.8066The merchandise I buy from Victoria’s Secret is of consistent qu alityPQ4
.8972.830.7473Victoria’s Secret merchandise holds up well after repeated washi ngsPQ3
.8960.831.7530Victoria’s Secret offers merchandise of very high qualityPQ1
Product Quality (
?
= .9109)
Alpha if deleted
Factor Loading
CITCDescriptionItem Label
Tab
le 4
.15.
Res
ults
of
mai
n st
udy
cons
truc
t dev
elop
men
t – P
rodu
ct Q
ualit
y, P
rodu
ct A
vaila
bilit
y an
dSe
lect
ion,
Ser
vice
Qua
lity
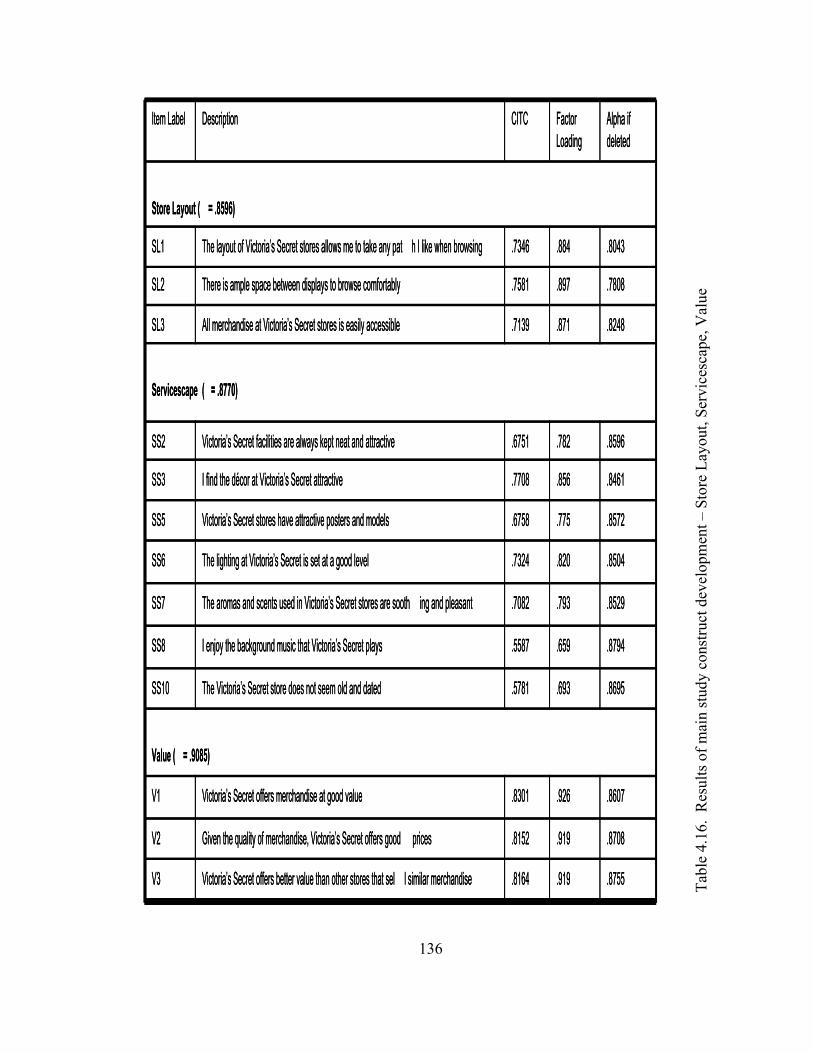
136
Value (
?
= .9085)
.8607.926.8301Victoria’s Secret offers merchandise at good valueV1
.8708.919.8152Given the quality of merchandise, Victoria’s Secret offers good pricesV2
.8695.693.5781The Victoria’s Secret store does not seem old and datedSS10
.8794.659.5587I enjoy the background music that Victoria’s Secret playsSS8
.7808.897.7581There is ample space between displays to browse comfortablySL2
.8529.793.7082The aromas and scents used in Victoria’s Secret stores are sooth ing and pleasantSS7
.8572.775.6758Victoria’s Secret stores have attractive posters and modelsSS5
.8504.820.7324The lighting at Victoria’s Secret is set at a good levelSS6
.8755.919.8164Victoria’s Secret offers better value than other stores that sel l similar merchandiseV3
.8461.856.7708I find the décor at Victoria’s Secret attractiveSS3
.8596.782.6751Victoria’s Secret facilities are always kept neat and attractiveSS2
Servicescape (
?
= .8770)
.8248.871.7139All merchandise at Victoria’s Secret stores is easily accessibleSL3
.8043.884.7346The layout of Victoria’s Secret stores allows me to take any pat h I like when browsingSL1
Store Layout (
?
= .8596)
Alpha if deleted
Factor Loading
CITCDescriptionItem Label
Tab
le 4
.16.
Res
ults
of
mai
n st
udy
cons
truc
t dev
elop
men
t – S
tore
Lay
out,
Serv
ices
cape
, Val
ue
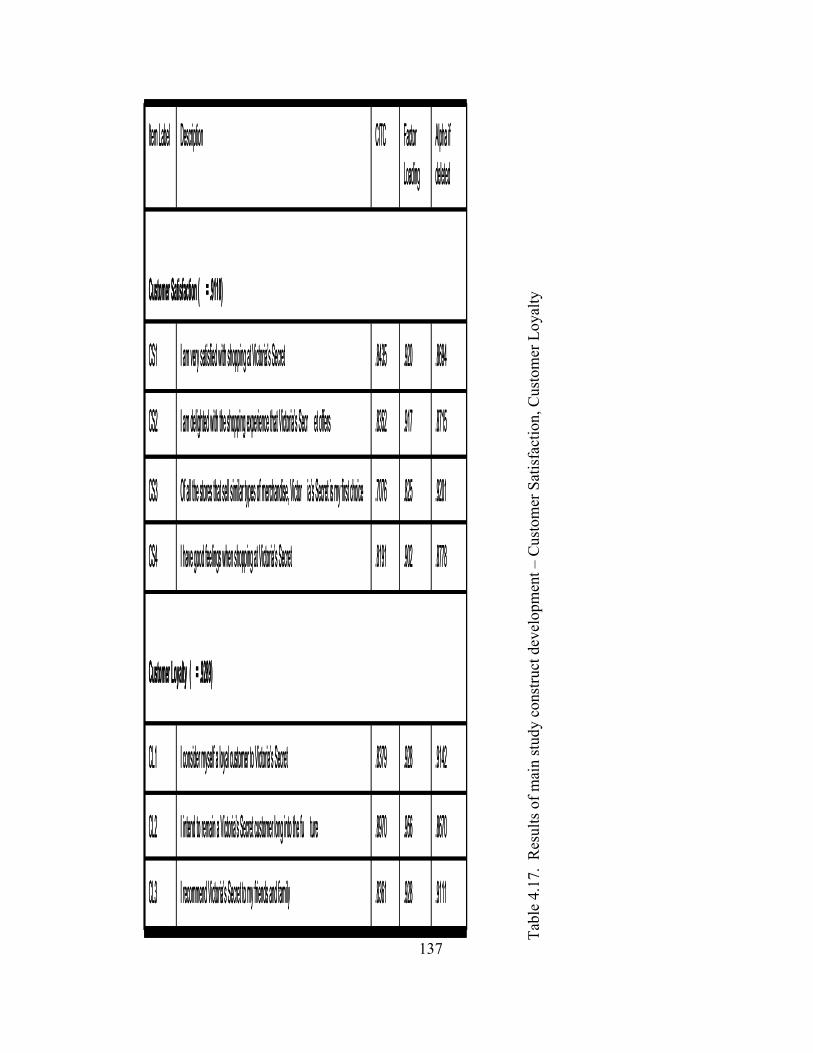
137
.9201.825.7076Of all the stores that sell similar types of merchandise, Victor ia’s Secret is my first choiceCS3
.8715.917.8352I am delighted with the shopping experience that Victoria’s Secr et offersCS2
.9111.928.8361I recommend Victoria’s Secret to my friends and familyCL3
.8670.956.8970I intend to remain a Victoria’s Secret customer long into the fu tureCL2
.9142.928.8379I consider myself a loyal customer to Victoria’s SecretCL1
Customer Loyalty (
?
= .9289)
.8778.902.8191I have good feelings when shopping at Victoria’s SecretCS4
.8694.920.8435I am very satisfied with shopping at Victoria’s SecretCS1
Customer Satisfaction (
?
= .9110)
Alpha if deleted
Factor Loading
CITCDescriptionItem Label
Tab
le 4
.17.
Res
ults
of
mai
n st
udy
cons
truc
t dev
elop
men
t – C
usto
mer
Sat
isfa
ctio
n, C
usto
mer
Loy
alty
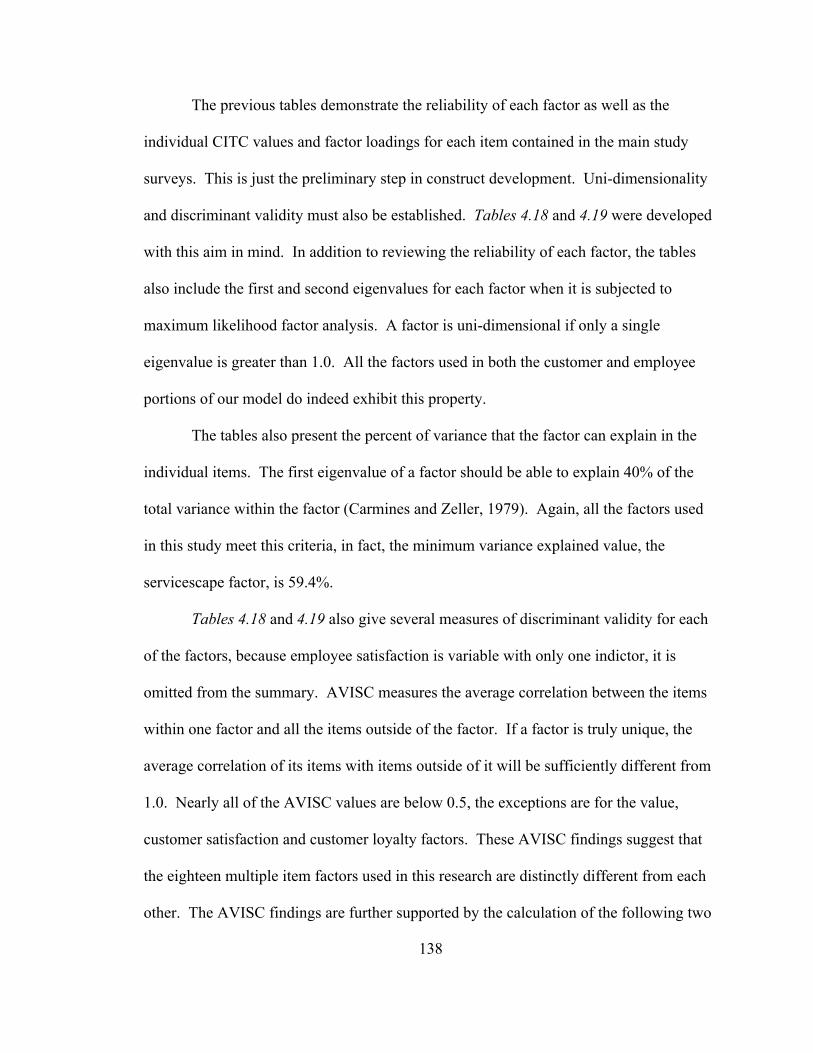
138
The previous tables demonstrate the reliability of each factor as well as the
individual CITC values and factor loadings for each item contained in the main study
surveys. This is just the preliminary step in construct development. Uni-dimensionality
and discriminant validity must also be established. Tables 4.18 and 4.19 were developed
with this aim in mind. In addition to reviewing the reliability of each factor, the tables
also include the first and second eigenvalues for each factor when it is subjected to
maximum likelihood factor analysis. A factor is uni-dimensional if only a single
eigenvalue is greater than 1.0. All the factors used in both the customer and employee
portions of our model do indeed exhibit this property.
The tables also present the percent of variance that the factor can explain in the
individual items. The first eigenvalue of a factor should be able to explain 40% of the
total variance within the factor (Carmines and Zeller, 1979). Again, all the factors used
in this study meet this criteria, in fact, the minimum variance explained value, the
servicescape factor, is 59.4%.
Tables 4.18 and 4.19 also give several measures of discriminant validity for each
of the factors, because employee satisfaction is variable with only one indictor, it is
omitted from the summary. AVISC measures the average correlation between the items
within one factor and all the items outside of the factor. If a factor is truly unique, the
average correlation of its items with items outside of it will be sufficiently different from
1.0. Nearly all of the AVISC values are below 0.5, the exceptions are for the value,
customer satisfaction and customer loyalty factors. These AVISC findings suggest that
the eighteen multiple item factors used in this research are distinctly different from each
other. The AVISC findings are further supported by the calculation of the following two
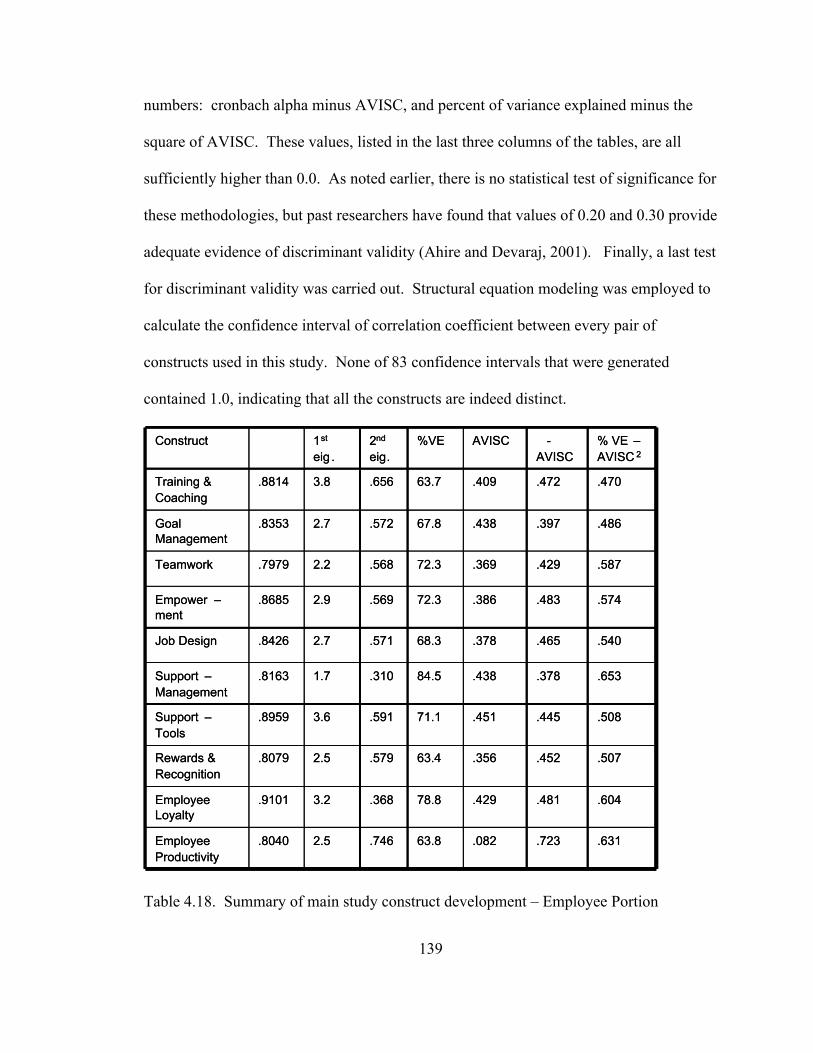
139
numbers: cronbach alpha minus AVISC, and percent of variance explained minus the
square of AVISC. These values, listed in the last three columns of the tables, are all
sufficiently higher than 0.0. As noted earlier, there is no statistical test of significance for
these methodologies, but past researchers have found that values of 0.20 and 0.30 provide
adequate evidence of discriminant validity (Ahire and Devaraj, 2001). Finally, a last test
for discriminant validity was carried out. Structural equation modeling was employed to
calculate the confidence interval of correlation coefficient between every pair of
constructs used in this study. None of 83 confidence intervals that were generated
contained 1.0, indicating that all the constructs are indeed distinct.
.604.481.42978.8.3683.2.9101Employee Loyalty
.507.452.35663.4.5792.5.8079Rewards & Recognition
.631.723.08263.8.7462.5.8040Employee Productivity
.508.445.45171.1.5913.6.8959Support –Tools
.653.378.43884.5.3101.7.8163Support –Management
.540.465.37868.3.5712.7.8426Job Design
.574.483.38672.3.5692.9.8685Empower –ment
.587.429.36972.3.5682.2.7979Teamwork
.486.397.43867.8.5722.7.8353Goal Management
.470.472.40963.7.6563.8.8814Training & Coaching
% VE –AVISC 2
?
-AVISC
AVISC%VE2nd
eig.1st
eig .
?
Construct
Table 4.18. Summary of main study construct development – Employee Portion
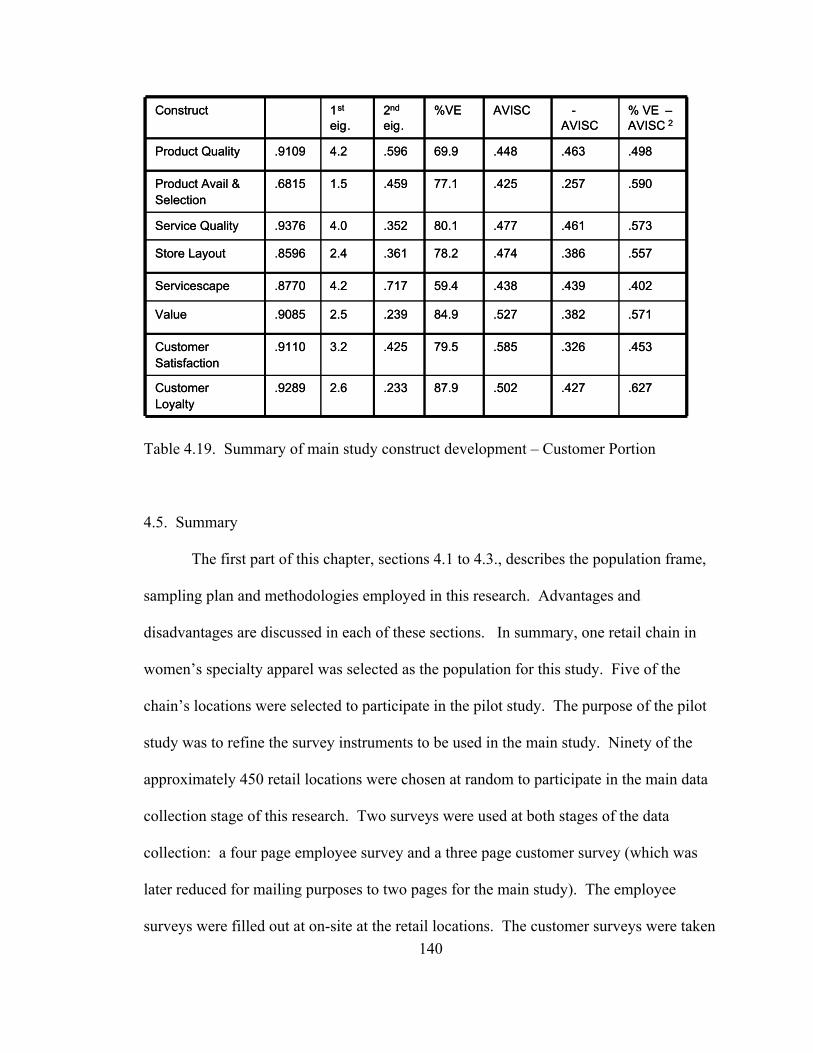
140
.627.427.50287.9.2332.6.9289Customer Loyalty
.453.326.58579.5.4253.2.9110Customer Satisfaction
.571.382.52784.9.2392.5.9085Value
.402.439.43859.4.7174.2.8770Servicescape
.557.386.47478.2.3612.4.8596Store Layout
.573.461.47780.1.3524.0.9376Service Quality
.590.257.42577.1.4591.5.6815Product Avail & Selection
.498.463.44869.9.5964.2.9109Product Quality
% VE –AVISC 2
?
-AVISC
AVISC%VE2nd
eig.1st
eig.
?
Construct
Table 4.19. Summary of main study construct development – Customer Portion
4.5. Summary
The first part of this chapter, sections 4.1 to 4.3., describes the population frame,
sampling plan and methodologies employed in this research. Advantages and
disadvantages are discussed in each of these sections. In summary, one retail chain in
women’s specialty apparel was selected as the population for this study. Five of the
chain’s locations were selected to participate in the pilot study. The purpose of the pilot
study was to refine the survey instruments to be used in the main study. Ninety of the
approximately 450 retail locations were chosen at random to participate in the main data
collection stage of this research. Two surveys were used at both stages of the data
collection: a four page employee survey and a three page customer survey (which was
later reduced for mailing purposes to two pages for the main study). The employee
surveys were filled out at on-site at the retail locations. The customer surveys were taken
141
home by shoppers and sent back in self-addressed stamped envelopes. Fifty employee
surveys and 62 customer surveys were returned during the pilot stage resulting in
response rates of 77% and 24% respectively. Eight hundred and seventy two employee
surveys were returned and 1,076 customer surveys were returned during the main data
collection stage, yielding response rates of 65% and 24% respectively.
The majority of chapter 4 is dedicated to analyzing the measurement models to be
used in this research. A priori factors are subjected to tests of reliability, uni-
dimensionality and discriminant validity. The pilot study analysis indicated that several
survey items needed to be altered, added, and/or dropped before moving on to the main
data collection stage. These changes are detailed in section 4.4.1.
Section 4.4.2 details the results of the measurement model used in the main study.
The results indicate that the constructs used in this study are highly reliable, measure only
a single theme (uni-dimensional) and are sufficiently different from other constructs
within the study (divergent validity). These results are very important because they allow
for the testing of the linkages within the service profit chain. They are all necessary
requirements for using structural equation modeling.
It is also important to note that while our measurement models confirmed factors
that have been used extensively in service management literature, e.g. service quality,
customer satisfaction, etc., the models have also applied scales that have primarily only
been used in other business disciplines: organizational support – human resource
management, value – marketing, work design – personnel psychology, etc. Furthermore,
the study has incorporated fairly new first order factors that have not yet been well
developed: servicescape (Wakefield and Blodgett, 1996) and product availability and

142
selection. Chapter 5 will continue this tradition in building two new second order
constructs – internal service quality and total retail experience. These two factors will be
the foundation upon which the structural equation models that test the service profit chain
will be built.
143
CHAPTER 5
STRUCTURAL MODELS AND ANALYSIS
Two structural equation models will be used to test the theory underlying the
service profit chain. As discussed in section 4.2, two models are used instead of one due
to the sample frame of this study. The first model, the employee model, will test the
plausibility of the first half of the service profit chain; specifically, it will investigate the
relationship between internal service quality, employee satisfaction, employee loyalty
and employee productivity. The second model, the customer model, will explore the
linkages between total retail experience, value, customer satisfaction and customer
loyalty.
This chapter is organized in the following manner. Section 5.1 will detail why
structural equation modeling is the methodology of choice for this research. Included in
this section is a discussion of the power of the two models. Section 5.2, the employee
model, will be broken into two sections. The first section, section 5.2.1 focuses on the
composition of internal service quality as a second order factor. Once this higher level
construct is established, section 5.2.2 explores how it relates to employee outcome
factors. The individual hypotheses proposed in chapter 2, and summarized below, are
tested, along with a discussion of overall model fit.
H1a: Internal service quality is positively associated with employeesatisfaction.
H1b: Internal service quality is positively associated with employeeloyalty.
144
H1c: Employee satisfaction is positively associated with employeeloyalty.
H1d: Employee satisfaction is positively associated with employeeproductivity.
H1e: Employee loyalty is positively associated with employeeproductivity.
Both sections, 5.2.1 and 5.2.2, end with a discussion of the contributions this research
makes in regards to the two respective areas.
The organization of Section 5.3 follows the same basic logic of Section 5.2 only it
looks at the customer model. Section 5.3.1 details the measurement of total retail
experience, a second order factor similar to internal service quality. Section 5.3.3
investigates the relationship between total retail experience, value, customer satisfaction
and customer loyalty. The hypotheses laid out in Chapter 3 are treated independently,
followed by an analysis of overall model fit.
H2a: Total retail experience is positively associated with value.
H2b: Total retail experience is positively associated with customersatisfaction.
H2c: Value is positively associated with customer satisfaction.
H2d: Customer satisfaction is positively associated with customerloyalty.
Both sections end with a discussion of the contributions of this research.
145
5.1. Structural equation modeling
Structural equation modeling is a multivariate technique that allows for very
powerful statistical analysis. As a technique, it provides many advantages over simpler
statistical methodologies like analysis of variance (ANOVA) or regression. It is because
of these advantages, detailed below, that structural equation modeling is selected as the
data analytic tool of choice.
First, structural equation modeling incorporates the use of latent variables. A
latent variable cannot be measured directly but rather must be represented or measured by
two or more variables (Hair et al, 1998). This definition becomes clearer with an
example from this research. In order to measure a multi-faceted concept such as training
and coaching it is necessary to ask questions regarding initial training, on-going training,
length of training, quality of training, etc. It is impossible to measure this concept using
only a single question; that is, a single indicator. As such, several questions are used to
build a representation of the training and coaching an employee receives. In our study we
use six questions. Using six questions has many advantages over using a single question.
The six question method allows for a much more comprehensive rendering of employees’
perceptions of the training they have received. Furthermore, because reliability is a
function of the number of indicators used, using six questions increases the reliability of
the survey instrument. By definition, a single item measure has zero reliability.
A second major advantage to using structural equation modeling is that it allows
for a variable to act both in a dependent and independent role simultaneously. In the
service profit chain model, many variables fit this description. For example, customer
satisfaction acts as a dependent variable in the equation containing the total retail
146
experience construct, equation (1), while also acting simultaneously as an independent
variable in the equation containing the customer loyalty construct, equation (2).
Customer Satisfaction = _1 * Total Retail Experience + _2 * Value + Error (1)
Customer Loyalty = _3 * Customer Satisfaction + Error (2)
This advantage also makes it possible to determine both the direct and indirect effects of
variables within the service profit chain model. Even more importantly, this advantage
allows for the determination of the causal nature of the relationships within the model;
findings which neither regression nor ANOVA can provide.
The primary concern of using structural equation modeling is obtaining large
enough samples to achieve reasonable power (MacCallum et al, 1996; Fan et al, 1999;
Jackson, 2001). Various researchers have recommended that between five and ten
observations are needed for each path estimate within the structural equation model (Hair
et al, 1998). As discussed in section 4.2, our population frame allows us to select a
sampling plan that results in very large sample yielding substantial power for our
statistical analyses. Using the framework proposed by MacCallum et al (1996), the
power for both structural equation models used in this research approaches 1.0. Degrees
of freedom for the employee and customer models are 619 and 455 respectively. Sample
size is 872 for the employee model and 1,076 for the customer model.
5.2. Employee Model
The employee model concentrates on both the direct and indirect relationships
between internal service quality and employee related outcome variables – satisfaction,
loyalty and productivity. Specifically, our rendering combines both a second order
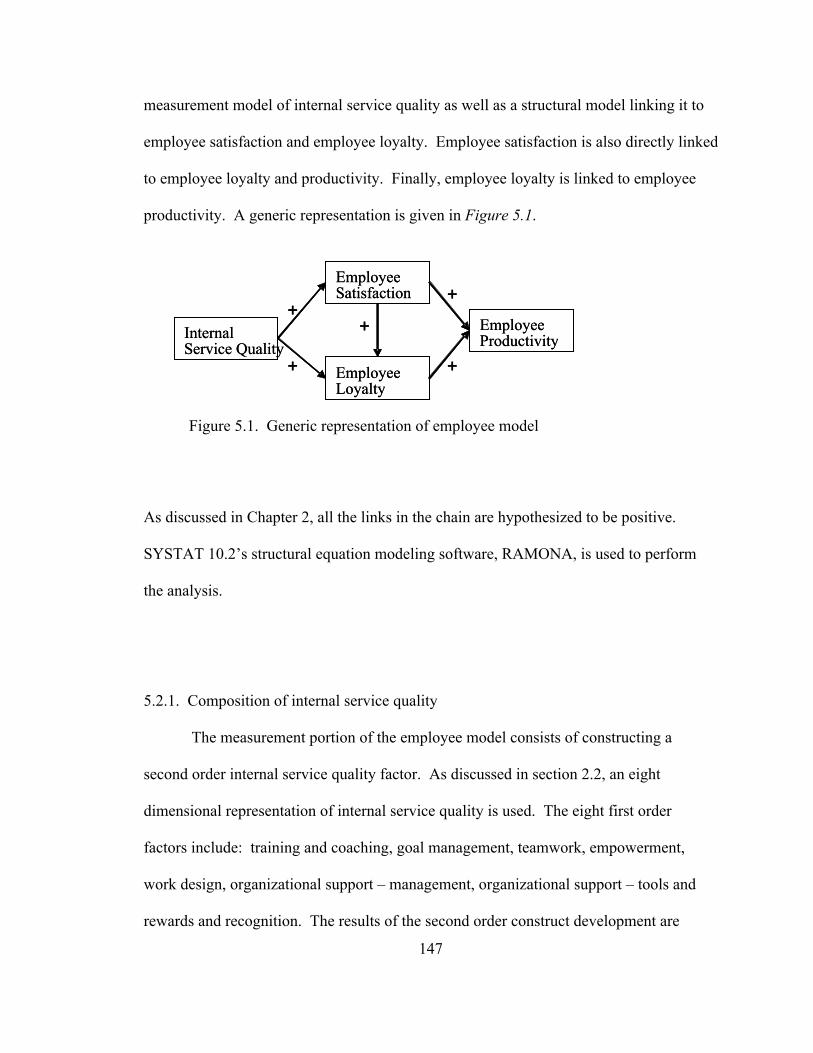
147
measurement model of internal service quality as well as a structural model linking it to
employee satisfaction and employee loyalty. Employee satisfaction is also directly linked
to employee loyalty and productivity. Finally, employee loyalty is linked to employee
productivity. A generic representation is given in Figure 5.1.
As discussed in Chapter 2, all the links in the chain are hypothesized to be positive.
SYSTAT 10.2’s structural equation modeling software, RAMONA, is used to perform
the analysis.
5.2.1. Composition of internal service quality
The measurement portion of the employee model consists of constructing a
second order internal service quality factor. As discussed in section 2.2, an eight
dimensional representation of internal service quality is used. The eight first order
factors include: training and coaching, goal management, teamwork, empowerment,
work design, organizational support – management, organizational support – tools and
rewards and recognition. The results of the second order construct development are
InternalService Quality
EmployeeSatisfaction
EmployeeLoyalty
EmployeeProductivity
+
+
+
+
+
InternalService Quality
EmployeeSatisfaction
EmployeeLoyalty
EmployeeProductivity
+
+
+
+
+
Figure 5.1. Generic representation of employee model
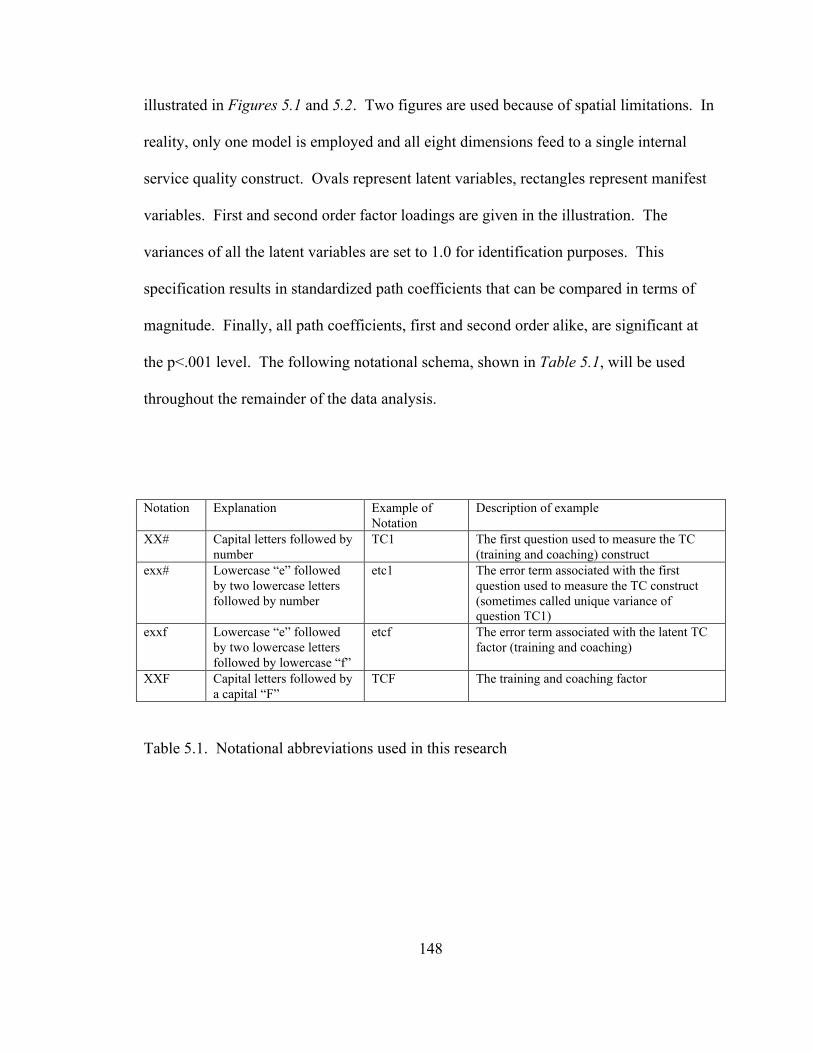
148
illustrated in Figures 5.1 and 5.2. Two figures are used because of spatial limitations. In
reality, only one model is employed and all eight dimensions feed to a single internal
service quality construct. Ovals represent latent variables, rectangles represent manifest
variables. First and second order factor loadings are given in the illustration. The
variances of all the latent variables are set to 1.0 for identification purposes. This
specification results in standardized path coefficients that can be compared in terms of
magnitude. Finally, all path coefficients, first and second order alike, are significant at
the p<.001 level. The following notational schema, shown in Table 5.1, will be used
throughout the remainder of the data analysis.
Notation Explanation Example ofNotation
Description of example
XX# Capital letters followed bynumber
TC1 The first question used to measure the TC(training and coaching) construct
exx# Lowercase “e” followedby two lowercase lettersfollowed by number
etc1 The error term associated with the firstquestion used to measure the TC construct(sometimes called unique variance ofquestion TC1)
exxf Lowercase “e” followedby two lowercase lettersfollowed by lowercase “f”
etcf The error term associated with the latent TCfactor (training and coaching)
XXF Capital letters followed bya capital “F”
TCF The training and coaching factor
Table 5.1. Notational abbreviations used in this research
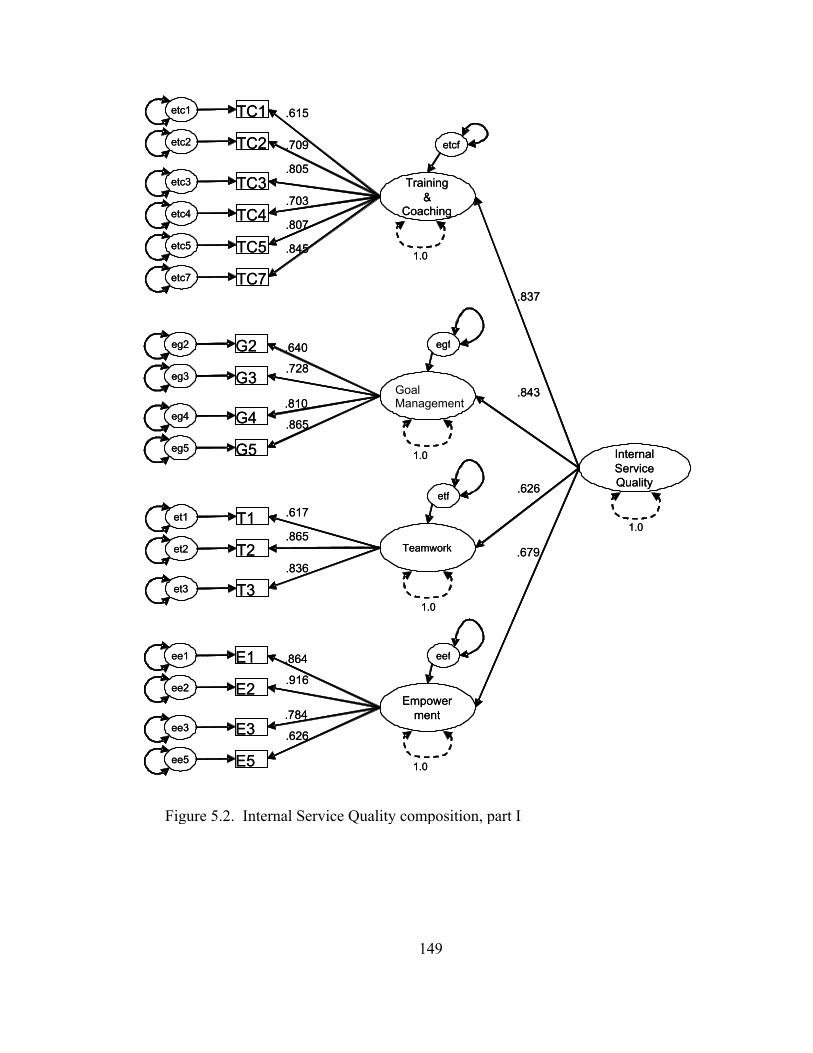
149
TC2etc2
TC3etc3
TC4etc4
TC5etc5
TC7etc7
TC1etc1 .615
.709
.805
.703
.807
.845
Training&
Coaching
1.0
etcf
G3eg3
G4eg4
G5eg5
G2eg2 .640
.728
.810
.865
1.0
egf
T2et2
T3et3
T1et1 .617
.865
.836
Teamwork
1.0
etf
E2ee2
E3ee3
E5ee5
E1ee1 .864
.916
.784
.626
Empowerment
1.0
eef
InternalServiceQuality
1.0
.837
.843
.626
.679
TC2etc2
TC3etc3
TC4etc4
TC5etc5
TC7etc7
TC1etc1 .615
.709
.805
.703
.807
.845
Training&
Coaching
1.0
etcf
G3eg3
G4eg4
G5eg5
G2eg2 .640
.728
.810
.865
GoalManagement
1.0
egf
T2et2
T3et3
T1et1 .617
.865
.836
Teamwork
1.0
etf
E2ee2
E3ee3
E5ee5
E1ee1 .864
.916
.784
.626
Empowerment
1.0
eef
InternalServiceQuality
1.0
.837
.843
.626
.679
Figure 5.2. Internal Service Quality composition, part I
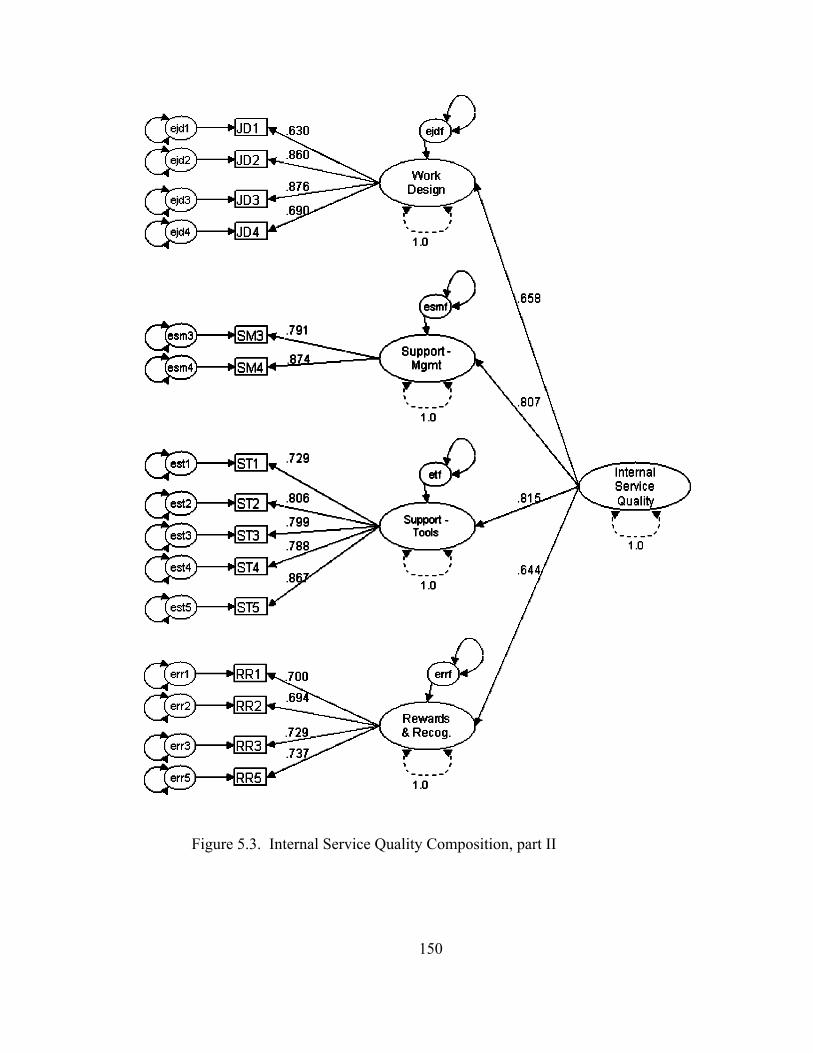
150
Figure 5.3. Internal Service Quality Composition, part II
151
Several important considerations can be taken away from the measurement
portion of the employee model. First, the eight dimensional representation of internal
service quality appears to be a very strong rendering. All eight dimensions exhibit large
second order factor loadings, ranging from 0.626 (teamwork) to 0.843 (goal
management). These findings suggest that employees do indeed develop a broad
conceptualization of their work surroundings, very similar to what previous researchers
have called organization culture, organizational climate and/or human resource
management.
It is also interesting to note that the magnitudes of the factor loadings of the
internal service quality dimensions fall into two groups. The first group consists of
training and coaching (0.837 factor loading), goal management (0.843), organizational
support – management (0.807) and organizational support – tools (0.815). It appears that
employees attribute the most weight to these four dimensions when assessing the quality
of their work environment. The second group is comprised of teamwork (0.626),
empowerment (0.679), work design (0.658) and rewards and recognition (0.644). None
of the confidence intervals around the factor loading parameter estimates from the first
group overlap with those from the second group. For example, the 95% confidence
interval around the factor loading parameter estimate for training and coaching is (0.812,
0.861); the interval around the teamwork factor estimate is (0.583, 0.669). Because these
two intervals do not overlap, it can be concluded that training and coaching is a more
salient shaper of employees’ perceptions of their internal service quality than teamwork
is. This argument can be extended to the rest of the elements in each of the two groups.
152
The measurement portion of the employee model makes two very important
contributions. First, it is the most thorough development of a comprehensive internal
service quality construct. The literature review in Chapter 2 is the most scrupulous
examination of internal service quality literature to date, integrating theory from several
different disciplines. This review provides for an eight dimensional representation that
exhibits high degrees of both content and face validity. We also provide the most
rigorous statistical construction of the internal service quality factor. Section 4.4 details
the reliability, uni-dimensionality and discriminant validity of each individual element;
the first such study to do so. Moreover, Section 5.2.2 explores the nomological and
predictive validities of the internal service quality construct by examining its relationship
with employee satisfaction and employee loyalty. Again, this study is the first to explore
thoroughly these relationships using a second order factor model.
The measurement portion of the employee model also gives practicing managers a
valuable tool that can be used in resource allocation. The second order factor loadings of
the eight internal service quality dimensions indicate the weightings that employees place
on each individual dimension. Managers can use these weights, when faced with limited
budgets, as an allocation instrument. If limited funds are available to improve working
conditions, a manager will want to select any of the four first group items: training and
coaching, goal management, organizational support – management and organizational
support – tools. Improving any of these four areas will yield the greatest overall increase
in internal service quality.
153
5.2.2. Linking internal service quality to satisfaction, loyalty and productivity
As discussed in Chapter 2, the following hypotheses are all embedded within the
employee portion of the service profit chain:
H1a: Internal service quality is positively associated with employeesatisfaction.
H1b: Internal service quality is positively associated with employeeloyalty.
H1c: Employee satisfaction is positively associated with employeeloyalty.
H1d: Employee satisfaction is positively associated with employeeproductivity.
H1e: Employee loyalty is positively associated with employeeproductivity.
Structural equations will test each of these hypotheses independently as well as testing
the overall fit of the employee portion of the service profit chain.
The structural framework tested along with the results are illustrated in Figure
5.4. Due to spatial limitations, the eight internal service quality dimensions, along with
their indicators, are omitted from the diagram, however, their equations are included in
the model (i.e. internal service quality is still a second order factor made up of eight first
order factors all made up of their individual indicators). The paths that are significant are
so at the p<.001 level. The two paths that are not significant are not so at the p<.05 level.
As noted earlier, the variances of all latent variables are set to 1.0 for identification
purposes, rectangles represent indicators and ovals represent latent variables. Table 5.2
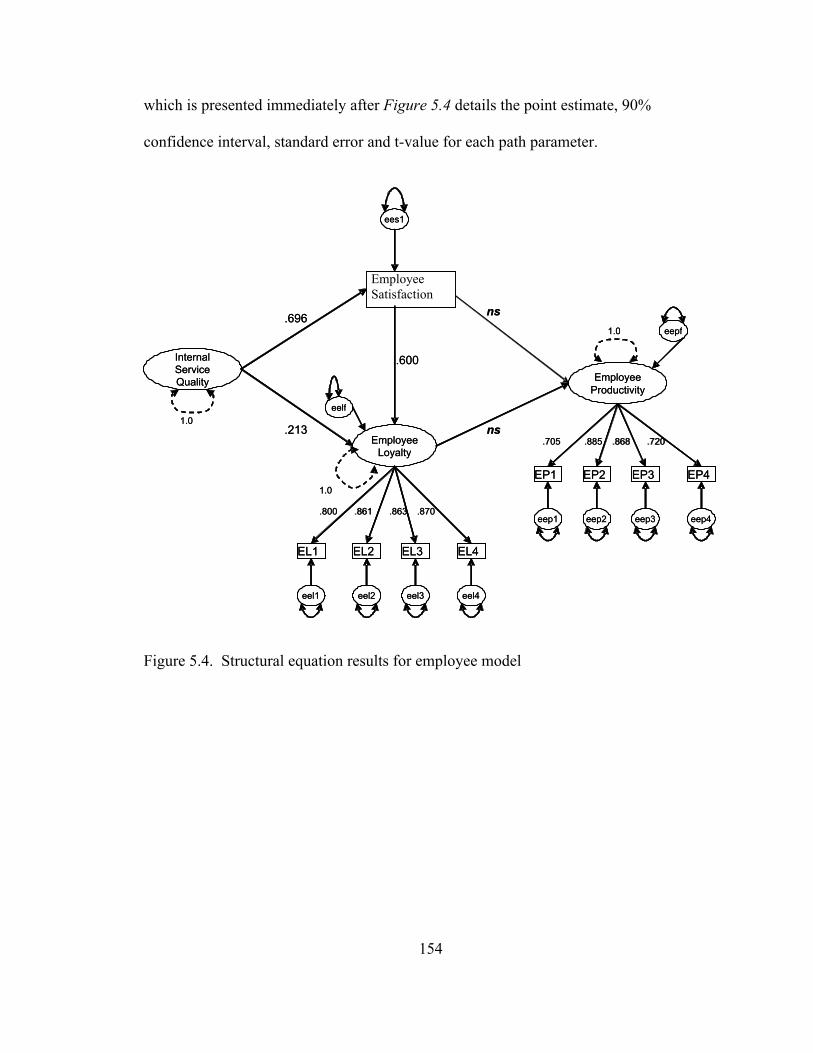
154
which is presented immediately after Figure 5.4 details the point estimate, 90%
confidence interval, standard error and t-value for each path parameter.
Figure 5.4. Structural equation results for employee model
InternalServiceQuality
1.0
EmployeeLoyalty
EmployeeProductivity
1.0
1.0
eelf
eepf
EL1 EL2 EL3
eel1 eel2 eel3
EP1 EP2 EP3
eep1 eep2 eep3
EmployeeSatisfaction
ees1
.696
EL4
eel4
EP4
eep4
.213
.600
ns
ns
.800 .861 .863 .870
.705 .885 .868 .720
InternalServiceQuality
1.0
EmployeeLoyalty
EmployeeProductivity
1.0
1.0
eelf
eepf
EL1 EL2 EL3
eel1 eel2 eel3
EP1 EP2 EP3
eep1 eep2 eep3
ees1
.696
EL4
eel4
EP4
eep4
.213
.600
ns
ns
.800 .861 .863 .870
.705 .885 .868 .720
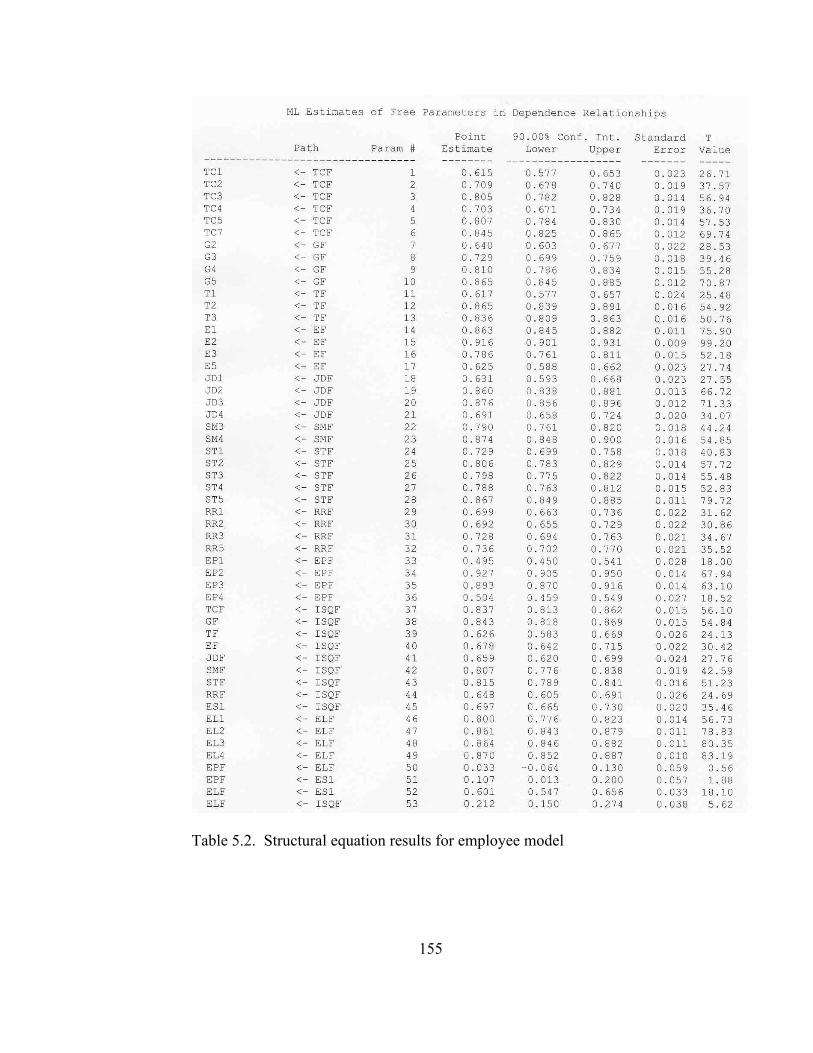
155
Table 5.2. Structural equation results for employee model
156
Before discussing model fit each hypothesis is treated individually. H1a theorizes
that there is a positive relationship between internal service quality and employee
satisfaction. The beta coefficient for the path between these two constructs is 0.697, 90%
confidence interval of (0.665, 0.730). The standard error of the path estimate is 0.020.
The t value associated with the path is 35.46 which is significant at the p < .001 level.
These results provide empirical validation of hypothesis H1a – there is a positive
relationship between internal service quality and employee satisfaction. The
confirmation of this hypothesis demonstrates that high quality support services and
organizational policies, such as goal management, support – management, support –
tools, rewards and recognition, etc., lead to employee satisfaction. In other words,
employees notice and value the developmental HR practices of their organizations.
These findings resemble those in closely related fields. Whether the research has used
the term organizational culture (Schneider, 1990; O’Rielly et al, 1991; Sheridan, 1992),
organizational climate (Schneider et al, 1980; Rogg et al, 2001), high performance work
systems (Huselid, 1995), high commitment human resource management (Arthur 1992,
1994; Whitener, 2001), innovative human resource practices (MacDuffie, 1995), quality
of work life (Havlovic, 1991; Lau et al, 2001) or perceived organizational support
(Eisenberger et al, 1986; Rhoades and Eisenberger, 2002) the results have been the same
– employees are grateful for the efforts of the organization’s commitment to provide
them an excellent working environment that not only treats them with respect but also
develops their capabilities.
A similar result occurs when testing hypothesis H1b – Internal service quality is
positively associated with employee loyalty. The path coefficient between these two
157
variables is 0.212, 90% confidence interval of (0.150, 0.274). The standard error of the
coefficient is 0.038, yielding a t value of 5.62 which is significant at the p < .001 value.
These findings do lend support for Hypothesis H1b: internal service quality is positively
associated with employee loyalty. The same arguments made above, linking internal
service quality to employee satisfaction, can be made here. Employees do recognize and
value an excellent working environment where their potential is utilized and developed.
As social exchange theorists argue, employees will feel a certain degree of reciprocity for
their organization’s support – one way the reciprocity will reveal itself is through a
heightened sense of commitment (Homans, 1961; Blau, 1964; Schneider et al, 1980;
Wayne et al, 1997; Rhoades and Eisenberger, 2002).
Before moving to the next hypothesis, a special comparative note should be made
in regards to the direct effect of internal service quality on employee satisfaction and
employee loyalty. The magnitude of the effect of internal service quality on employee
satisfaction is over three times greater than the magnitude of the effect of internal service
quality on employee loyalty, beta weights of 0.697 versus 0.212. This is the first research
that explicitly allows for this comparison. We believe there are two underlying reasons
for this result. First, there are probably fewer contextual effects that mediate the
relationship between internal service quality and employee satisfaction than there are that
mediate the effect between internal service quality and employee loyalty. For example,
an employee who is working in a retail environment while pursuing a college degree may
value and be highly satisfied with their organization’s internal work environment but
their career goal of pursuing a more permanent job in specialized field may lead to a less
pronounced effect of their working environment on their intent to remain with the
158
organization in a similar position, i.e. loyalty. Second, from a temporal sense, internal
service quality may have a more immediate effect on satisfaction than it does loyalty.
Giving employees a better working environment may dramatically increase their
immediate satisfaction, but it may take a certain amount of time for that satisfaction to
yield an increase in a more long term concept like loyalty. This concept is partially
accounted for by exploring the indirect path from internal service quality to employee
loyalty through the employee satisfaction variable.
The third hypothesis embedded within the service profit chain is H1c which states
that there is a positive association between employee satisfaction and employee loyalty.
The beta coefficient between these two variables is 0.601, 90% confidence interval of
(0.547, 0.656). The standard error for this coefficient is 0.033 resulting in a t value of
18.10, which is significant at the p < .001 level. These results lend support for hypothesis
H1c and reflect the findings a vast amount of previous research suggesting the link
between employee satisfaction and employee loyalty is quite strong (see section 2.3 for a
review of this literature). Indeed meta-analyses by Petty et al (1984) and Griffeth et al
(2000) concluded that employee satisfaction is the most significant predictor of employee
loyalty – the high beta weight, 0.601, of this study, serves to validate this concept.
The result of the structural equation model indicates that there is no evidence of
the expected positive relationship between employee satisfaction and employee
productivity or of the relationship between employee loyalty and employee productivity;
hence, hypotheses H1d and H1e are not supported. These results contradict a vast
amount of previous research into these relationships, see section 2.3 and Appendix E for a
review of this research. We believe that our results stem not from a truly insignificant
159
relationship among the three variables but rather from the construction of the employee
productivity measure. In the main survey instrument, four items are used to measure
employee productivity:
• I feel that I am a productive associate.• Within my store I am a top seller.• My average sales per hour is among the best in the store.• My productivity has increased the longer I have worked in the
store.
Although these questions have proven to be valid in previous studies (Denison et al,
1995; Huselid, 1995; Spreitzer et al, 1997; Silvestro and Cross, 2000) after deeper
investigation of the operating policies of the specialty retailer used in this study, it
appears they may not be appropriate measures for this specific setting. First, the specialty
retailer employs associates whose sole job responsibilities are stocking the front room
and inventory control in the back room. As such, questions pertaining to sales are not
applicable. Second, sales associates work in store zones and are instructed to hand
customers over to other associates when the customer leaves a zone. Due to this teaming
approach, individual sales figures are not tracked, therefore, employees do not actually
know their average individual daily sales. Jointly these two store operating
characteristics, along with the fact that anonymous surveys are utilized, precluding the
possibility of using manager’s perceptions of employee productivity, may be the
underlying cause of the insignificance among the three employee measures: satisfaction,
loyalty and productivity. At the very least, this finding warrants future investigation and
research.
The difficulty in measuring employee productivity in the service industry is a
common one to service management scholars (Vuorinen et al, 1998; Van Looy et al,
160
1998), see Nachum (1999) for a review. The measurement difficulty stems from the lack
of uniform inputs and outputs. An employee’s knowledge or helpfulness is not
necessarily captured in traditional manufacturing type output related productivity scores.
One could argue that the only true way to measure a service employee’s productivity is to
use a customer’s perception of the service quality provided by the employee as a
surrogate.
Due to the reasons listed above, and until the validity of an employee productivity
construct can be better ensured, the factor will be dropped from the remaining portions of
this research. The final structural equation model tested is presented in Figure 5.5. Note,
indicators and error terms are left off for spatial considerations. All individual paths are
significant at the p<.001 level. Details of the point estimates, 90% confidence intervals,
standard errors and t-values associated with each path can be found in Table 5.3
immediately following the illustration of the structural model.
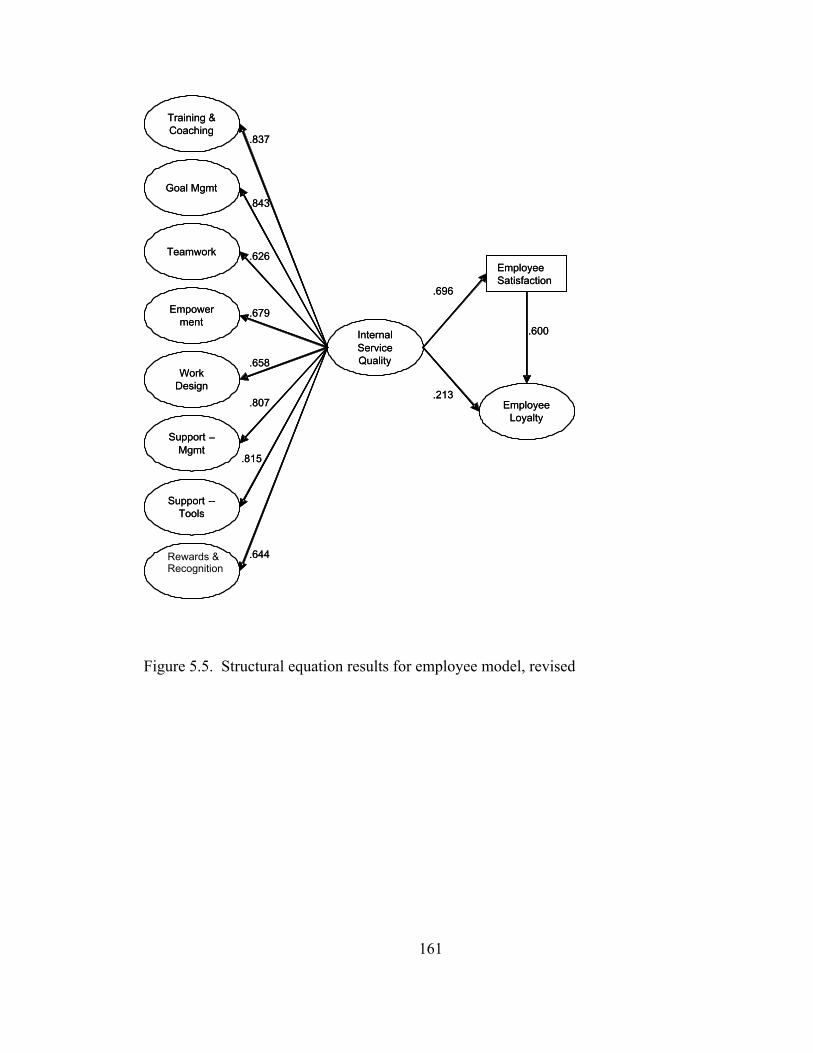
161
Figure 5.5. Structural equation results for employee model, revised
Training &Coaching
Goal Mgmt
Teamwork
Empowerment
WorkDesign
Support –Mgmt
Support --Tools
InternalServiceQuality
EmployeeLoyalty
EmployeeSatisfaction
.696
.600
.213
.837
.843
.626
.679
.658
.807
.815
.644
Training &Coaching
Goal Mgmt
Teamwork
Empowerment
WorkDesign
Support –Mgmt
Support --Tools
Rewards &Recognition
InternalServiceQuality
EmployeeLoyalty
EmployeeSatisfaction
.696
.600
.213
.837
.843
.626
.679
.658
.807
.815
.644
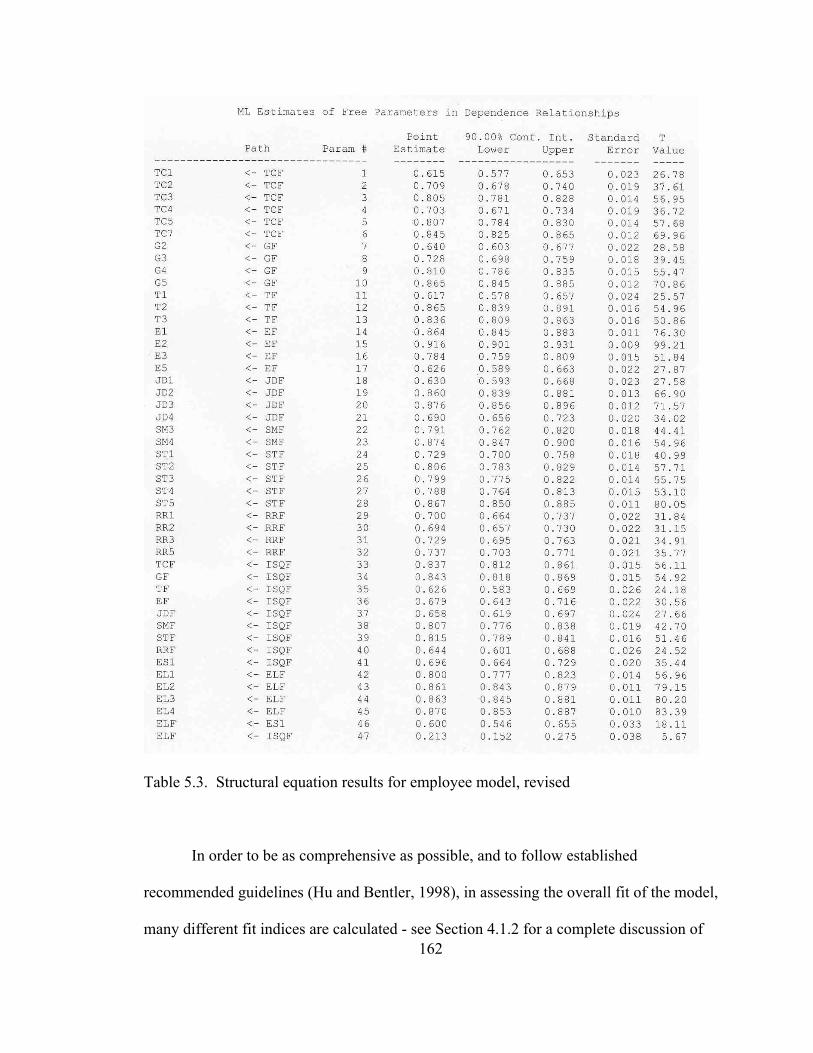
162
Table 5.3. Structural equation results for employee model, revised
In order to be as comprehensive as possible, and to follow established
recommended guidelines (Hu and Bentler, 1998), in assessing the overall fit of the model,
many different fit indices are calculated - see Section 4.1.2 for a complete discussion of
163
each fit measure. Table 5.4 summarizes all the values of the fit indices for the employee
model. An RMSEA of .057 is very close to Hair et al’s (1998) suggestion of .05
indicating good fit and well within the .08 cut-off of reasonable fit. A second absolute fix
index, RMR, also suggests that the model fits the data well. The model’s RMR of 0.05 is
well below the suggested 0.10 cutoff (Chau, 1997). The last absolute fit measure, a
gamma hat value of 0.90, is at the suggested 0.90 cutoff indicating the model fits the data
well (Steiger, 1989). All six of the incremental fit measures are above or near the 0.90
recommended cutoffs: NFI, NNFI, BL86, BL89, RNI and CFI. Taken together, these
nine fit measure thoroughly demonstrate that the proposed employee model does fit the
data well.
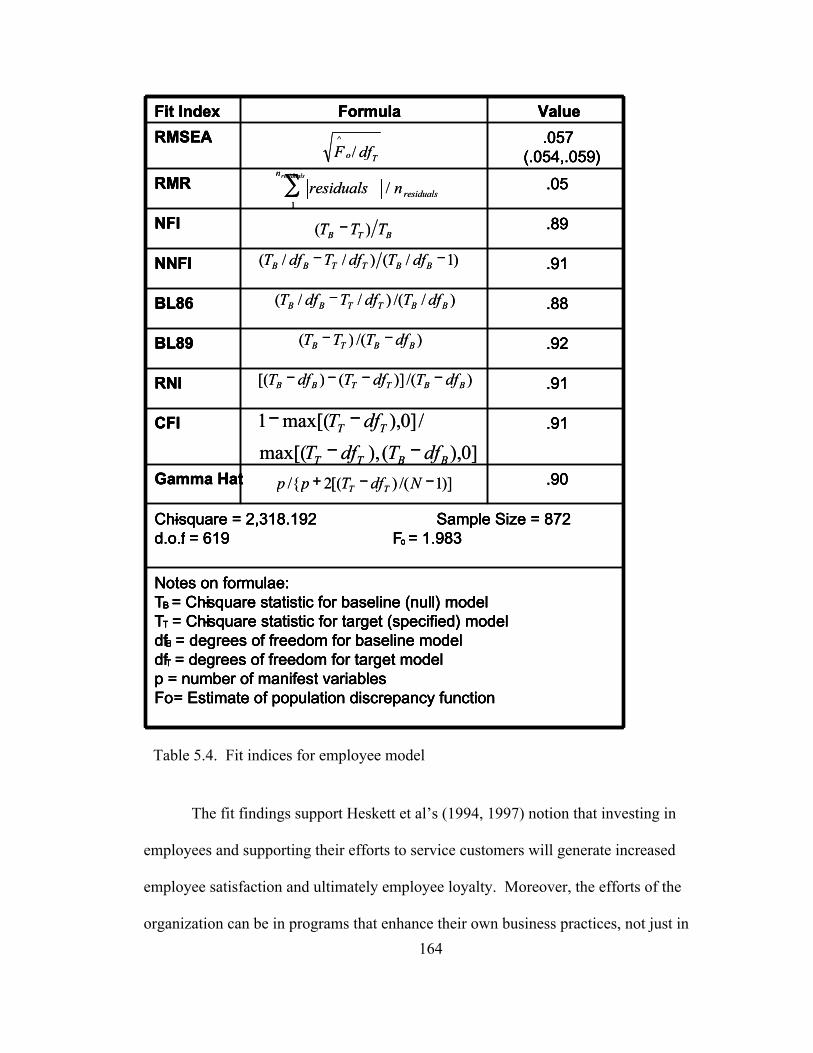
164
The fit findings support Heskett et al’s (1994, 1997) notion that investing in
employees and supporting their efforts to service customers will generate increased
employee satisfaction and ultimately employee loyalty. Moreover, the efforts of the
organization can be in programs that enhance their own business practices, not just in
BTB TTT )( −
)1/()//( −−BBTTBB dfTdfTdfT
)//()//( BBTTBB dfTdfTdfT −
)/()( BBTB dfTTT −−
)/()]()[( BBTTBB dfTdfTdfT −−−−
]0),(),max[(
/]0),max[(1
BBTT
TT
dfTdfT
dfT−−
−−
)]1/()[(2/{ −−+ NdfTpp TT
To dfF /^
residuals
n
nresidualsresiduals
/1
∑
Chi-square = 2,318.192 Sample Size = 872d.o.f. = 619 Fo = 1.983
Notes on formulae:TB = Chi-square statistic for baseline (null) modelTT = Chi-square statistic for target (specified) modeldfB = degrees of freedom for baseline modeldfT = degrees of freedom for target modelp = number of manifest variablesFo= Estimate of population discrepancy function
.90Gamma Hat
.91CFI
.91RNI
.92BL89
.88BL86
.91NNFI
.89NFI
.05RMR
.057(.054,.059)
RMSEA
ValueFormulaFit Index
Table 5.4. Fit indices for employee model
165
those programs that directly benefit the employee, such as increased compensation. For
example, the results show that organizations who train their employees and give them
tools to serve the customer will find that employees become more fulfilled and satisfied
with their work. It would be very difficult to argue that training programs have no direct
effect on the service delivery quality that the organization delivers. In summary, the fit
findings support the revised portion of the service profit chain model.
The results of the employee model make several important contributions to
service management literature. Most importantly, the findings support Heskett et al’s
(1994, 1997, 2001) theory that employees are valuable resources to be maximized rather
than value-less costs to be constrained. Rather than reducing front-line service jobs to
mundane, repetitive tasks, organizations can achieve competitive advantage by
broadening job descriptions and developing their employees through commitment
enhancing human resource practices. Supporting the growth of employees can have far
reaching benefits that extend well beyond keeping them happy. As hypothesized in the
service profit chain model, increased employee satisfaction leads to an increase in
employee retention. Increased retention leads to familiarity with the service process and
an enhancement in capability to service unique customer needs. Furthermore, as
Schlesinger and Heskett (1991) demonstrate in their work on the “satisfaction mirror”,
employee satisfaction is one of the best predictors of customer satisfaction. And as
various researchers have shown (e.g. Cronin and Taylor, 1992; Shemwell, 1998; Taylor
and Hunter, 2002), customer satisfaction leads to customer loyalty and overall
improvement in business performance.
166
The employee model also provides evidence for the nomological validity of the
internal service quality construct; something which previous research has yet to establish.
When developing constructs it is not enough to show that they are reliable, convergent
and divergent. It must also be shown, that post refinement, they behave in accordance
with accepted theory in relation to other well established constructs. The structural
equation results show that the eight dimensional representation of internal service quality
used in this study does behave in a manner consistent with human resource theory: it is
positively associated with employee satisfaction and employee loyalty. These results
can be used as justification for the nomological validity for both the eight dimensional
factors as well as the higher, second order internal service quality factor.
5.3. Customer model
In their service profit chain work, Heskett et al (1994, 1997) hypothesize that
external service quality, which we call total retail experience, drives value and customer
satisfaction, which, in turn, drive customer loyalty. As pointed out by Kaplan and Norton
(1991, 2002), in their work on the balanced scorecard, customer satisfaction and loyalty
are leading indicators of overall business performance. Similar to the employee model, a
second order construct, total retail experience, drives this entire causal framework.
Following the organization of section 5.2 we will first discuss the second order
measurement model, we will then explore the relationship among the rest of the
variables. The generic model to be tested is given in Figure 5.6.
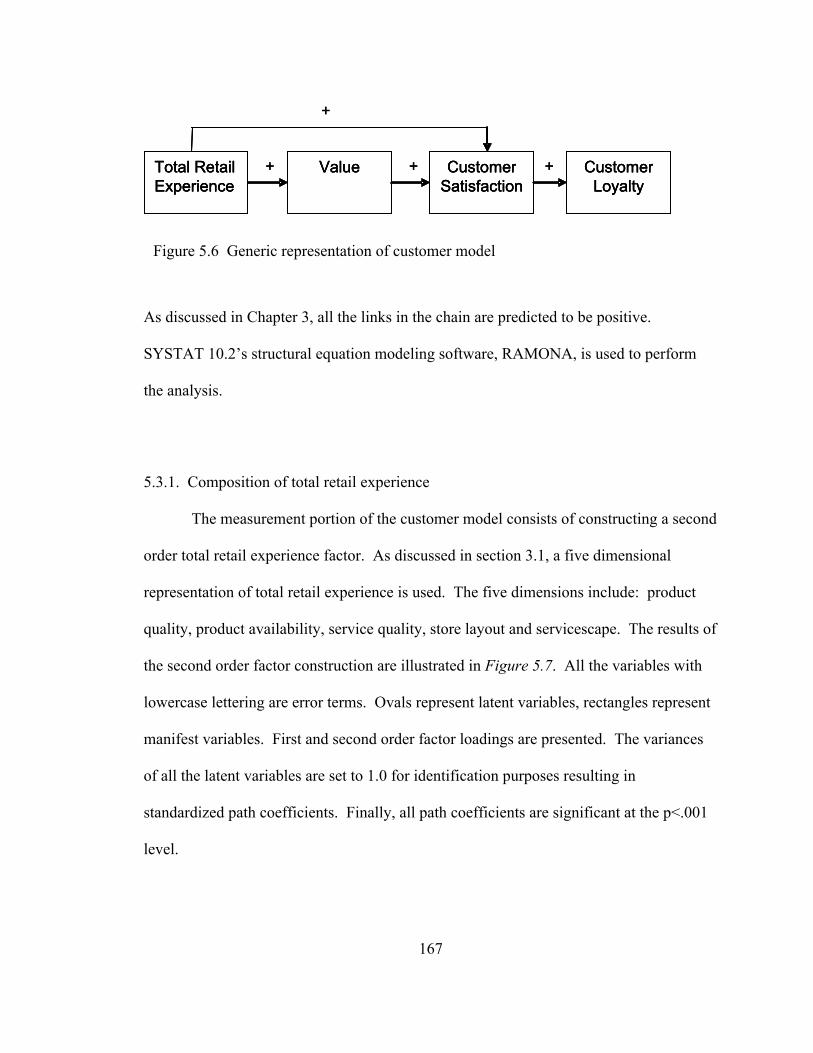
167
As discussed in Chapter 3, all the links in the chain are predicted to be positive.
SYSTAT 10.2’s structural equation modeling software, RAMONA, is used to perform
the analysis.
5.3.1. Composition of total retail experience
The measurement portion of the customer model consists of constructing a second
order total retail experience factor. As discussed in section 3.1, a five dimensional
representation of total retail experience is used. The five dimensions include: product
quality, product availability, service quality, store layout and servicescape. The results of
the second order factor construction are illustrated in Figure 5.7. All the variables with
lowercase lettering are error terms. Ovals represent latent variables, rectangles represent
manifest variables. First and second order factor loadings are presented. The variances
of all the latent variables are set to 1.0 for identification purposes resulting in
standardized path coefficients. Finally, all path coefficients are significant at the p<.001
level.
Total RetailExperience
Value CustomerSatisfaction
CustomerLoyalty
+ + +
+
Total RetailExperience
Value CustomerSatisfaction
CustomerLoyalty
Total RetailExperience
Value CustomerSatisfaction
CustomerLoyalty
+ + +
+
Figure 5.6 Generic representation of customer model
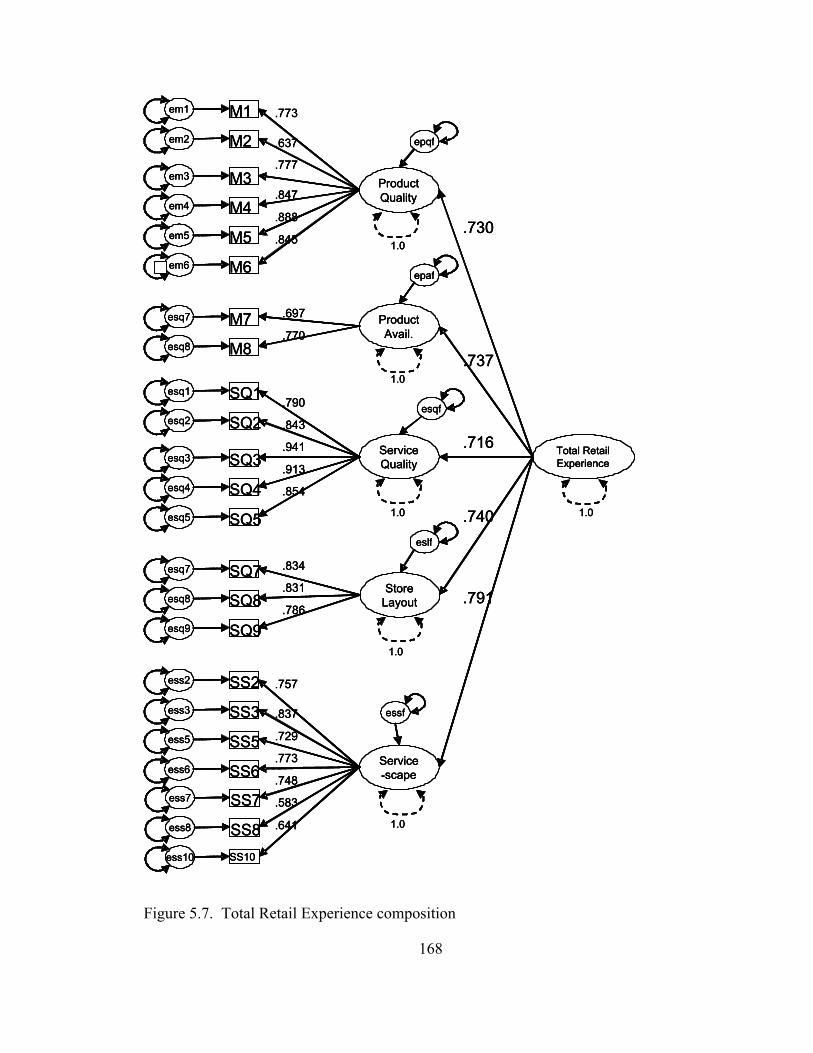
168
Figure 5.7. Total Retail Experience composition
M2em2
M3em3
M4em4
M5em5
M6em6
M1em1
M7esq7
M8esq8
SQ2esq2
SQ3esq3
SQ4esq4
SQ5esq5
SQ1esq1
SQ8esq8
SQ9esq9
SQ7esq7
SS3ess3
SS5ess5
SS7ess7
SS8ess8
SS2ess2
SS10ess10
.773
.637
.777
.847
.888
.845
.697
.770
.790
.843
.941
.913
.854
.834
.831
.786
.757
.837
.729
.748
.583
.641
SS6ess6.773
ProductQuality
ProductAvail.
ServiceQuality
StoreLayout
Service-scape
Total RetailExperience
.730
.737
.716
.740
.791
1.0
1.0
1.0
1.0
1.0
1.0
epqf
epaf
esqf
eslf
essf
169
Several interesting items emerge from the results illustrated above. It appears that
customers do form a holistic impression of their shopping experience that is multi-faceted
in nature. Total retail experience is a much more comprehensive construct of the
shopping experience than traditional service quality scales such as SERVQUAL and
SYSTRA-SQ. The results indicate that variables that are often overlooked in empirical
studies, for example, servicescape, store layout and merchandise accessibility, do play a
meaningful role in shaping customer perceptions of the retailer. Intuitively, this result
makes sense. It is of no use to customers if a retailer excels in service quality and has
tremendous product quality but lacks product availability and selection.
It also appears that the five dimensions are nearly equally weighted by customers
when forming impressions of the retailer; the second order factor loadings range from
0.716 to 0.790. Only one pair of confidence intervals do not overlap – servicescape, 95%
confidence interval of (0.765, 0.817), is weighted more heavily than service quality, 95%
confidence interval of (0.686, 0.746). This result suggests that resource allocation should
be spread fairly evenly across the five dimensions. For this particular retailer, excessive
investment in one dimension should not come at the expense of another.
The analysis of total retail experience yields two major contributions to the
literature. First, it provides a comprehensive statistical analysis of the composition of the
second order construct. Terblanche and Boshoff (2001 a, b) are the first to study the
concept but they do so only at a dimensional level. They fail to test whether their
dimensions of total retail experience converge to form a second order factor. This
weakness leaves the reader guessing whether Terblanche and Boshoff’s (2001 a, b)
170
dimensions do indeed form a convergent higher level factor or whether they are simply
independent, uncorrelated dimensions. Moreover, the dimensions used in each of the two
studies are not consistent. Furthermore, the customer portion of the service profit chain
used in this study will show the causal structure behind the relationship between internal
service quality, value, customer satisfaction and customer loyalty. Examining this
structure will provide deeper insight into the nomological network of customers’
impressions of the retail experience.
The second contribution is the validation, as a whole, of a more comprehensive
model of customers’ perceptions of their retail experience. In general, service
management literature is lacking just such a factor. Researchers have been using service
quality constructs as a surrogate, but the constructs are too narrowly defined to capture
the essence of the total retail experience. Using hierarchical regression, we test whether
our five total retail dimensions can better explain variance in customer satisfaction than
traditional service quality measures. If the added dimensions can explain significantly
more variance than the traditional measures then it may be a worthwhile pursuit for future
customer satisfaction researchers. At the first level of the hierarchy, customer
satisfaction (dependent variable) is regressed on Gronroos’ (1984, 1997) traditional
product quality/process quality definition of service quality, represented in our model by
the product quality and service quality constructs. The second stage of the hierarchy
involves adding the unique total retail experience dimensions: product availability, store
layout and servicescape. The regression equations for the two stages are listed below:
Step 1: Customer Satisfaction = _1 * Product Quality + _2 * Service Quality + _
171
Step 2: Customer Satisfaction = _1 * Product Quality + _2 * Service Quality +_3 * Servicescape + _4 * Store Layout + _5 * Product Availability andSelection + _
Scores for the five total retail experience factors and the customer satisfaction factor
needed to be created. Scores are generated using both a summated scores approach and a
factor scores methodology. Results are similar using both methodologies, thus only the
factor score method results are provided. The results are given in Table 5.5.
Before performing hierarchical regression, it is necessary to test for multi-
collinearity between the independent variables. The most common methodology used is
calculating variance inflation factor for each variable. This method measures how much
variance in each independent variable can be explained by the group of other independent
variables that are to be used in the regression analysis. A variance inflation factor of over
10.0 indicates that there may be problems with multi-collinearity (Myers, 1990). The
variance inflation factors for each of the independent variables used in this study are:
1.538 for product quality, 1.639 for service quality, 1.501 for product availability, 1.911
for store layout and 1.909 for servicescape. These values are well below 10.0 and
indicate there is no cause for concern of multi-collinearity.
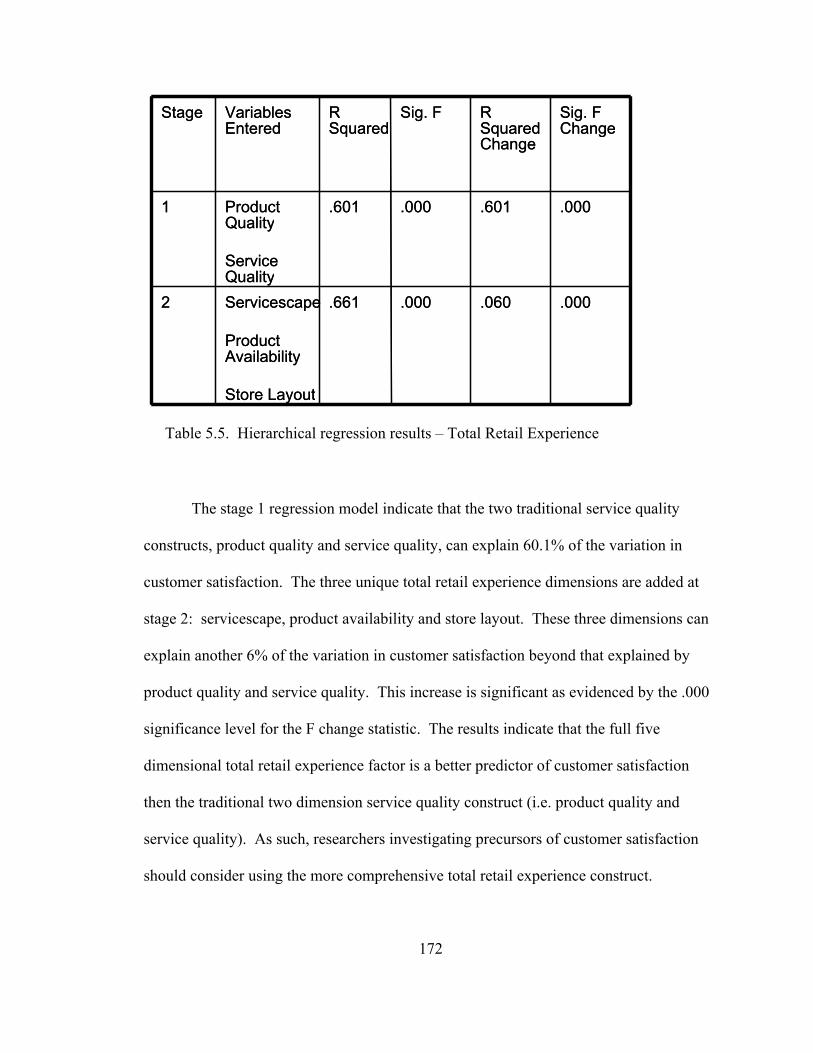
172
The stage 1 regression model indicate that the two traditional service quality
constructs, product quality and service quality, can explain 60.1% of the variation in
customer satisfaction. The three unique total retail experience dimensions are added at
stage 2: servicescape, product availability and store layout. These three dimensions can
explain another 6% of the variation in customer satisfaction beyond that explained by
product quality and service quality. This increase is significant as evidenced by the .000
significance level for the F change statistic. The results indicate that the full five
dimensional total retail experience factor is a better predictor of customer satisfaction
then the traditional two dimension service quality construct (i.e. product quality and
service quality). As such, researchers investigating precursors of customer satisfaction
should consider using the more comprehensive total retail experience construct.
.000.060.000.661Servicescape
ProductAvailability
Store Layout
2
.000.601.000.601ProductQuality
ServiceQuality
1
Sig. FChange
RSquaredChange
Sig. FRSquared
VariablesEntered
Stage
.000.060.000.661Servicescape
ProductAvailability
Store Layout
2
.000.601.000.601ProductQuality
ServiceQuality
1
Sig. FChange
RSquaredChange
Sig. FRSquared
VariablesEntered
Stage
Table 5.5. Hierarchical regression results – Total Retail Experience
173
5.3.2. Linearity between customer satisfaction and customer loyalty
One of the assumptions of structural equation modeling is that the relationships
between all variables in the model are linear. There has been much research into one
specific link in the chain that indicates the possible existence of non-linearity – the link
between customer satisfaction and customer loyalty. Some researchers believe this
relationship is non-linear in that very high levels of customer satisfaction can lead to
abnormally high levels of customer loyalty. Jones and Sasser (1995) conducted research
for the Xerox company and found that “very satisfied” customers are six times more
likely to re-purchase then “satisfied” customers. Fornell (1992) has similar findings in
the retail clothing industry. Anderson and Mittal (2000) use consumer information
search theory to explain the potential non-linear effect in their research, in essence,
claiming that once satisfaction reaches a certain level, consumers will no longer consider
alternative suppliers, resulting in dramatic increases in future purchase patterns. There is
roughly an equal amount of research that investigates the relationship between
satisfaction and loyalty and conclude that it is linear (Soderlund, 1998; Taylor and
Hunter, 2002).
Because there has yet to be a definitive conclusion to this debate, this research
will take an overtly conservative approach and test whether the link between customer
satisfaction and customer loyalty is indeed linear in the data obtained at the primary data
collection stage. The most common way to test whether a relationship between two
variables is linear is to use hierarchical regression. Specifically two forms on non-
linearity will be tested – a quadratic effect and a cubic. Prior evidence has shows that
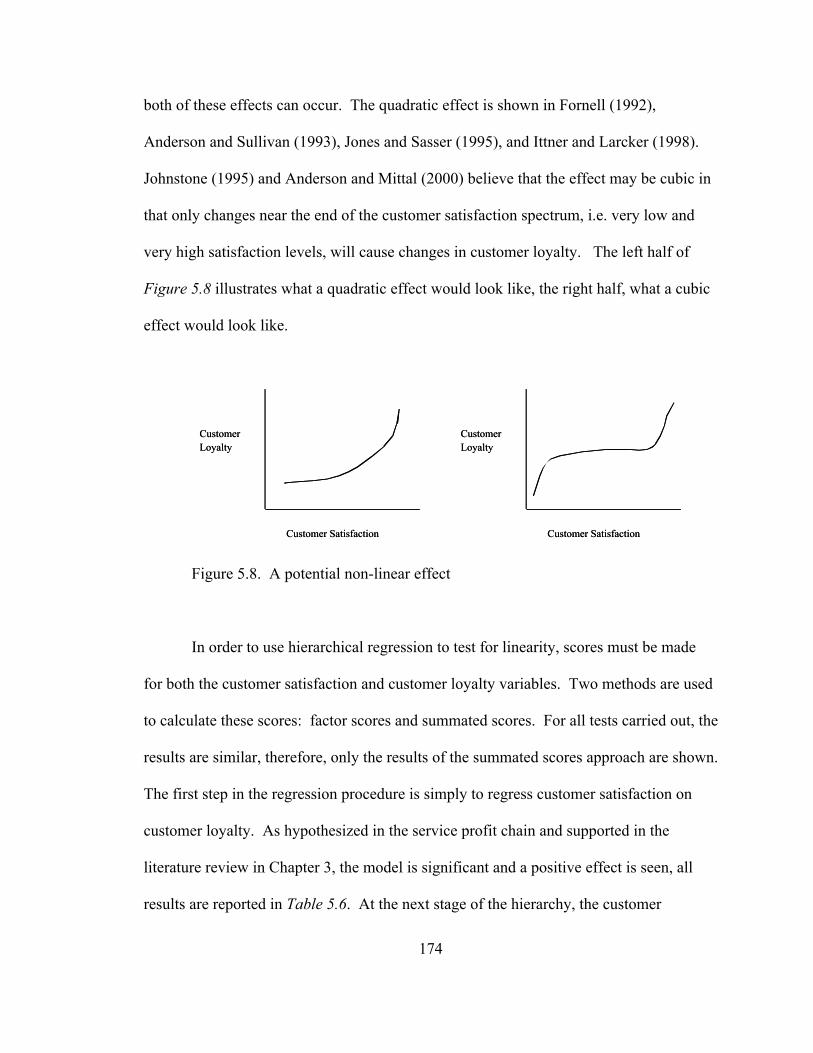
174
both of these effects can occur. The quadratic effect is shown in Fornell (1992),
Anderson and Sullivan (1993), Jones and Sasser (1995), and Ittner and Larcker (1998).
Johnstone (1995) and Anderson and Mittal (2000) believe that the effect may be cubic in
that only changes near the end of the customer satisfaction spectrum, i.e. very low and
very high satisfaction levels, will cause changes in customer loyalty. The left half of
Figure 5.8 illustrates what a quadratic effect would look like, the right half, what a cubic
effect would look like.
Customer Satisfaction
Customer Loyalty
Customer Satisfaction
Customer Loyalty
Customer Satisfaction
Customer Loyalty
Customer Satisfaction
Customer Loyalty
Figure 5.8. A potential non-linear effect
In order to use hierarchical regression to test for linearity, scores must be made
for both the customer satisfaction and customer loyalty variables. Two methods are used
to calculate these scores: factor scores and summated scores. For all tests carried out, the
results are similar, therefore, only the results of the summated scores approach are shown.
The first step in the regression procedure is simply to regress customer satisfaction on
customer loyalty. As hypothesized in the service profit chain and supported in the
literature review in Chapter 3, the model is significant and a positive effect is seen, all
results are reported in Table 5.6. At the next stage of the hierarchy, the customer
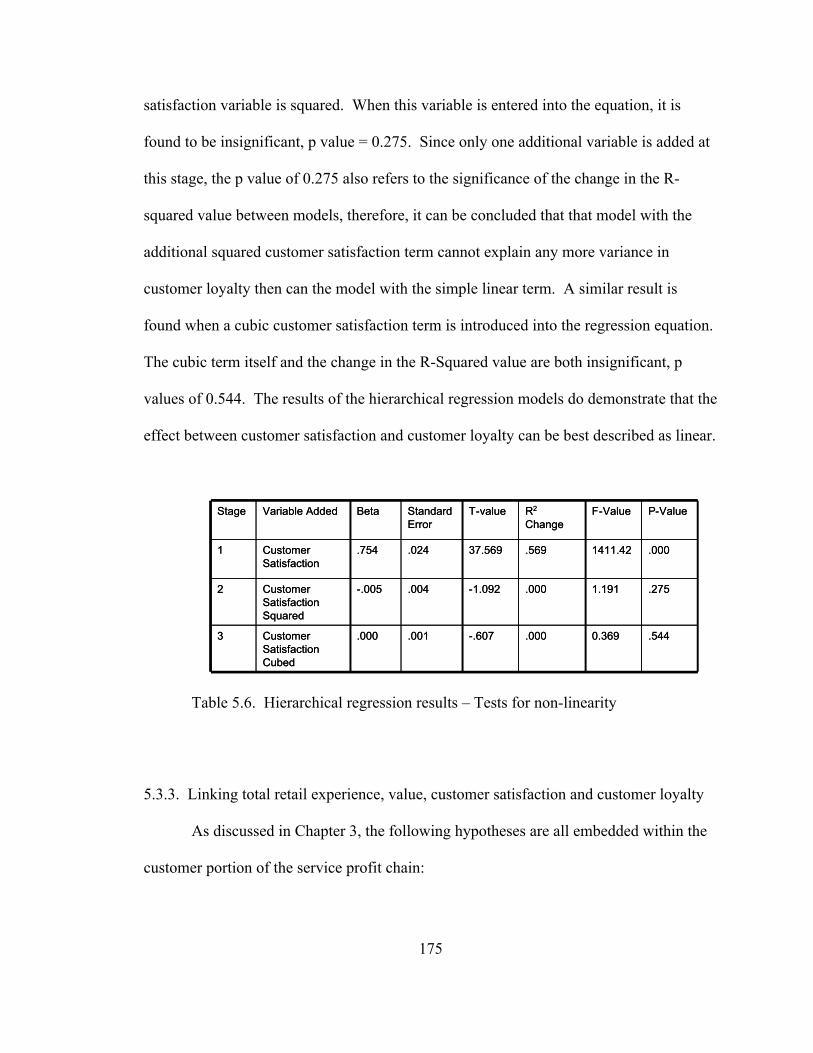
175
satisfaction variable is squared. When this variable is entered into the equation, it is
found to be insignificant, p value = 0.275. Since only one additional variable is added at
this stage, the p value of 0.275 also refers to the significance of the change in the R-
squared value between models, therefore, it can be concluded that that model with the
additional squared customer satisfaction term cannot explain any more variance in
customer loyalty then can the model with the simple linear term. A similar result is
found when a cubic customer satisfaction term is introduced into the regression equation.
The cubic term itself and the change in the R-Squared value are both insignificant, p
values of 0.544. The results of the hierarchical regression models do demonstrate that the
effect between customer satisfaction and customer loyalty can be best described as linear.
0.369
1.191
1411.42
F-Value
-.607
-1.092
37.569
T-value
.544.000.001.000Customer Satisfaction Cubed
3
.275.000.004-.005Customer Satisfaction Squared
2
.000.569.024.754Customer Satisfaction
1
P-ValueR2
ChangeStandard Error
BetaVariable AddedStage
0.369
1.191
1411.42
F-Value
-.607
-1.092
37.569
T-value
.544.000.001.000Customer Satisfaction Cubed
3
.275.000.004-.005Customer Satisfaction Squared
2
.000.569.024.754Customer Satisfaction
1
P-ValueR2
ChangeStandard Error
BetaVariable AddedStage
Table 5.6. Hierarchical regression results – Tests for non-linearity
5.3.3. Linking total retail experience, value, customer satisfaction and customer loyalty
As discussed in Chapter 3, the following hypotheses are all embedded within the
customer portion of the service profit chain:
176
H2a: Total retail experience is positively associated with value.
H2b: Total retail experience is positively associated with customersatisfaction.
H2c: Value is positively associated with customer satisfaction.
H2d: Customer satisfaction is positively associated with customerloyalty.
The structural equations will test each of these hypotheses independently as well as
testing the overall fit of the customer portion of the service profit chain.
The structural framework tested along with the results are illustrated in Figure
5.9. Due to spatial limitation the individual indicators for the five total retail experience
dimensions are omitted from the diagram. As noted earlier, the variances of all latent
variables are set to 1.0 for identification purposes, rectangles represent indicators and
ovals represent latent variables. All path coefficients are significant at the p<.001 level.
More detailed results are presented in tabular format in Table 5.7.
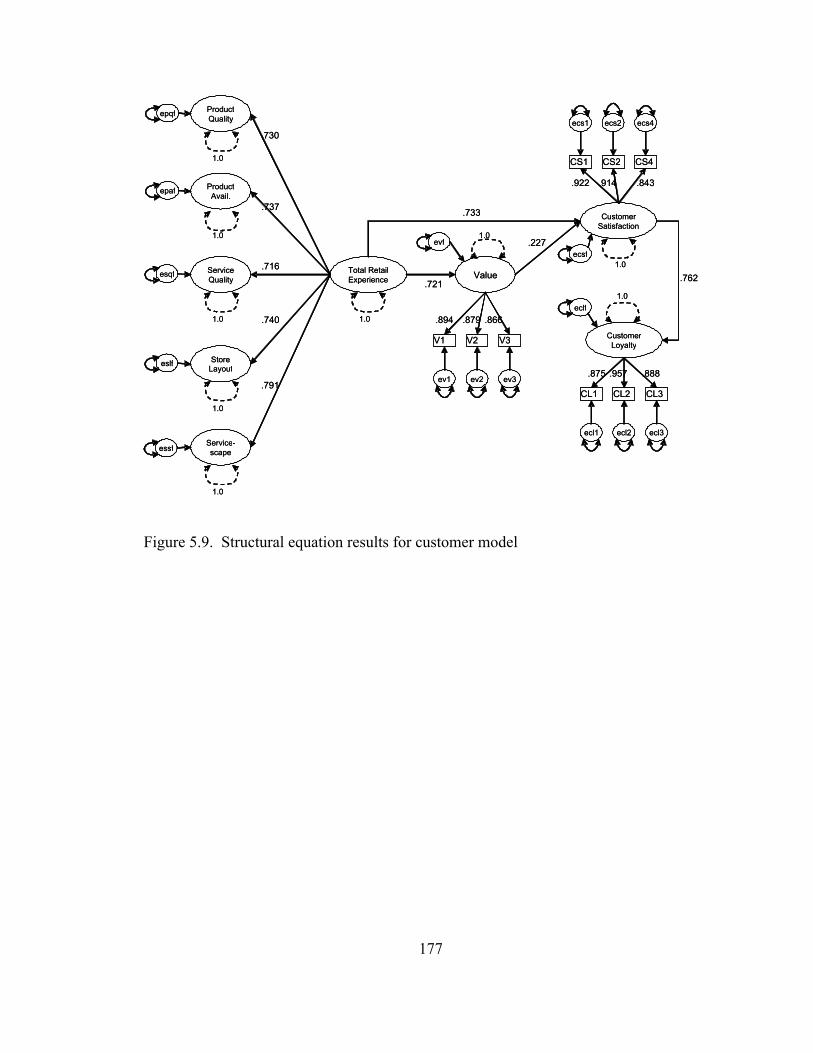
177
Figure 5.9. Structural equation results for customer model
ProductQuality
ProductAvail.
ServiceQuality
StoreLayout
Service-scape
1.0
1.0
1.0
1.0
1.0
Total RetailExperience
essf
eslf
esqf
epaf
epqf
1.0
Value
CustomerSatisfaction
CustomerLoyalty
1.0
1.0
1.0
evf
ecsf
eclf
V1 V2 V3
ev1 ev2 ev3
CL1 CL2 CL3
ecl1 ecl2 ecl3
CS1 CS2 CS4
ecs1 ecs2 ecs4
.730
.737
.716
.740
.791
.721
.733
.227
.762
.894 .879 .866
.922 .914 .843
.875 .957 .888
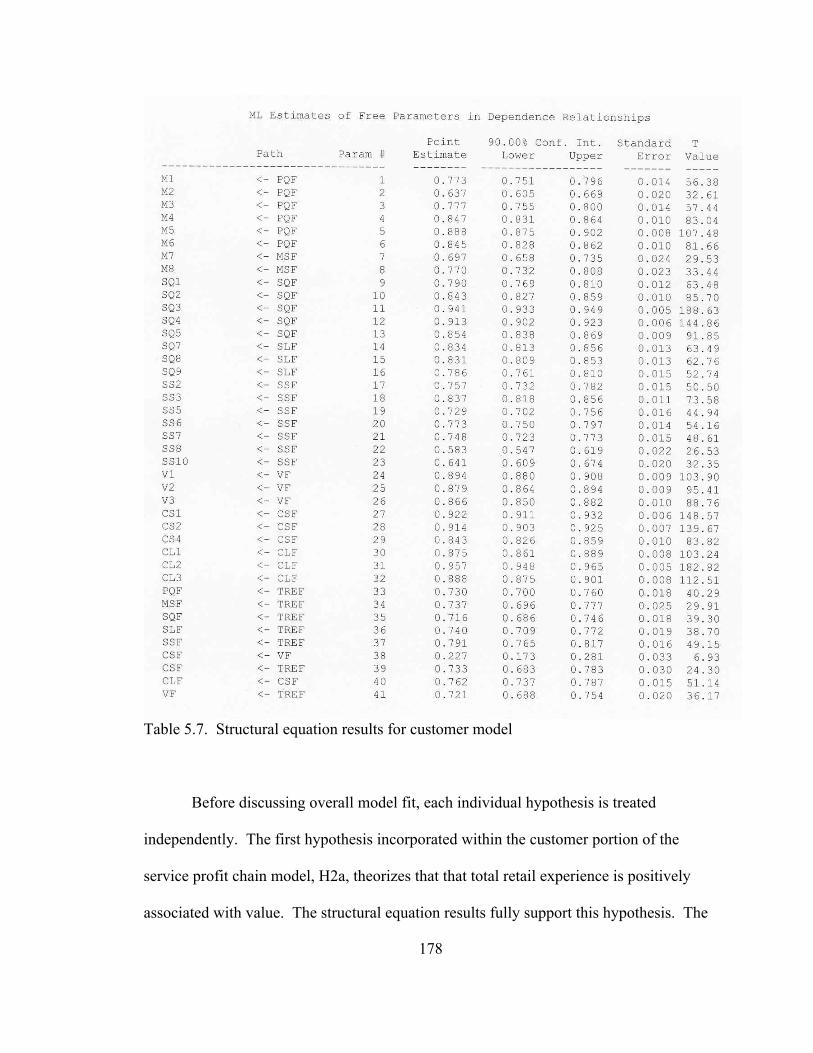
178
Table 5.7. Structural equation results for customer model
Before discussing overall model fit, each individual hypothesis is treated
independently. The first hypothesis incorporated within the customer portion of the
service profit chain model, H2a, theorizes that that total retail experience is positively
associated with value. The structural equation results fully support this hypothesis. The
179
path coefficient between value and total retail experience is 0.721, its associated 90%
confidence interval is (0.688, 0.754). The standard error of the path estimate is 0.020,
resulting in a t value of 36.17, which is significant at the p < .001 level. This finding
supports Terblanche and Boshoff’s (2001 a, b) preliminary work on total retail
experience. Customers assess the overall quality of their shopping experience, captured
in the total retail experience construct, and use it as a basis of judging the value they
receive. If you recall, the most common definition of value is total benefits divided by
total costs. The five dimensions of total retail experience can all be viewed as adding
value to the customer’s shopping experience, hence improving the benefits to cost ratio.
Each one of these dimensions has been individually linked to value/satisfaction in the
past, however, this work, along with Terblanche and Boshoff’s work (2001 a, b) begins to
show how the five dimensions interact and collectively influence customer’s service
experience assessments.
The second hypothesis embedded within the customer model, H2b, is similar to
the one treated above, namely, that total retail experience has a positive association with
customer satisfaction. The results of the structural equation model support this
hypothesis. The path coefficient between the two variables is 0.733, with a 90%
confidence interval of (0.683, 0.783). The standard error of this path estimate is 0.030
resulting in a t value of 24.30 which is significant at the p < .001 level. Again, much
previous research has linked the five dimensions of total retail experience to customer
satisfaction, but this research is one of the first to take such a comprehensive view of
customers’ assessments of their shopping experience.
180
Taken together these two initial findings lend validity to the fairly new concept of
total retail experience. Although still in its infancy stage, the total retail experience
construct draws from many proven service management/marketing concepts: store
shopping experience (V10), store image/personality (Martineau, 1958; Lindquist, 1974;
Stanley and Sewell, 1976; Zimmer and Golden, 1988), servicescape (Bitner, 1990) and
service quality (Gronroos, 1984). These findings demonstrate that tangible aspects of the
shopping experience (e.g. product quality, servicescape) combine with tacit aspects (e.g.
service quality) to influence not only customer assessment of the service organization, i.e.
value received, but also customer attitude, i.e. satisfaction, and as we shall see in the
latter hypotheses, ultimately, customer behavior, i.e. loyalty.
A positive relationship also exists between value and customer satisfaction, as
indicated by the 0.227 path coefficient between the two variables, 90% confidence
interval of (0.173, 0.281). The standard error of this path estimate is 0.033, yielding a t
value of 6.93 which is significant at the p < .001 level. This finding provides full support
for hypothesis H2c. The results confirm that which relationship value marketing
proponents argue: providing a high quality total retail experience, is not enough; it must
also be done at a reasonable cost (Heskett et al, 2001). Consumers are only willing to
pay so much for advancements in quality or servicescape. There will eventually become
a point where improvements to the service delivery process and/or consumer benefit
package come at too high an expense. However, it is also important to note, that in a
specialty niche retail environment, like the one studied in this research, value is not
nearly as effective a predictor of customer satisfaction as the shopping experience itself
is, as evidenced through the 0.733 coefficient versus the 0.227 coefficient. This result
181
was certainly expected for this retailer. In this retail environment, servicescape and
service quality are considered to be the key order winners with value/price playing a
much more subservient order qualifying role.
This research validates one of the most well established links in marketing, the
relationship between customer satisfaction and customer loyalty. As evidenced by the
path coefficient of 0.762, the relationship between these two factors is very strong; in
fact, it is the strongest relationship of all those studied in this research. The 90%
confidence interval for this path estimate is (0.737, 0.787). The standard error of the
estimate, 0.015, results in a t value of 51.14, which is significant at the p < .001 level.
These findings lend support for hypothesis H2d. Customers who are satisfied with their
shopping experience are likely to remain loyal to the organization and exhibit behaviors
such as continued purchases of primary products, increased purchases of ancillary
products and a willingness to recommend the organization to family and friends. Indeed,
in past research, customer satisfaction has been shown to be the best predictor customer
loyalty (Mittal and Lasser, 1998).
Model fit is again assessed through the comprehensive guidelines suggested by
Hu and Bentler (1998). Table 5.8 summarizes the values of several different fit indices
for the customer model.
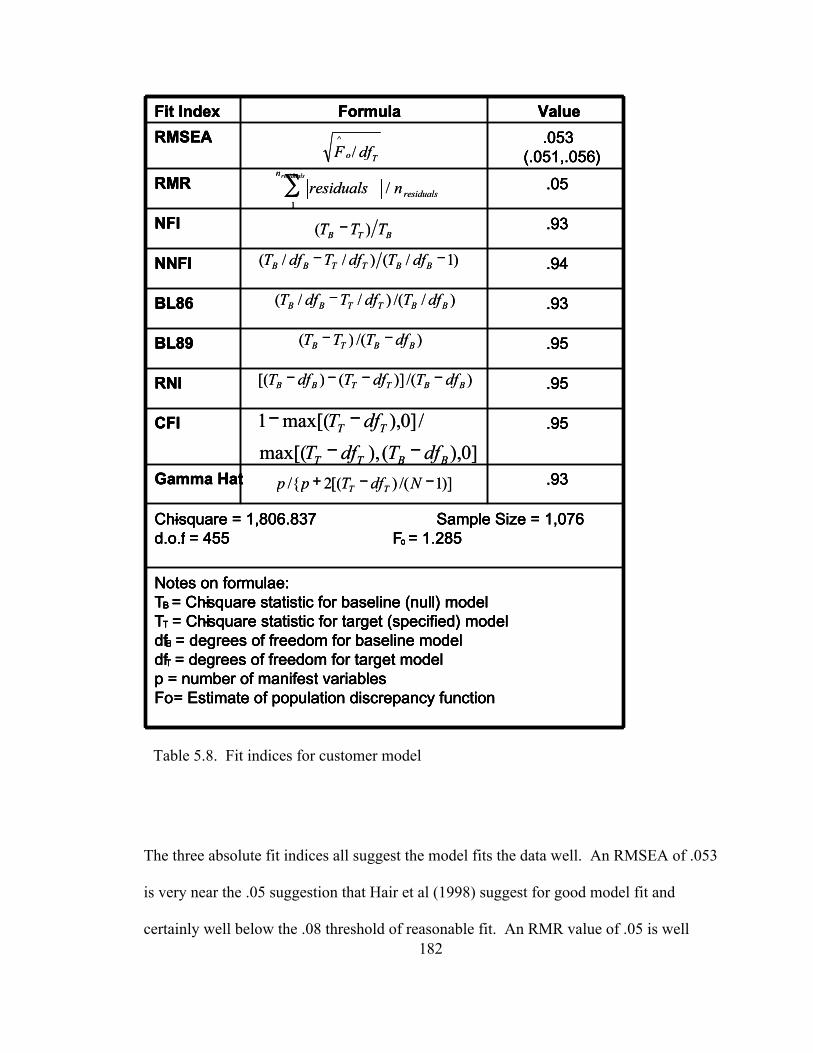
182
The three absolute fit indices all suggest the model fits the data well. An RMSEA of .053
is very near the .05 suggestion that Hair et al (1998) suggest for good model fit and
certainly well below the .08 threshold of reasonable fit. An RMR value of .05 is well
BTB TTT )( −
)1/()//( −−BBTTBB dfTdfTdfT
)//()//( BBTTBB dfTdfTdfT −
)/()( BBTB dfTTT −−
)/()]()[( BBTTBB dfTdfTdfT −−−−
]0),(),max[(
/]0),max[(1
BBTT
TT
dfTdfT
dfT−−
−−
)]1/()[(2/{ −−+ NdfTpp TT
To dfF /^
residuals
n
nresidualsresiduals
/1
∑
Chi-square = 1,806.837 Sample Size = 1,076d.o.f. = 455 Fo = 1.285
Notes on formulae:TB = Chi-square statistic for baseline (null) modelTT = Chi-square statistic for target (specified) modeldfB = degrees of freedom for baseline modeldfT = degrees of freedom for target modelp = number of manifest variablesFo= Estimate of population discrepancy function
.93Gamma Hat
.95CFI
.95RNI
.95BL89
.93BL86
.94NNFI
.93NFI
.05RMR
.053(.051,.056)
RMSEA
ValueFormulaFit Index
Table 5.8. Fit indices for customer model
183
below Chau’s (1997) recommended value of 0.10. The gamma hat value for this model
is 0.93, above the suggested 0.90 cutoff (Steiger, 1989). The three absolute measures
indicate that the model is able to reproduce adequately the sample covariance matrix. All
six of the incremental fit measures are above the suggested 0.90 threshold; in fact, the
lowest value is 0.93. The incremental models suggest that the proposed employee model
can fit the data better than a null or baseline model. Collectively, these nine measures
thoroughly demonstrate that the proposed customer model does fit the data well.
It is from this analysis that we find support for the customer portion of the service
profit chain. Specifically, the results support Heskett et al’s (1994, 1997, 2001) assertion
that customers form a holistic impression of their shopping experience. The key
components of the shopping experience include product quality, service quality, product
availability, store layout and servicescape. A customer’s shopping experience has both a
direct influence on the customer’s satisfaction as well as an indirect effect through its
relationship with perceived value. Customer satisfaction then in turns drives customer
loyalty. And if we are to incorporate the extensive research into theories such as
defensive marketing (Fornell & Wernerfelt, 1987), customer lifetime value (Rust et al,
2001), the balanced scorecard (Kaplan and Norton, 1992, 2001), defection analysis
(Reicheld and Sasser, 1990; Reicheld, 1996) and the service profit chain itself (Heskett et
al, 1994, 1997, 2001) the entire customer model will drive business results.
The structural equation analysis of the customer portion of the service profit chain
provides several contributions to service management literature. It is the most
comprehensive study to date of the linkages between total retail experience, value,
customer satisfaction and customer loyalty. It expands upon relationship value
184
management literature in its broad operationalization of total retail experience. Much of
the value literature takes a more simplistic approach to defining value, simply using cost
and quality to define a ratio. In a similar vein, most quality researchers omit the value
variable from their studies altogether, assuming quality improvements do not need to be
justified on a cost basis.
In validating the latter half of Heskett et al’s (1994, 1997) service profit chain
model, the results of this study demonstrate that in a specialty niche retail environment,
total retail experience is a much stronger predictor of customer satisfaction than value is.
Customers are clearly willing to “pay” extra for an enjoyable shopping experience. In
this service setting orders are not won through low cost, but rather, through
individualized service within a pleasant surrounding. As the factor’s label suggests,
customer orders are won by their total experience of shopping at the retailer. Service
management literature has yet to identify specific settings were this phenomenon occurs.
This study can serve as the grounds for future researchers to expand upon, replicating the
study in other types of service settings.
Another major contribution this research makes is presenting evidence for the
nomological validity of two newly constructed scales: servicescape and total retail
experience. The analysis in chapter 4 shows that the constructs are reliable and that they
exhibit several types of validity. The analysis presented in section 5.3.2 shows that both
of these constructs behave in a predictable fashion within a service management network.
Total retail experience, hence all its components as well, is positively associated with
customer satisfaction and value, as would be expected. The relationships among these
185
variables indicate that the constructs exhibit nomological validity; something which
previous literature has yet to establish.
5.4. Summary
The first section within this chapter, section 5.1, discusses the reasons why
structural equation modeling was chosen as the data analytic tool for this research. The
primary reasons include the ability of structural equation modeling to incorporate latent
variables, to allow for a single variable to act as both a dependent and independent
variable and to determine both direct and indirect structural effects. A primary concern
when using structural equation modeling is to obtain a large enough sample size to
achieve reasonable power. As discussed at the end of section 5.1, the power of both of
the models used in this research approaches 1.0.
Section 5.2 investigates the first portion of the service profit chain, a portion we
call “the employee model”. Five hypotheses are embedded within the employee model:
H1a: Internal service quality is positively associated with employee satisfaction.
H1b: Internal service quality is positively associated with employee loyalty.
H1c: Employee satisfaction is positively associated with employee loyalty.
H1d: Employee satisfaction is positively associated with employee productivity.
H1e: Employee loyalty is positively associated with employee productivity.
Before testing these hypotheses it was necessary to analyze the second order
measurement model that comprised internal service quality. Section 5.2.1 demonstrates
that internal service quality is an eight dimensional factor consisting of: training and
coaching, goal management, teamwork, empowerment, support - management, support –
186
tools, and rewards and recognition. All eight dimensions exhibit significant loadings
onto the second order internal service quality construct.
Section 5.2.2 uses structural equation modeling to test the five hypotheses
described above. There is empirical evidence to support the first three hypotheses, H1a,
H1b and H1c, but no evidence for the latter two, H1d and H1e. In summary, internal
service quality is positively associated with employee satisfaction and employee loyalty.
Employee satisfaction, in turn, is positively associated with employee loyalty. No
relationships are found between employee satisfaction and employee productivity nor
between employee loyalty and employee productivity. As such, the employee
productivity is dropped from the analysis and the overall fit of the revised model is
assessed. Chapter 6 expounds upon these findings.
The organization of section 5.3 closely resembles that of section 5.2 only it looks
at the second half of the service profit chain – the customer model. Embedded within this
portion of the service profit chain are four hypotheses:
H2a: Total retail experience is positively associated with value.
H2b: Total retail experience is positively associated with customer satisfaction.
H2c: Value is positively associated with customer satisfaction.
H2d: Customer satisfaction is positively associated with customer loyalty.
The first sub-section, section 5.3.1, shows the construction of the second order construct
total retail experience. This factor is shown to be five dimensional: product quality,
service quality, product availability and selection, store layout and servicescape.
Hierarchical regression demonstrates that this five dimensional construct is a stronger
187
predictor of customer satisfaction than Gronroos’ (1984) traditional measure of service
quality.
In section 5.3.3, the structural equation results confirm all four hypotheses
embedded within the service customer portion of the service profit chain. Moreover, the
overall fit indices indicate that the service profit chain model fits the survey data well.
The section ends with a summary of both the academic and managerial contributions of
testing the customer model.
188
CHAPTER 6
SUMMARY AND FUTURE RESEARCH
6.1. Research objectives
The primary objective of this research is to determine the most important drivers
of specialty retail store performance and to illuminate the path through which these
drivers affect operational and marketing performance measures. The study uses the
service profit chain as an organizing framework to research the drivers, and this work
will thus empirically test the validity of the service profit chain theory. In order to meet
the primary objective, several supporting objectives had to be developed. First, two new
multi-dimensional second order factors had to be created: internal service quality, a
factor measuring the internal working environment of the retail outlets, and total retail
experience, a comprehensive customer assessment factor. Second, as well as creating
these new higher order factors, this study must incorporate constructs that have been
developed outside of the service management discipline, e.g. support – management,
work design, value, etc. Finally, before a survey could be constructed to measure the
concepts laid forth in the service profit chain an extensive interdisciplinary literature
review was needed. Extent theory from various disciplines, e.g. marketing, human
resource management, personnel psychology, etc, was analyzed and parallels were drawn
189
as to how well-established theory from these other disciplines can be used to verify the
content validity of the service profit chain itself.
6.2. Overview of this study
This study represents one of the first attempts to empirically validate the service
profit chain theory within one setting. Despite an impressive body of theoretical and
anecdotal evidence supporting service profit chain theory, there has been little headway
made into empirically validating its tenets. Of the empirical studies to date, this research
builds the most comprehensive measurement model (Loveman, 1998; Silvestro and
Cross, 2001; Kamarkura et al, 2002). It is also the first to adapt well-established, highly
validated scales from other disciplines in order to build the service profit chain model.
The introductory chapter begins with a visual illustration of the service profit
chain model. Each of the hypotheses embedded within the model are briefly treated from
a managerial perspective. A list of anecdotal support, Table 1.1, helps give some
intuitive insights into the theory itself. The chapter then discusses the primary motivation
for this research: to help a women’s specialty fashion retail chain determine the most
important drivers of retail store performance. From this practitioner-oriented motivation,
an academic motivation is born – the desire to fill a notable gap in academic literature on
service management. As pointed out earlier, previous empirical studies of the service
profit chain have not used comprehensive and refined measurement scales. Section 1.2
details the objectives that stem directly from the motivations; they are also summarized
above in section 6.1. Nine research hypotheses, all extracted directly from the service
profit chain model, are extended in section 1.3. Research methodology, from instrument
190
development to data analysis, is then summarized in section 1.4. Chapter 1 ends with a
summary of the layout of the remainder of the dissertation.
Because of the fullness of the task, two chapters are dedicated to literature review.
This first chapter, chapter 2, begins with a discussion of the literature that examines the
entire service profit chain model collectively. A review of theoretical and anecdotal work
is followed by a discussion of empirical research. The remaining substantive sections of
chapter 2, sections 2.2 through 2.3, review research into what Heskett et al (1994) call the
“operating strategy and service delivery system” –in this work simplified to “employee
model.” These sections explore the following constructs: internal service quality,
employee satisfaction, employee loyalty and employee productivity. Each construct is
first looked at independently and, when possible, parallels are drawn to similar constructs
from other disciplines. Research dedicated to analyzing the links between constructs is
then reviewed. The chapter ends with a brief summary, including a restatement of the
first five hypotheses.
Chapter 3 is dedicated to reviewing the second half of the service profit chain, or
as Heskett et al (1994) call it, the “Service Concept” and “Target Market” sections, in this
research referred to as the “customer model”. The first section within this chapter
reviews the total retail experience construct. Since the construct is still in its infancy,
parallels are drawn to other customer assessment/valuation frameworks, such as
Gronroos’ (1984) technical / functional quality schema. Each of the five dimensions of
total retail experience is then analyzed independently. The next section of the review
explores research focused on customers’ perceptions of service value. Customer
satisfaction and loyalty literature is then detailed. The chapter ends with a summary that
191
ties a thread through all the constructs and summarizes the four testable hypotheses
embedded within the customer model.
The first portion of chapter 4 is devoted to describing the population frame and
sampling plans of this research. One large women’s specialty fashion merchandiser is
chosen as the population frame. This selection has both advantages and disadvantages, as
described in section 4.2. Five retail locations in Ohio were chosen to partake in the pilot
study. In total, fifty employee surveys were gathered, and sixty two customer surveys
were collected, resulting in response rates of 77% and 25% respectively. Ninety stores
located throughout the entire U.S. represent the main sampling frame. In total, 872
employee surveys and 1,076 customer surveys were collected from these stores, yielding
response rates of 65% and 24%. Before the measurement model is addressed,
exploratory data analysis is conducted. Factor development is then done on the pilot
study constructs – reliability assessment, uni-dimensionality, and convergent and
divergent validity. A few minor modifications are made. The changes appear successful
when the factors are analyzed using the main data. The chapter ends with a summary that
includes the managerial and academic contributions of the measurement model.
Chapter 5 begins with a description of structural equation modeling, including a
discussion of why it is most appropriate for this study. The remaining portion of the
chapter is dedicated to describing the results of two structural equation models – the
employee model and the customer model. The individual paths within each model are
analyzed, in essence testing the nine hypotheses introduced in the introductory chapter.
The overall model fit of the two models is then discussed, testing the two halves of the
192
service profit chain model from a more macroscopic view. The chapter ends with a
discussion of the contributions, both academic and applied, of this research.
6.3. Summary of research findings
The summary of the research findings will be organized in a similar way to their
presentation in the body of this dissertation: the findings of the main study measurement
models will be presented first, followed by a review of the structural equation modeling
results.
Internal Service Quality Construct -- As stated in chapter 4, two new second order factors
needed to be developed for this research – internal service quality and total retail
experience. An exhaustive literature review identifies the eight most important operating
policies that can impact employee satisfaction, productivity and loyalty: training and
coaching, goal management, empowerment, work design, support – management, support
– tools, and rewards and recognition. Each of these eight dimensions is developed
individually through both a pilot study and a main study. Furthermore, this research is
the first to test rigorously whether these eight dimensions converge to form a single
reliable and valid second order construct, section 5.2.1. Of the eight dimensions, the
following four proved to have the most significant impact in terms of magnitudue on
employee satisfaction: training and coaching, goal management, organizational support –
management and organizational support – tools. So when faced with limited budgets,
firms will find that increasing any of these four areas will have the greatest impact on
employee outcome measures such as satisfaction and loyalty.
193
Total Retail Experience Construct – The discussion put forward in chapter 3 notes a
significant lack of development in the service management literature in reference to a
comprehensive customer assessment construct, as such, a new construct is developed –
total retail experience. Much previous research focused exclusively on product and
process quality within service organizations. This research expands upon that view by
incorporating three additional concepts into the customer assessment framework: product
availability and selection, store layout and servicescape. The measurement model in
chapter 4 demonstrates that the five total retail experience dimensions are individually
reliable and valid. Moreoever, section 5.3.1 shows that the five dimensions do converge
to form a single reliable and valid second order construct. Although the three additional
constructs added into the assessment mix in this study have been thoroughly examined
and validated in other research (e.g. Bitner’s (1992) work on the servicescape), this study
is the first to show how they interact with the traditional service quality / product quality
framework. Furthermore, the hierarchical regression results demonstrate that the total
retail experience construct can explain a significantly larger percentage of variance in
customer satisfaction then traditional assessement frameworks such as the technical /
functional quality schema developed by Gronroos (1984). Service management
researchers can incorporate the total retail experience construct into future studies that
explore how customes assess a firms product and service offering – the assessment is
clearly more comprehensive than traditional scales lead one to believe.
194
In addition to assessing the overall fit of the service profit chain models, nine
embedded hypotheses were tested. Of the nine, the following seven were fully supported.
H1a: Internal service quality is positively associated with employee satisfaction.
Service organizations can boost the overall satisfaction level of their employees by
providing their employees with an excellent working environment, valuing the
employees’ contributions and investing in their development. This finding is key
because it shows that employee satisfaction can be improved by programs aimed at
increasing business performance (e.g. training and coaching, goal management, etc) and
not just programs aimed at short term employee satisfaction, such as increased pay. As
Heskett et al (1994, 1997) suggest, employees are happier when they can truly help
customers.
H1b: Internal service quality is positively associated with employee loyalty. Human
resources practices such as enhanced training efforts, focus on teamwork, employee
empowerment programs (and the rest of the internal service quality elements) signal to
employees that their organizations’ value their personal development and as such feel
induced to return the benefits they have received (Homans, 1961; Blau, 1964). One way
employees repay the organization is through increased loyalty, manifested in work
tenure. Much like the results of hypothesis H1a, this finding indicates that service
organizations can reap both direct and indirect benefits from investing in employee
development.
195
H1c: Employee satisfaction is positively associated with employee loyalty. Quite simply
employees who are satisfied with their working environment are more likely to remain
with organization than employees who are dissatisfied. Intuitively, this result makes
sense and supports much of the satisfaction literature reviewed in Chapter 2 – satisfaction
has always been shown to be the best direct predictor of loyalty (Petty, 1984).
H2a: Total retail experience is positively associated with value. Basically this theory
asserts that customers’ perceptions of value are based on their assessments of five
different store / service firm characteristics: product quality, service quality, product
availability and selection, store layout and servicescape. An improvement in any of
these five areas will have a positive effect on the perceived benefits that the customer
receives. As the benefits a customer receives increases, the ratio of benefits to cost, the
most common definition of value, will increase, hence, total retail experience increases a
customer’s perceived level of value received.
H2b: Total retail experience is positively associated with customer satisfaction.
Increases in product quality, service quality, product availability and selection, store
layout and/or servicescape will increase a customer’s overall level of satisfaction.
Moreover, as evidenced through their second order factor loadings, all five are nearly
equally weighted by customers. These results indicate that service organizations have
several options when trying to improve their operations; options that extend far beyond
improving their product’s quality or process quality.
196
H2c: Value is positively associated with customer satisfaction. Value is shown to be a
positive predictor of customer satisfaction. As customer’s benefit to cost ratio increases,
their satisfaction increases. It is interesting to note, that in the specialty retail
environment studied in this research, value plays a less important role in shaping
customers’ satisfaction than total retail experience does, as evidenced by the magnitude
of the path coefficients -- .227 vs. .733. This effect was not unexpected as the retail
chain’s strategy is NOT to win orders based on cost, but rather, to focus on issues such as
service quality, servicescape and brand image. The effect confirms what recent service
management strategists have suggested in their work on the “experience economy”,
namely, that competitive advantage can no longer be won simply by providing high
quality goods and/or friendly service, the total shopping experience must be superior
(Hill et al, 2001; Dahlke, 2002)
H2d: Customer satisfaction is positively associated with customer loyalty. As
relationship value marketing scholars have expounded for nearly two decades now,
keeping customers satisfied is the best way to ensure that they continue buying from you
in the future (Gronroos, 1997; Payne et al, 2001). Satisifed customers are less likely to
search for alternatives before making their next purchase. And as defensive marketing
theorists argue, customer loyalty is the best predictor of future business performance.
No empirical support was found for the following two hypotheses.
H1d: Employee satisfaction is positively associated with employee productivity.
H1e: Employee loyalty is positively associated with employee productivity.
197
We believe the lack of support for these hypotheses stems not from a truly insignificant
relationship among the variables but rather from the construction of the employee
productivity construct, section 5.2.2 details the limitations with the employee
productivity factor construction. Because of the difficulty with this construct, it is
dropped from the employee structural model before overall fit is assessed.
The overall fit statistics of the two service profit chain models are
comprehensively assessed using nine different fit indices. It is determined that both the
revised employee model and the customer model fit the data well – indicating support for
the underlying linkages within the service profit chain. Creating a supportive work
environment for employees, one that develops their skills and advancement potential, will
not only create more satisfied employees but also employees who are likely to remain
with the organization for extended periods of time. Furthermore, providing an
outstanding total retail experience will lead to an increase in customer perceptions of
value as well as customer satisfaction. Satisfied customers are then more likely to exhibit
loyalty traits such as continued future purchases and increased word of mouth referrals.
6.4. Research contributions
The contributions of this research will be divided into two separate categories:
academic contributions and managerial contributions. This separation is used strictly as
an organizing mechanism, we realize that there is substantial overlap between these two
categories but feel the benefit of added clarity outweighs all potential disadvantages.

198
6.4.1. Managerial contributions
In developing an internal service quality construct, section 5.1.1., this study can
be used as a resource allocation instrument for managers faced with limited budgets. The
study shows that employee satisfaction and loyalty can be increased by creating a
positive internal working environment. Moreover, the factor loadings associated with the
eight internal service quality dimensions can be interpreted as the weightings that specific
human resource practices have on shaping an employee’s overall satisfaction as well as
the employee’s intent to remain with the organization. Specifically, this research
demonstrates that employees value the following four internal service quality dimensions
most heavily: training and coaching, goal management, support – management and
support – tools. As such, managers faced with constrained resources will achieve the
biggest gains in employee satisfaction and loyalty by focusing on those four areas of
internal service quality. Furthermore, the structural equation results of section 5.2.2
verify Schlesinger and Heskett’s (1991) work on the employee cycle of failure / success.
Namely that employees are resources to be valued and maximized as opposed to costs to
be aggressively constrained. Rather than reducing front-line service jobs to mundane,
repetitive tasks, organizations can achieve competitive advantage by broadening job
descriptions and developing their employees through commitment enhancing human
resource practices.
Similar insights can be gleamed when deconstructing the total retail experience
construct. This research has demonstrated that when forming global beliefs about their
satisfaction customers will place nearly equal weights on all five of the total retail
experience dimensions: product quality, product availability and selection, service
199
quality, store layout and servicescape. As such, organizations in a specialty retail market
such as the one studied in this research, should invest in the five areas to a similar degree.
Investments in one of the five areas should not dominate the investments in any of the
other areas. This finding is important because traditional service management literature
has tended to focus research efforts on investigating the effects of product and process
quality on customer outcomes. This research shows that customer satisfaction is also
shaped by “experiential” store characteristics such as layout and servicescape. It shows,
as Collier (1994) argues, that customers are looking for a total “benefits package”.
The structural equation results of section 5.3.3 indicate that customer satisfaction
is more heavily influenced by a customer’s perception of their total shopping experience
than it is by the value their perceived value of the merchandise itself – as evidenced by
the .733 path estimate between total retail experience and customer satisfaction versus the
0.227 path coefficient between value and customer satisfaction. This result indicates that
in a niche, specialty industry such as women’s apparel, price plays a more minor role
than the five total retail experience dimensions. As such, managers can use this finding
as justification for increasing elements of the total retail experience knowing that a
reasonable price increase to pay for such improvements will be tolerated by the customer.
Customers are indeed willing to pay for a nice servicescape as much as they are willing to
pay for increases in product quality, a tenet that has received little empirical attention in
service management literature.
A final contribution is demonstrating the strength of the path estimate between
customer satisfaction and customer loyalty, 0.762. This finding illustrates to managers
that the best way to generate future purchases is to increase the satisfaction level of your
200
current customer base, a common component of what service marketing theorists call
defensive marketing. And as described above, the best way to increase customer
satisfaction is to provide a superior total retail experience. As previous research has
indicated, customers who are extremely satisfied with their retail experience are less
likely to search for alternatives decreasing the firm’s overall cost of serving their
customer base, increasing store profitability. Moreover, satisfied and loyal customers are
more likely to recommend the store to others and purchase secondary, ancillary products,
increasing market share (see chapter 3 for a full elucidation of this argument).
6.4.2. Academic contributions
This section will be organized by the focus and depth of the contribution,
specifically, contributions with narrow scope will be described first. The broader
contributions will be detailed last. In terms of construct development and validation this
study provides many contributions to the service management literature. It has taken well
established scales from other disciplines and validated them in a retail setting context:
value (marketing), support – management (human resource management), work design
(psychology) etc. Furthermore, it has developed more rigorously two second order
constructs: internal service quality and total retail experience. As noted in section 2.2.,
although the internal service quality construct has found its way into much academic
literature, to date no one has comprehensively developed the second order factor
(Hallowell, 1991; Edvardsson et al, 1997; Silvestro and Cross, 2000; and Kamakura et al,
2002). This research has scanned several disciplines to propose an eight dimensional
representation of internal service quality. Each of the eight dimensions is independently
201
shown to be reliable and valid, section 4.4.2. Furthermore, and herein lies the major
contribution, the eight dimensional second order factor is shown to be valid, section
5.2.1. The structural equation results also begin to show the nomological validity of the
internal service quality construct – the first such study to do so. The internal service
quality construct developed in this study can be used as a foundation upon which future
studies into both employee satisfaction and the service profit chain can be based.
In a similar vein, this research provides the most rigorous development of a total
retail experience construct. It has shown our five dimensional rendering to be valid.
Furthermore, the hierarchical regression results demonstrate that this five dimensional
total retail experience construct can explain significantly more variance in customer
satisfaction than traditional customer assessment constructs used in service management
literature, such as, Gronroos’ (1984) technical / functional breakdown of service quality.
The more comprehensive total retail experience construct can be used in future research
exploring customer reactions to service offerings. It is the first study to incorporate well
received, empirically validated scales such as servicescape and store layout with the
traditional service management scales of product and process quality. In doing so, it has
shown how all these scales converge to form one grand second order scale. Moreover,
the research is also the first to demonstrate the nomological validity of the construct by
showing that it behaves in accordance with well accepted theory in relation to other
constructs, such as value and customer satisfaction.
The inter-disciplinary nature of the theory underlying the service profit chain
required an extensive literature review. The literature review surveys research in several
different disciplines, service/operations management, marketing, human resource
202
management, organizational behavior, personnel psychology, just to name a few.
Chapters 2 and 3 identify many parallels to service profit chain theory, as such adding to
its content validity. The review provides service management researchers a framework
for finding the most salient related theory in other fields. These references can be used to
not only build more service management theory but also as a grounds of selecting well-
established and validated constructs to incorporate into modeling attempts. Furthermore,
the literature review adds to the content and face validities of not only the service profit
chain itself, but also the constructs contained therein.
Finally, and most significantly, this study provides the most comprehensive test of
the service profit chain to date. It is the only study to develop rigorously all of the
constructs that Heskett et al (1994, 1997, 2001) discuss in their original works on the
service profit chain. It also uses more sophisticated data analytic techniques than earlier
studies. As opposed to using simple correlation tests, which does not control for
intermediate effects, structural equation modeling is employed in order to elucidate the
paths, both direct and indirect, through with the hypothesized effects occur. As such,
managerial observations, like those in section 6.4.1, can be made. This research lays the
path upon which future service profit chain researchers can build, as described
throughout the next section.
The employee portion of our model has verified the service profit chain notion
that firms receive both direct and indirect benefits from investing in and developing their
labor force. Furthermore, the developmental practices are not limited to practices that are
strictly aimed at instantly “gratifying” employees, such as pay increases. Practices that
allow employees to serve customers more fully also enhance employee satisfaction – in
203
essence showing that employees do indeed care about the service quality they deliver to
customers. If we blend this research findings with previous research, as discussed in
chapter 2, we can state the internal service quality will have a positive effect on employee
satisfion and loyalty which will be manifested through reduced turnover (lower recruiting
expenses, lower training expenses, etc) and increased on the job performance.
The customer portion of our model demonstrates that customers do indeed form
comprehensive assessments of the retailer far beyond those which traditional service
management scales can account for. In forming their assessements of a retailer, nearly
equal weight is given to five areas: product quality, process quality, servicescape, store
layout and product availability and selection. These five areas converge into one second
order factor which has a positive effect on customer’s perceptions of value and customer
satisfaction. In spirit it shows that managers have five key ways to influence customers,
not just the two that are traditionally researched (product quality and process quality).
Furthermore, as shown in the path diagram, total retail experience is a much better
predictor of employee outcomes, such as satisfaction and loyalty, than perceived value is.
This confirms recent work on the “experience” economy that posits that customers look
beyond the product itself and even the help employees give when assessing a retailer
(Hill et al, 2001). Tacit components such as servicescape and store layout play a vital
role as well in shaping customer beliefs. Please note, it is a significant contribution to the
service quality literature that this study incorporated a value construct into the structural
model. The majority of early service quality literature did not do so, and by failing to
include a value variable or talk about value at all, researchers in essence were saying that
quality should be enhanced at any cost. It is not until the value variable is included that
204
quality enhancement projects must be held responsible from a financial standpoint (Rust
et al, 1995).
Staying within the customer model, the strength of the relationship between
customer satisfaction and customer loyalty lends credence to defensive marketing
theorists (Reichheld, 1990), see chapter 3 for a review of this theory. The key to future
market share is found in customer satisfaction. Satisfied customers are less likely to
search switch to a competitor, more likely to purchase ancillary products, more likely to
refer other customers, etc leading to increases in future revenue performance (e.g. sales
growth) and future margin increases (e.g. profitability).
Although our population frame precluded us from testing the definitive service
profit chain model that Heskett et al (1994, 1997) propose, very strong foundations were
built. Specifically, this research shows that two of the major variables in the service
profit chain are second order variables – internal service quality and total retail
experience. It has also shown that scales from other disciplines can be validly adapted to
a service management framework (e.g. perceived organizational support, value, etc). The
measurement model proposed in this research goes well beyond models used in service
profit chain research attempts. Although it confirms the difficulty in performing service
profit chain research (sample size required, employee productivity construct, etc) it does
show that the research is possible and gives a firm base to build upon.
6.5. Limitations and future research
Like any study, this research has limitations. These limitations offer opportunities
for improvements, thus suggesting ideas for future research. The first item that needs to
205
be addressed is the generalizability of this research. The population frame of this study
was one large retail organization in women’s specialty fashion. This frame was chosen
for a variety of reasons (see section 4.2 for a complete review), one of the primary being
that is can be classified as a relatively high contact service process – meaning there is
much interaction between service provider and customer. As Schlesinger and Heskett
(1991) point out, “the service model [service profit chain] will not appeal to all segments,
especially those seeking little or no human interaction.” A drawback to this selection is
conjecturing just how much this study can be generalized across all service industries.
As Schlesinger and Heskett (1991) observe, the model likely applies to other high contact
industries but exactly which industries is still unclear. Future researchers can use service
classification schemes, such as the one proposed by Lovelock (1983), to see which
service categories are most likely to benefit by the management practices underlying the
service profit chain.
Researchers can address the basic question of whether or not the service profit
chain management model is applicable to all industries. Furthermore, within those
industries where the service profit chain is applicable, insights could be gleaned from
further comparative analysis. For example, do the same eight dimensions load onto the
internal service quality construct across all industries? Do the same five dimensions
make up total retail experience? If so, do the weightings of the dimensions change?
Previous research has shown that the relative importance of product quality compared to
service quality changes between industries (Gronroos, 1984; Patterson and Spreng, 1997;
Nowak and Washburn, 1998; Mittal and Sasser, 1998; etc). Does this same phenomenon
occur for the five dimensions of total retail experience? Is servicescape more important
206
in some industries than others? If so, what are the characteristics of the environments
that lead to the difference? Additionally, value played a fairly minor role in this study,
possibly because specialty retail is a niche industry, but under what conditions does value
play a more important role?
Another limitation to the population frame used in this study is whether the results
are generalizable to other customer and employee segments. In this study, 3.2% of
employees are male; the remaining 96.8% are female. Although these proportions are
indicative of the entire national workforce for the firm we studied, the largest proportion
of firms within the U.S. will not have this gender distribution pattern. It is known that
gender is a potential mediating effect between employee satisfaction and employee
loyalty (Spreitzer et al, 1997; Griffeth et al, 2000; Moshavi and Terborg, 2002); future
researchers can study whether the service profit chain model is applicable in male-
dominated work environments, as well as gender balanced environments. Will the eight
dimensions of internal service quality, and their respective importance weights, remain
constant? Will the relationships among internal service quality, employee satisfaction
and employee loyalty all remain the same?
The same questions can be investigated on the customer portion of the service
profit chain. Since the merchant in this study sells primarily women’s specialty apparel,
its customer market is dominated by women – nearly 99% of the respondents to the
survey are women. It has been shown that gender can mediate the relationship between
external service quality and customer satisfaction (Odekerken-Schroder et al, 2001) and
between customer satisfaction and customer loyalty (Gremler and Brown, 1999; Mittal
and Kamakura, 2001). Gender has also been shown to influence specific variables, such
207
as the importance customers place on the different dimensions of service quality
(Odekerken-Schroder et al, 2001). What role will gender play in influencing the service
profit chain as a whole? Would results similar to ours be found even if the customer base
was male dominated?
Another fertile area of research is to try to piece together the two halves of the
service profit chain and test the entire theory at once. Our selection of population frame
precluded us from this possibility (see section 4.2 for a full discussion of this matter).
Undertaking this kind of research will be very difficult. Two potential data collection
methods that might prove fruitful include administering a simultaneous survey of
particular service encounters and trying to survey many different firms (as opposed to the
one large chain used in this study). Each will be briefly discussed.
The first potential data collection method to facilitate a single model of the
service profit chain is to survey employees and customers immediately after a service
encounter. This method would clearly allow the researcher to link a customer to a
particular store, thus allowing the researcher to test the link between employee outcomes,
such as satisfaction, loyalty and productivity, and customer perceptions, such as total
retail experience, satisfaction and loyalty. Unfortunately, this type of research would also
have to overcome limitations. Namely, many of the constructs in the service profit chain
are abstract concepts that develop over time – e.g. employee and customer loyalty
(Cronin and Taylor, 1992; Storbacka et al, 1994). Loyalty, although it can be measured
at a particular point in time, is a product of many service encounters. One possible way
around this limitation is to ask questions referring to a customer’s perceived change in
loyalty, i.e. how a specific service encounter changed their intention to shop at the store
208
again. If this method is undertaken, a control for initial reference point may have to be
incorporated. The only other possibility would be to drop all constructs that involve
perceptions that have been developed over time. Although doing this would reduce the
model, it would still provide great benefit in that the two halves of the chain would be
tested together.
The second data collection technique that would facilitate studying the entire
model simultaneously is surveying many different service firms. The data collection
required for this methodology might be too exhaustive to permit an application. A
collection of customers and employees would have to be surveyed for each firm. Then,
for each organization, the customer responses and employees responses would be
averaged to get one “score” for each firm. Each firm would then represent one row in the
data matrix. Because the service profit chain is so extensive, including approximately 18
first order factors, each potentially with four to six indicators, a large number of firms
would be needed to achieve even moderate power. Using the requirement of five
observations for each estimated path as a rule of thumb, one would need to collect data
from upwards of 1,000 firms ([36 * 5] * 5 + 20 * 5). Again, for each of these thousand
firms, sets of customers and employees would need to be surveyed.
Our choice of methodology, namely structural equation modeling, is a very
powerful tool that provides many advantages of over other possible methodologies,
section 5.1 details these advantages. However, one note should be made in this regard –
structural equation modeling does not strictly confirm theory. It simply measures how
well a model can reproduce a covariance matrix. It does not provide for a definitive test
of the model itself. In light of this, future researchers can test alternative models, ie.
209
derivations, of the service profit chain. For example, a derivative model could be
completely linear in nature. Internal service quality would influence only employee
satisfaction. In turn, employee satisfaction would influence only employee loyalty. The
linearity would be carried all the way through the model with the last link being customer
loyalty to business performance. Although the service profit chain model tested in this
research does fit the data well, this linear type of model, or any alternative model, could
possibly fit the data better.
A potential bias enters into this research from the sampling plan used to collect
customer surveys. The research team focused solely on distributing surveys to customers
who were in the process of shopping in the store. This method has a potential bias
towards customers who are satisfied and loyal to the store to begin with. There was no
way to contact individuals who had shopped at the retail chain but were so dissatisfied
they did not come back. As such, there were very few low scores on some of the
customer outcome variables – service quality, customer satisfaction, customer loyalty.
The question that results from this potential bias is whether the service profit chain
applies to dissatisfied customers as well. Or does the model need to be altered, and if so,
how?
Finally, two variables within the original service profit chain that Heskett et al
(1994) proposed a decade ago are not found in our final models – employee productivity
and business performance. As discussed in section 5.2.2 an employee productivity
construct is originally included in this study. However, because of measurement issues
within the particular population frame studied, this construct is dropped. In industries
where productivity can be objectively assessed, e.g. sales per employee / units produced
210
per employee, these measurement errors may be overcome. In such situations, the
construct can be included into the service profit chain model so as to test the original
theory. Likewise, because of measurement issues with the retail chain studied, this
research was not able to include any store performance metrics in the customer model.
As discussed earlier in this section, researchers whose data points are distinct firms,
rather than outlets of a single firm, may be able to overcome this limitation.
211
BIBLIOGRAPHY
Ahire, S. and Devaraj, S. (2001). “An empirical comparison of statistical constructvalidation approaches.” IEEE Transactions on Engineering Management, Vol. 48 No. 3,pp. 31 9 – 329.
Aldaigan, A. and Buttle, F. (2002). “SYSTRA-SQ: A new measure of bank servicequality.” International Journal of Service Industry Management, Vol. 13 No. 4, pp. 362– 381.
Allen, D., Shore, L. and Griffeth, R. (2003). “The role of perceived organizationalsupport and supportive human resource practices in the turnover process.” Journal ofManagement, Vol. 29 No. 1, pp. 99 – 118.
Anderson, E. and Fornell, C. (2000). “Foundations of the American customersatisfaction index.” Total Quality Management, Vol. 11 No. 7, pp. 869 – 882.
Anderson, E., Fornell, C. and Lehmann, D. (1994). “Customer satisfaction, marketshare and profitability: Findings from Sweden.” Journal of Marketing, Vol. 58 No. 3,pp. 53 – 66.
Anderson, E., Fornell, C. and Rust, R. (1997). “Customer satisfaction, productivity, andprofitability: differences between goods and services.” Marketing Science, Vol. 16No.2, pp. 129 – 145.
Anderson, E. and Mittal, V. (2000). “Strengthening the satisfaction-profit chain.”Journal of Service Research, Vol. 3 No. 2, pp. 107 – 120.
Anderson, E. and Sullivan, M. (1993). “The antecedents and consequences of customersatisfaction for firms.” Marketing Science, Vol. 12 No. 2, pp. 125 – 143.
Anderson, J. and Gerbing. D. (1988). “Structural equation modeling in practice: Areview and recommended two-step approach.” Psychological Bulletin, Vol. 103 No. 3,pp. 411 – 423.
212
Arthur, J. (1992). “The link between business strategy and industrial relations systemsin American steel minimills.” Industrial and Labor Relations Review, Vol. 45, pp. 488 –506.
Arthur, J. (1994). “Effects of human resource systems on manufacturing performanceand turnover.” The Academy of Management Journal, Vol. 37 No.3, pp. 670 – 687.
Asubonteng, P., McCleary, K. and Swan, J. (1996). “SERVQUAL revisited: A criticalreview of service quality.” The Journal of Services Marketing, Vol. 10 No. 6, pp. 62 –81.
Babakus, E. and Boller, G. (1992). “An empirical assessment of the SERVQUALscale.” Journal of Business Research, Vol. 24 No. 3, pp. 253 – 268.
Babakus, E., Yavas, U., Karatepe, O. and Avci, T. (2003). “The effect of managementcommitment to service quality on employees’ affective and performance outcomes.”Journal of the Academy of Marketing Science, Vol. 31 No. 3, pp. 272 – 286.
Baggozi, R. and Foxall, G. (1996). “Construct validation of a measure ofadaptive—innovative cognitive styles in consumption.” International Journal ofResearch in Marketing, Vol. 13, pp. 201 – 213.
Baggozi, R. and Heatherton, T. (1994). “A general approach to representingmultifaceted personality constructs’ application to self-esteem.” Structural EquationModeling, Vol. 1 No. 1, pp. 35 –67.
Barney, J. (1991). “Firm resources and sustained competitive advantage.” Journal ofManagement, Vol. 17, pp. 99 – 120.
Becker, G. (1964). Human Capital: A Theoretical and Empirical Analysis with SpecialReference to Education. Columbia University Press, New York, NY.
Berman, B. and Evans, J. (1998). Retail Management. 7th Edition. Prentice Hall, UpperSaddle River, NJ.
Berry, L. (1969). “The components of department store image: A theoretical andempirical analysis.” Journal of Retailing, Vol. 45 No. 1, pp. 3 – 20.
Bettencourt, L. (1997). “Customer voluntary performance.” Journal of Retailing, Vol.73 No. 3, pp. 383 – 406.
Bitner, M. (1990). “Evaluating service encounters: The effects of physical surroundingsand employee responses.” Journal of Marketing, Vol. 54 No. 2, pp. 69 – 82.
213
Bitner, M. (1992). “Servicescapes: The impact of physical surroundings on customersand employees.” Journal of Marketing, Vol. 56 No.2, pp. 57 – 71.
Bitner, M., Boom, B. and Tetreault, M. (1990). “The service encounter: diagnosingfavorable and unfavorable incidents.” Journal of Marketing, Vol. 54 No. 1, pp. 71 – 84.
Blanchard, R. and Galloway, R. (1994). “Quality in retail banking.” InternationalJournal of Service Industry Management, Vol. 5 No. 4, pp. 5 – 23.
Blattberg, R. and Deighton, J. (1996). “Manage Marketing by the Customer EquityTest.” Harvard Business Review, Vol. 74 No. 4, pp. 136 – 144.
Blau, P. (1964). Exchange and Power in Social Life. J. Wiley, New York, NY.
Bloemer, J. and Lemmink, J. (1992). “The importance of customer satisfaction inexplaining brand and dealer loyalty.” Journal of Marketing Management, Vol. 8 No. 4,pp. 351 – 363.
Bloom, P. and Reve, T. (1990). “Transmitting signals to consumers for competitiveadvantage.” Business Horizons, Vol. 33 No. 4, pp. 58 – 67.
Bollen, K. (1989). Structural Equations With Latent Variables. J. Wiley, New York,NY.
Bolton, R. (1998). “A dynamic model of the duration of customer’s relationship with acontinuous service provider: the role of satisfaction.” Marketing Science, Vol. 17 No. 1,pp. 45 – 65.
Bolton, R. and Drew, J. (1991). “A multistage model of customers’ assessments ofservice quality and value.” Journal of Consumer Research, Vol. 17 No. 4, pp. 375 – 384.
Boulding, W., Kalra, A., Staelin, R. and Zeithaml, V. (1993). “A dynamic processmodel of service quality: From expectations to behavioral intentions.” Journal ofMarketing Research, Vol. 30 No. 1, pp. 7 – 27.
Bowen, D. and Johston, R. (1999). “Internal service recovery: developing a newconstruct.” International Journal of Service Industry Management, Vol. 10 No. 2, pp.118 – 131.
Bowen, D. and Lawler, E. (1992). “The empowerment of service workers: What, why,how and when.” Sloan Management Review, Vol. 33 No. 3, pp. 31 – 40.
Bowen, D. and Lawler, E. (1995). “Empowering service employees.” SloanManagement Review, Vol. 36 No. 4, pp. 73 – 84.
214
Bozeman, D. and Perrewe, P. “The effect of content overlap on organizationalcommitment questionnaire – turnover cognitions relationships.” Journal of AppliedPsychology, Vol. 86 No.1, pp. 161 – 173.
Brown, S. and Peterson, R. (1993). “Antecedents and consequences of salesperson jobsatisfaction.” Journal of Marketing Research, Vol. 30 No. 1, pp. 15 – 21.
Brown, S. and Swartz, T. (1989). “A gap analysis of professional service quality.”Journal of Marketing, Vol. 53 No. 2, pp. 141 – 155.
Brown, T., Churchill, G. and Peter, J.P. (1993). “Improving the measurement of servicequality.” Journal of Retailing, Vol. 69 No. 1, pp. 127 – 139.
Browne, M., and Cudeck, R. (1992). “Alternative ways of assessing model fit.”Sociological Methods and Research, Vol. 21 No. 2, pp. 230 – 258.
Buttle, F. (1996). “SERVQUAL: Review, critique, research agenda.” EuropeanJournal of Marketing, Vol. 30 No. 1, pp. 8 – 32.
Carman, J. (1990). “Consumer perceptions of service quality: an assessment of theSERVQUAL dimensions.” Journal of Retailing, Vol. 66 No. 1, pp. 23 – 55.
Carmines, E. and Zeller, R. (1979). Reliability and Validity Assessment. SagePublications, Beverly Hills, CA.
Caruana, A. and Pitt, L. (1997). “INTQUAL – An internal measure of service qualityand the link between service quality and business performance.” European Journal ofMarketing, Vol. 31 No. 8, pp. 604 – 616.
Chatman, J. and Jehn, K. (1991). “Organizational culture in the service sector: Abetween-industry comparison.” Academy of Management Proceedings, pp. 168 – 172.
Chenet, P., Tynan, C. and Money, A. (2000). “The service performance gap: Testingthe redeveloped causal model.” European Journal of Marketing, Vol. 34 No. 3 – 4, pp.472 – 495.
Churchill, G. (1979). “A paradigm for developing better measures of marketingconstructs.” Journal of Marketing Research¸ Vol. 16, pp. 64 – 73.
Cooper-Thomas, H, Van Vianen, A. and Anderson, N. (2004). “Changes in person –organization fit: The impact of socialization tactics on perceived and actual P – O fit.”European Journal of Work and Organizational Psychology, Vol. 13 No. 1, pp. 52 – 78.
Cronbach, L. (1951). “Coefficient alpha and internal structure of tests.” Psychometrika,Vol. 16, pp. 297 – 334.
215
Cronin, J. and Taylor, S. (1992). “Measuring service quality: A reexamination andextension.” Journal of Marketing, Vol. 56 No. 3, pp. 55 – 68.
Cronin, J. and Taylor, S. (1994). “SERVPERF versus SERVQUAL: Reconcilingperformance-based and perceptions-minus-performance measurements of servicequality.” Journal of Marketing, Vol. 58 No. 1, pp. 125 – 131.
Cutcher – Gershenfeld, J. (1991). “The impact of economic performance of atransformation in workplace relations.” Industrial and Labor Relations Review, Vol. 44No. 2, pp. 241 – 260.
Dabholkar, P. (1995). “A contingency framework for predicting causality betweencustomer satisfaction and service quality.” Advances in Consumer Research, Vol. 22 No.1, pp. 101 – 108.
Dabholkar, P., Shepherd, C. and Thorpe, D. (2000). “A comprehensive framework forservice quality: An investigation of critical conceptual and measurement issues through alongitudinal study.” Journal of Retailing, Vol. 76 No. 2, pp. 139 – 173.
Dabholkar, P. and Thorpe, D. (1996). “A measure of service quality for retail stores:Scale development and validation.” Journal of the Academy of Marketing Science, Vol.24 No. 1, pp 3 – 16.
Danaher, P. and Haddrell, V. (1996). “A comparison of question scales used formeasuring customer satisfaction.” International Journal of Service IndustryManagement, Vol. 7 No. 4, pp. 4 – 26.
Darr, K., Tasso, K, Behar-Horenstein, L., Grimaudo, N., Guin, P., Gamble, K., Aumiller,A., Mandell, T. and Ramey, B. (2002). “Assessing patient satisfaction and quality ofcare through observation and interview.” Hospital Topics, Vol. 80 No. 3, pp. 4 – 10.
Dawson, S., Bloch, P. and Ridgway, N. (1990). “Shopping motives, emotional states,and retail outcomes.” Journal of Retailing, Vol. 66 No. 4, pp. 408 – 427.
Denison, D. and Mishra, A. (1995). “Toward a theory of organizational culture andeffectiveness.” Orgnization Science, Vol. 6 No. 2, pp. 204 – 223.
De Ruyter, K., Wetzel, M. and Bloemer, J. (1998). “On the relationship betweenperceived service quality, service loyalty and switching costs.” International Journal ofService Industry Management, Vol. 9 No. 5, pp. 436 – 453.
Devlin, S., Dong, H.K. and Brown, M. (2003). “Selecting a scale for measuringquality.” Marketing Research, Vol. 5 No. 3, pp. 12 – 17.
216
Dichter, E. (1985). “What’s in an image.” The Journal of Consumer Marketing, Vol. 2,pp. 75 – 81.
Dick, A. and Basu, K. (1994). “Customer loyalty: Toward an integrated conceptualframework.” Journal of the Academy of Marketing Science, Vol. 22 No. 2, pp. 99 – 114.
Dienesch, R. and Liden, R. (1986). “Leader-member exchange model of leadership: Acritique and further development.” Academy of Management Review, Vol. 11 No. 3, pp.618 – 634.
Dillman, D. (2000). Mail and Internet Surveys: The Tailored Design Method. Wiley,New York, NY.
Dotzour, M. and Lengnick-Hall, C. (1992). “Strategies for retaining your bestappraisers.” Appraisal Journal, Vol. 60 No. 2, pp. 218 – 227.
Doyle, P. and Fenwick, I. (1974/75). “How store image affects shopping habits ingrocery chains.” Journal of Retailing, Vol. 50 No. 4, pp. 39 – 52.
Droge, C. and Vickery, S. (1996). “How valid are measurements?” Decision Sciences,Vol. 27 No. 5, pp. 10 – 12.
Dunham, R., Smith, F. and Blackburn, R. (1977). “Validation of the index oforganizational reaction with the JDI, the MSQ and Faces scales.” Academy ofManagement Journal, Vol. 20 No. 3, pp. 420 – 432.
Edvardsson, B., Larsson, G. and Setterlind, S. (1997). “Internal service quality and thepsychosocial work environment: An empirical analysis of conceptual interrelatedness.”The Services Industries Journal, Vol. 17 No. 2, pp. 252 – 263.
Eisenberger, R., Armeli, S., Rexwinkel, B., Lynch, P. and Rhoades, L. (2001).“Reciprocation of perceived organizational support.” Journal of Applied Psychology¸Vol. 86 No. 1, pp. 42 – 51.
Eisenberger, R., Fasolo, P. and Davis-LaMastro, V. (1990). “Perceived organizationalsupport and employee diligence, commitment and innovation.” Journal of AppliedPsychology, Vol. 75 No. 1, pp. 51 – 59.
Eisenberger, R., Huntington, R., Hutchinson, S. and Sowa, D. (1986). “Perceivedorganizational support.” Journal of Applied Psychology, Vol. 71 No. 3, pp. 500 – 507.
Eisenberger, R., Stinglhamber, F., Vandenberghe, C, Sucharski, I. and Roades, L.(2002). “Perceived supervisor support: Contributions to perceived organizationalsupport and employee retention.” Journal of Applied Psychology, Vol. 87 No. 3, pp. 565– 573.
217
Ennew, C. and Binks, M. (1999). “Impact of participative service relationships onquality, satisfaction and retention.” Journal of Business Research, Vol. 46 No.2, pp. 121– 132.
Erdogan, B., Kraimer, M. and Liden, R. (2002). “Person-organization fit and workattitudes: The moderating role of leader-member exchange.” Academy of ManagementProceedings.
Eskildsen, J. and Dahlgaard, J. (2000). “A causal model for employee satisfaction.”Total Quality Management, Vol. 11 No. 8, pp. 1081 – 1094.
Evans, J. and Lindsey, W. (1996). The Management and Control of Quality. WestPublishing, St. Paul, Minnesota.
Fan. X., Thompson, B. and Wang, L. (1999). “Effects of sample size, estimationmethods and model specification on structural equation modeling fit indexes.” StructuralEquation Modeling, Vol. 6 No. 1, pp. 56 – 83.
Feinberg, R., Kim, I., Hokama, L. de Ruyter, K. and Kenn, C. (2000). “Operationaldeterminants of caller satisfaction in the call center.” International Journal of ServiceIndustry Management, Vol. 11 No. 2, pp. 131 – 141.
Finn, D., Baker, J., Marshall, G. and Anderson, R. (1996). “Total quality managementand internal customers: Measuring internal service quality.” Journal of Marketing, Vol.4 No. 3, pp. 36 – 51.
Finn, D. and Lamb, C. (1991). “An evaluation of the SERVQUAL scales in a retailingsetting.” Advances in Consumer Research, Vol. 18 No. 1, pp. 483 – 491.
Fornell, C. (1992). “A national customer satisfaction barometer: the Swedishexperience.” Journal of Marketing, Vol. 56 No.1, pp. 6 – 21.
Fornell, C., Johnson, M., Anderson, E., Cha, J. and Bryant B. (1996). “The Americancustomer satisfaction index: Nature, purpose, and findings.” Journal of Marketing, Vol.60 No. 4, pp. 7 – 18.
Fornell, C. and Larcker, D. (1981) “Evaluating structural equation models withunobservable variables and measurement error.” Journal of Marketing Research. Vol.18, pp. 39 – 50.
Fornell, C. and Wernerfelt, B. (1987). “Defensive marketing strategy by customercomplaint management.” Journal of Marketing Research, Vol. 24, pp. 337 – 346.
218
Frayne, C. and Geringer, M. (2000). “Self-management training for improving jobperformance: A field experiment involving salespeople.” Journal of AppliedPscyhology, Vol. 85 No. 3, pp. 361 – 372.
Frost, F. and Kumar, M. (2000). “INTSERVQUAL – An internal adaptation of the GAPmodel in a large service organization.” Journal of Services Marketing, Vol. 14 No. 5, pp.358 – 377.
Gagliano, K. and Hathcote, J. (1994). “Customer expectations of service quality in retailapparel specialty stores.” Journal of Services Marketing, Vol. 8 No. 1, pp. 60 – 69.
Garvin, D. (1987). “Competing on the eight dimensions of quality.” Harvard BusinessReview, Vol. 65 No. 6, pp. 101 – 110.
Gerbing, D., Ahadi, S. and Patton, J. (1987). “Toward a conceptualization ofimpulsivity: Components across the behavioral and self report domains.” MultivariateBehavioral Research, Vol. 22, pp. 357 - 379.
Gerbing, D. and Anderson, J. (1984). “On the meaning of within-factor correlatedmeasurement errors.” Journal of Consumer Research, Vol. 11, pp. 572 – 580.
Gerbing, D. and Anderson, J. (1988). “An updated paradigm for scale developmentincorporating unidimensionality and its assessment.” Journal of Marketing Research,Vol. 25, pp. 186 – 192.
Gillet, B. and Schwab, D. (1975). “Convergent and discriminant validities ofcorresponding Job Descriptive Index and Minnesota Satisfaction Questionnaire scales.”Journal of Applied Psychology, Vol. 60, pp. 313-317.
Goldstein, S. and Schweikhart, S. (2002). “Empirical support for the Baldridge awardframework in U.S. hospitals.” Health Care Management Review, Vol. 27 No. 1, pp. 62 –75.
Grant, A. and Schlesinger, L. (1995). “Realize your customer’s full profit potential.”Harvard Business Review, Vol. 73 No. 5, pp. 59 – 72.
Gremler, D., Bitner, M. and Evans, K. (1994). “The internal service encounter.”International Journal of Service Industry Management, Vol. 5 No. 2, pp. 34 – 56.
Gremler, D. and Brown, S. (1999). “The loyalty ripple effect: Appreciating the fullvalue of customers.” International Journal of Service Industry Management, Vol. 10 No.3, pp. 271 – 291.
219
Griffeth, R., Hom, P. and Gaertner, S. (2000). “A meta-analysis of antecedents andcorrelates of employee turnover: update, moderator tests, and research implications forthe next millennium.” Journal of Management, Vol. 26 No. 3, pp. 463 – 488.
Gronroos, C. (1984). “A service quality model and its marketing implications.”European Journal of Marketing, Vol. 18 No. 4, pp. 36 – 44.
Gronroos, C. (1994). “Quo Vadis, Marketing? Toward a relationship marketingparadigm.” Journal of Marketing Management, Vol. 10 No. 5, pp. 347 – 360.
Gronroos, C. (1997). “From marketing mix to relationship marketing: Towards aparadigm shift in marketing.” Management Decision, Vol. 35 No. 4, pp. 322 – 339.
Gronroos, C. (1997). “Value-driven relational marketing: From products to resourcesand competencies.” Journal of Marketing Management, Vol. 13 No. 5, pp. 407 – 419.
Hackman, J. and Oldham, G. (1976). “Motivation through the design of work: Test of atheory.” Organizational Behavior and Human Performance, Vol. 16 No. 2, pp. 250 –279.
Hair, J., Andeson, R., Tatham, R. and Black, W. (1995). Multivariate Data Analysis, 5th
edition. Prentice Hall, Englewood Cliffs, NJ.
Hallowell, R. (1996). “The relationships of customer satisfaction, customer loyalty, andprofitability: An empirical study.” International Journal of Service IndustryManagement, Vol. 7 No. 4, pp. 27 – 42.
Hallowell, R., Schlesinger, L. and Zornitsky, J. (1996). “Internal service quality,customer and job satisfaction: Linkages and implications for management.” HumanResources Planning, Vol. 19 No. 2, pp. 20 – 31.
Hart, C., Heskett, J. and Sasser, W. (1990). “The profitable art of service recovery.”Harvard Business Review, Vol. 68 No. 4, pp. 148 – 156.
Havlovic, S. (1991). “Quality of work life and human resource outcomes.” IndustrialRelations, Vol. 30 No. 3, pp. 469 – 479.
Hays, J. and Hill, A. (2001). “A preliminary investigation of the relationships betweenemployee motivation/vision, service learning and perceived service quality.” Journal ofOperations Management, Vol. 19 No. 3, pp. 335 – 349.
Heskett, J. (1987). “Lessons in the service sector.” Harvard Business Review, Vol. 65No. 2, pp. 118 – 126.
220
Heskett, J., Jones, T., Loveman, G., Sasser, W. and Schlesinger L. (1994). “Putting theservice profit chain to work.” Harvard Business Review, Vol. 72 No. 2, pp. 164 – 174.
Heskett, J., Sasser, W. and Schlesinger, L. (1997). The Service Profit Chain. Free Press,New York, NY.
Hom, P. and Griffeth, R. (1991). “Structural equation modeling test of a turnovertheory: cross-sectional and longitudinal data.” Journal of Applied Psychology, Vol. 76No. 3, pp. 350 – 366.
Hom, P. and Kinicki, A. (2001). “Toward a greater understanding of how dissatisfactiondrives employee turnover.” Academy of Management Journal, Vol. 44 No. 5, pp. 975 –987.
Homas, G. (1961). Social Behavior. Harcourt, Brace and World, New York, NY.
Howcroft, B. and Beckett, A. (1993). “Change in UK bank branch networks: Acustomer perspective.” Service Industries Journal, Vol. 13 No. 4, pp. 267 – 288.
Howell, R. (1987). “Covariance structure modeling and measurement issues: A note on‘Interrelations among channel entity’s power sources’.” Journal of Marketing Research,Vol. 24, pp. 119 – 126.
Hu, L. and Bentler, P. (1992). “Can test statistics in covariance structure analysis betrusted?” Psychological Bulletin, Vol. 112 No. 2, pp. 351 – 362.
Huselid, M. (1995). “The impact of human resource management practices on turnover,productivity and corporate financial performance.” The Academy of ManagementJournal, Vol. 38 No. 3, pp. 635- 672.
Huselid, M. and Day, N. (1991). “Organizational commitment, job involvement andturnover: a substantive and methodological analysis.” Journal of Applied Psychology,Vol. 76 No. 3, pp. 380 – 391.
Ittner, C. and Larcker, D. (1998). “Are nonfinancial measures leading indicators offinancial performance? An analysis of customer satisfaction.” Journal of AccountingResearch, Vol. 36 Supplement, pp. 1 – 35.
Jackson, D. (2001). “Sample size and number of parameter estimates in maximumlikelihood confirmatory factor analysis: A monte carlo investigation.” StructuralEquation Modeling, Vol. 8 No. 2, pp. 205 – 223.
James, L, Demaree, R. and Wolf, G. (1984). “Estimating within-group reliability withand without response bias.” Journal of Applied Psychology, Vol. 69 No. 1, pp. 85 – 98.
221
Javalgi, R. and Moberg, C. (1997). “Service loyalty: Implications for serviceproviders.” The Journal of Services Marketing, Vol. 11 No. 3, pp. 165 – 179.
Johnston, R. (1995). “The zone of tolerance: Exploring the relationships betweenservice transactions and satisfaction with the overall service.” International Journal ofService Industry Management, Vol. 6 No. 2, pp. 46 – 61.
Jones, T. and Sasser, W. (1995). “Why satisfied customers defect.” Harvard BusinessReview, Vol. 73 No. 6, pp. 88 – 99.
Judge, T., Heller, D. and Mount, M. (2002). “Five-Factor model of personality and jobsatisfaction: A meta-analysis.” Journal of Applied Psychology, Vol. 87 No. 3, pp. 530 –541.
Kacmar, K., Zivnuska, S., Witt, L. and Gully, S. (2003). “The interactive effect ofleader-member exchange and communication frequency on performance ratings.”Journal of Applied Psychology, Vol. 88 No. 4, pp. 764 – 773.
Kamurka, W., Mittal, V., de Rosa, F. and Mazzon, J. (2002). “Assessing the serviceprofit chain.” Marketing Science, Vol. 21 No. 3, pp. 294 – 317.
Kang, G., James, J. and Alexandris, K. (2002). “Measurement of internal servicequality: Application of the SERVQUAL battery to internal service quality.” ManagingService Quality, Vol. 12 No. 5, pp. 278 – 291.
Kaplan, R. and Norton, D. (1992). “The balanced scorecard – Measures that driveperformance.” Harvard Business Review, Vol. 70 No. 1, pp. 71 – 79.
Kaplan, R. and Norton, D. (2001). “Transforming the balanced scorecard fromperformance measurement to strategic management: Part I.” Accounting Horizons, Vol.15 No. 1, pp. 87 – 104.
Kaplan, R. and Norton, D. (2001). “Transforming the balanced scorecard fromperformance measurement to strategic management: Part II.” Accounting Horizons, Vol.15 No. 2, pp. 147 – 160.
Kerr, J. and Slocum, J. (1987). “Managing corporate culture through reward systems.”Academy of Management Executive, Vol. 1 No. 2, pp. 99 – 108.
Kerin, R., Jain, A. and Howard, D. (1992). “Store shopping experience and consumerprice – quality – value perceptions.” Journal of Retailing, Vol. 68 No. 4, pp. 376 – 397.
Kerlinger, F. (1986). Foundations of Behavioral Research. Holt, Rinehart and Winston,New York, NY.

222
Kraimer, M., Seibert, S. and Liden, R. (1999). “Psychological empowerment as a multi-dimensional construct.: A test of construct validity.” Educational and PsychologicalMeasurement, Vol. 59 No. 1, pp. 127 – 142.
Kopelman, R., Brief, A. and Guzzo, R. (1990). “The role of climate and culture inproductivity.” In B. Schneider (Ed.), Organizational Climate and Culture, pp. 282 – 318,Jossey-Bass, San Francisco, CA.
Koustelios, A. and Bagiatis, K. (1997). “The employee satisfaction inventory (ESI):Development of a scale to measure satisfaction of Greek employees.” Educational andPsychological Measurement, Vol. 57 No. 3, pp. 469 – 476.
Koys, D. (2001). “The effects of employee satisfaction, organizational citizenshipbehavior, and turnover on organizational effectiveness: A unit-level, longitudinal study.”Personnel Psychology, Vol. 54 No. 1, pp. 101 – 113.
Kraimer, M., Seibert, S. and Liden, R. (1999). “Psychological empowerment as amultidimensional construct: A test of construct validity.” Educational andPsychological Measurement, Vol. 59 No. 1, pp. 127 – 142.
Kunkel, J. and Berry, L. (1968). “A behavioral concept of retail images.” Journal ofMarketing, Vol. 32 No. 4, pp. 21 – 28.
Lassar, W., Manolis, C. and Winsor, R. (2000). “Service quality perspectives andsatisfaction in private banking.” Journal of Services Marketing, Vol. 14 No. 3, pp. 244 –271.
Lau, R. (2000). “Quality of work life and performance: an ad hoc investigation of twokey elements in the service profit chain.” International Journal of Service IndustryManagement, Vol. 11 No. 5, pp. 422 – 437.
Lee, H., Lee, Y. and Yoo, D. (2000). “The determinants of perceived service quality andits relationship with satisfaction.” Journal of Services Marketing, Vol. 14 No. 3, pp. 217– 231.
Lehman, D. (1979). Market Research and Analysis. Irwin, Homewood, IL.
Levinson, H. (1965). “Reciprocation: The relationship between man and organization.”Administrative Science Quarterly, Vol. 9, pp. 370 – 398.
Liden, R., Ferris, G. and Dienesch, R. (1988). “The influence of causal feedback onsubordinate reactions and behavior.” Group and Organization Studies, Vol. 13 No. 3, pp.348 – 373.
223
Liden, R. and Maslyn, J. (1998). “Multi-dimensionality of leader-member exchange:An empirical assessment through scale development.” Journal of Management, Vol. 24No. 1, pp. 43 – 72.
Liden, R. and Wayne, S. (2000). “An examination of the mediating role ofpsychological empowerment on the relations between the job, interpersonal relationshipsand work outcomes.” Journal of Applied Psychology, Vol. 85 No. 3, pp. 407 – 416.
Liden, R., Wayne, S., Kraimer, M. and Sparrowe, R. (2003). “The dual commitments ofcontingent workers: An examination of contingents’ commitment to the agency and theorganization.” Journal of Organizational Behavior, Vol. 24 No. 5, pp. 609 – 626.
Liljander, V. and Strandvik, T. (1997). “Emotions in service satisfaction.” InternationalJournal of Service Industry Management, Vol. 8 No. 2, pp. 18 – 29.
Lindquist, J. (1974). “Meaning of image.” Journal of Retailing, Vol. 50 No. 4, pp. 29–38.
Lovelock, C. (1983). “Classifying services to gain strategic marketing insights.”Journal of Marketing, Vol. 47, pp. 9 – 20.
Loveman, G. (1998). “Employee satisfaction, customer loyalty, and financialperformance: An empirical examination of the service profit chain in retail banking.”Journal of Service Research, Vol. 1 No. 1, pp. 18 – 31.
Loveman, G. and Heskett, J. (1999). “Service profit chain research.” In TheIntellectual Venture Capitalist. Eds. McCraw, T. and Cruikshank, J. Harvard BusinessSchool Press, Boston, MA.
Lynch, J. and Schuler, D. (1990). “Consumer evaluation of the quality of hospitalservices.” Journal of Health Care Marketing, Vol. 10 No. 2, pp. 16 – 22.
MacCallum, R., Browne, M. and Sugawara, H. (1996). “Power analysis anddetermination of sample size for covariance structure modeling.” PyschologicalMethods, Vol. 1 No. 2, pp. 130 – 149.
MacDuffie, J. (1995). “Human resource bundles and manufacturing performance:organizational logic and flexible production systems in the world auto industry.”Industrial and Labor Relations Review, Vol. 48 No. 2, pp. 197 – 221.
Mangold, G. and Babakus, E. (1991). “Service quality: The front stage vs. the backstage perspective.” Journal of Services Marketing, Vol. 5 No. 4, pp. 59 – 70.
March, J. and Simon, H. (1958). Organizations. J. Wiley, New York, NY.
224
Marks, M., Zaccaro, S. and Mathieu, J. (2000). “Performance implications of leaderbriefings and team-interaction training for team adaption to novel environments.”Journal of Applied Psychology, Vol. 85 No. 6, pp. 971 – 986.
Marsh, H., Balla, J. and McDonald, R. (1988). “Goodness-of-fit indices in confirmatoryfactor analysis: The effect of sample size.” Psychological Bulletin, Vol. 103 No. 3, pp.391 – 410.
Martineau, P. (1958). “The personality of the retail store.” Harvard Business Review,Vol. 36, pp. 47 – 55.
McColl-Kennedy, J. and Schneider, U. (2000). “Measuring customer satisfaction: Why,what and how?” Total Quality Management, Vol. 11 No. 7, pp. 883 - 896.
McEvoy, G. and Cascio, W. (1987). “Do good or poor performers leave? A meta-analysis of the relationship between performance and turnover.” Academy ofManagement Journal, Vol. 30 No. 4, pp. 744 – 762.
McDougal, G. and Levesque, T. (2000). “Customer satisfaction with services: Puttingperceived value into the equation.” Journal of Services Marketing, Vol. 14 No. 5, pp.392 – 410.
Meyer, A., Chase, R., Roth, A., Voss, C., Sperl, K. Menor, L. and Blackmon, K. (1999).“Service competitiveness: an international benchmarking comparison of servicepractices and performance in Germany, UK and USA.” International Journal of ServiceIndustry Management, Vol. 10 No. 4, pp. 369 – 379.
Meyer, S. and Collier, D. (2001). “An empirical test of the causal relationships in theBaldridge Health Care Pilot Criteria.” Journal of Operations Management, Vol. 19 No.4, pp. 403 – 425.
Mittal, V. and Kamakura, W. (2001). “Satisfaction, repurchase intent, and repurchasebehavior: investing the moderating effect of customer characteristics.” Journal ofMarketing Research, Vol. 38 No. 1, pp. 131 – 142.
Mittal, V. and Katrichis, J. (2000). “Distinctions between new and loyal customers.”Marketing Research, Vol. 12 No.1, pp. 27 – 32.
Mittal, V. and Lassar, W. (1998). “Why do customers switch? The dynamics ofsatisfaction versus loyalty.” The Journal of Services Marketing, Vol. 12 No. 3, pp. 177 –194.
Moorman, R., Blakely, G. and Neihoff, B. (1996). “Does perceived organizationalsupport mediate the relationship between procedural justice and organizationalcitizenship behavior?” Academy of Management Journal, Vol. 41 No. 3, pp. 351 – 357.
225
Moshavi, D. and Terborg, J. (2002). “The job satisfaction and performance ofcontingent and regular custome service representatives.” International Journal of ServiceIndustry Management, Vol. 13 No. 4, pp. 333 – 347.
Myers, R. (1990). Classical and Modern Regression with Applications. Duxbury,Boston, MA.
Nachum, L. (1999). “Measurement of productivity of professional services: Anillustration on Swedish management consulting firms.” International Journal of ServiceIndustry Management, Vol. 19 No. 9, pp. 922 – 949.
Nagy, M. (2002). “Using a single item approach to measure facet job satisfaction.”Journal of Occupational and Organizational Psychology, Vol. 75 No. 1, pp. 77 – 86.
Neihoff, B. and Enz, C. (1990). “The impact of top-management actions on employeeattitudes.” Group and Organization Studies, Vol. 15 No. 3, pp. 337 – 352.
Nowak, L. and Washburn, J. (1998). “Antecedents to client satisfaction in businessservices.” The Journal of Services Marketing, Vol. 12 No. 6, pp. 441 – 452.
Nunnally, C. (1978). Psychometric Theory. McGraw-Hill, New York, NY.
Odekerken-Schroder, G., De Wulf, K., Kasper, H., Kleijnen, M., Hoekstra, J. andCommandeur, H. (2001). “The impact of quality on store loyalty: A contingencyapproach.” Total Quality Management, Vol. 12 No. 3, pp. 307 – 322.
Oldham, G. and Hackman, J. (1980). “Work design in the organizational context.”Research in Organizational Behavior, Vol. 2, pp. 247 – 278.
Oliva, R. (2001). “Tradeoffs in responses to work pressure in the service industry.”California Management Review, Vol. 43 No. 4, pp. 26 – 43.
Oliver, R. (1980). “A cognitive model of the antecedents and consequences ofsatisfaction decisions.” Journal of Marketing Research, Vol. 80 No. 17, pp. 460 – 469.
O’Rielly, C., Chatman, J. and Caldwell, D. (1991). “People and organizational culture:a profile comparison approach to assessing person-organization fit.” Academy ofManagement Journal, Vol. 3, pp. 487 – 516.
Oxenfeldt, A. (1974). “Developing a favorable price-quality image.” Journal ofRetailing, Vol. 50, pp. 8 – 14, 115.
226
Parasumran, A. and Grewal, D. (2000). “The impact of technology on the quality –value – loyalty chain: A research agenda.” Journal of Academy of Marketing Science.Vol. 18 No. 1, pp. 168 – 174.
Parasuraman, A., Zeithaml, V., and Berry, L. (1994). “Alternative scales for measuringservice quality: A comparative assessment based on psychometric and diagnosticcriteria.” Journal of Retailing, Vol. 70 No. 3, pp. 201 – 230.
Parasuraman, A., Zeithaml, V., and Berry, L. (1985). “A conceptual model of servicequality and its implications for future research.” Journal of Marketing, Vol. 49 No. 4, pp.41 – 50.
Parasuraman, A., Zeithaml, V. and Berry, L. (1994). “Reassessment of expectations asa comparison standard in measuring service quality: Implications for further research.”Journal of Marketing, Vol. 58 No. 1, pp. 111 – 124.
Parasuraman, A., Zeithaml, V. and Berry, L. (1991). “Refinement and reassessment ofthe SERVQUAL instrument.” Journal of Retailing, Vol. 67 No. 4, pp. 420 – 450.
Parasuraman, A., Zeithaml, V., and Berry, L. (1991). “Understanding customerexpectations of service.” Sloan Management Review, Vol. 32 No. 3, pp. 39 – 48.
Parasuraman, A., Zeithaml, V., and Berry, L. (1988). “SERVQUAL: A multiple-itemscale for measuring consumer perceptions of service quality.” Journal of Retailing, Vol.64 No. 1, pp. 29 – 40.
Patterson, P. and Spreng, R. (1997). “Modelling the relationship between perceivedvalue, satisfaction and repurchase intentions in a business-to-business, services context:an empirical examination.” International Journal of Service Industry Management, Vol.8 No. 5, pp. 414 – 434.
Payne, A., Holt, S. and Frow, P. (2000). “Integrating employee, customer andshareholder value through an enterprise performance model: an opportunity for financialservices.” International Journal of Bank Marketing, Vol. 18 No. 6, pp. 258 – 273.
Payne, A., Holt, S. and Frow, P. (2001). “Relationship value management: exploringthe integration of employee, customer and shareholder value and enterprise performancemodels.” Journal of Marketing Management, Vol. 17 No. 7, pp. 785 – 817.
Petrick, J. (2002). “Development of a multi-dimensional scale for measuring theperceived value of a service.” Journal of Leisure Research, Vol. 34 No. 2, pp. 119 – 134.
Petty, M., McGee, G. and Cavender, J. (1984). “A meta-analysis of the relationshipsbetween individual job satisfaction and individual performance.” Academy ofManagement Review, Vol. 9 No. 4, pp. 712 – 721.
227
Potts, G. (1988). “Exploit your product’s service life cycle.” Harvard Business Review,Vol. 66 No. 5, pp. 95 – 98.
Przasnyski, Z. and Tai, L. (1999). “Stock market reaction to Malcolm Baldrige nationalquality award announcements: Does quality pay?” Total Quality Management, Vol. 10No. 3, pp. 391 – 400.
Quinn, J., Doorley, T. and Paquette, P. (1990). “Beyond products: Services-basedstrategies.” Harvard Business Review, Vol. 68 No. 2, pp. 58 – 65.
Rafiq, M. and Ahmed, P. (1998). “A customer-oriented framework for empoweringservice employees.” The Journal of Services Marketing, Vol. 12 No. 5, pp. 379 – 396.
Ravald, A. and Gronroos, C. (1996). “The value concept and relationship marketing.”European Journal of Marketing, Vol. 30 No. 2, pp. 19 – 30.
Reicheld, F. (1996). “Learning from customer defections.” Harvard Business Review,Vol. 74 No. 2, pp. 56 – 69.
Reicheld, F., and Sasser, W., (1990). “Zero defections: Quality comes to services.”Harvard Business Review, Vol. 68 No. 5, pp. 105 – 111.
Reynoso, J. and Moores, B. (1995). “Towards the measurement of internal servicequality.” International Journal of Service Industry Management, Vol. 6 No. 3, pp. 64 –83.
Rhoades, L and Eisenberger, R. (2002). “Perceived organizational support: A review ofliterature.” Journal of Applied Psychology, Vol. 87 No. 4, pp. 698 – 714.
Rhoades, L, Eisenberger, R. and Armeli, S. (2001). “Affective commitment to theorganization: The contribution of perceived organizational support.” Journal of AppliedPsychology, Vol. 86 No. 5, pp. 825 – 836.
Ridgway, N., Dawson, S. and Bloch, P. (1990). “Pleasure and arousal in themarketplace: Interpersonal differences in approach-avoidance responses.” MarketingLetters, Vol. 1 No. 2, pp. 139 – 148.
Robinson, S. (1998). “Measuring service quality in the process of delivering asimulation study: The customer’s perspective.” International Transactions inOperational Research, Vol. 5 No. 5, pp 357 – 374.
Rogers, J., Clow, K. and Kash, T. (1994). “Increasing job satisfaction of servicepersonnel.” Journal of Services Marketing, Vol. 8 No. 1, pp. 14 – 26.
228
Rogg, K. Schmidt, D., Shull, C and Schmitt, N. (2001). “Human resources practices,organizational climate, and customer satisfaction.” Journal of Management, Vol. 27 No.4, pp. 431 – 449.
Roth, A. and Jackson, W. (1995). “Strategic determinants of service quality andperformance: Evidence from the banking industry.” Management Science, Vol. 41 No.11, pp. 1720 – 1733.
Rubio, D., Weger, M. and Tebb, S. (2001). “Using structural equation modeling to testfor multidimensionality.” Structural Equation Modeling, Vol. 8 No. 4, pp. 613 – 626.
Rucci, A., Kirn, S. and Quinn, R. (1998). “The employee-customer profit chain atSears.” Harvard Business Review, Vol. 76 No. 1, pp. 83 – 97.
Rust, R., Stewart, G., Miller, H. and Pielack, D. (1996). “The satisfaction and retentionof frontline employees: A customer satisfaction measurement approach.” InternationalJournal of Service Industry Management, Vol. 7 No. 5, pp. 62 – 80.
Rust, R., and Zahorik, A. (1993). “Customer satisfaction, customer retention, andmarket share.” Journal of Retailing, Vol. 69 No. 2, pp. 193 – 215.
Rust, R., Zahorik., A. and Keiningham, T. (1995). “Return on quality (ROQ): Makingservice quality financially accountable.” Journal of Marketing, Vol. 59 No. 2, pp. 58 –70.
Schlesinger, L. and Heskett, J. (1991). “Breaking the cycle of failure in services.” SloanManagement Review, Vol. 32 No. 3, pp. 17- 28.
Schlesinger, L. and Heskett, J. (1991). “Enfranchisement of service workers.”California Management Review, Vol. 33 No. 4, pp. 83 – 100.
Schlesinger, L. and Heskett, J. (1991). “The service-driven company.” HarvardBusiness Review, Vol. 69 No. 5, pp. 71 – 81.
Schlesinger, L. and Heskett, J. (1991). “Leonard A. Schlesinger and James L. Heskettrespond: Customer satisfaction is rooted in employee satisfaction.” Harvard BusinessReview, Vol. 69 No. 6, pp. 148 – 149.
Schlesinger, L and Zornitsky, J. (1991). “Job satisfaction, service capability, andcustomer satisfaction: An examination of linkages and measurement implications.”Human Resource Planning, Vol. 14 No. 2, pp. 141 – 149.
Schneider, B. (1990). (Ed.) Organizational Climate and Culture. Jossey-Bass, SanFrancisco, CA.
229
Schneider, B. and Bowen, D. (1985). “Employee and customer perceptions of service inbanks: Replication and extension.” Journal of Applied Psychology, Vol. 70 No. 3, pp.423 – 433.
Schneider, B. and Bowen, D. (1993). “The service organization: Human resourcesmanagement is critical.” Organizational Dynamics, Vol. 21 No. 4, pp. 39 – 52.
Schneider, B., Parkington, J. and Buxton, V. (1980). “Employee and customerperceptions of service in banks.” Administrative Science Quarterly, Vol. 25, pp. 252 –267.
Schneider, B., White, S. and Paul, M. (1998). “Linking service climate and customerperceptions of service quality: test of a causal model.” Journal of Applied Psychology,Vol. 83 No. 2, pp. 150 – 163.
Sharma, N. and Patterson, P. (1999). “The impact of communication effectiveness andservice quality on relationship commitment in consumer, professional services.” TheJournal of Services Marketing, Vol. 13 No. 2, pp. 151 – 170.
Sharma, N. and Patterson, P. (2000). “Switching costs, alternative attractiveness andexperience as moderators of relationship commitment in professional, consumerservices.” International Journal of Service Industry Management, Vol. 11 No. 5, pp. 470– 490.
Shemwell, D., Yavas, U. and Bilgin, Z. (1998). “Customer-service providerrelationships: An empirical test of a model of service quality, satisfaction andrelationship-oriented outcomes.” International Journal of Service Industry Management,Vol. 9 No. 2, pp. 155 – 168.
Sheridan, J. (1992). “Organizational culture and employee retention.” The Academy ofManagement Journal, Vol. 35 No. 5, pp. 1036 – 1056.
Shore, L. and Tetrick, L. (1991). “A construct validity study of the survey of perceivedorganizational support.” Journal of Applied Psychology, Vol. 76 No. 5, pp. 637 – 643.
Silvestro, R. and Cross, S. (2000). “Applying the service profit chain in a retailenvironment: Challenging the satisfaction mirror.” International Journal of ServiceIndustry Management, Vol. 11 No. 3, pp. 244 – 268.
Singh, P. and Smith, A. (2002). “TQM and innovation: An empirical examination oftheir relationship.” 5th International and 8th National Research Conference on Qualityand Innovation Management, pp. 525 – 542.
230
Sirohi, N., McLaughlin, E. and Wittink, D. (1998). “A model of consumer perceptionsof store loyalty intentions for a supermarket retailer.” Journal of Retailing, pp. 223 –245.
Soderlund, M. (1998). “Customer satisfaction and its consequences on customerbehavior revisited: The impact of different levels of satisfaction on word-of-mouth,feedback to the supplier and loyalty.” International Journal of Service IndustryManagement, Vol. 9 No. 2, pp. 169 – 188.
Spreitzer, G., Kizilos, M. and Nason, S. (1997). “A dimensional analysis of therelationship between psychological empowerment and effectiveness, satisfaction andstrain.” Journal of Management, Vol. 23 No. 5, pp. 679 – 704.
Spreitzer, G. and Quinn, R. (1995). “Excavating the paths of meaning, renewal andempowerment.” Journal of Management Inquiry, Vol. 4 No. 1, pp. 16 – 39.
Spreng, R. and Mackoy, R. (1996). “An empirical examination of a model of perceivedservice quality and satisfaction.” Journal of Retailing, Vol. 72 No. 2, pp. 201 – 214.
Stauss, B. and Neuhaus, P. (1997). “The qualitative satisfaction model.” InternationalJournal of Service Industry Management, Vol. 8 No. 3, pp. 236 – 249.
Steiner, D. (1988). “Value perceptions in leader-member exchange.” Journal of SocialPsychology, Vol. 128 No. 5, pp. 611 – 619.
Storbacka, K., Strandvik, T. and Gronroos, C. (1994). “Managing customerrelationships for profit: The dynamics of relationship quality.” International Journal ofService Industry Management, Vol. 5 No. 5, pp. 21 – 38.
Sureshchandar, G., Rajendran, C. and Anantharaman, R. (2002). “Determinants ofcustomer-perceived service quality: A confirmatory factor analysis approach.”International Journal of Service Industry Management, Vol. 16 No. 1, pp. 9 – 34.
Sureshchandar, G., Rajendran, C. and Anantharaman, R. (2002). “The relationshipbetween service quality and customer satisfaction: A factor specific approach.” Journalof Services Marketing, Vol. 16 No. 4, pp. 363 – 379.
Surprenant, C. and Solomon, M. (1987). “Predictability and personalization in theservice encounter.” Journal of Marketing, Vol. 51 No. 2, pp. 86 – 96.
Sweeney, J. and Soutar, G. (2001). “Consumer perceived value: The development of amultiple item scale.” Journal of Retailing, Vol. 77 No. 2, pp. 203 – 220.
Tabachnick, B. and Fidell, L. (1983). Using Multivariate Statistics. Harper and Row,New York, NY.
231
Tai, L. and Przyasnyski, Z. (1999). “Baldridge award winners beat the S & P 500.”Quality Progress, Vol. 32 No. 4, pp. 45 – 50.
Taylor, S. and Hunter, G. (2002). “The impact of loyalty with e-CRM software and e-services.” International Journal of Service Industry Management, Vol. 13 No. 5, pp. 452– 474.
Teas, K. (1994). “Expectations as a comparison standard in measuring service quality:An assessment of a reassessment.” Journal of Marketing, Vol. 58 No. 1, pp. 132 – 139.
Teas, K. (1994). “Expectations, performance, evaluation, and consumers’ perceptions ofquality.” Journal of Marketing, Vol. 57 No. 4, pp. 18 – 34.
Terblanche, N. and Boshoff, C. (2001). “Measuring customer satisfaction with some ofthe controllable elements of the total retail experience: An exploratory study.” SouthAfrican Journal of Business Management, Vol. 32 No. 2, pp. 35 – 41.
Terblanche, N. and Boshoff, C. (2001). “Measuring customer satisfaction with thecontrollable elements of the in-store shopping experience.” South African Journal ofBusiness Management, Vol. 32 No. 4, pp. 11 – 19.
Tornow, W. and Wiley, J. (1991). “Service quality and management practices: A lookat employee attitudes, customer satisfaction and bottom-line consequences.” HumanResource Planning, Vol. 14 No. 2, pp. 105 – 115.
Ulrich, D., Halbrook, R., Meder, D., Stuchlik, M. and Thorpe, S. (1991). “Employeeand customer attachment: synergies for competitive advantage.” Human ResourcePlanning, Vol. 14 No. 2, pp. 89 – 103.
Van der Wiele, T., Boselie, P. and Hesselink, M. (2002). “Empirical evidence for therelationship between customer satisfaction and business performance.” ManagingService Quality, Vol. 12 No. 3, pp. 184 – 193.
Van Looy, B., Gemmel, P., Van Dierdonck, R. and Serneels, S. (1998). “Dealing withproductivity and quality indicators in a service environment.” International Journal ofService Industry Management, Vol. 9 No. 4, pp. 359 – 376.
Varca, P. (1999). “Work stress and customer service delivery.” The Journal of ServicesMarketing, Vol. 13 No. 3, pp. 229 – 241.
Voss, G., Parasuraman, A. and Grewal, D. (1998). “The roles of price, performance, andexpectations in determining satisfaction in service exchanges.” Journal of Marketing,Vol. 62 No. 4, pp. 46 – 61.
232
Vuorinen, I., Jarvinen, R. and Lehtinen, U. (1998). “Content and measurement ofproductivity in the service sector.” International Journal of Service IndustryManagement, Vol. 9 No. 4, pp. 377 – 396.
Wakefield, K. and Blodgett, J. (1996). “The effects of the servicescape on customers’behavioral intentions in leisure service settings.” The Journal of Services Marketing,Vol. 10 No. 6, pp. 45 – 61.
Wakefield, K. and Blodgett, J. (1994). “The importance of servicescapes in leisureservice settings.” The Journal of Services Marketing, Vol. 8 No. 3, pp. 66 – 76.
Wanous, J., Reichers, A. and Hudy, M. (1997). “Overall job satisfaction: How good aresingle item measures?” Journal of Applied Psychology, Vol. 82, pp. 247 – 252.
Ward, J., Bitner, M. and Barnes, J. (1992). “Measuring prototypicality and meaning ofretail environments.” Journal of Retailing, Vol. 68 No. 2, pp. 194 – 221.
Wayne, S., Shore, L. and Liden, R. (1997). “Perceived organizational support andleader-member exchange: a social exchange perspective.” The Academy of ManagementJournal, Vol. 40 No. 1, pp. 82 – 111.
Whitener, E. (2001). “Do ‘high commitment’ human resource practices affect employeecommitment? A cross-level analysis using hierarchical linear modeling.” Journal ofManagement, Vol. 27 No. 5, pp. 515 – 535.
Wiley, J. (1991). “Customer satisfaction: A supportive work environment and itsfinancial cost.” Human Resource Planning, Vol. 14 No. 2, pp. 117- 127.
Williams, L. and Hazer, J. (1986). “Antecedents and consequences of satisfaction andcommitment in turnover models.” Journal of Applied Psychology, Vol. 86 No. 2, pp. 219– 131.
Wilson, D. and Collier, D. (2000). “An empirical investigation of the MalcolmBaldridge national quality award causal model.” Decision Sciences, Vol. 31 No. 12, pp.361 – 384.
Wisner, P. and Feist, H. (2001). “Does teaming pay off?” Strategic Finance, Vol. 82No. 8, pp. 58 – 64.
Woodruff, R. (1997). “Customer value: The next source for competitive advantage.”Journal of the Academy of Marketing Science. Vol. 25 No. 2, pp. 139 – 153.
Wong, Y. and Kanji, G. (2001). “Measuring customer satisfaction: Evidence fromHong Kong retail banking industry.” Total Quality Management, Vol. 12 No. 7 – 8, pp.939 – 948.
233
Wright, P. and Boswell, W. (2002). “Desegregating HRM: A review and synthesis ofmicro and macro human resource management research.” Journal of Management, Vol.28 No. 3, pp. 247 – 276.
Wu, B. and Petroshius, S. (1987). “The halo effect in store image measurement.”Journal of the Academy of Marketing Science, Vol. 15 No. 3, pp. 44 – 51.
Yeung, M., Ging, L. and Ennew, C. (2002). “Customer satisfaction and profitability: Areappraisal of the nature of the relationship.” Journal of Targeting, Measurement andAnalysis for Marketing, Vol. 11 No. 1, pp. 24 – 33.
Yi, Y. (1990). “Cognitive and affective priming effects of the context for printadvertisements.” Journal of Advertising, Vol. 19 No. 2, pp. 40 – 48.
Yoo, C., Park, J. and MacInnis, D. (1998). “Effects of store characteristics and in-storeemotional experiences on store attitudes.” Journal of Business Research, Vol. 42 No. 3,pp. 253 – 263.
Zeffane, R. (1994). “Understanding employee turnover: The need for a contingencyapproach.” International Journal of Manpower, Vol. 15 No. 9 – 10, pp. 22 – 37.
Zeithaml, V. (1988). “Consumer perceptions of price, quality and value: A means-endmodel and synthesis of evidence.” Journal of Marketing, Vol. 52 No. 3, pp. 2 – 22.
Zeithaml, V. (2000). “Service quality, profitability, and the economic worth ofcustomers: What we know and what we need to learn.” Journal of the Academy ofMarketing Science, Vol. 28 No. 1, pp. 67 – 85.
Zeithaml, V., Berry, L. and Parasurman, A. (1988). “Communication and controlprocesses in the delivery of service quality.” Journal of Marketing, Vol. 52, pp. 35 – 68.
Zeithaml, V., Berry, L. and Parasuraman, A. (1996). “The behavioral consequences ofservice quality.” Journal of Marketing, Vol. 60 No. 2, pp. 31 – 46.
Zemke, R. (2002). “Managing the employee connection.” Managing Service Quality,Vol. 12 No. 2, pp. 73 – 76.
Zimmer, M. and Golden, L. (1988). “Impressions of retail stores: A content analysis ofconsumer images.” Journal of Retailing, Vol. 64 No. 3, pp. 265 – 293.
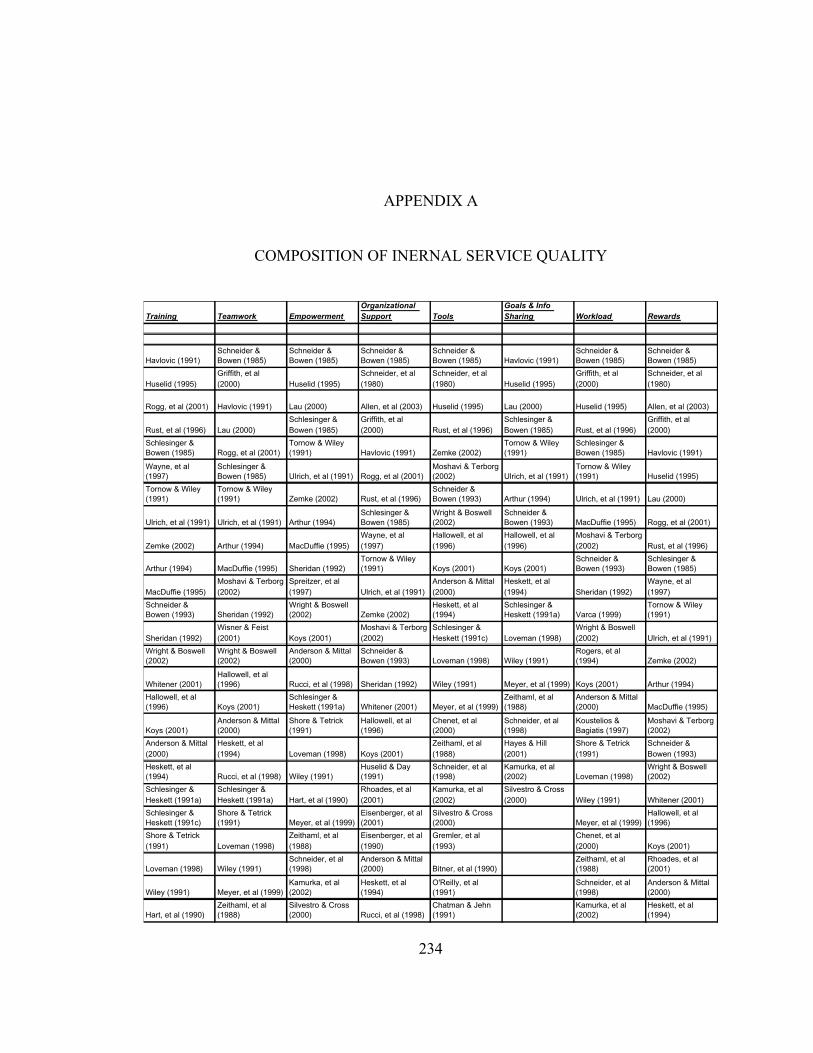
234
APPENDIX A
COMPOSITION OF INERNAL SERVICE QUALITY
Training Teamwork EmpowermentOrganizational Support Tools
Goals & Info Sharing Workload Rewards
Havlovic (1991)Schneider & Bowen (1985)
Schneider & Bowen (1985)
Schneider & Bowen (1985)
Schneider & Bowen (1985) Havlovic (1991)
Schneider & Bowen (1985)
Schneider & Bowen (1985)
Huselid (1995)Griffith, et al (2000) Huselid (1995)
Schneider, et al (1980)
Schneider, et al (1980) Huselid (1995)
Griffith, et al (2000)
Schneider, et al (1980)
Rogg, et al (2001) Havlovic (1991) Lau (2000) Allen, et al (2003) Huselid (1995) Lau (2000) Huselid (1995) Allen, et al (2003)
Rust, et al (1996) Lau (2000)Schlesinger & Bowen (1985)
Griffith, et al (2000) Rust, et al (1996)
Schlesinger & Bowen (1985) Rust, et al (1996)
Griffith, et al (2000)
Schlesinger & Bowen (1985) Rogg, et al (2001)
Tornow & Wiley (1991) Havlovic (1991) Zemke (2002)
Tornow & Wiley (1991)
Schlesinger & Bowen (1985) Havlovic (1991)
Wayne, et al (1997)
Schlesinger & Bowen (1985) Ulrich, et al (1991) Rogg, et al (2001)
Moshavi & Terborg (2002) Ulrich, et al (1991)
Tornow & Wiley (1991) Huselid (1995)
Tornow & Wiley (1991)
Tornow & Wiley (1991) Zemke (2002) Rust, et al (1996)
Schneider & Bowen (1993) Arthur (1994) Ulrich, et al (1991) Lau (2000)
Ulrich, et al (1991) Ulrich, et al (1991) Arthur (1994)Schlesinger & Bowen (1985)
Wright & Boswell (2002)
Schneider & Bowen (1993) MacDuffie (1995) Rogg, et al (2001)
Zemke (2002) Arthur (1994) MacDuffie (1995)Wayne, et al (1997)
Hallowell, et al (1996)
Hallowell, et al (1996)
Moshavi & Terborg (2002) Rust, et al (1996)
Arthur (1994) MacDuffie (1995) Sheridan (1992)Tornow & Wiley (1991) Koys (2001) Koys (2001)
Schneider & Bowen (1993)
Schlesinger & Bowen (1985)
MacDuffie (1995)Moshavi & Terborg (2002)
Spreitzer, et al (1997) Ulrich, et al (1991)
Anderson & Mittal (2000)
Heskett, et al (1994) Sheridan (1992)
Wayne, et al (1997)
Schneider & Bowen (1993) Sheridan (1992)
Wright & Boswell (2002) Zemke (2002)
Heskett, et al (1994)
Schlesinger & Heskett (1991a) Varca (1999)
Tornow & Wiley (1991)
Sheridan (1992)Wisner & Feist (2001) Koys (2001)
Moshavi & Terborg (2002)
Schlesinger & Heskett (1991c) Loveman (1998)
Wright & Boswell (2002) Ulrich, et al (1991)
Wright & Boswell (2002)
Wright & Boswell (2002)
Anderson & Mittal (2000)
Schneider & Bowen (1993) Loveman (1998) Wiley (1991)
Rogers, et al (1994) Zemke (2002)
Whitener (2001)Hallowell, et al (1996) Rucci, et al (1998) Sheridan (1992) Wiley (1991) Meyer, et al (1999) Koys (2001) Arthur (1994)
Hallowell, et al (1996) Koys (2001)
Schlesinger & Heskett (1991a) Whitener (2001) Meyer, et al (1999)
Zeithaml, et al (1988)
Anderson & Mittal (2000) MacDuffie (1995)
Koys (2001)Anderson & Mittal (2000)
Shore & Tetrick (1991)
Hallowell, et al (1996)
Chenet, et al (2000)
Schneider, et al (1998)
Koustelios & Bagiatis (1997)
Moshavi & Terborg (2002)
Anderson & Mittal (2000)
Heskett, et al (1994) Loveman (1998) Koys (2001)
Zeithaml, et al (1988)
Hayes & Hill (2001)
Shore & Tetrick (1991)
Schneider & Bowen (1993)
Heskett, et al (1994) Rucci, et al (1998) Wiley (1991)
Huselid & Day (1991)
Schneider, et al (1998)
Kamurka, et al (2002) Loveman (1998)
Wright & Boswell (2002)
Schlesinger & Heskett (1991a)
Schlesinger & Heskett (1991a) Hart, et al (1990)
Rhoades, et al (2001)
Kamurka, et al (2002)
Silvestro & Cross (2000) Wiley (1991) Whitener (2001)
Schlesinger & Heskett (1991c)
Shore & Tetrick (1991) Meyer, et al (1999)
Eisenberger, et al (2001)
Silvestro & Cross (2000) Meyer, et al (1999)
Hallowell, et al (1996)
Shore & Tetrick (1991) Loveman (1998)
Zeithaml, et al (1988)
Eisenberger, et al (1990)
Gremler, et al (1993)
Chenet, et al (2000) Koys (2001)
Loveman (1998) Wiley (1991)Schneider, et al (1998)
Anderson & Mittal (2000) Bitner, et al (1990)
Zeithaml, et al (1988)
Rhoades, et al (2001)
Wiley (1991) Meyer, et al (1999)Kamurka, et al (2002)
Heskett, et al (1994)
O'Reilly, et al (1991)
Schneider, et al (1998)
Anderson & Mittal (2000)
Hart, et al (1990)Zeithaml, et al (1988)
Silvestro & Cross (2000) Rucci, et al (1998)
Chatman & Jehn (1991)
Kamurka, et al (2002)
Heskett, et al (1994)
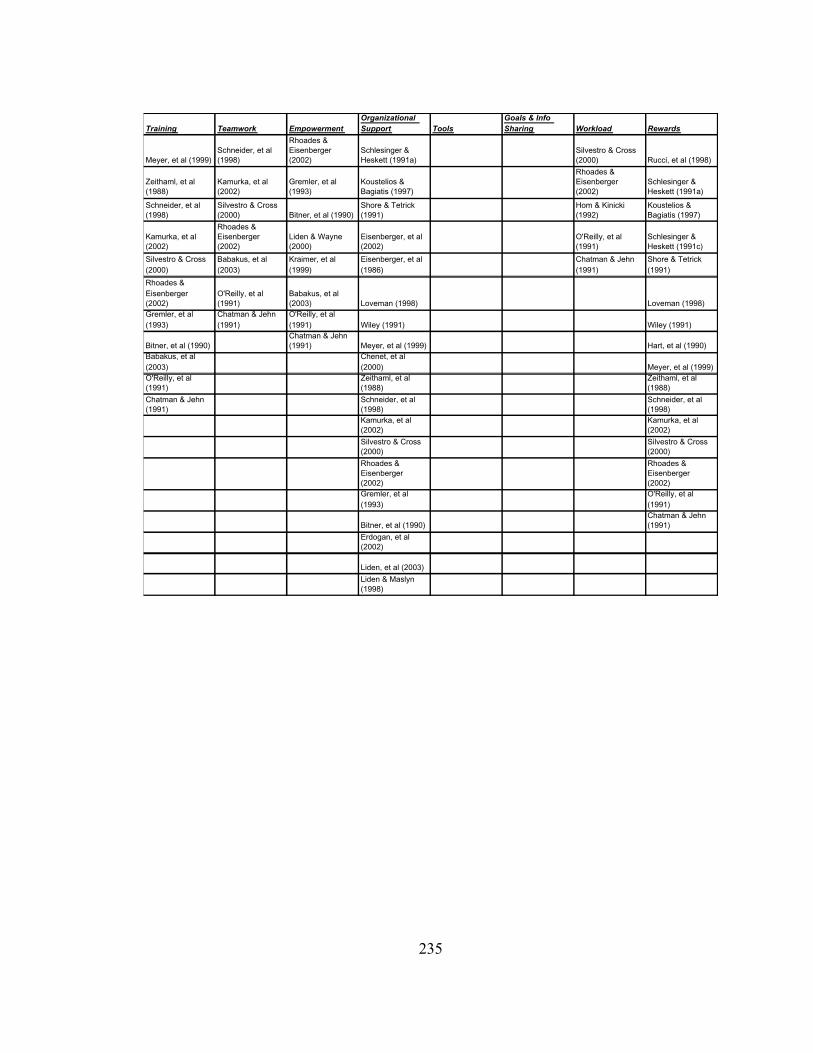
235
Training Teamwork EmpowermentOrganizational Support Tools
Goals & Info Sharing Workload Rewards
Meyer, et al (1999)Schneider, et al (1998)
Rhoades & Eisenberger (2002)
Schlesinger & Heskett (1991a)
Silvestro & Cross (2000) Rucci, et al (1998)
Zeithaml, et al (1988)
Kamurka, et al (2002)
Gremler, et al (1993)
Koustelios & Bagiatis (1997)
Rhoades & Eisenberger (2002)
Schlesinger & Heskett (1991a)
Schneider, et al (1998)
Silvestro & Cross (2000) Bitner, et al (1990)
Shore & Tetrick (1991)
Hom & Kinicki (1992)
Koustelios & Bagiatis (1997)
Kamurka, et al (2002)
Rhoades & Eisenberger (2002)
Liden & Wayne (2000)
Eisenberger, et al (2002)
O'Reilly, et al (1991)
Schlesinger & Heskett (1991c)
Silvestro & Cross (2000)
Babakus, et al (2003)
Kraimer, et al (1999)
Eisenberger, et al (1986)
Chatman & Jehn (1991)
Shore & Tetrick (1991)
Rhoades & Eisenberger (2002)
O'Reilly, et al (1991)
Babakus, et al (2003) Loveman (1998) Loveman (1998)
Gremler, et al (1993)
Chatman & Jehn (1991)
O'Reilly, et al (1991) Wiley (1991) Wiley (1991)
Bitner, et al (1990)Chatman & Jehn (1991) Meyer, et al (1999) Hart, et al (1990)
Babakus, et al (2003)
Chenet, et al (2000) Meyer, et al (1999)
O'Reilly, et al (1991)
Zeithaml, et al (1988)
Zeithaml, et al (1988)
Chatman & Jehn (1991)
Schneider, et al (1998)
Schneider, et al (1998)
Kamurka, et al (2002)
Kamurka, et al (2002)
Silvestro & Cross (2000)
Silvestro & Cross (2000)
Rhoades & Eisenberger (2002)
Rhoades & Eisenberger (2002)
Gremler, et al (1993)
O'Reilly, et al (1991)
Bitner, et al (1990)Chatman & Jehn (1991)
Erdogan, et al (2002)
Liden, et al (2003)
Liden & Maslyn (1998)
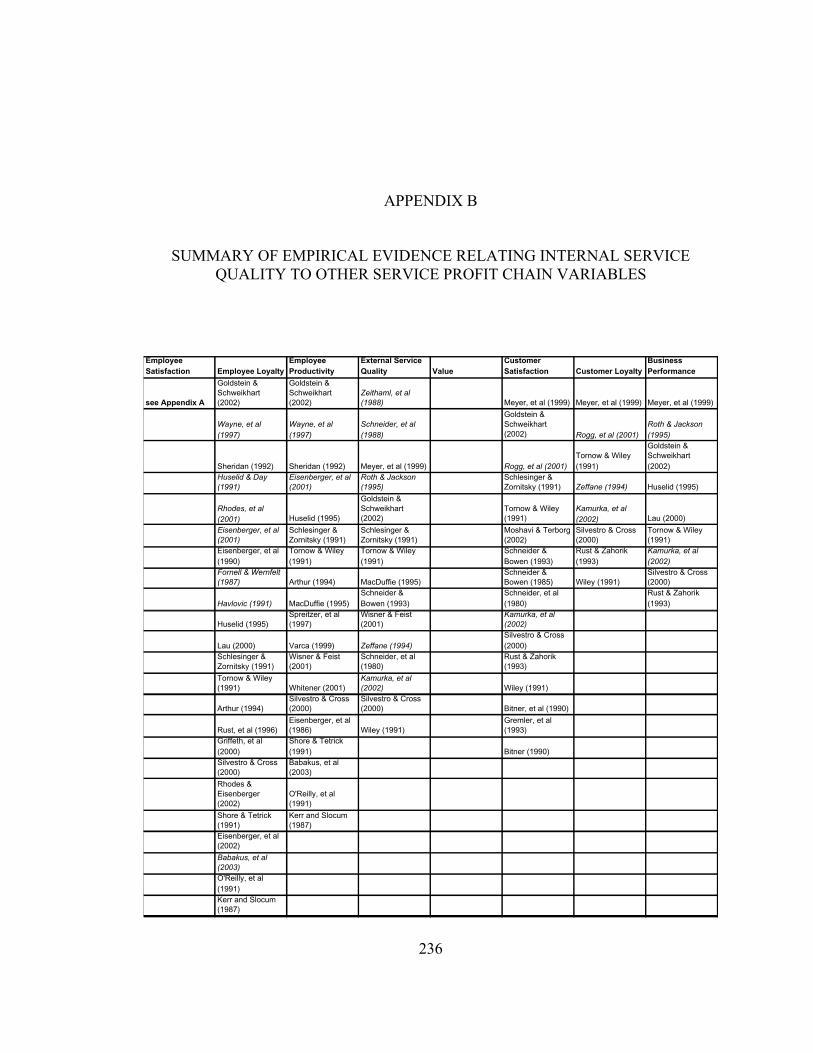
236
APPENDIX B
SUMMARY OF EMPIRICAL EVIDENCE RELATING INTERNAL SERVICEQUALITY TO OTHER SERVICE PROFIT CHAIN VARIABLES
Employee Satisfaction Employee Loyalty
Employee Productivity
External Service Quality Value
Customer Satisfaction Customer Loyalty
Business Performance
see Appendix A
Goldstein & Schweikhart (2002)
Goldstein & Schweikhart (2002)
Zeithaml, et al (1988) Meyer, et al (1999) Meyer, et al (1999) Meyer, et al (1999)
Wayne, et al (1997)
Wayne, et al (1997)
Schneider, et al (1988)
Goldstein & Schweikhart (2002) Rogg, et al (2001)
Roth & Jackson (1995)
Sheridan (1992) Sheridan (1992) Meyer, et al (1999) Rogg, et al (2001)Tornow & Wiley (1991)
Goldstein & Schweikhart (2002)
Huselid & Day (1991)
Eisenberger, et al (2001)
Roth & Jackson (1995)
Schlesinger & Zornitsky (1991) Zeffane (1994) Huselid (1995)
Rhodes, et al (2001) Huselid (1995)
Goldstein & Schweikhart (2002)
Tornow & Wiley (1991)
Kamurka, et al (2002) Lau (2000)
Eisenberger, et al (2001)
Schlesinger & Zornitsky (1991)
Schlesinger & Zornitsky (1991)
Moshavi & Terborg (2002)
Silvestro & Cross (2000)
Tornow & Wiley (1991)
Eisenberger, et al (1990)
Tornow & Wiley (1991)
Tornow & Wiley (1991)
Schneider & Bowen (1993)
Rust & Zahorik (1993)
Kamurka, et al (2002)
Fornell & Wernfelt (1987) Arthur (1994) MacDuffie (1995)
Schneider & Bowen (1985) Wiley (1991)
Silvestro & Cross (2000)
Havlovic (1991) MacDuffie (1995)Schneider & Bowen (1993)
Schneider, et al (1980)
Rust & Zahorik (1993)
Huselid (1995)Spreitzer, et al (1997)
Wisner & Feist (2001)
Kamurka, et al (2002)
Lau (2000) Varca (1999) Zeffane (1994)Silvestro & Cross (2000)
Schlesinger & Zornitsky (1991)
Wisner & Feist (2001)
Schneider, et al (1980)
Rust & Zahorik (1993)
Tornow & Wiley (1991) Whitener (2001)
Kamurka, et al (2002) Wiley (1991)
Arthur (1994)Silvestro & Cross (2000)
Silvestro & Cross (2000) Bitner, et al (1990)
Rust, et al (1996)Eisenberger, et al (1986) Wiley (1991)
Gremler, et al (1993)
Griffeth, et al (2000)
Shore & Tetrick (1991) Bitner (1990)
Silvestro & Cross (2000)
Babakus, et al (2003)
Rhodes & Eisenberger (2002)
O'Reilly, et al (1991)
Shore & Tetrick (1991)
Kerr and Slocum (1987)
Eisenberger, et al (2002)
Babakus, et al (2003)O'Reilly, et al (1991)Kerr and Slocum (1987)
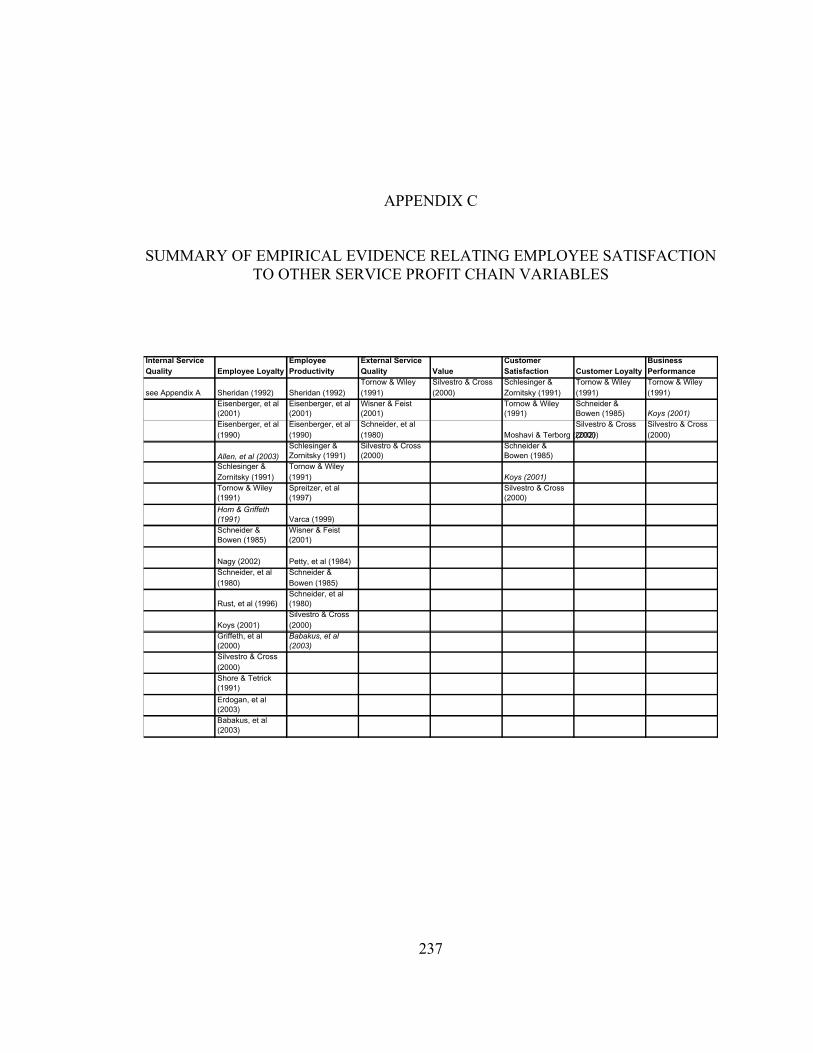
237
APPENDIX C
SUMMARY OF EMPIRICAL EVIDENCE RELATING EMPLOYEE SATISFACTIONTO OTHER SERVICE PROFIT CHAIN VARIABLES
Internal Service Quality Employee Loyalty
Employee Productivity
External Service Quality Value
Customer Satisfaction Customer Loyalty
Business Performance
see Appendix A Sheridan (1992) Sheridan (1992)Tornow & Wiley (1991)
Silvestro & Cross (2000)
Schlesinger & Zornitsky (1991)
Tornow & Wiley (1991)
Tornow & Wiley (1991)
Eisenberger, et al (2001)
Eisenberger, et al (2001)
Wisner & Feist (2001)
Tornow & Wiley (1991)
Schneider & Bowen (1985) Koys (2001)
Eisenberger, et al (1990)
Eisenberger, et al (1990)
Schneider, et al (1980) Moshavi & Terborg (2002)
Silvestro & Cross (2000)
Silvestro & Cross (2000)
Allen, et al (2003)Schlesinger & Zornitsky (1991)
Silvestro & Cross (2000)
Schneider & Bowen (1985)
Schlesinger & Zornitsky (1991)
Tornow & Wiley (1991) Koys (2001)
Tornow & Wiley (1991)
Spreitzer, et al (1997)
Silvestro & Cross (2000)
Hom & Griffeth (1991) Varca (1999)Schneider & Bowen (1985)
Wisner & Feist (2001)
Nagy (2002) Petty, et al (1984)Schneider, et al (1980)
Schneider & Bowen (1985)
Rust, et al (1996)Schneider, et al (1980)
Koys (2001)Silvestro & Cross (2000)
Griffeth, et al (2000)
Babakus, et al (2003)
Silvestro & Cross (2000)Shore & Tetrick (1991)
Erdogan, et al (2003)Babakus, et al (2003)
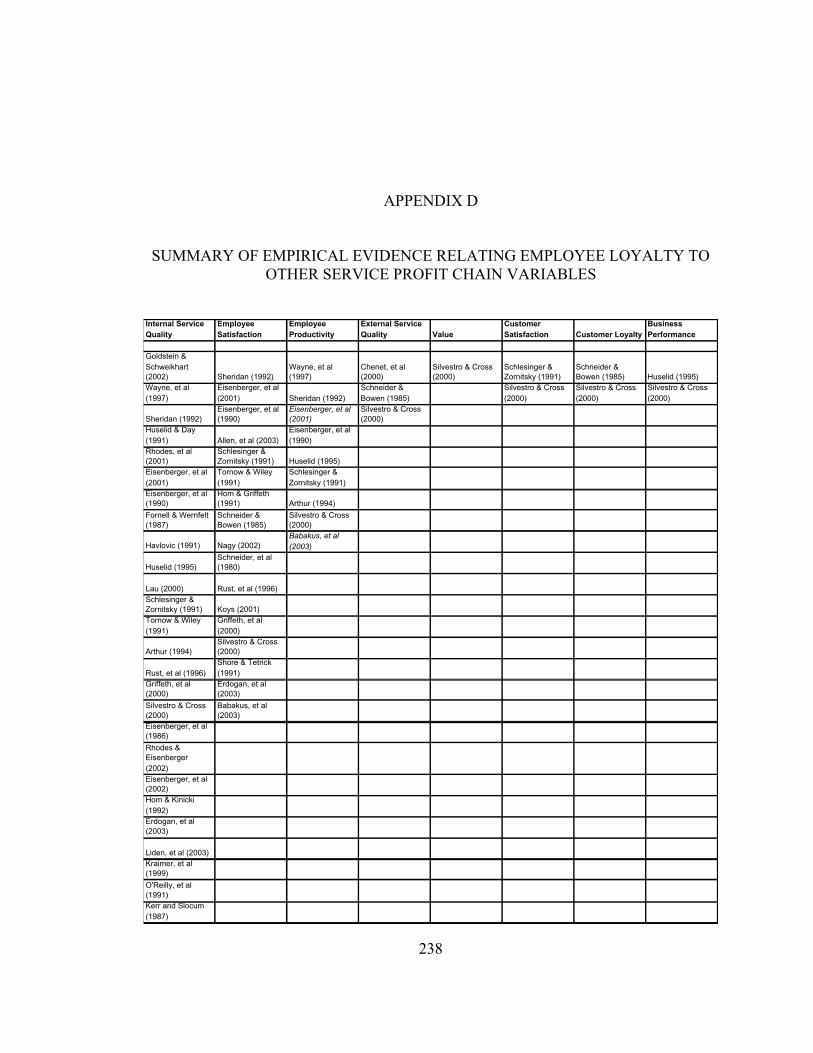
238
APPENDIX D
SUMMARY OF EMPIRICAL EVIDENCE RELATING EMPLOYEE LOYALTY TOOTHER SERVICE PROFIT CHAIN VARIABLES
Internal Service Quality
Employee Satisfaction
Employee Productivity
External Service Quality Value
Customer Satisfaction Customer Loyalty
Business Performance
Goldstein & Schweikhart (2002) Sheridan (1992)
Wayne, et al (1997)
Chenet, et al (2000)
Silvestro & Cross (2000)
Schlesinger & Zornitsky (1991)
Schneider & Bowen (1985) Huselid (1995)
Wayne, et al (1997)
Eisenberger, et al (2001) Sheridan (1992)
Schneider & Bowen (1985)
Silvestro & Cross (2000)
Silvestro & Cross (2000)
Silvestro & Cross (2000)
Sheridan (1992)Eisenberger, et al (1990)
Eisenberger, et al (2001)
Silvestro & Cross (2000)
Huselid & Day (1991) Allen, et al (2003)
Eisenberger, et al (1990)
Rhodes, et al (2001)
Schlesinger & Zornitsky (1991) Huselid (1995)
Eisenberger, et al (2001)
Tornow & Wiley (1991)
Schlesinger & Zornitsky (1991)
Eisenberger, et al (1990)
Hom & Griffeth (1991) Arthur (1994)
Fornell & Wernfelt (1987)
Schneider & Bowen (1985)
Silvestro & Cross (2000)
Havlovic (1991) Nagy (2002)Babakus, et al (2003)
Huselid (1995)Schneider, et al (1980)
Lau (2000) Rust, et al (1996)Schlesinger & Zornitsky (1991) Koys (2001)Tornow & Wiley (1991)
Griffeth, et al (2000)
Arthur (1994)Silvestro & Cross (2000)
Rust, et al (1996)Shore & Tetrick (1991)
Griffeth, et al (2000)
Erdogan, et al (2003)
Silvestro & Cross (2000)
Babakus, et al (2003)
Eisenberger, et al (1986)
Rhodes & Eisenberger (2002)Eisenberger, et al (2002)Hom & Kinicki (1992)Erdogan, et al (2003)
Liden, et al (2003)Kraimer, et al (1999)
O'Reilly, et al (1991)Kerr and Slocum (1987)
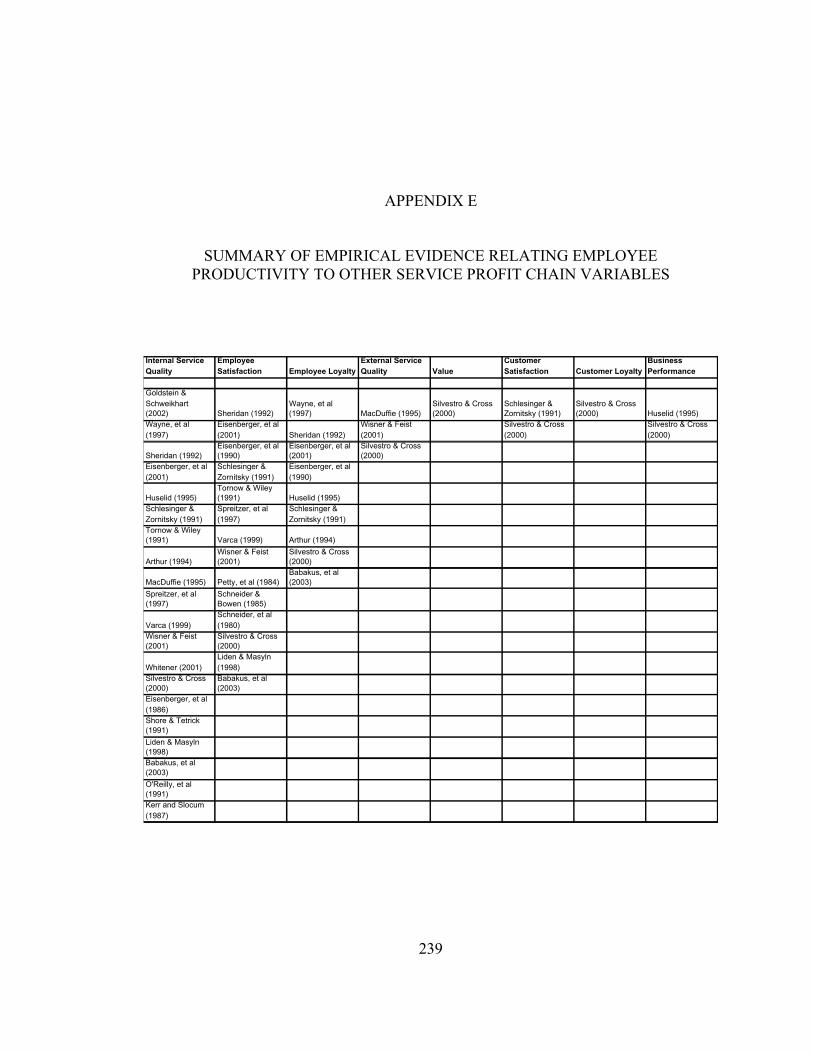
239
APPENDIX E
SUMMARY OF EMPIRICAL EVIDENCE RELATING EMPLOYEEPRODUCTIVITY TO OTHER SERVICE PROFIT CHAIN VARIABLES
Internal Service Quality
Employee Satisfaction Employee Loyalty
External Service Quality Value
Customer Satisfaction Customer Loyalty
Business Performance
Goldstein & Schweikhart (2002) Sheridan (1992)
Wayne, et al (1997) MacDuffie (1995)
Silvestro & Cross (2000)
Schlesinger & Zornitsky (1991)
Silvestro & Cross (2000) Huselid (1995)
Wayne, et al (1997)
Eisenberger, et al (2001) Sheridan (1992)
Wisner & Feist (2001)
Silvestro & Cross (2000)
Silvestro & Cross (2000)
Sheridan (1992)Eisenberger, et al (1990)
Eisenberger, et al (2001)
Silvestro & Cross (2000)
Eisenberger, et al (2001)
Schlesinger & Zornitsky (1991)
Eisenberger, et al (1990)
Huselid (1995)Tornow & Wiley (1991) Huselid (1995)
Schlesinger & Zornitsky (1991)
Spreitzer, et al (1997)
Schlesinger & Zornitsky (1991)
Tornow & Wiley (1991) Varca (1999) Arthur (1994)
Arthur (1994)Wisner & Feist (2001)
Silvestro & Cross (2000)
MacDuffie (1995) Petty, et al (1984)Babakus, et al (2003)
Spreitzer, et al (1997)
Schneider & Bowen (1985)
Varca (1999)Schneider, et al (1980)
Wisner & Feist (2001)
Silvestro & Cross (2000)
Whitener (2001)Liden & Masyln (1998)
Silvestro & Cross (2000)
Babakus, et al (2003)
Eisenberger, et al (1986)Shore & Tetrick (1991)
Liden & Masyln (1998)Babakus, et al (2003)
O'Reilly, et al (1991)Kerr and Slocum (1987)
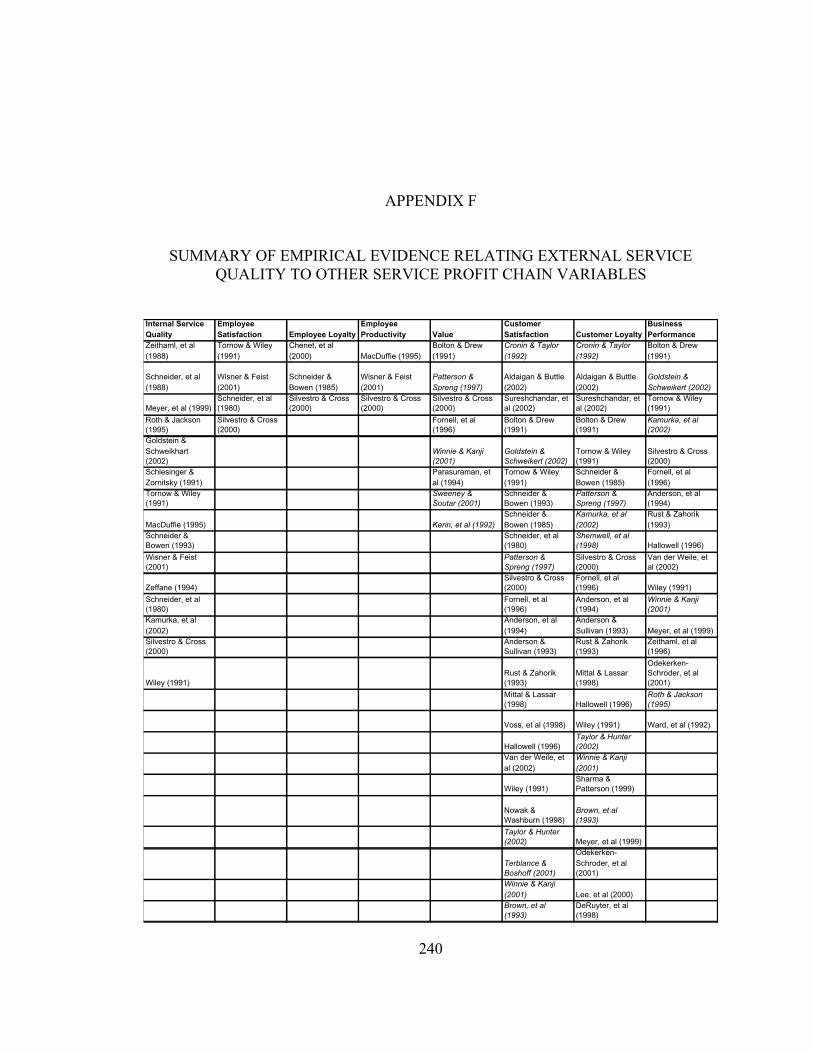
240
APPENDIX F
SUMMARY OF EMPIRICAL EVIDENCE RELATING EXTERNAL SERVICEQUALITY TO OTHER SERVICE PROFIT CHAIN VARIABLES
Internal Service Quality
Employee Satisfaction Employee Loyalty
Employee Productivity Value
Customer Satisfaction Customer Loyalty
Business Performance
Zeithaml, et al (1988)
Tornow & Wiley (1991)
Chenet, et al (2000) MacDuffie (1995)
Bolton & Drew (1991)
Cronin & Taylor (1992)
Cronin & Taylor (1992)
Bolton & Drew (1991)
Schneider, et al (1988)
Wisner & Feist (2001)
Schneider & Bowen (1985)
Wisner & Feist (2001)
Patterson & Spreng (1997)
Aldaigan & Buttle (2002)
Aldaigan & Buttle (2002)
Goldstein & Schweikert (2002)
Meyer, et al (1999)Schneider, et al (1980)
Silvestro & Cross (2000)
Silvestro & Cross (2000)
Silvestro & Cross (2000)
Sureshchandar, et al (2002)
Sureshchandar, et al (2002)
Tornow & Wiley (1991)
Roth & Jackson (1995)
Silvestro & Cross (2000)
Fornell, et al (1996)
Bolton & Drew (1991)
Bolton & Drew (1991)
Kamurka, et al (2002)
Goldstein & Schweikhart (2002)
Winnie & Kanji (2001)
Goldstein & Schweikert (2002)
Tornow & Wiley (1991)
Silvestro & Cross (2000)
Schlesinger & Zornitsky (1991)
Parasuraman, et al (1994)
Tornow & Wiley (1991)
Schneider & Bowen (1985)
Fornell, et al (1996)
Tornow & Wiley (1991)
Sweeney & Soutar (2001)
Schneider & Bowen (1993)
Patterson & Spreng (1997)
Anderson, et al (1994)
MacDuffie (1995) Kerin, et al (1992)Schneider & Bowen (1985)
Kamurka, et al (2002)
Rust & Zahorik (1993)
Schneider & Bowen (1993)
Schneider, et al (1980)
Shemwell, et al (1998) Hallowell (1996)
Wisner & Feist (2001)
Patterson & Spreng (1997)
Silvestro & Cross (2000)
Van der Weile, et al (2002)
Zeffane (1994)Silvestro & Cross (2000)
Fornell, et al (1996) Wiley (1991)
Schneider, et al (1980)
Fornell, et al (1996)
Anderson, et al (1994)
Winnie & Kanji (2001)
Kamurka, et al (2002)
Anderson, et al (1994)
Anderson & Sullivan (1993) Meyer, et al (1999)
Silvestro & Cross (2000)
Anderson & Sullivan (1993)
Rust & Zahorik (1993)
Zeithaml, et al (1996)
Wiley (1991)Rust & Zahorik (1993)
Mittal & Lassar (1998)
Odekerken-Schroder, et al (2001)
Mittal & Lassar (1998) Hallowell (1996)
Roth & Jackson (1995)
Voss, et al (1998) Wiley (1991) Ward, et al (1992)
Hallowell (1996)Taylor & Hunter (2002)
Van der Weile, et al (2002)
Winnie & Kanji (2001)
Wiley (1991)Sharma & Patterson (1999)
Nowak & Washburn (1998)
Brown, et al (1993)
Taylor & Hunter (2002) Meyer, et al (1999)
Terblance & Boshoff (2001)
Odekerken-Schroder, et al (2001)
Winnie & Kanji (2001) Lee, et al (2000)Brown, et al (1993)
DeRuyter, et al (1998)
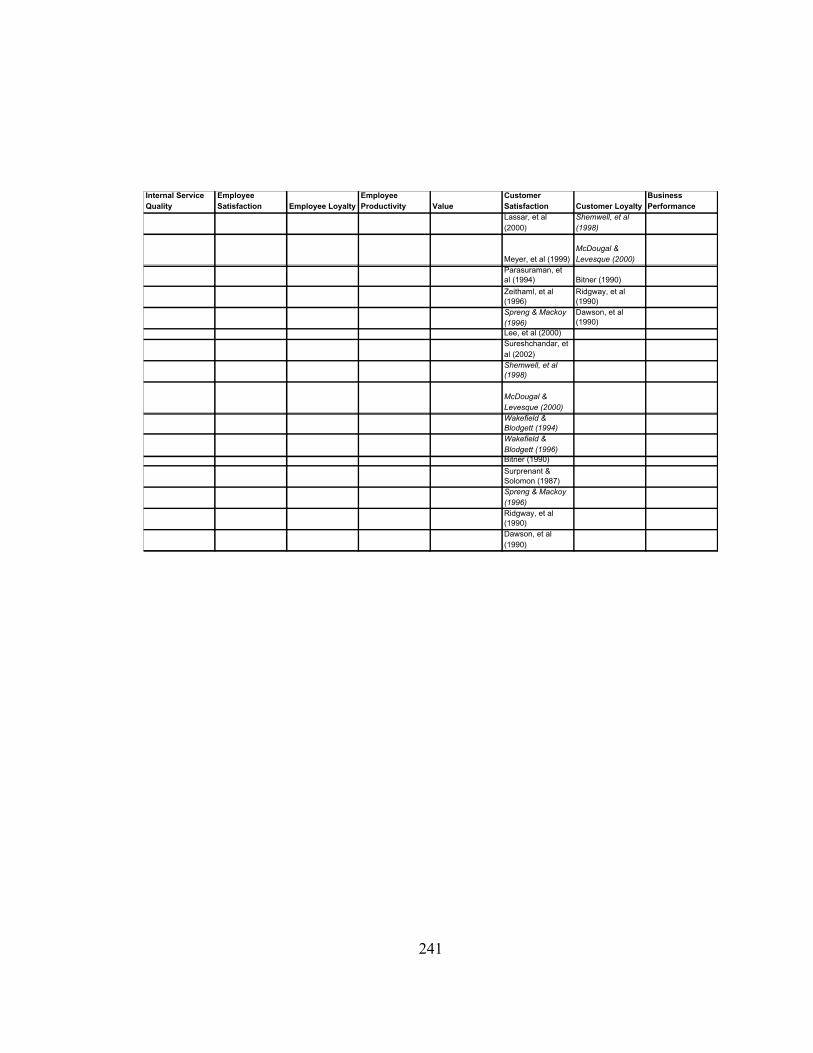
241
Internal Service Quality
Employee Satisfaction Employee Loyalty
Employee Productivity Value
Customer Satisfaction Customer Loyalty
Business Performance
Lassar, et al (2000)
Shemwell, et al (1998)
Meyer, et al (1999)McDougal & Levesque (2000)
Parasuraman, et al (1994) Bitner (1990)
Zeithaml, et al (1996)
Ridgway, et al (1990)
Spreng & Mackoy (1996)
Dawson, et al (1990)
Lee, et al (2000)Sureshchandar, et al (2002)Shemwell, et al (1998)
McDougal & Levesque (2000)Wakefield & Blodgett (1994)Wakefield & Blodgett (1996)Bitner (1990)
Surprenant & Solomon (1987)Spreng & Mackoy (1996)Ridgway, et al (1990)Dawson, et al (1990)
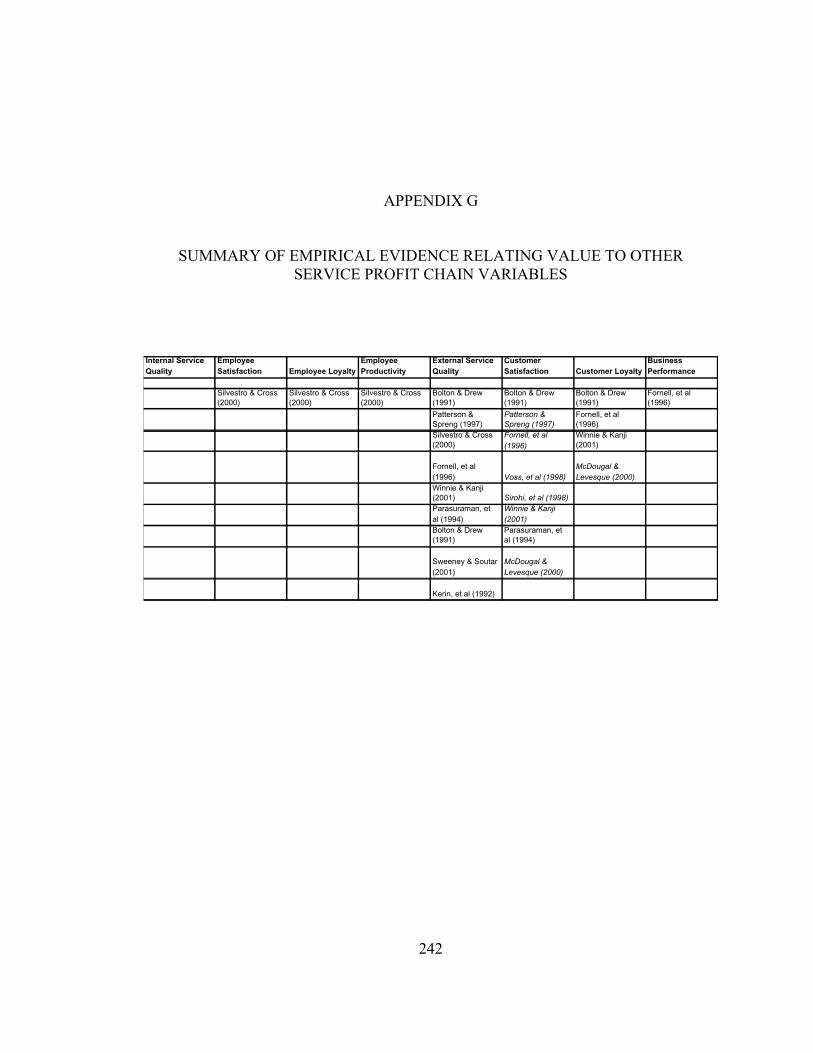
242
APPENDIX G
SUMMARY OF EMPIRICAL EVIDENCE RELATING VALUE TO OTHERSERVICE PROFIT CHAIN VARIABLES
Internal Service Quality
Employee Satisfaction Employee Loyalty
Employee Productivity
External Service Quality
Customer Satisfaction Customer Loyalty
Business Performance
Silvestro & Cross (2000)
Silvestro & Cross (2000)
Silvestro & Cross (2000)
Bolton & Drew (1991)
Bolton & Drew (1991)
Bolton & Drew (1991)
Fornell, et al (1996)
Patterson & Spreng (1997)
Patterson & Spreng (1997)
Fornell, et al (1996)
Silvestro & Cross (2000)
Fornell, et al (1996)
Winnie & Kanji (2001)
Fornell, et al (1996) Voss, et al (1998)
McDougal & Levesque (2000)
Winnie & Kanji (2001) Sirohi, et al (1998)Parasuraman, et al (1994)
Winnie & Kanji (2001)
Bolton & Drew (1991)
Parasuraman, et al (1994)
Sweeney & Soutar (2001)
McDougal & Levesque (2000)
Kerin, et al (1992)
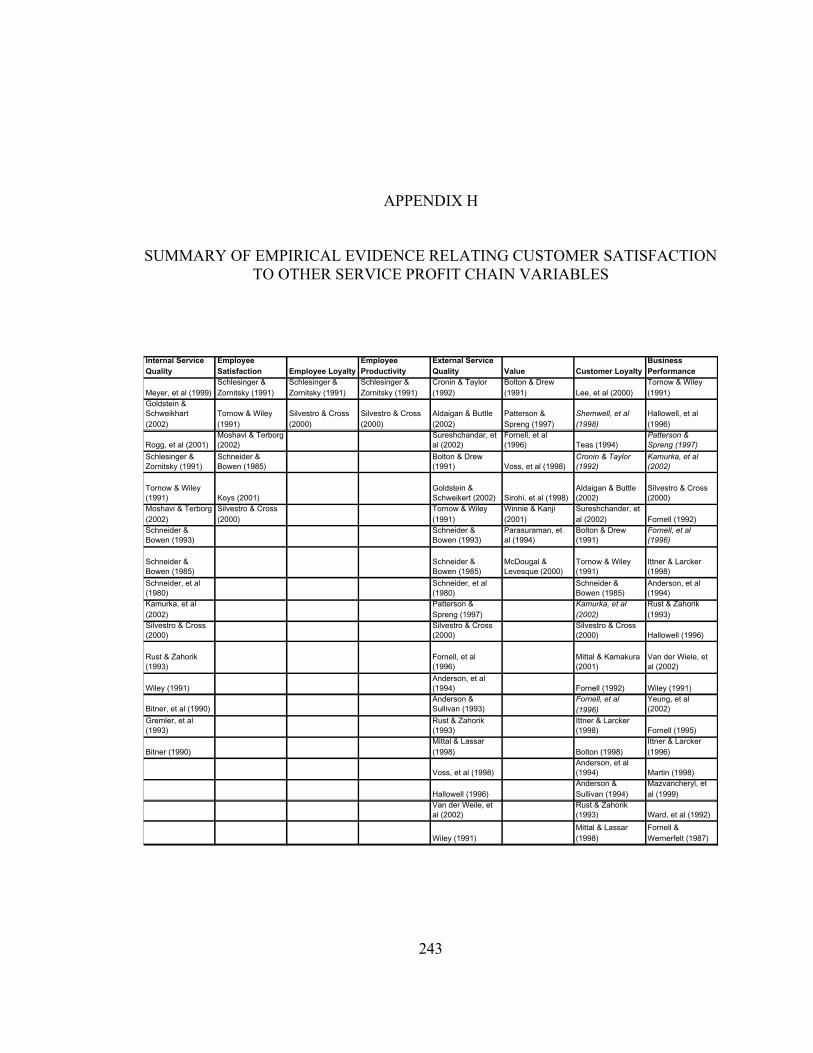
243
APPENDIX H
SUMMARY OF EMPIRICAL EVIDENCE RELATING CUSTOMER SATISFACTIONTO OTHER SERVICE PROFIT CHAIN VARIABLES
Internal Service Quality
Employee Satisfaction Employee Loyalty
Employee Productivity
External Service Quality Value Customer Loyalty
Business Performance
Meyer, et al (1999)Schlesinger & Zornitsky (1991)
Schlesinger & Zornitsky (1991)
Schlesinger & Zornitsky (1991)
Cronin & Taylor (1992)
Bolton & Drew (1991) Lee, et al (2000)
Tornow & Wiley (1991)
Goldstein & Schweikhart (2002)
Tornow & Wiley (1991)
Silvestro & Cross (2000)
Silvestro & Cross (2000)
Aldaigan & Buttle (2002)
Patterson & Spreng (1997)
Shemwell, et al (1998)
Hallowell, et al (1996)
Rogg, et al (2001)Moshavi & Terborg (2002)
Sureshchandar, et al (2002)
Fornell, et al (1996) Teas (1994)
Patterson & Spreng (1997)
Schlesinger & Zornitsky (1991)
Schneider & Bowen (1985)
Bolton & Drew (1991) Voss, et al (1998)
Cronin & Taylor (1992)
Kamurka, et al (2002)
Tornow & Wiley (1991) Koys (2001)
Goldstein & Schweikert (2002) Sirohi, et al (1998)
Aldaigan & Buttle (2002)
Silvestro & Cross (2000)
Moshavi & Terborg (2002)
Silvestro & Cross (2000)
Tornow & Wiley (1991)
Winnie & Kanji (2001)
Sureshchander, et al (2002) Fornell (1992)
Schneider & Bowen (1993)
Schneider & Bowen (1993)
Parasuraman, et al (1994)
Bolton & Drew (1991)
Fornell, et al (1996)
Schneider & Bowen (1985)
Schneider & Bowen (1985)
McDougal & Levesque (2000)
Tornow & Wiley (1991)
Ittner & Larcker (1998)
Schneider, et al (1980)
Schneider, et al (1980)
Schneider & Bowen (1985)
Anderson, et al (1994)
Kamurka, et al (2002)
Patterson & Spreng (1997)
Kamurka, et al (2002)
Rust & Zahorik (1993)
Silvestro & Cross (2000)
Silvestro & Cross (2000)
Silvestro & Cross (2000) Hallowell (1996)
Rust & Zahorik (1993)
Fornell, et al (1996)
Mittal & Kamakura (2001)
Van der Wiele, et al (2002)
Wiley (1991)Anderson, et al (1994) Fornell (1992) Wiley (1991)
Bitner, et al (1990)Anderson & Sullivan (1993)
Fornell, et al (1996)
Yeung, et al (2002)
Gremler, et al (1993)
Rust & Zahorik (1993)
Ittner & Larcker (1998) Fornell (1995)
Bitner (1990)Mittal & Lassar (1998) Bolton (1998)
Ittner & Larcker (1996)
Voss, et al (1998)Anderson, et al (1994) Martin (1998)
Hallowell (1996)Anderson & Sullivan (1994)
Mazvancheryl, et al (1999)
Van der Weile, et al (2002)
Rust & Zahorik (1993) Ward, et al (1992)
Wiley (1991)Mittal & Lassar (1998)
Fornell & Wernerfelt (1987)
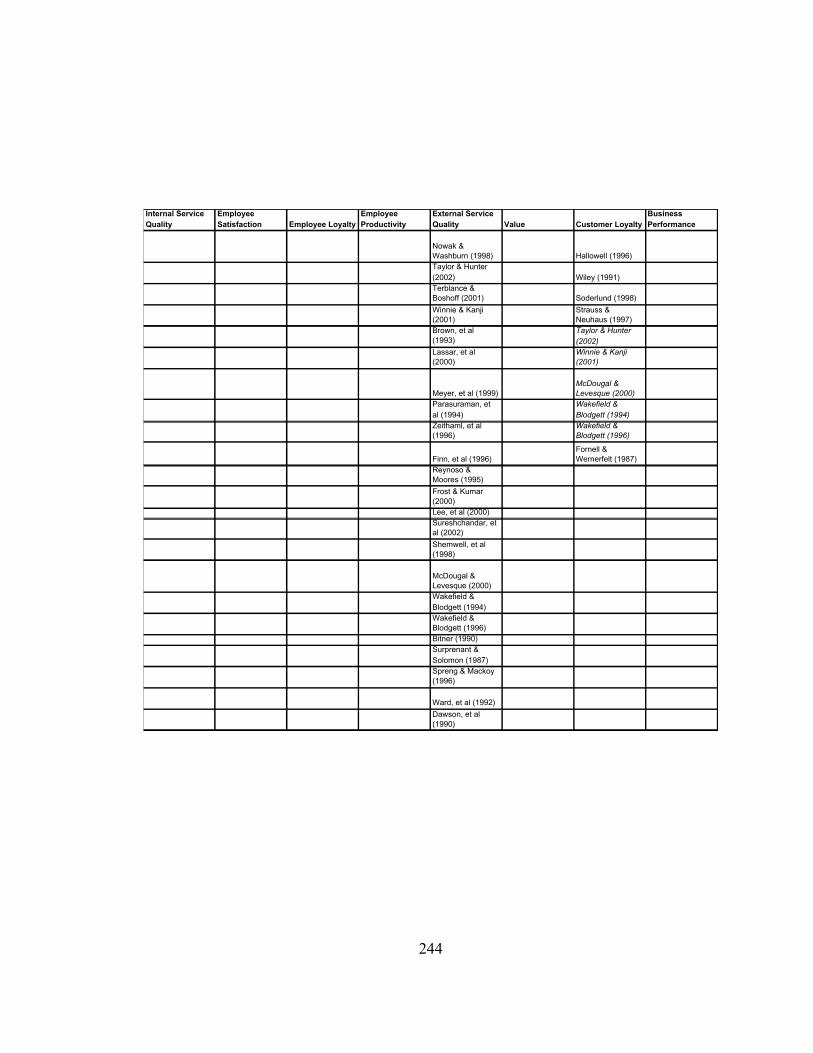
244
Internal Service Quality
Employee Satisfaction Employee Loyalty
Employee Productivity
External Service Quality Value Customer Loyalty
Business Performance
Nowak & Washburn (1998) Hallowell (1996)Taylor & Hunter (2002) Wiley (1991)Terblance & Boshoff (2001) Soderlund (1998)
Winnie & Kanji (2001)
Strauss & Neuhaus (1997)
Brown, et al (1993)
Taylor & Hunter (2002)
Lassar, et al (2000)
Winnie & Kanji (2001)
Meyer, et al (1999)McDougal & Levesque (2000)
Parasuraman, et al (1994)
Wakefield & Blodgett (1994)
Zeithaml, et al (1996)
Wakefield & Blodgett (1996)
Finn, et al (1996)Fornell & Wernerfelt (1987)
Reynoso & Moores (1995)
Frost & Kumar (2000)Lee, et al (2000)Sureshchandar, et al (2002)
Shemwell, et al (1998)
McDougal & Levesque (2000)Wakefield & Blodgett (1994)Wakefield & Blodgett (1996)Bitner (1990)Surprenant & Solomon (1987)Spreng & Mackoy (1996)
Ward, et al (1992)
Dawson, et al (1990)
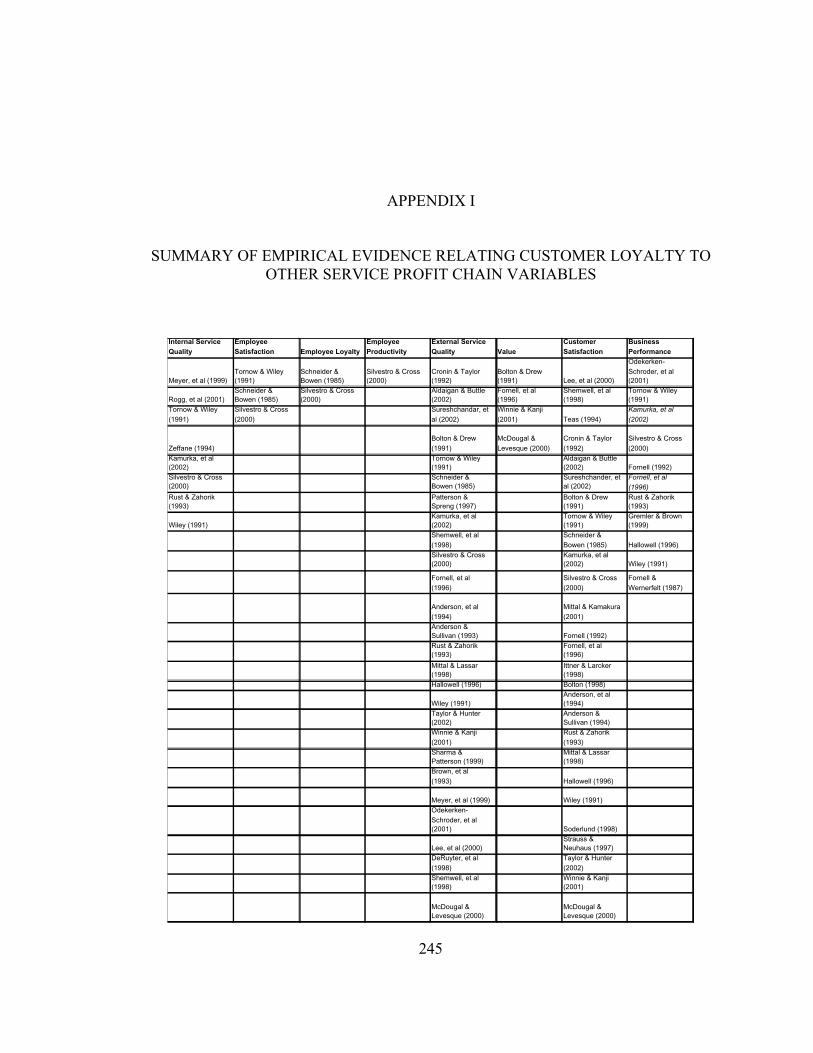
245
APPENDIX I
SUMMARY OF EMPIRICAL EVIDENCE RELATING CUSTOMER LOYALTY TOOTHER SERVICE PROFIT CHAIN VARIABLES
Internal Service
Quality
Employee
Satisfaction Employee Loyalty
Employee
Productivity
External Service
Quality Value
Customer
Satisfaction
Business
Performance
Meyer, et al (1999)Tornow & Wiley (1991)
Schneider & Bowen (1985)
Silvestro & Cross (2000)
Cronin & Taylor (1992)
Bolton & Drew (1991) Lee, et al (2000)
Odekerken-
Schroder, et al (2001)
Rogg, et al (2001)Schneider & Bowen (1985)
Silvestro & Cross (2000)
Aldaigan & Buttle (2002)
Fornell, et al (1996)
Shemwell, et al (1998)
Tornow & Wiley (1991)
Tornow & Wiley
(1991)
Silvestro & Cross
(2000)
Sureshchandar, et
al (2002)
Winnie & Kanji
(2001) Teas (1994)
Kamurka, et al
(2002)
Zeffane (1994)
Bolton & Drew
(1991)
McDougal &
Levesque (2000)
Cronin & Taylor
(1992)
Silvestro & Cross
(2000)
Kamurka, et al (2002)
Tornow & Wiley (1991)
Aldaigan & Buttle (2002) Fornell (1992)
Silvestro & Cross (2000)
Schneider & Bowen (1985)
Sureshchander, et al (2002)
Fornell, et al
(1996)
Rust & Zahorik (1993)
Patterson & Spreng (1997)
Bolton & Drew (1991)
Rust & Zahorik (1993)
Wiley (1991)Kamurka, et al (2002)
Tornow & Wiley (1991)
Gremler & Brown (1999)
Shemwell, et al
(1998)
Schneider &
Bowen (1985) Hallowell (1996)
Silvestro & Cross (2000)
Kamurka, et al (2002) Wiley (1991)
Fornell, et al
(1996)
Silvestro & Cross
(2000)
Fornell &
Wernerfelt (1987)
Anderson, et al
(1994)
Mittal & Kamakura
(2001)
Anderson & Sullivan (1993) Fornell (1992)
Rust & Zahorik (1993)
Fornell, et al (1996)
Mittal & Lassar (1998)
Ittner & Larcker (1998)
Hallowell (1996) Bolton (1998)
Wiley (1991)Anderson, et al (1994)
Taylor & Hunter (2002)
Anderson & Sullivan (1994)
Winnie & Kanji
(2001)
Rust & Zahorik
(1993)
Sharma & Patterson (1999)
Mittal & Lassar (1998)
Brown, et al
(1993) Hallowell (1996)
Meyer, et al (1999) Wiley (1991)
Odekerken-
Schroder, et al (2001) Soderlund (1998)
Lee, et al (2000)Strauss & Neuhaus (1997)
DeRuyter, et al
(1998)
Taylor & Hunter
(2002)
Shemwell, et al (1998)
Winnie & Kanji (2001)
McDougal & Levesque (2000)
McDougal & Levesque (2000)
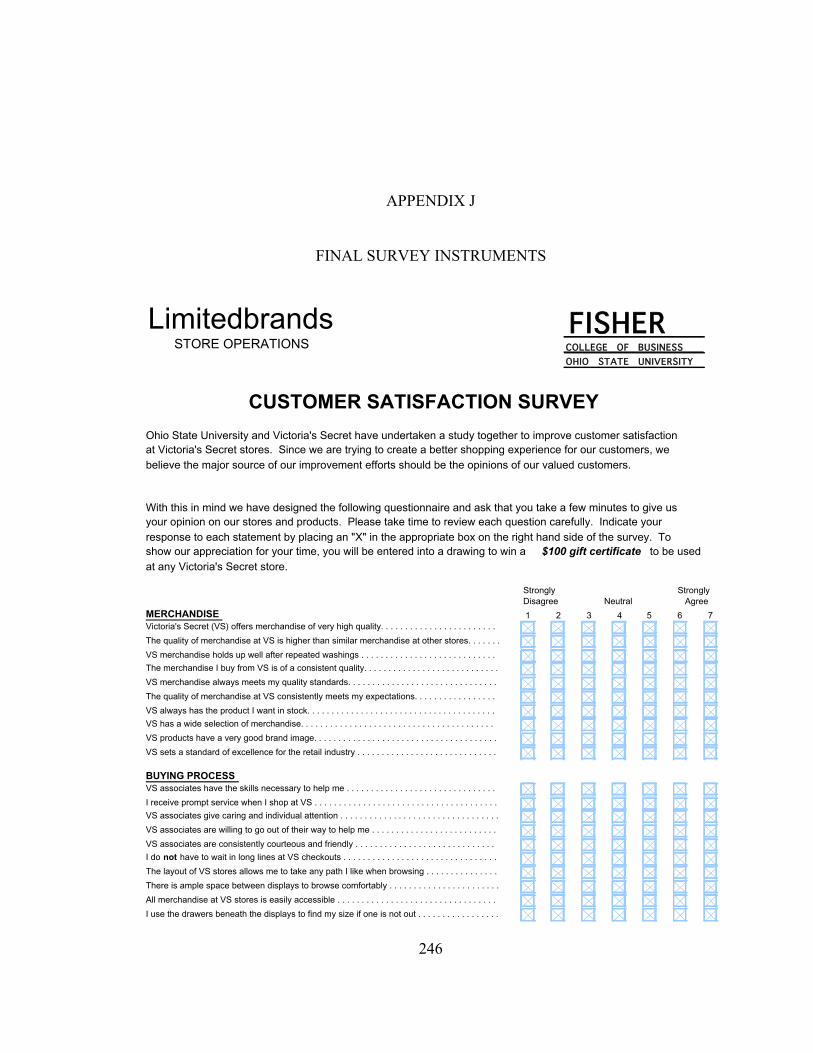
246
APPENDIX J
FINAL SURVEY INSTRUMENTS
Limitedbrands FISHERCOLLEGE OF BUSINESSOHIO STATE UNIVERSITY
Ohio State University and Victoria's Secret have undertaken a study together to improve customer satisfactionat Victoria's Secret stores. Since we are trying to create a better shopping experience for our customers, webelieve the major source of our improvement efforts should be the opinions of our valued customers.
With this in mind we have designed the following questionnaire and ask that you take a few minutes to give usyour opinion on our stores and products. Please take time to review each question carefully. Indicate your response to each statement by placing an "X" in the appropriate box on the right hand side of the survey. Toshow our appreciation for your time, you will be entered into a drawing to win a $100 gift certificate to be usedat any Victoria's Secret store.
Strongly StronglyDisagree Neutral Agree
MERCHANDISE 1 2 3 4 5 6 7Victoria's Secret (VS) offers merchandise of very high quality. . . . . . . . . . . . . . . . . . . . . . . .
The quality of merchandise at VS is higher than similar merchandise at other stores. . . . . . .
VS merchandise holds up well after repeated washings . . . . . . . . . . . . . . . . . . . . . . . . . . . .
The merchandise I buy from VS is of a consistent quality. . . . . . . . . . . . . . . . . . . . . . . . . . . .
VS merchandise always meets my quality standards. . . . . . . . . . . . . . . . . . . . . . . . . . . . . . .
The quality of merchandise at VS consistently meets my expectations. . . . . . . . . . . . . . . . .
VS always has the product I want in stock. . . . . . . . . . . . . . . . . . . . . . . . . . . . . . . . . . . . . . .
VS has a wide selection of merchandise. . . . . . . . . . . . . . . . . . . . . . . . . . . . . . . . . . . . . . . .
VS products have a very good brand image. . . . . . . . . . . . . . . . . . . . . . . . . . . . . . . . . . . . . .
VS sets a standard of excellence for the retail industry . . . . . . . . . . . . . . . . . . . . . . . . . . . . .
BUYING PROCESSVS associates have the skills necessary to help me . . . . . . . . . . . . . . . . . . . . . . . . . . . . . . .
I receive prompt service when I shop at VS . . . . . . . . . . . . . . . . . . . . . . . . . . . . . . . . . . . . . .
VS associates give caring and individual attention . . . . . . . . . . . . . . . . . . . . . . . . . . . . . . . . .
VS associates are willing to go out of their way to help me . . . . . . . . . . . . . . . . . . . . . . . . . .
VS associates are consistently courteous and friendly . . . . . . . . . . . . . . . . . . . . . . . . . . . . .
I do not have to wait in long lines at VS checkouts . . . . . . . . . . . . . . . . . . . . . . . . . . . . . . . .
The layout of VS stores allows me to take any path I like when browsing . . . . . . . . . . . . . . .
There is ample space between displays to browse comfortably . . . . . . . . . . . . . . . . . . . . . . .
All merchandise at VS stores is easily accessible . . . . . . . . . . . . . . . . . . . . . . . . . . . . . . . . .
I use the drawers beneath the displays to find my size if one is not out . . . . . . . . . . . . . . . . .
CUSTOMER SATISFACTION SURVEY
STORE OPERATIONS
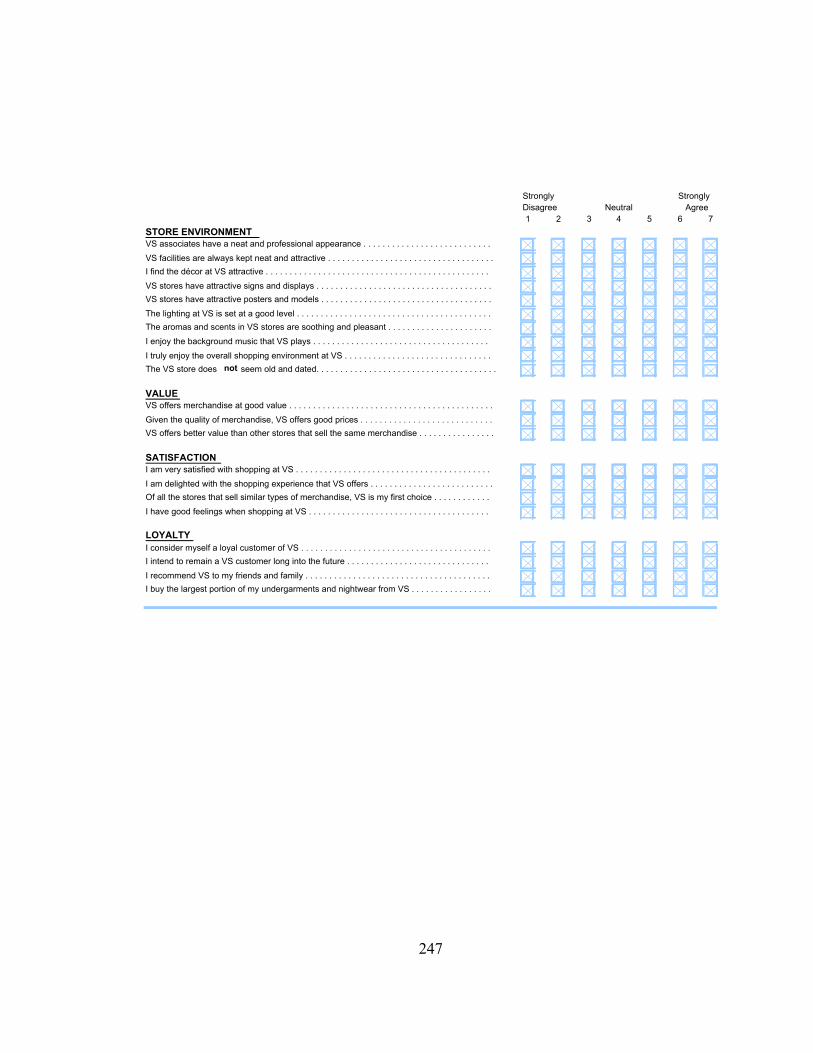
247
Strongly StronglyDisagree Neutral Agree1 2 3 4 5 6 7
STORE ENVIRONMENTVS associates have a neat and professional appearance . . . . . . . . . . . . . . . . . . . . . . . . . . .
VS facilities are always kept neat and attractive . . . . . . . . . . . . . . . . . . . . . . . . . . . . . . . . . . .
I find the décor at VS attractive . . . . . . . . . . . . . . . . . . . . . . . . . . . . . . . . . . . . . . . . . . . . . . .
VS stores have attractive signs and displays . . . . . . . . . . . . . . . . . . . . . . . . . . . . . . . . . . . . .
VS stores have attractive posters and models . . . . . . . . . . . . . . . . . . . . . . . . . . . . . . . . . . . .
The lighting at VS is set at a good level . . . . . . . . . . . . . . . . . . . . . . . . . . . . . . . . . . . . . . . . .
The aromas and scents in VS stores are soothing and pleasant . . . . . . . . . . . . . . . . . . . . . .
I enjoy the background music that VS plays . . . . . . . . . . . . . . . . . . . . . . . . . . . . . . . . . . . . .
I truly enjoy the overall shopping environment at VS . . . . . . . . . . . . . . . . . . . . . . . . . . . . . . .
The VS store does not seem old and dated. . . . . . . . . . . . . . . . . . . . . . . . . . . . . . . . . . . . . .
VALUEVS offers merchandise at good value . . . . . . . . . . . . . . . . . . . . . . . . . . . . . . . . . . . . . . . . . . .
Given the quality of merchandise, VS offers good prices . . . . . . . . . . . . . . . . . . . . . . . . . . . .
VS offers better value than other stores that sell the same merchandise . . . . . . . . . . . . . . . .
SATISFACTIONI am very satisfied with shopping at VS . . . . . . . . . . . . . . . . . . . . . . . . . . . . . . . . . . . . . . . . .
I am delighted with the shopping experience that VS offers . . . . . . . . . . . . . . . . . . . . . . . . . .
Of all the stores that sell similar types of merchandise, VS is my first choice . . . . . . . . . . . .
I have good feelings when shopping at VS . . . . . . . . . . . . . . . . . . . . . . . . . . . . . . . . . . . . . .
LOYALTYI consider myself a loyal customer of VS . . . . . . . . . . . . . . . . . . . . . . . . . . . . . . . . . . . . . . . .
I intend to remain a VS customer long into the future . . . . . . . . . . . . . . . . . . . . . . . . . . . . . .
I recommend VS to my friends and family . . . . . . . . . . . . . . . . . . . . . . . . . . . . . . . . . . . . . . .
I buy the largest portion of my undergarments and nightwear from VS . . . . . . . . . . . . . . . . .
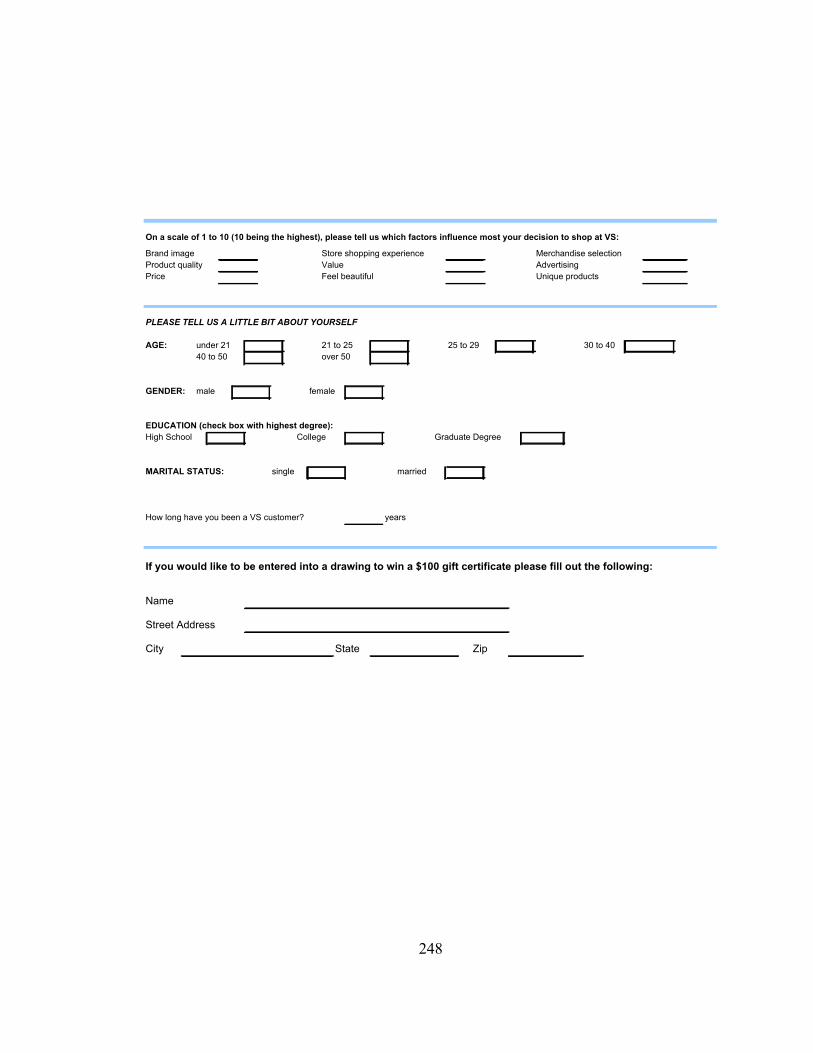
248
On a scale of 1 to 10 (10 being the highest), please tell us which factors influence most your decision to shop at VS:
Brand image Store shopping experience Merchandise selectionProduct quality Value AdvertisingPrice Feel beautiful Unique products
PLEASE TELL US A LITTLE BIT ABOUT YOURSELF
AGE: under 21 21 to 25 25 to 29 30 to 4040 to 50 over 50
GENDER: male female
EDUCATION (check box with highest degree):High School College Graduate Degree
MARITAL STATUS: single married
How long have you been a VS customer? years
If you would like to be entered into a drawing to win a $100 gift certificate please fill out the following:
Name
Street Address
City State Zip
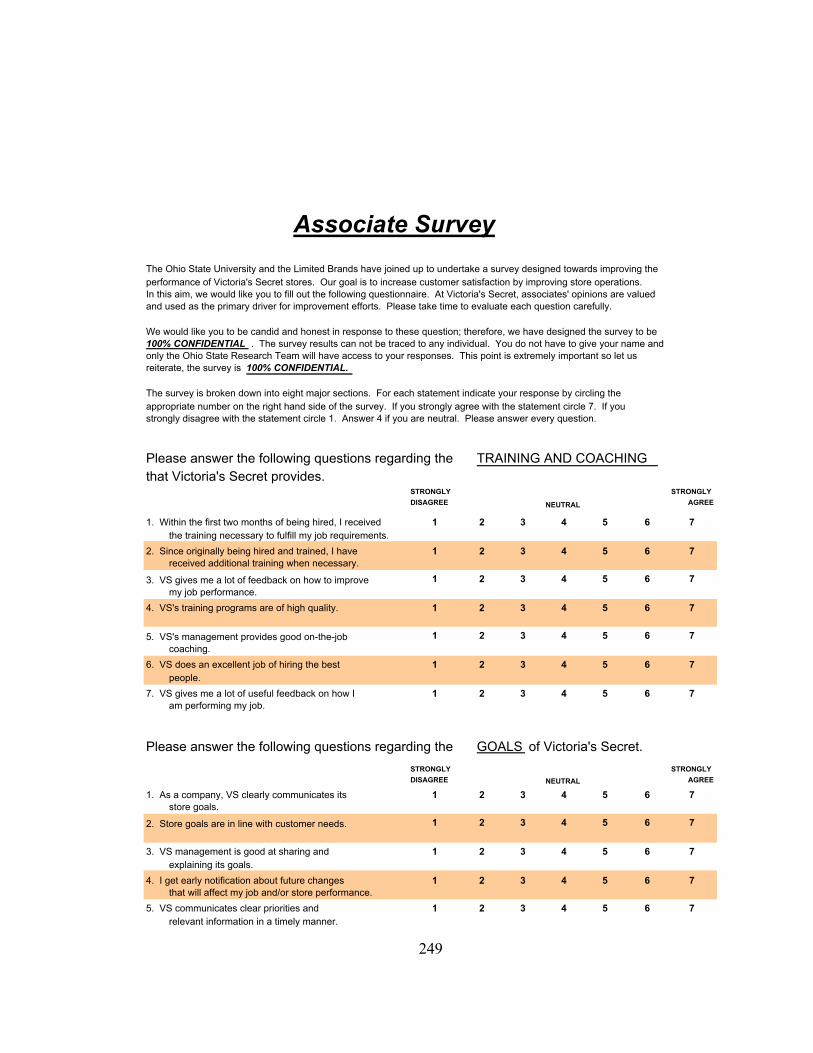
249
Associate Survey
The Ohio State University and the Limited Brands have joined up to undertake a survey designed towards improving theperformance of Victoria's Secret stores. Our goal is to increase customer satisfaction by improving store operations.In this aim, we would like you to fill out the following questionnaire. At Victoria's Secret, associates' opinions are valuedand used as the primary driver for improvement efforts. Please take time to evaluate each question carefully.
We would like you to be candid and honest in response to these question; therefore, we have designed the survey to be100% CONFIDENTIAL . The survey results can not be traced to any individual. You do not have to give your name andonly the Ohio State Research Team will have access to your responses. This point is extremely important so let us reiterate, the survey is 100% CONFIDENTIAL.
The survey is broken down into eight major sections. For each statement indicate your response by circling the appropriate number on the right hand side of the survey. If you strongly agree with the statement circle 7. If you strongly disagree with the statement circle 1. Answer 4 if you are neutral. Please answer every question.
Please answer the following questions regarding the TRAINING AND COACHINGthat Victoria's Secret provides.
STRONGLY
DISAGREE NEUTRAL
STRONGLY
AGREE
1. Within the first two months of being hired, I received 1 2 3 4 5 6 7the training necessary to fulfill my job requirements.
2. Since originally being hired and trained, I have 1 2 3 4 5 6 7received additional training when necessary.
3. VS gives me a lot of feedback on how to improve 1 2 3 4 5 6 7my job performance.
4. VS's training programs are of high quality. 1 2 3 4 5 6 7
5. VS's management provides good on-the-job 1 2 3 4 5 6 7coaching.
6. VS does an excellent job of hiring the best 1 2 3 4 5 6 7people.
7. VS gives me a lot of useful feedback on how I 1 2 3 4 5 6 7am performing my job.
Please answer the following questions regarding the GOALS of Victoria's Secret.
STRONGLY
DISAGREE NEUTRAL
STRONGLY
AGREE
1. As a company, VS clearly communicates its 1 2 3 4 5 6 7store goals.
2. Store goals are in line with customer needs. 1 2 3 4 5 6 7
3. VS management is good at sharing and 1 2 3 4 5 6 7explaining its goals.
4. I get early notification about future changes 1 2 3 4 5 6 7that will affect my job and/or store performance.
5. VS communicates clear priorities and 1 2 3 4 5 6 7relevant information in a timely manner.
250
Please answer the following questions regarding TEAMWORK at Victoria'sSecret.
STRONGLY DISAGREE NEUTRAL
STRONGLY AGREE
1. VS associates are urged to work in teams. 1 2 3 4 5 6 7
2. VS associates often give each other help. 1 2 3 4 5 6 7
3. VS associates communicate well with each 1 2 3 4 5 6 7
other.
4. Throughout the working day I will help 1 2 3 4 5 6 7associates in other work zones when needed.
5. VS associates help train new hires. 1 2 3 4 5 6 7
6. I give help at the cash wrap when the 1 2 3 4 5 6 7store is very busy.
7. Employees from Limited's home office have 1 2 3 4 5 6 7
a good idea of what customer's require of us.
Please answer the following questions regarding JOB DESIGN at Victoria's Secret.
STRONGLY DISAGREE NEUTRAL
STRONGLY AGREE
1. I have been given enough authority to serve 1 2 3 4 5 6 7
customers to the best of my ability.
2. I have enough latitude in my job to serve 1 2 3 4 5 6 7customers to the best of my ability.
3. I have enough independence to meet each 1 2 3 4 5 6 7customer's unique needs.
4. I do not have to check with my manager before 1 2 3 4 5 6 7
making any decision to help serve a customer
5. I have enough latitude to follow up on client sales 1 2 3 4 5 6 7
leads as required.6. My job requirements often conflict with 1 2 3 4 5 6 7
customer needs.
7. I find my job stressful. 1 2 3 4 5 6 7
8. My workload is too heavy. 1 2 3 4 5 6 7
9. My job requirements are not clear to me. 1 2 3 4 5 6 7
Please answer the following questions regarding the SUPPORT you receivefrom Victoria's Secret to help your do you job properly.
STRONGLY DISAGREE NEUTRAL
STRONGLY AGREE
1. As a company, VS cares about my well being. 1 2 3 4 5 6 7
2. As a company, VS values my opinions. 1 2 3 4 5 6 7
3. My immediate supervisor values me as an 1 2 3 4 5 6 7
associate.
4. Help from management is widely available if 1 2 3 4 5 6 7needed.
5. Store technology supports my ability to meet 1 2 3 4 5 6 7customers needs.
6. I am given the necessary tools to satisfy 1 2 3 4 5 6 7
251
STRONGLY
DISAGREE NEUTRAL
STRONGLY
AGREE
7. I have access to information I need in order 1 2 3 4 5 6 7to better serve customers.
8. Store policies and procedures support my 1 2 3 4 5 6 7ability to meet customer needs.
9. In general, I have the resources I need to 1 2 3 4 5 6 7help customers to the best of my ability.
Please answer the following questions regarding the REWARDS & RECOGNITIONthat Victoria's Secret offers its associates.1. VS pays as well or better than other retailers. 1 2 3 4 5 6 7
2. VS provides good associate benefits. 1 2 3 4 5 6 7
3. Over time, my compensation is linked to my 1 2 3 4 5 6 7sales performance.
4. I get personal recognition when I do a great 1 2 3 4 5 6 7job.
5. VS provides good opportunities for advancement. 1 2 3 4 5 6 7
6. When I do a great job, VS management 1 2 3 4 5 6 7acknowledges it and thanks me.
Please answer the following questions regarding the CAPABILITY you have as a VS associate to meet customer needs.
STRONGLY DISAGREE NEUTRAL
STRONGLY AGREE
1. I feel that I am a productive associate. 1 2 3 4 5 6 7
2. Within my store I am a top seller. 1 2 3 4 5 6 7
3. My average sales per hour is among the 1 2 3 4 5 6 7best in the store.
4. My productivity has increased the longer 1 2 3 4 5 6 7I have worked at the store.
5. Our store is kept clean and organized. 1 2 3 4 5 6 7
6. My VS store follows daily replenishment 1 2 3 4 5 6 7procedures to ensure product is on the floor.
7. VS schedules key associates to work on 1 2 3 4 5 6 7busy and high priority days.
8. My VS store is excellent at managing 1 2 3 4 5 6 7merchandise flow.
9. My VS store ensures that all merchandise 1 2 3 4 5 6 7and displays are kept neat and organized.
10. The more times you interact with the customer 1 2 3 4 5 6 7the higher the sales will be.
11. A good measure of associate productivity is 1 2 3 4 5 6 7sales dollars generated.
12. Assigning associates to zones increases 1 2 3 4 5 6 7store sales.
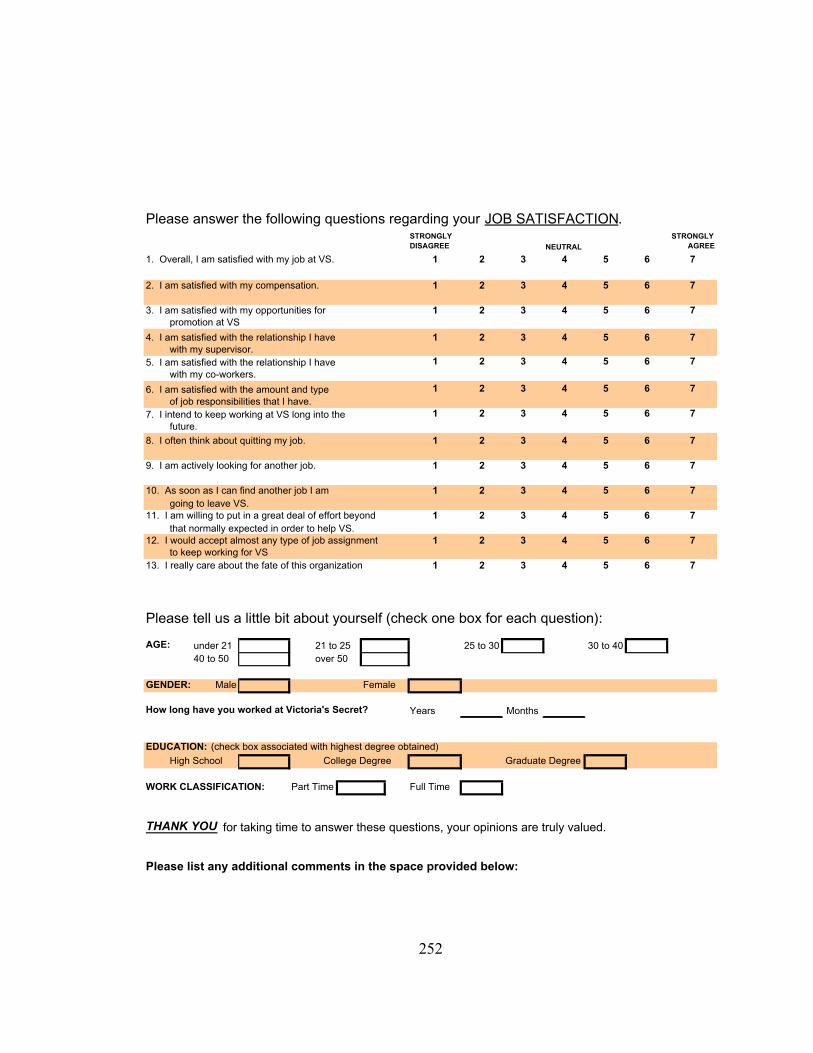
252
Please answer the following questions regarding your JOB SATISFACTION.STRONGLY DISAGREE NEUTRAL
STRONGLY AGREE
1. Overall, I am satisfied with my job at VS. 1 2 3 4 5 6 7
2. I am satisfied with my compensation. 1 2 3 4 5 6 7
3. I am satisfied with my opportunities for 1 2 3 4 5 6 7 promotion at VS
4. I am satisfied with the relationship I have 1 2 3 4 5 6 7with my supervisor.
5. I am satisfied with the relationship I have 1 2 3 4 5 6 7with my co-workers.
6. I am satisfied with the amount and type 1 2 3 4 5 6 7of job responsibilities that I have.
7. I intend to keep working at VS long into the 1 2 3 4 5 6 7future.
8. I often think about quitting my job. 1 2 3 4 5 6 7
9. I am actively looking for another job. 1 2 3 4 5 6 7
10. As soon as I can find another job I am 1 2 3 4 5 6 7going to leave VS.
11. I am willing to put in a great deal of effort beyond 1 2 3 4 5 6 7that normally expected in order to help VS.
12. I would accept almost any type of job assignment 1 2 3 4 5 6 7to keep working for VS
13. I really care about the fate of this organization 1 2 3 4 5 6 7
Please tell us a little bit about yourself (check one box for each question):
AGE: under 21 21 to 25 25 to 30 30 to 4040 to 50 over 50
GENDER: Male Female
How long have you worked at Victoria's Secret? Years Months
EDUCATION: (check box associated with highest degree obtained)
High School College Degree Graduate Degree
WORK CLASSIFICATION: Part Time Full Time
THANK YOU for taking time to answer these questions, your opinions are truly valued.
Please list any additional comments in the space provided below:
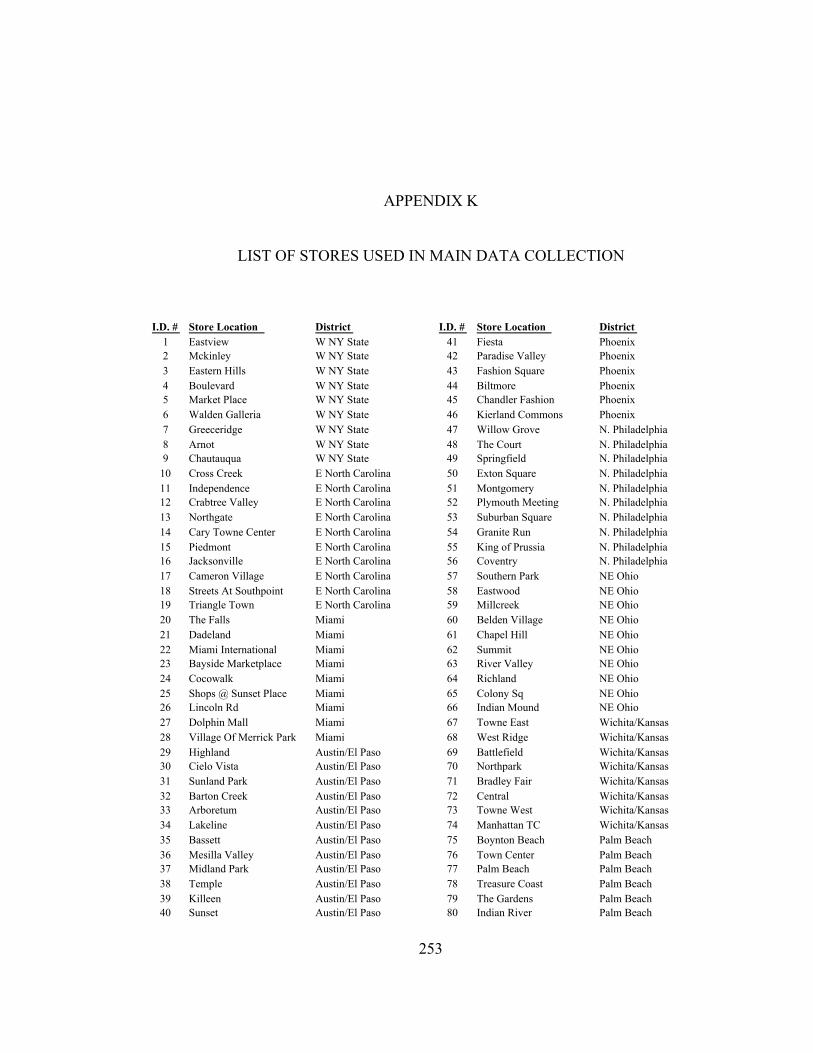
253
APPENDIX K
LIST OF STORES USED IN MAIN DATA COLLECTION
I.D. # Store Location District I.D. # Store Location District1 Eastview W NY State 41 Fiesta Phoenix2 Mckinley W NY State 42 Paradise Valley Phoenix3 Eastern Hills W NY State 43 Fashion Square Phoenix4 Boulevard W NY State 44 Biltmore Phoenix5 Market Place W NY State 45 Chandler Fashion Phoenix6 Walden Galleria W NY State 46 Kierland Commons Phoenix7 Greeceridge W NY State 47 Willow Grove N. Philadelphia8 Arnot W NY State 48 The Court N. Philadelphia9 Chautauqua W NY State 49 Springfield N. Philadelphia
10 Cross Creek E North Carolina 50 Exton Square N. Philadelphia11 Independence E North Carolina 51 Montgomery N. Philadelphia12 Crabtree Valley E North Carolina 52 Plymouth Meeting N. Philadelphia13 Northgate E North Carolina 53 Suburban Square N. Philadelphia14 Cary Towne Center E North Carolina 54 Granite Run N. Philadelphia15 Piedmont E North Carolina 55 King of Prussia N. Philadelphia16 Jacksonville E North Carolina 56 Coventry N. Philadelphia17 Cameron Village E North Carolina 57 Southern Park NE Ohio18 Streets At Southpoint E North Carolina 58 Eastwood NE Ohio19 Triangle Town E North Carolina 59 Millcreek NE Ohio20 The Falls Miami 60 Belden Village NE Ohio21 Dadeland Miami 61 Chapel Hill NE Ohio22 Miami International Miami 62 Summit NE Ohio23 Bayside Marketplace Miami 63 River Valley NE Ohio24 Cocowalk Miami 64 Richland NE Ohio25 Shops @ Sunset Place Miami 65 Colony Sq NE Ohio26 Lincoln Rd Miami 66 Indian Mound NE Ohio27 Dolphin Mall Miami 67 Towne East Wichita/Kansas28 Village Of Merrick Park Miami 68 West Ridge Wichita/Kansas29 Highland Austin/El Paso 69 Battlefield Wichita/Kansas30 Cielo Vista Austin/El Paso 70 Northpark Wichita/Kansas31 Sunland Park Austin/El Paso 71 Bradley Fair Wichita/Kansas32 Barton Creek Austin/El Paso 72 Central Wichita/Kansas33 Arboretum Austin/El Paso 73 Towne West Wichita/Kansas34 Lakeline Austin/El Paso 74 Manhattan TC Wichita/Kansas35 Bassett Austin/El Paso 75 Boynton Beach Palm Beach36 Mesilla Valley Austin/El Paso 76 Town Center Palm Beach37 Midland Park Austin/El Paso 77 Palm Beach Palm Beach38 Temple Austin/El Paso 78 Treasure Coast Palm Beach39 Killeen Austin/El Paso 79 The Gardens Palm Beach40 Sunset Austin/El Paso 80 Indian River Palm Beach
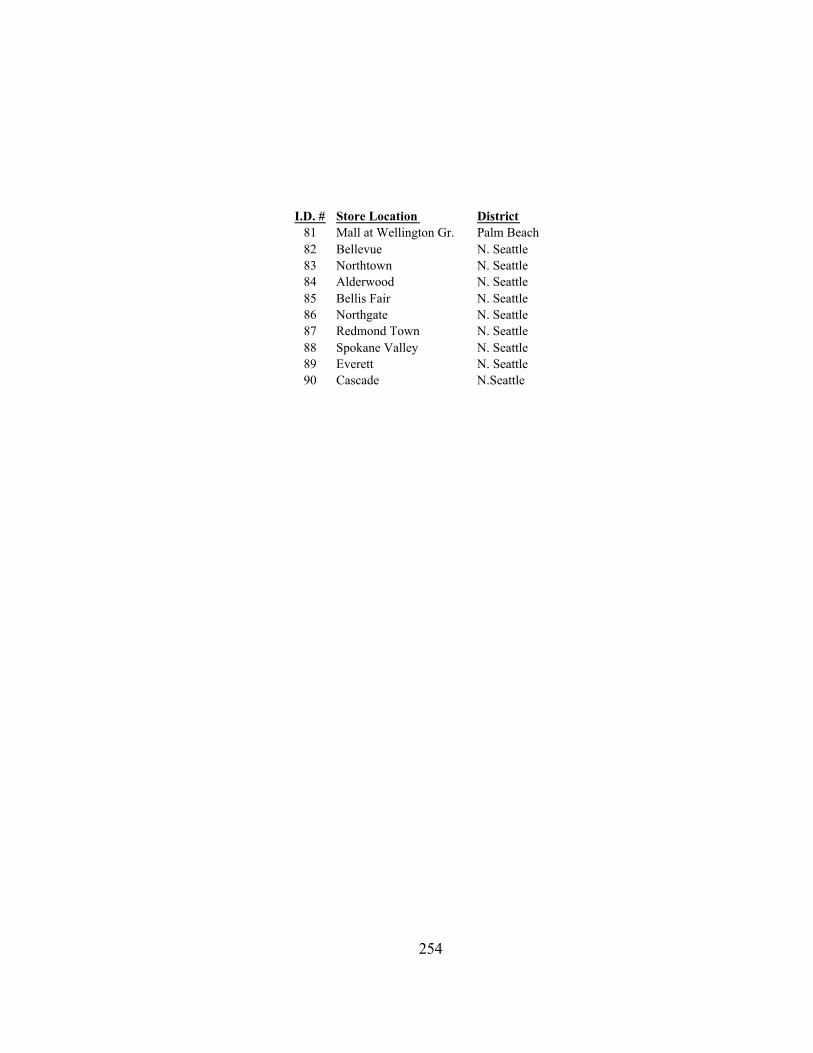
254
I.D. # Store Location District81 Mall at Wellington Gr. Palm Beach82 Bellevue N. Seattle83 Northtown N. Seattle84 Alderwood N. Seattle85 Bellis Fair N. Seattle86 Northgate N. Seattle87 Redmond Town N. Seattle88 Spokane Valley N. Seattle89 Everett N. Seattle90 Cascade N.Seattle