Embed Size (px)
Citation preview

4
Cost–Volume–Profit Analysis
87
4 LEARNING OUTCOMES After completing this chapter, you should be able to:
� explain the concept of contribution and its use in cost–volume–profi t (CVP) analysis;
� calculate and interpret the breakeven point, profi t target, margin of safety and profi t/volume ratio for a single product or service;
� prepare breakeven charts and profi t/volume graphs for a single product or service;
� calculate the profi t maximising sales mix for a multi-product company that has limited demand for each product and one other constraint or limiting factor.
4.1 Introduction In this chapter, you will see how an understanding of cost behaviour patterns and a focus on identifying the costs that will alter as the result of a course of action are important in providing effective information as the basis for management decision-making.
Cost–Volume–Profit Analysis
Cost–volume–profi t (CVP) analysis is defi ned in CIMA’s Terminology as the ‘ study of the effects on future profi t of changes in fi xed cost, variable cost, sales
price, quantity and mix ’ .
4.2 Breakeven or cost–volume–profit analysis
A common term used for this type of analysis is breakeven analysis . However, this is some-what misleading, since it implies that the focus of the analysis is the breakeven point – that is, the level of activity which produces neither profi t nor loss. You will see in this chapter that the scope of CVP analysis is much wider than this, as indicated in the defi nition. However, you should be aware that the terms ‘ breakeven analysis ’ and ‘ CVP analysis ’ tend to be used interchangeably.
STUDY MATERIAL C188C
OST
–VO
LUM
E–PR
OFI
T A
NA
LYSI
S 4.2.1 The concept of contribution In chapter 1 you learned that variable costs are those that vary with the level of activity. If we can identify the variable costs associated with producing and selling a product or ser-vice we can highlight a very important measure: contribution.
Contribution sales value variable costs� �
Variable costs are sometimes referred to as marginal costs and the two terms are often used interchangeably.
Contribution is so called because it literally does contribute towards fi xed costs and profi t. Once the contribution from a product or service has been calculated, the fi xed costs associ-ated with the product or service can be deducted to determine the profi t for the period.
4.2.2 Calculating the breakeven point As sales revenues grow from zero, the contribution also grows until it just covers the fi xed costs. This is the breakeven point where neither profi ts nor losses are made.
It follows that to break even the amount of contribution must exactly match the amount of fi xed costs. If we know how much contribution is earned from each unit sold, then we can calculate the number of units required to break even as follows:
Breakeven point in unitsFixed costs
Contribution per unit�
For example, suppose that an organisation manufactures a single product, incurring variable costs of £30 per unit and fi xed costs of £20,000 per month. If the product sells for £50 per unit, then the breakeven point can be calculated as follows:
Breakeven point in units£
£ £ units per mo�
��
20 000
50 301 000
,, nnth
The margin of safety is the difference between the expected level of sales and the breakeven point. The larger the margin of safety, the more likely it is that a
profi t will be made, that is, if sales start to fall there is more leeway before the organ-ization begins to incur losses. (Obviously, this statement is made on the assumption that projected sales volumes are above the breakeven point.) In the above example, if forecast sales are 1,700 units per month, the margin of safety can be easily calculated.
4.3 The margin of safety
Margin of safety projected sales breakeven point uni
� �� 1 700, tts units
units per month, or of sales (�
�1 000
700 41 700,
% /11 700 100, %)�
89 FUNDAMENTALS OF MANAGEMENT ACCOUNTINGC
OST–VO
LUM
E–PROFIT A
NA
LYSIS
The margin of safety should be expressed as a percentage of projected sales to put it in perspective. To quote a margin of safety of 700 units without relating it to the projected sales fi gure is not giving the full picture.
The margin of safety can also be used as one route to a profi t calculation. We have seen that the contribution goes towards fi xed costs and profi t. Once breakeven point is reached the fi xed costs have been covered. After the breakeven point there are no more fi xed costs to be covered and all of the contribution goes towards making profi ts grow.
In our example, the monthly profi t from sales of 1,700 units would be £14,000.
Margin of safety units per monthMonthly profit co
�� �
700700 nntribution per unit
££
� � �
700 2014 000, .
4.4 The contribution to sales (C/S) ratio The contribution to sales ratio is usually expressed as a percentage. It can be calculated for the product in our example as follows.
Contribution to sales ratio (C/S ratio) £ £ %%
� ��
20 50 10040
/
A higher contribution to sales ratio means that contribution grows more quickly as sales levels increase. Once the breakeven point has been passed, profi ts will accumulate more quickly than for a product with a lower contribution to sales ratio.
You might sometimes see this ratio referred to as the profi t � volume (P/V) ratio. If we can assume that a unit’s variable cost and selling price remain constant then the
C/S ratio will also remain constant. It can be used to calculate the breakeven point as follows (using the data from the earlier example):
Breakeven point in sales valueFixed costs
C/S ratio� �
£20 00, 00
0 4050 000
.,� £
This can be converted to 1,000 units as before by dividing by the selling price of £50 per unit.
Exercise 4.1 A company manufactures and sells a single product which has the following cost and sell-ing price structure:
£/unit £/unit Selling price 120 Direct material 22 Direct labour 36 Variable overhead 14 Fixed overhead 12 84 Profi t per unit 36
STUDY MATERIAL C190C
OST
–VO
LUM
E–PR
OFI
T A
NA
LYSI
S The fi xed overhead absorption rate is based on the normal capacity of 2,000 units per month. Assume that the same amount is spent each month on fi xed overheads.
Budgeted sales for next month are 2,200 units. You are required to calculate:
(i) the breakeven point, in sales units per month; (ii) the margin of safety for next month; (iii) the budgeted profi t for next month; (iv) the sales required to achieve a profi t of £96,000 in a month.
Solution (i) The key to calculating the breakeven point is to determine the contribution per unit.
Contribution per unit £ (£ £ £ ) £
Breakeven poin
� � � � �120 22 36 14 48
ttFixed overhead
Contribution per unit£
£ un
�
��
�12 2 000
48500
,iits
(ii) Margin of safety � budgeted sales � breakeven point � �� � �
2 200 5001 700 1 700 2 2000 100 77
,, , / , units (or % % of budgeteed sales)
(iii) Once breakeven point has been reached, all of the contribution goes towards profi ts because all of the fi xed costs have been covered.
Budgeted profit units margin of safety £ Contribu� � 1 700 48, ttion per unit£81,600�
(iv) To achieve the desired level of profi t, suffi cient units must be sold to earn a contribu-tion which covers the fi xed costs and leaves the desired profi t for the month.
Number of sales units requiredFixed overhead desired prof
�� iit
Contribution per unit(£ £
£ unit�
� ��
12 2 000 96 000
482 500
, ) ,, ss.
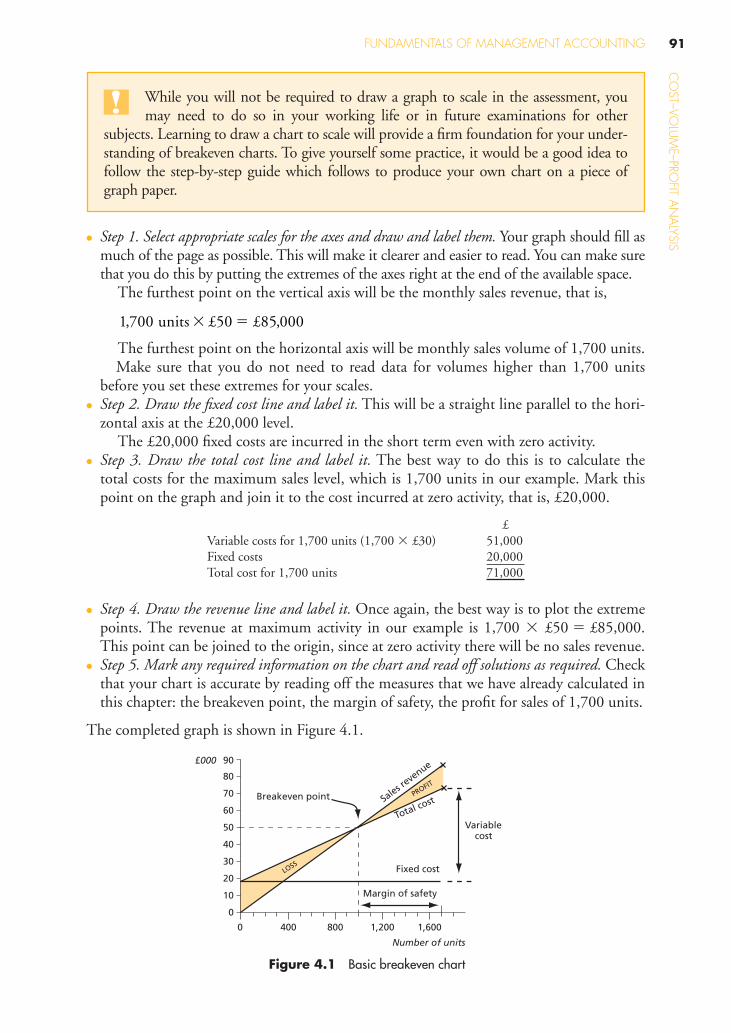
4.5 Drawing a basic breakeven chart A basic breakeven chart records costs and revenues on the vertical axis and the level of activity on the horizontal axis. Lines are drawn on the chart to represent costs and sales revenue. The breakeven point can be read off where the sales revenue line cuts the total cost line.
We will use our basic example to demonstrate how to draw a breakeven chart. The data is:
Selling price £50 per unit Variable cost £30 per unit Fixed costs £20,000 per month Forecast sales 1,700 units per month
91 FUNDAMENTALS OF MANAGEMENT ACCOUNTINGC
OST–VO
LUM
E–PROFIT A
NA
LYSIS● Step 1. Select appropriate scales for the axes and draw and label them. Your graph should fi ll as much of the page as possible. This will make it clearer and easier to read. You can make sure that you do this by putting the extremes of the axes right at the end of the available space. The furthest point on the vertical axis will be the monthly sales revenue, that is,
1 700 50 85 000, , units £ £� �
The furthest point on the horizontal axis will be monthly sales volume of 1,700 units. Make sure that you do not need to read data for volumes higher than 1,700 units
before you set these extremes for your scales. ● Step 2. Draw the fi xed cost line and label it. This will be a straight line parallel to the hori-
zontal axis at the £20,000 level. The £20,000 fi xed costs are incurred in the short term even with zero activity.
● Step 3. Draw the total cost line and label it. The best way to do this is to calculate the total costs for the maximum sales level, which is 1,700 units in our example. Mark this point on the graph and join it to the cost incurred at zero activity, that is, £20,000.
90£000
80
70
60
50
40
30
20
10
0
0 400 800 1,200
Margin of safety
Fixed cost
PROFIT
LOSS
Total costSa
les reve
nue
Variablecost
Breakeven point
Number of units
1,600
Figure 4.1 Basic breakeven chart
While you will not be required to draw a graph to scale in the assessment, you may need to do so in your working life or in future examinations for other
subjects. Learning to draw a chart to scale will provide a fi rm foundation for your under-standing of breakeven charts. To give yourself some practice, it would be a good idea to follow the step-by-step guide which follows to produce your own chart on a piece of graph paper.
£ Variable costs for 1,700 units (1,700 � £30) 51,000 Fixed costs 20,000 Total cost for 1,700 units 71,000
● Step 4. Draw the revenue line and label it. Once again, the best way is to plot the extreme points. The revenue at maximum activity in our example is 1,700 � £50 � £85,000. This point can be joined to the origin, since at zero activity there will be no sales revenue.
● Step 5. Mark any required information on the chart and read off solutions as required. Check that your chart is accurate by reading off the measures that we have already calculated in this chapter: the breakeven point, the margin of safety, the profi t for sales of 1,700 units.
The completed graph is shown in Figure 4.1 .
STUDY MATERIAL C192C
OST
–VO
LUM
E–PR
OFI
T A
NA
LYSI
S
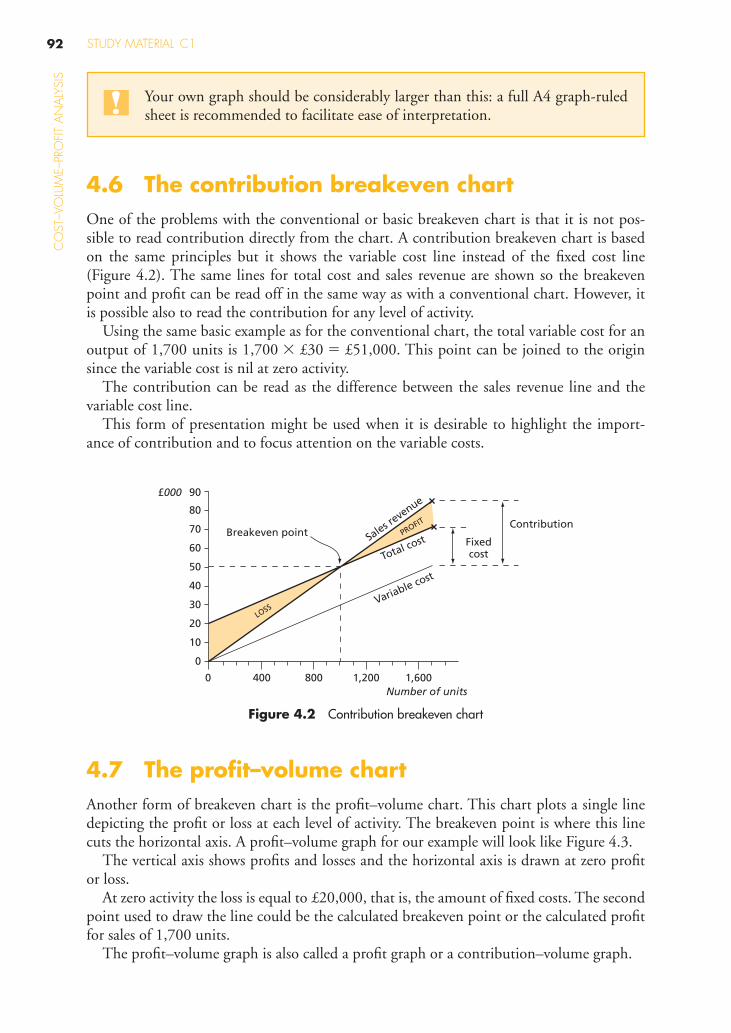
4.6 The contribution breakeven chart One of the problems with the conventional or basic breakeven chart is that it is not pos-sible to read contribution directly from the chart. A contribution breakeven chart is based on the same principles but it shows the variable cost line instead of the fi xed cost line ( Figure 4.2 ). The same lines for total cost and sales revenue are shown so the breakeven point and profi t can be read off in the same way as with a conventional chart. However, it is possible also to read the contribution for any level of activity.
Using the same basic example as for the conventional chart, the total variable cost for an output of 1,700 units is 1,700 � £30 � £51,000. This point can be joined to the origin since the variable cost is nil at zero activity.
The contribution can be read as the difference between the sales revenue line and the variable cost line.
This form of presentation might be used when it is desirable to highlight the import-ance of contribution and to focus attention on the variable costs.
90£000
80
70
60
50
40
30
20
10
0
0 400 800 1,200
Variable cost
PROFIT
LOSS
Total costSa
les reve
nue
Fixedcost
ContributionBreakeven point
Number of units1,600
Figure 4.2 Contribution breakeven chart
Your own graph should be considerably larger than this: a full A4 graph-ruled sheet is recommended to facilitate ease of interpretation.
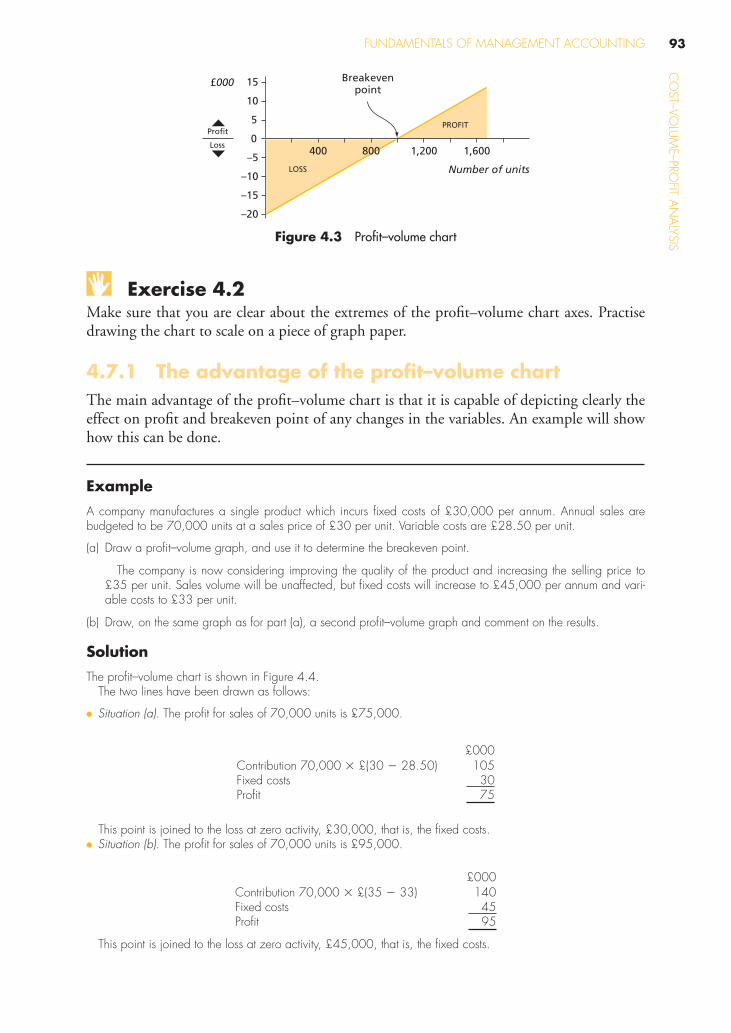
4.7 The profit–volume chart Another form of breakeven chart is the profi t–volume chart. This chart plots a single line depicting the profi t or loss at each level of activity. The breakeven point is where this line cuts the horizontal axis. A profi t–volume graph for our example will look like Figure 4.3 .
The vertical axis shows profi ts and losses and the horizontal axis is drawn at zero profi t or loss.
At zero activity the loss is equal to £20,000, that is, the amount of fi xed costs. The second point used to draw the line could be the calculated breakeven point or the calculated profi t for sales of 1,700 units.
The profi t–volume graph is also called a profi t graph or a contribution–volume graph.
93 FUNDAMENTALS OF MANAGEMENT ACCOUNTINGC
OST–VO
LUM
E–PROFIT A
NA
LYSIS
Exercise 4.2 Make sure that you are clear about the extremes of the profi t–volume chart axes. Practise drawing the chart to scale on a piece of graph paper.
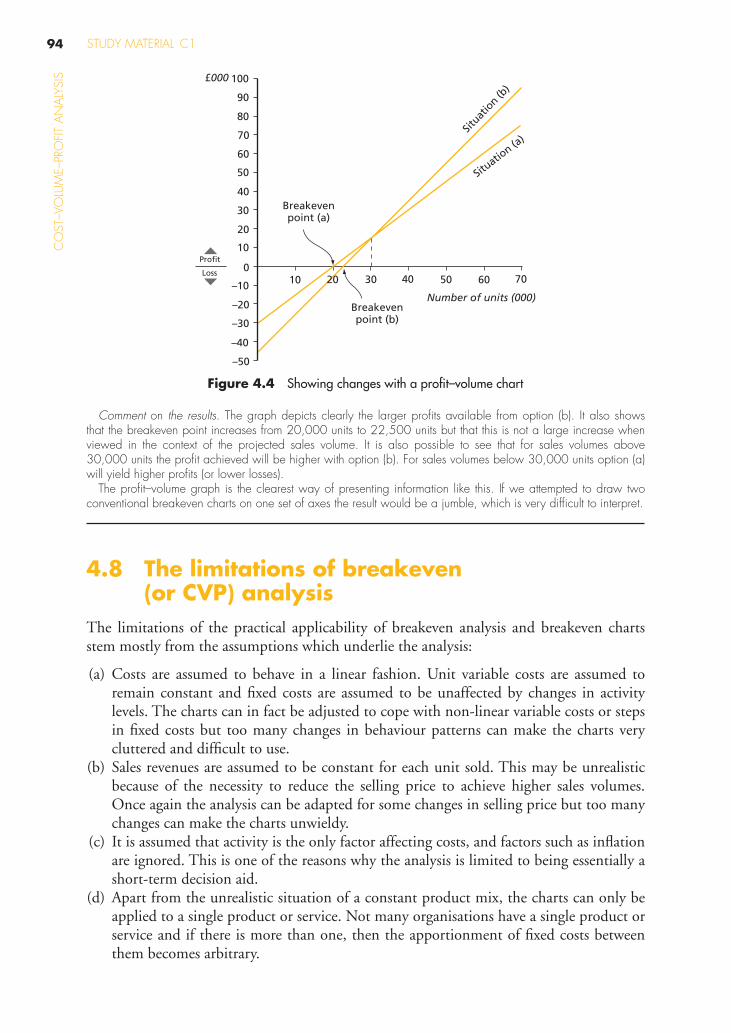
4.7.1 The advantage of the profit–volume chart The main advantage of the profi t–volume chart is that it is capable of depicting clearly the effect on profi t and breakeven point of any changes in the variables. An example will show how this can be done.
Example
A company manufactures a single product which incurs fi xed costs of £30,000 per annum. Annual sales are budgeted to be 70,000 units at a sales price of £30 per unit. Variable costs are £28.50 per unit.
(a) Draw a profi t–volume graph, and use it to determine the breakeven point.
The company is now considering improving the quality of the product and increasing the selling price to £35 per unit. Sales volume will be unaffected, but fi xed costs will increase to £45,000 per annum and vari-able costs to £33 per unit.
(b) Draw, on the same graph as for part (a), a second profi t–volume graph and comment on the results.
Solution
The profi t–volume chart is shown in Figure 4.4 . The two lines have been drawn as follows:
● Situation (a). The profi t for sales of 70,000 units is £75,000.
£000 Contribution 70,000 � £(30 � 28.50) 105 Fixed costs 30 Profi t 75
This point is joined to the loss at zero activity, £30,000, that is, the fi xed costs. ● Situation (b) . The profi t for sales of 70,000 units is £95,000.
£000 Contribution 70,000 � £(35 � 33) 140 Fixed costs 45 Profi t 95
PROFIT
LOSS
£000 15
10
5
0
–5
–10
–15
–20
400 800 1,200 1,600
Number of units
Breakevenpoint
Loss
Profit
Figure 4.3 Profit–volume chart
This point is joined to the loss at zero activity, £45,000, that is, the fi xed costs.
STUDY MATERIAL C194C
OST
–VO
LUM
E–PR
OFI
T A
NA
LYSI
S
Comment on the results. The graph depicts clearly the larger profi ts available from option (b). It also shows that the breakeven point increases from 20,000 units to 22,500 units but that this is not a large increase when viewed in the context of the projected sales volume. It is also possible to see that for sales volumes above 30,000 units the profi t achieved will be higher with option (b). For sales volumes below 30,000 units option (a) will yield higher profi ts (or lower losses).
The profi t–volume graph is the clearest way of presenting information like this. If we attempted to draw two conventional breakeven charts on one set of axes the result would be a jumble, which is very diffi cult to interpret.
4.8 The limitations of breakeven (or CVP) analysis
The limitations of the practical applicability of breakeven analysis and breakeven charts stem mostly from the assumptions which underlie the analysis:
(a) Costs are assumed to behave in a linear fashion. Unit variable costs are assumed to remain constant and fi xed costs are assumed to be unaffected by changes in activity levels. The charts can in fact be adjusted to cope with non-linear variable costs or steps in fi xed costs but too many changes in behaviour patterns can make the charts very cluttered and diffi cult to use.
(b) Sales revenues are assumed to be constant for each unit sold. This may be unrealistic because of the necessity to reduce the selling price to achieve higher sales volumes. Once again the analysis can be adapted for some changes in selling price but too many changes can make the charts unwieldy.
(c) It is assumed that activity is the only factor affecting costs, and factors such as infl ation are ignored. This is one of the reasons why the analysis is limited to being essentially a short-term decision aid.
(d) Apart from the unrealistic situation of a constant product mix, the charts can only be applied to a single product or service. Not many organisations have a single product or service and if there is more than one, then the apportionment of fi xed costs between them becomes arbitrary.
£000
20
30
40
50
60
70
80
90
100
10
20 30 40 50 60 70100
–10
–20
–30
–40
–50
Number of units (000)
Breakevenpoint (a)
Situat
ion (b
)
Situatio
n (a)
Breakevenpoint (b)
Loss
Profit
Figure 4.4 Showing changes with a profit–volume chart
95 FUNDAMENTALS OF MANAGEMENT ACCOUNTINGC
OST–VO
LUM
E–PROFIT A
NA
LYSIS
(e) The analysis seems to suggest that as long as the activity level is above the breakeven point, then a profi t will be achieved. In reality certain changes in the cost and revenue patterns may result in a second breakeven point after which losses are made. This situ-ation will be depicted in the next section of this chapter.
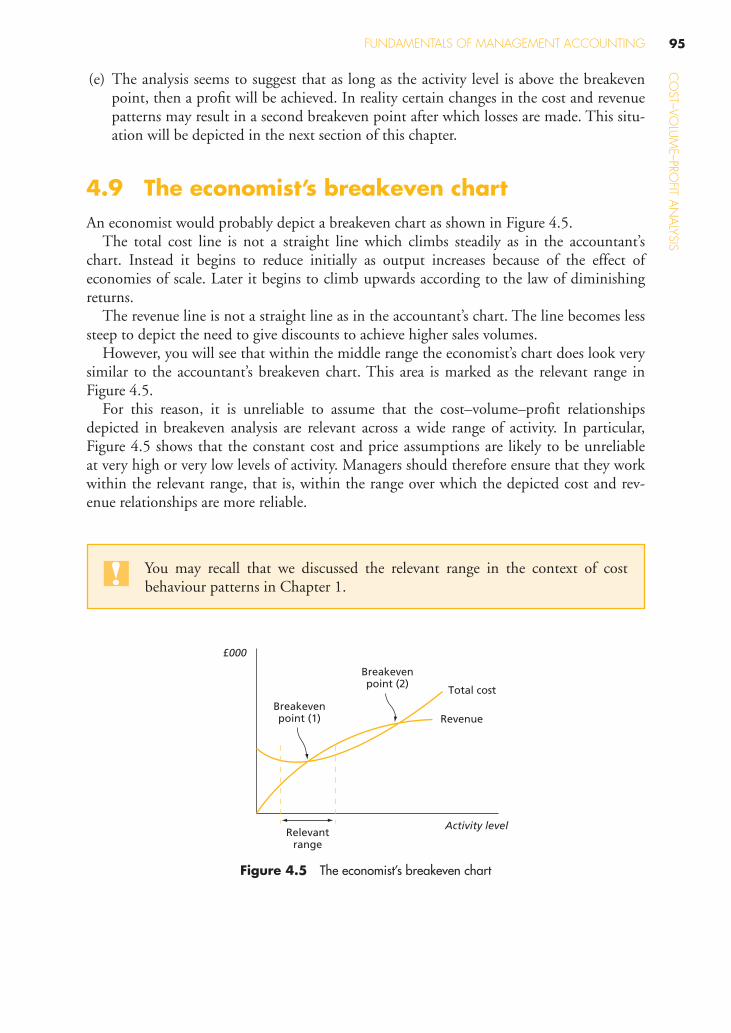
4.9 The economist’s breakeven chart An economist would probably depict a breakeven chart as shown in Figure 4.5 .
The total cost line is not a straight line which climbs steadily as in the accountant’s chart. Instead it begins to reduce initially as output increases because of the effect of economies of scale. Later it begins to climb upwards according to the law of diminishing returns.
The revenue line is not a straight line as in the accountant’s chart. The line becomes less steep to depict the need to give discounts to achieve higher sales volumes.
However, you will see that within the middle range the economist’s chart does look very similar to the accountant’s breakeven chart. This area is marked as the relevant range in Figure 4.5 .
For this reason, it is unreliable to assume that the cost–volume–profi t relationships depicted in breakeven analysis are relevant across a wide range of activity. In particular, Figure 4.5 shows that the constant cost and price assumptions are likely to be unreliable at very high or very low levels of activity. Managers should therefore ensure that they work within the relevant range, that is, within the range over which the depicted cost and rev-enue relationships are more reliable.
Relevantrange
Revenue
Total cost
Breakevenpoint (2)
Breakevenpoint (1)
Activity level
£000
Figure 4.5 The economist’s breakeven chart
You may recall that we discussed the relevant range in the context of cost behaviour patterns in Chapter 1.
STUDY MATERIAL C196C
OST
–VO
LUM
E–PR
OFI
T A
NA
LYSI
S 4.10 Using CVP analysis to evaluate proposals Use your understanding of breakeven analysis and cost behaviour patterns to evaluate the proposals in the following exercise.
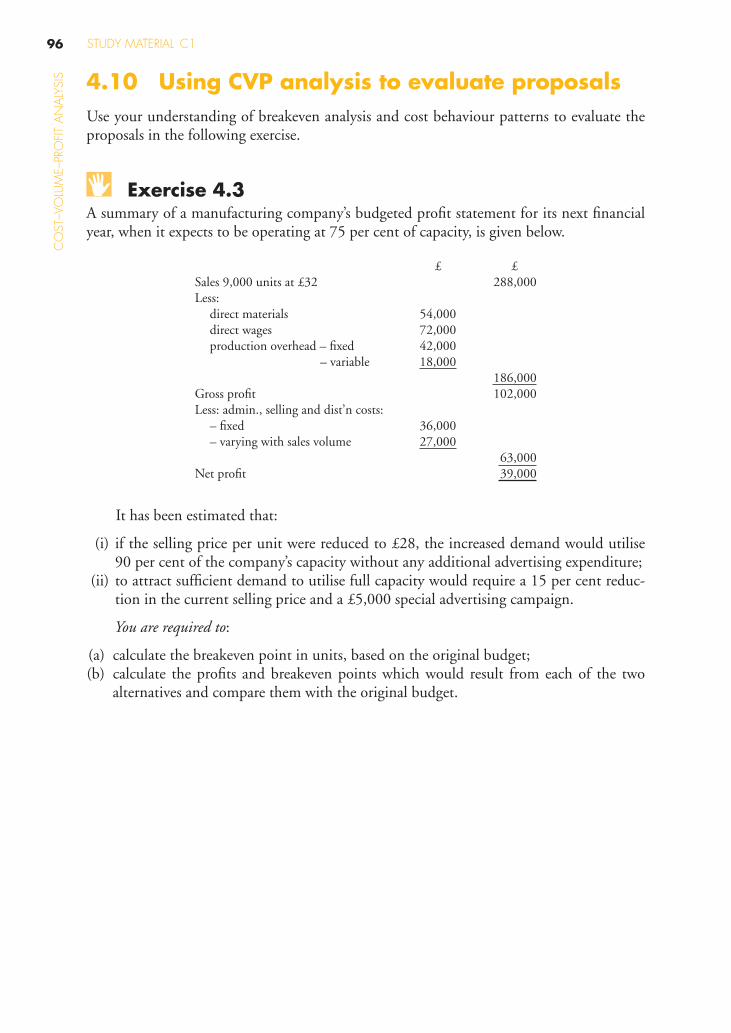
Exercise 4.3 A summary of a manufacturing company’s budgeted profi t statement for its next fi nancial year, when it expects to be operating at 75 per cent of capacity, is given below.
£ £ Sales 9,000 units at £32 288,000 Less: direct materials 54,000 direct wages 72,000 production overhead – fi xed 42,000
– variable 18,000 186,000 Gross profi t 102,000 Less: admin., selling and dist’n costs: – fi xed 36,000 – varying with sales volume 27,000 63,000 Net profi t 39,000
It has been estimated that:
(i) if the selling price per unit were reduced to £28, the increased demand would utilise 90 per cent of the company’s capacity without any additional advertising expenditure;
(ii) to attract suffi cient demand to utilise full capacity would require a 15 per cent reduc-tion in the current selling price and a £5,000 special advertising campaign.
You are required to :
(a) calculate the breakeven point in units, based on the original budget; (b) calculate the profi ts and breakeven points which would result from each of the two
alternatives and compare them with the original budget.
97 FUNDAMENTALS OF MANAGEMENT ACCOUNTINGC
OST–VO
LUM
E–PROFIT A
NA
LYSIS
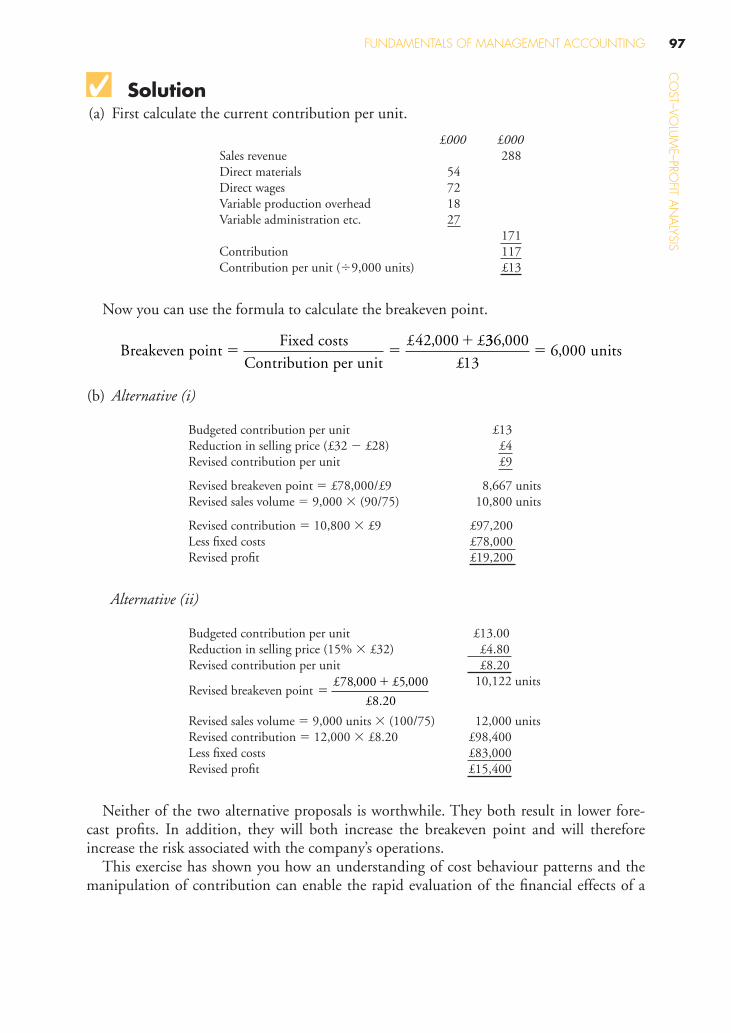
Solution (a) First calculate the current contribution per unit.
£000 £000 Sales revenue 288 Direct materials 54 Direct wages 72 Variable production overhead 18 Variable administration etc. 27 171 Contribution 117 Contribution per unit ( � 9,000 units) £13
Now you can use the formula to calculate the breakeven point.
Breakeven pointFixed costs
Contribution per unit
£ £� �
�42 000, 336 000
136 000
,,
£ units�
(b) Alternative (i)
Budgeted contribution per unit £13 Reduction in selling price (£32 � £28) £4 Revised contribution per unit £9
Revised breakeven point � £78,000/£9 8,667 units Revised sales volume � 9,000 � (90/75) 10,800 units
Revised contribution � 10,800 � £9 £97,200 Less fi xed costs £78,000 Revised profi t £19,200
Alternative (ii)
Budgeted contribution per unit £13.00 Reduction in selling price (15% � £32) £4.80 Revised contribution per unit £8.20
Revised breakeven point ��£ £
£
78 000 5 000
8 20
, ,
.
10,122 units
Revised sales volume � 9,000 units � (100/75) 12,000 units Revised contribution � 12,000 � £8.20 £98,400 Less fi xed costs £83,000 Revised profi t £15,400
Neither of the two alternative proposals is worthwhile. They both result in lower fore-cast profi ts. In addition, they will both increase the breakeven point and will therefore increase the risk associated with the company’s operations.
This exercise has shown you how an understanding of cost behaviour patterns and the manipulation of contribution can enable the rapid evaluation of the fi nancial effects of a
STUDY MATERIAL C198C
OST
–VO
LUM
E–PR
OFI
T A
NA
LYSI
S proposal. We can now expand it to demonstrate another aspect of the application of CVP analysis to short-term decision-making.
Exercise 4.4 The manufacturing company decided to proceed with the original budget and has asked you to determine how many units must be sold to achieve a profi t of £45,500.
Solution Once again, the key is the required contribution. This time the contribution must be suf-fi cient to cover both the fi xed costs and the required profi t. If we then divide this amount by the contribution earned from each unit, we can determine the required sales volume.
Required salesFixed costs required profit
Contribution per�
�
unit
(£42,000 £ £
£ units�
� ��
36 000 45 500
139 500
, , ),
A limiting factor is any factor which is in scarce supply and which stops the organisation from expanding its activities further, that is, it limits the organi-
sation’s activities.
4.11 Limiting factor analysis
The limiting factor for many trading organisations is sales volume because they can-not sell as much as they would like. However, other factors may also be limited, especially in the short term. For example, machine capacity or the supply of skilled labour may be limited for one or two periods until some action can be taken to alleviate the shortage.
The concept of contribution can be used to make decisions about the best use of a limited resource.
4.11.1 Decisions involving a single limiting factor If an organisation is faced with a single limiting factor, for example machine capacity, then it must ensure that a production plan is established which maximises the profi t from the use of the available capacity. Assuming that fi xed costs remain constant, this is the same as saying that the contribution must be maximised from the use of the available capacity. The machine capacity must be allocated to those products which earn the most contribution per machine hour.
This decision rule can be stated as ‘ maximising the contribution per unit of limiting factor ’ .
99 FUNDAMENTALS OF MANAGEMENT ACCOUNTINGC
OST–VO
LUM
E–PROFIT A
NA
LYSIS
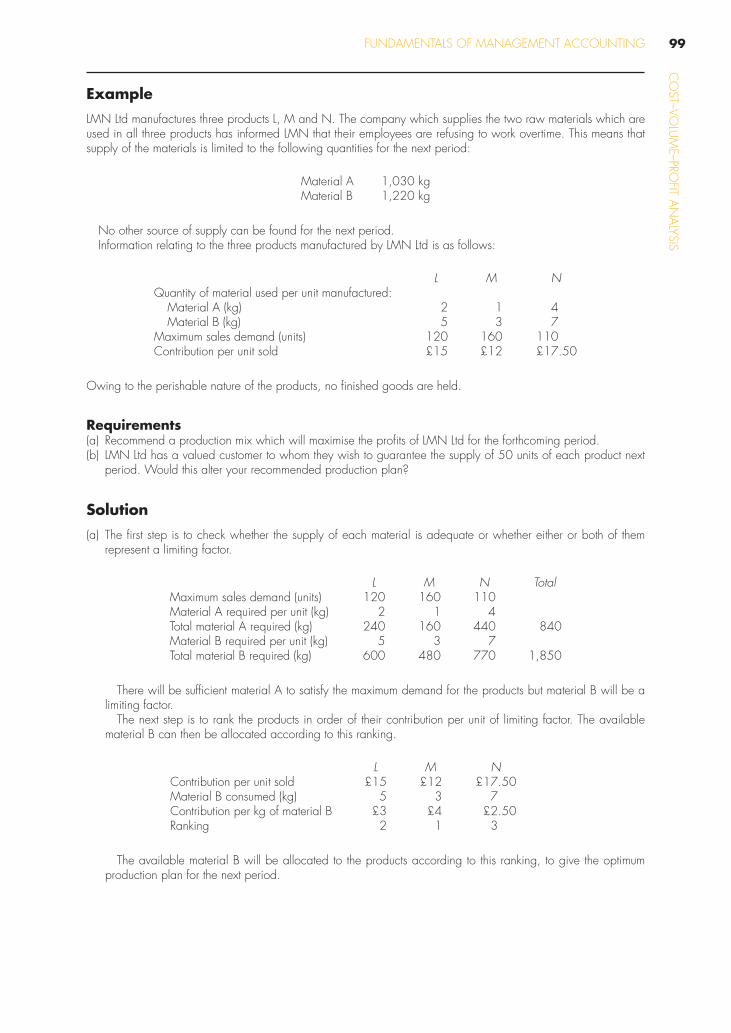
Example
LMN Ltd manufactures three products L, M and N. The company which supplies the two raw materials which are used in all three products has informed LMN that their employees are refusing to work overtime. This means that supply of the materials is limited to the following quantities for the next period:
Material A 1,030 kg Material B 1,220 kg
No other source of supply can be found for the next period. Information relating to the three products manufactured by LMN Ltd is as follows:
L M NQuantity of material used per unit manufactured:
Material A (kg) 2 1 4 Material B (kg) 5 3 7
Maximum sales demand (units) 120 160 110 Contribution per unit sold £15 £12 £17.50
Owing to the perishable nature of the products, no fi nished goods are held.
Requirements (a) Recommend a production mix which will maximise the profi ts of LMN Ltd for the forthcoming period. (b) LMN Ltd has a valued customer to whom they wish to guarantee the supply of 50 units of each product next
period. Would this alter your recommended production plan?
Solution
(a) The fi rst step is to check whether the supply of each material is adequate or whether either or both of them represent a limiting factor.
L M N Total Maximum sales demand (units) 120 160 110 Material A required per unit (kg) 2 1 4 Total material A required (kg) 240 160 440 840 Material B required per unit (kg) 5 3 7 Total material B required (kg) 600 480 770 1,850
There will be suffi cient material A to satisfy the maximum demand for the products but material B will be a limiting factor.
The next step is to rank the products in order of their contribution per unit of limiting factor. The available material B can then be allocated according to this ranking.
L M N Contribution per unit sold £15 £12 £17.50 Material B consumed (kg) 5 3 7 Contribution per kg of material B £3 £4 £2.50Ranking 2 1 3
The available material B will be allocated to the products according to this ranking, to give the optimum production plan for the next period.
STUDY MATERIAL C1100C
OST
–VO
LUM
E–PR
OFI
T A
NA
LYSI
S
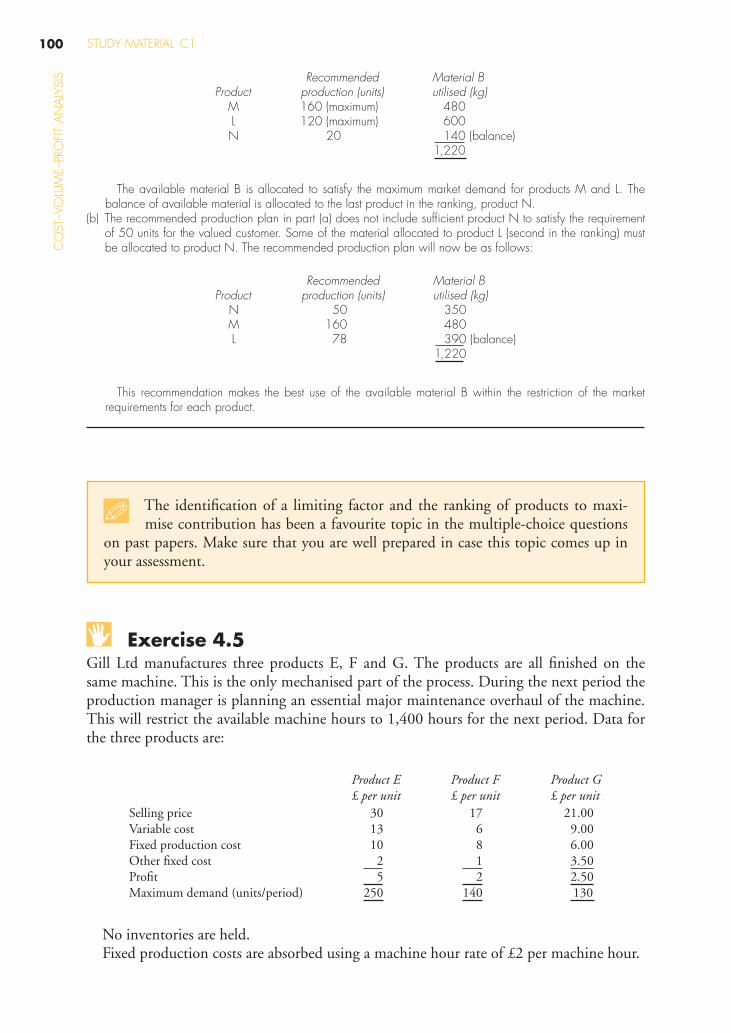
Product Recommended
production (units) Material B utilised (kg)
M 160 (maximum) 480L 120 (maximum) 600N 20 140 (balance)
1,220
The available material B is allocated to satisfy the maximum market demand for products M and L. The balance of available material is allocated to the last product in the ranking, product N.
(b) The recommended production plan in part (a) does not include suffi cient product N to satisfy the requirement of 50 units for the valued customer. Some of the material allocated to product L (second in the ranking) must be allocated to product N. The recommended production plan will now be as follows:
Product Recommended
production (units) Material B utilised (kg)
N 50 350M 160 480L 78 390 (balance)
1,220
This recommendation makes the best use of the available material B within the restriction of the market requirements for each product.
The identifi cation of a limiting factor and the ranking of products to maxi-mise contribution has been a favourite topic in the multiple-choice questions
on past papers. Make sure that you are well prepared in case this topic comes up in your assessment.
Exercise 4.5 Gill Ltd manufactures three products E, F and G. The products are all fi nished on the same machine. This is the only mechanised part of the process. During the next period the production manager is planning an essential major maintenance overhaul of the machine. This will restrict the available machine hours to 1,400 hours for the next period. Data for the three products are:
Product E £ per unit
Product F £ per unit
Product G £ per unit
Selling price 30 17 21.00 Variable cost 13 6 9.00 Fixed production cost 10 8 6.00 Other fi xed cost 2 1 3.50 Profi t 5 2 2.50 Maximum demand (units/period) 250 140 130
No inventories are held. Fixed production costs are absorbed using a machine hour rate of £2 per machine hour.
101 FUNDAMENTALS OF MANAGEMENT ACCOUNTINGC
OST–VO
LUM
E–PROFIT A
NA
LYSIS
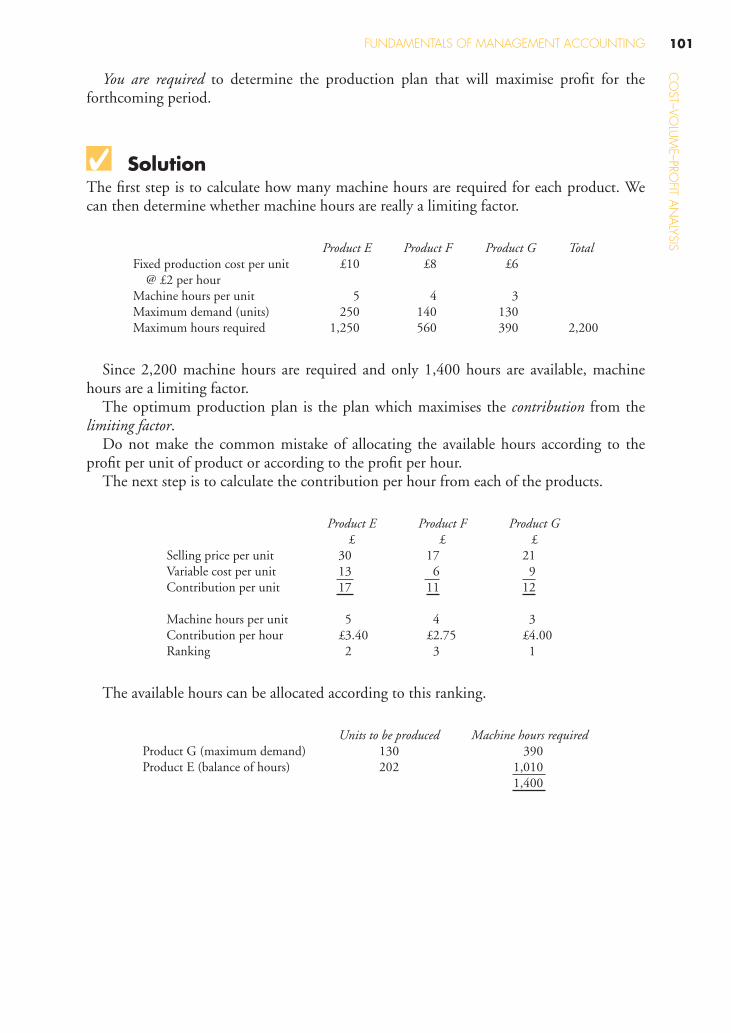
You are required to determine the production plan that will maximise profi t for the forthcoming period.
Solution The fi rst step is to calculate how many machine hours are required for each product. We can then determine whether machine hours are really a limiting factor.
Product E Product F Product G Total Fixed production cost per unit @ £2 per hour
£10 £8 £6
Machine hours per unit 5 4 3 Maximum demand (units) 250 140 130 Maximum hours required 1,250 560 390 2,200
Since 2,200 machine hours are required and only 1,400 hours are available, machine hours are a limiting factor.
The optimum production plan is the plan which maximises the contribution from the limiting factor .
Do not make the common mistake of allocating the available hours according to the profi t per unit of product or according to the profi t per hour.
The next step is to calculate the contribution per hour from each of the products.
Product E £
Product F £
Product G £
Selling price per unit 30 17 21 Variable cost per unit 13 6 9 Contribution per unit 17 11 12
Machine hours per unit 5 4 3 Contribution per hour £3.40 £2.75 £4.00 Ranking 2 3 1
The available hours can be allocated according to this ranking.
Units to be produced Machine hours required Product G (maximum demand) 130 390 Product E (balance of hours) 202 1,010 1,400
STUDY MATERIAL C1102C
OST
–VO
LUM
E–PR
OFI
T A
NA
LYSI
S 4.12 Summary Having read this chapter the main points that you should understand are as follows.
1. Cost–volume–profi t (CVP) analysis is the study of the effect on profi t of changes in costs and sales price, quantity and mix. Another common term used in this context is ‘ breakeven analysis ’ .
2. Contribution is calculated as sales value minus variable cost. 3. The ratio of a cost unit’s contribution to its selling price is usually assumed to be
constant. This ratio may be referred to as the contribution to sales (C/S) ratio or the profi t � volume (P/V) ratio, both of which are usually expressed as a percentage.
4. The breakeven point can be calculated as (fi xed costs/contribution per unit) or (fi xed costs/PV ratio).
5. The margin of safety is the difference between the expected level of sales and the breakeven point. It may be expressed as a percentage of the expected sales.
6. Contribution required to achieve a target profi t � fi xed costs � target profi t. 7. A breakeven chart is a pictorial representation of costs and revenues depicting the
profi t or loss for the relevant range of activity. 8. A contribution breakeven chart shows the variable cost line instead of the fi xed cost
line, so that contribution can be read directly from the chart. 9. A profi t–volume (PV) chart depicts a single line indicating the profi t or loss for the
relevant range of activity. It is particularly useful for demonstrating the effect on profi t of changes in costs or revenues.
10. Breakeven or CVP analysis has a number of limitations and managers should be aware of these if they are to apply the technique effectively.
11. A limiting factor is any factor which is in scarce supply and stops the organisation from expanding its activities further. The decision rule in this situation is to maximise the contribution per unit of limiting factor.
103
Revision Questions 4 Question 1 Multiple choice 1.1 A Ltd has fi xed costs of £60,000 per annum. It manufactures a single product which
it sells for £20 per unit. Its contribution to sales ratio is 40 per cent. A Ltd’s breakeven point in units is:
(A) 1,200 (B) 3,000 (C) 5,000 (D) 7,500.
1.2 B Ltd manufactures a single product which it sells for £9 per unit. Fixed costs are £54,000 per month and the product has a variable cost of £6 per unit.
In a period when actual sales were £180,000, B Ltd’s margin of safety, in units, was:
(A) 2,000 (B) 14,000 (C) 18,000 (D) 20,000.
1.3 For the forthcoming year, E plc’s variable costs are budgeted to be 60 per cent of sales value and fi xed costs are budgeted to be 10 per cent of sales value.
If E plc increases its selling prices by 10 per cent, but if fi xed costs, variable costs per unit and sales volume remain unchanged, the effect on E plc’s contribution would be:
(A) a decrease of 2 per cent. (B) an increase of 5 per cent. (C) an increase of 10 per cent. (D) an increase of 25 per cent.
1.4 An organisation currently provides a single service. The cost per unit of that service is as follows:
£ Selling price 130
Direct materials 22 Direct labour 15 Direct expenses 3 Variable overheads 10 Total variable cost 50
CO
ST–V
OLU
ME–
PRO
FIT
AN
ALY
SIS
REVISION QUESTIONS C1104
Total fi xed costs for the period amount to £1,600,000. How many units of ser-vice (to the nearest whole unit) will the organisation need to provide to customers to generate a profi t of £250,000?
(A) 20,000 (B) 20,555 (C) 23,125 (D) 26,428.
1.5 P Ltd provides plumbing services. Due to a shortage of skilled labour next period the company is unable to commence all the plumbing jobs for which customers have accepted estimates.
When deciding which plumbing jobs should be commenced, the jobs should be ranked according to the:
(A) Contribution to be earned from each job. (B) Profi t to be earned from each job. (C) Contribution to be earned per hour of skilled labour on each job. (D) Profi t to be earned per hour of skilled labour on each job.
1.6 Z Ltd manufactures three products, the selling price and cost details of which are given below:
Product X £
Product Y £
Product Z £
Selling price per unit 75 95 95 Costs per unit: Direct materials (£5/kg) 10 5 15 Direct labour (£8/hour) 16 24 20 Variable overhead 8 12 10 Fixed overhead 24 36 30
In a period when direct materials are restricted in supply, the most and the least profi table uses of direct materials are:
Most profi table Least profi table (A) X Z (B) Y Z (C) Z Y (D) Y X
Question 2 Short objective-test questions2.1 OT Ltd plans to produce and sell 4,000 units of product C each month, at a selling
price of £18 per unit. The unit cost of product C is as follows:
£ per unit Variable cost 8 Fixed cost 4 12
CO
ST–VOLU
ME–PRO
FIT AN
ALYSIS
105 FUNDAMENTALS OF MANAGEMENT ACCOUNTING
To the nearest whole number, the monthly margin of safety, as a percentage of planned sales is %.
2.2 The P/V ratio is the ratio of profi t generated to the volume of sales.
True False
2.3 Product J generates a contribution to sales ratio of 30 per cent. Fixed costs directly attributable to product J amount to £75,000 per month. The sales revenue required to achieve a monthly profi t of £15,000 is £ .
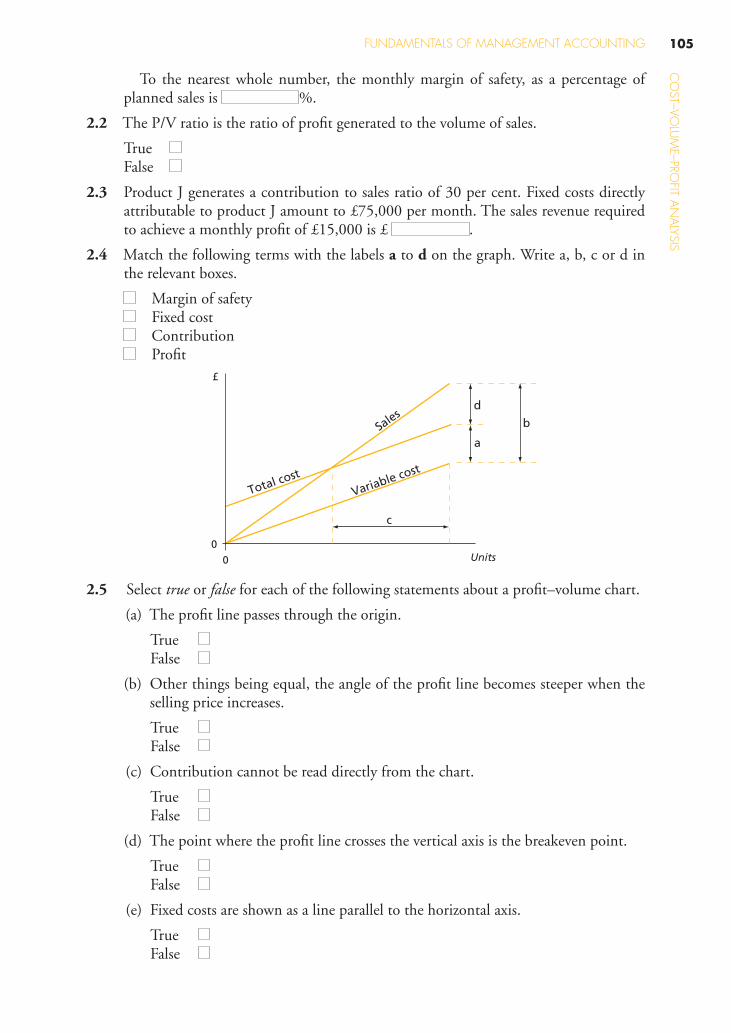
2.4 Match the following terms with the labels a to d on the graph. Write a, b, c or d in the relevant boxes.
Margin of safety Fixed cost Contribution Profi t
£
0
0
a
c
dbSa
les
Variable cost
Total cost
Units
2.5 Select true or false for each of the following statements about a profi t–volume chart.
(a) The profi t line passes through the origin.
True False
(b) Other things being equal, the angle of the profi t line becomes steeper when the selling price increases.
True False
(c) Contribution cannot be read directly from the chart.
True False
(d) The point where the profi t line crosses the vertical axis is the breakeven point.
True False
(e) Fixed costs are shown as a line parallel to the horizontal axis.
True False
CO
ST–V
OLU
ME–
PRO
FIT
AN
ALY
SIS
REVISION QUESTIONS C1106
(f ) The angle of the profi t line is directly affected by the P/V ratio.
True False
2.6 PH Ltd has spare capacity in its factory. A supermarket chain has offered to buy a number of units of product XZ each month, and this would utilise the spare capacity. The super-market is offering a price of £ 8 per unit and the cost structure of XZ is as follows:
£ per unit Direct material 3 Direct labour 2 Variable overhead 1 Fixed overhead 3 9
Fixed costs would not be affected. On a purely fi nancial basis, should the supermarket’s offer be accepted or rejected?
Accept the offer Reject the offer
2.7 The following tasks are undertaken when deciding on the optimum production plan when a limiting factor exists. Write 1, 2, 3 or 4 in the boxes to indicate the correct sequence of tasks.
Rank the products according to the contribution per unit of limiting factor used. Calculate each product’s contribution per unit of limiting factor used. Identify the limiting factor. Allocate the limited resource according to the ranking.
2.8 A manufacturer of cell phones is considering the following actions. Which of these is likely to increase the manufacturer’s C/S (contribution/sales) ratio (tick all that apply)?
(i) taking advantage of quantity discounts for bulk purchases of material; (ii) introducing training programmes designed to improve labour effi ciency; (iii) following the actions of a competitor who has cut prices substantially; (iv) reducing exports to countries where there is intense price competition; (v) offering retailers a lower price if they display the product more prominently.
Question 3 Profi t statements and breakeven analysis BSE Veterinary Services is a specialist laboratory carrying out tests on cattle to ascertain whether the cattle have any infection. At present, the laboratory carries out 12,000 tests each period but, because of current diffi culties with the beef herd, demand is expected to increase to 18,000 tests a period, which would require an additional shift to be worked.
CO
ST–VOLU
ME–PRO
FIT AN
ALYSIS
107 FUNDAMENTALS OF MANAGEMENT ACCOUNTING
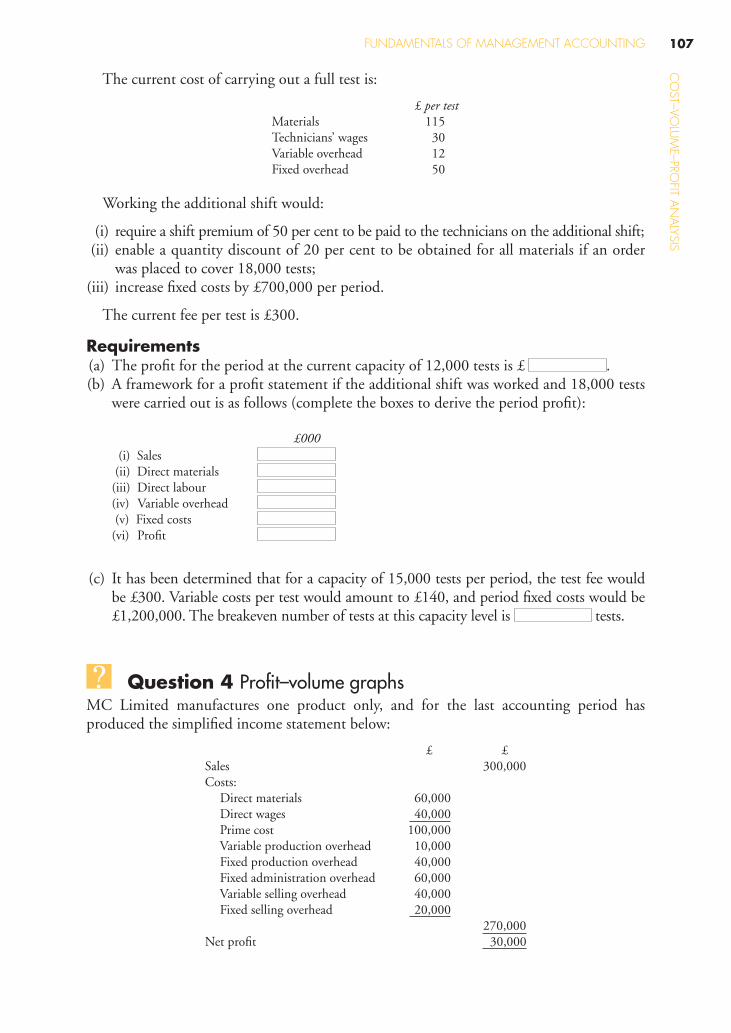
The current cost of carrying out a full test is:
£ per test Materials 115 Technicians ’ wages 30 Variable overhead 12 Fixed overhead 50
Working the additional shift would:
(i) require a shift premium of 50 per cent to be paid to the technicians on the additional shift; (ii) enable a quantity discount of 20 per cent to be obtained for all materials if an order
was placed to cover 18,000 tests; (iii) increase fi xed costs by £700,000 per period.
The current fee per test is £300.
Requirements (a) The profi t for the period at the current capacity of 12,000 tests is £ . (b) A framework for a profi t statement if the additional shift was worked and 18,000 tests
were carried out is as follows (complete the boxes to derive the period profi t):
£000 (i) Sales (ii) Direct materials (iii) Direct labour (iv) Variable overhead (v) Fixed costs (vi) Profi t
(c) It has been determined that for a capacity of 15,000 tests per period, the test fee would be £300. Variable costs per test would amount to £140, and period fi xed costs would be £1,200,000. The breakeven number of tests at this capacity level is tests.
Question 4 Profi t–volume graphs MC Limited manufactures one product only, and for the last accounting period has produced the simplifi ed income statement below:
£ £ Sales 300,000 Costs: Direct materials 60,000 Direct wages 40,000 Prime cost 100,000 Variable production overhead 10,000 Fixed production overhead 40,000 Fixed administration overhead 60,000 Variable selling overhead 40,000 Fixed selling overhead 20,000 270,000 Net profi t 30,000
CO
ST–V
OLU
ME–
PRO
FIT
AN
ALY
SIS
REVISION QUESTIONS C1108
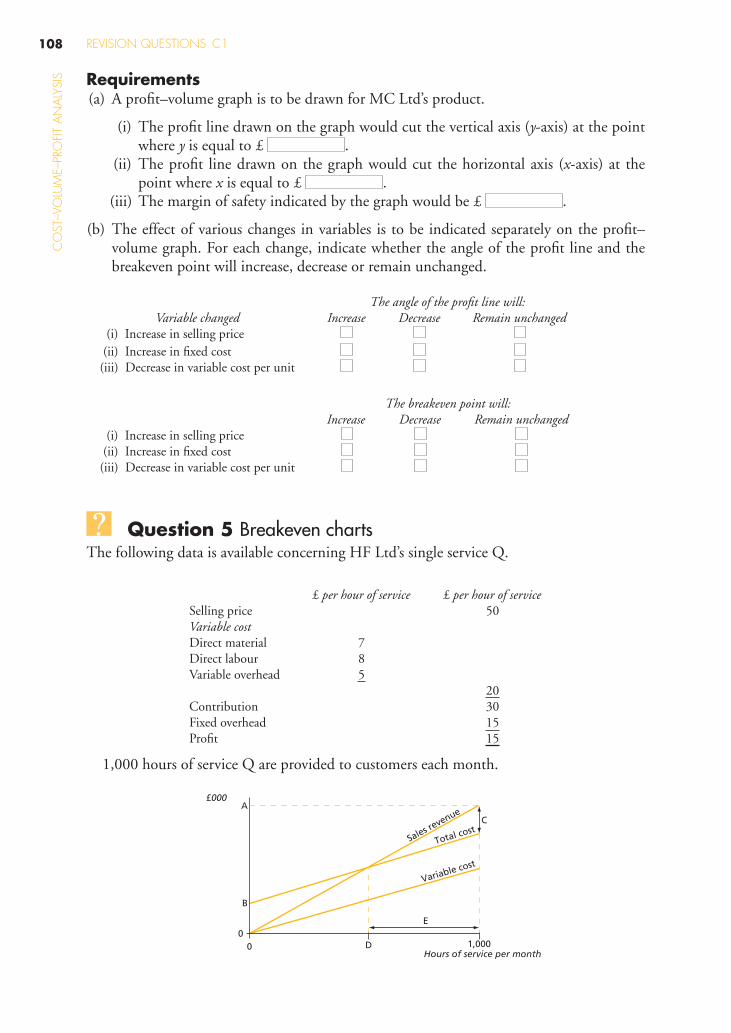
Requirements (a) A profi t–volume graph is to be drawn for MC Ltd’s product.
(i) The profi t line drawn on the graph would cut the vertical axis ( y -axis) at the point where y is equal to £ .
(ii) The profi t line drawn on the graph would cut the horizontal axis ( x -axis) at the point where x is equal to £ .
(iii) The margin of safety indicated by the graph would be £ .
(b) The effect of various changes in variables is to be indicated separately on the profi t–volume graph. For each change, indicate whether the angle of the profi t line and the breakeven point will increase, decrease or remain unchanged.
The angle of the profi t line will: Variable changed Increase Decrease Remain unchanged
(i) Increase in selling price (ii) Increase in fi xed cost (iii) Decrease in variable cost per unit
The breakeven point will: Increase Decrease Remain unchanged (i) Increase in selling price (ii) Increase in fi xed cost (iii) Decrease in variable cost per unit
Question 5 Breakeven charts The following data is available concerning HF Ltd’s single service Q.
£ per hour of service £ per hour of service Selling price 50 Variable cost Direct material 7 Direct labour 8 Variable overhead 5 20 Contribution 30 Fixed overhead 15 Profi t 15
1,000 hours of service Q are provided to customers each month.
£000A
B
00 1,000
E
C
D
Sales revenue
Variable cost
Total cost
Hours of service per month
CO
ST–VOLU
ME–PRO
FIT AN
ALYSIS
109 FUNDAMENTALS OF MANAGEMENT ACCOUNTING
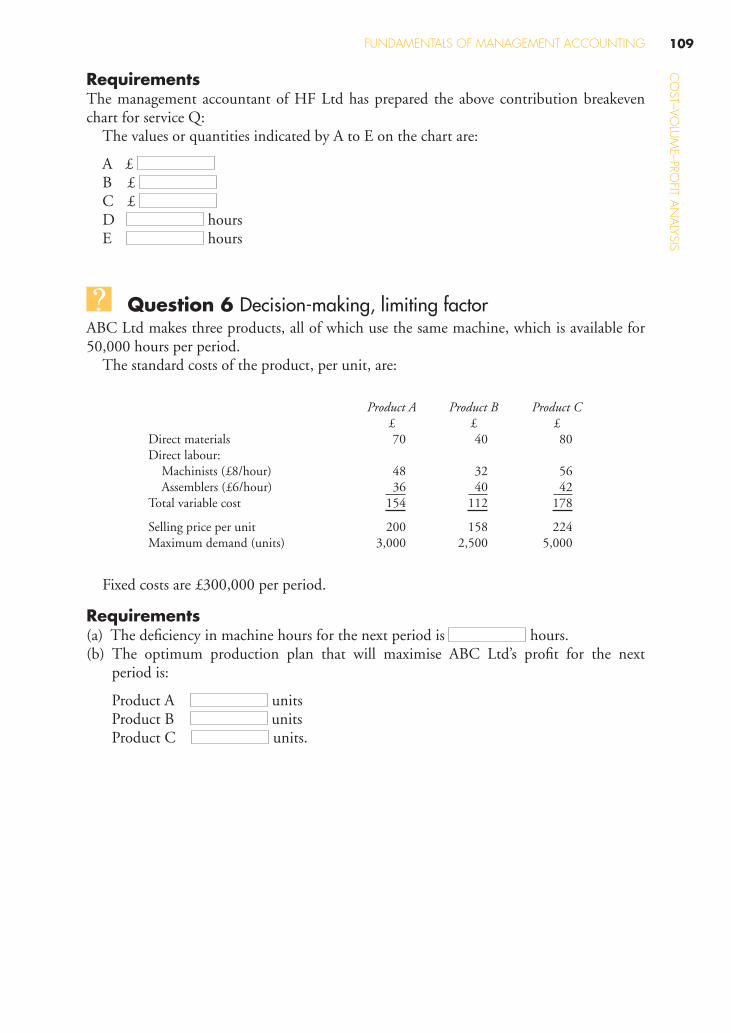
Requirements The management accountant of HF Ltd has prepared the above contribution breakeven chart for service Q:
The values or quantities indicated by A to E on the chart are:
A £ B £ C £ D hours E hours
Question 6 Decision-making, limiting factor ABC Ltd makes three products, all of which use the same machine, which is available for 50,000 hours per period.
The standard costs of the product, per unit, are:
Product A £
Product B £
Product C £
Direct materials 70 40 80 Direct labour: Machinists (£8/hour) 48 32 56 Assemblers (£6/hour) 36 40 42 Total variable cost 154 112 178
Selling price per unit 200 158 224 Maximum demand (units) 3,000 2,500 5,000
Fixed costs are £300,000 per period.
Requirements (a) The defi ciency in machine hours for the next period is hours. (b) The optimum production plan that will maximise ABC Ltd’s profi t for the next
period is:
Product A units Product B units Product C units.

This page intentionally left blank
111
Solutions to Revision Questions
Solution 1 ● Question 1.3 is quite tricky. Try setting up a table of the selling price, variable cost
and contribution before and after the change, perhaps using a selling price of £100. Remember that fi xed costs are not relevant because they do not affect contribution.
1.1 Answer: (D)
Contribution per unit of selling price
Breakeven poi
� �40 8% £
nnt units� �£
£
60 000
87 500
,,
1.2 Answer: (A)
Contribution per unit
Breakeven pointFixed costs
C
� � �
�
£ £ £9 6 3
oontribution per unit units
Margin of safe
� �£
£
54 000
318 000
,,
tty Actual sales breakeven sales
u
� � � �
�
£
£
180 000
918 000
2 000
,,
, nnits
1.3 Answer: (D) Fixed costs are not relevant because they do not affect contribution. Taking a selling price of, say, £100 per unit, the cost structures will look like this:
Before change £ per unit
After change £ per unit
Sales price 100 � 10% 110 Variable cost 60 60 Contribution 40 50
Contribution per unit increases by 25 per cent. If sales volume remains unchanged then total contribution will also increase by 25 per cent.
4
CO
ST–V
OLU
ME–
PRO
FIT
AN
ALY
SIS
SOLUTIONS TO REVISION QUESTIONS C1112
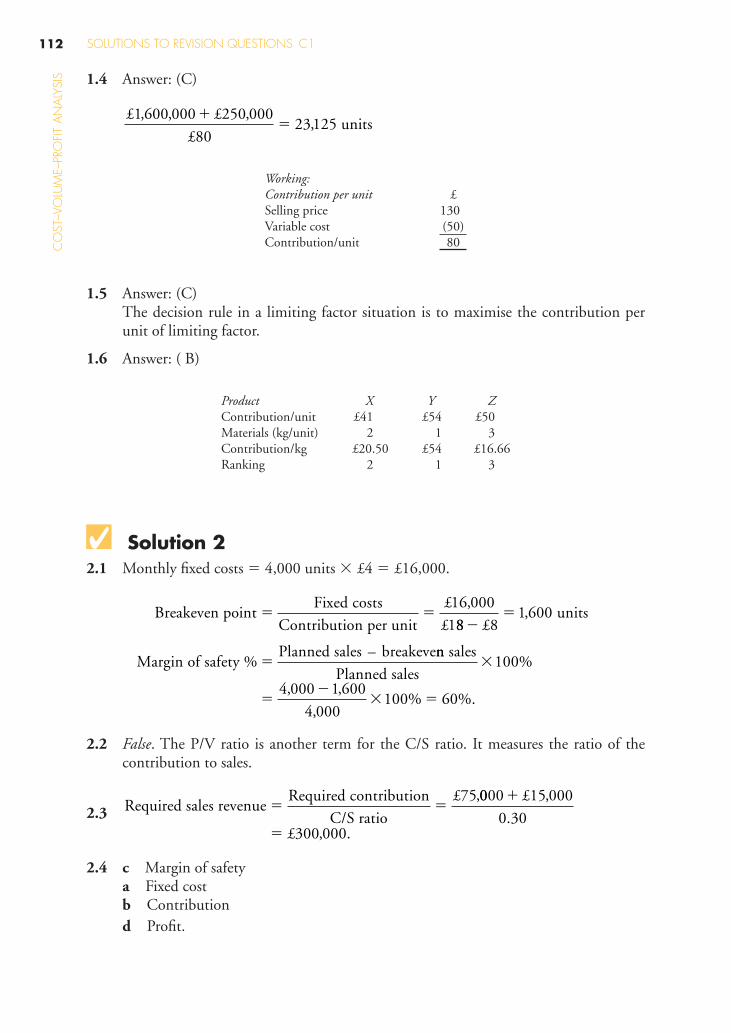
1.4 Answer: (C)
£ £
£
1 600 000 250 000
8023125
, , ,,
�� units
Working: Contribution per unit £ Selling price 130 Variable cost (50) Contribution/unit 80
1.5 Answer: (C) The decision rule in a limiting factor situation is to maximise the contribution per unit of limiting factor.
1.6 Answer: ( B)
Product X Y Z Contribution/unit £41 £54 £50 Materials (kg/unit) 2 1 3 Contribution/kg £20.50 £54 £16.66 Ranking 2 1 3
Solution 2 2.1 Monthly fi xed costs � 4,000 units � £4 � £16,000.
Breakeven pointFixed costs
Contribution per unit
£
£� �
16 000
1
,
88 81 600
��
�
£ units
Margin of safety %Planned sales – breakeve
,
nn sales
Planned sales%
%
�
��
� �
100
4 000 1 600
4 000100 60
, ,
,%.
2.2 False . The P/V ratio is another term for the C/S ratio. It measures the ratio of the contribution to sales.
2.3 Required sales revenueRequired contribution
C/S ratio� �
£75,0000 15 000
0 30300 000
�
�
£
£
,
., .
2.4 c Margin of safety a Fixed cost b Contribution d Profi t.
CO
ST–VOLU
ME–PRO
FIT AN
ALYSIS
113 FUNDAMENTALS OF MANAGEMENT ACCOUNTING
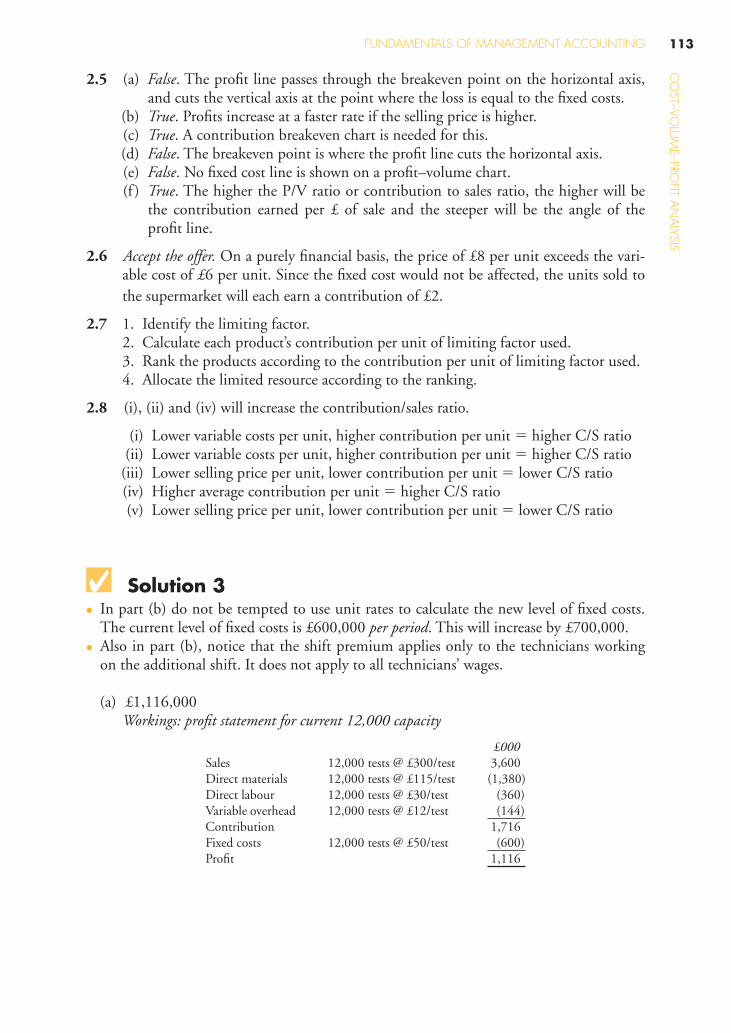
2.5 (a) False . The profi t line passes through the breakeven point on the horizontal axis, and cuts the vertical axis at the point where the loss is equal to the fi xed costs.
(b) True . Profi ts increase at a faster rate if the selling price is higher. (c) True . A contribution breakeven chart is needed for this. (d) False . The breakeven point is where the profi t line cuts the horizontal axis. (e) False . No fi xed cost line is shown on a profi t–volume chart. (f ) True . The higher the P/V ratio or contribution to sales ratio, the higher will be
the contribution earned per £ of sale and the steeper will be the angle of the profi t line.
2.6 Accept the offer. On a purely fi nancial basis, the price of £8 per unit exceeds the vari-able cost of £ 6 per unit. Since the fi xed cost would not be affected, the units sold to the supermarket will each earn a contribution of £2.
2.7 1. Identify the limiting factor. 2. Calculate each product’s contribution per unit of limiting factor used. 3. Rank the products according to the contribution per unit of limiting factor used. 4. Allocate the limited resource according to the ranking.
2.8 (i), (ii) and (iv) will increase the contribution/sales ratio.
(i) Lower variable costs per unit, higher contribution per unit � higher C/S ratio (ii) Lower variable costs per unit, higher contribution per unit � higher C/S ratio (iii) Lower selling price per unit, lower contribution per unit � lower C/S ratio (iv) Higher average contribution per unit � higher C/S ratio (v) Lower selling price per unit, lower contribution per unit � lower C/S ratio
Solution 3 ● In part (b) do not be tempted to use unit rates to calculate the new level of fi xed costs.
The current level of fi xed costs is £600,000 per period . This will increase by £700,000. ● Also in part (b), notice that the shift premium applies only to the technicians working
on the additional shift. It does not apply to all technicians ’ wages.
(a) £1,116,000 Workings: profi t statement for current 12,000 capacity
£000 Sales 12,000 tests @ £300/test 3,600 Direct materials 12,000 tests @ £115/test (1,380) Direct labour 12,000 tests @ £30/test (360) Variable overhead 12,000 tests @ £12/test (144) Contribution 1,716 Fixed costs 12,000 tests @ £50/test (600) Profi t 1,116
CO
ST–V
OLU
ME–
PRO
FIT
AN
ALY
SIS
SOLUTIONS TO REVISION QUESTIONS C1114
(b) Profi t statement for 18,000 capacity, with additional shift
£000 £000 Sales 18,000 tests @ £300/test 5,400 (i) Direct materials 18,000 tests @ £92/test (1,656) (ii) Direct labour 12,000 tests @ £30/test (360) 6,000 tests @ £45/test (270) (630) (iii) Variable overhead 18,000 tests @ £12/test (216) (iv) Contribution 2,898 Fixed costs (1,300) (v) Profi t 1,598 (vi )
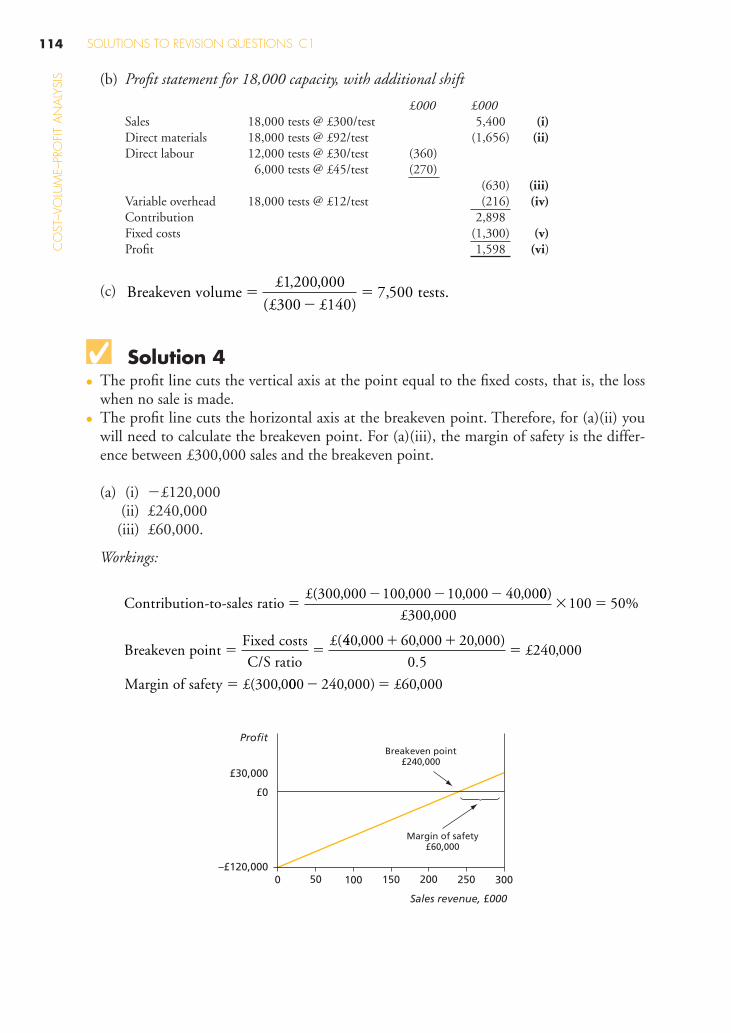
(c) Breakeven volume tests.��
�£
£ £
1 200 000
300 1407 500
, ,
( ),
Solution 4 ● The profi t line cuts the vertical axis at the point equal to the fi xed costs, that is, the loss
when no sale is made. ● The profi t line cuts the horizontal axis at the breakeven point. Therefore, for (a)(ii) you
will need to calculate the breakeven point. For (a)(iii), the margin of safety is the differ-ence between £300,000 sales and the breakeven point.
(a) (i) � £120,000 (ii) £240,000 (iii) £60,000.
Workings:
Contribution-to-sales ratio(
�� � �£ 300 000 100 000 10 000 40 00, , , , 00
300 000100 50
)
,%
(
£
£
� �
� �Breakeven pointFixed costs
C/S ratio
440 000 60 000 20 000
0 5240 000
300 0
, , , )
.,
,
� ��
�
£
£Margin of safety ( 000 240 000 60 000� �, ) ,£
Margin of safety£60,000
Breakeven point£240,000
–£120,0000 50 150 200 250 300100
£30,000
Profit
£0
Sales revenue, £000
CO
ST–VOLU
ME–PRO
FIT AN
ALYSIS
115 FUNDAMENTALS OF MANAGEMENT ACCOUNTING
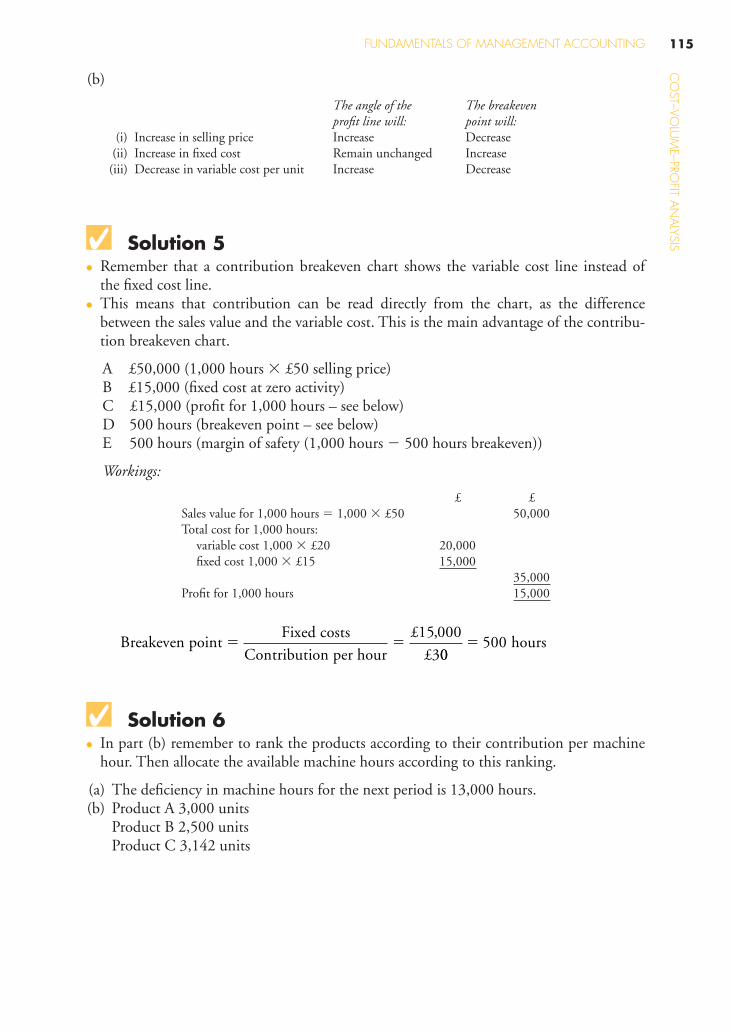
(b)
The angle of the profi t line will:
The breakeven point will:
(i) Increase in selling price Increase Decrease (ii) Increase in fi xed cost Remain unchanged Increase (iii) Decrease in variable cost per unit Increase Decrease
Solution 5 ● Remember that a contribution breakeven chart shows the variable cost line instead of
the fi xed cost line. ● This means that contribution can be read directly from the chart, as the difference
between the sales value and the variable cost. This is the main advantage of the contribu-tion breakeven chart.
A £50,000 (1,000 hours � £50 selling price) B £15,000 (fi xed cost at zero activity) C £15,000 (profi t for 1,000 hours – see below) D 500 hours (breakeven point – see below) E 500 hours (margin of safety (1,000 hours � 500 hours breakeven))
Workings:
£ £ Sales value for 1,000 hours � 1,000 � £50 50,000 Total cost for 1,000 hours: variable cost 1,000 � £20 20,000 fi xed cost 1,000 � £15 15,000 35,000 Profi t for 1,000 hours 15,000
Breakeven pointFixed costs
Contribution per hour� �
£
£
15 000
3
,
00500� hours
Solution 6 ● In part (b) remember to rank the products according to their contribution per machine
hour. Then allocate the available machine hours according to this ranking.
(a) The defi ciency in machine hours for the next period is 13,000 hours. (b) Product A 3,000 units
Product B 2,500 units Product C 3,142 units
CO
ST–V
OLU
ME–
PRO
FIT
AN
ALY
SIS
SOLUTIONS TO REVISION QUESTIONS C1116
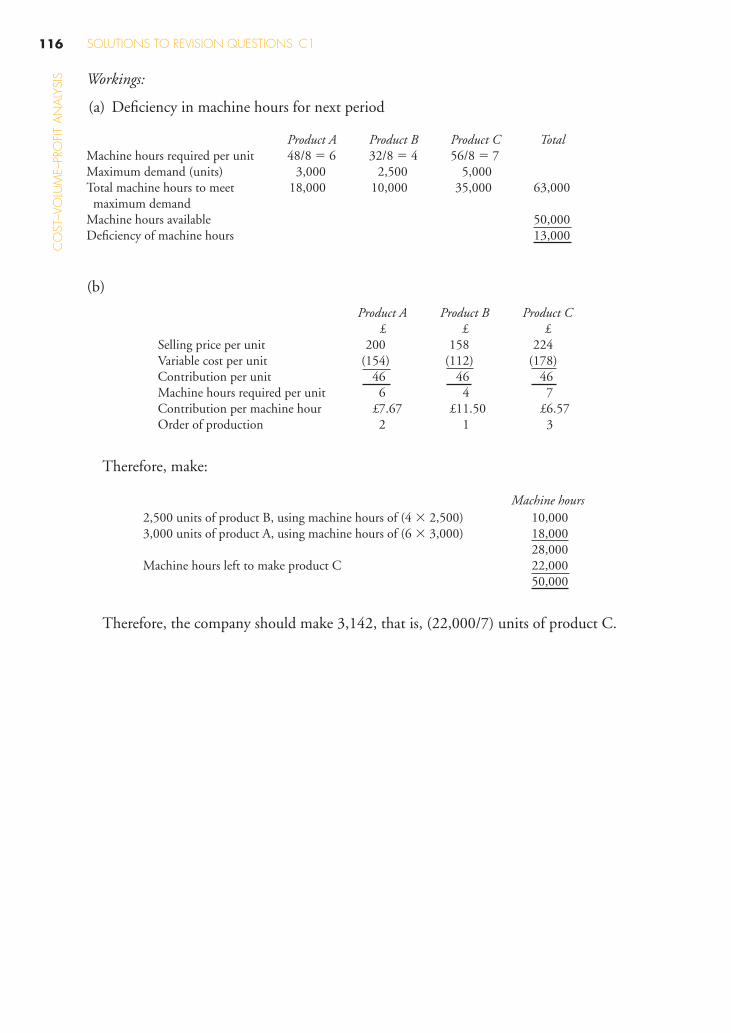
Workings:
(a) Defi ciency in machine hours for next period
Product A Product B Product C Total Machine hours required per unit 48/8 � 6 32/8 � 4 56/8 � 7 Maximum demand (units) 3,000 2,500 5,000 Total machine hours to meet maximum demand
18,000 10,000 35,000 63,000
Machine hours available 50,000 Defi ciency of machine hours 13,000
(b)
Product A£
Product B£
Product C£
Selling price per unit 200 158 224 Variable cost per unit (154) (112) (178) Contribution per unit 46 46 46 Machine hours required per unit 6 4 7 Contribution per machine hour £7.67 £11.50 £6.57 Order of production 2 1 3
Therefore, make:
Machine hours 2,500 units of product B, using machine hours of (4 � 2,500) 10,000 3,000 units of product A, using machine hours of (6 � 3,000) 18,000 28,000 Machine hours left to make product C 22,000 50,000
Therefore, the company should make 3,142, that is, (22,000/7) units of product C.