Embed Size (px)
Citation preview

CPD11, 521–553, 2015
Temperaturereconstruction for NE
Canada
M. Naulier et al.
Title Page
Abstract Introduction
Conclusions References
Tables Figures
J I
J I
Back Close
Full Screen / Esc
Printer-friendly Version
Interactive Discussion
Discussion
Paper
|D
iscussionP
aper|
Discussion
Paper
|D
iscussionP
aper|
Clim. Past Discuss., 11, 521–553, 2015www.clim-past-discuss.net/11/521/2015/doi:10.5194/cpd-11-521-2015© Author(s) 2015. CC Attribution 3.0 License.
This discussion paper is/has been under review for the journal Climate of the Past (CP).Please refer to the corresponding final paper in CP if available.
A millennial summer temperaturereconstruction for northeastern Canadausing oxygen isotopes in subfossil trees
M. Naulier1, M. M. Savard2, C. Bégin2, F. Gennaretti3, D. Arseneault3, J. Marion2,A. Nicault4, and Y. Bégin1
1Institut national de la recherche scientifique-ETE, 490 rue de la Couronne, QC,G1K9A9, Canada2Geological Survey of Canada, Natural Resources Canada, 490 rue de la Couronne, QC,G1K9A9, Canada3Université du Québec à Rimouski, 300 allée des Ursulines, Rimouski, G5L3A1, Canada4Aix-Marseille University, ECCOREV (FR-3098), Europôle Méditerranéen de l’Arbois, BP 80,13545 Aix-en-Provence CEDEX 4, France
Received: 18 November 2014 – Accepted: 5 January 2015 – Published: 20 February 2015
Correspondence to: M. Naulier ([email protected])
Published by Copernicus Publications on behalf of the European Geosciences Union.
521

CPD11, 521–553, 2015
Temperaturereconstruction for NE
Canada
M. Naulier et al.
Title Page
Abstract Introduction
Conclusions References
Tables Figures
J I
J I
Back Close
Full Screen / Esc
Printer-friendly Version
Interactive Discussion
Discussion
Paper
|D
iscussionP
aper|
Discussion
Paper
|D
iscussionP
aper|
Abstract
Climatic reconstructions for north-eastern Canada are scarce such that this area isunder-represented in global temperature reconstructions. To fill this lack of knowledgeand identify the most important processes influencing climate variability, this studypresents the first summer temperature reconstruction for eastern Canada based on5
a millennial oxygen isotopic series (δ18O) from tree rings. For this purpose, we selected230 well-preserved subfossil stems from the bottom of a boreal lake and five living treeson the lakeshore. The sampling method permitted an annually resolved δ18O serieswith a replication of five trees per year. The June to August maximal temperatureof the last millennium has been reconstructed using the statistical relation between10
Climatic Research Unit (CRU TS3.1) and δ18O data. The resulting millennial seriesis marked by the well-defined Medieval Warm Anomaly (AD 1000–1250), the Little IceAge (AD 1450–1880) and the modern period (AD 1950–2010), and an overall averagecooling trend of −0.6 ◦C/millennium. These climatic periods and climatic low frequencytrends are in agreement with the only reconstruction available for northeastern Canada15
and others from nearby regions (Arctic, Baffin Bay) as well as some remote regionslike the Canadian Rockies or Fennoscandia. Our temperature reconstruction clearlyindicates that the Medieval Warm Anomaly has been warmer than the modern period,which is relatively cold in the context of the last 1000 years. However, the temperatureincrease during the last three decades is one of the fastest warming observed over20
the last millennium (+1.9 ◦C between 1970 and 2000). An additional key finding ofthis research is that the coldest episodes mainly coincide with low solar activitiesand the extremely cold period of the early 19th century has occurred when a solarminimum was in phase with successive intense volcanic eruptions. Our study providesa new perspective unraveling key mechanisms that controlled the past climate shifts in25
northeastern Canada.
522

CPD11, 521–553, 2015
Temperaturereconstruction for NE
Canada
M. Naulier et al.
Title Page
Abstract Introduction
Conclusions References
Tables Figures
J I
J I
Back Close
Full Screen / Esc
Printer-friendly Version
Interactive Discussion
Discussion
Paper
|D
iscussionP
aper|
Discussion
Paper
|D
iscussionP
aper|
1 Introduction
The recently published work of the Intergovernmental Panel on Climate Change (IPCCAR5, 2013; PAGES 2K consortium, 2013) has shown that north-eastern Canadais poorly represented among existing millennial temperature reconstructions in theNorthern Hemisphere. For this reason, a better knowledge of regional past climate5
variations registered in natural archives is needed. The use of natural archives suchas trees, sediment or pollen has permitted the reconstruction of temperature variabilityat regional, hemispheric and global scales for the past millennium (Hegerl et al., 2007;Mann et al., 2009; Moberg et al., 2005; PAGES 2k consortium, 2013). Although somestudies have documented past climatic conditions in northern Canada (Moore et al.,10
2001; Thomas and Briner, 2009; Luckman and Wilson, 2005; Edwards et al., 2008;Viau and Gajewski, 2009; Gajewski and Atkinson, 2003), only one annually-resolvedmillennial temperature reconstruction based on tree-ring widths exists for easternCanada (Gennaretti et al., 2014; summer temperature reconstruction for EasternCanada, STREC), but none has been based on the isotopic approach. Consequently,15
obtaining millennial-long, high-resolution temperature reconstructions from additionalproxies in north-eastern Canada is important to increase our knowledge of the pastclimate, and better understand the mechanisms of climate change.
Tree-ring isotope series present the advantage that they generally do not need tobe detrended; they retain climatic low frequency variations, and require fewer trees20
compared to classical dendrological methods (Loader et al., 2013; Robertson et al.,1997; Young et al., 2010). Moreover, oxygen (δ18O) and carbon (δ13C) series haveproven their suitability for reconstructing past summer temperatures (Porter et al., 2013;Luckman and Wilson, 2005; Barber et al., 2004; Anchukaitis et al., 2012). Whereasδ13C series have often been used for long climatic reconstructions, only a few studies25
have used long δ18O series (Edwards et al., 2008; Richter et al., 2008; Treydte et al.,2006; Wang et al., 2013). A previous study has already proven that δ18O is the most
523

CPD11, 521–553, 2015
Temperaturereconstruction for NE
Canada
M. Naulier et al.
Title Page
Abstract Introduction
Conclusions References
Tables Figures
J I
J I
Back Close
Full Screen / Esc
Printer-friendly Version
Interactive Discussion
Discussion
Paper
|D
iscussionP
aper|
Discussion
Paper
|D
iscussionP
aper|
suitable isotopic proxy for summer temperature reconstruction in our study region(Naulier et al., 2014, 2015).
In northern Canada, most tree species rarely live more than 300 years (Arseneaultet al., 2013). In such regions where old trees are missing, isotopic chronologies canbe extended by combining living specimens with subfossil trees preserved in lakes5
(Boettger et al., 2003; Gagen et al., 2012; Mayr et al., 2003; Savard et al., 2012), andcross-dating stems to determine subfossil tree ages (Arseneault et al., 2013). For thepurpose of paleoclimate studies, subfossil stems can be easily extracted and collectedfrom large stocks of drowned subfossil logs in lakes and can be associated with specificedaphic contexts as most specimens are not redistributed in lakes (Gennaretti et al.,10
2014a).After cross-dating, the development of a robust millennial, isotopic chronology from
the combination of living and subfossil stems involves replicating specimens in order toretain the climate variability of the study site (Haupt et al., 2014; Loader et al., 2013a).However, the amount of material available is often a constraint because of the short15
lifespans of trees, the difficulty to separate single and thin rings and obtaining enoughcellulose for isotopic analysis (Loader et al., 2013b; Boettger and Friedrich, 2009).To overcome these problems, different pooling methods have been developed suchas inter-tree pooling (McCarroll and Loader, 2004; Dorado Liñán et al., 2011), serialpooling of consecutive tree rings within an individual tree (Boettger and Friedrich,20
2009), and the “offset-pool plus join-point method” (Gagen et al., 2012). This lastmethod has permitted constructing a millennial δ13C series with annual resolutionand high replication, while reducing the sampling efforts and laboratory analyses(Gagen et al., 2012). Moreover, a statistical analysis of this method has confirmed itsrobustness and possible application for the production of millennial δ18O series (Haupt25
et al., 2014).The present study aims to produce a new paleoclimatic data set based on tree-
ring δ18O series covering the last millennium in northeastern North America. For thispurpose, we develop a 1010 years long δ18O series using a combination of living trees
524

CPD11, 521–553, 2015
Temperaturereconstruction for NE
Canada
M. Naulier et al.
Title Page
Abstract Introduction
Conclusions References
Tables Figures
J I
J I
Back Close
Full Screen / Esc
Printer-friendly Version
Interactive Discussion
Discussion
Paper
|D
iscussionP
aper|
Discussion
Paper
|D
iscussionP
aper|
and submerged subfossil stems from one site, and reconstruct the summer maximaltemperature. We analyze the main characteristics of the climatic series and evaluateits robustness by comparison with other reconstructed temperature series. Finally, weexplore the potential impact of natural forcing (solar radiation and volcanic eruptions)on past climatic variability in north-eastern Canada.5
2 Materials and methods
2.1 Study area
The study site is located at the center of the Quebec-Labrador peninsula in north-eastern Canada (Fig. 1a). This area is part of the Precambrian Canadian Shield, mainlyconstituted of granitic and gneissic rocks. The landscape is characterized by a low10
altitude plateau (400–600 m), with abundant lakes and wetlands (Dyke et al., 1989).Forests of the area are dominated by black spruce (Picea mariana (Mill.) BSP) trees,developed as pure open lichen woodlands on well-drained sites, and spruce-mosswoodlands in depressions. Balsam fir (Abies balsamea (L.) Mill.) and Tamarack (Larixlaricina (Du Roi) Koch) also grow in this region. Wildfires are the most important natural15
disturbances with a rotation period estimated between 250 and 500 years (Boulangeret al., 2012).
The climate is continental and subarctic with short, mild summers and long, coldwinters. Environment Canada data (Schefferville station) show that the 1949 to 2010mean monthly temperature is −22.9 ◦C in January and 13.3 ◦C in July with a mean20
annual temperature of −3.9 ◦C. Total annual precipitation averaged 640 mm with up to60 % falling in summer (June–September). The mean duration of the frost-free periodis 75 days from mid-late June to mid-September. The lakes are generally frozen frommid-October to early June.
The selected lake (L20; 54◦56′31′′N; 71◦24′10′′W) is part of the large network25
of lakes sampled by our group (Arseneault et al., 2013; Gennaretti et al., 2014a,
525

CPD11, 521–553, 2015
Temperaturereconstruction for NE
Canada
M. Naulier et al.
Title Page
Abstract Introduction
Conclusions References
Tables Figures
J I
J I
Back Close
Full Screen / Esc
Printer-friendly Version
Interactive Discussion
Discussion
Paper
|D
iscussionP
aper|
Discussion
Paper
|D
iscussionP
aper|
b). Ecological and morphological criteria have been developed to identify lakes thatpresent the best potential for millennial-long climatic reconstructions (well-preservedsubfossil trees) and large stocks of subfossil logs. These lakes are typified by an abruptlake/forest transition, as well as log accumulation in the lower littoral zone away fromice erosion and waves (Arseneault et al., 2013; Gennaretti et al., 2014a, c). Lake L205
has an altitude of 483 m and an area of 35.1 ha. It is bordered by open spruce-mosswith lichen woodlands growing on well-drained podzolic soil and regular slope. The lastsevere wildfire occurred at about AD 1590 along the southern section of the studiedshore segment and more than 1200 years ago along the northern section (Gennarettiet al., 2014c).10
2.2 Tree stem selection and sampling strategy
We recently demonstrated that isotopic series from different heights along lakeshoretrees provide similar isotopic trends, and indicated that the combination of lakeshoreblack spruce trees with subfossil stem segments does not introduce artefacts in longδ18O series, thus permitting their combination for climatic reconstruction (Naulier et al.,15
2014). In the present study, subfossil stems were selected from a large collection of586 cross-dated specimens from lake L20, also used in the STREC reconstruction(Gennaretti et al., 2014b), based on their excellent degree of preservation (Savardet al., 2012), relatively large ring width (> 0.2 mm) and their life span. The developmentof a millennial isotopic series requires choosing an appropriate method to preserve20
both high and low climate frequencies, while limiting analytical efforts. We decided toadapt the “offset-pool plus join-point method” (Gagen et al., 2012) in order to obtain anannual resolution with a replication of five trees for each year.
According to this sampling method, one cohort is made by selecting segments fromfive contemporaneous trees such that each cohort overlaps the next one over five25
years. In our case, five living trees were selected to construct a modern cohort (CV;AD 1860–2006) and 60 well-preserved subfossil stems from the lake floor were usedto produce 12 subfossil cohorts (C0–C11; AD 997–1956; Fig. 2). Overall, our cohorts
526

CPD11, 521–553, 2015
Temperaturereconstruction for NE
Canada
M. Naulier et al.
Title Page
Abstract Introduction
Conclusions References
Tables Figures
J I
J I
Back Close
Full Screen / Esc
Printer-friendly Version
Interactive Discussion
Discussion
Paper
|D
iscussionP
aper|
Discussion
Paper
|D
iscussionP
aper|
cover between 59 and 111 years and the complete suite of cohorts extends fromAD 997 to 2006. Additionally, within every cohort, each tree was divided into five-yearblocks which were offset by one year among trees. As a consequence, the δ18O valueobtained for a specific year is the mean of the isotopic results from five trees, whichrepresents a triangular centralized nine-year moving average.5
2.3 Laboratory treatment
We extracted α-cellulose sub-samples according to a standard protocol modified forsmall samples at the Delta-lab of the Geological Survey of Canada (Green, 1963;Savard et al., 2012). The extracted α-cellulose was dried at 55 ◦C for 12 h andsub-samples analyzed using peripherals on-line with gas-source isotope ratio mass10
spectrometers (IRMS). All material was analyzed for δ18O values with a pyrolysis-CF-IRMS (Delta plus XL). The analytical accuracy of this instrument was 0.2 ‰ (1σ), asestablished by using international standards (IAEA-SO-6 and IAEA-NBS-127). All δ18Omeasures are reported in permil (‰) relative to the Vienna Standard Mean OceanWater (VSMOW). A total of 2192 analyses were produced, with, in addition, 24 % of all15
samples retreated and analyzed to determine the external precision (reproducibility) ofthe complete procedure (0.2 ‰, 1σ).
2.4 Cohort corrections and climatic reconstruction
When a long isotopic series is produced from trees coming from a random assemblage,joining two successive cohorts may be difficult due to the existence of isotopic offsets20
between cohorts. An approach to overcome this problem is to use the mean ofδ18O values coming from several tree segments from the overlap period betweentwo successive cohorts which permits to estimate a correction factor for the offset(Gagen et al., 2012). In the present study, the construction of the millennial δ18Oseries required such an adjustment for some cohorts. We have adopted the “join-point25
method” proposed by Gagen et al. (2012). A join-point (hereafter JP), corresponds
527

CPD11, 521–553, 2015
Temperaturereconstruction for NE
Canada
M. Naulier et al.
Title Page
Abstract Introduction
Conclusions References
Tables Figures
J I
J I
Back Close
Full Screen / Esc
Printer-friendly Version
Interactive Discussion
Discussion
Paper
|D
iscussionP
aper|
Discussion
Paper
|D
iscussionP
aper|
to the mean results of 5 years blocks from several trees overlapping between twocohorts. We have used all available dated trees (between 10 and 24) to producethe required join points (JP0 to JP11), and verified several methods to correct for theoffsets between cohorts. Hence, every cohort has been corrected by adding the linearregression calculated between the δ18O values of its two ends.5
The integrity of the isotopic signal has been verified elsewhere (Naulier, 2014). Theδ18O values of lignin and cellulose have been analyzed for three contrasted climaticperiods of the millennium (AD 1141–1164, 1741–1761 and 1886–1909), as detectedin previous studies (e.g. Savard et al., 2012). The cellulose isotopic integrity of thesubfossil stems has been confirmed by the similarity of the ∆ values between living10
trees and subfossil stems for the 1886–1909 period. In addition, the departure betweenthe δ18O values of lignin and cellulose (∆ = δ18Ocellulose−δ
18Olignin) exhibit no temporaltrend.
In previous studies, we have analyzed the relationships between δ18O series of fiveliving trees and various climatic parameters (temperature, precipitation, vapor pressure15
deficit, etc). We have established that δ18O series of black spruce stems sampled at anannual resolution from boreal lakeshore were significantly correlated with June–August(JJA) maximal temperature (Tmax; r = 0.54). We have also determined by statisticalanalysis (Buishand test, Buishand, 1982) that the summers became warmer after 1975and that the growing season duration and degree-days have increased importantly20
during the last decade (2000–2010). Moreover, we have demonstrated that during thisdecade the growing season started sooner and finished later than before, changingthe relationship between JJA maximal temperature and δ18O series (divergence). Inother words, this JJA Tmax and δ18O series relation is stable and strong between1930 and 2000 (rmean = 0.54; 1930–2000), but not after (AD 2000–2010; Naulier et al.,25
2014, 2015). Therefore, in the present study, we excluded the last decade (divergentyears) when calibrating the δ18O series on temperature data which is assumed to benon-representative of the temperature variation over the last century. The δ18O seriesof subfossil cohorts are filtered on 9 years; we have made the choice to pass a 9 years
528

CPD11, 521–553, 2015
Temperaturereconstruction for NE
Canada
M. Naulier et al.
Title Page
Abstract Introduction
Conclusions References
Tables Figures
J I
J I
Back Close
Full Screen / Esc
Printer-friendly Version
Interactive Discussion
Discussion
Paper
|D
iscussionP
aper|
Discussion
Paper
|D
iscussionP
aper|
centered-filter on the JJA maximal temperature CRU TS 3.1 in order to use series alltreated in the same way for the reconstruction.
In a first step, a simple linear regression and a linear-scaling model were calibratedover the entire 1930–2000 period with climatic data. Climate data from the 1900–1929period were excluded because no meteorological station was then operating at less5
than 300 km from the study site. The climatic series was separated into two equalperiods (AD 1930–1970 and 1971–2000; Table 1) in order to test the robustness ofthe two calibration models, using the non-first-differenced reduction of error (RE), thecoefficient of error (CE), the raw mean squared error (RMSE) and the coefficient ofdetermination (r2). The linear regression and the linear-scaling calibration procedures10
resulted in somewhat different temperature reconstructions of similar robustness withsimilar RE, CE, r2 and RMSE coefficients. In both cases, the model residuals satisfythe standard linear regression assumptions of normality, variance and autocorrelation(not shown), but cannot reproduce all attributes of the measured data. We thereforetested the possibility of averaging the two model results, and this option gave the best15
reproduction of the measured Tmax. Consequently, we averaged results from the tworeconstructions in order to obtain one robust reconstruction (Table 1).
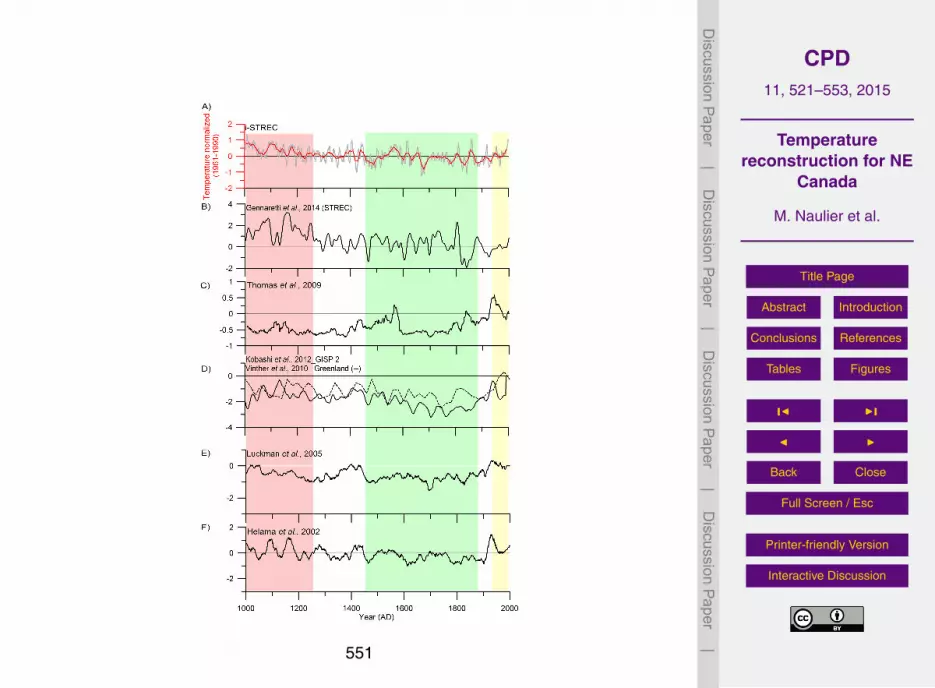
Then, i-STREC was compared to the only other regional temperature reconstruction(STREC; Gennaretti et al., 2014), which is built from ring width data from 6 lakes,including our site, and with reconstructions based on tree rings from another boreal20
region (Fennoscandia, Helama et al., 2002; Fig. 5). We also compared i-STRECwith independent temperature reconstructions based on other natural archives fromNorth America and the Arctic region (Thomas and Briner, 2009; Kobashi et al., 2011;Luckman and Wilson, 2005; Vinther et al., 2009; Fig. 5). Most published reconstructionsare based on mean temperatures, except our reconstruction and the one from the25
Canadian Rockies, which are based on summer maximal temperatures. The influenceof climatic forcings was evaluated through the comparison of i-STREC with time seriesof sulfate emission from volcanic origin (Crowley et al., 2013) and solar radiation series
529

CPD11, 521–553, 2015
Temperaturereconstruction for NE
Canada
M. Naulier et al.
Title Page
Abstract Introduction
Conclusions References
Tables Figures
J I
J I
Back Close
Full Screen / Esc
Printer-friendly Version
Interactive Discussion
Discussion
Paper
|D
iscussionP
aper|
Discussion
Paper
|D
iscussionP
aper|
(Bard et al., 2003; Fig. 6). The durations of the solar minima have been determinedaccording to existing estimations of solar radiation (e.g., Bard et al., 2003).
3 Results and discussion
3.1 Development of δ18O chronology
As the purpose of the reconstruction was to identify contrasted periods and important5
temperature changes over the last millennium, the choice of the sampling methodproposed by Boettger et al. (2009) was relevant because it allows for reconstructionof climatic parameters at an annual resolution with a replication of five trees per year.The range of δ18O values of trees is between 19.5 and 22.0 ‰, and the largest δ18Odifferences among trees within a junction is obtained for JP5 (3.8 ‰; Fig. 3a). This large10
inter-tree variability can be explained by a combination of causes, including variousgrowing locations along the lakeshore which influence their water supply (Fig. 1b), andinter-tree metabolic variability (0.5 ‰ in Naulier et al., 2014). Such variability confirmsthe need to take a large number of trees for a millennial reconstruction in order tocapture the site signal (Loader et al., 2013a).15
The δ18O values at intersections between two successive cohorts and of the JPδ18O means are surprisingly matching in most cases (except at the C8/C9 and C3/C4junctions; Fig. 3). These observations suggest that offset correction between cohortsis not always necessary. However, we have determined that a modification of the JPadjustment procedure published by Gagen et al. (2012) would optimize the correction20
while conserving the isotopic variability and trends over the millennium (Naulier, 2014).Hence, we have used the mean of δ18O values of JP from overlapping cohorts tocalculate the required adjustment, this mean being considered as “the adjustmentvalue”. Correcting cohort δ18O series with this method increases the number of treesconsidered (20–33 trees instead of 10–23 trees if only JP are used).25
530

CPD11, 521–553, 2015
Temperaturereconstruction for NE
Canada
M. Naulier et al.
Title Page
Abstract Introduction
Conclusions References
Tables Figures
J I
J I
Back Close
Full Screen / Esc
Printer-friendly Version
Interactive Discussion
Discussion
Paper
|D
iscussionP
aper|
Discussion
Paper
|D
iscussionP
aper|
After correction, the mean of the millennial δ18O series is 20.8 ‰. The strongcorrelation between the δ18O series of living trees and subfossil stems (r2 = 0.70) overtheir overlapping period (1860–1956) confirms the isotopic integrity of the subfossilstems, and ensures that the climatic reconstruction can be performed over the rest ofthe millennial δ18O series.5
3.2 Model validation and millennial climatic reconstruction
3.2.1 Model validation
We have compared two methods of sampling and production of the ring series fromliving trees prior to calibration: (1) separation at an annual resolution without pooling(e.g., Haupt et al., 2013); and (2) sampling with the cohort approach. We have found10
that the second was best suited because it slightly improved the correlation betweenδ18O series and maximal temperatures (r2 = 0.64 vs. 0.54 with annual resolution), andit allows using δ18O series compatible with the one used for the millennial subfossilseries (9 years moving average). Consequently, the δ18O series of the living-tree cohort(CV) was used to calibrate the model and to provide a robust reconstruction as it show15
a strong correlation with the new CRU series (r2 = 0.64) for the entire calibration period(1930–2000), which confirmed that the reconstruction of past temperature with theaverage δ18O series is suitable (Fig. 4a). The RMSE is 0.26, with a RE and a CEof 0.60. These statistical results confirm that the summer temperature reconstructedbased on δ18O values (i-STREC) are representative of the natural variability that20
existed in north-eastern Canada.
3.2.2 Millennial temperature trends in north-eastern Canada
The i-STREC shows a 0.6 ◦C decrease of maximum summer temperature over the pastmillennium (Fig. 4b), whereas a millennial 0.2 ◦C cooling is roughly estimated for themean temperature of Northern Hemisphere (PAGES 2k consortium, 2013). However,25
531

CPD11, 521–553, 2015
Temperaturereconstruction for NE
Canada
M. Naulier et al.
Title Page
Abstract Introduction
Conclusions References
Tables Figures
J I
J I
Back Close
Full Screen / Esc
Printer-friendly Version
Interactive Discussion
Discussion
Paper
|D
iscussionP
aper|
Discussion
Paper
|D
iscussionP
aper|
our local temperature decrease is in the same order of magnitude as the decrease ofsummer-months mean temperature reconstructed using pollen in the North Americantundra (Viau et al., 2012), and in northern regions of high latitudes (sediment, tree-ringwidths, ice core in Kaufman et al., 2009 and tree-ring widths in Esper et al., 2012). Thistemperature decline over the last millennium is generally attributed to orbital forcing5
(PAGES 2k consortium, 2013).The reconstruction suggests that the maximum summer temperature has varied
from a maximum of 17.3 ◦C around AD 1008–1010 to a minimum of 14.8 ◦C aroundAD 1670–1674. The twentieth century was generally cold (mean of 16 ◦C) with anabrupt warming trend during the last three decades (+0.2 ◦C/10 years between10
AD 1900–1980 and +0.8 ◦C/decade between AD 1980 and 2010; CRU TS 3.1 data;Fig. 4a). Furthermore, two major climatic episodes were also revealed by i-STREC:a warm period during the eleventh and twelfth centuries (mean of 16.5 ◦C) anda cold period from the early fifteenth to the end of the nineteenth centuries (meanof 15.8 ◦C; Fig. 4b). These periods are in agreement with the general knowledge of the15
temperature trends observed globally for the last millennium and correspond to, theMedieval Warm Anomaly (MWA) and the Little Ice Age (LIA), respectively (IPCC, 2013;PAGES 2k consortium, 2013). Based on i-STREC data, we associate these two climaticepisodes to the ∼ AD 1000–1250 and ∼ AD 1450–1880 time periods, respectively.
3.2.3 Evidences of contrasted climatic periods20
The high summer temperatures of the 11th century (AD∼ 1000–1250; Fig. 4b) coincidewith peaks previously observed in our study area based on tree-ring width (Gennarettiet al., 2014b; STREC), as well as in Greenland ice cores (Kobashi et al., 2011;Vinther et al., 2009, 2010), tree-ring series from the Canadian Rockies (Luckmanand Wilson, 2005) and Fennoscandia (Helama et al., 2002; Fig. 5), and large-scale25
reconstructions (Mann et al., 2009; Ljungqvist et al., 2012; Kaufman et al., 2009;Trouet et al., 2013). Several hypotheses on the forcing of this warm anomaly havebeen proposed, including a prolonged tendency towards a positive-phase of the North
532

CPD11, 521–553, 2015
Temperaturereconstruction for NE
Canada
M. Naulier et al.
Title Page
Abstract Introduction
Conclusions References
Tables Figures
J I
J I
Back Close
Full Screen / Esc
Printer-friendly Version
Interactive Discussion
Discussion
Paper
|D
iscussionP
aper|
Discussion
Paper
|D
iscussionP
aper|
Atlantic Oscillation (NAO; Trouet et al., 2009, 2012) or a synchronicity between LaNiña phase and a warm phase in the Atlantic Multidecadal Oscillation (AMO; Fenget al., 2011; Mann et al., 2009). In northeastern Canada, the NAO has an importantimpact on winter temperatures but not for summer (Hurrell et al., 2003). In contrast,the AMO influences spring and summer temperatures (Fortin and Lamoureux, 2009)5
and is partly responsible for the recent sea surface temperature warming of north-eastern Canada (Ding et al., 2014). Thus, a warm phase of AMO during the MWAcould have caused the warm period observed in our study area. The MWA has beenwidely studied for its similarities with the modern warming period, even if the causesthat triggered these periods are different (i.e., Landrum et al., 2013). Following the10
MWA, i-STREC emphasize a cold period between ∼ AD 1450 and 1880, which can beattributed to the Little Ice Age (LIA; Fig. 4b). It is worth noting that a short warmingphase occurred between 1510 and 1590 (Fig. 4b). Such warm phase also occurred atthe eastern Canadian treeline and included the expansion of upright tree growth formsin lichen-spruce woodland (Payette et al., 1989). Overall, the LIA is recorded in several15
Northern Hemisphere temperature reconstructions based on various proxies, even if itslength vary among regions (PAGES 2k consortium, 2013). At the hemispheric scale,the LIA is a well-documented cool period (Moberg et al., 2005; Mann et al., 2009;Hegerl et al., 2007), and several causes may have concurred to trigger its occurrence,including a succession of strong volcanic eruptions (Crowley, 2000; Miller et al., 2012;20
Gennaretti et al., 2014b), millennial orbital cooling (Kaufman et al., 2009; Esper et al.,2012), and low solar radiation (Bard et al., 1997).
In the present study, we compared the i-STREC mean of maximal summertemperatures for MWA (1000–1250), LIA (1350–1850) and the modern period (1950–2000 as defined in IPCC, 2014) and found that the MWA was warmer than the modern25
period (+0.2 ◦C) and LIA (+0.4 ◦C) in our study area. These results contrast somewhatwith Northern Hemisphere temperature reconstructions that have determined thatthe mean annual temperature of the modern period was the warmest in northernCanada (Mann et al., 2009; Ljungqvist et al., 2012). Indeed, the data available for
533

CPD11, 521–553, 2015
Temperaturereconstruction for NE
Canada
M. Naulier et al.
Title Page
Abstract Introduction
Conclusions References
Tables Figures
J I
J I
Back Close
Full Screen / Esc
Printer-friendly Version
Interactive Discussion
Discussion
Paper
|D
iscussionP
aper|
Discussion
Paper
|D
iscussionP
aper|
these hemispheric reconstructions in the last IPCC report are scarce for north-easternCanada (Viau et al., 2012). Clearly, both the i-STREC and STREC (Gennaretti et al.,2014) results indicate that the MWA in northeastern Canada has been the warmestperiod of the last millennium (Fig. 5). Moreover, both i-STREC and STREC show thatthe last century was relatively corelative to the preceding periods. However, summer5
temperatures in this area have significantly increased during the last three decadesand this warming (+1.9 ◦C between 1970 and 2000) is one of the fastest observed overthe last millennium. In all cases, the LIA in i-STREC has been colder than the modernwarm period (−0.3 ◦C) and MWA (−0.4 ◦C).
3.2.4 Climatic forcings of the last millennium10
Contrary to previous studies, our isotopic series does not emphasise an abruptLIA onset in response to volcanic forcing such as the AD 1257 Samalas event(Lavigne et al., 2013; Fig. 6). Instead, our data suggest that solar radiation was themost influential forcing on Tmax changes in the studied region. Indeed, the mostimportant cooling phases of i-STREC occurred during periods of low solar activity15
like the Oort (AD 1040–1080), Dalton (AD 1800–1850), Maunder (AD 1600–1650) andSpörer (AD 1410–1480) minima (Fig. 6). A simple re-sampling method involving 1000iterations of re-sampling (bootstrapped) has demonstrated that the low temperatureperiods were always associated to low solar radiation periods (p < 0.05). Proposingthat solar radiation represents an important control on temperature in north-eastern20
Canada is in agreement with the hypothesis that the solar forcing was importantduring the last millennium (AD 1000 to ∼ 1900), except during the modern period(Breitenmoser et al., 2012; Keller et al., 2004), implying that recent anthropogenicimpact is the main control at that time. However, even i-STREC is not significantlyinfluenced by volcanism, as determined by superimposed epoch analysis (results not25
shown), the possibility that successive strong volcanic eruptions combined with solarminima could have contributed to the important LIA cooling in Northeastern Canadacannot be discarded. Strong eruptions and solar minima coincide during the Maunder
534

CPD11, 521–553, 2015
Temperaturereconstruction for NE
Canada
M. Naulier et al.
Title Page
Abstract Introduction
Conclusions References
Tables Figures
J I
J I
Back Close
Full Screen / Esc
Printer-friendly Version
Interactive Discussion
Discussion
Paper
|D
iscussionP
aper|
Discussion
Paper
|D
iscussionP
aper|
minimum with the Kuwae eruption, and the Dalton minimum with the unknown (1809),Tambora (1815) and Cosiguïna (1835) eruptions. The role of coinciding natural forcingsis also invoked in other paleoclimatic studies that have compared Northern Hemispherereconstructions with solar radiation series (e.g., Bard et al., 2006; Breitenmoser et al.,2012; Crowley et al., 2000; Lean et al., 1995; Shindell et al., 2003). These studies have5
shown that temperature changes were largely due to solar forcing alone during the firstpart of the last millennial, and to volcanic and solar forcings (i.e, Breitenmoser et al.,2012), or to volcanic eruptions (i.e., Crowley et al., 2000; Keller et al., 2004) during theend of the LIA (after 1600).
The other temperature reconstruction produced for the studied region (STREC)10
contains a stronger volcanic signal than i-STREC (Gennaretti et al., 2014b).Considering that the two reconstructions are statistically robust, we can assume thatthey both reflect real trends. In addition, calibrating STREC using the same approachthan for i-STREC (i.e. calibration on maximum temperature over the 1930–2000 timeperiod) indicates that methods cannot account for the main differences between the15
two reconstructions. Consequently, differences in thermal trends between i-STREC andSTREC must be caused by their respective sensitivity to climatic triggers and controlmechanisms, ring width and δ18O values. The first important point to bear in mindis that temperature is the main control on changes in ring widths and δ18O values,but not the only one. Consequently, other climatic parameters (i.e., precipitations,20
vapor pressure deficit; Naulier et al., 2014) have also generated short and mediumvariations on the two series, creating an important “climatic noise” at high and mediumfrequencies, possibly explaining the differences between the reconstructions. However,it is important to recall that the ring width and δ18O series used to generate STRECand i-STREC display similar long-term climatic trends. This last point is quite important,25
considering that our main purpose was to identify long climatic tendencies over the lastmillennium in northeastern Canada.
The second important aspect to consider is that the temperature-linked processesresponsible for the variations of ring widths and δ18O values slightly differ. In the studied
535

CPD11, 521–553, 2015
Temperaturereconstruction for NE
Canada
M. Naulier et al.
Title Page
Abstract Introduction
Conclusions References
Tables Figures
J I
J I
Back Close
Full Screen / Esc
Printer-friendly Version
Interactive Discussion
Discussion
Paper
|D
iscussionP
aper|
Discussion
Paper
|D
iscussionP
aper|
region, rings widths are directly influenced by photosynthetic rates, which generallyincrease with ambient temperatures. In addition, volcanic aerosols blocking light aftera major volcanic eruption may also reduce ring growth concomitantly to reducedtemperature, explaining the strong influence of major volcanic events on ring width. Incontrast, one of the main control on the final tree-ring δ18O values is the temperature5
prevailing regionally during cloud mass distillation, as registered in the raindrop signaland transferred to the source water in soils, then through the root system, to the tree.Moreover, the temperature effects on fractionation during distillation and precipitation(Rayleigh process) is not limited to a temperature range, and may record temperaturelows that are not necessarily extreme such as those modulated by solar radiations.10
When strong volcanic events are combined with minimal solar radiations, the stronginfluence on regional temperature is also detected by δ18O values of rain drops. Thesekey differences in mechanisms controlling temperature recorded in ring widths andδ18O values imply that the two proxies may emphasize forcings in a complementaryfashion.15
As a summary, it appears that ring widths or δ18O series have strengths andweaknesses as proxy of past climatic conditions. However, the climatic data that can beextracted from the two series can generate complementary information, permitting tohighlight several climatic forcings and identify the main regional control on past, presentand future temperatures. Nevertheless, there are still needs for further understanding20
the differences between processes influencing isotopic assimilation and ring-widthgrowth. Such information would be useful for future climatic reconstruction usinga multi-indicator approach.
4 Conclusions
1. The cohort sampling method allows reconstructing climatic variability of medium25
and low frequencies by using fewer samples than other sampling methods,with a high temporal resolution and analytical replication. Our adjustment of the
536

CPD11, 521–553, 2015
Temperaturereconstruction for NE
Canada
M. Naulier et al.
Title Page
Abstract Introduction
Conclusions References
Tables Figures
J I
J I
Back Close
Full Screen / Esc
Printer-friendly Version
Interactive Discussion
Discussion
Paper
|D
iscussionP
aper|
Discussion
Paper
|D
iscussionP
aper|
method of joining cohorts, the JP-adjustment method, permits the preservationof δ18O variability between segments of trees without biasing the millennial δ18Oseries.
2. The combination of two statistical models (linear scaling and simple linearregression) has permitted an adequate reproduction of the measured regional5
temperature, and allowed reconstructing maximum temperature over the lastmillennium.
3. i-STREC is complementary to the only other reconstruction in the study region(STREC, based on tree-ring width). These two reconstructions should becombined within a multi-parameter approach to increase the proportions of10
variance explained.
4. i-STREC suggests that the main climatic forcing at play during the last millenniumin the studied region was solar activity, but we remain cautious because webase this hypothesis solely on an apparent correlation between reconstructedTmax and the curve for solar radiations. Clearly, coldest episodes in the L2015
area coincide with low solar radiation (Oort, Spörer, Maunder and Dalton),with the exception of an episode in the nineteenth century, during which lowsolar radiations (Dalton minima) were combined with two successive and strongvolcanic eruptions (unknown 1809 and Tambora 1815 eruptions).
5. Overall, i-STREC shows that the Medieval Warm Anomaly (997–1250; MWA)20
was the warmest period of the last millennium in the study region. However, thesudden and rapid temperature increase during the last four decades is one of thefastest over the last millennium (+1.9 ◦C between 1970 and 2000) and if this rapidwarming rate persists, the future climate in northeastern Canada may become anissue of concern.25
Acknowledgements. The authors would like to thank Anna Smirnoff, Marie-Christine Simardand Marc Luzincourt for their technical support during sample treatment and analyses at the
537

CPD11, 521–553, 2015
Temperaturereconstruction for NE
Canada
M. Naulier et al.
Title Page
Abstract Introduction
Conclusions References
Tables Figures
J I
J I
Back Close
Full Screen / Esc
Printer-friendly Version
Interactive Discussion
Discussion
Paper
|D
iscussionP
aper|
Discussion
Paper
|D
iscussionP
aper|
Delta-Lab of the Geological Survey of Canada. We are grateful to Julia Autin, Pierre-PaulDion and Yves Bouthillier for the sampling of lakeshore trees and subfossil stems. We alsowould like to thank Steve Wolfe who made constructive comments during a pre-submissionreview of this article. This research was supported financially by the NSERC-OURANOSCollaborative Research and Development grant (ARCHIVES project of INRS–ETE), and the5
Environmental Geoscience Program of the Geological Survey of Canada (ESS contributionnumber 20140213).
References
Anchukaitis, K. J., D’Arrigo, R. D., Andreu-Hayles, L., Frank, D., Verstege, A., Curtis, A.,Buckley, B. M., Jacoby, G. C., and Cook, E. R.: Tree-ring reconstructed summer temperatures10
from northwestern North America during the last nine centuries, J. Climate, 26, 3001–3012,doi:10.1175/jcli-d-11-00139.1, 2012.
Arseneault, D., Dy, B., Gennaretti, F., Autin, J., and Bégin, Y.: Developing millennial tree ringchronologies in the fire-prone North American boreal forest, J. Quaternary Sci., 28, 283–292,doi:10.1002/jqs.2612, 2013.15
Barber, V. A., Juday, G. P., Finney, B. P., and Wilmking, M.: Reconstruction of summertemperatures in interior Alaska from tree-ring proxies: evidence for changing synoptic climateregimes, Climatic Change, 63, 91–120, 2004.
Bard, E. and Frank, M.: Climate change and solar variability: what’s new under the sun?, EarthPlanet. Sc. Lett., 248, 1–14, 2006.20
Bard, E., Raisbeck, G. M., Yiou, F., and Jouzel, J.: Solar modulation of cosmogenic nuclideproduction over the last millennium: comparison between 14C and 10Be records, EarthPlanet. Sc. Lett., 150, 453–462, 1997.
Bard, E., Raisbeck, G., Yiou, F., and Jouzel, J.: Reconstructed Solar Irradiance Data,IGBP PAGES/World Data Center for Paleoclimatology Data Contribution Series #2003-006,25
NOAA/NGDC Paleoclimatology Program, Boulder CO, USA, 2003.Boettger, T. and Friedrich, M.: A new serial pooling method of shifted tree ring blocks to
construct millennia long tree ring isotope chronologies with annual resolution, Isot. Environ.Healt. S., 45, 68–80, doi:10.1080/10256010802522218, 2009.
538

CPD11, 521–553, 2015
Temperaturereconstruction for NE
Canada
M. Naulier et al.
Title Page
Abstract Introduction
Conclusions References
Tables Figures
J I
J I
Back Close
Full Screen / Esc
Printer-friendly Version
Interactive Discussion
Discussion
Paper
|D
iscussionP
aper|
Discussion
Paper
|D
iscussionP
aper|
Boulanger, Y., Gauthier, S., Burton, P. J., and Vaillancourt, M.-A.: An alternative fire regimezonation for Canada, Int. J. Wildland Fire, 21, 1052–1064, doi:10.1071/WF11073, 2012.
Breitenmoser, P., Beer, J., Broennimann, S., Frank, D., Steinhilber, F., and Wanner, H.: Solarand volcanic fingerprints in tree-ring chronologies over the past 2000 years, Palaeogeogr.Palaeocl., 313, 127–139, 2012.5
Briffa, K. R., Jones, P. D., Schweingruber, F. H., and Osborn, T. J.: Influence of volcaniceruptions on Northern Hemisphere summer temperature over the past 600 years, Nature,393, 450–455, 1998.
Buishand, T. A.: Some methods for testing the homogeneity of rainfall data, J. Hydrol., 58,11–27, 1982.10
Crowley, T. J.: Causes of climate change over the past 1000 years, Science, 289, 270–277,2000.
Crowley, T. J. and Unterman, M. B.: Technical details concerning development of a 1200 yrproxy index for global volcanism, Earth Syst. Sci. Data, 5, 187–197, doi:10.5194/essd-5-187-2013, 2013.15
Dai, J., Mosley-Thompson, E., and Thompson, L. G.: Ice core evidence for an explosive tropicalvolcanic eruption 6 years preceding Tambora, J. Geophys. Res.-Atmospheres (1984–2012),96, 17361–17366, 1991.
D’Arrigo, R. D. and Jacoby, G. C.: Northern North American tree-ring evidence for regionaltemperature changes after major volcanic events, Clim. Change, 41, 1–15, 1999.20
D’Arrigo, R., Jacoby, G. C., Wilson, R., Liepert, B., and Cherubini, P.: On the “DivergenceProblem” in Northern Forests: a review of the tree-ring evidence and possible causes, GlobalPlanet. Change, 60, 289–305, doi:10.1016/j.gloplacha.2007.03.004, 2008.
Daux, V., Edouard, J.-L., Masson-Delmotte, V., Stievenard, M., Hoffmann, G., Pierre, M.,Mestre, O., Danis, P., and Guibal, F.: Can climate variations be inferred from tree-ring25
parameters and stable isotopes from Larix decidua? Juvenile effects, budmoth outbreaks,and divergence issue, Earth Planet. Sc. Lett., 309, 221–233, 2011.
Ding, Q., Wallace, J. M., Battisti, D. S., Steig, E. J., Gallant, A. J., Kim, H.-J., and Geng, L.:Tropical forcing of the recent rapid Arctic warming in north-eastern Canada and Greenland,Nature, 509, 209–212, 2014.30
Dorado Liñán, I., Gutiérrez, E., Helle, G., Heinrich, I., Andreu-Hayles, L., Planells, O., Leuen-berger, M., Bürger, C., and Schleser, G.: Pooled vs. separate measurements of tree-ring
539

CPD11, 521–553, 2015
Temperaturereconstruction for NE
Canada
M. Naulier et al.
Title Page
Abstract Introduction
Conclusions References
Tables Figures
J I
J I
Back Close
Full Screen / Esc
Printer-friendly Version
Interactive Discussion
Discussion
Paper
|D
iscussionP
aper|
Discussion
Paper
|D
iscussionP
aper|
stable isotopes, Sci. Total Environ., 409, 2244–2251, doi:10.1016/j.scitotenv.2011.02.010,2011.
Driscoll, W. W., Wiles, G. C., D’Arrigo, R. D., and Wilmking, M.: Divergent tree growth responseto recent climatic warming, Lake Clark National Park and Preserve, Alaska, Geophys. Res.Lett., 32, L20703, doi:10.1029/2005GL024258, 2005.5
Edwards, T. W., Birks, S. J., Luckman, B. H., and MacDonald, G. M.: Climatic and hydrologicvariability during the past millennium in the eastern Rocky Mountains and northern GreatPlains of western Canada, Quaternary Res., 70, 188–197, 2008.
Esper, J., Frank, D. C., Timonen, M., Zorita, E., Wilson, R. J., Luterbacher, J., Holzkämper, S.,Fischer, N., Wagner, S., and Nievergelt, D.: Orbital forcing of tree-ring data, Nature Climate10
Change, 2, 862–866, 2012.Feng, S., Hu, Q., and Oglesby, R. J.: Influence of Atlantic sea surface temperatures on
persistent drought in North America, Clim. Dynam., 37, 569–586, 2011.Fortin, D. and Lamoureux, S. F.: Multidecadal hydroclimatic variability in north-eastern North
America since 1550 AD, Clim. Dynam., 33, 427–432, 2009.15
Gagen, M., Zorita, E., McCarroll, D., Young, G. H. F., Grudd, H., Jalkanen, R., Loader, N. J.,Robertson, I., and Kirchhefer, A.: Cloud response to summer temperatures in Fennoscandiaover the last thousand years, Geophys. Res. Lett., 38, L05701, doi:10.1029/2010gl046216,2011.
Gagen, M., McCarroll, D., Jalkanen, R., Loader, N. J., Robertson, I., and Young, G. H. F.:20
A rapid method for the production of robust millennial length stable isotopetree ring series for climate reconstruction, Global Planet. Change, 82–83, 96–103,doi:10.1016/j.gloplacha.2011.11.006, 2012.
Gajewski, K. and Atkinson, D.: Climatic change in northern Canada, Environ. Rev., 11, 69–102,2003.25
Gao, C., Robock, A., and Ammann, C.: Volcanic forcing of climate over the past 1500 years:an improved ice core-based index for climate models, J. Geophys. Res., 113, D23111,doi:10.1029/2008JD010239, 2008.
Gennaretti, F., Arseneault, D., and Bégin, Y.: Millennial stocks and fluxes of large woody debrisin lakes of the North American taiga, J. Ecol., 102, 367–380, 2014a.30
Gennaretti, F., Arseneault, D., Nicault, A., Perreault, L., and Bégin, Y.: Volcano-induced regimeshifts in millennial tree-ring chronologies from North-eastern North America, P. Natl. Acad.Sci. USA, 111, 10077–10082, 2014b.
540

CPD11, 521–553, 2015
Temperaturereconstruction for NE
Canada
M. Naulier et al.
Title Page
Abstract Introduction
Conclusions References
Tables Figures
J I
J I
Back Close
Full Screen / Esc
Printer-friendly Version
Interactive Discussion
Discussion
Paper
|D
iscussionP
aper|
Discussion
Paper
|D
iscussionP
aper|
Gennaretti, F., Arseneault, D., and Bégin, Y.: Millennial disturbance-driven forest standdynamics in the Eastern Canadian taiga reconstructed from subfossil logs, J. Ecol., 102,1612–1622, doi:10.1111/1365-2745.12315, 2014c.
Green, J. W.: Wood cellulose, Methods Carbohydr. Chem. III, 3, 9–21, 1963.Guiot, J. and Nicault, A.: Méthodes de dendroclimatologie à l’échelle continentale: fonctions de5
réponse et fonction de transfert, La Dendroécologie, 229–253, 2011 (in French).Haupt, M., Friedrich, M., Shishov, V. V., and Boettger, T.: The construction of oxygen isotope
chronologies from tree-ring series sampled at different temporal resolution and its use asclimate proxies: statistical aspects, Climatic Change, 122, 201–215, 2014.
Hegerl, G. C., Crowley, T. J., Allen, M., Hyde, W. T., Pollack, H. N., Smerdon, J., and Zorita, E.:10
Detection of human influence on a new, validated 1500-year temperature reconstruction, J.Climate, 20, 650–666, 2007.
Helama, S., Lindholm, M., Timonen, M., J., M., and Eronen, M.: The supra-long Scots pinetree-ring record for Finnish Lapland: Part 2, interannual to centennial variability in summertemperatures for 7500 years, The Holocene, 12, 681–687, 2002.15
Hurrell, J. W., Kushnir, Y., Ottersen, G., and Visbeck, M.: The North Atlantic Oscillation: ClimaticSignificance and Environmental Impact, American Geophysical Union, Cambridge UniversityPress, Cambridge, United Kingdom and New York, NY, USA, 1–35, 2003.
IPCC: Climatic change 2013: The physical Science Basis, Contribution of Working Group 1 tothe Fifth Assessment Report of the Intergovernmental Panel on Climate Change, 2013.20
Jacoby, G. C., Workman, K. W., and D’Arrigo, R. D.: Laki eruption of 1783, tree rings, anddisaster for northwest Alaska Inuit, Quaternary Sci. Rev., 18, 1365–1371, 1999.
Jones, G. S., Gregory, J. M., Stott, P. A., Tett, S. F., and Thorpe, R. B.: An AOGCM simulationof the climate response to a volcanic super-eruption, Clim. Dynam., 25, 725–738, 2005.
Kaufman, D. S., Schneider, D. P., McKay, N. P., Ammann, C. M., Bradley, R. S., Briffa, K. R.,25
Miller, G. H., Otto-Bliesner, B. L., Overpeck, J. T., and Vinther, B. M.: Recent warmingreverses long-term Arctic cooling, Science, 325, 1236–1239, 2009.
Keller, C. F.: 1000 Years of climate change, Adv. Space Res., 34, 315–322, 2004.Kobashi, T., Kawamura, K., Severinghaus, J. P., Barnola, J. M., Nakaegawa, T., Vinther, B. M.,
Johnsen, S. J., and Box, J. E.: High variability of Greenland surface temperature over the30
past 4000 years estimated from trapped air in an ice core, Geophys. Res. Lett., 38, L21501,doi:10.1029/2011GL049444, 2011.
541

CPD11, 521–553, 2015
Temperaturereconstruction for NE
Canada
M. Naulier et al.
Title Page
Abstract Introduction
Conclusions References
Tables Figures
J I
J I
Back Close
Full Screen / Esc
Printer-friendly Version
Interactive Discussion
Discussion
Paper
|D
iscussionP
aper|
Discussion
Paper
|D
iscussionP
aper|
Kobashi, T., Kawamura, K., Severinghaus, J. P., Barnola, J. M., Nakaegawa, T., Vinther, B. M.,Johnsen, S. J., and Box, J. E.: GISP2 Ice Core 4000 Year Ar-N Isotope TemperatureReconstruction. IGBP PAGES/World Data Center for Paleoclimatology Data ContributionSeries # 2012-034. NOAA/NCDC Paleoclimatology Program, Boulder CO, USA, 2012.
Landrum, L., Otto-Bliesner, B. L., Wahl, E. R., Conley, A., Lawrence, P. J., Rosenbloom, N., and5
Teng, H.: Last Millennium Climate and Its Variability in CCSM4, J. Climate, 26, 1085–1111,doi:10.1175/JCLI-D-11-00326.1, 2013.
Lean, J., Beer, J., and Bradley, R.: Reconstruction of solar irradiance since 1610: Implicationsfor climate change, Geophys. Res. Lett., 22, 3195–3198, 1995.
Ljungqvist, F. C., Krusic, P. J., Brattström, G., and Sundqvist, H. S.: Northern Hemisphere10
temperature patterns in the last 12 centuries, Clim. Past, 8, 227–249, doi:10.5194/cp-8-227-2012, 2012.
Loader, N. J., Robertson, I., Barker, A. C., Switsur, V. R., and Waterhouse, J. S.: An improvedtechnique for the batch processing of small wholewood samples to [alpha]-cellulose, Chem.Geol., 136, 313–317, doi:10.1016/s0009-2541(96)00133-7, 1997.15
Loader, N., Young, G. H., McCarroll, D., and Wilson, R. J.: Quantifying uncertainty in isotopedendroclimatology, The Holocene, 23, 1221–1226, doi:10.1177/0959683613486945, 2013a.
Loader, N. J., Young, G. H. F., Grudd, H., and McCarroll, D.: Stable carbon isotopesfrom Torneträsk, northern Sweden provide a millennial length reconstruction of summersunshine and its relationship to Arctic circulation, Quaternary Sci. Rev., 62, 97–113,20
doi:10.1016/j.quascirev.2012.11.014, 2013b.Luckman, B. and Wilson, R.: Summer temperatures in the Canadian Rockies during the last
millennium: a revised record, Clim. Dynam., 24, 131–144, 2005.Luckman, B. H. and Wilson, R. J. S.: Canadian Rockies Summer Temperature Reconstruction,
IGBP PAGES/World Data Center for Paleoclimatology, Data Contribution Series # 2006-011,25
NOAA/NCDC Paleoclimatology Program, Boulder CO, USA, 2006.Mann, M. E., Zhang, Z., Rutherford, S., Bradley, R. S., Hughes, M. K., Shindell, D., Ammann, C.,
Faluvegi, G., and Ni, F.: Global signatures and dynamical origins of the Little Ice Age andMedieval Climate Anomaly, Science, 326, 1256–1260, 2009.
McCarroll, D. and Loader, N. J.: Stable isotopes in tree rings, Quaternary Sci. Rev., 23, 771–30
801, doi:10.1016/j.quascirev.2003.06.017, 2004.Miller, G. H., Geirsdottir, A., Zhong, Y., Larsen, D. J., Otto-Bliesner, B. L., Holland, M. M.,
Bailey, D. A., Refsnider, K. A., Lehman, S. J., and Southon, J. R.: Abrupt onset of the Little
542

CPD11, 521–553, 2015
Temperaturereconstruction for NE
Canada
M. Naulier et al.
Title Page
Abstract Introduction
Conclusions References
Tables Figures
J I
J I
Back Close
Full Screen / Esc
Printer-friendly Version
Interactive Discussion
Discussion
Paper
|D
iscussionP
aper|
Discussion
Paper
|D
iscussionP
aper|
Ice Age triggered by volcanism and sustained by sea-ice/ocean feedbacks, Geophys. Res.Lett., 39, L02708, doi:10.1029/2011GL050168, 2012.
Moberg, A., Sonechkin, D. M., Holmgren, K., Datsenko, N. M., and Karlén, W.: Highly variableNorthern Hemisphere temperatures reconstructed from low-and high-resolution proxy data,Nature, 433, 613–617, 2005.5
Moore, J., Hughen, K., Miller, G., and Overpeck, J.: Little Ice Age recorded in summertemperature reconstruction from vared sediments of Donard Lake, Baffin Island, Canada,J. Paleolimnol., 25, 503–517, 2001.
Naulier, M., Savard, M. M., Bégin, C., Marion, J., Arseneault, D., and Bégin, Y.: Carbon andoxygen isotopes of lakeshore black spruce trees in north-eastern Canada as proxies for10
climatic reconstruction, Chem. Geol., 374, 37–43, 2014.Naulier, M.: Développement de séries isotopiques et reconstitution des conditions climatiques
estivales du dernier millénaire à partir de tiges subfossiles dans le nord de la forêt boréaleQuébécoise, Thèse présentée pour l’obtention du grade de Philosophiae doctor (Ph. D.) ensciences de la terre, 2014.15
PAGES 2k consortium: Continental-scale temperature variability during the past two millennia,Nat. Geosci., 6, 339–346, doi:10.1038/NGEO1797, 2013.
Payette, S., Filion, L., Delwaide, A., and Bégin, C.: Reconstruction of tree-line vegetationresponse to long-term climate change, Nature, 341, 429–432, 1989.
Plummer, C. T., Curran, M. A. J., van Ommen, T D., Rasmussen, S. O., Moy, A. D., Vance, T. R.,20
Clausen, H. B., Vinther, B. M., and Mayewski, P. A.: An independently dated 2000-yr volcanicrecord from Law Dome, East Antarctica, including a new perspective on the dating of the1450s CE eruption of Kuwae, Vanuatu, Clim. Past, 8, 1929–1940, doi:10.5194/cp-8-1929-2012, 2012.
Porter, T., Pisaric, M. J., Field, R., Kokelj, S., Edwards, T. D., deMontigny, P., Healy, R.,25
and LeGrande, A.: Spring-summer temperatures since AD 1780 reconstructed from stableoxygen isotope ratios in white spruce tree-rings from the Mackenzie Delta, northwesternCanada, Clim. Dynam., 3–4, 771–785, doi:10.1007/s00382-013-1674-3, 2013.
Robertson, I., Switsur, V. R., Carter, A. H. C., Barker, A. C., Waterhouse, J. S., Briffa, K. R.,Jones, P. D.: Signal strength and climate relationships in 13C/12C ratios of tree ring cellulose30
from oak in east England, J. Geophys. Res., 102, 19507–19516, 1997.
543

CPD11, 521–553, 2015
Temperaturereconstruction for NE
Canada
M. Naulier et al.
Title Page
Abstract Introduction
Conclusions References
Tables Figures
J I
J I
Back Close
Full Screen / Esc
Printer-friendly Version
Interactive Discussion
Discussion
Paper
|D
iscussionP
aper|
Discussion
Paper
|D
iscussionP
aper|
Rinne, K. T., Boettger, T., Loader, N. J., Robertson, I., Switsur, V. R., and Waterhouse, J. S.:On the purification of [alpha]-cellulose from resinous wood for stable isotope (H, C and O)analysis, Chem. Geol., 222, 75–82, doi:10.1016/j.chemgeo.2005.06.010, 2005.
Savard, M. M., Bégin, C., Marion, J., Arseneault, D., and Bégin, Y.: Evaluating the integrity ofC and O isotopes in sub-fossil wood from boreal lakes, Palaeogeogr. Palaeocl., 348–349,5
21–31, doi:10.1016/j.palaeo.2012.06.003, 2012.Shindell, D. T., Schmidt, G. A., Miller, R. L., and Mann, M. E.: Volcanic and solar forcing of
climate change during the preindustrial era, J. Climate, 16, 4094–4107, 2003.Sigl, M., McConnell, J. R., Layman, L., Maselli, O., McGwire, K., Pasteris, D., Dorthe, D. J.,
Steffensen, B. V., Edwards, R., Mulvaney, R., and Kipfstuhl, S. A.: New bipolar ice core10
record of volcanism from WAIS Divide and NEEM and implications for climate forcing of thelast 2000 years, J. Geophys. Res.-Atmos., 118, 1151–1169, 2013.
Thomas, E. K. and Briner, J. P.: Big Round Lake, Baffin Island Varve Thickness Data. IGBPPAGES/World Data Center for Paleoclimatology Data Contribution Series # 2008-115.NOAA/NCDC Paleoclimatology Program, Boulder CO, USA, 2008.15
Thomas, E. K. and Briner, J. P.: Climate of the past millennium inferred from varved proglaciallake sediments on northeast Baffin Island, Arctic Canada, J. Paleolimnol., 41, 209–224,2009.
Thomas, S. R., Owens, M. J., and Lockwood, M.: The 22-year hale cycle in cosmic ray flux–evidence for direct heliospheric modulation, Sol. Phys., 289, 407–421, 2014.20
Trouet, V., Esper, J., Graham, N. E., Baker, A., Scourse, J. D., and Frank, D. C.: Persistentpositive North Atlantic Oscillation mode dominated the medieval climate anomaly, Science,324, 78–80, 2009.
Trouet, V., Scourse, J., and Raible, C.: North Atlantic storminess and Atlantic MeridionalOverturning Circulation during the last millennium: reconciling contradictory proxy records25
of NAO variability, Global Planet. Change, 84, 48–55, 2012.Trouet, V., Diaz, H., Wahl, E., Viau, A., Graham, R., Graham, N., and Cook, E.: A 1500-year
reconstruction of annual mean temperature for temperate North America on decadal-to-multidecadal time scales, Environ. Res. Lett., 8 024008, doi:10.1088/1748-9326/8/2/024008,2013.30
Viau, A. and Gajewski, K.: Reconstructing millennial-scale, regional paleoclimates of borealCanada during the Holocene, J. Climate, 22, 316–330, 2009.
544

CPD11, 521–553, 2015
Temperaturereconstruction for NE
Canada
M. Naulier et al.
Title Page
Abstract Introduction
Conclusions References
Tables Figures
J I
J I
Back Close
Full Screen / Esc
Printer-friendly Version
Interactive Discussion
Discussion
Paper
|D
iscussionP
aper|
Discussion
Paper
|D
iscussionP
aper|
Viau, A., Ladd, M., and Gajewski, K.: The climate of North America during the past 2000 yearsreconstructed from pollen data, Global Planet. Change, 84, 75–83, 2012.
Vinther, B. M., Buchardt, S. L., Clausen, H. B., Dahl-Jensen, D., Johnsen, S. J., Fisher, D. A.,Koerner, R. M., Raynaud, D., Lipenkov, V., Andersen, K. K., Blunier, T., Rasmussen, S. O.,Steffensen, J. P., and Svensson, A. M.: Holocene shinning of the greenland ice sheet, Nature,5
461, 385–388, 2009.Vinther, B. M., Jones, P. D., Briffa, K. R., Clausen, H. B., Andersen, K. K., Dahl-Jensen, D.,
and Johnsen, S. J.: Climatic signals in multiple highly resolved stable isotope records fromGreenland, Quaternary Sci. Rev., 29, 522–538, 2010.
Vinther, B. M., Buchardt, S. L., Clausen, H. B., Dahl-Jensen, D., Johnsen, S. J., Fisher, D. A.,10
Koerner, R. M., Raynaud, D., Lipenkov, V., Andersen, K. K., Blunier, T., Rasmussen, S. O.,Steffensen, J. P., and Svensson, A. M.: Greenland Ice Sheet Holocene d18O, Temperature,and Surface Elevation, IGBP PAGES/World Data Center for Paleoclimatology DataContribution Series # 2011-053, NOAA/NCDC Paleoclimatology Program, Boulder CO, USA,2011.15
Wood, G. D. A.: Tambora: The Eruption That Changed the World, Princeton University Press,Princeton, 2014.
Young, G. H. F., McCarroll, D., Loader, N. J., and Kirchhefer, A. J.: A 500-year record of summernear-ground solar radiation from tree-ring stable carbon isotopes, Holocene, 20, 315–324,2010.20
545

CPD11, 521–553, 2015
Temperaturereconstruction for NE
Canada
M. Naulier et al.
Title Page
Abstract Introduction
Conclusions References
Tables Figures
J I
J I
Back Close
Full Screen / Esc
Printer-friendly Version
Interactive Discussion
Discussion
Paper
|D
iscussionP
aper|
Discussion
Paper
|D
iscussionP
aper|
Table 1. Summary of the verification statistics for calibrations using the linear scaling and simplelinear regression methods for different periods, and using the measured maximal temperatureseries.
Calibration Calibration Calibration(1930–1970) (1971–2000) (1930–2000)
Linear scaling/simple linear regression
Average ◦C±SD 15.9±0.3 16.4±0.4 16.1±0.4R2 calibration 0.27/0.43 0.85/0.85R2 verification 0.85/0.85 0.27/0.43R2 total period 0.62/0.64RMSE verification, ◦C 0.14/0.33 0.34/0.33RMSE calibration, ◦C 0.33/0.16 0.15/0.14RMSE total period, ◦C 0.27/0.25RE 0.94/0.19 0.64/0.07 0.57/0.64CE 0.84/0.05 −0.02/0.21 0.57/0.64
SD is the standard deviation, r2 is the coefficient of determination (R squared), RMSEthe raw mean squared error, RE the reduction of error and CE the coefficient of error.
546

CPD11, 521–553, 2015
Temperaturereconstruction for NE
Canada
M. Naulier et al.
Title Page
Abstract Introduction
Conclusions References
Tables Figures
J I
J I
Back Close
Full Screen / Esc
Printer-friendly Version
Interactive Discussion
Discussion
Paper
|D
iscussionP
aper|
Discussion
Paper
|D
iscussionP
aper|
Figure 1. (a) Site location (black circle) and meteorological stations (black stars). (b)Representation of lake L20, also illustrating the sampling location of subfossil stems (brownmarks) and living trees (yellow marks).
547

CPD11, 521–553, 2015
Temperaturereconstruction for NE
Canada
M. Naulier et al.
Title Page
Abstract Introduction
Conclusions References
Tables Figures
J I
J I
Back Close
Full Screen / Esc
Printer-friendly Version
Interactive Discussion
Discussion
Paper
|D
iscussionP
aper|
Discussion
Paper
|D
iscussionP
aper|
Figure 2. Illustration of the sampling strategy. From year 1000 to 2006, cohorts are representedin red for subfossil stem segments (C0–C11), and in green for living trees (CV). The join pointsare in black on the overlapping periods (JP0–JP12).
548

CPD11, 521–553, 2015
Temperaturereconstruction for NE
Canada
M. Naulier et al.
Title Page
Abstract Introduction
Conclusions References
Tables Figures
J I
J I
Back Close
Full Screen / Esc
Printer-friendly Version
Interactive Discussion
Discussion
Paper
|D
iscussionP
aper|
Discussion
Paper
|D
iscussionP
aper|
Figure 3. (a) Millennial raw δ18O series (1000–2010) with subfossil segment cohorts (cohortsC0–C11; illustrated with different colors), living tree cohort (CV; dark pink curve), and join points(blue dash), the adjustment means (black dash) and the number of tree segments used per year(straight black line). The grey envelop represents the analytical error (0.2 ‰). The legend showsthe correspondence between the colours curves and cohorts. (b) Millennial δ18O series (blackline) with SD (grey lines) chronology. (c) Comparison between δ18O values of living trees andsubfossil stem segments over the common time interval (1860–1956).
549

CPD11, 521–553, 2015
Temperaturereconstruction for NE
Canada
M. Naulier et al.
Title Page
Abstract Introduction
Conclusions References
Tables Figures
J I
J I
Back Close
Full Screen / Esc
Printer-friendly Version
Interactive Discussion
Discussion
Paper
|D
iscussionP
aper|
Discussion
Paper
|D
iscussionP
aper|
Figure 4. (a) Comparison between reconstructed (i-STREC, black line) and observed (blueline) JJA maximal temperature and mean square values on the entire period of calibration.(b) i-STREC (black line) with 21 year moving average (red line) and observed JJA maximaltemperature series from CRU TS3.1 (blue line). In both cases, the dark grey shading representsuncertainty with ±1 RMSE calculated on the 21 year filter values.
550
CPD11, 521–553, 2015
Temperaturereconstruction for NE
Canada
M. Naulier et al.
Title Page
Abstract Introduction
Conclusions References
Tables Figures
J I
J I
Back Close
Full Screen / Esc
Printer-friendly Version
Interactive Discussion
Discussion
Paper
|D
iscussionP
aper|
Discussion
Paper
|D
iscussionP
aper|
551

CPD11, 521–553, 2015
Temperaturereconstruction for NE
Canada
M. Naulier et al.
Title Page
Abstract Introduction
Conclusions References
Tables Figures
J I
J I
Back Close
Full Screen / Esc
Printer-friendly Version
Interactive Discussion
Discussion
Paper
|D
iscussionP
aper|
Discussion
Paper
|D
iscussionP
aper|
Figure 5. Comparison between i-STREC and other temperature reconstructions (data obtainedfrom NOAA). (a) i-STREC from in north-eastern Canada. (b) STREC from tree-ring width, inthe same region. (c) July–September temperature from varved sediments, Baffin Island, ArcticCanada. (d) annual surface temperature from GISP 2 ice core, in Greenland. (e) May–Augustmaximum temperature from maximum latewood density and tree-ring width, Canadian Rockies.(f) July temperature from tree-ring width, northern Finland. Shading based on i-STREC isshown to ease comparison with the other reconstructions compiled: warmer (pink), colder(green) and modern periods (yellow). All reconstructions have been smoothed with a 21 yearsfilter and normalized (1960–1991).
552

CPD11, 521–553, 2015
Temperaturereconstruction for NE
Canada
M. Naulier et al.
Title Page
Abstract Introduction
Conclusions References
Tables Figures
J I
J I
Back Close
Full Screen / Esc
Printer-friendly Version
Interactive Discussion
Discussion
Paper
|D
iscussionP
aper|
Discussion
Paper
|D
iscussionP
aper|
Figure 6. Volcanic and solar forcings. (a) I-STREC (reconstructed summer temperature,21 years smoothed; red line), compared with the well-known solar minima (grey bands) andthe solar forcing series (black line; Bard et al., 2003). (b) I-STREC reconstructed summertemperature (red line) compared with the volcanic aerosols sulfates (Sigl et al., 2013). Themajor eruptions are marked: (1) 1257/1258 = Samalas, (2) 1456 = Kuwae, (3) 1783 = Laki, (4)1809 = unknown and 1815 = Tambora and (5) 1835 = Cosigüina).
553