Embed Size (px)
Citation preview

LETTERdoi:10.1038/nature13397
Millennial-scale variability in Antarctic ice-sheetdischarge during the last deglaciationM. E. Weber1, P. U. Clark2, G. Kuhn3, A. Timmermann4, D. Sprenk1, R. Gladstone5, X. Zhang3, G. Lohmann3, L. Menviel6,7,M. O. Chikamoto4, T. Friedrich4 & C. Ohlwein8
Our understanding of the deglacial evolution of the Antarctic IceSheet (AIS) following the Last Glacial Maximum (26,000–19,000 yearsago)1 is based largely on a few well-dated but temporally and geo-graphically restricted terrestrial and shallow-marine sequences2–4.This sparseness limits our understanding of the dominant feedbacksbetween the AIS, Southern Hemisphere climate and global sea level.Marine records of iceberg-rafted debris (IBRD) provide a nearly con-tinuous signal of ice-sheet dynamics and variability. IBRD records fromthe North Atlantic Ocean have been widely used to reconstruct vari-ability in Northern Hemisphere ice sheets5, but comparable recordsfrom the Southern Ocean of the AIS are lacking because of the lowresolution and large dating uncertainties in existing sediment cores.Here we present two well-dated, high-resolution IBRD records thatcapture a spatially integrated signal of AIS variability during the lastdeglaciation. We document eight events of increased iceberg flux fromvarious parts of the AIS between 20,000 and 9,000 years ago, in markedcontrast to previous scenarios which identified the main AIS retreatas occurring after meltwater pulse 1A3,6–8 and continuing into thelate Holocene epoch. The highest IBRD flux occurred 14,600 years
ago, providing the first direct evidence for an Antarctic contributionto meltwater pulse 1A. Climate model simulations with AIS fresh-water forcing identify a positive feedback between poleward trans-port of Circumpolar Deep Water, subsurface warming and AIS melt,suggesting that small perturbations to the ice sheet can be substantiallyenhanced, providing a possible mechanism for rapid sea-level rise.
Today, the estimated total iceberg calving flux from Antarctica is about1,300–2,000 gigatons per year (Gt yr21)9, with giant (longer than 18 km)icebergs representing at least half of the total AIS mass loss10. Iceberg tra-jectory studies for the sea-ice-covered part of the Southern Ocean showthat only a small fraction of icebergs calving from the AIS escapes coastalregions directly to the north, owing to topographic steering of oceancurrents9. Otherwise, a substantial fraction of large icebergs9 remainentrained in the westward-flowing Antarctic Coastal Current, travel-ling counter-clockwise around Antarctica before entering the WeddellSea11 (Fig. 1). Here, they follow the cyclonic wind-driven Weddell Gyre,where they merge with icebergs calving from the Filchner–Rønne IceShelf in the southern Weddell Sea. These icebergs then travel norththrough the so-called ‘Iceberg Alley’ and exit the Weddell Sea basin to
1Institute of Geology and Mineralogy, University of Cologne, Zuelpicher Strasse 49a, 50935 Cologne, Germany. 2College of Earth, Ocean, and Atmospheric Sciences, Oregon State University, Corvallis,Oregon 97331, USA. 3Alfred-Wegener-Institut Helmholtz-Zentrum fur Polar- und Meeresforschung, Am Alten Hafen 26, 27568 Bremerhaven, Germany. 4International Pacific Research Center, School ofOcean and Earth Sciences and Technology, University of Hawaii at Manoa, 2525 Correa Road, Honolulu, Hawaii 96822, USA. 5Arctic Centre, University of Lapland, PO Box 122, 96101 Rovaniemi, Finland.6Climate Change Research Centre, Level 4, Mathews Building, University of New South Wales, Sydney, New South Wales 2052, Australia. 7ARC Centre of Excellence for Climate System Science, University ofNew South Wales, Sydney, New South Wales 2052, Australia. 8Hans-Ertel Centre for Weather Research/Climate Monitoring Branch, Meteorological Institute, University of Bonn, Auf dem Hugel 20, 53121Bonn, Germany.
–55°
–50°
−45°
–60°
–65°
–70°
–75°
–75° –60° –45° –30° –15° 0°
Patagonia at LGM
SHW
Glacial
LGM limit
Polar Front
SB o
f ACC
N
ACC
EDML
MD07-3134
MD07-3133
Scotia Sea
Patagonia
Southwest
Atlantic
Southeast
Pacific
West Antarctica East Antarctica
Pirie
Bank
Dove
Basin
Summersea ice
Wintersea ice
PS cores
Iceberg
Alley
Weddell Sea
Filchner–Rønne
Ice Shelf
Antarctic
Peninsula
60° S
75° S
90° E
90° W
180°
E
0°E
Ross
Ice Shelf
Filchner–Rønne
Ice Shelf
Amery
Ice Shelf
Antarctic Coastal
Current
ACC
A
ntarctic Coastal Curre
nt
Figure 1 | Location map. Sites MD07-3133 andMD07-3134 are located in the central Scotia Sea.Open arrows refer to Iceberg Alley. The large greyarrow indicates the Southern Hemisphere westerlywinds (SHW). The southern boundary of theAntarctic Circumpolar Current (SB of ACC) isindicated by a grey dashed line. White dashed linesdescribe winter and summer sea-ice extent.Research vessel Polarstern (PS) cores refer to ice-sheet retreat studies conducted in the southeasternWeddell Sea4. The inset map (upper right) showsthe circum-Antarctic drift of icebergs (turquoise;$5 km in length) calving off the Antarctic iceshelves from 1999 to 2009 (ref. 11). Black arrowsindicate the general counterclockwise flow withinthe Antarctic Coastal Current.
0 0 M O N T H 2 0 1 4 | V O L 0 0 0 | N A T U R E | 1
Macmillan Publishers Limited. All rights reserved©2014

the northeast into the Scotia Sea (Fig. 1). Around 55u S–60 uS, icebergsstart to move in a more eastward direction as they are swept into thewarmer Antarctic Circumpolar Current. Melt rates remain low untilthe warmer Antarctic Circumpolar Current is reached, after which theicebergs ablate rapidly in the general area of our core sites.
We present two high-resolution records of IBRD from deep-sea coresites MD07-3133 and MD07-3134, collected from the south-centralScotia Sea (Fig. 1) (Methods). Dating relies mainly on the correlation ofdust records from our cores to the Antarctic European Project for IceCoring in Antarctica (EPICA) Dronning Maud Land (EDML) dustrecord12 (Methods). Ages reported here refer to the EDML1 or EPICADome C (EDC) 3 age scale (Methods). The cores are located in the centreof Iceberg Alley, the primary route taken by large icebergs from the AISthat remained entrained in the Antarctic Coastal Current today as wellas during the last deglaciation (Methods). Owing to the loss of someicebergs northwards from the Antarctic Coastal Current, and the grad-ual ablation of icebergs within the Antarctic Coastal Current, relativelyfewer icebergs may reach our sites from more distant sources (Methods).Although the primary IBRD content of icebergs may vary substantiallyand most of the coarser basal material is released close to the source(that is, the coarse-grained IBRD signal may have a regional bias towardsthe Weddell Sea and the Antarctic Peninsula), the majority of the fine-grained englacial material determined here should capture a spatiallymore integrated signal that is representative of variability in the flux oficebergs released by the AIS (except for the Amundsen Sector), parti-cularly in a colder climate than today’s.
The IBRD record from site MD07-3134 exhibits a number of peaksstarting at about 20,000 years (20 kyr) ago and continuing through thedeglaciation until about 9 kyr ago, when modern IBRD levels were reached
(Fig. 2c). Most of the pronounced IBRD events are replicated at site MD07-3133 (Fig. 2d), which is about 300 km to the northwest (Fig. 1), thusproviding a robust signal of episodic enhanced iceberg flux throughIceberg Alley. Stacking the IBRD records (Fig. 2e) and their fluxes (Fig. 2f)(Methods) identifies eight primary episodes of enhanced iceberg fluxoriginating from different parts of the AIS that began within one to sev-eral decades and lasted from centuries to a millennium. These recordsthus provide the first evidence for substantial centennial to millennialvariability in mass loss from the AIS throughout much of the last degla-ciation. We refer to these events as Antarctic Ice Sheet discharges (AID8to AID1, from oldest to youngest); for error estimates on the timing andduration of AIDs see Methods.
AID8 occurred 20–19 kyr ago (Fig. 2), which corresponds to the startof the deglaciation of the Antarctic Peninsula Ice Sheet2 and the EastAIS in the southeastern Weddell Sea4. Although the IBRD event in thestacked record has a concentration of debris similar to that of several ofthe younger events, its flux (Fig. 2f) is the smallest, which is consistentwith an early onset of deglaciation for just the Antarctic Peninsula andWeddell Sea sectors in response to increasing Southern Hemisphereobliquity and sea-level forcing originating from the onset of deglacia-tion of Northern Hemisphere ice sheets4.
Subsequent AID events generally have similar or larger concentra-tion in the IBRD stack than does AID8 (Fig. 2e), whereas the IBRD fluxesof AID7 to AID1 exceed those of AID8 (Fig. 2f). AID7 started 17 kyr ago,with IBRD increasing until around 15.7 kyr ago, when the event abruptlyended. The distinct IBRD peak near the end of AID7 about 16 kyr ago hasbeen documented as a second retreat phase of the Weddell Sea sector ofthe East AIS4. Moreover, most of the marine-based sectors of the Ant-arctic Peninsula Ice Sheet had retreated by about 16.7 kyr ago2, along
B-A
AID4
AID5
AID6
AID7AID8 AID3
AID2
AID1
AIM1AIM2
YDMWP-1AMWP-19KA H1
ACR
MWP-1B
Age (kyr)
25 212324 22 20 19 18 17 16 15 14 13 12 11 10 9 8 7
25 212324 22 20 19 18 17 16 15 14 13 12 11 10 9 8 7
No
n-s
ea-s
alt C
a2
+
(μg
m−
2 y
r–1)
100
0
200
EDML Mag
netic
suscep
tibility
(10
–5 S
I)
0
20
40
60
MD07-3134
MD07-3133
f
b
d
e
c
a
NH
SH
GA
P
Sco
tia S
ea IB
RD
sta
ck
(gra
ins c
m–3)
0
0.5
1.5
2.0
0.8
1.6
0
Site
MD07-3133
IBR
D
(>1
mm
cm
−3)
RGB
Sco
tia S
ea IB
RD
flux
(gra
ins c
m−
2 y
r−
1)
0
0.04
0.12
0.16
0
0.4
0.8
1.2Site
MD07-3134
RGB
Age control points
IBR
D
(>1 m
m c
m−
3)
0.08
1.0
Figure 2 | Climate development from the LastGlacial Maximum to the Holocene (25–7 kyrago). Eight phases of enhanced iceberg fluxthrough Iceberg Alley were detected and namedAID1 to AID8. a, Magnetic susceptibility (in SIunits) record of sites MD07-3133 and MD07-3134(ref. 12). b, EDML ice-core non-sea-salt Ca flux onthe EDML1/EDC3 timescale27. c, IBRD with red,green, blue (RGB) colour log for site MD07-3134and site MD07-3133 (d). e, Stacked IBRD record.f, Stacked IBRD flux record (Methods). AID8–AID1 occurred at approximately 20–19 kyr ago,17–16 kyr ago, 15–14 kyr ago, 13.5 kyr ago, 13 kyrago, 12 kyr ago, 11 kyr ago and 10–9 kyr ago. Thetop panel identifies Northern Hemisphere (NH)climate signals MWP-19KA, Heinrich event 1(H1), MWP-1A, Bølling–Allerød (B–A), YoungerDryas (YD), and MWP-1B, as well as SouthernHemisphere (SH) Antarctic Isotopic Maxima(AIM) 2 and 1, and the Antarctic ColdReversal (ACR).
RESEARCH LETTER
2 | N A T U R E | V O L 0 0 0 | 0 0 M O N T H 2 0 1 4
Macmillan Publishers Limited. All rights reserved©2014

with sectors of the West AIS (for example, the Pine Island glacier of theAmundsen Sea embayment) at 16.4 kyr ago (Methods) that are generallycoincident with the major increase in the Scotia Sea IBRD flux ratesstarting at 16.4 kyr ago (Fig. 2f).
The start of AID7 follows the onset of Antarctic-wide deglacial warming13
(Fig. 3f) and the retreat of sea ice13 (Fig. 3e). As indicated by a decreasein the stable carbon isotope ratio of atmospheric carbon d13Catm (ref. 14;Fig. 3c), enhanced Southern Ocean opal flux (Fig. 3d), and decliningdust/magnetic susceptibility contents (Fig. 2a,b), the onset of AID7is accompanied by enhanced Southern Ocean ventilation and changesin atmospheric circulation that may have caused an encroachment ofwarmer water to the AIS marine margins, leading to destabilizationand a period of enhanced iceberg release.
There is a distinct pause in ice rafting between AID7 and AID6 (Figs 2, 3)accompanied by a slowdown in atmospheric warming in the Atlanticsector. The subsequent AID6 exhibits the largest IBRD flux (Fig. 3a and b).AID6 has a relatively abrupt onset at about 15 kyr ago and reaches itspeak values approximately 14.8–14.4 kyr ago, followed by a more gradualdecline until 13.9 kyr ago, when it abruptly ends. There is general agree-ment among the few existing well-dated records from Antarctica for wide-spread retreat of the AIS at this time, including from Mac RobertsonLand of the East AIS, the Ross Sea sector of the West AIS, and the Ant-arctic Peninsula Ice Sheet2,3 (Methods).
The interval of peak IBRD flux during AID6 (14.8–14.4 kyr ago 6
0.25 kyr, where the error is 1s) is synchronous with the onset of theBølling interstadial in the Northern Hemisphere (14.64 6 0.09 kyr ago)(Fig. 3g) and with the period of rapid sea-level rise referred to as melt-water pulse (MWP) 1A (occurring 14.65–14.3 kyr ago 6 0.03 kyr ago)15.Fingerprinting studies using the new Tahiti sea-level record and other far-field records15 support previous such studies16 in identifying a substantial(at least 50%) Antarctic contribution to the global mean sea-level rise of
about 14 m during MWP-1A. The fact that the peak flux of AID6 in ourwell-dated IBRD record is the same age and duration (around 400years) as MWP-1A (as defined from the Tahiti record) provides directevidence for an Antarctic contribution.
Several factors may have preconditioned or triggered the initial AISgrounding-line (boundary between the floating ice shelf and the groundedice that rests on bedrock) retreat during AID6, including sea-level risefrom melting of Northern Hemisphere ice sheets17, subsurface warm-ing associated with changes of the Atlantic Meridional OverturningCirculation4, and increases of atmospheric greenhouse gas concentra-tions. To further explain the climate response to the meltwater dischargeassociated with AID6, we conducted a series of transient numerical mod-elling experiments with three different Earth system models (Methods).Assuming that AID6 freshwater forcing corresponded to a maximumsea-level rise of 20 mm yr21 (50% of the maximum MWP-1A rate15),our model results show considerable Southern Ocean surface cooling,expansion of sea ice, formation of a halocline, reduction of AntarcticBottom Water formation and subsurface warming at depths of 100–1,500 m through poleward migration of Circumpolar Deep Water (Fig. 4).Consistent with previous modelling experiments18,19, we suggest thatthis ocean thermal forcing accelerated thinning of ice shelves by basalmelting, inducing a positive feedback by causing grounding-line retreat,calving and subsequent release of more fresh water.
The next five IBRD events (AID5–AID2), which are of comparableconcentration and duration, show a pacing with a repeat time of about800–900 years. AID2 has the largest IBRD flux of these five events, attain-ing its peak flux at about 11.3 kyr ago, which corresponds to the age ofMWP-1B recorded in the Barbados sea-level record20. The absence ofan equivalent sea-level event in the Tahiti coral record21 might reflectdifferent far-field sea-level responses to a deglaciation event from thePacific sector of the AIS21. Although our IBRD record does not distinguish
Age (kyr)
ACR
NH
SH
B-A YD
MWP-1AMWP-19KA
H1
MWP-1B
725 91113151719212324 22 20 18 16 14 12 10 8
725 91113151719212324 22 20 18 16 14 12 10 8
NGRIP
AIM1AIM2
δ1
8O
(‰)
δ1
8O
(‰)
-42
-38
-34
f
g
e
d
c
b
a
MD07-3134
TN057-14
Southeast
Atlantic
Op
al fl
ux
(g c
m−
2 k
yr
–1)
0
10
20
15
5
MD07-3133
–6.4
–6.5
–6.7
–6.6
–6.3
–6.8
EDC/
Talos Dome
Ice Core
-50
-48
-46
-44
EDML
90
140
190
240
EDML
IBR
D fl
ux 5
00-y
r avera
ge
(rela
tive to
Ho
locene)
3
1
2
4
5
6
0
0.08
0.12
0.16
AID6
AID7
AID8
AID1
AID5
AID2
AID4
AID3
0
1
1.5
0.5
δ13C
atm
(‰)
Sea-s
alt N
a+
flux
(μg
m–2 y
r–1)
Sco
tia S
ea
IBR
D fl
ux
(gra
ins c
m−
2 y
r–1)
Figure 3 | IBRD flux in the Scotia Sea comparedto climate changes during the last deglaciation.a, Stacked IBRD flux record. b, 500-yr averages ofstacked IBRD flux relative to Holocene average(Methods). c, Antarctic deglacial d13Catm stackwith 1s error (shaded)14. d, Biogenic opal fluxrecords from the southeast Atlantic site TN057-14(dashed)28 and the Scotia Sea sites MD07-3133(black) and MD07-3134 (grey)29. e, EDML ice-corerecord of sea-salt Na1 flux13. f, d18O record fromEDML ice core13. g, d18O record from NGRIP icecore30. Note that MWP-1A is coeval with AID6,within the dating uncertainties. Note further thatmajor changes in the Southern Hemispherecommenced around 17 kyr ago when the NorthernHemisphere was cold during Heinrich event 1.
LETTER RESEARCH
0 0 M O N T H 2 0 1 4 | V O L 0 0 0 | N A T U R E | 3
Macmillan Publishers Limited. All rights reserved©2014

the source of mass loss from the AIS, the presence of AID2 is consistentwith an Antarctic contribution to MWP-1B as well21.
The youngest IBRD event (AID1) started about 10 kyr ago, with thepeak flux occurring around 9.5 kyr ago; it ended about 9 kyr ago. Theonly other available records that span this time are from the Ross Seasector of the Western AIS, but they suggest that retreat of the ground-ing line in the Ross Sea occurred either before or after AID1. The specificsector of the AIS that contributed to this event thus remains unknown(Methods).
Our IBRD record shows clear evidence for episodic mass loss of theAIS during the last deglaciation, but further work is required to identifythe sources of mass loss associated with each AID (Methods). Millennial-scale AIDs, similar to those observed in the Northern Hemisphere5, areindicative of abrupt ice-sheet instabilities22 that initiated within one toa few decades, released fresh water into the Southern Ocean, and con-tributed to the overall deglacial sea-level rise. The peak of AID6 is syn-chronous, within the dating uncertainties, with MWP-1A. Modellingresults indicate that ocean thermal forcing from the transport of warmCircumpolar Deep Water to the base of ice shelves may have been animportant positive feedback in AIS deglacial dynamics. Highlighting therole of ocean thermal forcing and rapid ice-sheet responses, our studyprovides an important palaeoclimate context for contemporaneous23,24
and future25,26 interactions between the ice sheet and the ocean aroundAntarctica.
METHODS SUMMARYChronology. Age models for cores MD07-3133 and MD07-3134 (ref. 12) wereestablished by correlating their magnetic susceptibility signal, as well as the Ca andFe records of MD07-3134, both of which largely reflect dust deposition in the circum-Antarctic region, to the dust (non-sea-salt Ca) flux record of the EDML ice core27. Weassume that sediment-core magnetic susceptibility, Fe, Ca and ice-core non-sea-salt Ca are in phase because all signals are atmospheric, and therefore essentiallyreached marine and ice-sheet deposition sites synchronously. Sites MD07-3133and MD07-3134 have average sedimentation rates of 92 cm kyr21 and 63 cm kyr21
over the last 36 kyr and 93 kyr, respectively, yielding a deglacial sample resolutionfor IBRD of 5–15 yr (Methods).Sample analysis. IBRD was counted every centimetre on X-radiographs takenfrom 1-cm-thick slices that were cut out from the centre of each core segment andexposed to an X-ray system (Methods). Biogenic opal was determined using acombination of a traditional leaching method and newly introduced Fourier trans-form infrared spectroscopy.Earth system modelling experiments. Coordinated Southern Ocean freshwaterperturbation experiments were conducted with the Bern3D and LOVECLIM Earthsystem models of intermediate complexity and the coupled general circulation modelCOSMOS (Methods). The IBRD flux stack (Fig. 3a) is used as a Southern Oceanfreshwater forcing time series for these models, assuming that 50% of the MWP-1Aforcing originated from Antarctica, and attaining peak values of about 0.22 Sv at14.67 kyr ago, coincident with the onset of the Bølling interstadial (14.64 kyr ago)and MWP-1A (14.65 kyr ago).
Online Content Any additional Methods, Extended Data display items and SourceData are available in the online version of the paper; references unique to thesesections appear only in the online paper.
Received 5 July 2013; accepted 16 April 2014.
Published online 28 May 2014.
1. Clark, P. U. et al. The Last Glacial Maximum. Science 325, 710–714 (2009).2. Heroy, D. C. & Anderson, J. B. Radiocarbon constraints on Antarctic Peninsula ice
sheet retreat following the Last Glacial Maximum. Quat. Sci. Rev. 26, 3286–3297(2007).
3. Mackintosh, A. et al. Retreat of the East Antarctic ice sheet during the last glacialtermination. Nature Geosci. 4, 195–202 (2011).
4. Weber, M. E. et al. Interhemispheric ice-sheet synchronicity during the Last GlacialMaximum. Science 334, 1265–1269 (2011).
5. Bond, G. C. & Lotti, R. Iceberg discharges into the North Atlantic on millennialtimescales during the last glaciation. Science 267, 1005–1010 (1995).
6. Peltier, W. R. Global glacial isostasy and the surface of the ice-age Earth: theICE-5G (VM2) model and GRACE. Annu. Rev. Earth Planet. Sci. 32, 111–149(2004).
7. Bentley, M. J. et al. Deglacial history of the West Antarctic Ice Sheet in the WeddellSea embayment: constraints on past ice volume change. Geology 38, 411–414(2010).
8. Conway, H., Hall, B. L., Denton, G. H., Gades, A. M. & Waddington, E. D. Past andfuture grounding-line retreat of the West Antarctic ice sheet. Science 286,280–283 (1999).
9. Gladstone, R. M., Bigg, G. R. & Nicholls, K. W. Iceberg trajectory modeling andmeltwater injection in the Southern Ocean. J. Geophys. Res. 106, 19903–19915(2001).
10. Silva, T. A. M., Bigg, G. R. & Nicholls, K. W. Contribution of giant icebergs to theSouthern Ocean freshwater flux. J. Geophys. Res. 111, C03004 (2006).
11. Stuart, K. M. & Long, D. G. Tracking large tabular icebergs using theSeaWinds Ku-band microwave scatterometer. Deep Sea Res. II 58, 1285–1300(2011).
12. Weber, M. E. et al. Dust transport from Patagonia to Antarctica—a newstratigraphic approach from the Scotia Sea and its implications for the last glacialcycle. Quat. Sci. Rev. 36, 177–188 (2012).
13. EPICA Community Members. One-to-one coupling of glacial climate variability inGreenland and Antarctica. Nature 444, 195–198 (2006).
14. Schmitt, J. et al. Carbon isotope constraints on the deglacial CO2 rise from icecores. Science 336, 711–714 (2012).
15. Deschamps, P. et al. Ice-sheet collapse and sea-level rise at the Bølling warming14,600 years ago. Nature 483, 559–564 (2012).
16. Clark,P.U.,Mitrovica, J. X.,Milne,G.A.&Tamisiea,M.E. Sea-level fingerprintingasadirect test for the source of global meltwater pulse IA. Science 295, 2438–2441(2002).
17. Golledge,N.R., Fogwill, C. J.,Mackintosh, A.N.&Buckley, K.M.Dynamicsof theLastGlacial Maximum Antarctic ice-sheet and its response to ocean forcing. Proc. NatlAcad. Sci. USA 109, 16052–16056 (2012).
18. Menviel, L., Timmermann, A., Timm, O. E. & Mouchet, A. Climate andbiogeochemical response to a rapid melting of the West Antarctic ice sheet duringinterglacials and implications for future climate. Paleoceanography 25, PA4231(2010).
19. Bintanja, R., van Oldenborgh, G. J., Drijfhout, S. S., Wouters, B. & Katsman, C. A.Important role for ocean warming and increased ice-shelf melt in Antarctic sea-iceexpansion. Nature Geosci. 6, 376–379 (2013).
20. Peltier,W.R.&Fairbanks,R.G.Global glacial ice volume and LastGlacialMaximumduration from an extended Barbados sea level record. Quat. Sci. Rev. 25,3322–3337 (2006).
0 km
1
2
3
4
30° E 90° E 150° E 150° W 90° W 30° W
−0.5−1.0 −1.5 (°C)
−0.5
−0.
2 −0.
05 0
.05
0.2
0.
5 (°C
)
80° S
NADW
CDW
60° S
40° S
1414.214.414.614.815 1414.214.414.614.815 1414.214.414.614.8150.05
0.1
0.15
0.2
0.25
Time (kyr)
Fre
sh
wate
r flu
x (S
v)
−1
0
1
2
3
4
5
Time (kyr)
Sea-i
ce a
no
maly
(1
06 k
m2)
0
0.1
0.2
0.3
0.4
0.5
0.6
Time (kyr)
Su
bsu
rface t
em
pera
ture
an
om
aly
(°C
)
a b cAID6
Control sea ice (20 cm)
MWP-1A sea ice (20 cm)
Figure 4 | Three-dimensional pattern oftemperature anomalies at 14.8–14 kyr ago(AID6). The map shows mean surface airtemperature anomaly; the vertical profile indicateszonally averaged ocean temperature anomaly inresponse to an Antarctic meltwater pulse of about0.22 Sv at around 14.6 kyr ago. The multi-modelmean is calculated by averaging the respectiveanomalies obtained from the Bern3D, LOVECLIMand COSMOS models (Methods). White-and-purple dashed and purple solid lines show theannual mean extent of 20-cm-thick sea ice for14.8 kyr ago and 14.6 kyr ago, respectively,simulated by the LOVECLIM model. Note thatfreshwater forcing (a) causes surface cooling, anincrease in zonally averaged sea-ice extent (b) andaveraged subsurface warming between 800 mand 1,200 m and 63 uS and 70 uS (c). NADW,North Atlantic Deep Water; CDW, CircumpolarDeep Water.
RESEARCH LETTER
4 | N A T U R E | V O L 0 0 0 | 0 0 M O N T H 2 0 1 4
Macmillan Publishers Limited. All rights reserved©2014

21. Bard, E., Hamelin, B. & Delanghe-Sabatier, D. Deglacial meltwater pulse 1B andYounger Dryas sea levels revisited with boreholes at Tahiti. Science 327,1235–1237 (2010).
22. Marshall, S. J. & Koutnik, M. R. Ice sheet action versus reaction: distinguishingbetween Heinrich events and Dansgaard-Oeschger cycles in the North Atlantic.Paleoceanography 21, PA2021 (2006).
23. Pritchard, H. D. et al. Antarctic ice-sheet loss driven by basal melting of ice shelves.Nature 484, 502–505 (2012).
24. Jenkins, A. et al. Observations beneath Pine Island Glacier in West Antarctica andimplications for its retreat. Nature Geosci. 3, 468–472 (2010).
25. Hellmer, H. H., Kauker, F., Timmermann, R., Determann, J. & Rae, J. Twenty-first-century warming of a large Antarctic ice-shelf cavity by a redirected coastalcurrent. Nature 485, 225–228 (2012).
26. Gladstone, R. M. et al. Calibrated prediction of Pine Island Glacier retreat duringthe 21st and 22nd centuries with a coupled flowline model. Earth Planet. Sci. Lett.333–334, 191–199 (2012).
27. Fischer, H. et al. Reconstruction of millennial changes in dust emission, transportand regional sea ice coverage using the deep EPICA ice cores from the Atlantic andIndian Ocean sector of Antarctica. Earth Planet. Sci. Lett. 260, 340–354 (2007).
28. Anderson, R. F. et al. Wind-driven upwelling in the Southern Ocean and thedeglacial rise in atmospheric CO2. Science 323, 1443–1448 (2009).
29. Sprenk, D. et al. Southern Ocean bioproductivity during the last glacial cycle—newdecadal-scale insight from the Scotia Sea. Geol. Soc. Lond. Spec. Publ. 381,245–261 (2013).
30. NGRIP Members. High-resolution record of Northern Hemisphere climateextending into the last interglacial period. Nature 431, 147–151 (2004).
Acknowledgements We acknowledge support from the DeutscheForschungsgemeinschaft (DFG grant numbers We2039/7-1, Ri525/17-1 and Ku683/
9-1 to M.E.W. and G.K.), the University of Cologne (to M.E.W.), the US NSF AntarcticGlaciology Program (grant numbers ANT-1043517 to P.U.C. and ANT-1341311to A.T.), the US NSF Paleoclimatology Program and the Japan Agency for Marine-EarthScience and Technology (to A.T.), and Helmholtz funding through the Polar Regionsand Coasts in the changing Earth System (PACES) programme (to X.Z., G.L.and G.K.). Our study was also part of the Southern Ocean Initiative of the InternationalMarine Past Global Change Study (IMAGES) program. We thank W. F. Budd forcomments on Antarctic ice-sheet dynamics, and M. Winstrup and S. Rasmussenfor advice on comparing ice-core chronologies. Experiments with the Bern3Dwere performed in the Department of Climate and Environmental Physics,University of Bern, and with funding through the Oeschger Center forClimate Change.
Author Contributions M.E.W. conceived the idea for the study and, with P.U.C.,wrote most of the manuscript. G.K. selected the core sites and provided geochemicaldata. A.T. oversaw the modelling contributions and helped write the manuscript.R.G. provided insight into iceberg routing and associated ice-sheet modelling.D.S. helped develop the age model and provided biogenic opal data. G.L. and X.Z.contributed results from the COSMOS model. L.M., M.O.C. and T.F. contributedresults from Bern3D and LOVECLIM models. C.O. contributed uncertaintyestimates on the different age models. All authors commented onthe manuscript.
Author Information Further data are available at http://dx.doi.org/10.1594/PANGAEA.819646. Reprints and permissions information is available atwww.nature.com/reprints. The authors declare no competing financial interests.Readers are welcome to comment on the online version of the paper.Correspondence and requests for materials should be addressed toM.E.W. ([email protected]).
LETTER RESEARCH
0 0 M O N T H 2 0 1 4 | V O L 0 0 0 | N A T U R E | 5
Macmillan Publishers Limited. All rights reserved©2014

METHODSMaterial and sediment composition. If not tabulated here, data from this studyare available at the Pangaea data library (http://dx.doi.org/10.1594/PANGAEA.819646). Sediment cores MD07-3133 (57u 269 S, 43u 279 W; 3,101 m water depth;32.8 m core length) and MD07-3134 (59u 259 S, 41u 289 W; 3,663 m water depth;58.2 m core length) were obtained from the northern end of Dove Basin and PirieBank, respectively, in the southern part of the central Scotia Sea (Fig. 1). Both sitesare located well below the carbonate compensation depth, that is, the sediments arelargely carbonate-free and consist primarily of biogenic opal and detrital material.The relative proportions of these two components depend on climate conditions(see below): warm periods are associated with homogenous, olive grey to yellowishdiatomaceous oozes, whereas cold periods correspond to grey to blue-grey diatom-bearing mud, and climate transitions are associated with olive-grey diatomaceousmud29.Non-destructive measurements. We conducted a number of non-destructivemeasurements12. We determined magnetic susceptibility (kappa volume specific) witha Bartington coil sensor for whole-core and a point sensor for split-core measure-ments at 1-cm increments using a multi-sensor core logger31. We also measured thedistribution of chemical elements using an AVAATECH X-ray fluorescence corescanner32. Results for Ca are given as peak area intensities determined in total countsper second. We performed the analysis using a sample spot of 1 cm 3 1 cm in sizeat 1-cm increments33.
We also used a Minolta spectrophotometer CM-2002 to measure L*, a* and b*as well as RGB colour components34 at 1-cm increments. RGB colour values wereconverted to R/G/B35 and plotted with PanPlot (www.pangaea.de/software/PanPlot)to obtain visual colour logs (Fig. 2).Biogenic opal determination. Biogenic opal was determined by several methodsfor sites MD07-3133 and MD07-3134 (ref. 29). We first analysed biogenic opal byleaching the sediment in 1 M NaOH solution36 to obtain ground-truth informationat critical transitions (MD07-3133: 1,655–2,785 cm, 112 samples; MD07-3134: 745–1,785 cm, 4,135–4,585 cm; 141 samples). We then implemented a new and fasttechnique that relies on this ground-truthing, called Fourier transform infraredspectroscopy37, to obtain information on biogenic opal at 10-cm increments overthe entire core lengths of sites MD07-3133 and MD07-3134 (316 and 575 samples,respectively). Note that biogenic opal flux rates in Fig. 3d are normalized for 230Thto account for sediment focusing with the exception of MD07-3133, where no230Th data have been obtained so far29.Chronology. The low-resolution chronology of sites MD07-3133 and MD07-3134,which extend back to 36 kyr ago and 93 kyr ago, respectively, is described in ref. 12.It is based on several ground-truth data points associated with Marine Isotopic Stageboundaries, the correlation to rather massive layers rich in coarser-grained detritus38,and the identification of the Laschamp event. The high-resolution chronologyrelies on dust–climate couplings between Southern Ocean sediment and the Ant-arctic EDML ice core12. The use of marine Fe records as a proxy for dust is a well-established approach reflecting coherent and synchronous changes in dust depositionacross much of the Southern Ocean and the AIS, and has recently also been imple-mented to construct age models for records from the Atlantic39 and the Pacific40
sectors of the Southern Ocean to reconstruct Southern Hemisphere dust climatecouplings during the Late Quaternary using Fe counts. In addition, a number of pre-vious workers have identified a remarkable similarity in the structure of variabilityof magnetic susceptibility in cores from the Scotia Sea and the variability in dustrecords from Antarctic ice cores41–43. Pugh et al.44 noted this similarity in magneticsusceptibility records from three cores in the Scotia Sea (that is, the same region asour records cover), and explicitly tested whether the magnetic susceptibility signalwas synchronous with the EPICA ice-core dust record. They first established twoindependent age models for their cores from (1) biostratigraphy (variations inCycladophora davisiana abundance tied to the LR04 time scale d18O global stack45)and (2) radiocarbon dating, and then compared those age models to one constructedby synchronizing their magnetic susceptibility records to the ice-core dust record.They concluded that these three independently derived age models are ‘‘mutuallyconsistent over their common ranges’’ and that millennial-scale fluctuations in mag-netic susceptibility and in Antarctic dust concentration were synchronous, supportingour strategy of tuning Scotia Sea magnetic susceptibility records to Antarctic ice-core dust records to develop an age model for our marine records12.
Weber et al.12 also noted a remarkable similarity in the structure of variability ofCa in the cores from the Scotia Sea and the variability in the non-sea-salt Ca recordsfrom Antarctic ice cores. Weber et al.12 measured Ca by X-ray fluorescence which,because the Scotia Sea sites do not contain biogenic Ca, is the same proxy for dust asused in the ice cores (non-sea-salt Ca), and found that when Ca is tuned to non-sea-salt Ca (which is completely independent of the magnetic susceptibility tuning),the resulting correlation between the two is as strong as the correlation of magneticsusceptibility to non-sea-salt Ca, providing additional support for synchroneity,
because both marine and ice-core Ca records are proxies for dust, with the mostlikely physical process being short-lived atmospheric transport.
Given these independent lines of evidence supporting synchronous changes, wetuned magnetic susceptibility and Ca in our cores to the non-sea-salt Ca flux recordfrom the EDML ice core27. We used three statistical approaches to produce a tuned,high-resolution age model, evaluate its quality and provide error estimates12. Imple-menting dynamic time wrapping algorithms, for instance, helped to detect circula-rities by computing a time (depth) axis stretch and mapping two time series optimallyby minimizing the cumulative distance without any pre-defined tie points. Theresulting age–depth structure obtained from dynamic time wrapping was virtuallyidentical to the one obtained by the tuning procedure, which served as indepen-dent verification of our final tuning with tie points.
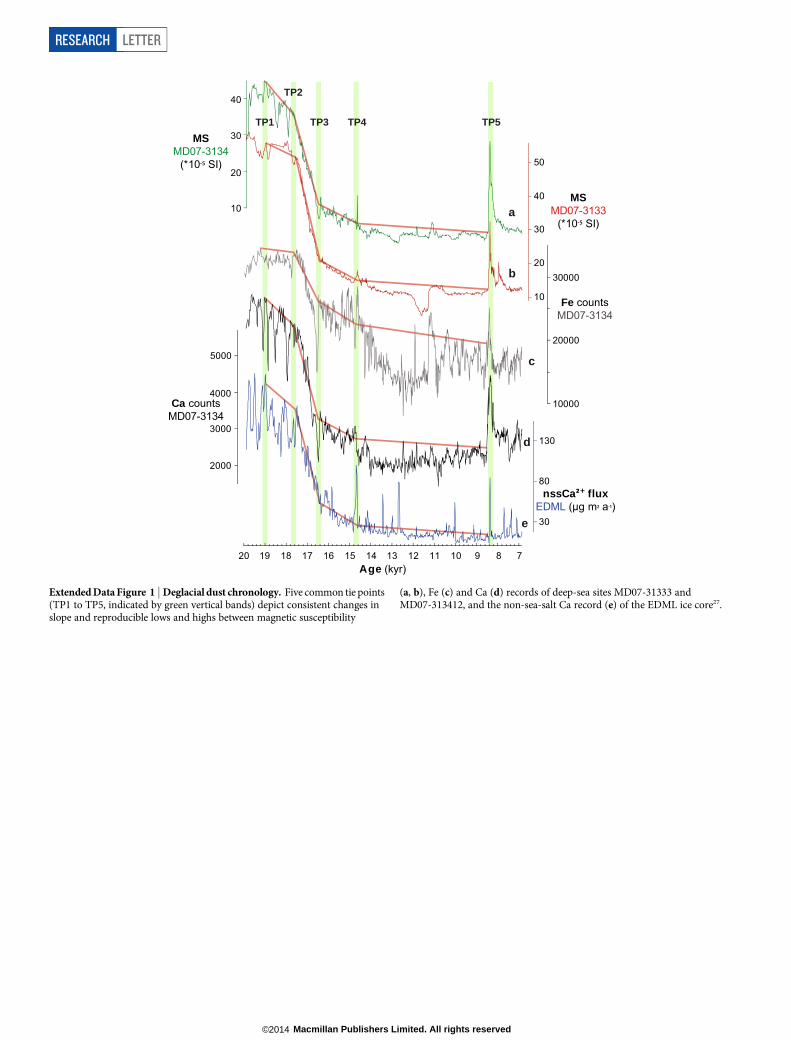
Our deglacial age model is based primarily on five stratigraphic tie points (TP1to TP5) that are shared between the records and reveal a detailed record for theperiod about 20–8 kyr ago over 10 m and 7 m core lengths for sites MD07-3133 andMD07-3134, respectively (Extended Data Fig. 1). The five tie points correspond toconsistent breaks in slopes and characteristic and reproducible peaks in the recordsof magnetic susceptibility and Ca relative to non-sea-salt Ca. Our deglacial chro-nology also includes Fe, which shows the same characteristic trends and features asmagnetic susceptibility and Ca, and which has been used to synchronize SouthernOcean marine sediment and Antarctic ice-core records39,40. TP1 (about 19 kyr ago)is one of many correlation points for the Last Glacial Maximum used in ref. 12. Itmarks the end of distinctly elevated values in magnetic susceptibility, Ca, Fe andnon-sea-salt Ca towards the end of this phase. TP2 (about 17.6 kyr ago) is definedon the basis of a steep increase in slope in each of the records. A subsequent decreasein slope in each of the records is the basis for TP3 around 16.5 kyr ago. TP4 occursanother 1,800 years later with another distinct decrease in slope in each recordaround 14.7 kyr ago and a corresponding distinct peak in the non-sea-salt Ca andmagnetic susceptibility records. TP5 is recorded in all archives as a distinct peakthat occurred around 8.4 kyr ago.
In addition to these common tie points, site MD07-3134 and EDML share adust peak at 12.85 kyr ago that is not preserved at site MD07-3133. Sites MD07-3133 and MD07-3134 share a weak dust peak at 11.42 kyr ago, which was taken asan additional age control for MD07-3133. This correlation is supported by the factthat colour component a* (red–green variability) shows a distinct peak at 8.5–8.3 kyrago at sites MD07-3133 and MD07-3134, which also serves as control point at bothsites (Fig. 2c, d). This peak is replicated at 11.42 kyr ago (that is, at 19.00 m at siteMD07-3133, and at 11.00 m at site MD07-3134).
Based on our age model, sedimentation rates in our cores are high, 0.2–1.2 m kyr21
for site MD07-3134 (63 cm kyr21 on average over the last 93 kyr) and 0.3–2.1 m kyr21
for site MD07-3133 (92 cm kyr21 on average over the last 36 kyr), translating intomass accumulation rates of 10–120 g cm2 kyr21 and 15–170 g cm2 kyr21, and intosample resolutions of 8–50 yr and 5–33 yr (given a sample increment of 1 cm) forIBRD counting, respectively.
Considering the chronological limitations and problems that are associated withmost Southern Ocean sediment archives, the age model of our two Scotia Sea siteshas a high resolution and should be very accurate because the uncertainties assoc-iated with 14C dating, such as reservoir age, are circumvented. Therefore, our expandeddeglacial record of about 20–8 kyr ago (documented over 7 m and 10 m core length insites MD07-3134 and MD07-3133, respectively) is chronologically better constrainedthan the deglacial signals that have been inferred from shallow-water archives aroundthe Antarctic continent, such as at Mac Robertson Land3, where inferred changesusually occur over a few centimetres in condensed, lithologically complex succes-sions with partially reversed 14C ages that have uncertain reservoir ages.Age scale and AID uncertainty estimates. We use the EDML1/EDC3 age modelthat was developed in conjunction with the EDC age model27 by incorporatingground-truth stratigraphic evidence, most importantly the correlation of regionalvolcanic ash layers. Based on this age model, three AIDs in the Scotia Sea correlatewell with large-scale events: the peak of AID7 with the major retreat of the WeddellSea part of the East AIS at 16.1 kyr ago4, the peak of AID6 with MWP-1A around14.7 kyr ago, and AID2 with MWP-1B at 11.3 kyr ago.
The original age scale EDML1/EDC3 relied on ash correlation to EDC46,47. Theerrors of this correlation are a couple of decades. For ages younger than 41 kyr ago,the EDML1/EDC3 age model is based on correlation of methane and 10Be to the Green-land Ice Core Chronology 2005 (GICC05), which largely relies on layer counting48.The errors of GICC05 were also a couple of decades for the Holocene, and up totwo centuries for the time around MWP-1A. Subsequent revision to the EDML agemodel49 and the latest Antarctic-wide ice-core chronology50, called AICC2012, triedto account for regional stratigraphic constraints and the need to adjust ages to achieveinterhemispheric methane and 10Be synchronization during deglaciation.
AICC2012 shows little to no difference to EDML1/EDC3 for most of the Holo-cene: that is, the timing of AID1 and AID2 are not affected. However, from about8–18 kyr ago, AICC2012 becomes progressively older, with an age difference peaking
RESEARCH LETTER
Macmillan Publishers Limited. All rights reserved©2014

at about 550 yr at 18 kyr ago, and declining again to about 200 yr from the LastGlacial Maximum. For the time of MWP-1A, for instance, the age difference is almost400 yr. This would increase the age of the tie point, which occurs right at the startof AIE6, from 14.8 kyr ago to almost 15.2 kyr ago, implying that the peak of AIE6dates 15.1–14.7 kyr ago instead of 14.8–14.4 kyr ago. The entire AIE6 would hencebe 15.2–14.2 kyr ago.
However, this age shift is only achieved at the expense of a significantly largerdating uncertainty than the original EDML1/EDC3 chronology. For the Holocenethe uncertainty is around 200 yr (ref. 51). At about 12 kyr ago, it increases to almost500 yr, and it reaches 1,000 yr by about 19 kyr ago. The original EDML1/EDC3 agescale, however, has much lower uncertainties. From approximately 10 kyr ago to14 kyr ago, uncertainties increase from only a few decades to around 200 yr, respec-tively (Extended Data Fig. 2d), and then further increase to about 700 yr at around18 kyr ago. One should note that, although AICC2012 is applied to all Antarctic icecores, the only ground-truth correlation of EDML is established via volcanics to EDC.
Synchronization of the new West AIS ice core to EDML via layer counting betweenvolcanic acidic horizons, which has not been included in AICC2012, indicates thatAICC2012 is significantly too old for the pre-Holocene time (Winstrup, M., Vinther,B. M., Sigl, M., McConnell, J., Svensson, A. M. and Wegner, A., manuscript in prep-aration). For the depth around MWP-1A, for instance (about 800 m at EDML),this new chronology will again be closer to the timing of the original EDML1/EDC3timescale. Also, the uncertainly will again be much lower, given the low countingerror of annual bands between volcanic ashes.
Since the ageing of AICC2012 is only achieved at the expense of much higheruncertainties relative to the EDML1/EDC3 age scale, and all shifts are within theuncertainties of the different ice-core age models, we use the original EMDL1/EDC3age model. We note also that its dating uncertainties are lower and that it has moreground-truth chronological constraints.
The original uncertainty estimates of the Scotia Sea sites12 built upon a bootstrapalgorithm that simulates possibly wrong tie points and therefore provides conser-vative error estimates. However, these uncertainty estimates do not include ice-coreage uncertainties. We used the resulting dating errors (2s) of the tie point correla-tion to calculate uncertainties for the start, end and duration of AIDs (ExtendedData Fig. 2a). In addition, we considered the uncertainties in the EDML1 chronology47
as well as the EDC3 chronology46 when calculating the full uncertainties for theAIDs (Extended Data Fig. 2b). All uncertainties are incorporated into the absolutedating uncertainty (2s error) of the AIDs (Extended Data Table 1). The bootstrapalgorithm allows for the derivation of relative dating uncertainties for the AIDs.Since interpolation errors of nearby layers are highly correlated, these uncertaintiesare naturally smaller than the absolute dating uncertainties (Extended Data Fig. 2c).Hence, significantly more precise estimates can be made on the duration of and thedistance between AIDs.IBRD counting and conversion. We cut out 1-cm-thick, 10-cm-wide and 25-cm-long slices from the centre of each core section, placed them on plastic plates andexposed the slices to film-sensitive negatives for 3 min to 5 min using a HP 43855X-ray system. The negatives were then scanned at 300 dpi (dots per inch) and ana-lysed for the amount of IBRD using a 1-mm by 1-mm grid.
We counted all visible grains .1 mm in diameter per centimetre core depth52 (thatis, per 10 cm3 volume) as an indicator for the content of IBRD (Extended Data Fig. 3).We distinguished between grains 1–2 mm and .2 mm in diameter. Also, to accountfor operator subjectivity in IBRD counts, three different individuals conducted inde-pendent counts, which were then averaged for Fig. 2c and d. For Fig. 2e, we stackedthe results by re-sampling each data series at 10-yr increments, adding the individualcounts from the two cores, and then dividing them by 2. For Fig. 2f, we con-verted the IBRD time series from sites MD07-3133 and MD07-1334 into flux rates,using the detailed age models12, and, again, stacked the results. For Fig. 3b, we averagedthe stacked IBRD flux rates into 500-yr slices.
The stacked IBRD flux-rate record indicates, on average, rather stable valueswith little multi-centennial variability of 0.01 grains cm2 yr21 for 25–21 kyr ago, and0.015 grains cm2 yr21 for 8–0 kyr ago. We infer that these low values represent steady-state conditions, that is, the amount of iceberg calving off the Antarctic continent isbalanced by accumulation on the ice sheet. During deglaciation, however, flux rateswere distinctly above these low values, and 10–15 times higher during meltwaterpulses. Even when averaged into 500-yr slices (grey histogram line, Fig. 3e), melt-water pulses show IBRD flux rates 4–7 times higher.
We note that icebergs usually lose the majority of their coarse-grained IBRD (peb-bles to boulders) immediately after calving proximal to the AIS grounding lines.The largest IBRD reaching our distal core positions in Iceberg Alley is usually1–3 mm in size and dispersed in a diatom-rich or clay-rich matrix (Extended DataFig. 3). These particles embedded within icebergs can travel over long distancesand argue against a strong regional bias in our IBRD data set.On the relation of AIS mass loss, icebergs and IBRD. The majority of IBRDoriginates from bedrock, either directly (through scouring) or indirectly (through
refreezing of sediment-laden water at the bed), and is entrained in the deeper partof a glacier. Where glaciers merge, medial moraines can cause IBRD to occur over amuch greater thickness, sometimes even throughout the ice column (W. F. Budd,personal communication, 2013). Other processes internal to ice flow (for example,compressive flow) can also transport debris from the bed well up into the ice column.Only a small fraction will be delivered onto the ice surface, for example, by rock fall,or by wind transport in the case of finer grains.
In the floating ice shelves most IBRD near the base will melt out relatively close tothe source53,54, immediately in front of the grounding line. In ice shelves with highmelt rates, the whole sediment-rich basal layer might ablate. However, in some iceshelves tributary glaciers can carry IBRD straight into a basal freeze-on zone, wherethey are protected from melting out by a layer of meteoric ice (for example, the westside of the Amery; see figures 6a and 9a of ref. 55). This process and the poten-tial for localized IBRD throughout the ice column allow some IBRD to reach thefront of large ice shelves.
The fact that we capture mostly small, englacial IBRD in Iceberg Alley indicatesthat the majority of the coarse-grained IBRD has been deposited before the icebergsreached the Scotia Sea sites. The fact that englacial material can travel long dis-tances and will probably survive the counterclockwise journey around Antarctica(see below) within the Antarctic Coastal Current could therefore indicate thatregional bias is not strong and no large nonlinearities exist between the amountof entrained IBRD detected in the Scotia Sea and the number of icebergs calving offthe AIS.Iceberg Alley today and during deglaciation. The term ‘Iceberg Alley’56 refers tothe confluence zone where Antarctic icebergs merge57 and exit the Weddell Sea tothe north into the Scotia Sea58. Icebergs take several months to two years to com-plete their journey counterclockwise around Antarctica9. Although icebergs lose somemass in transit (through wave erosion, friction or collisions with sea ice), it is a rapidjourney in cold waters. Therefore, melt rates remain low until the warmer AntarcticCircumpolar Current is reached, after which the icebergs ablate rapidly59. This is oneof the reasons why the sites from Iceberg Alley should contain a circum-Antarctic-wide IBRD signal, although it is also reasonable to assume that the Weddell Seapart of the East AIS and the Antarctica Peninsula Ice Sheet provide more IBRD thanmore distal sources. This regional bias has been detected before in IBRD provenancestudies53,54, although deglaciations may involve different iceberg fluxes from varioussources at different times as well as longer transport distances due to colder climates60.
A substantial percentage of large icebergs reach Iceberg Alley through the Ant-arctic Coastal Current11. Some of the smaller icebergs (for example, in the vicinityof the Kerguelen plateau) may stray directly north due to topographic steering ofocean currents, but even the smaller icebergs mostly stay entrained in the AntarcticCoastal Current. Most icebergs calving from the Western AIS are not likely to reachIceberg Alley through the Antarctic Coastal Current because there is a small north-wards and clockwise escape route from the coastal drift (see arrow in Fig. 1; refs 9, 11).However, it is conceivable that these icebergs could also come through the ScotiaSea and affect the IBRD record of our sites.
Several factors indicate that the present-day iceberg routeing through IcebergAlley would have remained largely the same during the last deglaciation. The Ant-arctic Divergence is the major driver of the ocean–atmospheric circulation in theSouthern Ocean. It forces winds north of it to blow east and to feed clockwise intothe Antarctic Circumpolar Current. South of the Antarctic Divergence, winds blowwest and feed counterclockwise into the Antarctic Coastal Current around Antarctica.The Antarctic Circumpolar Current is constrained to flow south of the tip of SouthAmerica at 56u S as it passes from the Pacific Ocean to the Atlantic Ocean, and itsmean position therefore lies between 50u S and 55u S (ref. 61). The Antarctic Circum-polar Current and Antarctic Coastal Current will thus exist under different climatesof the past28,62, although specific fronts associated with them probably shifted northor south, depending on the state of the climate and its associated sea-ice coverage.
An additional factor that is important in routeing of icebergs discharged fromthe AIS is the Coriolis force, which depends on the rotation of the Earth and is there-fore independent of the state of the climate. It causes all moving objects to be deflectedto the left in the Southern Hemisphere. Thus, all icebergs calving from the AIS areforced to move counterclockwise and maintain a course parallel to the edge of theAntarctic continent. Moreover, the Coriolis force exerts a greater force on the largericebergs57, which contribute most of the AIS mass loss, and they thus largely remainentrained in the Antarctic Coastal Current (that is, sea ice does not have a largeeffect on altering the course of big icebergs); preferably smaller icebergs and crawlerswould have escaped the Antarctic Coastal Current during times of thicker sea-icecoverage further away from the continent.
Finally, several studies4,63 have reconstructed extensive coastal polynyas (areasof open water surrounded by sea ice) immediately in front of the AIS during colderperiods when sea-ice coverage was dense further away from the continent. This fur-ther implies a vigorous Antarctic Coastal Current also during glacial and deglacialtimes. In summary, there are several lines of evidence that iceberg routeing through
LETTER RESEARCH
Macmillan Publishers Limited. All rights reserved©2014

Iceberg Alley operated in much the same way during deglaciation as is observed andmodelled today.
We note that Kanfoush et al.38 detected layers rich in coarser-grained detritusacross the southern Atlantic, and named them SA0 (about 14–15 kyr ago) to SA6(about 55 kyr ago). Whereas they interpreted these layers as IBRD and also inferredepisodes of Antarctic ice-sheet instability from them, subsequent studies64 demon-strated that the material was volcanic ash, most probably from the South SandwichIslands, and concluded that the ash was deposited on sea ice, which then trans-ported the material. In any event, the majority of Antarctic icebergs are entrainedinto the Antarctic Circumpolar Current in Iceberg Alley and melt long before thesedistal South Atlantic sites can be reached57. Moreover, the layers described byKanfoush et al.38 are distinct and massive, whereas our IBRD counts usually indicatesmall (1–3 mm in diameter) and dispersed grains embedded in a diatom- or clay-rich matrix. In addition, our IBRD records show no long-term correlation to thesea-salt Na record (Fig. 3f) of the EDML ice core, a proxy for sea ice. Accordingly, weare confident that the Scotia Sea IBRD counts indicate a source from icebergs withvarying fluxes rather than a fallout from volcanic eruptions and transport by sea ice.Deglacial meltwater sources. During deglaciation, specific parts of the AIS con-tributed to specific retreat events, that is, ice-sheet retreat probably did not occurcontemporaneously across the entire AIS. The Weddell Sea sector of the East AISprobably contributed to AID8 (MWP-19KA; ref. 1) and AID7, with evidence thatice-sheet retreat occurred 19 kyr ago and 16 kyr ago, respectively4. Early deglacia-tion of the Antarctic Peninsula65 and the Lambert glacier–Amery ice shelf system66
may also have contributed icebergs to these events. In addition, the Pine Island gla-cier of the Amundsen Sea embayment retreated at 16.4 kyr ago67, and may have con-tributed to AID7.
Evidence for widespread retreat 14–15 kyr ago comes from additional sectorsof the East AIS, that is, Mac Robertson Land3, as well as the Ross Sea sector of theWest AIS68,69 and the Antarctic Peninsula Ice Sheet2,70, suggesting multiple sourcesfor AID6 (MWP-1A). Such a change in the distribution of meltwater sources is sup-ported by our freshwater experiments, which simulate increased subsurface tempe-rature responses when sources are shifted from west to east during deglaciation.Subsequent retreat during AID2 (MWP-1B) is recorded at Wilkes Land, part of theEast AIS71. Available terrestrial and shallow-marine records from the Ross Sea sectorof the West AIS suggest retreat of the grounding line in the Ross Sea as havingoccurred either before72 or after8 AID1. Therefore, the specific sector of the AISthat contributed to this event remains unknown.Ice-sheet/ocean feedbacks during AID6. To study the response of the SouthernHemisphere climate system to AID6-related iceberg surges, a series of coordinatedtransient climate modelling experiments is conducted with a hierarchy of climatemodels using time-varying Southern Ocean freshwater forcing (Extended DataTable 1). The freshwater forcing, which is evenly applied to the climate models inthe Weddell and Ross seas, is a linearly scaled version of the IBRD flux stack ofFig. 3a. The scaling factor is determined by assuming that 50% of the maximumsea level rates during MWP-1A (40 mm yr21)15 originated from Antarctica. Thecorresponding peak freshwater forcing around Antarctica during AID6 reachesvalues of 0.22 Sv (Fig. 4). It should be noted here that the anomalous fresh waterreleased from the Ross and Weddell seas is picked up by the Antarctic CircumpolarCurrent. This results in an efficient mixing of the freshwater around Antarctica,mimicking to some degree the effect of drifting icebergs10 and their correspondingfreshwater fluxes. The multi-model approach allows us to determine the robust fea-tures of the climate response to an Antarctic iceberg discharge 14.8–14.0 kyr ago(Fig. 3).
The following three climate models have been used: (1) The Bern3D model73,74
is an intermediate-complexity model based on an energy-balance model for theatmosphere and a frictional geostrophic model for the ocean. Other componentsincluded in the Bern3D model, such as a carbon cycle and sediment component,are not considered here. The horizontal resolution adopted here is 5u by 10u. Atmo-spheric winds are prescribed at present-day values, thus inhibiting large-scale atmo-spheric circulation changes in response to the climate change. The freshwater forcingis applied to the Bern3D model under climate boundary conditions that representthe Last Glacial Maximum. (2) The global climate model LOVECLIM uses a sim-plified dynamical atmosphere coupled to an ocean general circulation model, anddynamic/thermodynamic sea-ice and diagnostic vegetation models. It has beenused in a number of palaeoclimate studies focusing on the Southern Ocean18,75,76.Horizontal resolutions of the atmosphere and the ocean are 5.6u by 5.6u and 3u by3u, respectively. Here the Southern Ocean freshwater forcing is applied to constantclimate boundary conditions that represent the climate around 15 kyr ago77. Theseinitial conditions were obtained from 5,000-yr-long spin-up experiments that use15-kyr-ago greenhouse gas concentrations, orbital forcing and ice-sheet forcing.(3) COSMOS is a comprehensive coupled general circulation model including a landsurface scheme and a dynamic sea-ice model. It has been extensively used to studyvarious key palaeoclimate periods78–80. Horizontal resolutions of the atmosphere
and the ocean are 3.75u and 3u, respectively. The freshwater forcing is applied under15-kyr-ago boundary conditions. The initial state for the freshwater forcing experi-ment was obtained from a transient deglacial simulation varying CO2 concentra-tions derived from EDC ice core81 and orbital forcing.
Mimicking the effects of AID6, the applied Southern Hemisphere freshwaterforcing causes widespread surface cooling in the Southern Hemisphere and anincrease of Southern Ocean sea-ice area (Fig. 4), in accordance with the sea-saltNa1 flux data from EPICA Dronning Maud Land (Fig. 3e). This cooling wouldcontribute to establishing the Antarctic Cold Reversal and the bipolar seesaw responseduring the Bølling–Allerød. Moreover, the freshwater forcing generates a stronghalocline, which inhibits formation of very cold Antarctic Bottom Water, which isthen replaced by considerably warmer Circumpolar Deep Water (Fig. 4). Follow-ing previous studies18,19, we hypothesize that the associated sub-surface warmingat depths of 100–1,500 m can cause ice-shelf melting, grounding-line retreat, calv-ing and subsequent release of more fresh water, all of which act as positive feedbacks.
31. Weber, M. E., Niessen, F., Kuhn, G. & Wiedicke, M. Calibration and application ofmarine sedimentary physical properties using a multi-sensor core logger. Mar.Geol. 136, 151–172 (1997).
32. Jansen, J. H. F., Van der Gaast, S. J., Koster, B. & Vaars, A. J. CORTEX, a shipboardXRF-scanner for element analyses in split sediment cores. Mar. Geol. 151,143–153 (1998).
33. Richter, T. O. et al. The Avaatech XRF Core Scanner: technical description andapplications to NE Atlantic sediments. Geol. Soc. Lond. Spec. Publ. 267, 39–50(2006).
34. Weber, M. E. Estimation of biogenic carbonate and opal by continuousnon-destructive measurements in deep-sea sediments: application to the easternEquatorial Pacific. Deep Sea Res. I 45, 1955–1975 (1998).
35. Weber, M. E. et al. BMPix and PEAK tools: new methods for automated laminaerecognition and counting—application to glacial varves from Antarctic marinesediment. Geochem. Geophys. Geosyst. 11, 1–18 (2010).
36. Muller, P. J. & Schneider, R. An automated leaching method for the determinationof opal in sediments and particulate matter. Deep Sea Res. I 40, 425–444 (1993).
37. Rosen, P. et al. Fourier transform infrared spectroscopy, a new method for rapiddetermination of total organic and inorganic carbon and biogenic silicaconcentration in lake sediments. J. Paleolimnol. 43, 247–259 (2010).
38. Kanfoush, S. l. et al. Millennial-scale instability of the Antarctic Ice Sheet during thelast glaciation. Science 288, 1815–1819 (2000).
39. Martınez-Garcia, A. et al. Southern Ocean dust-climate coupling over the past fourmillion years. Nature 476, 312–315 (2011).
40. Lamy, F. et al. Increased dust deposition in the Pacific Southern Ocean duringglacial periods. Science 343, 403–407 (2014).
41. Hofmann, A. Kurzfristige Klimaschwankungen im Scotiameer und Ergebnisse zurKalbungsgeschichte der Antarktis wahrend der letzten 200 000 Jahre (Rapid climateoscillations in the Scotia Sea and results of the calving history of Antarctica during thelast 200000 years) PhD thesis (Univ. Bremen, 1999).
42. Diekmann, B. et al. Terrigenous sediment supply in the Scotia Sea (SouthernOcean): response to Late Quaternary ice dynamics in Patagonia and on theAntarctic Peninsula. Palaeogeogr. Palaeoclimatol. Palaeoecol. 162, 357–387(2000).
43. Yoon, H. I., Khim, B. K., Yoo, K. C., Bak, Y. S. & Lee, J. I. Late glacial to Holoceneclimatic and oceanographic record of sediment facies from the South Scotia Seaoff the northern Antarctic Peninsula. Deep Sea Res. II 54, 2367–2387 (2007).
44. Pugh, R. S., McCave, I. N., Hillenbrand, C. D. & Kuhn, G. Circum-Antarctic agemodelling of Quaternary marine cores under the Antarctic Circumpolar Current:ice-core dust–magnetic correlation. Earth Planet. Sci. Lett. 284, 113–123 (2009).
45. Lisiecki, L. E.&Raymo,M.E.A.Pliocene-Pleistocene stackof57globallydistributedbenthic d18O records. Paleoceanography 20, PA1003 (2005).
46. Parrenin, F. et al. The EDC3 chronology for the EPICA Dome C ice core. Clim. Past 3,485–497 (2007).
47. Ruth, U. et al. ‘‘EDML1’’: a chronology for the EPICA deep ice core from DronningMaud Land, Antarctica, over the last 150 000 years. Clim. Past 3, 475–484 (2007).
48. Rasmussen, S. O. et al. A new Greenland ice core chronology for the last glacialtermination. J. Geophys. Res. 111, D06102 (2006).
49. Lemieux-Dudon,B.d.et al.Consistentdating forAntarctic andGreenland ice cores.Quat. Sci. Rev. 29, 8–20 (2010).
50. Veres, D. et al. The Antarctic ice core chronology (AICC2012): an optimized multi-parameter and multi-site dating approach for the last 120 thousand years. Clim.Past Discuss. 8, 6011–6049 (2012).
51. Veres, D. et al. The Antarctic ice core chronology (AICC2012): an optimizedmulti-parameter and multi-site dating approach for the last 120 thousand years.Clim. Past 9, 1733–1748 (2013).
52. Grobe, H. A simple method for the determination of ice-rafted debris in sedimentcores. Polarforschung 57, 123–126 (1987).
53. Roy, M., van de Flierdt, T., Hemming, S. R. & Goldstein, S. L. 40Ar/39Ar ages ofhornblende grains and bulk Sm/Nd isotopes of circum-Antarctic glacio-marinesediments: implications for sediment provenance in the southern ocean. Chem.Geol. 244, 507–519 (2007).
54. Pierce, E. L. et al. Characterizing the sediment provenance of East Antarctica’sweak underbelly: the Aurora and Wilkes sub-glacial basins. Paleoceanography 26,PA4217 (2011).
55. Galton-Fenzi, B. K., Hunter, J. R., Coleman, R., Marsland, S. J. & Warner, R. C.Modeling the basal melting and marine ice accretion of the Amery Ice Shelf.J. Geophys. Res. 117, C09031 (2012).
RESEARCH LETTER
Macmillan Publishers Limited. All rights reserved©2014

56. Anderson, J. B. & Andrews, J. T. Radiocarbon constraints on ice sheet advance andretreat in the Weddell Sea, Antarctica. Geology 27, 179–182 (1999).
57. Schodlok, M. P., Hellmer, H. H., Rohardt, G. & Fahrbach, E. Weddell Sea icebergdrift: five years of observations. J. Geophys. Res. 111, C06018 (2006).
58. Pudsey, C. J.& Howe, J. A. Quaternary historyof theAntarctic CircumpolarCurrent:evidence from the Scotia Sea. Mar. Geol. 148, 83–112 (1998).
59. Jacka, T. H. & Giles, A. B. Antarctic iceberg distribution and dissolution fromship-based observations. J. Glaciol. 53, 341–356 (2007).
60. Williams, T. et al. Evidence for iceberg armadas from East Antarctica in theSouthern Ocean during the late Miocene and early Pliocene. Earth Planet. Sci. Lett.290, 351–361 (2010).
61. Toggweiler, J. R. & Russell, J. Ocean circulation in a warming climate. Nature 451,286–288 (2008).
62. Toggweiler, J. R. & Lea, D. W. Temperature differences between the hemispheresand ice age climate variability. Paleoceanography 25, PA2212 (2010).
63. Smith, J. A., Hillenbrand, C.-D., Pudsey, C. J., Allen, C. S. & Graham, A. G. C. Thepresence of polynyas in the Weddell Sea during the Last Glacial Period withimplications for the reconstruction of sea-ice limits and ice sheet history. EarthPlanet. Sci. Lett. 296, 287–298 (2010).
64. Nielsen, S. H. H., Hodell, D. A., Kamenov, G., Guilderson, T. & Perfit, M. R. Origin andsignificance of ice-rafted detritus in the Atlantic sector of the Southern Ocean.Geochem. Geophys. Geosyst. 8, 1–23 (2007).
65. Nakada, M. et al. Late Pleistocene and Holocene melting history of the Antarctic icesheet derived from sea-level variations. Mar. Geol. 167, 85–103 (2000).
66. White, D. A., Fink, D. & Gore, D. B. Cosmogenic nuclide evidence for enhancedsensitivity of an East Antarctic ice stream to change during the last deglaciation.Geology 39, 23–26 (2011).
67. Kirshner, A. E. et al. Post-LGM deglaciation in Pine Island Bay, West Antarctica.Quat. Sci. Rev. 38, 11–26 (2012).
68. Hall, B. L. & Denton, G. H. Radiocarbon chronology of Ross Sea drift, Eastern TaylorValley, Antarctica: evidence for a grounded ice sheet in the Ross Sea at the LastGlacial Maximum. Geogr. Ann. 82, 305–336 (2000).
69. Price,S. F., Conway,H.&Waddington, E.D. Evidence for latePleistocene thinning ofSiple Dome, West Antarctica. J. Geophys. Res. 112, F03021 (2007).
70. Simms, A. R., Milliken, K. T., Anderson, J. B. & Wellner, J. S. The marine record ofdeglaciation of the South Shetland Islands, Antarctica since the Last GlacialMaximum. Quat. Sci. Rev. 30, 1583–1601 (2011).
71. Leventer, A. et al. Marine sediment record from the East Antarctic margin revealsdynamics of ice sheet recession. Geol. Soc. Am. Today 16, 4–10 (2006).
72. McKay,R. M. et al. Retreat history of the Ross Ice Sheet (Shelf) since the LastGlacialMaximum from deep-basin sediment cores around Ross Island. Palaeogeogr.Palaeoclimatol. Palaeoecol. 260, 245–261 (2008).
73. Menviel, L. & Joos, F. Toward explaining the Holocene carbon dioxide and carbonisotope records: results from transient ocean carbon cycle-climate simulations.Paleoceanography 27, PA1207 (2012).
74. Ritz, S. P., Stocker, T. F. & Joos, F. A coupled dynamical ocean–energy balanceatmosphere model for paleoclimate studies. J. Clim. 24, 349–375 (2011).
75. Menviel, L., Timmermann, A., Mouchet, A. & Timm, O. Climate and marine carboncycle response to changes in the strength of the Southern Hemispheric westerlies.Paleoceanography 23, PA4201 (2008).
76. Timmermann, A., Timm, O., Stott, L. & Menviel, L. The roles of CO2 and orbitalforcing in driving Southern Hemispheric temperature variations during the last21 000 Yr. J. Clim. 22, 1626–1640 (2009).
77. Timm, O., Timmermann, A., Abe-Ouchi, A., Saito, F.& Segawa, T. On the definition ofseasons in paleoclimate simulations with orbital forcing. Paleoceanography 23,PA2221 (2008).
78. Knorr, G., Butzin, M., Micheels, A. & Lohmann, G. A warm Miocene climate at lowatmospheric CO2 levels. Geophys. Res. Lett. 38, L20701 (2011).
79. Zhang, X., Lohmann, G., Knorr, G. & Xu, X. Different ocean states and transientcharacteristics in Last Glacial Maximum simulations and implications fordeglaciation. Clim. Past 9, 2319–2333 (2013).
80. Wei, W., Lohmann, G. & Dima, M. Distinct modes of internal variability in the globalmeridional overturning circulation associated with the Southern Hemispherewesterly winds. J. Phys. Oceanogr. 42, 785–801 (2012).
81. Lourantou, A. et al. Constraint of the CO2 rise by new atmospheric carbon isotopicmeasurementsduring the last deglaciation. Glob. Biogeochem. Cycles 24, GB2015(2010).
LETTER RESEARCH
Macmillan Publishers Limited. All rights reserved©2014
TP2
TP3 TP4 TP5TP1
e
d
c
b
a
MSMD07-3134
(*10 SI)
10
20
30
40
MSMD07-3133
(*10 SI)
10
20
30
40
50
nssCa fluxEDML (μg m a )30
80
130
+
Ca countsMD07-3134
2000
3000
5000
4000
Age (kyr)720 8910111213141516171819
Fe countsMD07-3134
30000
20000
10000
Extended Data Figure 1 | Deglacial dust chronology. Five common tie points(TP1 to TP5, indicated by green vertical bands) depict consistent changes inslope and reproducible lows and highs between magnetic susceptibility
(a, b), Fe (c) and Ca (d) records of deep-sea sites MD07-31333 andMD07-313412, and the non-sea-salt Ca record (e) of the EDML ice core27.
RESEARCH LETTER
Macmillan Publishers Limited. All rights reserved©2014

AID1
AID2
AID3
AID4
AID5
AID6
AID7
AID8
AID (2σ error)
Age (kyr)8 10 12 14 16 18 20 22
●
●
●
●
●
●
●
●
9.63 (0.29) ka
11.23 (0.25) ka
11.90 (0.24) ka
12.88 (0.22) ka
13.46 (0.21) ka
14.40 (0.17) ka
16.33 (0.13) ka
19.54 (0.08) ka
AID1−AID1AID1−AID2AID2−AID2AID2−AID3AID3−AID3AID3−AID4AID4−AID4AID4−AID5AID5−AID5AID5−AID6AID6−AID6AID6−AID7AID7−AID7AID7−AID8AID8−AID8
Relative AID duration/distance (2σ error)
Duration (kyr)0.0 0.5 1.0 1.5 2.0 2.5 3.0
1.29 (0.19) kyr 0.72 (0.08) kyr 0.46 (0.04) kyr 0.32 (0.03) kyr 0.25 (0.02) kyr 0.68 (0.06) kyr 0.33 (0.03) kyr 0.24 (0.02) kyr 0.37 (0.03) kyr 0.29 (0.02) kyr 0.92 (0.07) kyr 0.89 (0.09) kyr 1.16 (0.09) kyr 2.09 (0.14) kyr 1.08 (0.07) kyr
AID1
AID2
AID3
AID4
AID5
AID6
AID7
AID8
AID with EDML1 & EDC3 uncertainty (2σ)
Age (kyr)8 10 12 14 16 18 20 22
●
●
●
●
●
●
●
●
9.63 (0.38) ka
11.23 (0.39) ka
11.90 (0.41) ka
12.88 (0.42) ka
13.46 (0.43) ka
14.40 (0.50) ka
16.33 (0.76) ka
19.54 (1.04) kaUncertainties (2σ)
Age (kyr)Ye
ars
(ka)
8 9 10 11 12 13 14 15 16 17 18 19 20 21 22 230.
00.
40.
81.
21.
6 MD07 & EDML1 (with EDC3)MD07 & EDML1 (IU only)EDML1 (IU only)
d
c
b
a
Extended Data Figure 2 | Uncertainty estimates for AIDs. Conservativeerror estimates (2s) rely on bootstrapping of different age models andprojecting them on to AIDs. a, Errors of the MD age model12 based on tie pointcorrelation only. Black dots depict the centre of the AID and its absoluteuncertainty range. Black error bars at the boxes mark the relative uncertaintywith respect to the centre. Grey error bars show the absolute uncertainty of thebeginning and end of each AID. b, Errors including the EDML1 (ref. 47), and
EDC3 (ref. 46) uncertainties. c, Relative duration of AIDs and relateduncertainties. d, Error propagation of the three different age scales through thelast deglaciation. IU is interpolation uncertainty. Note that uncertainties arehighly correlated for nearby ages. Accounting for this correlation, the durationof each AID as well as the time between two AIDs is significantly more accuratethan its absolute age uncertainty.
LETTER RESEARCH
Macmillan Publishers Limited. All rights reserved©2014

Extended Data Figure 3 | X-radiograph images from Scotia Sea SiteMD07-3134. IBRD (bright dropstones) are embedded in a matrix-supporteddiatomaceous mud. Low IBRD contents are documented for the Last GlacialMaximum (LGM, ,24.7 kyr ago) and the Holocene (,8.8 kyr ago), whereas
higher numbers indicate enhanced iceberg routeing through IcebergAlley during three distinct deglaciation phases (centre panels): AID8 (MWP-19KA), AID7 and AID6 (MWP-1A).
RESEARCH LETTER
Macmillan Publishers Limited. All rights reserved©2014

Extended Data Table 1 | Uncertainty estimates
AID
No.
Top
(kyr)
Error (2 ) Centre
(kyr)
Error (2 ) Bottom
(kyr)
Error (2 )
AID1 8.99 (0.32,
0.38)
9.63 (0.29,
0.38)
10.28 (0.27,
0.38)
AID2 11.00 (0.26,
0.39)
11.23 (0.25,
0.39)
11.46 (0.25,
0.39)
AID3 11.78 (0.24,
0.40)
11.90 (0.24,
0.41)
12.03 (0.24,
0.42)
AID4 12.71 (0.22,
0.42)
12.88 (0.22,
0.42)
13.04 (0.22,
0.42)
AID5 13.28 (0.21,
0.43)
13.46 (0.21,
0.43)
13.65 (0.20,
0.44)
AID6 13.94 (0.19,
0.44)
14.40 (0.17,
0.50)
14.86 (0.16,
0.55)
AID7 15.75 (0.13,
0.67)
16.33 (0.13,
0.76)
16.91 (0.13,
0.85)
AID8 19.00 (0.07,
1.03)
19.54 (0.08,
1.04)
20.08 (0.09,
1.05)
Top, bottom, and centre of deglacial AID1 to AID8, as well as absolute dating uncertainties in terms of the 2s error (parenthesis). The first uncertainty relates to the MD07 chronology only12, the one below to theoverall uncertainty including the EDML1 (ref. 47) and EDC3 (ref. 46) chronology.
LETTER RESEARCH
Macmillan Publishers Limited. All rights reserved©2014


