Embed Size (px)
Citation preview
Genetic assignment with isotopes and habitat suitability
(GAIAH), amigratory bird case study
KristenC. Ruegg*,†,1,2, Eric C. Anderson†,3, Ryan J. Harrigan1, Kristina L. Paxton4,
Jeffrey F. Kelly5,6, FrankMoore7 and ThomasB. Smith1,8
1Center for Tropical Research, Institute of the Environment and Sustainability, University of California, Los Angeles, Los
Angeles, CA 90095-1496, USA; 2Department of Ecology and Evolutionary Biology, University of California, Santa Cruz,
CA 95064, USA; 3Fisheries Ecology Division, Southwest Fisheries Science Center, National Marine Fisheries Service,
NOAA, Santa Cruz, CA 95060, USA; 4Department of Biology, University of Hawaii, Hilo, HI 96720, USA; 5Oklahoma
Biological Survey, University of Oklahoma, Norman, OK 73019, USA; 6Department of Biology, University of Oklahoma,
Norman, OK 73019, USA; 7Department of Biological Sciences, University of Southern Mississippi, Hattiesburg, MS
39406, USA; and 8Department of Ecology and Evolutionary Biology, University of California, Los Angles, CA 90095,
USA
Summary
1. Identifying migratory connections across the annual cycle is important for studies of migrant ecology, evolu-
tion and conservation. While recent studies have demonstrated the utility of high-resolution SNP-based genetic
markers for identifying population-specific migratory patterns, the accuracy of this approach relative to other
intrinsic tagging techniques has not yet been assessed.
2. Here, using a straightforward application of Bayes’ Rule, we develop amethod for combining inferences from
high-resolution genetic markers, stable isotopes and habitat suitability models, to spatially infer the breeding ori-
gin of migrants captured anywhere along their migratory pathway. Using leave-one-out cross validation, we
compare the accuracy of this combined approach with the accuracy attained using each source of data indepen-
dently.
3. Our results indicate that when each method is considered in isolation, the accuracy of genetic assignments far
exceeded that of assignments based on stable isotopes or habitat suitability models. However, our joint assign-
ment method consistently resulted in small, but informative increases in accuracy and did help to correct misas-
signments based on genetic data alone. We demonstrate the utility of the combined method by identifying
previously undetectable patterns in the timing of migration in a North American migratory songbird, the
Wilson’s warbler.
4. Overall, our results support the idea that while genetic data provides the most accurate method for tracking
animals using intrinsic markers when each method is considered independently, there is value in combining all
three methods. The resulting methods are provided as part of a new computationally efficient R-package, GAIAH,
allowing broad application of our statistical framework to othermigratory animal systems.
Key-words: avian ecology, migratory connectivity, movement ecology, population assignment,
Wilson’s warbler
Introduction
The ecology and evolution of animals that undergo annual sea-
sonal migration is shaped by events encountered across the
entire annual cycle (Sillett, Holmes & Sherry 2000; Webster
et al. 2002, 2005). It is now well established that habitat condi-
tions duringmigratory or wintering phases can have significant
carry-over effects on breeding ground productivity (Marra,
Hobson&Holmes 1998; Sillett, Holmes & Sherry 2000; Norris
& Taylor 2006). As a result, understanding patterns of migra-
tory connectivity, or the geographic links between breeding,
wintering and stopover sites for a population over the course
of an annual cycle, is a critical first step towards studies of
migrant ecology, evolution and conservation.
Efforts to identify the strength of migratory connections
have relied on a variety of methods for tracking animal move-
ments (Marra, Hobson & Holmes 1998; Bonfil et al. 2005;
Smith et al. 2005; Stutchbury et al. 2009). Extrinsic devices
such as satellite transmitters and geo-locators have increased
our knowledge of the movement patterns of individuals of a
particular species (Stutchbury et al. 2009), but remain impracti-
cal for many large-scale (1000s of individuals) applications due
to cost andweight restrictions, and the need to re-capturemany
individuals to collect the data (Arlt, Low & P€art 2013; Bridge
et al. 2013). An attractive alternative is the use of genetic and*Correspondence author. E-mail: [email protected]
†Co-first authors: Anderson andRuegg contributed equally.
© 2017 The Authors. Methods in Ecology and Evolution © 2017 British Ecological Society
Methods in Ecology and Evolution 2017, 8, 1241–1252 doi: 10.1111/2041-210X.12800
isotopic markers, that capture information contained within
the tissue of an animal, to pinpoint an individual’s population
of origin. These methods have broad appeal because they are
minimally invasive, cost-effective when applied at scale and do
not require recapture of individuals (Rubenstein et al. 2002;
Kelly, Ruegg & Smith 2005; Rundel et al. 2013). Furthermore,
intrinsic methods make it possible to trace the origins of ani-
mals that have died from both natural and anthropogenic
causes (i.e. poaching, collisions and disease), because genetic
and isotopic samples can be collected fromcarcasses.
While some genetic approaches have been limited by a lack
of resolution, advances in genome-wide sequencing have
resulted in new technologies that can be applied to genetic tag-
ging of wild populations (Allendorf, Hohenlohe & Luikart
2010; Metzker 2010; Davey et al. 2011). Even in species with
high rates of dispersal, such as birds, fish and mammals it has
been found that a small number (n < 100) of single-nucleotide
polymorphisms (SNPs) foundwithin, or linked to, genes under
selection can be targeted to reveal population structure at spa-
tial scales that are critical to regional conservation planning
(Nielsen et al. 2009; Hess, Matala & Narum 2011; Nielsen
et al. 2012; Ruegg et al. 2014). For example, Ruegg et al.
(2014) found that 96 high-resolution SNPs could be used to
identify six genetically distinct populations of a migratory
songbird, the Wilson’s warbler (Cardellina pusilla), whereas
previous single-marker techniques found support for only two
groups (Kimura et al. 2002). Furthermore, SNP assays that
isolate short fragments of DNA specific to the taxa of interest
make it possible to rapidly screenDNA from a variety of tissue
types (i.e. bird feathers, fin clips, animal hair) that can be col-
lected using non-invasive sampling techniques, making this
method an attractive choice for conservation genomic studies
(Ruegg et al. 2014; Kraus et al. 2015).
Despite their appeal, several questions remain as to how
genetic tools compare with other intrinsic methods such as
stable isotopes which are cost effective and have had broad
applicability across many species (Hobson, Wassenaar & Tay-
lor 1999; Brattstr€om et al. 2008; Hobson, Barnett-Johnson &
Cerling 2010;Hobson et al. 2012a,c;Cryan, Stricker&Wunder
2014), andhabitat suitabilitymodelswhich canbeused to refine
isotopic- and genetic-based assignments (Hallworth et al. 2013;
Pekarsky et al. 2015; Fournier et al. 2016). In contrast to stable
isotope and habitat suitability model-based approaches, geno-
mic methods require extensive expertise in laboratory and
bioinformatic methods and therefore might not be appropriate
in all situations. In addition, there are clear examples where
genetic markers alone fall short of resolving populations across
all or large parts of a species geographic range (Gagnaire et al.
2015; Toews et al. 2015). In such situations, the inclusion of
stable isotopic data and/or habitat suitability models may
increase the resolution of genetic markers on their own (Kelly,
Ruegg&Smith 2005;Rundel et al. 2013; Pekarsky et al. 2015).
For example, Rundel et al. (2013) showed that genetic and iso-
topic information can be combined to increase the assignment
accuracy of individuals (birds) to their population of origin;
however, this method was not designed to deal with disjunct
patterns of genetic variation, like that observed in theWilson’s
warbler (Ruegg et al. 2014). More recently, several authors
have used habitat suitability models to refine isotopic-based
estimates of population assignment (Hallworth et al. 2013;
Pekarsky et al. 2015;Fournier et al. 2016), but didnot establish
whether or not the use of habitat suitability as a prior actually
led to improved estimates of the geographic origin of individu-
als and also did not establish how the resulting estimates com-
pared in accuracy to genetic-based estimates.
Here, we combine genetic, stable isotope and habitat suit-
ability data into a joint assignment procedure that infers the
breeding origins of individuals collected anywhere along their
migratory trajectory with greater resolution than can be
attained using each method individually. We refine previously
developed R-code (R Core Team 2016) for performing each
type of assignment alone (Anderson, Waples & Kalinowski
2008; Bridge et al. 2013; Vander Zanden et al. 2014), making
it computationally feasible to combine assignments and per-
form statistically rigorous leave-one-out cross validation. To
assess the overall accuracy of our method in comparison to
existing approaches we examine the results from each type of
data – genetics, stable isotopes and habitat suitability – individ-ually as well as jointly, in order to determine: (i) contributions
of each data type to the accuracy of joint assignments, (ii)
insights that might be gathered from the combined approach,
and (iii) recommendations for future studies of migratory con-
nectivity based on our results.
We assess the accuracy of each method using data from a
long-distance migratory bird, the Wilson’s warbler (Cardellina
pusilla), a particularly appropriate model for testing the efficacy
of our approach because previous population-genetic/connec-
tivity studies on this species provide a solid basis for compar-
ison among methods (Kimura et al. 2002; Clegg et al. 2003;
Paxton et al. 2007; Irwin, Irwin & Smith 2011; Paxton et al.
2013; Rundel et al. 2013). We start by deriving posterior proba-
bility rasters (or other scaled ‘scores’) for each method individu-
ally (genetics, stable isotopes and habitat suitability) and then
combine those into a joint assignment probability. We then
evaluate the gains in accuracy achieved by each method indi-
vidually as well as by combining multiple data sources using
leave-one-out cross-validation with a reference set of Wilson’s
warblers sampled from known locations during the breeding
season. The combined approach is then applied to the assign-
ment of migratory birds of unknown origin at a stopover site in
Cibola, AZ during spring migration. Our methods have been
implemented in the new R-package, GAIAH (GeneticAssignment
using Isotopes And Habitat suitability), available on CRAN
(https://CRAN.R-project.org/package=gaiah). Our scripts for
using GAIAH to replicate the results in this paper are available
on GitHub (https://github.com/eriqande/gaiah-wiwa).
Materials andmethods
SAMPLING
Sampling of Wilson’s warblers is detailed in Ruegg et al. (2014).
Briefly, a collection of 357 feathers from 30 locations (average of 12
individuals/site; range: 2–25) across the breeding range was made
© 2017 The Authors. Methods in Ecology and Evolution © 2017 British Ecological Society, Methods in Ecology and Evolution, 8, 1241–1252
1242 K. C. Ruegg et al.
possible through a large collaborative effort with bird banding stations
bothwithin and outside of theMonitoringAvian Productivity and Sur-
vivorship (MAPS) and the Landbird Monitoring of North America
(LaMNA) networks. These samples became the foundation of the sub-
sequent genetic and isotopic analysis of known-origin samples. Breed-
ing samples were collected and categorized into groups based on
collection date (June 1 to July 31), signs of breeding (presence/size of a
cloacal protuberance) and life-history timetables for the Wilson’s war-
bler. To illustrate the efficacy of the combined approach to the assess-
ment of migratory stopover site use-through-time, 686migrant samples
were also collected from Cibola, AZ (31∘180N, 114∘41
0W), using consis-
tent-effort, daily, passive mist-netting from 22 March to 24 May, in
both 2008 and 2009.
GENETICS
The application of genetic markers to the assignment of Wilson’s war-
blers is detailed in Ruegg et al. (2014). Briefly, genetic samples, con-
sisting of the proximal end of one rectrix (breeding samples) and
whole blood samples (migratory samples) were purified using a Qiagen
DNeasy Blood and Tissue Kit and quantified using a NanoDropTM
Spectrophotometer (Thermo Scientific, Inc., Waltham, MA, USA).
Genotyping was done using a panel of 96 high-resolution SNP mark-
ers ascertained from a genome-wide survey of genetic variation in the
species using restriction-associated-digest, paired-end (RAD-PE)
sequencing. Analyses using STRUCTURE 2.3.4 (Pritchard, Stephens &
Donnelly 2000; Falush, Stephens & Pritchard 2003) and GENELAND
4.0.6 (Guillot, Mortier & Estoup 2005) indicated G = 6 spatially dis-
tinct population groups that could be reliably distinguished using the
96 SNPs. The spatial extent of these six groups identified by GENELAND
was overlaid, and then clipped, by the known range of Wilson’s war-
bler [downloaded from NatureServe, www.natureserve.org, (Ridgely
et al. 2005)], to create a map of the occurrence of different population
groups across the breeding range (see Fig. 1, Ruegg et al. 2014).
Breeding birds collected from locales within each population group
were included as reference samples for genetic population assignment
to assign posterior probabilities across the six genetic groups using the
program GSI_SIM (Anderson, Waples & Kalinowski 2008). For each
bird, i, this program returns an estimate of the posterior probability,
PðGi ¼ gjygeni ;BÞ; g ¼ 1; . . .;G;
that i’s genetic group (Gi) is equal to g (g denotes one of the six
genetic groups), given i’s genotype ygeni and the reference or base-
line samples, B.
These posterior probabilities refer to group membership of each
bird; however, to combine these inferences with stable isotope data
requires first converting group membership posteriors into posterior
probabilities of spatial location. As the 96 SNPs provide only limited
ability to resolve local origin of birds within each genetic group’s geo-
graphic area, we converted the genetic posteriors for the ith bird to a
grid, Mgeni , of spatially explicit posterior probabilities by distributing
the posterior probabilityPðGi ¼ gjygeni ; BÞ uniformly across the raster
grid representing the spatial range of group g, and ensuring that these
are appropriately normalized to sum to one across the whole breeding
range. Namely, within group g’s range, posterior probability is dis-
tributed according to
Mgeni ðgÞ ¼ PðGi ¼ gjygeni ;BÞUg
Cg
whereUg is a matrix (raster) containing 1s in cells within genetic group
g’s region and 0’s elsewhere, and Cg is the number of raster cells within
group g’s region (i.e. the sum of the elements of Ug). In most cases
within the reference dataset, individuals were assignedwith high proba-
bility to one genetic group and lower probability to other groups (see
Fig. 1, Ruegg et al. 2014). To represent the uncertainty in the genetic
assignments to different groups (which in most cases was very small,
see Fig. S1, Supporting Information) we spread the posterior probabil-
ity of assignment to each group across the geographic ranges of all the
groups to which the bird was assigned and then weighted the values
according to their likelihood so that the combined areas summed to 1.
Subsequently, the posterior probability of spatial assignment of birds
based on genetics and assuming a uniform prior across space is
Mgeni ¼
XGg¼1
Mgeni ðgÞ;
whose elements clearly sum to unity.Mgeni is a raster of the same extent
and resolution asMisoi (see next section).
STABLE ISOTOPES
Predictable continental patterns of stable hydrogen isotopes in precipi-
tation (d2Hp) are highly correlatedwith stable hydrogen isotopes of ani-
mal tissues (d2Hf), allowing for inferences about the origin of where
tissues were grown (Hobson & Wassenaar 2008). When the breeding
and moulting locations are the same, as is the case for Wilson’s war-
blers, then stable isotope values provide an assessment of the breeding
origin of a bird that is independent of a genetic assessment. We
expressed all isotope ratios in standard delta notation (d2H) where
d ¼ isotope ratio of sample
isotope ratio of standard� 1;
with ratios shown as parts per thousand (&) deviation from Vienna
StandardMean OceanWater for hydrogen. Prior to analysis, all feath-
ers (breeding and migratory samples) were cleaned with dilute deter-
gent followed by a 2:1 chloroform:methanol solution (Paritte & Kelly
2009). For d2H analyses, a 0�1–0�2 mg piece of feather was packed into
a silver capsule and loaded into an auto-sampling tray. Isotope ratio
measurements were performed at the University of Oklahoma with a
ThermoFinnigan Delta V isotope ratio mass spectrometer connected
to an elemental analyzer (H analyses: TC/EA, Thermo-Finnigan,Ring-
oes, NJ, USA). To control for exchangeable hydrogen, hydrogen iso-
tope ratios were normalized according toWassenaar &Hobson (2003),
using established keratin standards: chicken feathers (�147�4&), cow
(Bos taurus) hooves (�187&) and bowhead whale (Balaenamysticetus)
baleen (�108&). For additional details on our analysis methods, see
Kelly et al. (2009) and Paritte &Kelly (2009).
We created an isoscape of d2Hp and its associated variance using ISO-
MAP (Job Key 54152), an online resource to generate region- and
time-specific isoscapes for geographic assignments (Bowen et al. 2014,
www.isomap.org). In ISOMAP, a geospatial isoscape was generated
using precipitation data from 120 stations collected during the time per-
iod of 1960–2009, and includedCRU-derived climatic variables such as
elevation, precipitation and minimum precipitation in the model
(Mitchell & Jones 2005; similar to Hobson et al. 2012d). Using a para-
metric bootstrapping approach (Supporting Information 3) we con-
verted the isoscape of d2Hp values to an isoscape of d2Hf values based
on the relationship between d2Hp and d2Hf collected from the 357
known-origin, breedingWilson’s warblers sampled across the breeding
range. We then computed the posterior probability of breeding origin
given a feather d2Hf ratio and three sources of variance following the
methods used inVander Zanden et al. (2014). The three sources of vari-
ance included variance associated with; (i) the original d2Hp isoscape
© 2017 The Authors. Methods in Ecology and Evolution © 2017 British Ecological Society, Methods in Ecology and Evolution, 8, 1241–1252
Identifying migrant origins with multiple data types 1243
generated in ISOMAP, (ii) the rescaled precipitation to feather d2H iso-
scape, and (iii) individual variation in d2Hf among birds sampled at the
same breeding location.
Specifically, this approach assumes that yisoi , the isotope ratio mea-
sured in the feather of the ith bird, is a normal random variable with
mean and variance determined by its location in space. If these means
and variances, denoted by the matrices T(l) and Tðr2Þ, respectively,were known across a regular grid of possible origin locations, then it
would be straightforward to compute the posterior probability of
breeding location. Namely, assuming a uniform prior on spatial origin,
the posterior that bird i originated from the (r, c)th cell in the grid is
proportional to the density of observing yisoi given it was drawn from a
normal density withmeanTðlÞr;c and varianceT
ðr2Þr;c (the (r, c)th elements
ofT(l) andTðr2Þ respectively).
It should be noted that T(l) and Tðr2Þ are not known, so we follow
Vander Zanden et al. (2014) by using eTðlÞand eTðr2Þ
in their place,
computed as
eTðlÞ ¼ �aPðlÞ þ �b eqn 1
eTðr2Þ ¼ Rðr2Þ þ Pðr2Þ þ r2indivJ; eqn 2
where P(l) and Pðr2Þ are the predictions and associated variances,
respectively, for the precipitation isotope ratios from ISOMAPmade on
the same grid as eTðlÞand eTðr2Þ
; J is a matrix of 1’s of the same dimen-
sion as eTðr2Þ;Rðr2Þ, �a and �b, are determined by a parametric bootstrap-
ping approach described in Supporting Information 3; and r2indiv is a
term accounting for individual variation in isotope ratios which was set
to the square of the mean of the standard deviation of yisoi among birds
Habitat alone Genetics alone
Isotopes alone G = 1, I = 1, H = 1
G = 1, I = 1, H = 1
40
50
60
70
40
50
60
70
−175 −150 −125 −100 −75 −50 −175 −150 −125 −100 −75 −50
Long
Lat
0·000
0·001
0·002
0·003
0·004Prob
Habitat alone Genetics alone
Isotopes alone
40
50
60
70
40
50
60
70
−175 −150 −125 −100 −75 −50 −175 −150 −125 −100 −75 −50
Long
Lat
0·0000
0·0025
0·0050
0·0075
Prob
(a)
(b)
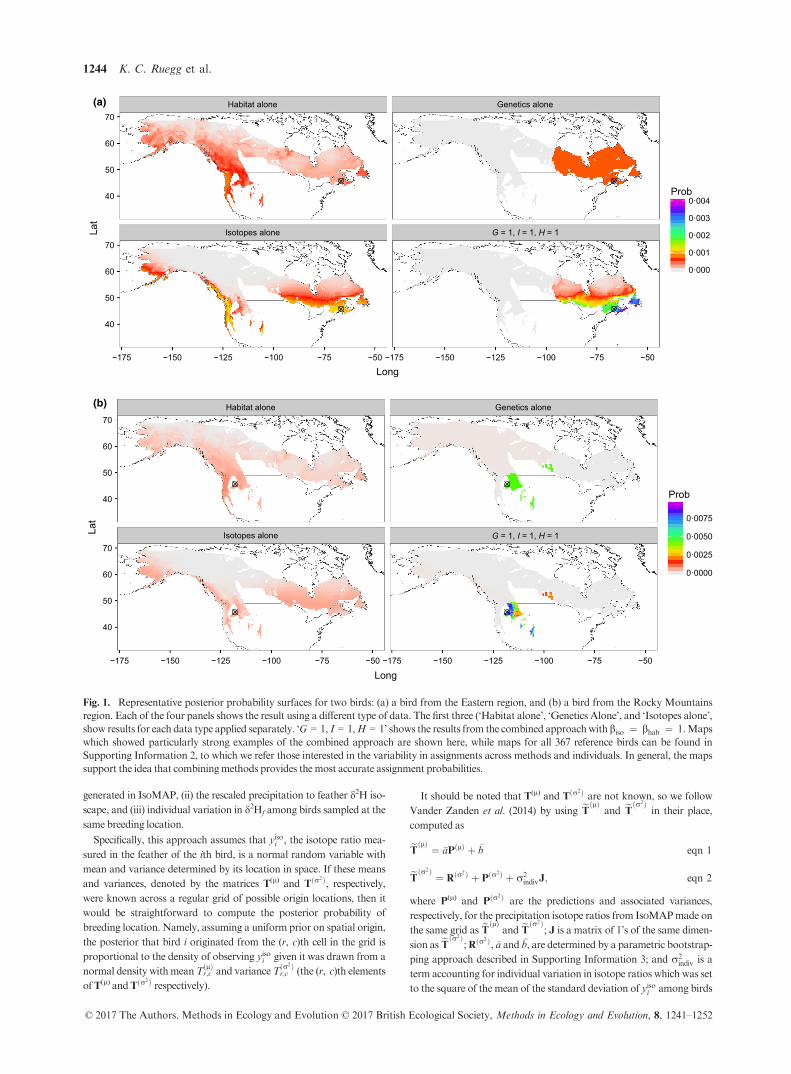
Fig. 1. Representative posterior probability surfaces for two birds: (a) a bird from the Eastern region, and (b) a bird from the Rocky Mountains
region. Each of the four panels shows the result using a different type of data. The first three (‘Habitat alone’, ‘Genetics Alone’, and ‘Isotopes alone’,
show results for each data type applied separately. ‘G = 1, I = 1,H = 1’ shows the results from the combined approachwithbiso ¼ bhab ¼ 1.Maps
which showed particularly strong examples of the combined approach are shown here, while maps for all 367 reference birds can be found in
Supporting Information 2, to which we refer those interested in the variability in assignments across methods and individuals. In general, the maps
support the idea that combiningmethods provides themost accurate assignment probabilities.
© 2017 The Authors. Methods in Ecology and Evolution © 2017 British Ecological Society, Methods in Ecology and Evolution, 8, 1241–1252
1244 K. C. Ruegg et al.
sampled at common locations across the breeding range during the
breeding season. Posterior probabilities derived in this manner for bird
i are a set of values over a spatial grid. Setting values outside of the
known breeding range to zero and normalizing to sum to one gives the
matrix,Misoi .
HABITAT SUITABIL ITY
In order for subspecies ranges to be further classified in terms of their
utilization by breeding individuals, habitat suitability models were con-
structed for Wilson’s warblers across their breeding range. This was
performed by identifying the geographical locations of Wilson’s war-
blers during the breeding season, and then modelling the relationship
of these occurrences to the environmental conditions at those sites. This
model was then used to predict the probability of occurrence of individ-
uals across the species range.
Locations of individuals were extracted from the eBird website
(www.ebird.org). To ensure that we used only those birds that were
breeding (or at least were located on breeding grounds), we filtered the
nearly 450 000 records of Wilson’s warblers available to include only
those sighted on or after 10 June, but before 1 August, of any given cal-
ender year. To avoid redundant observations at the same site artificially
influencing models, we used each unique geographic location only
once. The final dataset contained 9984 unique locations of Wilson’s
warblers on breeding grounds.
We used the machine learning algorithm MAXENT 3.3.3 (Phillips,
Anderson & Schapire 2006) to modelWilson’s warbler distributions. As
this method relies only on presence data (i.e. it does not require records
of Wilson’s warbler absence), it is particularly well-suited for the use of
eBird occurrence records to capture complex biological responses to
environment (Elith et al. 2011), and has performed well in previous sta-
tistical comparisons with other species distributionmodelling techniques
(Harrigan et al. 2014). Environmental variables were chosen to best
reflect unique predictive ability, and variables were removed from final
analyses when a Pearson’s correlation coefficient was >0�7 among the
variable and any other predictor. We ran three replicates of a MAXENT
model using the Wilson’s warbler records as a response variable and 14
climate and landscape variables as predictors. These included eight
(among 19 available) bio-climatic layers (Bio 1, 2, 4–6, 12, 15, 19, down-
loaded from www.worldclim.org) as well as variables representing land-
cover, tree cover, elevation and vegetation characteristics and
heterogeneity [Normalized Difference Vegetation Index (NDVI) mean
and standard deviation] downloaded from theGlobal LandCoverFacil-
ity (www.landcover.org). Default parameters were used for all MAXENT
runs except for the following: clamping turned off, a maximum of
100 000backgroundpoints selected and 20%of datawithheld for subse-
quent testing. In addition, both predictor response curves, aswell as jack-
knifing to assess variable importance, were created as part of the output.
Once final models were evaluated and found to converge on similar
response curves and probability estimates, the mean output ascii file
was exported to ArcGIS and was clipped to the extent of the breeding
range ofWilson’s warbler, as determined using digital range maps pro-
vided by NatureServe (www.natureserve.org; Ridgely et al. 2005).
These final probability estimates were then downsampled in resolution
to yield a rasterMhab with the same extent and resolution asMgeni and
Misoi .
COMBIN ING DATA TYPES
The above approaches yieldMgeni andMiso
i for the ith bird, as well as a
prior probability of occurrence of a Wilson’s warbler in any location,
Mhab. Treated as matrices of probabilities, these rasters can be com-
bined using Bayes’ rule to obtain a combined estimate of probability of
spatial origin for each bird. In order to explore weighting the different
sources of information (genetics, stable isotopes and habitat) differ-
ently, we considered incorporating the parameter b ¼ ðbiso; bhabÞ thatdetermines the relative amount of weight given to the stable isotope
and habitat data, and hence compute the combined probability as
Mcombi ðbÞ ¼ 1
CðbÞMgeni ðMiso
i Þbiso ðMhabÞbhab ; eqn 3
where (M)b denotes the matrix M with every element raised to the
power b. C(b) is a normalizing constant that ensures that the elements
of Mcombi ðbÞ sum to one. It can be easily found for any
b ¼ ðbiso; bhabÞ by simply summing over all the elements of the unnor-
malizedmatrix.
Among the different genetic groups of birds, the relative utility of iso-
topic data vs. habitat suitabilitymay vary. In theory, one could leverage
this to advantage by choosing different values of biso and bhab for birdsthat are assigned with genetics to particular genetic groups. However,
doing so accurately would require sampling of reference birds propor-
tionally with respect to their true density on the landscape, which may
not be the case with the genetic samples used herein, which were
obtained opportunistically from bird banding stations. Accordingly,
while we explored a range of values of ðbiso; bhabÞ, for all results in the
paper we used values of biso ¼ bhab ¼ 1.
ASSESSMENT OF ACCURACY
To assess the extent to which the inclusion of stable isotope and habitat
data improve the spatial localization of birds on the breeding grounds
we test how well birds of known breeding location (those in the refer-
ence dataset) can be inferred using genetics alone, stable isotopes alone,
habitat suitability alone or a combination of each. When doing so with
the reference birds, we use a leave-one-out procedure, removing indi-
vidual i from the reference dataset when computingMgeni andMiso
i .
To assess accuracy we develop an easily interpreted metric, Spmi , the
posterior mean of great circle distance between the true location of i
and inferred locations. This is found by averaging the distance between
i’s true location and the centre of every cell in the breeding range,
weighted by Mi. In order to assess the accuracy of genetics, stable iso-
topes or habitat used separately or together, we compute Spmi with
Misoi ,Mgen
i ,Mhab orMcombi ðbÞ respectively.
ASSIGNMENT OF UNKNOWN MIGRATORY BIRDS –
EXAMPLE DATASET
To illustrate the efficacy of the combined approachwe applied the com-
bined approach to a set of migratory birds of unknown origin captured
at a stopover site in Cibola, AZ during springmigration. For each bird,
we determined the combined probability of origin using eqn (3), creat-
ing a matrix of probability assignments, Mcombi , for each migrant. We
then calculated the posterior mean migration distance remaining from
the stopover site by averaging the distance between the stopover site
and the centre of every cell in the breeding range, weighted byMcombi .
Results
GENETICS
As previously reported (Ruegg et al. 2014), the maximum-
a-posteriori self-assignments of the reference birds using
© 2017 The Authors. Methods in Ecology and Evolution © 2017 British Ecological Society, Methods in Ecology and Evolution, 8, 1241–1252
Identifying migrant origins with multiple data types 1245
genetic data showed that a high fraction (88�2%) of birds are
correctly assigned to their true region of origin. The rate of cor-
rect assignment varied across regions, with the lowest rate of
correct assignment occurring in Coastal California (78%), fol-
lowed by Rocky Mountain (81%), Pacific Northwest (85%),
California Sierra (86%), Alaska to Alberta (95%) and Eastern
North America (100%). Of the birds that are assigned cor-
rectly, their average maximum posterior is 96% and when
birds are incorrectly assigned to their true region of origin, the
average maximum posterior is 74%. This confirms that when
genetic assignments are incorrect, isotopes and suitability have
the potential to increase posteriors, and thereby improve local-
izations in joint assignments.
STABLE ISOTOPES
Across theWilson’s warbler breeding range, d2Hp values range
from �14�3& to �190�6& with uncertainty across the d2Hp
isoscape varying (SD: 8�5& to 21�6&) as a result of the uneven
distribution of precipitation stations used to model d2Hp.
Regions with the greatest uncertainty in d2Hp values included
coastal Alaska, Northwest Territories and Newfoundland.
The rescaling equation used to convert the d2Hp isoscape to a
d2Hf isoscape was d2Hf = 0�74(d2Hp) � 38�01; that is, in
eqn (1), �a ¼ 0�74 and �b ¼ �38�01. The standard deviation
associated with the rescaled precipitation to feather d2H iso-
scape, R(r), ranged from 0�6& to 6�6&, while the mean,
within-site standard deviation of d2Hf from the 357 Wilson’s
warblers of known breeding origin sampled across 30 locations
was rindiv = 12�5& (Table S1). The total variability, T(r),
including the three sources of uncertainty, contained standard
deviation values ranging between 15�2& and 24�9&, depend-
ing on the geographic region of assignment.
HABITAT SUITABIL ITY
Habitat suitability model runs yielded accurate species proba-
bility of occurrence maps according to several criteria. First,
the mean score of all replicates using only data withheld for
testing was high, with an AUC = 0�938. Standard deviations
in AUC between each replicate run were minimal (lowest
AUC = 0�937, highest AUC = 0�939). Additionally, environ-
mental predictors deemed most important in explaining pres-
ence of Wilson’s Warblers were consistent across all replicate
runs, with Bio 19 (Precipitation of the coldest quarter), Bio 5
(Maximum temperature of the warmest month) and Bio 4
(Temperature Seasonality) contributing to over 70% of the
variation in occurrence explained by the MAXENT model.
Finally, our final map displaying the point-wise mean proba-
bility of occurrence (Fig. S2) closely matched previously pub-
lishedmaps of the species distribution ofWilson’sWarbler [for
instance, probability of occurrence was consistently <0�23 in
regions outside of the species range, and habitat suitability gen-
erally identified regions that were also found to harbour high
abundance of Wilson’s warblers according to previously pub-
lished data (Status of Birds in Canada, Peter Blancher, based
on BBS abundancemap estimates)].
From predictor response curves, we found that increases in
precipitation in the coldest quarter (Bio19) and temperature in
the warmest month (Bio5) led to increases in the probability of
Wilson’s warbler occurrence, whereas increases in temperature
seasonality (Bio4) led to decreases in probability of occurrence
(Fig. S2). These relationships resulted in several regions of high
habitat suitability being identified within the Wilson’s warbler
range, including much of the Pacific coastline, the Sierra
Nevada Mountain range, parts of the Rocky Mountain range
and the CanadianMaritimes for eastern breeding populations.
COMPARISON OF DATA TYPES
Overall, combining genetics, isotopes and habitat suitability
improved the inference of breeding origin ofWilson’s warblers.
The posterior mean great circle distance between the true loca-
tion and inferred location for nearly every bird in the reference
dataset was decreased by combining all three sources of data
(Fig. 2). Of the three individual data sources, genetic data pro-
vided themost accurate localization of individuals, while stable
isotope assignments and the habitat suitability prior used alone
resulted in significantly less accurate localization. There were
also significant differences in the accuracy of assignments of
the reference birds to breeding location based upon geographic
region (Fig. 3): genetic assignments performed best in all
regions; for birds originating from the Pacific Northwest, the
Sierras and the Rocky Mountains, more accurate assignments
were achieved by using the prior information fromhabitat suit-
ability than using data on stable isotopes alone; and conversely
isotope-only assignments outperformed assignments using just
the habitat suitability prior in Coastal California and the East-
ernUnited States.
EXAMPLE DATA – TIMING OF MIGRATION IN PACIF IC
NORTHWEST WILSON’S WARBLERS
In order to illustrate our combined approach on real-world
migratory data, we calculated the posterior mean remaining
migratory distance of birds sampled from Cibola, AZ during
the springmigrations of 2008 and 2009. A general pattern, pre-
viously suggested in Ruegg et al. (2014), of birds en route to
Coastal California migrating through before birds en route to
the Pacific Northwest, the Sierras and Alaska to Alberta, was
reinforced using our combined-data approach (Fig. 4a). In
addition, we found previously undetected patterns in the tim-
ing of migrants en route to the Pacific Northwest, with
migrants headed to the southern Pacific Northwest arriving
earlier than migrants en route to northern Pacific Northwest.
These results were concordant across both years (Fig. 4b).
Discussion
Tracking the origins of migratory animals using non-invasive,
intrinsic marking techniques has been a particularly challeng-
ing endeavour for movement ecologists. Here we develop a
streamlined method for combining three independent data
sources (genetics, stable isotopes and habitat suitability
© 2017 The Authors. Methods in Ecology and Evolution © 2017 British Ecological Society, Methods in Ecology and Evolution, 8, 1241–1252
1246 K. C. Ruegg et al.
models) that improves upon the accuracy of each method
when used on its own. Using leave-one-out cross validation to
compare the relative accuracy of each method independently,
we find that genetic data alone provide the most accurate esti-
mation of the true origin of our reference birds, consistently
outperforming assignments based upon stable isotopes and
habitat suitability models (Figs 1 and 3). Improvements to the
R-code for batch isotopic and genetic assignments initially
developed by Vander Zanden et al. (2014) and Anderson,
Waples & Kalinowski (2008), respectively, were compiled into
an R-package called GAIAH in an effort to make future imple-
mentations of the resulting combined approach for generating
joint Bayesian probability surfaces feasible across a broad
range of migratory systems. Below we discuss region- and data
type-specific differences in the assignments, illustrate the utility
of our combined method for uncovering new patterns of con-
nectivity across time in birds captured during springmigration,
and discuss the implications of our results for future studies
considering limitations in both time and resources.
ACCURACY OF EACH DATA TYPE RELATIVE TO THE
COMBINED APPROACH
Our results indicate that while the joint assignment method
consistently provided the best approximation of the true origin
of birds in our reference sample (Figs 3 and 2), the accuracy of
genetic assignments on their own far exceeded that of assign-
ments based on stable isotopes or habitat suitability models. In
general, the inclusion of habitat suitability and stable isotope
data helped to localize assignments within regions identified by
strong genetic assignment probabilities and, in some cases,
helped correct misassignments based on genetic data alone.
Surprisingly, for many birds originating from western regions
(the RockyMountains, the Pacific Northwest and the Sierras),
simply using the habitat suitability prior alone provided a bet-
ter inference of the true origin of individuals than did stable
Genetics Habitat Isotopes
0
1000
2000
3000
4000
500 1000 1500 2000 500 1000 1500 2000 500 1000 1500 2000
(km), data sources combined
(km
),si
ngle
data
sour
ce
RegionAlaska to Alberta
Pacific Northwest
Coastal California
Sierra
Rocky Mountain
Eastern
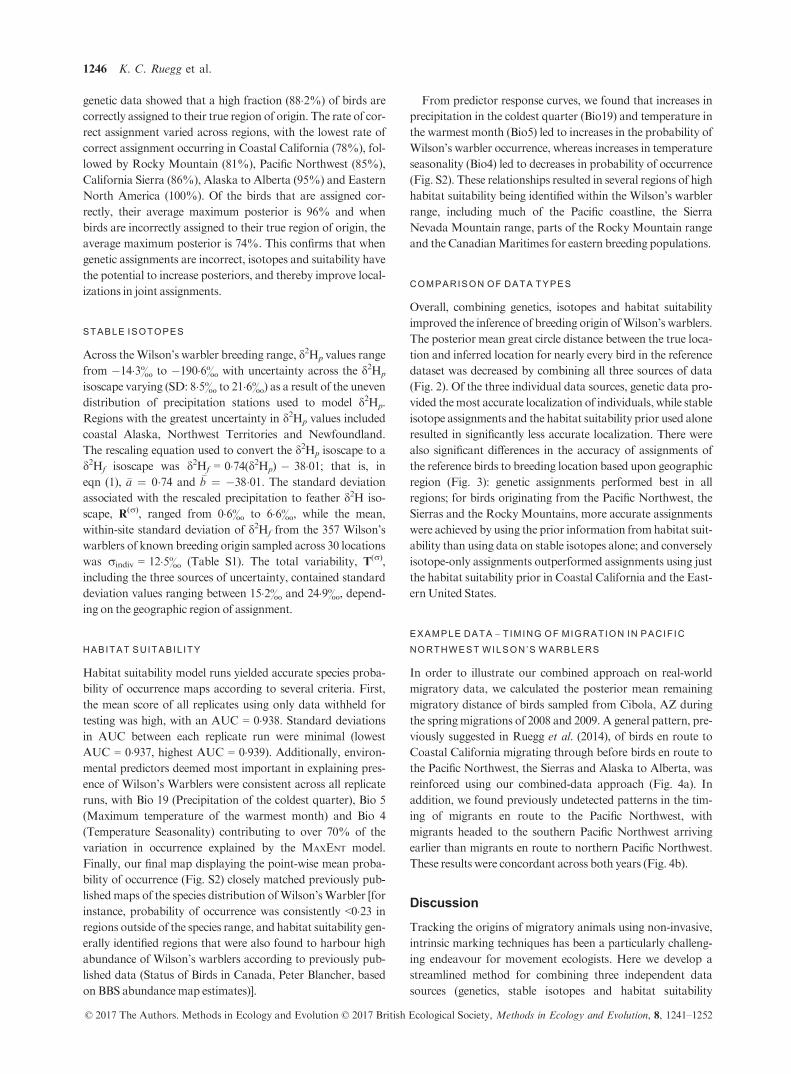
Fig. 2. Acomparison of the posteriormean great circle distances,Spmi , between individual data types and the combined approach. Each point repre-
sents one bird. In all panels the x-axis shows Spmi using all data sources combined and the y-axis shows Spm
i when using a single data source. The
proximity of the points to the y = x line shows howwell eachmethod does compared to the combined approach. The results clearly demonstrate that
genetic data provide the most accurate inference of the true origin, while habitat suitability and stable isotope data provide more modest improve-
ments. Nonetheless the fact that the majority of points lie above the y = x line in the ‘genetics’ plot confirms that the addition of habitat and stable
isotope data improves the inference of breeding origin (as all the points would fall on the y = x line if the inclusion of stable isotopes and habitat did
not change the inferencesmadewith genetics alone).
Alaska to Alberta Pacific Northwest Coastal California
Sierra Rocky Mountain Eastern
0
1000
2000
3000
4000
0
1000
2000
3000
4000
Com
bo
Gen
etic
s
Hab
itat
Isot
opes
Com
bo
Gen
etic
s
Hab
itat
Isot
opes
Com
bo
Gen
etic
s
Hab
itat
Isot
opes
Data type used
(km
)
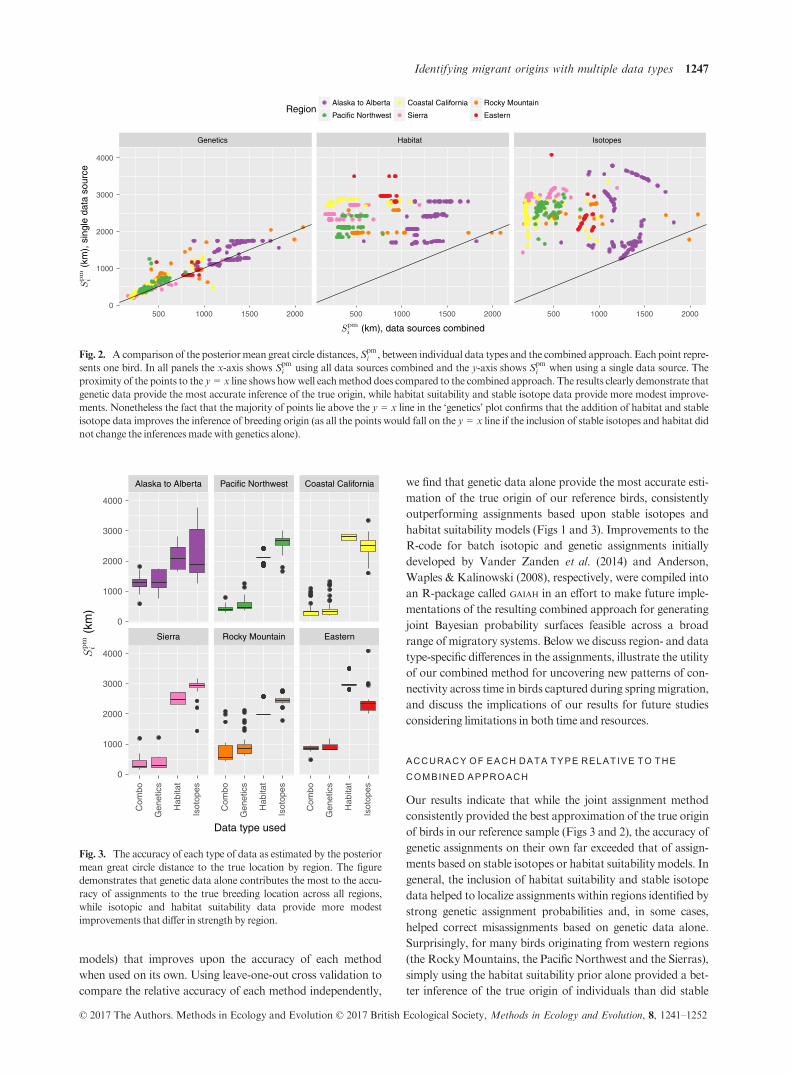
Fig. 3. The accuracy of each type of data as estimated by the posterior
mean great circle distance to the true location by region. The figure
demonstrates that genetic data alone contributes the most to the accu-
racy of assignments to the true breeding location across all regions,
while isotopic and habitat suitability data provide more modest
improvements that differ in strength by region.
© 2017 The Authors. Methods in Ecology and Evolution © 2017 British Ecological Society, Methods in Ecology and Evolution, 8, 1241–1252
Identifying migrant origins with multiple data types 1247
hydrogen isotope data. We hypothesize that this result is lar-
gely driven by high environmental variability in Western
North America, which contributes to the informativeness of
the suitability models in this region, and to the similarity in
stable hydrogen isotopes between eastern and western parts of
North America at equivalent latitudes, which contributes to
the reduction in accuracy of stable istope-based assignments in
species with cross continental distributions (Hobson &Wasse-
naar 2008). We acknowledge that the differences in accuracy
between the methods assessed herein is in part a due to the
cross-continent distribution of our study species, the Wilson’s
warbler, which poses particular challenges for stable istope-
based analysis and that more data are needed to assess the gen-
ralizability of our accuracy findings across othermigratory sys-
tems. Overall, our result supports the idea that while genetic
data provide the most accurate method for tracing the origins
of species with as much genetic diversity as the Wilson’s war-
bler, there is value in combining all threemethods.
While the development of our new R-package, GAIAH,
has streamlined the process of data integration, there
remain a number of ways to improve upon population
assignment methods using intrinsic markers. For example,
the power of genetics for population assignment demon-
strated herein is part due to the fact that our genetic infer-
ences are based upon 96 variables (corresponding to the 96
SNPs), while our isotope inferences are based on a single
variable (hydrogen isotopes). In the future, the combination
of multiple stable isotopes (e.g. carbon, nitrogen, sulphur)
into a multivariate assignment framework could improve
the accuracy of single isotope-based assignments as has
been demonstrated in numerous other taxa (Sellick et al.
2009; Hobson, Møller & Van Wilgenburg 2012b; Garc�ıa-
P�erez & Hobson 2014; Veen et al. 2014). At the same time,
it is now routine to screen hundreds of thousands of SNP
markers with similar levels of effort which could simultane-
ously increase the power of genetic-based assignments
(Andrews et al. 2016).
In addition, our results indicate that it remains difficult to
identify individuals originating from the region spanning from
Alaska to Alberta. This may be due in part to the absence of
precipitation stations needed for the construction of high-reso-
lution isoscapes and habitat suitability models in this region
and/or to the limited number of genetic samples from across
the same area. Thus, in the future, all three methods could be
improvedwith additional environmental and genetic sampling.
Lastly, significant improvements to all three methods could be
made by constraining assignments to smaller geographic areas
within a species range using prior information from band
returns or morphometrics (Hobson et al. 2009; Van Wilgen-
burg & Hobson 2011). For example, in the case of Wilson’s
warblers migrating through Cibola, AZ, assignments could be
constrained to the western breeding region based upon an
absence of eastern breeders in band return records from this
region. While restricting assignments to the western region
would significantly increase the accuracy of all three methods,
it would have the biggest impact on stable isotope-based
assignments because of similarity in stable hydrogen isotopes
in eastern and western regions at the same latitude and the
strong latitudinal effect on d2Hp.
It is important to note that our results are based upon a sin-
gle species and one might wonder whether they are limited to
Wilson’s warblers or whether they will be applicable across
other migratory systems.While we do not have the data herein
to test the generality of the differences in accuracy between the
three methods in species beyond Wilson’s warblers, there are
cases where assignments based on genetic data will not
2008 2009
1000
2000
3000
4000
80 100 120 140 80 100 120 140
Days since January 1
Post
erio
r mea
n re
mai
ning
mig
ratio
n di
stan
ce (k
m)
Genetically−assigned regionAlaska to Alberta
Pacific Northwest
Coastal California
Sierra
900
1200
1500
1800
2100
80 100 120 80 100 120
Days since January 1
Post
erio
r mea
n re
mai
ning
mig
ratio
n di
stan
ce (k
m)
(a)
(b) 2008 2009
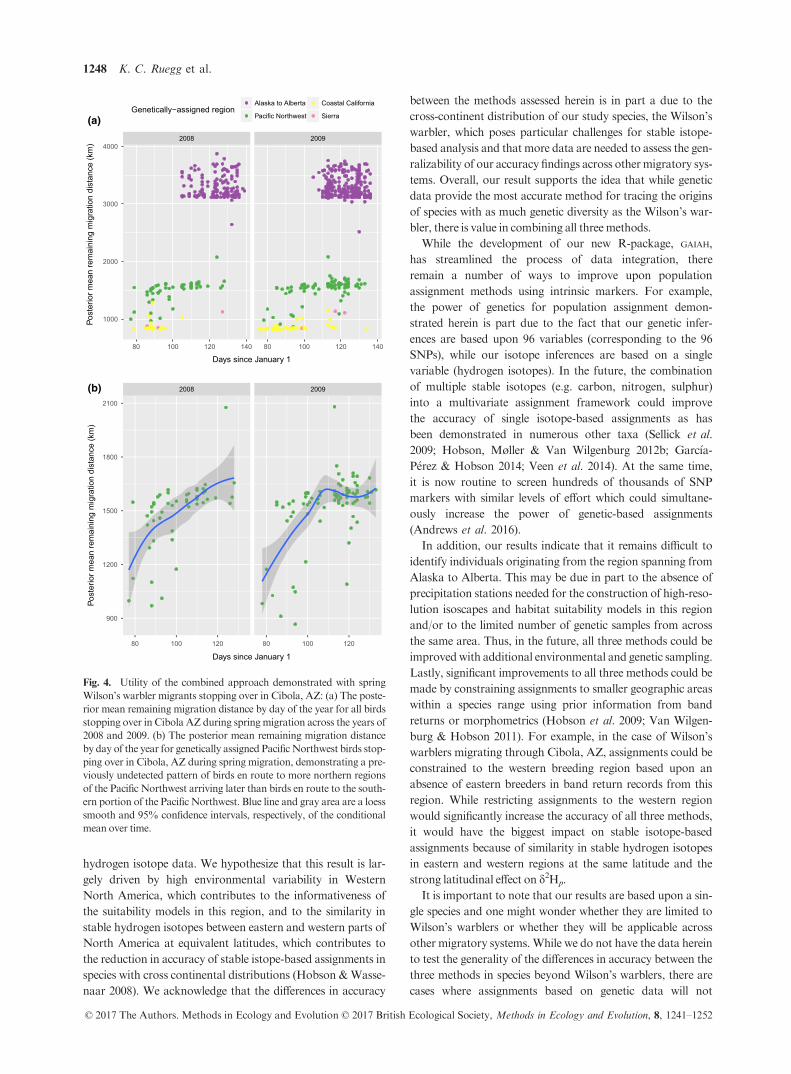
Fig. 4. Utility of the combined approach demonstrated with spring
Wilson’s warbler migrants stopping over in Cibola, AZ: (a) The poste-
rior mean remaining migration distance by day of the year for all birds
stopping over in Cibola AZ during spring migration across the years of
2008 and 2009. (b) The posterior mean remaining migration distance
by day of the year for genetically assigned PacificNorthwest birds stop-
ping over in Cibola, AZ during spring migration, demonstrating a pre-
viously undetected pattern of birds en route to more northern regions
of the Pacific Northwest arriving later than birds en route to the south-
ern portion of the PacificNorthwest. Blue line and gray area are a loess
smooth and 95% confidence intervals, respectively, of the conditional
mean over time.
© 2017 The Authors. Methods in Ecology and Evolution © 2017 British Ecological Society, Methods in Ecology and Evolution, 8, 1241–1252
1248 K. C. Ruegg et al.
perform as well, and cases where assignments based on stable
isotopes and habitat suitability models will performbetter. For
example, genetic-based assignments will perform worse when
genetic variation changes more gradually as a function of geo-
graphic distance (i.e. isolation-by-distance) rather than being
separated into discrete groups as in the case of the Wilson’s
warbler. This may occur in species that underwent range
expansions out of a single glacial refugium and are not under
strong selection for local adaptation. In these cases, it would be
possible to construct the genetic posterior matrices, Mgeni , by
using an assignment approach designed to deal with continu-
ous spatial data (Wasser et al. 2004; Ra~nola, Novembre &
Lange 2014). Such an approach is implemented in the package
ISOSCAT (Rundel et al. 2013), but could be improved by incor-
porating a genetic model that allows for allele frequencies to
change non-linearly with geography (e.g. Ra~nola, Novembre
& Lange 2014). There are also examples of situations where
stable isotopes alone providedmore accurate assignments than
in the case of the Wilson’s warbler. For example, stable iso-
topes have stronger power in delineating the origin of migra-
tory species with geographic distributions that span large
latitudinal gradients with little longitudinal variation. Exam-
ples of migratory birds in North America that have been
shown to be particularly well suited to stable isotope analysis
include, the black-throated blue warbler, Setophaga caerules-
cens Golden-winged Warblers, Vermivora chrysoptera and the
black-and-white warbler, Mniotilta varia (Chamberlain et al.
1996; Rubenstein et al. 2002; Paxton & Moore 2015; Streby,
Andersen & Buehler 2016). In conclusion, future work in will
reveal the extent to which the genetic-based assignments in spe-
cies without strong population structure can be used in combi-
nation with stable isotope and habitat suitability-based
assignments in species whose ranges span regions of high stable
isotope and environmental variability.
DEMONSTRATION OF THE UTIL ITY OF THE COMBINED
APPROACH
We demonstrated the utility of the combined method by
assigning 686Wilson’s warblers migrating through Cibola, AZ
during the spring of 2008 and 2009, back to their most proba-
ble breeding destination. The results identify previously unde-
tected patterns in the timing of migrants en route to the Pacific
Northwest, with Wilson’s warblers en route to more southern
locations in Northern California migrating through earlier
than birds en route to more northern locations near theWash-
ington, British Columbia boarder (Fig. 4b). These results were
consistent across years and further corroborate similar pat-
terns of leap-frog migration in westernWilson’s warblers iden-
tified in previous work on a much coarser continental scale
(Clegg et al. 2003; Paxton et al. 2007, 2013; Rundel et al.
2013). Interestingly, similar leapfrog patterns were not seen in
migrants en route to breeding regions ranging from Alberta to
Alaska (Fig. 4), but is not clear whether this is due to a lack of
resolution in the markers or the lack of a leap-frog pattern in
this region. In addition, similar leapfrog patterns were also not
observed within the California population where genetic
resolution was high and stable isotopes provided the second
most informative measure of the true location of reference
birds. Overall these data illustrate the power of the combined
approach for identifying fine-scale patterns in migratory
behavior which have not been detected using any other
methodology to date.
RECOMMENDATIONS FOR FUTURE MIGRATORY-
CONNECTIV ITY STUDIES
Our results suggest that if time andmoney is not a limiting fac-
tor then there is utility in combining all three approaches.
However, because high-resolution genetic markers alone pro-
vide a nearly optimal estimation of assignment accuracy with-
out the need for additional data sources, researchers that are
working on species with as much population genetic structure
as the Wilson’s warbler and that have access to the necessary
genetic tools should consider investing in genomic approaches.
The utility of SNP-based approaches for population assign-
ment will be most apparent when high volumes of samples are
to be screened because at that point the per individual cost of
screening becomes less. Furthermore, once a basemap of
genetic variation across geographic space (i.e. a genoscape) has
been produced, it can be used for many other purposes such as
the identification of biologically meaningful population
boundaries, studies of introgression, hybridization, parentage,
kinship and effective population size (Andrews et al. 2016;
Garner et al. 2016). That being said, it is important to recog-
nize that the development of high-resolution genetic markers
requires substantial initial investments in highly trained per-
sonnel able to process genome-wide data, as well as in sequenc-
ing and reagent costs. In contrast, there are a number of
aspects of stable isotope and habitat suitability-based
approaches that make them more widely applicable and cost
effective. First, the technical expertise required to implement
stable isotope-based methods is less because of the accessibility
of reputable isotope labs that are able to routinely process sam-
ples using a comparative equilibrium approach (Wassenaar &
Hobson 2003). Furthermore, the fact that habitat suitability
models can be constructed using freely available records of ani-
mal locations (in this case from eBird) and associated environ-
mental variables makes them the easiest to implement of all
three methods and we recommend their incorporation when-
ever possible. Second, unlike genoscapes which will differ
depending upon the natural history of the organism and must
be created from scratch for each new species, isoscapes and
habitat suitability models are more easily transferable across
species because their construction is dependent upon known
biogeochemical processes (temperature, relative humidity,
rainfall, etc) common across landscapes. Lastly, as mentioned
above, there are numerous examples were isotope-based meth-
ods will preform better than in the case of theWilson’s warbler
and in these cases the combination of habitat suitabilitymodels
and multiple stable isotopes analyzed in a multivariate frame-
work may provide an appropriate level of resolution for the
questions at hand. In conclusion, while it is hard to understate
the power of SNP-based approaches for population
© 2017 The Authors. Methods in Ecology and Evolution © 2017 British Ecological Society, Methods in Ecology and Evolution, 8, 1241–1252
Identifying migrant origins with multiple data types 1249
assignment in species with similar levels of population struc-
ture to the Wilson’s warbler, researchers must consider the
biology of the organism, the number of samples to be screened,
and the other potential uses of the resulting genetic data when
considering an investment in genome-wide methods for studies
of migratory connectivity.
Conclusions
Identifying the population of origin ofmigratory animals using
intrinsic-marker techniques is now feasible at increasingly
small spatial scales. Here, we show that genetic assignments far
outweigh the accuracy of assignments based on stable isotopes
or habitat suitability models alone in species with similar levels
of population structure to the Wilson’s warbler. Thus, when
logistically possible, the inclusion of all three data sources
(genetics, stable isotopes and habitat suitability) can serve to
refine genetic-only estimates. As in the case of the Wilson’s
warbler, the combination of all three sources of data can reveal
previously undetected patterns in the timing of migratory
events. Overall, initial (seemingly large) investments in devel-
oping high-resolution genetic markers must be weighed on a
case-by-case basis, but undoubtedly provide a high return on
investment for heavily managed species or species for which
high volumes of samples are to be screened. Our results pro-
vide methodological recommendations and a framework for
analysis that can be used to facilitate future advances in the
field of movement ecology including the discovery of new
migratory pathways and cryptic migratory species, as well as
the tools necessary to manage declining taxa in the face of
rapid ecological changes.
Authors’ contributions
K.C.R. coordinated the collaboration and wrote the manuscript with contribu-
tions from all authors. E.C.A. wrote the R-package and carried out the majority
of the analysis, while K.L.P. carried out the analysis of the isotopic data and
R.J.H. developed the habitat suitability models. J.F.K. contributed the isotopic
data and F.M. and T.B.S. facilitated sample collections and provided guidance
and institutional support.
Acknowledgements
We thank Eli Bridge and Hanna Vander Zanden for discussions about isotopic
assignment test methods and for sharing the R-code they used to perform isotope
assignments and to Hanna Vander Zanden for her comments on an earlier ver-
sion of this manuscript. We also thank the Institute for Bird Populations and
MAPS, MoSI, LaMNA networks and the Migratory Bird Research Group for
sample coordination and contribution. Funding for this work was made possible
by grants from the California Energy Commission toK.C.R. (POEA01-Z01) and
to K.C.R. and T.B.S. (EPC-15-043) as well as grants from the National Science
Foundation to R.J.H. (PD-08-1269) and F.M. (IOS-0844703). This work was
also supported by a grant from the Environmental ProtectionAgency (R 833778)
to T.B.S. and generous donations fromMargery Nicolson, an anonymous donor
andFirst Solar Inc.
Data accessibility
The methods introduced in this paper are implemented in the R package GAIAH
(https://CRAN.R-project.org/package=gaiah) which also includes the data. The
R package and additional scripts to recreate all the results in this paper are
archivedwithDryad https://doi.org/10.5061/dryad.sv8n7 (Ruegg et al. 2017).
References
Allendorf, F.W., Hohenlohe, P.A. & Luikart, G. (2010) Genomics and the future
of conservation genetics.NatureReviewsGenetics, 11, 697–709.Anderson, E.C., Waples, R.S. & Kalinowski, S.T. (2008) An improved method
for predicting the accuracy of genetic stock identification. Canadian Journal of
Fisheries and Aquatic Sciences, 65, 1475–1486.Andrews, K.R., Good, J.M., Miller, M.R., Luikart, G. & Hohenlohe, P.A.
(2016)Harnessing the power of RADseq for ecological and evolutionary geno-
mics.Nature ReviewsGenetics, 17, 81–92.Arlt, D., Low,M. &P€art, T. (2013) Effect of geolocators onmigration and subse-
quent breeding performance of a long-distance passerinemigrant.PloSOne, 8,
e82316.
Bonfil, R., Me€yer, M., Scholl, M.C., Johnson, R., O’Brien, S., Oosthuizen, H.,
Swanson, S., Kotze, D. & Paterson,M. (2005) Transoceanic migration, spatial
dynamics, andpopulation linkages of white sharks. Science, 310, 100–103.Bowen, G.J., Liu, Z., Vander Zanden, H.B., Zhao, L. & Takahashi, G. (2014)
Geographic assignment with stable isotopes in IsoMAP. Methods in Ecology
and Evolution, 5, 201–206.Brattstr€om,O.,Wassenaar, L.I., Hobson,K.A.&�Akesson, S. (2008) Placing but-
terflies on the map–testing regional geographical resolution of three stable iso-
topes in Sweden using the monophagus peacock Inachis io. Ecography, 31,
490–498.Bridge, E.S., Kelly, JF., Contina, A., Gabrielson, R.M.,MacCurdy, R.B. &Win-
kler, D.W. (2013) Advances in tracking small migratory birds: a technical
review of light-level geolocation. Journal of FieldOrnithology, 84, 121–137.Chamberlain, C., Blum, J., Holmes, R., Feng, X., Sherry, T. &Graves, G. (1996)
The use of isotope tracers for identifying populations of migratory birds.
Oecologia, 109, 132–141.Clegg, S.M., Kelly, J.F., Kimura, M. & Smith, T.B. (2003) Combining genetic
markers and stable isotopes to reveal population connectivity and migration
patterns in a Neotropical migrant, Wilson’sWarbler (Wilsonia pusilla).Molec-
ular Ecology, 12, 819–830.Cryan, P.M., Stricker, C.A. & Wunder, M.B. (2014) Continental-scale, seasonal
movements of a heterothermic migratory tree bat. Ecological Applications, 24,
602–616.Davey, J.W., Hohenlohe, P.A., Etter, P.D., Boone, J.Q., Catchen, J.M. & Blax-
ter,M.L. (2011) Genome-wide genetic marker discovery and genotyping using
next-generation sequencing.NatureReviewsGenetics, 12, 499–510.Elith, J., Phillips, S.J., Hastie, T., Dud�ık, M., Chee, Y.E. & Yates, C.J. (2011) A
statistical explanation of MaxEnt for ecologists. Diversity and Distributions,
17, 43–57.Falush, D., Stephens, M. & Pritchard, J.K. (2003) Inference of population struc-
ture using multilocus genotype data: linked loci and correlated allele frequen-
cies.Genetics, 164, 1567–1587.Fournier, A.M.V., Sullivan, A.R., Bump, J.K., Perkins, M., Shieldcastle, M.C. &
King, S.L. (2016) Combining citizen science species distribution models and
stable isotopes reveals migratory connectivity in the secretive Virginia rail.
Journal of AppliedEcology, 54, 618–627.Gagnaire, P.A., Broquet, T., Aurelle, D., Viard, F., Souissi, A., Bonhomme, F.,
Arnaud-Haond, S. & Bierne, N. (2015) Using neutral, selected, and hitchhiker
loci to assess connectivity ofmarine populations in the genomic era.Evolution-
aryApplications, 8, 769–786.Garc�ıa-P�erez, B. & Hobson, K.A. (2014) A multi-isotope (d2H, d13C, d15N)
approach to establishing migratory connectivity of Barn Swallow (Hirundo
rustica).Ecosphere, 5, 1–12.Garner, B.A., Hand, B.K., Amish, S.J. et al. (2016) Genomics in conservation:
case studies and bridging the gap between data and application.Trends in Ecol-
ogy &Evolution, 31, 81–83.Guillot, G., Mortier, F. & Estoup, A. (2005) GENELAND: a computer package for
landscape genetics.Molecular EcologyNotes, 5, 712–715.Hallworth,M.T., Studds, C.E., Scott Sillett, T. &Marra, P.P. (2013) Do archival
light-level geolocators and stable hydrogen isotopes provide comparable esti-
mates of breeding-ground origin?TheAuk, 130, 273–282.Harrigan, R.J., Thomassen, H.A., Buermann, W. & Smith, T.B. (2014) A conti-
nental risk assessment ofWest Nile virus under climate change.Global Change
Biology, 20, 2417–2425.Hess, J., Matala, A.&Narum, S. (2011) Comparison of SNPs andmicrosatellites
for fine-scale application of genetic stock identification of Chinook salmon in
the ColumbiaRiver Basin.Molecular Ecology Resources, 11, 137–149.Hobson, K.A. & Wassenaar, L.I. (eds) (2008) Tracking Animal Migration with
Stable Isotopes, 1st edn. Elsevier, San Francisco, CA,USA.
Hobson, K.A., Wassenaar, L.I. & Taylor, O.R. (1999) Stable isotopes (dD and
d13C) are geographic indicators of natal origins of monarch butterflies in east-
ernNorthAmerica.Oecologia, 120, 397–404.
© 2017 The Authors. Methods in Ecology and Evolution © 2017 British Ecological Society, Methods in Ecology and Evolution, 8, 1241–1252
1250 K. C. Ruegg et al.
Hobson, K.A.,Wunder,M.B., VanWilgenburg, S.L., Clark, R.G. &Wassenaar,
L.I. (2009) A method for investigating population declines of migratory birds
using stable isotopes: origins of harvested lesser scaup inNorthAmerica.PLoS
One, 4, e7915.
Hobson, K.A., Barnett-Johnson,R. &Cerling, T. (2010)Using isoscapes to track
animal migration. Isoscapes (eds J.B. West, G.J. Bowen, T.E. Dawson &K.P.
Tu), pp. 273–298, Springer, NewYork,NY,USA.
Hobson, K.A., Anderson, R.C., Soto, D.X. & Wassenaar, L.I. (2012a) Isotopic
evidence that dragonflies (Pantala flavescens) migrating through the Maldives
come from the northern Indian subcontinent.PloSOne, 7, e52594.
Hobson, K.A., Møller, A.P. & Van Wilgenburg, S.L. (2012b) A multi-isotope
(d13C, d15N, d2H) approach to connecting European breeding and African
wintering populations of barn swallow (Hirundo rustica).AnimalMigration, 1,
8–22.Hobson, K.A., Soto, D.X., Paulson, D.R., Wassenaar, L.I., & Matthews, J.H.
(2012c) A dragonfly (d2H) isoscape for North America: a new tool for deter-
miningnatal origins ofmigratory aquatic emergent insects.Methods in Ecology
and Evolution, 3, 766–772.Hobson, K.A., Van Wilgenburg, S.L., Wassenaar, L.I. & Larson, K. (2012d)
Linking hydrogen (dH) isotopes in feathers and precipitation: sources of vari-
ance and consequences for assignment to isoscapes.PLoSOne, 7, e35137.
Irwin, D.E., Irwin, J.H. & Smith, T.B. (2011) Genetic variation and seasonal
migratory connectivity inWilson’s warblers (Wilsonia pusilla): species-level dif-
ferences in nuclear DNA between western and eastern populations.Molecular
Ecology, 20, 3102–3115.Kelly, J.F., Ruegg, K.C. & Smith, T.B. (2005) Combining isotopic and genetic
markers to identify breeding origins of migrant birds. Ecological Applications,
15, 1487–1494.Kelly, J.F., Bridge, E.S., Fudickar, A.M. &Wassenaar, L.I. (2009) A test of com-
parative equilibration for determining non-exchangeable stable hydrogen iso-
tope values in complex organic materials. Rapid Communications in Mass
Spectrometry, 23, 2316–2320.Kimura, M., Clegg, S., Lovette, I.J., Holder, K.R., Girman, D.J., Mil�a, B.,
Wade, P. & Smith, T.B. (2002) Phylogeographical approaches to assessing
demographic connectivity between breeding and overwintering regions in a
Nearctic-Neotropical warbler (Wilsonia pusilla). Molecular Ecology, 11,
1605–1616.Kraus, R.H., Vonholdt, B., Cocchiararo, B. et al. (2015) A single-nucleotide
polymorphism-based approach for rapid and cost-effective genetic wolf moni-
toring in Europe based on noninvasively collected samples.Molecular Ecology
Resources, 15, 295–305.Marra, P.P., Hobson, K.A. & Holmes, R.T. (1998) Linking winter and summer
events in a migratory bird by using stable-carbon isotopes. Science, 282, 1884–1886.
Metzker, M.L. (2010) Sequencing technologies—the next generation. Nature
Reviews Genetics, 11, 31–46.Mitchell, T.D. & Jones, P.D. (2005) An improvedmethod of constructing a data-
base of monthly climate observations and associated high-resolution grids.
International Journal of Climatology, 25, 693–712.Nielsen, E.E., Hemmer-Hansen, J., Larsen, P.F. & Bekkevold, D. (2009) Popula-
tion genomics of marine fishes: identifying adaptive variation in space and
time.Molecular Ecology, 18, 3128–3150.Nielsen, E.E., Cariani, A., Mac Aoidh, E. et al. (2012) Gene-associated markers
provide tools for tackling illegal fishing and false eco-certification. Nature
Communications, 3, 851.
Norris, D.R. & Taylor, C.M. (2006) Predicting the consequences of carry-over
effects formigratory populations.Biology Letters, 2, 148–151.Paritte, J.M.&Kelly, J.F. (2009) Effect of cleaning regime on stable-isotope ratios
of feathers in JapaneseQuail (Coturnix japonica).TheAuk, 126, 165–174.Paxton, K.L. & Moore, F.R. (2015) Carry-over effects of winter habitat quality
on en route timing and condition of amigratory passerine during springmigra-
tion. Journal of Avian Biology, 46, 495–506.Paxton, K.L., Van Riper, III, C., Theimer, T.C., Paxton, E.H. & Hobson,
K. (2007) Spatial and temporal migration patterns of Wilson’s Warbler
(Wilsonia pusilla) in the southwest as revealed by stable isotopes. The
Auk, 124, 162–175.Paxton, K.L., Yau,M.,Moore, F.R. & Irwin, D.E. (2013) Differential migratory
timing ofwestern populations ofWilson’sWarbler (Cardellina pusilla) revealed
bymitochondrial DNAand stable isotopes.TheAuk, 130, 689–698.Pekarsky, S., Angert, A., Haese, B., Werner, M., Hobson, K.A. & Nathan, R.
(2015) Enriching the isotopic toolbox for migratory connectivity analysis: a
new approach for migratory species breeding in remote or unexplored areas.
Diversity andDistributions, 21, 416–427.
Phillips, S.J., Anderson, R.P. & Schapire, R.E. (2006) Maximum entropy model-
ing of species geographic distributions.EcologicalModelling, 190, 231–259.Pritchard, J.K., Stephens, M. & Donnelly, P. (2000) Inference of population
structure usingmultilocus genotype data.Genetics, 155, 945–959.R Core Team (2016) R: A Language and Environment for Statistical Computing.
RFoundation for Statistical Computing, Vienna, Austria.
Ra~nola, J.M., Novembre, J. & Lange, K. (2014) Fast spatial ancestry via flexible
allele frequency surfaces.Bioinformatics, 30, 2915–2922.Ridgely, R.S., Allnutt, T.F., Brooks, T., McNicol, D.K., Mehlman, D.W.,
Young, B.E. & Zook, J.R. (2005) Digital Distribution Maps of the Birds of the
WesternHemisphere, version 2.1., NatureServe, Arlington, VA,USA.
Rubenstein,D., Chamberlain, C., Holmes, R., Ayres,M.,Waldbauer, J., Graves,
G. & Tuross, N. (2002) Linking breeding and wintering ranges of a migratory
songbird using stable isotopes.Science, 295, 1062–1065.Ruegg, K.C., Anderson, E.C., Paxton, K.L., Apkenas, V., Lao, S., Siegel, R.B.,
DeSante, D.F., Moore, F. & Smith, T.B. (2014)Mapping migration in a song-
bird using high-resolution geneticmarkers.Molecular Ecology, 23, 5726–5739.Ruegg, K.C., Anderson, E.C., Harrigan, R.J., Paxton, K.L., Kelly, J.F., Moore,
F., Smith, T.B. (2017) Data from: Genetic assignment with isotopes and habi-
tat suitability (GAIAH), a migratory bird case study. Dryad Digital Repository,
https://doi.org/10.5061/dryad.sv8n7
Rundel, C.W., Wunder, M.B., Alvarado, A.H. et al. (2013) Novel statistical
methods for integrating genetic and stable isotope data to infer individual-level
migratory connectivity.Molecular Ecology, 22, 4163–4176.Sellick, M.J., Kyser, T.K., Wunder, M.B., Chipley, D. & Norris, D.R. (2009)
Geographic variation of strontium and hydrogen isotopes in avian tissue:
implications for trackingmigration anddispersal.PLoSOne, 4, e4735.
Sillett, T.S.,Holmes,R.T. & Sherry, T.W. (2000) Impacts of a global climate cycle
on population dynamics of amigratory songbird. Science, 288, 2040–2042.Smith, T.B., Clegg, S., Kimura, M., Ruegg, K.C., Mila, B. & Lovette, I.J. (2005)
Molecular genetic approaches to linking breeding and overwintering areas in
five Neotropical migrant passerines. Birds of Two Worlds: The Ecology and
Evolution of Migration (eds R. Greenberg & P.P. Marra), pp. 222–234. JohnHopkinsUniversity Press, Baltimore,MD,USA.
Streby, H.M., Andersen, D.E. & Buehler, D.A. (2016) Golden-Winged Warbler
Ecology, Conservation, and Habitat Management. Taylor and Francis Group,
BocaRaton, FL,USA.
Stutchbury, B.J., Tarof, S.A., Done, T., Gow, E., Kramer, P.M., Tautin, J., Fox,
J.W. & Afanasyev, V. (2009) Tracking long-distance songbird migration by
using geolocators.Science, 323, 896–896.Toews, D.P., Campagna, L., Taylor, S.A. et al. (2015) Genomic approaches to
understanding population divergence and speciation in birds. The Auk, 133,
13–30.Van Wilgenburg, S.L. & Hobson, K.A. (2011) Combining stable-isotope (dD)
andband recovery data to improve probabilistic assignment ofmigratory birds
to origin.Ecological Applications, 21, 1340–1351.Vander Zanden, H.B., Wunder, M.B., Hobson, K.A., Van Wilgenburg, S.L.,
Wassenaar, L.I., Welker, J.M. & Bowen, G.J. (2014) Contrasting assignment
of migratory organisms to geographic origins using long-term versus year-spe-
cific precipitation isotopemaps.Methods in Ecology and Evolution, 5, 891–900.Veen, T., Hjernquist, M.B., Van Wilgenburg, S.L., Hobson, K.A., Folmer, E.,
Font, L. & Klaassen, M. (2014) Identifying the African wintering grounds of
hybrid flycatchers using a multi–isotope (d2H, d13C, d15N) assignment
approach.PloSOne, 9, e98075.
Wassenaar, L. & Hobson, K. (2003) Comparative equilibration and online tech-
nique for determination of non-exchangeable hydrogen of keratins for use in
animal migration studies. Isotopes in Environmental and Health Studies, 39,
211–217.Wasser, S.K., Shedlock, A.M., Comstock, K., Ostrander, E.A., Mutayoba, B. &
Stephens,M. (2004) Assigning African elephantDNA to geographic region of
origin: applications to the ivory trade. Proceedings of the National Academy of
Sciences of the United States of America, 101, 14847–14852.Webster, M.S., Marra, P.P., Haig, S.M., Bensch, S. &Holmes, R.T. (2002) Links
betweenworlds: unravelingmigratory connectivity.Trends in Ecology&Evolu-
tion, 17, 76–83.Webster, M.S., Marra, P.P., Greenberg, R. & Marra, P. (2005) The impor-
tance of understanding migratory connectivity and seasonal interactions.
Birds of Two Worlds: The Ecology and Evolution of Migration (eds R.
Greenberg & P.P. Marra), pp. 199–209. Johns Hopkins University Press,
Baltimore, MD, USA.
Received 24 January 2017; accepted 13March 2017
Handling Editor: Susan Johnston
© 2017 The Authors. Methods in Ecology and Evolution © 2017 British Ecological Society, Methods in Ecology and Evolution, 8, 1241–1252
Identifying migrant origins with multiple data types 1251
Supporting Information
Details of electronic Supporting Information are provided below.
Supporting Information 1.Afile that includes the following:
Fig. S1. Posterior probabilities of assignment of all individuals in the
reference set of birds to regions based upon high-resolution SNP-based
markers.
Fig. S2.Habitat suitability model for the Wilson’s warbler based upon
eBird data.
Fig. S3.The effect of different weighting schemes for isotopes and habi-
tat suitability (values of biso and bhab) on the posteriormean great circle
distance (pmgcd) to the true location with and without genetics. Each
point shows the average pmgcd over all birds from the indicated region.
Solid lines indicate inferences without genetic data. Dashed lines indi-
cate the inclusion of the genetic data. The figure demonstrates that
when genetic data are included, the accuracy is relatively unaffected by
changing the weight schemes on isotopes and habitat suitability. With-
out genetics, the weighting schemes for isotopes and habitat suitability
yield different pmgcd, but not consistently over the different regions.
Table S1.Environmental variables and their contribution to full species
distributionmodel forWilson’s warbler.
Supporting Information 2. A file containing 367 figures like those in
Fig. 1, one for every bird in the reference dataset.
Supporting Information 3. Equations describing the parametric boot-
strap for calculation of isotope posterior probabilities.
© 2017 The Authors. Methods in Ecology and Evolution © 2017 British Ecological Society, Methods in Ecology and Evolution, 8, 1241–1252
1252 K. C. Ruegg et al.


