Embed Size (px)
Citation preview

Hydrol. Earth Syst. Sci., 14, 1697–1713, 2010www.hydrol-earth-syst-sci.net/14/1697/2010/doi:10.5194/hess-14-1697-2010© Author(s) 2010. CC Attribution 3.0 License.
Hydrology andEarth System
Sciences
A geophysical analysis of hydro-geomorphic controls within aheadwater wetland in a granitic landscape, through ERI and IP
E. S. Riddell1, S. A. Lorentz1, and D. C. Kotze2
1School of Bioresources Engineering and Environmental Hydrology, University of KwaZulu-Natal, Private Bag X01,Scottsville, Pietermaritzburg, 3209, South Africa2Centre for Environment and Development, University of KwaZulu-Natal, Private Bag X01, Scottsville, Pietermaritzburg,3209, South Africa
Received: 12 March 2010 – Published in Hydrol. Earth Syst. Sci. Discuss.: 22 March 2010Revised: 13 August 2010 – Accepted: 20 August 2010 – Published: 31 August 2010
Abstract. Wetlands are undergoing considerable degrada-tion in South Africa. As interventions are often technicaland costly, there is a requirement to develop conceptual pro-cess models for these wetland systems so that rehabilita-tion attempts will be successful. This paper presents an ap-proach using the geophysical methods of Electrical Resis-tivity Imaging (ERI) and Induced Polarization (IP) to de-lineate sub-surface hydro-geomorphic controls that maintainequilibrium disconnectivity of wetland-catchment processes,which through gully erosion are increasing the catchmentsconnectivity through loss of water and sediment. The find-ings presented here give insight into the geomorphic pro-cesses that maintain the wetland in an un-degraded state, thisallows for the development of a conceptual model outliningthe wetland forming processes. The analysis suggests thatsub-surface clay-plugs, within an otherwise sandy substrateare created by illuviation of clays from the surrounding hill-slopes particularly at zones of valley confinement.
1 Introduction
Wetlands in southern Africa as in most parts of the worldcontinue to be vulnerable to anthropogenic pressures and cli-matic shifts which influence the hydrological and geomor-phologic processes that otherwise maintain the equilibrium
Correspondence to:E. S. Riddell([email protected])
of the wetlands dynamic state. Consequently many wetlandsare continually undergoing degradation. In recent years thedrive has been to determine the wetlands structure and func-tion within the broader landscape in order for rehabilitationof these degraded systems to be sustainable. In the interestsof ecosystem integrity significant emphasis is now placed onunderstanding a wetlands hydro-geomorphic setting to en-sure the success of such intervention, whereby the causes ofwetland degradation rather than the symptom are incorpo-rated into the rehabilitation planning (Tooth and McCarthy,2007). In other words rehabilitation must be sympatheticto and not in conflict with the natural dynamic of the wet-land or river system, and hence seek to maintain those pro-cesses that govern the systems water balance (Ellery et al.,2008). It is within this context that a detailed hydrolog-ical monitoring of a technical rehabilitation effort was un-dertaken within a headwater wetland catchment of the SandRiver in northeastern South Africa, as part of a river rehabil-itation program. These headwater sub-catchments are char-acterized by channeled and un-channeled valley bottom wet-lands with a sandy soil matrix derived from the surroundinggranitic geology. It was postulated that zones of finer sed-iment within this matrix controlled the lateral movement ofwater within these wetlands prior to their degradation, andthese fine sediment zones are being removed through exten-sive gully erosion (Pollard et al., 2005). It is the stabiliza-tion of these gullies that are the focus of technical rehabili-tation efforts. Descriptions of the hydrodynamic behavioursof the wetland phreatic surfaces prior to rehabilitation inter-ventions revealed stark differences in event driven responses
Published by Copernicus Publications on behalf of the European Geosciences Union.

1698 E. S. Riddell et al.: A geophysical analysis of hydro-geomorphic controls
either side of a suspected clay-plug in this wetland (Riddell etal., 2007). Clay-plugs are distinct zones of fine particles in anenvironment that is otherwise dominated by coarse particles,and due to the lower hydraulic conductivities of this medium,they are thought to exert significant controls on lateral sub-surface flows in the wetlands of the Sand River catchment.It is the identification and examination of these sub-surfacestructures that are presented here.
This paper presents results of geophysical interpretation ofthe wetlands hydro-geomorphology using Electrical Resis-tivity Imaging (ERI) in both 2 dimensional form (2-D) duringscoping surveys and a more detailed examination of hydro-geomorphic controls in 3 dimensional form (3-D) using ERIand Induced Polarization (IP) techniques. The 2-D surveysusing ERI only were deployed at various times during thehydrological characterization of this catchment (2005–2009)and were used in a reconnaissance fashion to assist in the in-terpretation of hydrological processes. 2-D readings wereconducted as single onetime surveys, however it was pre-ferred to conduct them during the late winter (dry season,March–October/November) period, as soil moisture contentswere at their minimum and therefore variability in electricalresistivity measurements were assumed to have been mini-mally affected.
The 3-D surveys using both ERI and IP were used to exam-ine the clay-plug distribution and develop concepts regard-ing their geomorphic evolution. The geophysical techniquesused here have their roots in the mineral prospecting andother geotechnical investigations (Lowrie, 2007) but are nowbeing increasingly used by the earth science fraternity in-volved in water resources management and geomorphologystudies, whose recognition of their utility has been widelyacknowledged (Robinson et al., 2008; Dahlin, 1996). ERIfor instance has successfully been used in the interpretationof hillslope flow pathways in research catchments in SouthAfrica (Uhlenbrook et al., 2005), examining permafrost dis-tribution in peri-glacial mountain environments in Europe(Kneisel, 2006) and weathering and erosion processes on lat-eritic plateaus of south Pacific islands (Beauvais et al., 2007).ERI has been praised as a valuable, cost-effective and non-intrusive tool for conducting reconnaissance surveys in ge-omorphological investigations (Smith and Sjogren, 2006).Whilst IP has not received as much attention as resistivitymethods, it was demonstrated by Slater and Lesmes (2002) toreveal valuable data on clay-free and clay-rich stratificationsin 1-D and 2-D field surveys. Meanwhile, IP is now provingimportant as a complementary tool to resistivity mapping, forinstance to delineate sub-surface materials in low resistivityclay rich environments it has shown success such as slopeinstability studies in Switzerland (Marescot et al., 2008). In-terestingly it has also showed promise in mapping the stratig-raphy of peatlands in the north-eastern United States, partic-ularly the high chargeability of partially decomposed organicmatter found therein (Slater and Reeve, 2002).
The basis of ERI surveying is the induction of an elec-trical current by an array ofcurrent electrodes inserted intothe ground surface, with a sequence ofpotentialelectrodesreceiving the electrical signal. Hence the measurements ofelectrical potential at the surface are dependent on the elec-trical resistance of sub-surface materials, expressed in ohmmetres (� m), which vary according to sub-surface strata,as a result of their inherent pore size distribution, variationsin water content and degree of salinity (Loke, 1999). Thecollation of this sub-surface resistivity distribution is facili-tated by computerized devices known asswitching unitsthatcontrol the sequence of pairs of current and potential elec-trodes, known as the quadripole. Variations in the positionand sequence of current and potential electrodes along a tran-sect facilitate measurements with different degrees of hori-zontal and/or vertical resolution, these computer-generatedsequences (protocols) are known asarrays. Inversion algo-rithms are used to create a model of measured and apparent(calculated) resistivity values. Using Jacobian matrix calcu-lations and forward modeling procedures produces values ofthe true resistivity, which when plotted in 2-D or 3-D areknown aspseudosections. The law governingapparent re-sistivity(pa) is written as follows:
pa = kR and (1)
R = V/I (2)
where:k is the geometric factor and varies according to thequadripole array,R is the resistance,V is the voltage andIis the current.
These plotted pseudosections are then used to examinesub-surface resistivity heterogeneities based on the differ-ences of equipotential surfaces where they hit the ground sur-face at potential electrodes; the interpretation of this data isbased on known resistivity ranges of geologic materials. Fol-lowing on from this procedure, IP surveys measure the decayof the electrical pulse from the current electrodes as the sub-surface returns to electrical equilibrium, since particular geo-logic materials are polarizable, some parts of the sub-surfacedomain essentially act as capacitors. This is particularly per-tinent in the case of clays which have a high propensity formembrane polarization as a result of ion accumulations onthe particles surface and hence within pore spaces (Kiberu,2002). In essence then the IP survey is measuring thecharge-ability (M) of sub-surface materials and this is written in theform:
M =1
V0
∫ t2
t1
V (t)dt (3)
Where V0 is voltage at time(t) 0, where subsequent time-voltage values are an expression of the decay of the steady-state voltage.
Hydrol. Earth Syst. Sci., 14, 1697–1713, 2010 www.hydrol-earth-syst-sci.net/14/1697/2010/
E. S. Riddell et al.: A geophysical analysis of hydro-geomorphic controls 1699
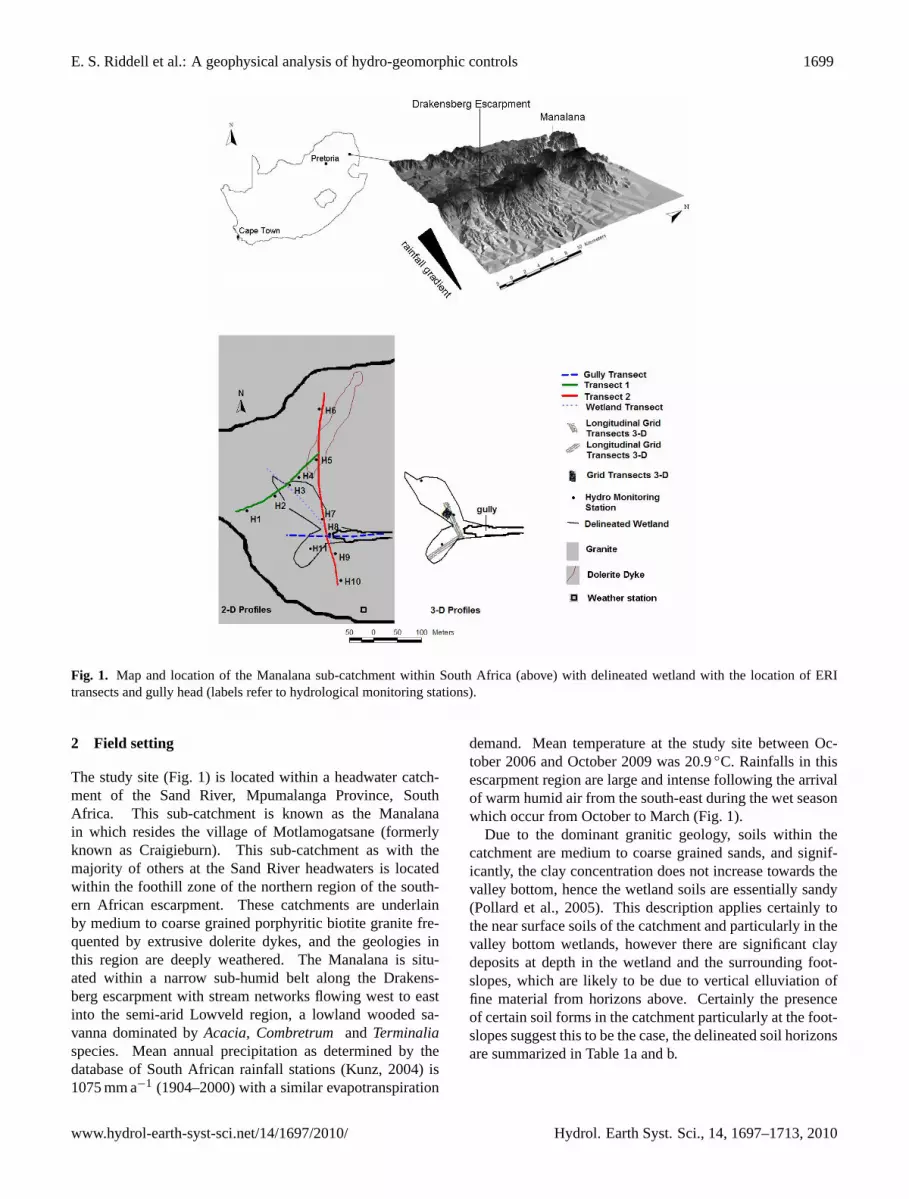
Fig. 1. Map and location of the Manalana sub-catchment within South Africa (above) with delineated wetland with the location of ERItransects and gully head (labels refer to hydrological monitoring stations).
2 Field setting
The study site (Fig. 1) is located within a headwater catch-ment of the Sand River, Mpumalanga Province, SouthAfrica. This sub-catchment is known as the Manalanain which resides the village of Motlamogatsane (formerlyknown as Craigieburn). This sub-catchment as with themajority of others at the Sand River headwaters is locatedwithin the foothill zone of the northern region of the south-ern African escarpment. These catchments are underlainby medium to coarse grained porphyritic biotite granite fre-quented by extrusive dolerite dykes, and the geologies inthis region are deeply weathered. The Manalana is situ-ated within a narrow sub-humid belt along the Drakens-berg escarpment with stream networks flowing west to eastinto the semi-arid Lowveld region, a lowland wooded sa-vanna dominated byAcacia, Combretrumand Terminaliaspecies. Mean annual precipitation as determined by thedatabase of South African rainfall stations (Kunz, 2004) is1075 mm a−1 (1904–2000) with a similar evapotranspiration
demand. Mean temperature at the study site between Oc-tober 2006 and October 2009 was 20.9◦C. Rainfalls in thisescarpment region are large and intense following the arrivalof warm humid air from the south-east during the wet seasonwhich occur from October to March (Fig. 1).
Due to the dominant granitic geology, soils within thecatchment are medium to coarse grained sands, and signif-icantly, the clay concentration does not increase towards thevalley bottom, hence the wetland soils are essentially sandy(Pollard et al., 2005). This description applies certainly tothe near surface soils of the catchment and particularly in thevalley bottom wetlands, however there are significant claydeposits at depth in the wetland and the surrounding foot-slopes, which are likely to be due to vertical elluviation offine material from horizons above. Certainly the presenceof certain soil forms in the catchment particularly at the foot-slopes suggest this to be the case, the delineated soil horizonsare summarized in Table 1a and b.
www.hydrol-earth-syst-sci.net/14/1697/2010/ Hydrol. Earth Syst. Sci., 14, 1697–1713, 2010

1700 E. S. Riddell et al.: A geophysical analysis of hydro-geomorphic controls
Table 1a. Hydrometry stations in the Manalana catchment with soil form, soil moisture tension and shallow groundwater levels, and soiltexture (Soil form and texture data from University of the Free State, unpublished report).
Sensor Depth (m)0.3 0.6 2 2 4 6
SA Soil Soil Moisture Tension Shallow Groundwater levelSlope Elementa Formb WRBc (m) (m)
October 2006
H5 Backslope Oakleaf Regosol 3.39 4.11 3.22 None. obs.
H6 Shoulder Glenrosa Leptosol 15.20 87.80 10.31 None. obs.
H7 Toeslope Katspruit Gleysol 4.61 0.41 −2.81 −4.40(wetland)
H8 Toeslope Kroonstad Planosol 3.05 −4.52(wetland)
H9 Foot-slope Oakleaf Regosol 3.92 None. obs. None. obs.
H10 Backslope Oakleaf Regosol 8.72 25.54 18.26
November 2006
H1 Backslope Glenrosa Leptosol 3.00 5.50 4.53 None. obs.
H2 Foot-slope Kroonstad Planosol 0.41 0.63−0.24 None. obs. None. obs.
H3 Toeslope Katspruit Gleysol 1.21 0.31 −2.20(wetland)
H4 Foot-slope Kroonstad Planosol 2.22 2.02 −5.32
H5 Backslope Oakleaf Regosol 1.38 1.17 4.49 None. obs.
H6 Shoulder Glenrosa Leptosol 1.60 4.14 9.45 None. obs.
a Slope Element based on classification by Ruhe (1960).b South African Soil Form classification by Soil Classification Working Group (1991).c World Reference Base soil classification, FAO (1998).
Table 1b.
Horizon Depth (m) Texturea Horizon Depth (m) Texturea
H1 A 0–0.2 sandy loam – sandy clay loam H6 A 0–0.4 sandy loam
B 0.2–1.2 sandy clay loam B 0.4–1.4 sandy clay loam
H2 A 0–0.4 sandy clay loam H7 A 0-0-.4 sandy loam – sandy clay loam
G 0.4–1.0 clay E 0.4–0.9 sandy clay loam
H3 A 0–0.3 sandy loam – sandy clay loam G 0.9–1.7 clay loam
G 0.3–0.4 clay loam H8 A 0–0.2 sandy loam – sandy clay loam
G 0.4–0.7 clay – clay loam B 0.2–0.8 sandy loam – sandy clay loam
G 0.7–1.3 clay – clay loam B 0.8–1.0 sandy clay loam
G 1.3–1.5 clay B 1.0–1.9 sandy clay loam
G 1.5–2.0 clay – clay loam H9 A 0–0.1 sandy loam – sandy clay loam
H4 A 0–0.3 sandy loam B 0.1–0.6 sandy clay loam
E 0.3–0.6 clay loam B 0.6–1.0 sandy clay
E 0.6–1.1 clay – clay loam B 1.0–1.7 clay loam
G 1.1–1.7 clay H10 A 0–0.3 sandy clay loam
H5 A 0–0.2 sandy loam B 0.3–1.1 sandy clay loam
B 0.2–0.6 sandy clay loam C 1.1–1.7 clay loam
B 0.6–1.4 sandy clay loam
B 1.4–2.0 clay – clay loam
a United States Department of Agriculture.
Hydrol. Earth Syst. Sci., 14, 1697–1713, 2010 www.hydrol-earth-syst-sci.net/14/1697/2010/

E. S. Riddell et al.: A geophysical analysis of hydro-geomorphic controls 1701
According to the South African vegetation type classifica-tion system (Acocks, 1988) this area falls under the lowveldsour bushveld. Land use within the Manalana is essentiallydensely populated rural housing of the communal land tenuretypical of the area including a dense network of roads andpathways. A combination of dry-upland and wetland-valleybottom small holder subsistence cultivation characterizes thearea. The Manalana catchment is highly altered in its veg-etation composition than would normally be found in morepristine areas of the lowveld sour bushveld. The hillslopeswere in part cleared for forestry in the 1960–70 s and neverplanted, as such the short opportunistic shrub,Parinari cu-ratellifolia now dominates. The presence of this shrub, aswell as communal grazing of cattle, frequent grassland fires,and harvesting of grass and fuel wood has rendered a catch-ment with a very low basal cover. In addition, it is extensivewetland cultivation (ridge and furrow systems) that has al-tered the natural micro-topography of the valley bottom andchanged the balance of hydro-geomorphic processes withinthe wetland system. This may take the form of disaggre-gating material through tillage practices, as well as increas-ing the level of channelization within the system by furrow-ing, amongst several other factors for example. This is be-lieved to be a causative agent facilitating the extensive gul-lying characterizing the Manalana catchment. The Manalanacatchment itself is 2.61 km2 of which 2.50 km2 and 0.11 km2
(or 95.6% and 4.4 %) make up the area of interfluve and wet-land respectively. Whilst the wetlands had traditionally beenused for subsistence agriculture, the wetland in the study areaof the catchment has remained fallow and had since returnedto a vegetation community of emergent wetland vegetationdominated byPhragmites mauritianus.
3 Methods and techniques
3.1 Overall approach
Since the commencement of the catchment hydrologicalmonitoring program (September 2005) various 2-D ERI sur-veys were undertaken along transects through the wetlandand its contributing catchment. These were followed in July–August 2008 with a detailed 3-D ERI and IP approach toascertain the distribution of the sub-surface clay-plugs andallow for some speculation on their development. In bothcases use was made of an ABEMTM SAS1000 single channelLund imaging system (Terrameter and switcher unit) with 64electrode take-out over four cables. Electrode spacing andarray types varied with each survey according to informa-tion requirements, a summary of these are given in Table 2.In general the Wenner array was used as this is sensitiveto vertical changes in the subsurface resistivity distributionand anticipated to be useful for delineating sedimentary lay-ers. Meanwhile, the Schlumberger array was used specifi-cally on transect 1 as this array is sensitive to both vertical
and horizontal resistivity distributions and therefore antici-pated to be useful for revealing intruding features such asbedrock outcrops, this array was used principally to assistin a complementary study in the catchment on hillslope hy-drology. Orientation of these surveys is displayed in Fig. 1.Inversion of 2-D and 3-D datasets were conducted using theRES2DINV and RES3DINV software packages respectively(Loke, 2005a, 2005b). Prior to the final inversion of data,the raw electrical resistivity data was assessed for its qual-ity according to the methods of Loke (2004), where bad datapoints are removed from a preliminary inversion array thatdisplay high RMS error. These bad data points are thereforeexcluded from the final data inversion process. Inversion datawere georeferenced with correct elevations using a Trimble®Pro-XRS differential Global Position System.
3.2 3-D approach
The first part of the 3-D study sought to examine the loca-tion and extent of the clay-plugs within the wetland. Forthis purpose three parallel transects were placed at longitu-dinal orientation in the two arms of the wetland (as shown inFig. 1), forming a juncture adjacent to the erosion gully head.Wenner-α arrays were used in each of the parallel transectsusing a single time interval IP sequence which also recordsthe sub-surface resistivity distribution at the same time, a de-fault setting in the ABEM system.
The second part of the 3-D approach sought to examine theinterface between the hillslope and valley bottom (wetland)in order to determine whether these clay-plug zones are con-tiguous with the hillslope, i.e. at the interface of the wetlandwith the footslope. Here one location was chosen (Fig. 1)for detailed examination, in which it was hoped that any lay-ered lithographic effects within the wetland substrate couldalso be discerned. Due to the small localized setting of thisparticular investigation and due to considerations in terms ofthe data acquisition time, new protocols were written suchthat Wenner-β arrays could be deployed using a single ca-ble with a 21 electrode take-out (NB: the system consists of4 cables, each of 21 take-out positions). This allowed for 3subsequent transects to be set-up whilst the ABEM systemwas logging another. Referring to Fig. 2, the survey took theform of a gridded system made up of two orientations of 11parallel transects, in bothX andY directions, making up atotal of 22 parallel lines. Electrodes were spaced at 0.75 mintervals, and thus the total length of each individual tran-sect was 15 m. Correct geometric factors (k) were applied tothe raw data in order to recalculate the apparent resistivity,prior to the inversion of the data set since the ABEM systemlimits the electrode spacing to metre integer values with onedecimal place. Hence, the apparent resistivity distributionswould be different to those that would otherwise have beencalculated automatically by the ABEM system.
In both 3-D approaches the resulting images are quasi-3-D as results are interpolated from 2-D transects, and the one
www.hydrol-earth-syst-sci.net/14/1697/2010/ Hydrol. Earth Syst. Sci., 14, 1697–1713, 2010

1702 E. S. Riddell et al.: A geophysical analysis of hydro-geomorphic controls
Table 2. 2-D ERI surveys timing and arrays deployed in the Manalana catchment.
ERT Survey array type electrode date of survey orientation purposespacing (m)
Gully longitudinal Wenner-α (long) 2.5 May 2005 W–E material and bedrocktransect distribution
wetland and gully floor
Transect 1 Schlumberger 5a November 2006 SW–NE material and bedrock(short) distribution
hillslope-wetland-hillslope
Transect 2 Wenner-α (long) 5 October 2006 S–N material and bedrockdistributionhillslope-wetland-hillslope
Wetland transect Wenner-α (short) 5a October 2006 NW–SE material and bedrockdistribution
Longitudinal Grid Wenner-α (long) 2 July 2008 SW–NE & identify clay distributionTransects 3-D SE–NW underlying wetland
Grid Transects 3-D Wenner-β 0.75 August 2008 SW–SE–NE–NW identify clay distribution at(21 probe) wetland-footslope interface
a used model refinement in inversion to half unit electrode spacing, this allows for dampening of the effect of high resistivity variations that may be encountered in a survey andprovides for smoother inversion of resistivity data.
channel SAS1000 ABEM system is limited in this regard.Also parallel transects were placed apart at two times theunit electrode spacing, within the bounds of acceptable er-ror for a quasi-3-D approach (Loke, 1999). A brief expla-nation of this is warranted: up to this point discussion hasfocused on the vertical sensitivity of the electrodes to pro-duce a 2-D pseudosection, meanwhile electrodes also exert aradial sensitivity around themselves which becomes impor-tant where data is acquired and interpolated through inver-sion techniques in 3-D. The reader is referred to Loke (1999)for a more detailed explanation. In both 3-D approaches usedhere, data of 3-D transect “blocks” were defined by the “col-late 2-D to 3-D function” within RES2DINV and inverted inRES3DINV. This function takes a series of 2-D surveys (2-Ddata files) and through an interpolation technique based onknown co-ordinates of each electrode produces a 3-D datafile. Again, data with high RMS error were removed fromthe 2-D data arrays prior to final inversion in RES3DINV. 3-D images were plotted using Rockworks® 2006 software forvisualizing earth surface and sub-surface data.
The presence of groundwater has an effect on the resis-tivity range of earth materials (Loke, 2004) and in order toachieve maximum clarity in terms of interpreting these 3-D data, the dry winter period is most appropriate for datacollection. Therefore, these surveys were conducted duringJuly–August 2008, during the mid winter period and heightof the dry season for this region. Consequently this wetlandhad undergone a period of desiccation following the cessa-tion of the rains earlier in the year, and as a result, the in-fluence of groundwater on the resistivity and IP soundings
was at the minimum possibly achievable for this wetlandsystem. A qualitative ground-truthing was also undertakenof the 3-D transects, using a series of random auger sam-ples where the depth to a change in soil texture was noted,specifically where a change in material dominated by sandfraction switched to that dominated by clay, using a bolustest (Tongway and Hindley, 2004).
3.3 Supporting hydrometry
As part of the hydrological monitoring study undertakenwithin the Manalana catchment two forms of data are usedto assist in the verification and interpretation of ERI and IPdata. These are simply shallow groundwater piezometer data,which were measured using regular (bi-/tri-weekly) dip me-ter readings in nested groundwater piezometers at hydrolog-ical monitoring stations within the wetland. The locations ofthese stations are located in Fig. 1. Moreover, these piezome-ters were also the subject of in-situ saturated hydraulic con-ductivity analysis, which took the form of bail tests using themethod of Bouwer and Rice (1976), which takes the form:
K =r2c ln(Re/rw)
2L
1
tln
y0
yt
(4)
where:K is the hydraulic conductivity of the wetland mate-rial, L is the height of the open screen portion of the piezome-ter at its interface with the wetland matrix (300 mm),y is thevertical distance between water level in the piezometer andthat within the wetland material at equilibrium at time 0 andtime t . Re is the effective radius over whichy is dissipated
Hydrol. Earth Syst. Sci., 14, 1697–1713, 2010 www.hydrol-earth-syst-sci.net/14/1697/2010/
E. S. Riddell et al.: A geophysical analysis of hydro-geomorphic controls 1703
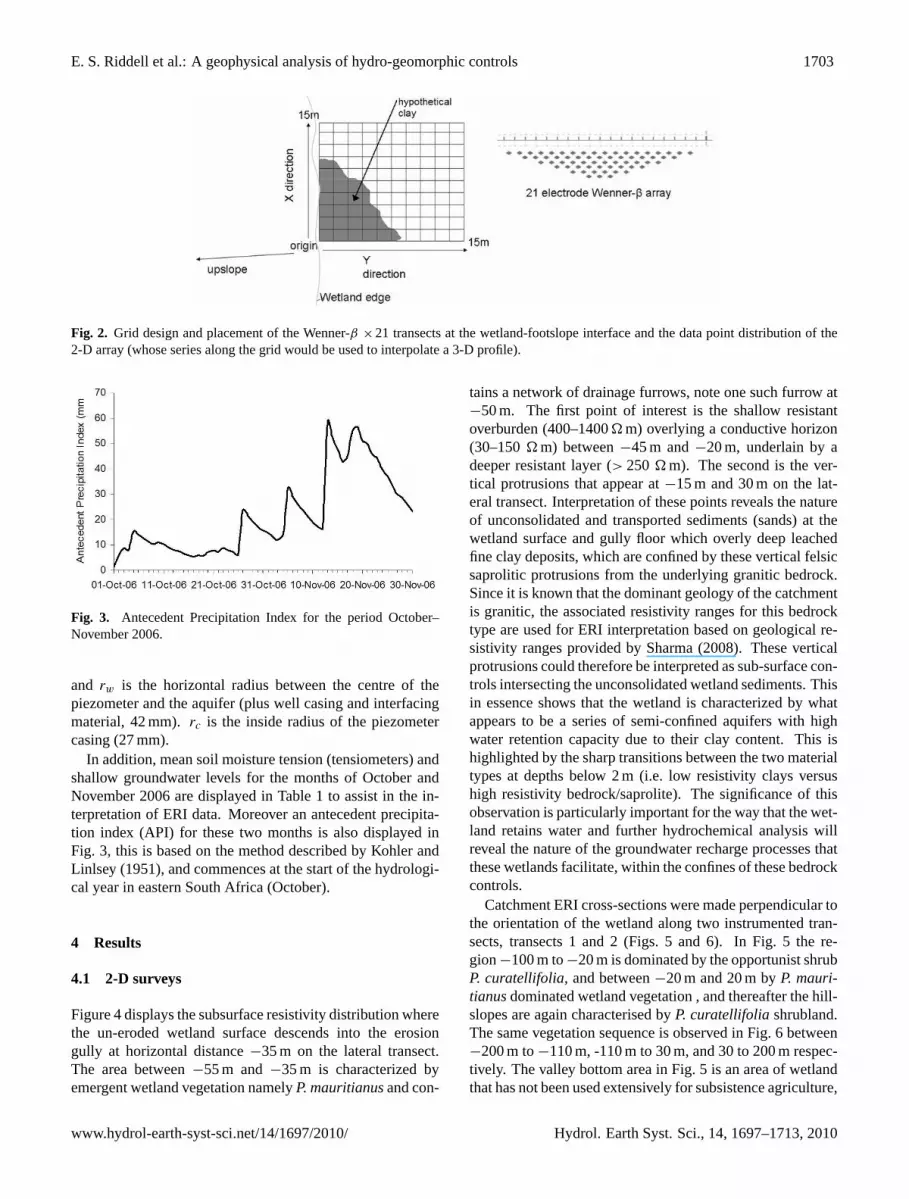
Fig. 2. Grid design and placement of the Wenner-β ×21 transects at the wetland-footslope interface and the data point distribution of the2-D array (whose series along the grid would be used to interpolate a 3-D profile).
Fig. 3. Antecedent Precipitation Index for the period October–November 2006.
and rw is the horizontal radius between the centre of thepiezometer and the aquifer (plus well casing and interfacingmaterial, 42 mm).rc is the inside radius of the piezometercasing (27 mm).
In addition, mean soil moisture tension (tensiometers) andshallow groundwater levels for the months of October andNovember 2006 are displayed in Table 1 to assist in the in-terpretation of ERI data. Moreover an antecedent precipita-tion index (API) for these two months is also displayed inFig. 3, this is based on the method described by Kohler andLinlsey (1951), and commences at the start of the hydrologi-cal year in eastern South Africa (October).
4 Results
4.1 2-D surveys
Figure 4 displays the subsurface resistivity distribution wherethe un-eroded wetland surface descends into the erosiongully at horizontal distance−35 m on the lateral transect.The area between−55 m and−35 m is characterized byemergent wetland vegetation namelyP. mauritianusand con-
tains a network of drainage furrows, note one such furrow at−50 m. The first point of interest is the shallow resistantoverburden (400–1400� m) overlying a conductive horizon(30–150� m) between−45 m and−20 m, underlain by adeeper resistant layer (> 250 � m). The second is the ver-tical protrusions that appear at−15 m and 30 m on the lat-eral transect. Interpretation of these points reveals the natureof unconsolidated and transported sediments (sands) at thewetland surface and gully floor which overly deep leachedfine clay deposits, which are confined by these vertical felsicsaprolitic protrusions from the underlying granitic bedrock.Since it is known that the dominant geology of the catchmentis granitic, the associated resistivity ranges for this bedrocktype are used for ERI interpretation based on geological re-sistivity ranges provided by Sharma (2008). These verticalprotrusions could therefore be interpreted as sub-surface con-trols intersecting the unconsolidated wetland sediments. Thisin essence shows that the wetland is characterized by whatappears to be a series of semi-confined aquifers with highwater retention capacity due to their clay content. This ishighlighted by the sharp transitions between the two materialtypes at depths below 2 m (i.e. low resistivity clays versushigh resistivity bedrock/saprolite). The significance of thisobservation is particularly important for the way that the wet-land retains water and further hydrochemical analysis willreveal the nature of the groundwater recharge processes thatthese wetlands facilitate, within the confines of these bedrockcontrols.
Catchment ERI cross-sections were made perpendicular tothe orientation of the wetland along two instrumented tran-sects, transects 1 and 2 (Figs. 5 and 6). In Fig. 5 the re-gion−100 m to−20 m is dominated by the opportunist shrubP. curatellifolia,and between−20 m and 20 m byP. mauri-tianusdominated wetland vegetation , and thereafter the hill-slopes are again characterised byP. curatellifoliashrubland.The same vegetation sequence is observed in Fig. 6 between−200 m to−110 m, -110 m to 30 m, and 30 to 200 m respec-tively. The valley bottom area in Fig. 5 is an area of wetlandthat has not been used extensively for subsistence agriculture,
www.hydrol-earth-syst-sci.net/14/1697/2010/ Hydrol. Earth Syst. Sci., 14, 1697–1713, 2010

1704 E. S. Riddell et al.: A geophysical analysis of hydro-geomorphic controls
Fig. 4. Longitudinal ERI pseudosection of a transect along erosion gully. (Wenner long). NB. This survey was conducted prior to theinstallation of hydrometric apparatus.
Fig. 5. ERI pseudosection of Transect 1 (hillslope-wetland-hillslope) (Schlumberger short).
Fig. 6. ERI pseudosection of Transect 2 (Wenner long).
Hydrol. Earth Syst. Sci., 14, 1697–1713, 2010 www.hydrol-earth-syst-sci.net/14/1697/2010/

E. S. Riddell et al.: A geophysical analysis of hydro-geomorphic controls 1705
Fig. 7. ERI pseudosection of a transect along the wetland. Wenner short, note 2× vertical scale exaggeration.
meanwhile the valley bottom area of Fig. 6 has been, and itcontains a large network of ridge and furrow systems. Inboth cases the substrate appears to be increasingly conduc-tive towards the valley bottom and underlain by higher resis-tant material. The unconsolidated wetland substrates of thevalley bottom appear to be some 20–25 m deep and are prob-ably of a more conductive nature due to the higher moisturecontent of the substrates in this region than on the interfluves.In Fig. 5 it is apparent that the interfluve of the NE side ofthe transect is more conductive than the SW side. This isdue to the intersection of the catchment’s northern edge bya doleritic dyke, noted through in-situ observations, whereasthe SW is a slope of granitic material. This is seen again inFig. 6 for the S–N transect, the doleritic dyke is more appar-ent between 50–100 m with a vertical structure of< 150� mextending to the base of the pseudosection. Further to thenorth of this transect in the upslope region the granitic geol-ogy reappears.
These initial 2-D ERI surveys reveal the interplay ofbedrock and regolith that characterizes this particular catch-ment. In particular there is an obvious contrast between thetwo geological substrates by way of the predominant graniticmaterial and flanking of the catchments by dolerite dykes.This interplay of geologies has important ramifications forthe hydrological processes operating within this catchment,particularly since soil hydraulics will be influenced by thedifferent soil textures and porosities yielded from soils onthese different geologies. Most notably granites weather tocoarse structured soils and dolerites to fine clay rich soils(Schaetzl and Anderson, 2005), and this was reflected by thecontrasting conductivities of the materials in Figs. 5 and 6.Hence the lower resistance of the doleritic material is ex-plained by its higher clay content than the opposing granites.The observed hydrological responses reflecting these differ-ing hillslope geologies to precipitation events and antecedentsoil moisture conditions, and the consequent variability in theway that water is delivered to the valley bottom wetland havebeen characterized for this catchment. This has been done
through hydrometric observations and hydropedological in-terpretation of soil form (Riddell et al., 2010).
The entire profile of Fig. 7. has emergent wetland vege-tation at the surface, dominated byP. mauritianusand sub-sistence agriculture occurred primarily between−30 m and70 m. As expected, increasingly conductive material is ob-served within the longitudinal pseudosection displayed inFig. 7, in particular the< 100� m material on the northernside of the transect which corresponds with the valley bot-tom material of Fig. 5. This conductive material is seen allalong the profile although it is shallower with reduced depthto bedrock at the northern end. However, between−20 mand 40 m a more resistant (> 1000� m) layer is seen at thesurface. This resistant layer is an area where the wetland to-pography has been mechanically altered by subsistence agri-cultural practices. The creation of ridge and furrow systemsby digging and re-deposition of material in this way has con-sequently disaggregated the wetland substrate, reducing itsbulk density and hence inducing higher relative apparent re-sistivity. The furrows themselves are up to approximately1 m deep, below the top of the raised cultivation beds. It islikely that the traversing of the resistivity probes and cablesacross both the furrows and raised cultivation beds has al-lowed for a certain degree of distortion of the observed verti-cal resistivity distribution in this region of the wetland, allow-ing for an over exaggerated measurement of resistant mate-rial at depth. A significant observation from this pseudosec-tion is the apparent vertical protrusions of high conductivitymaterial at 60 m and a similar possible structure at 45 m (con-trasting with the high resistant protrusions of Fig. 5). At theextreme SE of this image a large area of high resistant mate-rial occurs and this forms the eroded and deposited sedimentsof the erosion gully head, corresponding to−40 m in Fig. 4.
www.hydrol-earth-syst-sci.net/14/1697/2010/ Hydrol. Earth Syst. Sci., 14, 1697–1713, 2010
1706 E. S. Riddell et al.: A geophysical analysis of hydro-geomorphic controls
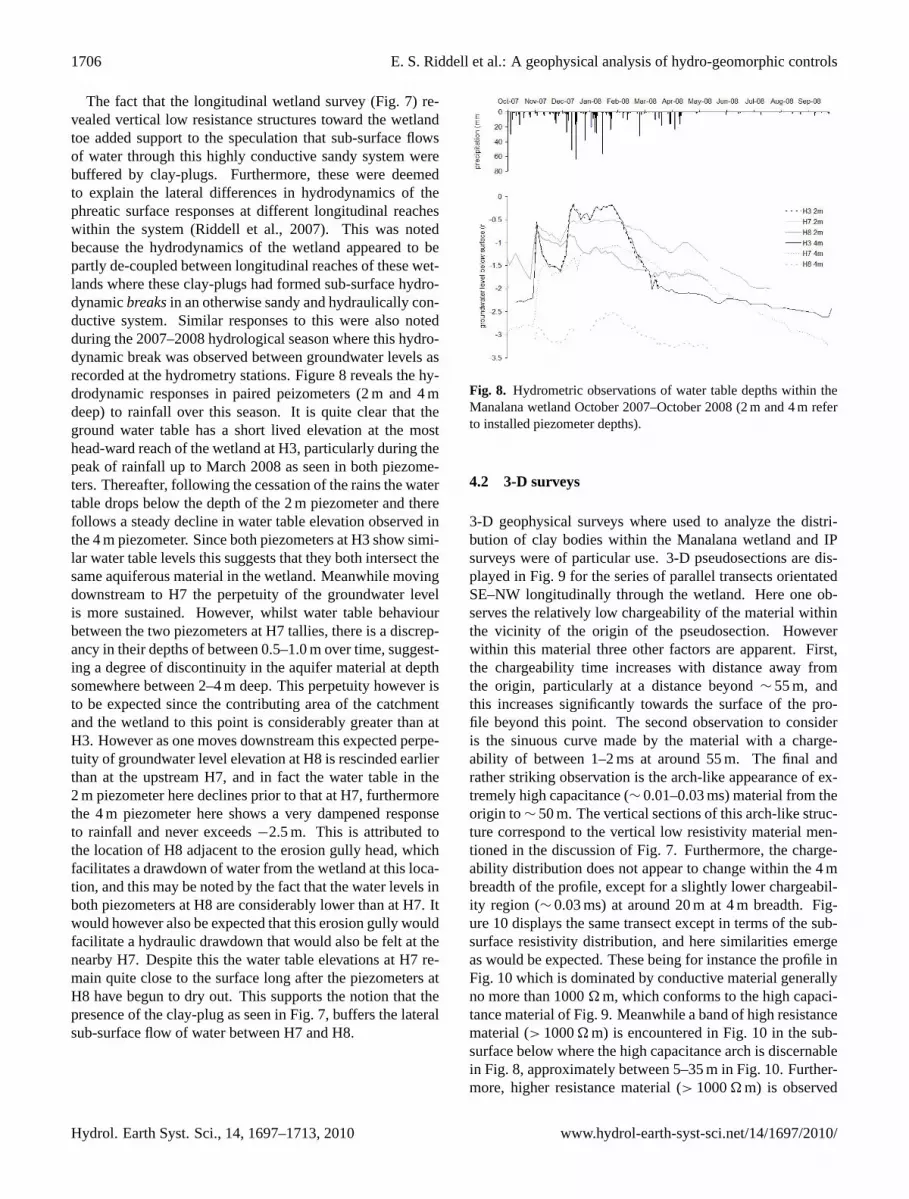
The fact that the longitudinal wetland survey (Fig. 7) re-vealed vertical low resistance structures toward the wetlandtoe added support to the speculation that sub-surface flowsof water through this highly conductive sandy system werebuffered by clay-plugs. Furthermore, these were deemedto explain the lateral differences in hydrodynamics of thephreatic surface responses at different longitudinal reacheswithin the system (Riddell et al., 2007). This was notedbecause the hydrodynamics of the wetland appeared to bepartly de-coupled between longitudinal reaches of these wet-lands where these clay-plugs had formed sub-surface hydro-dynamicbreaksin an otherwise sandy and hydraulically con-ductive system. Similar responses to this were also notedduring the 2007–2008 hydrological season where this hydro-dynamic break was observed between groundwater levels asrecorded at the hydrometry stations. Figure 8 reveals the hy-drodynamic responses in paired peizometers (2 m and 4 mdeep) to rainfall over this season. It is quite clear that theground water table has a short lived elevation at the mosthead-ward reach of the wetland at H3, particularly during thepeak of rainfall up to March 2008 as seen in both piezome-ters. Thereafter, following the cessation of the rains the watertable drops below the depth of the 2 m piezometer and therefollows a steady decline in water table elevation observed inthe 4 m piezometer. Since both piezometers at H3 show simi-lar water table levels this suggests that they both intersect thesame aquiferous material in the wetland. Meanwhile movingdownstream to H7 the perpetuity of the groundwater levelis more sustained. However, whilst water table behaviourbetween the two piezometers at H7 tallies, there is a discrep-ancy in their depths of between 0.5–1.0 m over time, suggest-ing a degree of discontinuity in the aquifer material at depthsomewhere between 2–4 m deep. This perpetuity however isto be expected since the contributing area of the catchmentand the wetland to this point is considerably greater than atH3. However as one moves downstream this expected perpe-tuity of groundwater level elevation at H8 is rescinded earlierthan at the upstream H7, and in fact the water table in the2 m piezometer here declines prior to that at H7, furthermorethe 4 m piezometer here shows a very dampened responseto rainfall and never exceeds−2.5 m. This is attributed tothe location of H8 adjacent to the erosion gully head, whichfacilitates a drawdown of water from the wetland at this loca-tion, and this may be noted by the fact that the water levels inboth piezometers at H8 are considerably lower than at H7. Itwould however also be expected that this erosion gully wouldfacilitate a hydraulic drawdown that would also be felt at thenearby H7. Despite this the water table elevations at H7 re-main quite close to the surface long after the piezometers atH8 have begun to dry out. This supports the notion that thepresence of the clay-plug as seen in Fig. 7, buffers the lateralsub-surface flow of water between H7 and H8.
Fig. 8. Hydrometric observations of water table depths within theManalana wetland October 2007–October 2008 (2 m and 4 m referto installed piezometer depths).
4.2 3-D surveys
3-D geophysical surveys where used to analyze the distri-bution of clay bodies within the Manalana wetland and IPsurveys were of particular use. 3-D pseudosections are dis-played in Fig. 9 for the series of parallel transects orientatedSE–NW longitudinally through the wetland. Here one ob-serves the relatively low chargeability of the material withinthe vicinity of the origin of the pseudosection. Howeverwithin this material three other factors are apparent. First,the chargeability time increases with distance away fromthe origin, particularly at a distance beyond∼ 55 m, andthis increases significantly towards the surface of the pro-file beyond this point. The second observation to consideris the sinuous curve made by the material with a charge-ability of between 1–2 ms at around 55 m. The final andrather striking observation is the arch-like appearance of ex-tremely high capacitance (∼ 0.01–0.03 ms) material from theorigin to∼ 50 m. The vertical sections of this arch-like struc-ture correspond to the vertical low resistivity material men-tioned in the discussion of Fig. 7. Furthermore, the charge-ability distribution does not appear to change within the 4 mbreadth of the profile, except for a slightly lower chargeabil-ity region (∼ 0.03 ms) at around 20 m at 4 m breadth. Fig-ure 10 displays the same transect except in terms of the sub-surface resistivity distribution, and here similarities emergeas would be expected. These being for instance the profile inFig. 10 which is dominated by conductive material generallyno more than 1000� m, which conforms to the high capaci-tance material of Fig. 9. Meanwhile a band of high resistancematerial (> 1000� m) is encountered in Fig. 10 in the sub-surface below where the high capacitance arch is discernablein Fig. 8, approximately between 5–35 m in Fig. 10. Further-more, higher resistance material (> 1000� m) is observed
Hydrol. Earth Syst. Sci., 14, 1697–1713, 2010 www.hydrol-earth-syst-sci.net/14/1697/2010/

E. S. Riddell et al.: A geophysical analysis of hydro-geomorphic controls 1707
Fig. 9. Pseudo 3-D IP section of the SE–NW parallel transects.Scales are in metres diverging from a geographical origin, verticalscale is altitude a.s.l. (Wenner long, 2 m spacing, 8th iteration, RMSerror 8.74%).
Fig. 10. Pseudo 3-D resistivity section of the SE-NW parallel tran-sects. Scales are in metres diverging from a geographical origin,vertical scale is altitude a.s.l. (Wenner long, 2 m spacing, 8th itera-tion, RMS error 6.36%).
beyond 70 m near the surface in Fig. 10 when compared tothe rest of the pseudosection, corresponding to the lower ca-pacitance material in Fig. 9. However the major differencebetween the two images relates to the clearer definition ofan arch-type distribution of material in Fig. 9, this is not re-vealed in Fig. 10.
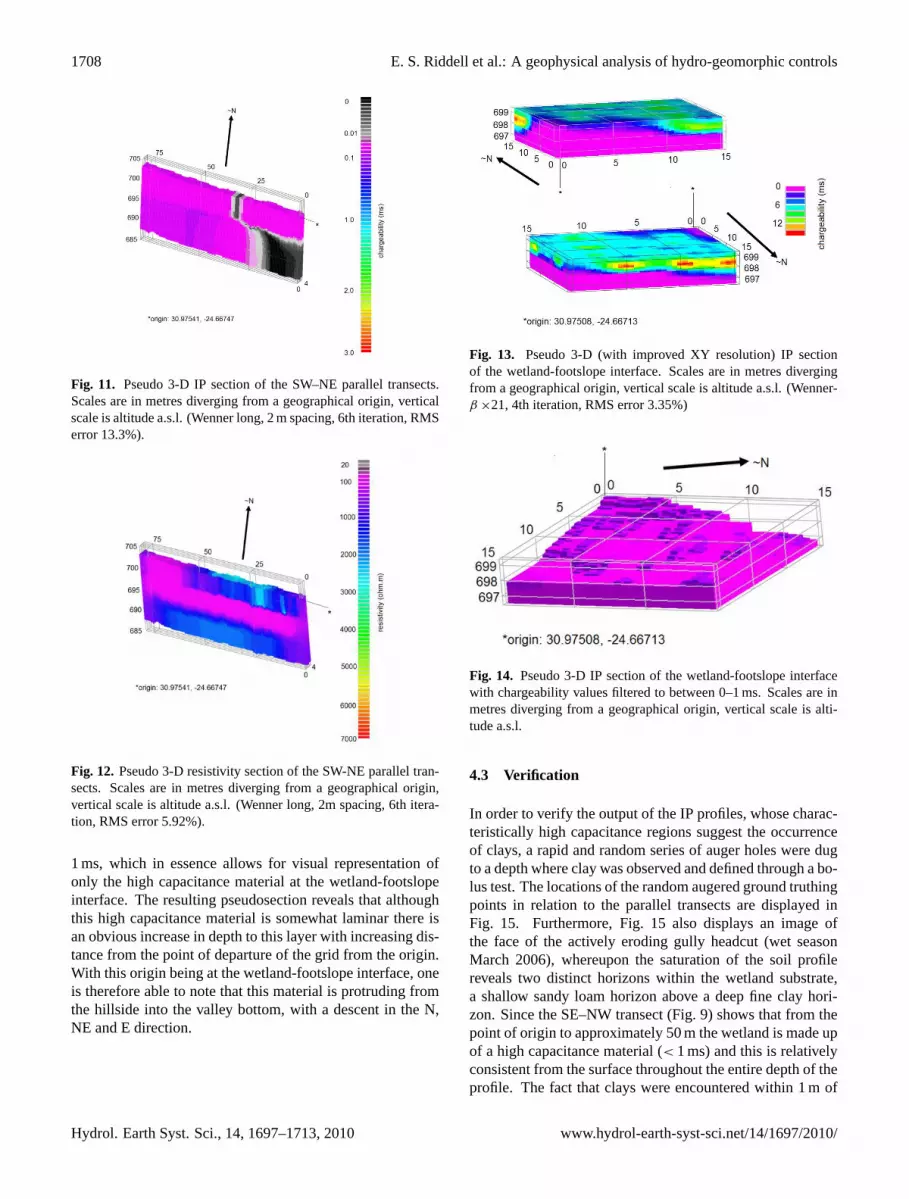
The IP profile of the SW–NE orientated transect (Fig. 11)has a high capacitance material throughout the profile, sel-dom exceeding 0.1 ms. Hence the inference from this imageis that this part of the wetland has a particularly clay rich pro-
file, the full length of the wetland, contrasting with the largerarm of the wetland seen in Figs. 9 and 10. Of particular notein Fig. 10 is the very high capacitance (< 0.01 ms) materialseen from the point of origin to∼ 25 m. This material corre-sponds with the vertical band of material seen near the originin Fig. 9. Furthermore, one observes a vertical band of highcapacitance material (< 0.01 ms) at∼ 30 m extending fromthe surface to 5 m deep. However, despite the inversion ofthe data using a robust method with optimized damping fac-tors, the pseudosection was achieved with a relatively highroot mean square (RMS) error, and hence this image must beinterpreted with caution. Meanwhile, the satisfactory inver-sion of the corresponding resistivity image for this sectionaids in the interpretation of this anomalous IP output. Thisresistivity data is displayed in Fig. 12, where one observes alateral stratification of the sub-surface media within this pro-file, particularly a band of material of< 1000� m between693–698 m a.s.l., similarly this banding is also discernablein Fig. 10 for the complementary transect in the alternativeorientation. In both cases this low resistivity/high capaci-tance material overlies a slightly higher resistance materialat depth (note the material under-arch in Fig. 10). Moreover,in Fig. 11 one observes the slight reduction in material ca-pacitance below 697 m a.s.l., beyond 30 m. However, Fig. 12does reveal the anomalous nature of the vertical band of highcapacitance material at 30 m seen in Fig. 11, which does nottally with the higher resistant material observed at this loca-tion in the resistivity profile. One possible reason for thisanomaly, speculatively speaking, may be due to the presenceof cracked clay in the profile, which due to the dry winterperiod at the time of surveying is highly likely. Therefore,although the clays themselves will have high capacitance, ifthey are cracked and hence have very large inter-pore spacesmay engender large resistivity readings due to greater air topore ratios in the soil medium than under wetter conditions.
The results of IP surveys using the gridded 21 electrodemethod at the wetland footslope interface revealed the highlyvariable nature of the material here in terms of its chargeabil-ity. Figure 13 displays this data in two orientations aroundthe origin. This variability is reflected in the stratification ofchargeability layers and heterogeneities in the near surface. Itmust be remembered here that due to the short electrode arrayand short spacing of these electrodes the vertical depth pene-tration is reduced, and hence the resulting survey provides aresolution to a depth of 3 m. Nevertheless the resulting out-put reveals the patchy network of low capacitance (> 6 ms)material near the surface and this reflects the disturbed mate-rial at the wetland surface that has been mechanically alteredto create raised bed and furrow systems used for cultivationpurposes. Meanwhile, one is able to discern that this uncon-solidated material overlies a deeper layer of rather high ca-pacitance material (< 1 ms), which varies in its depth acrossthe 15 m× 15 m domain.
Figure 14 displays the same data, except that an IP fil-ter has been applied to display chargeability data only below
www.hydrol-earth-syst-sci.net/14/1697/2010/ Hydrol. Earth Syst. Sci., 14, 1697–1713, 2010
1708 E. S. Riddell et al.: A geophysical analysis of hydro-geomorphic controls
Fig. 11. Pseudo 3-D IP section of the SW–NE parallel transects.Scales are in metres diverging from a geographical origin, verticalscale is altitude a.s.l. (Wenner long, 2 m spacing, 6th iteration, RMSerror 13.3%).
Fig. 12. Pseudo 3-D resistivity section of the SW-NE parallel tran-sects. Scales are in metres diverging from a geographical origin,vertical scale is altitude a.s.l. (Wenner long, 2m spacing, 6th itera-tion, RMS error 5.92%).
1 ms, which in essence allows for visual representation ofonly the high capacitance material at the wetland-footslopeinterface. The resulting pseudosection reveals that althoughthis high capacitance material is somewhat laminar there isan obvious increase in depth to this layer with increasing dis-tance from the point of departure of the grid from the origin.With this origin being at the wetland-footslope interface, oneis therefore able to note that this material is protruding fromthe hillside into the valley bottom, with a descent in the N,NE and E direction.
Fig. 13. Pseudo 3-D (with improved XY resolution) IP sectionof the wetland-footslope interface. Scales are in metres divergingfrom a geographical origin, vertical scale is altitude a.s.l. (Wenner-β ×21, 4th iteration, RMS error 3.35%)
Fig. 14. Pseudo 3-D IP section of the wetland-footslope interfacewith chargeability values filtered to between 0–1 ms. Scales are inmetres diverging from a geographical origin, vertical scale is alti-tude a.s.l.
4.3 Verification
In order to verify the output of the IP profiles, whose charac-teristically high capacitance regions suggest the occurrenceof clays, a rapid and random series of auger holes were dugto a depth where clay was observed and defined through a bo-lus test. The locations of the random augered ground truthingpoints in relation to the parallel transects are displayed inFig. 15. Furthermore, Fig. 15 also displays an image ofthe face of the actively eroding gully headcut (wet seasonMarch 2006), whereupon the saturation of the soil profilereveals two distinct horizons within the wetland substrate,a shallow sandy loam horizon above a deep fine clay hori-zon. Since the SE–NW transect (Fig. 9) shows that from thepoint of origin to approximately 50 m the wetland is made upof a high capacitance material (< 1 ms) and this is relativelyconsistent from the surface throughout the entire depth of theprofile. The fact that clays were encountered within 1 m of
Hydrol. Earth Syst. Sci., 14, 1697–1713, 2010 www.hydrol-earth-syst-sci.net/14/1697/2010/

E. S. Riddell et al.: A geophysical analysis of hydro-geomorphic controls 1709
Fig. 15. Locations of auger sample points to clay horizons (L) anddiscernable shallow sandy loam soils over lying deep fine clays ofthe Kroonstad (Planosol) soil form exposed at the site of active gul-lying (R).
the wetland surface at these locations support the inferencesmade about clay distribution from the IP surveys.
An analysis was also undertaken to verify IP interpreta-tions by using measures of saturated conductivity (K) at thehydrometric monitoring stations. This verification is con-sidered semi-quantitative since, as will become apparent, re-peated bail tests could not be undertaken due to the extremelyslow recoveries of the piezometers. Hence, the displayedK values of Fig. 16 are single measurements and thereforetreated as estimates ofK at the various piezometer depths.Figure 16 displays the closest measured IP (ms) and appar-ent resistivity (� m) value at each depth corresponding to thedepth of the piezometer well at each hydrometric monitor-ing location (Fig. 2). These values originate from the raw 4point resitivity measurements rather than from the invertedpseudosections. In cases whereK was determined at depths>2m, theK is extremely low, implying that water levels inthe wells would take hours if not days to recover to equilib-rium levels prior to conducting bail tests.
When resistivity data is plotted against log values ofK
there appears to be good agreement between the estimatedconductivity of the material at the respective piezometerdepths and the measured apparent resistivity of the same ma-terial for all wells (note there is only one well at H11). How-ever the correlation coefficient for LogK against chargeabil-ity at 0.65 is much more agreeable than against resistivityat −0.45. In each case however the plots appear to showa decline in resistance (or increased conductance) withK
at depth, which tapers off below a depth of 4 m. The sit-uation with the IP data does not yield the same clear rela-tionship, although trends may be observed. Firstly, there isa general decrease inK of the wetland material whilst ca-pacitance increases (chargeability time decreases), up to 4 mdepth. Second, at depths beyond 4 mK increases slightlyat piezometer locations H7 and H8, and at H11 capaci-tance andK tally. Therefore, there is a trend between thesetwo variables ofK and chargeability, however the clarity oftheir relationship is concealed by the very small chargeabil-
Fig. 16. Plots of log-K vs. IP measurements (above) and resistivitymeasurements (below).
ity range that is plotted on the secondary Y-axis. Obviously,more repeatedK tests and precise determination of resistiv-ity and chargeability would be ideal in order to verify theERI and IP output. However this was negated by condi-tions in the field i.e. very low conductivities, and output ofmeasured apparent resistivities, where the readings extractedfrom inversion-model output would not have been in pre-cisely the same location as the piezometer wells.
5 Discussion
The addition of 3-D combined IP and resistivity surveys tothe 2-D scoping surveys and supporting hydrometry datahave allowed a real insight into the hydro-geomorphic con-trols within this wetland system and facilitated a proposedmodel for the development of these controls, particularly interms of clay-plug formation. The rationale for the proposedmodel will now be outlined:
Remembering that the SE-NW orientated parallel tran-sects (Figs. 9 and 10) situated in a larger region of the wet-land (refer to Fig. 2) show that the chargeability time in thewetlands sub-surface increases with distance NW away fromthe origin. Meanwhile the SW-NE orientated transects withinthe smaller wetland region displays an extremely high capac-itance all the way along this part of the wetland. This pro-vides for the first point of interest. The suggestion is thatthe smaller wetland region has a more uniform clay distribu-tion in the sub-surface than the larger region, and the latter
www.hydrol-earth-syst-sci.net/14/1697/2010/ Hydrol. Earth Syst. Sci., 14, 1697–1713, 2010
1710 E. S. Riddell et al.: A geophysical analysis of hydro-geomorphic controls
therefore is likely comprised of increasingly coarser (higherresistance, lower capacitance) material away from the junc-ture of these two regions (tributaries) of the wetland. Fur-thermore, it was noted that there was a distinct down slopingof higher capacitance material with distance away from thehillslope-wetland interface. These two observations facili-tate the notion that finer (clay) particles are removed fromthe hillslope units through the process of elluviation, whichis a common process on these geological terrains in semi-arid settings, particularly in the case of clay enriched sodicsites of the region (e.g. Khomo and Rogers, 2005). This ellu-viation allows for their deposition (or illuviation) as distinctclay rich horizons at the hillslope toes, which in this catch-ment have been described according to the South African soiltaxonomic system as aKroonstadsoil form (Soil Classifica-tion Working Group, 1991). Clay rich illuviated horizonsare termed “G-horizons” according to the South African def-inition. These soils translate to the World Reference Base(FAO, 1998) system asplanosols. This illuviation processhas probably been more concentrated within the smaller wet-land region due to the higher capacitance and more uniformdistribution of this material within this region. This has effec-tively created a barrier across the confluence with the largerwetland region. Furthermore, the confinement zone or val-ley pinches that are observed at this confluence has also con-tributed to this barrier creation, and one observes this processwhen interpreting Figs. 9 and 11 to their respective positionsat this confluence. Indeed the arch-like structure obvious inFig. 9 suggests an extremely dense clay formation (clay-plug) that could have been created by two (or more) illuvialpathways at this juncture. Effectively what this scenario cre-ates is a zone of infilling by coarser clastic sediments into thelarger wetland region from the broader contributing catch-ment. Indeed the soil types in this larger region of the wet-land have been described as hydromorphic soils of theKat-spruit form, which accordingly translate togleysols(FAO,1998) which typically develop under wet conditions in un-consolidated materials.
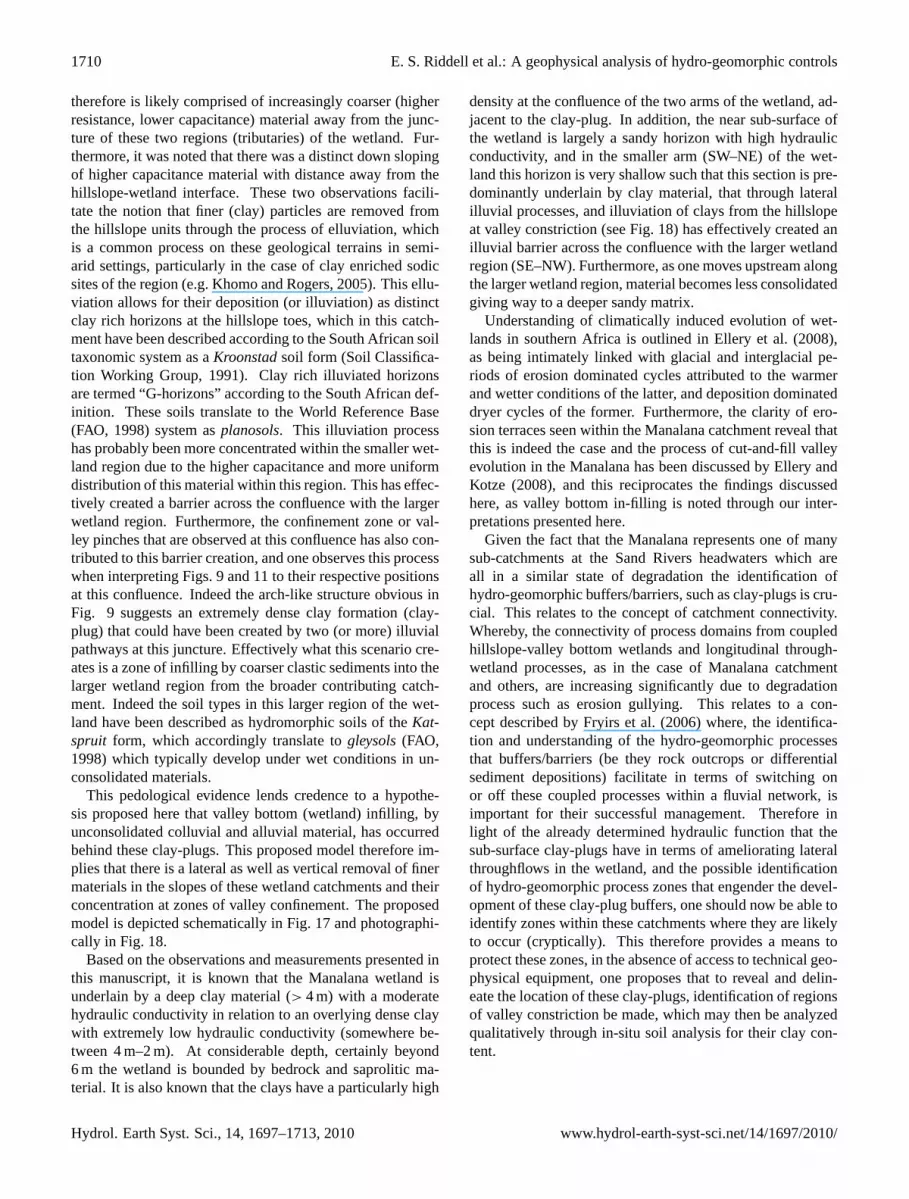
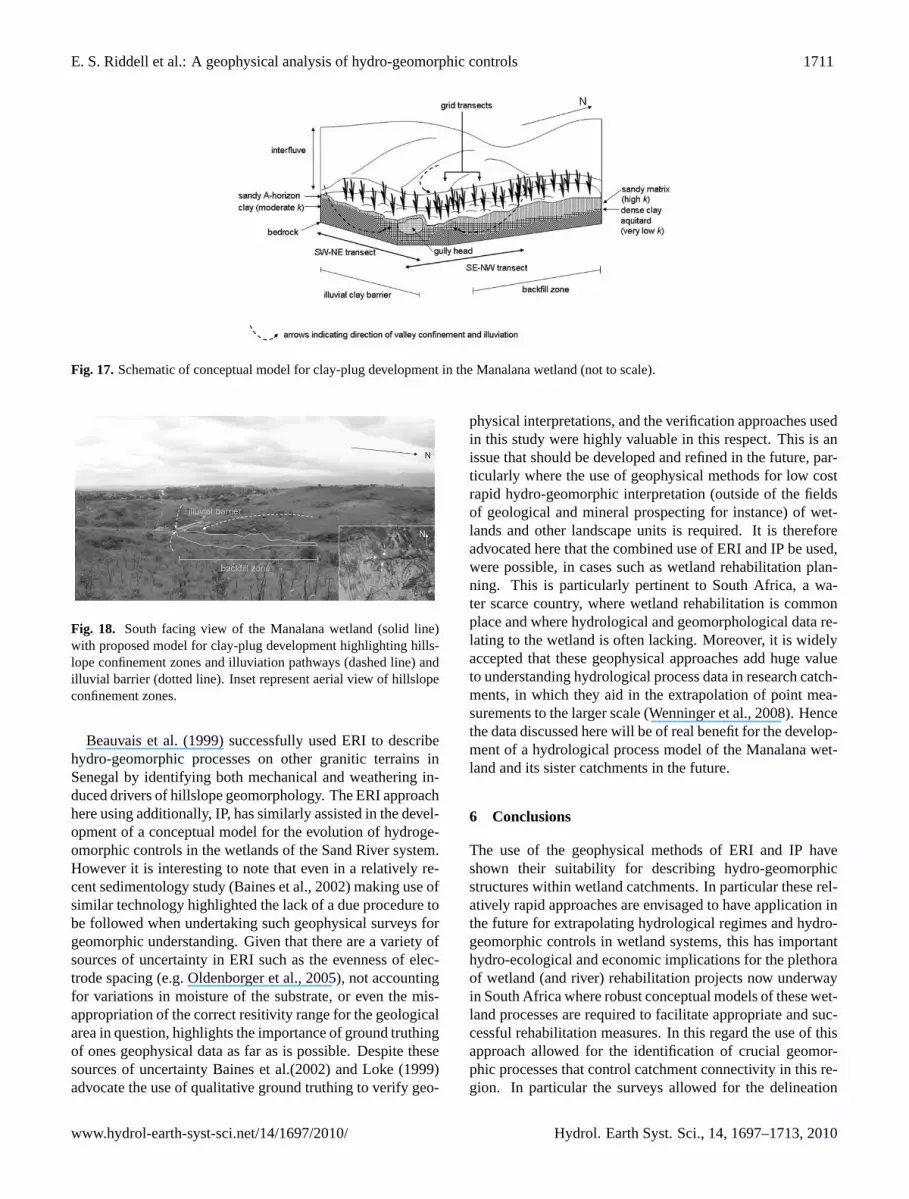
This pedological evidence lends credence to a hypothe-sis proposed here that valley bottom (wetland) infilling, byunconsolidated colluvial and alluvial material, has occurredbehind these clay-plugs. This proposed model therefore im-plies that there is a lateral as well as vertical removal of finermaterials in the slopes of these wetland catchments and theirconcentration at zones of valley confinement. The proposedmodel is depicted schematically in Fig. 17 and photographi-cally in Fig. 18.
Based on the observations and measurements presented inthis manuscript, it is known that the Manalana wetland isunderlain by a deep clay material (> 4 m) with a moderatehydraulic conductivity in relation to an overlying dense claywith extremely low hydraulic conductivity (somewhere be-tween 4 m–2 m). At considerable depth, certainly beyond6 m the wetland is bounded by bedrock and saprolitic ma-terial. It is also known that the clays have a particularly high
density at the confluence of the two arms of the wetland, ad-jacent to the clay-plug. In addition, the near sub-surface ofthe wetland is largely a sandy horizon with high hydraulicconductivity, and in the smaller arm (SW–NE) of the wet-land this horizon is very shallow such that this section is pre-dominantly underlain by clay material, that through lateralilluvial processes, and illuviation of clays from the hillslopeat valley constriction (see Fig. 18) has effectively created anilluvial barrier across the confluence with the larger wetlandregion (SE–NW). Furthermore, as one moves upstream alongthe larger wetland region, material becomes less consolidatedgiving way to a deeper sandy matrix.
Understanding of climatically induced evolution of wet-lands in southern Africa is outlined in Ellery et al. (2008),as being intimately linked with glacial and interglacial pe-riods of erosion dominated cycles attributed to the warmerand wetter conditions of the latter, and deposition dominateddryer cycles of the former. Furthermore, the clarity of ero-sion terraces seen within the Manalana catchment reveal thatthis is indeed the case and the process of cut-and-fill valleyevolution in the Manalana has been discussed by Ellery andKotze (2008), and this reciprocates the findings discussedhere, as valley bottom in-filling is noted through our inter-pretations presented here.
Given the fact that the Manalana represents one of manysub-catchments at the Sand Rivers headwaters which areall in a similar state of degradation the identification ofhydro-geomorphic buffers/barriers, such as clay-plugs is cru-cial. This relates to the concept of catchment connectivity.Whereby, the connectivity of process domains from coupledhillslope-valley bottom wetlands and longitudinal through-wetland processes, as in the case of Manalana catchmentand others, are increasing significantly due to degradationprocess such as erosion gullying. This relates to a con-cept described by Fryirs et al. (2006) where, the identifica-tion and understanding of the hydro-geomorphic processesthat buffers/barriers (be they rock outcrops or differentialsediment depositions) facilitate in terms of switching onor off these coupled processes within a fluvial network, isimportant for their successful management. Therefore inlight of the already determined hydraulic function that thesub-surface clay-plugs have in terms of ameliorating lateralthroughflows in the wetland, and the possible identificationof hydro-geomorphic process zones that engender the devel-opment of these clay-plug buffers, one should now be able toidentify zones within these catchments where they are likelyto occur (cryptically). This therefore provides a means toprotect these zones, in the absence of access to technical geo-physical equipment, one proposes that to reveal and delin-eate the location of these clay-plugs, identification of regionsof valley constriction be made, which may then be analyzedqualitatively through in-situ soil analysis for their clay con-tent.
Hydrol. Earth Syst. Sci., 14, 1697–1713, 2010 www.hydrol-earth-syst-sci.net/14/1697/2010/
E. S. Riddell et al.: A geophysical analysis of hydro-geomorphic controls 1711
Fig. 17. Schematic of conceptual model for clay-plug development in the Manalana wetland (not to scale).
Fig. 18. South facing view of the Manalana wetland (solid line)with proposed model for clay-plug development highlighting hills-lope confinement zones and illuviation pathways (dashed line) andilluvial barrier (dotted line). Inset represent aerial view of hillslopeconfinement zones.
Beauvais et al. (1999) successfully used ERI to describehydro-geomorphic processes on other granitic terrains inSenegal by identifying both mechanical and weathering in-duced drivers of hillslope geomorphology. The ERI approachhere using additionally, IP, has similarly assisted in the devel-opment of a conceptual model for the evolution of hydroge-omorphic controls in the wetlands of the Sand River system.However it is interesting to note that even in a relatively re-cent sedimentology study (Baines et al., 2002) making use ofsimilar technology highlighted the lack of a due procedure tobe followed when undertaking such geophysical surveys forgeomorphic understanding. Given that there are a variety ofsources of uncertainty in ERI such as the evenness of elec-trode spacing (e.g. Oldenborger et al., 2005), not accountingfor variations in moisture of the substrate, or even the mis-appropriation of the correct resitivity range for the geologicalarea in question, highlights the importance of ground truthingof ones geophysical data as far as is possible. Despite thesesources of uncertainty Baines et al.(2002) and Loke (1999)advocate the use of qualitative ground truthing to verify geo-
physical interpretations, and the verification approaches usedin this study were highly valuable in this respect. This is anissue that should be developed and refined in the future, par-ticularly where the use of geophysical methods for low costrapid hydro-geomorphic interpretation (outside of the fieldsof geological and mineral prospecting for instance) of wet-lands and other landscape units is required. It is thereforeadvocated here that the combined use of ERI and IP be used,were possible, in cases such as wetland rehabilitation plan-ning. This is particularly pertinent to South Africa, a wa-ter scarce country, where wetland rehabilitation is commonplace and where hydrological and geomorphological data re-lating to the wetland is often lacking. Moreover, it is widelyaccepted that these geophysical approaches add huge valueto understanding hydrological process data in research catch-ments, in which they aid in the extrapolation of point mea-surements to the larger scale (Wenninger et al., 2008). Hencethe data discussed here will be of real benefit for the develop-ment of a hydrological process model of the Manalana wet-land and its sister catchments in the future.
6 Conclusions
The use of the geophysical methods of ERI and IP haveshown their suitability for describing hydro-geomorphicstructures within wetland catchments. In particular these rel-atively rapid approaches are envisaged to have application inthe future for extrapolating hydrological regimes and hydro-geomorphic controls in wetland systems, this has importanthydro-ecological and economic implications for the plethoraof wetland (and river) rehabilitation projects now underwayin South Africa where robust conceptual models of these wet-land processes are required to facilitate appropriate and suc-cessful rehabilitation measures. In this regard the use of thisapproach allowed for the identification of crucial geomor-phic processes that control catchment connectivity in this re-gion. In particular the surveys allowed for the delineation
www.hydrol-earth-syst-sci.net/14/1697/2010/ Hydrol. Earth Syst. Sci., 14, 1697–1713, 2010

1712 E. S. Riddell et al.: A geophysical analysis of hydro-geomorphic controls
of clay-plug sub-surface hydrological buffers and providedinformation on their modes of formation, albeit by inferringwhere they will likely occur with respect to longitudinal val-ley position. The findings will now enable the future protec-tion of these zones from externally derived degradation pro-cesses and it is envisaged that this methodology be suitablyapplied in the future, particularly for wetland rehabilitationplanning.
Acknowledgements.The authors are grateful to the South AfricanWater Research Commission (WRC) and National ResearchFoundation (NRF) for financial support. Professor Fred Ellery(Rhodes University) for assistance with geomorphic conceptsand facilitating the initial wetland monitoring project. The kindassistance of the following people for field assistance, data process-ing and interpretation is duly acknowledged; Johannes Hachman(University of Freiburg), Bertram Koning (University of KwaZulu-Natal). Pieter Le Roux and his team (University of Free State)for assistance in data collection and in interpretation of soil formcharacteristics. Logistical and administrative support was providedby the Association for Water and Rural Development (AWARD).
Edited by: E. Zehe
References
Acocks, J. P. H.: Veld Types of South Africa, Memoirs of the Botan-ical Survey of South Africa, Botanical Research Institute, Dept.of Agriculture and Water Supply (South Africa), 57, 146 pp.,1988.
Baines, D., Smith, D. G., Froese, D. G., Bauman, P., and Nimeck,G.: Electrical resistivity ground imaging (ERGI): a new tool formapping the lithology and geometry of channel-belts and valley-fills, Sedimentology, 49, 441–449, 2002.
Beauvais, A., Ritz, M., Parisot, J. C., Dukhan, M., and Bantsimba,C.: Analysis of poorly stratified lateritic terrains overlying agranitic bedrock in West Africa, using 2-D electrical resistivitytomography, Earth Planet. Sc. Lett., 173, 413–424, 1999.
Beauvais, A., Parisot, J. C., and Savin, C.: Ultramafic rock weather-ing and slope erosion processes in a South West Pacific tropicalenvironment, Geomorphology, 83, 1–13, 2007.
Bouwer, H. and Rice, R. C.: A slug test for determining hydraulicconductivity of unconfined aquifers with completely or partiallypenetrating wells, Water Resour. Res., 12(1), 423–428, 1976.
Dahlin, T.: 2-D resistivity surveying for environmental and engi-neering applications, First Break, 14(7), 275–283, 1996.
Ellery, W. N. and Kotze, D. C.: WET-OutcomeEvaluate, in: WET-Management, The Wetland Management Series, 11 Chapters,edited by: Breen, C., Dini, J., Mitchell, S., and Uys, M., Wa-ter Research Commission, Gezina, Pretoria, WRC Report No.TT 343/08, 2008.
Ellery, W. N., Grenfell, M., Grenfell, S., Kotze, D. C., McCarthy, T.S., Tooth, S., Grundling P. L., Beckedahl, H., Le Maitre, D., andRamsay L.: WET-Origins, Controls on the distribution and dy-namics of wetlands in South Africa, in: WET-Management, TheWetland Management Series, 11 Chapters, edited by: Breen, C.,Dini, J., Mitchell, S., and Uys, M., Water Research Commission,Gezina, Pretoria, WRC Report No. TT-334, 2008.
FAO 1998.: World Reference Base for Soil Resources, Rome Foodand Agriculure Organization of the United Nations FAO, Inter-national Society of Soil Science ISSS-AISS-IBG, InternationalSoil Reference Group, available at:http://www.fao.org/ag/agl/agll/wrb/newkey.stm, last access: January 2010.
Fryirs, K. A., Brierley, G. J., Preston, N. J., and Kasai, M.: Buffers,barriers and blankets: The (dis)connectivity of catchment-scalesediment cascades, Catena, 70(1), 49–67, 2006.
Khomo, L. M. and Rogers, K. H.: Proposed mechanism for theorigin of sodic patches in Kruger National Park, South Africa,Afr. J. Ecol., 43, 29–34, 2005.
Kiberu, J.: Induced polarization and Resistivity measurements ona suite of near surface soil samples and their empirical rela-tionship to selected measured engineering parameters, Intern-tional Institute for Geo-information Science and Earth Observa-tion, Enschede, The Netherlands, availabel at:http://www.itc.nl/library/Papers/msc2002/ereg/kiberu.pdf, (last acces: March2009), 2002.
Kneisel, C.: Assessment of subsurface lithology in mountain en-vironments using 2-D resistivity imaging, Geomorphology, 80,32-44, 2006.
Kohler, M. A. and Linsley, R. K.: Predicting the runoff from stormrainfall. Weather Bureau, US Department of Commerce, Wash-ington, Research Paper No. 34, p. 9, 1951.
Kunz, R.: Daily Rainfall Data Extraction Utility, User Manualv. 1.0, Institute for Commercial Forestry Research, Pietermar-itzburg, Republic of South Africa, 2004.
Loke, M. H.: Electrical imaging surveys for environmental and en-gineering studies: A practical guide to 2-D and 3-D surveys,available at:www.terrajp.co.jp/lokenote.pdf, (last acces: August2008), 1999.
Loke, M. H.: Tutorial: 2-D and 3-D electrical imaging surveys,available at:www.geoelectrical.com, (last acces: August 2008),2004.
Loke, M. H.: Res2dinv 2-D Resisitivity and IP inversion, GeotomoSoftware, Malaysia, available at:www.geoelectrical.com, (lastaccess: August 2008), 2005a.
Loke, M. H.: Res3dinv 3-D Resistivity and IP Inversion, GeotomoSoftware, Malaysia, available at:www.geoelectrical.com, (lastaccess: August 2008), 2005b.
Lowrie, W.: Fundamentals of Geophysics, Second Edition, Cam-bridge University Press, ISBN-13, 9780521859028, 2007.
Marescot, L., Monnet, R., and Chapellier, D.: Resistivity and in-duced polarization surveys for slope instability studies in theSwiss Alps, Eng. Geol., 98(1–2), 18–28, 2008.
Oldenborger, G. A., Routh, P. S., and Knoll, M. D.: Sensitivity ofelectrical resistivity tomography data to electrode position errors,Geophys. J. Int., 163, 1–9, 2005.
Pollard, S., Kotze, D., Ellery, W., Cousins, T., Monareng, J., King,K., and Jewitt, G.: Linking Water and Livelihoods The develop-ment of an integrated wetland rehabilitation plan in the commu-nal areas of the Sand River Catchment as a test case, Associationfor Water and Rural Development Warfsa/Working for Wetlands,AWARD internal report, 2005.
Riddell, E. S., Lorentz, S. A., Ellery, W. N., Kotze, D., Pretorius J.J., and Nketar, S. N.: Water Table Dynamics of a Severely ErodedWetland System, Prior to Rehabilitation, Sand River Catch-ment, South Africa, Proceedings of the XXXV IAH Congress onGroundwater and Ecosystems, 17–21 September, Lisbon, Portu-
Hydrol. Earth Syst. Sci., 14, 1697–1713, 2010 www.hydrol-earth-syst-sci.net/14/1697/2010/

E. S. Riddell et al.: A geophysical analysis of hydro-geomorphic controls 1713
gal, 2007.Riddell, E. S and Lorentz, S. A.: Hydrologic mechanisms in a
granitic hillslope that induce rapid phreatic surface responses ina headwater wetland, in review, 2010.
Robinson, D. A., Binley, A., Crook, N., Day-Lewis, F. D., Ferre,T. P. A., Grauch, V. J. S., Knight, R., Knoll, M., Lakshmi, V.,Miller, R., Nyquist, J., Pellerin, L., Singha, K., and Slater, L.:Advancing process-based watershed hydrological research usingnear-surface geophysics: a vision for, and review of, electricaland magnetic geophysical methods, Hydrol. Process., 22, 3604–3635, 2008.
Ruhe, R.: Elements of the soil landscape, Trans. 7th Intl. Congr.Soil Sci., Madison, WI, 4, 165–170, 1960.
Schaetzl, R., and Anderson, S. (Eds.): Soils: Genesis and Geomor-phology, Cambridge, UK, Cambridge University Press, ISBN-978-0-521-81201-6, 2005.
Sharma, P. V.: Environmental and Engineering Geophysics, Cam-bridge University Press, ISBN-978-0521576321, 2008.
Slater, L. D. and Lesmes, D.: IP interpretation in environmental in-vestigations, Geophysics, 67(1), 77–88, doi:10.1190/1.1451353,2002.
Slater, L. D. and Reeve, A.: Investigating peatland stratigraphyand hyderogeology using integrated electrical geophsics., Geo-physics, 67(2), 365–378, doi:10.1190/1.1468597, 2002.
Smith, R. C. and Sjorgen, D. B.: An evaluation of electrical resis-tivity imaging (ERI) in Quaternary sediments, southern Alberta,Canada, Geosphere, 2(6), 287–298, 2006.
Soil Classification Working Group, Soil classification a taxonomicsystem for South Africa, Memoirs on the Agricultural NaturalResources of South Africa Ed., Memoirs on the Agricultural Nat-ural Resources of South Africa No. 15., SIRI, D.A.T.S., Pretoria,1991.
Tongway, D. J. and Hindley, N. L. (eds.): Landscape FunctionAnalysis: Procedures for monitoring and assessing landscapes,CSIRO Australia, ISBN-0-9751783-0-X, 2004.
Tooth, S. and McCarthy, T. S.: Wetlands in drylands: geomorpho-logical and sedimentological characteristics, with emphasis onexamples from Southern Africa, Prog. Phys. Geog. 31(1), 3–41,2007.
Uhlenbrook, S., Wenninger, J., and Lorentz, S.: What happens af-ter the catchment caught the storm? Hydrological processes atthe small, semi-arid Weatherley catchment, South-Africa, Adv.Geosci., 2, 237–241, doi:10.5194/adgeo-2-237-2005, 2005.
Wenninger, J., Uhlenbrook, S., Lorentz, S., and Leibundgut, C.:Identification of runoff generation processes using combined hy-drometric, tracer and geophysical methods in a headwater catch-ment in South Africa, Hydrolog. Sci. J., 53(1), 65–80, 2008.
www.hydrol-earth-syst-sci.net/14/1697/2010/ Hydrol. Earth Syst. Sci., 14, 1697–1713, 2010


![[FINAL] ERI@N Brochure](https://img.dokumen.tips/doc/110x75/63553498b4909beae3003a89/final-erin-brochure.jpg)


