Embed Size (px)
Citation preview

Chemical Engineering Science 61 (2006) 5427–5439www.elsevier.com/locate/ces
3-D modelling of kerosene-fuelled HVOF thermal spray gun
S. Kamnis, S. Gu∗
School of Engineering and Applied Science, Aston University, Aston Triangle, Birmingham B4 7ET, UK
Received 9 December 2005; received in revised form 6 March 2006; accepted 4 April 2006Available online 21 April 2006
Abstract
Liquid-fuelled high-velocity oxy-fuel (HVOF) thermal spraying systems are capable of generating more momentum output to powderparticles in comparison with gas-fuelled systems. The use of low-cost fuel such as kerosene makes this technology particular attractive. High-quality coating requires thermal spraying systems delivering consistent performance as a result of the combustion during HVOF spraying. Thecombustion of kerosene is very complicated due to the variation of fuel composition and subsequently makes it extremely challenging forprocess control. This paper describes a 3-D simulation using mathematical models available in a commercial finite volume CFD code. Thecombustion and discrete particle models within the numerical code are applied to solve the combustion of kerosene and couple the motion offuel droplets with the gas flow dynamics in a Lagrangian fashion. The effects of liquid fuel droplets on the thermodynamics of the combustinggas flow are examined thoroughly.� 2006 Elsevier Ltd. All rights reserved.
Keywords: CFD; HVOF; Gas dynamics; Combustion; Kerosene
1. Introduction
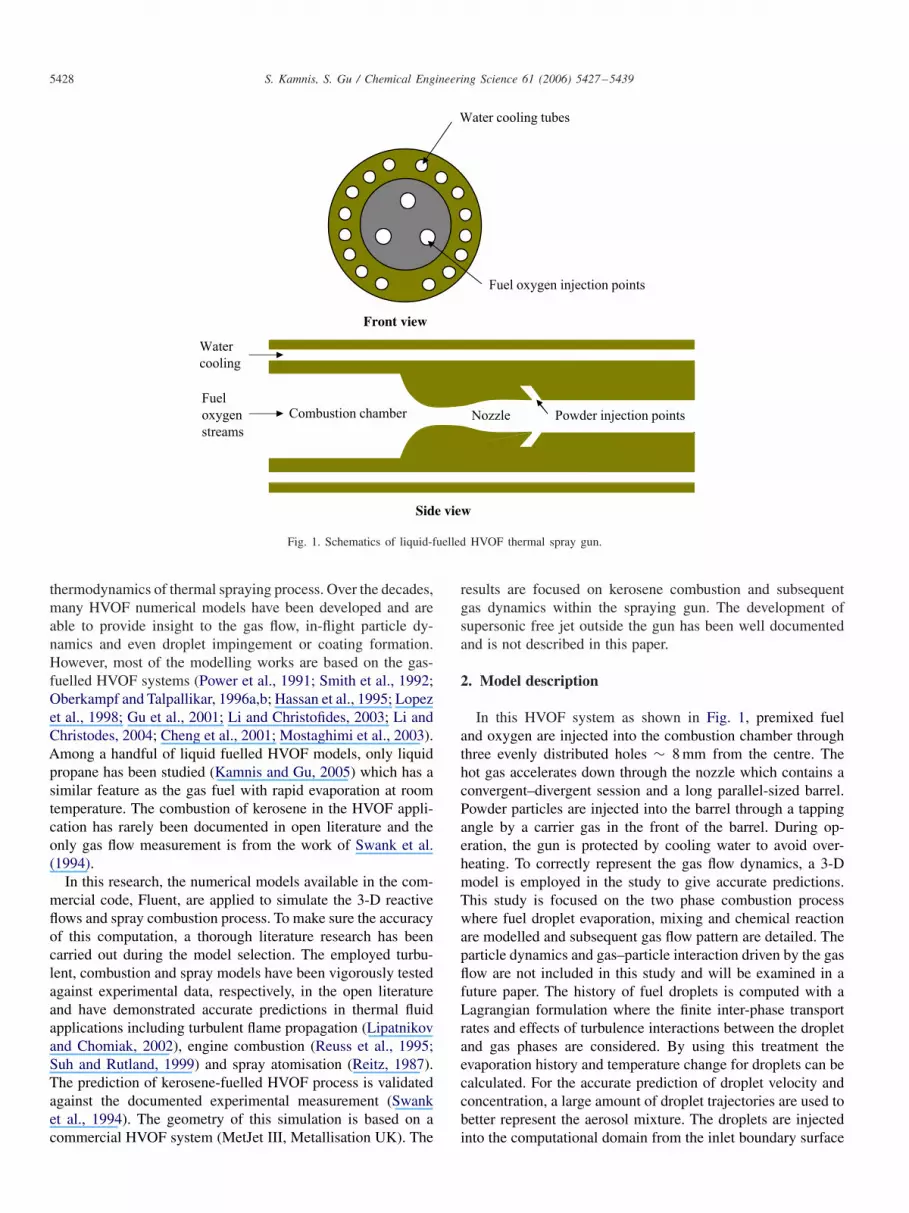
The technology of high-velocity oxygen fuel (HVOF) ther-mal spraying has been transforming from gas-fuelled towardsliquid-fuelled systems. An apparent benefit from that devel-opment is to use low-cost fuels such as kerosene. In addi-tion, liquid-fuelled HVOF guns are normally designed witha convergent–divergent nozzle, which gives superior acceler-ation to the gas flow and high momentum output to pow-der particles. Research on coating microstructure has shownthat liquid-fuelled systems generate denser coating structureand better bonding without over-melting the powder particlesin comparison to gas-fuelled systems (Zhang et al., 2003).During a liquid-fuelled HVOF thermal spraying as shown inFig. 1, premixed fuel and oxygen streams are injected intocombustion chambers and energy generated by the combustionprocess is transformed into a hot high-pressure gas that heatsand accelerates powder particles. Powder is normally fed intothe hot gas stream at upstream of the nozzle instead of being
∗ Corresponding author. Tel.: +44(0)1212043582; fax: +44(0)1213335809.E-mail addresses: [email protected] (S. Kamnis), [email protected]
(S. Gu).
0009-2509/$ - see front matter � 2006 Elsevier Ltd. All rights reserved.doi:10.1016/j.ces.2006.04.005
directly fed into combustion chambers, which effectively re-duces over-heating to powder particles and contributes to theunique feature of high powder impact velocity without over-heating. The overall process of HVOF thermal spraying is verycomplicated with combustion, supersonic flow expansion, tur-bulent mixing and gas–solid interaction. As a critical elementof the process, combustion not only generates the required en-ergy for powder heating but also affects the multiphase flowpattern. An efficient combustion process is very important todeliver consistent quality performance for HVOF spraying. Thecombustion of liquid fuel, such as kerosene is very compli-cated, due to the large variation of composition and fuel quality.A perfectly designed liquid-fuelled HVOF system specialisedfor the UK market may not have the same performance in theUS or other European counties. It is expected that the evapo-ration of fuel droplet would influence the combustion process,therefore, the fuel atomisation mechanism needs to be carefullycontrolled.
To date the research on thermal spraying has progressedin both experimental and modelling fashions. Experimentshave been focused heavily on microstructure characterisationand certain element of in-flight particle diagnosis. Numeri-cal modelling has become an important tool to underpin the
5428 S. Kamnis, S. Gu / Chemical Engineering Science 61 (2006) 5427–5439
Water cooling tubes
Fuel oxygen injection points
Powder injection points
Water
cooling
Fuel
oxygen
streams
Combustion chamber Nozzle
Side view
Front view
Fig. 1. Schematics of liquid-fuelled HVOF thermal spray gun.
thermodynamics of thermal spraying process. Over the decades,many HVOF numerical models have been developed and areable to provide insight to the gas flow, in-flight particle dy-namics and even droplet impingement or coating formation.However, most of the modelling works are based on the gas-fuelled HVOF systems (Power et al., 1991; Smith et al., 1992;Oberkampf and Talpallikar, 1996a,b; Hassan et al., 1995; Lopezet al., 1998; Gu et al., 2001; Li and Christofides, 2003; Li andChristodes, 2004; Cheng et al., 2001; Mostaghimi et al., 2003).Among a handful of liquid fuelled HVOF models, only liquidpropane has been studied (Kamnis and Gu, 2005) which has asimilar feature as the gas fuel with rapid evaporation at roomtemperature. The combustion of kerosene in the HVOF appli-cation has rarely been documented in open literature and theonly gas flow measurement is from the work of Swank et al.(1994).
In this research, the numerical models available in the com-mercial code, Fluent, are applied to simulate the 3-D reactiveflows and spray combustion process. To make sure the accuracyof this computation, a thorough literature research has beencarried out during the model selection. The employed turbu-lent, combustion and spray models have been vigorously testedagainst experimental data, respectively, in the open literatureand have demonstrated accurate predictions in thermal fluidapplications including turbulent flame propagation (Lipatnikovand Chomiak, 2002), engine combustion (Reuss et al., 1995;Suh and Rutland, 1999) and spray atomisation (Reitz, 1987).The prediction of kerosene-fuelled HVOF process is validatedagainst the documented experimental measurement (Swanket al., 1994). The geometry of this simulation is based on acommercial HVOF system (MetJet III, Metallisation UK). The
results are focused on kerosene combustion and subsequentgas dynamics within the spraying gun. The development ofsupersonic free jet outside the gun has been well documentedand is not described in this paper.
2. Model description
In this HVOF system as shown in Fig. 1, premixed fueland oxygen are injected into the combustion chamber throughthree evenly distributed holes ∼ 8 mm from the centre. Thehot gas accelerates down through the nozzle which contains aconvergent–divergent session and a long parallel-sized barrel.Powder particles are injected into the barrel through a tappingangle by a carrier gas in the front of the barrel. During op-eration, the gun is protected by cooling water to avoid over-heating. To correctly represent the gas flow dynamics, a 3-Dmodel is employed in the study to give accurate predictions.This study is focused on the two phase combustion processwhere fuel droplet evaporation, mixing and chemical reactionare modelled and subsequent gas flow pattern are detailed. Theparticle dynamics and gas–particle interaction driven by the gasflow are not included in this study and will be examined in afuture paper. The history of fuel droplets is computed with aLagrangian formulation where the finite inter-phase transportrates and effects of turbulence interactions between the dropletand gas phases are considered. By using this treatment theevaporation history and temperature change for droplets can becalculated. For the accurate prediction of droplet velocity andconcentration, a large amount of droplet trajectories are used tobetter represent the aerosol mixture. The droplets are injectedinto the computational domain from the inlet boundary surface
S. Kamnis, S. Gu / Chemical Engineering Science 61 (2006) 5427–5439 5429
with uniform size distribution. The study is intended to shedlight on the importance of fuel atomisation process. However,the physical atomisation process and the resulted droplet diam-eter distribution prior to injection are out of the scope of thispaper. The conditions under which each droplet has a set ofgoverning equations are:
1. The liquid droplet and oxygen gas phases have their owninitial continuous velocity and temperature and co-exist ateach location in the flow field.
2. Liquid phase has its own turbulent fluctuations that result inturbulent droplet transport of mass, momentum and energy.The random effects of turbulence on the particle motion arecounted by integrating the individual particle trajectory withthe instantaneous fluid velocity.
3. The density ratio for droplet to gas phases is large, thereforethe effects of pressure gradients, virtual mass and Saffmanforces are neglected.
4. The droplet collisions are neglected and droplets do notbreak up during the evaporation process while chemical re-action in the droplets is also neglected.
The operation parameters are 0.003526 kg s−1 for kerosene and0.01197 kg s−1 for oxygen. The computational simulation isperformed using a commercial finite volume code FLUENT. Allthe numerical models being applied are ready available withinthe FLUENT code and their details are given in the followingsection.
2.1. Mathematical models
2.1.1. Gas flow modelThe governing equations for the 3-D model in the Cartesian
tensor form are:mass conservation equation:
�
�xi
(�ui) = 0, (1)
momentum conservation:
�
�xj
(�uiuj ) = − �p
�xi
+ �
�xj
(�ij )eff + �
�xj
(−�u′iu
′j ), (2)
energy transport equation:
�
�xi
[ui(�E + p)] = �
�xj
(Keff
�T
�xj
+ ui(�ij )eff
)+ Sh, (3)
where the deviatoric stress tensor is given by
(�ij )eff = �eff
(�uj
�xi
+ �ui
�xj
)− 2
3�eff
�ui
�xi
�ij . (4)
The effective thermal conductivity is
Keff = K + cp�t
�t
. (5)
2.1.2. Particle modelEquations of motion: The equation of motion for particles
can be written as a force balance that equates the droplet inertiawith forces acting on the droplet:
dup
dt= FD(u − up) + gx(�p − �)
�p
+ Fx . (6)
The drag force per unit particle mass is
FD = 18�
�pd2p
CDRe
24. (7)
The drag coefficient CD given by Morsi and Alexander (1972)
CD = 24
Red
(1 + b1Reb2d ) + b3Red
b4 + Red
, (8)
b1 = exp(2.3288 − 6.4581� + 2.4486�2),
b2 = 0.0964 + 0.5565�,
b3 = exp(4.905 − 13.8944� + 18.4222�2 − 10.2599�3),
b4 = exp(1.4681 + 12.2584� − 20.7322�2 + 15.8855�3).
(9)
The shape factor � given by Haider and Levenspiel (1989) is
� = s
S. (10)
The relative Reynolds number is defined as
Re = �dp|up − u|�
. (11)
Turbulent effects on particles: The turbulent dispersion ofparticles is predicted by a stochastic tracking approach. Therandom effects of turbulence on the particle motion are countedby integrating the individual particle trajectory with the instan-taneous fluid velocity. Eq. (12) describes the time spent in tur-bulent motion along the particle path ds
T =∫ ∞
0
u′p(t)u′
p(t + s)
u′2p
ds. (12)
The Lagrangian integral time, TL, can be obtained by matching
the diffusivity of particles u′iu
′̄j TL with the predicted diffusion
rate vt/� by the realizable k.� turbulence model as follows:
TL ≈ 0.15k
�. (13)
Heat and mass transfer: The droplet heating law is appliedwhen the droplet temperature is lower than the vaporisationtemperature where a heat balance is applied:
mpcp
dTp
dt= hAp
(T∞ − Tp
)+ �pAp�(4R − T 4
p
). (14)
The heat transfer coefficient is evaluated using the Ranz andMarshall (1952a,b) correlation:
Nu = hdp
k∞= 2.0 + 0.6 Re1/2
d P r1/3. (15)
5430 S. Kamnis, S. Gu / Chemical Engineering Science 61 (2006) 5427–5439
When the droplet temperature reaches the vaporisation temper-ature the vaporisation law is activated. The droplet mass reduc-tion is calculated according to
mp(t + �t) = mp(t) − NiApM,i�t , (16)
where
Ni = Kc(Ci,s − Ci,∞). (17)
The mass transfer coefficient is calculated according to
NuAB = Kcdp
Di,m
= 2.0 + 0.6 Re1/2d Sc1/3 (18)
and
Ci,s = psat(Tp)
RT p
, Ci,∞ = Xi
pop
RT ∞. (19)
2.2. Turbulent model
A wide variety of flow problems can be calculated by usingthe standard k.� model (Launder and Spalding, 1972) basedon the presumption that an analogy between the action of vis-cous stresses and Reynolds stresses on the mean flow exists.Although it is usually acceptably accurate for simple flows, in-accuracies could rise from the turbulent-viscosity hypothesisand from the equation of turbulence dissipation rate for com-plex flows (Stephen, 2001). Improvement has been made to thestandard k.� model, a recent development is the realizable k.�model (Shih et al., 1995). The transport equations for the real-izable k.� model are:
turbulent kinetic transport equation:
�
�t(�k) + �
�xi
(�kuj ) = �
�xi
[(� + �t
�k
)�k
�xj
]+ Gk + Gb
− �� − YM + Sk , (20)
rate of dissipation of energy from the turbulent flow:
�
�t(��) + �
�xj
(��uj ) = �
�xj
[(� + �t
��
)��
�xj
]+ �C1S�
− �C2�2
k + √��
+ C1��
kC2�Gb + S�,
(21)
where the turbulent viscosity is
�t = �C�k2
�. (22)
The coefficient of dynamic viscosity is
C� = 1
A0 + As(kU/�). (23)
In comparison with the standard k.� model, the realizable k.�model contains a new formulation of the turbulent viscositywhere the dynamic viscosity coefficient is no longer constant(Shih et al., 1995).
2.3. Combustion models
The liquid fuel kerosene is a mixture of many individualmolecules of different sizes in the alkane family, CnH2n+2. Thecarbon number in kerosene is in the range of 9–17. This liquidfuel therefore has no definite chemical formula because of thenature of its compositions. In the present study, C12H26 is usedto have a representative average value for the individual com-ponents. The combustion kinetics is represented by one globalreaction scheme which takes dissociations and intermediate re-actions into account
n1C12H26 + n2O2 → n3CO2 + n4H2O + n5CO + n6OH
+ n7O2 + n8O + n9H2 + n10H.
These coefficients are dependent on variables such as the com-bustion chamber pressure, fuel to oxygen ratio, mass flow rateor even the torch geometry. To derive those coefficients for eachcomputational case, an iterative approach (Li et al., 2004, 2005)based on a chemical equilibrium model is employed to makesure the coefficients representing the correct pressure level andthermal flow field. An eddy dissipation model is used to solvethis global reaction. This approach is based on the solutionof transport equations for species mass fractions. The reactionrates are assumed to be controlled by the turbulence insteadof the calculation of Arrhenius chemical kinetics. The net rateof production for species i due to reaction r , is given by thesmaller of the two expressions below:
Ri,r = vi,rMw,iA��
kmin
(YR
vR,rM,R
), (24)
Ri,r = vi,rMw,iAB��
k
( ∑P YP∑N
j vj,rM,j
). (25)
2.4. Model development
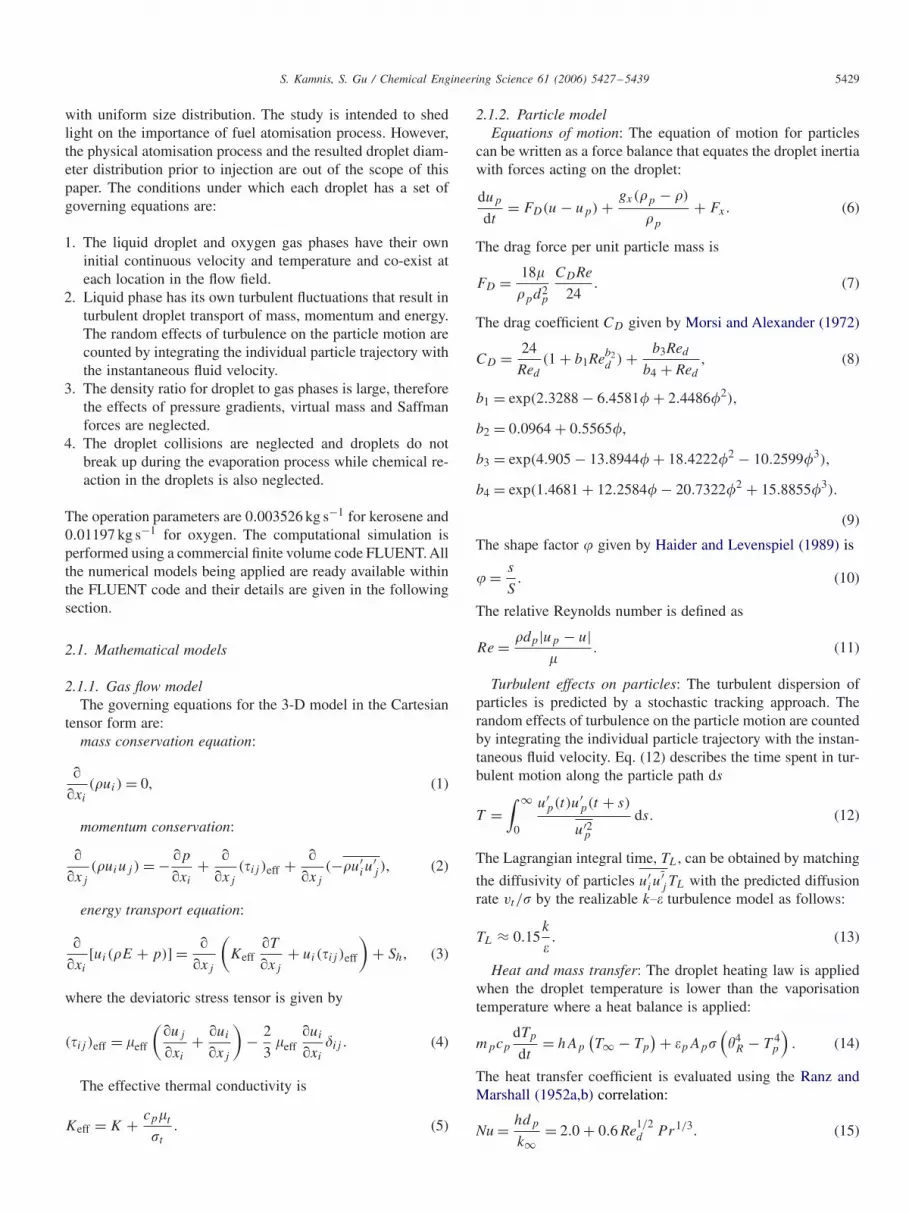
A 3-D computational model is developed to represent theconfiguration shown in Fig. 1. Unstructured grid is deployedthroughout the domain and the mesh is refined along the cen-treline and in the nozzle region. Fig. 2 shows the grid structurewithin the combustion chamber and the divergent convergentnozzle part. After the examination of grid dependence, the finalgrid has total tetrahedral mesh volumes of 1,108,000.
The numerical method used in this study is a segregatedsolution algorithm (Van Doormal et al., 1987) with a controlvolume-based technique. The segregated solution is chosen, dueto the advantage over the alternative method of strong couplingbetween the velocities and pressure. This can help to avoidconvergence problems and oscillations in pressure and velocityfields. This technique consists of an integration of the govern-ing equations of mass, momentum, species, energy and turbu-lence on the individual cells within the computational domainto construct algebraic equations for each unknown dependentvariable. The pressure and velocity are coupled using the SIM-PLE (semi-implicit method for pressure linked equations) al-gorithm (Peric, 1990; Raithby and Schneider, 1979) which uses
S. Kamnis, S. Gu / Chemical Engineering Science 61 (2006) 5427–5439 5431
Fig. 2. Grid structure within the combustion chamber and convergent divergent nozzle part.
00 1 2 3 4 5 6 7
200
400
600
800
1000
1200
1400
1600
1800
Vel
oci
ty (
m/s
)
(a) Radial Distance (mm)
Experiment
CFD model
0 2 4 6 100
500
1000
1500
2000
2500
Radial Distance (mm)
Tem
per
atu
re (
K)
Experiment
CFD model
(b)8
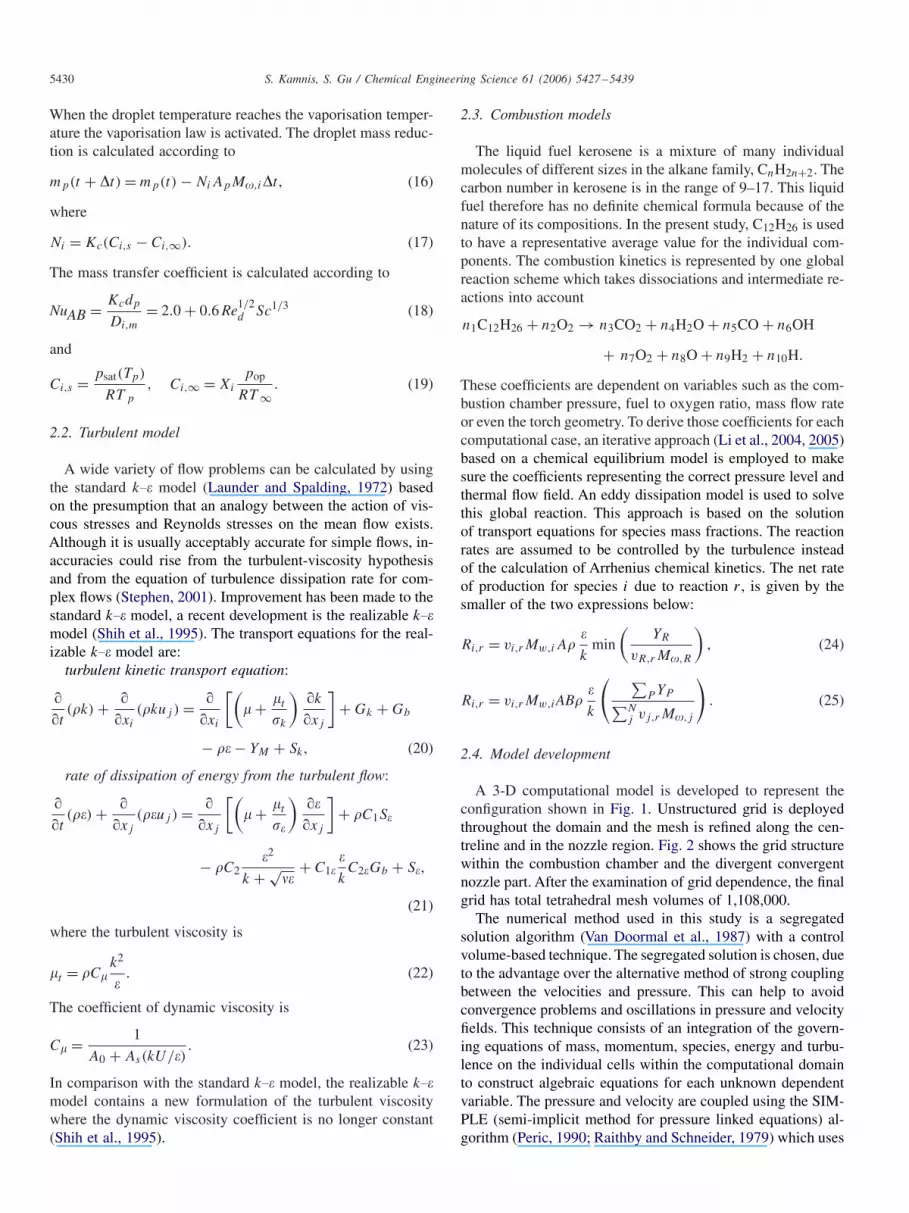
Fig. 3. Comparison of modelling prediction with gas flow measurement(Swank et al., 1994): (a) gas velocity at the exit of the gun; (b) gas temperatureat the exit of the gun.
a guess-and-correct procedure for the calculation of pressureon the staggered grid arrangement. It is more economical andstable compared to the other algorithms. The second order up-wind scheme is employed for the discretisation of the modelequations as it is always bounded and provides stability for thepressure-correction equation.
The numerical methods and mathematical models are firstapplied to a kerosene-fuelled 2-D geometry based on theJP-5000 (Praxair, US) HVOF gun. The predicted results are
Table 1Initial conditions of boundaries
Boundaries Initial conditions
Fuel inlet Temperature: 300 KMass flow rate: 1.175 g s−1
Oxygen inlet Temperature: 300 KMass flow rate: 4.3 g s−1
Wall Temperature: 300 KPressure outlet Pressure: 1.103 × 10⁵ Pa
compared with the gas flow measurement (Swank et al., 1994)and a reasonable agreement is achieved as shown in Fig. 3.The validated numerical approach is then deployed to the 3-Dgeometry and the results are described in the following section.
3. Results and discussions
3.1. Flame structure
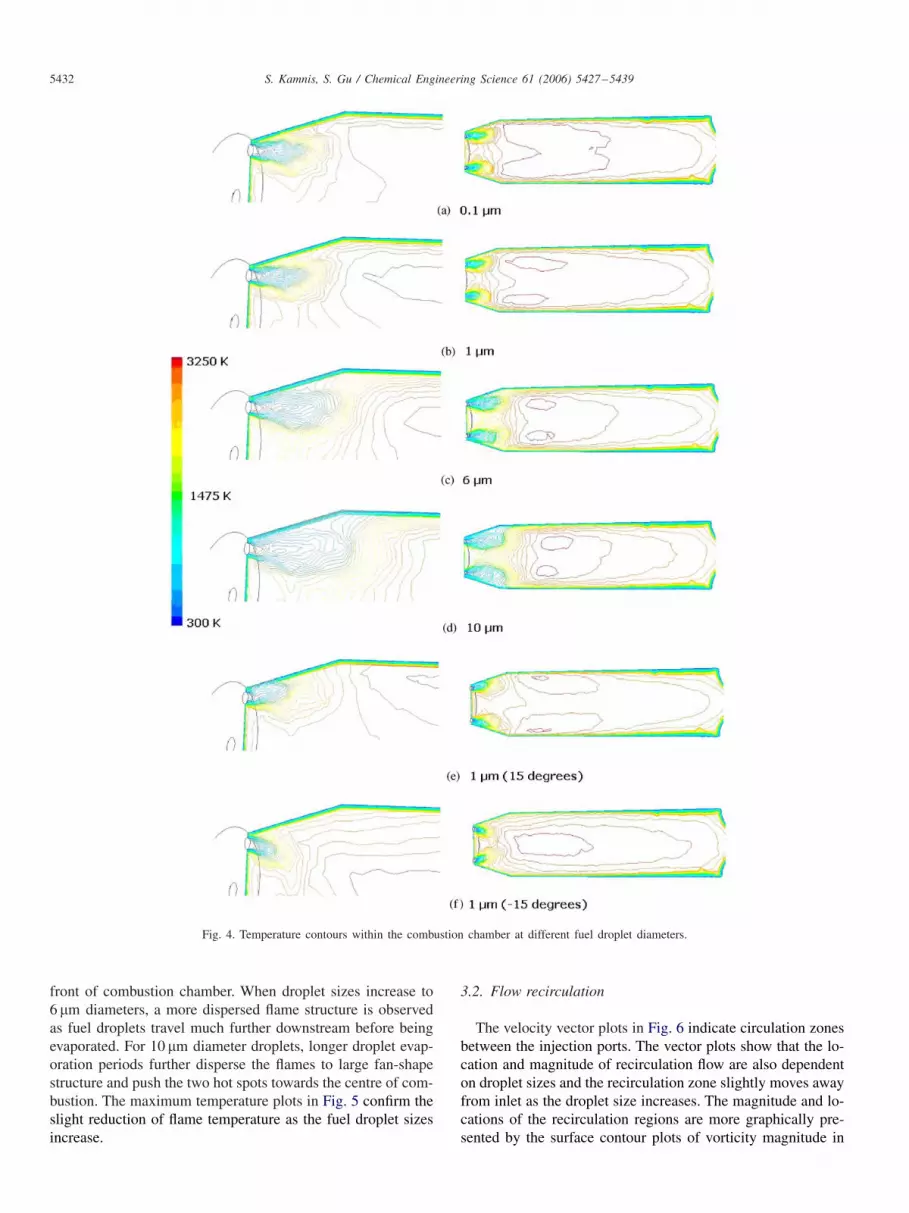
The development of cold fuel-plus-oxygen streams (givenan initial temperature of 300 K as shown in Table 1) to hotflames is illustrated by the temperature contour plots in Fig. 4.The close distance between the side walls and injection portstends to shape the flames towards the side walls. Unlike gasfuel which has instantaneous combustion, liquid fuel combus-tion takes place as fuel droplets evaporate. The evaporation ofthe droplets is faster in the periphery of the mixture jet andslower at the centre of the jet. Therefore, the flame structure isclosely related to the droplet sizes. When fuel droplets are verysmall, rapid heat transfer occurs through the droplet by the sur-rounding hot gas and the droplets evaporate rapidly, as a result,a combustion process similar to gas fuel could be expected. Inthis study, fine droplets of 0.1 �m diameters are injected whichgenerate a confined corn-shape flame and give more uniformtemperature profile within the combustion chamber. Furtherexamination is to increase the droplet size to 1 �m diameter,there is no noticeable change of flame structure which impliesa marginal variation of droplet evaporation time. However, thetemperature profile within the combustion chamber is changedfrom a more uniform output to two separate hot spots in the
5432 S. Kamnis, S. Gu / Chemical Engineering Science 61 (2006) 5427–5439
Fig. 4. Temperature contours within the combustion chamber at different fuel droplet diameters.
front of combustion chamber. When droplet sizes increase to6 �m diameters, a more dispersed flame structure is observedas fuel droplets travel much further downstream before beingevaporated. For 10 �m diameter droplets, longer droplet evap-oration periods further disperse the flames to large fan-shapestructure and push the two hot spots towards the centre of com-bustion. The maximum temperature plots in Fig. 5 confirm theslight reduction of flame temperature as the fuel droplet sizesincrease.
3.2. Flow recirculation
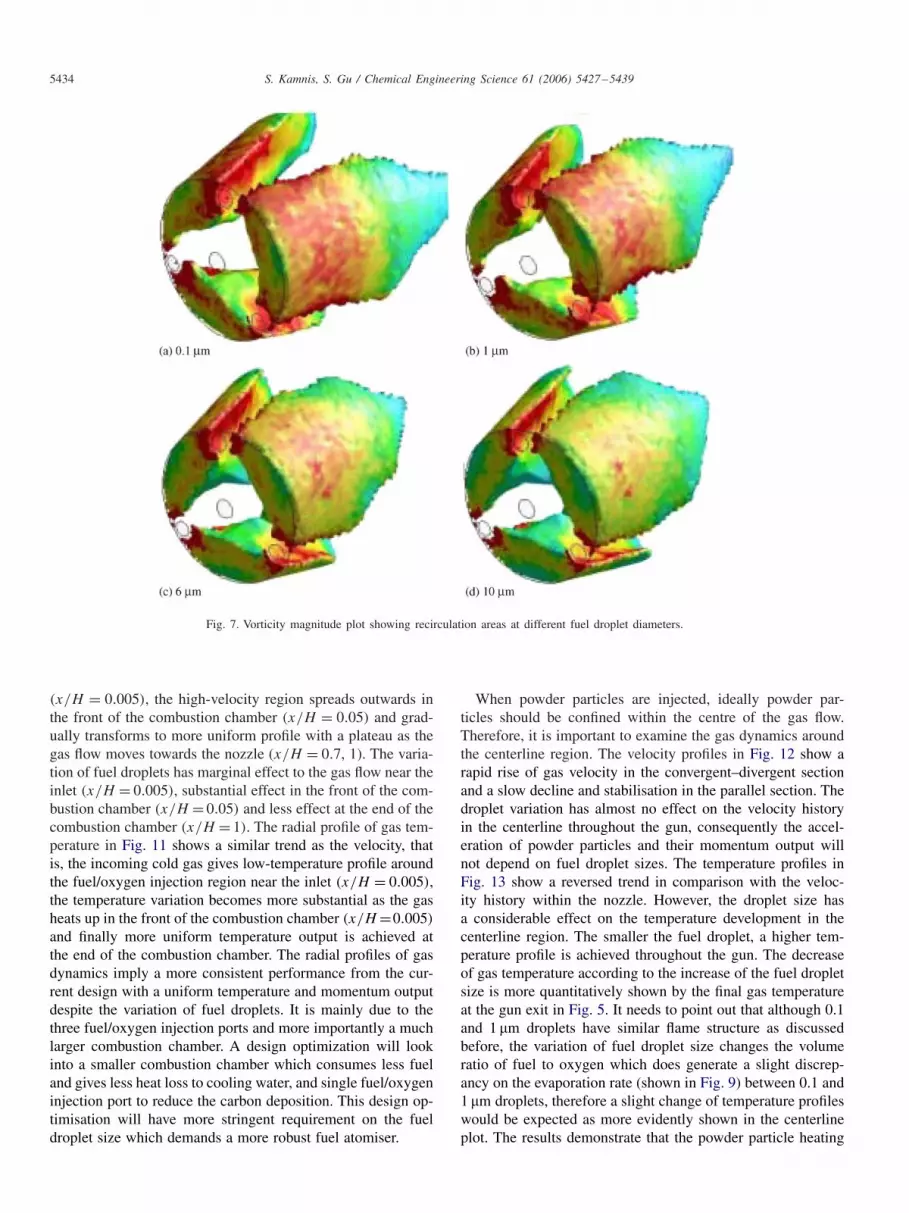
The velocity vector plots in Fig. 6 indicate circulation zonesbetween the injection ports. The vector plots show that the lo-cation and magnitude of recirculation flow are also dependenton droplet sizes and the recirculation zone slightly moves awayfrom inlet as the droplet size increases. The magnitude and lo-cations of the recirculation regions are more graphically pre-sented by the surface contour plots of vorticity magnitude in

S. Kamnis, S. Gu / Chemical Engineering Science 61 (2006) 5427–5439 5433
Fig. 7. Due to the periodic nature of the geometry, the flowpattern around one injection part shall give a good representa-tion of the overall flow dynamics, in this case, attention shouldbe given to the top injection port. The red regions representthe significance of vorticity (recirculation flow). It is shownthat large area of recirculation appears on the side surface andaround the top injection hole for 0.1 �m diameter droplets; therecirculation regions has not changed noticeably as the dropletsincrease to 1 �m; recirculation flows have vanished mostly onthe side surface and shrunk slightly around the top injectionhole for 6 �m droplets; recirculation flows are reduced furtherfor 10 �m droplets. Overall the results illustrate a substantialreduction of recirculation flows as the droplet size increases.
1500
2000
2500
3000
3500
1086420 12Droplet Diameter (µm)
Tem
per
atu
re (
K) Maximum Temperature
Exit Temperature
Fig. 5. Temperature development at different fuel droplet diameters.
Fig. 6. Velocity vectors within the combustion chamber for different fuel droplet diameters.
3.3. Droplet evaporation
The trajectories of fuel droplets at various sizes are vividlyshown in Fig. 8. Apparently small droplets only endure shortdistances and are confined within a more uniform pattern whilelarge droplets travel much further and disperse into the gas flow.The in-flight droplet evaporation along the core of the flamesis more quantitatively shown in Fig. 9. The liquid droplets startto evaporate as they enter the combustion chamber, the evap-oration rate increases rapidly as the droplets are heated up,the evaporation rate peaks when the majority of liquid fuel istransformed into gas and the evaporation slows down to a com-plete end as liquid fuel dries out. The results confirm that largedroplets travel greater distance before disappearing. It is inter-esting to point out that 0.1 and 1 �m droplets share good de-gree of resemblance in their evaporation histories despite thesubstantial difference of their sizes. That confirms the previousdiscussion that both droplets have similar flame structures inthe current operation condition. This result implies that a cost-effective droplet size could be found as the droplet evaporationrate approaches stagnation point. In this case, an ideally de-signed atomiser for the kerosene-fuelled HVOF gun operatingin the current flow rate shall produce droplet sizes around 1 �m.
3.4. Gas flow dynamics
The radial profile of gas velocity within the combus-tion chamber in Fig. 10 shows that a surge of gas velocityat the fuel/oxygen injection region is found near the inlet
5434 S. Kamnis, S. Gu / Chemical Engineering Science 61 (2006) 5427–5439
Fig. 7. Vorticity magnitude plot showing recirculation areas at different fuel droplet diameters.
(x/H = 0.005), the high-velocity region spreads outwards inthe front of the combustion chamber (x/H = 0.05) and grad-ually transforms to more uniform profile with a plateau as thegas flow moves towards the nozzle (x/H = 0.7, 1). The varia-tion of fuel droplets has marginal effect to the gas flow near theinlet (x/H = 0.005), substantial effect in the front of the com-bustion chamber (x/H = 0.05) and less effect at the end of thecombustion chamber (x/H = 1). The radial profile of gas tem-perature in Fig. 11 shows a similar trend as the velocity, thatis, the incoming cold gas gives low-temperature profile aroundthe fuel/oxygen injection region near the inlet (x/H = 0.005),the temperature variation becomes more substantial as the gasheats up in the front of the combustion chamber (x/H =0.005)
and finally more uniform temperature output is achieved atthe end of the combustion chamber. The radial profiles of gasdynamics imply a more consistent performance from the cur-rent design with a uniform temperature and momentum outputdespite the variation of fuel droplets. It is mainly due to thethree fuel/oxygen injection ports and more importantly a muchlarger combustion chamber. A design optimization will lookinto a smaller combustion chamber which consumes less fueland gives less heat loss to cooling water, and single fuel/oxygeninjection port to reduce the carbon deposition. This design op-timisation will have more stringent requirement on the fueldroplet size which demands a more robust fuel atomiser.
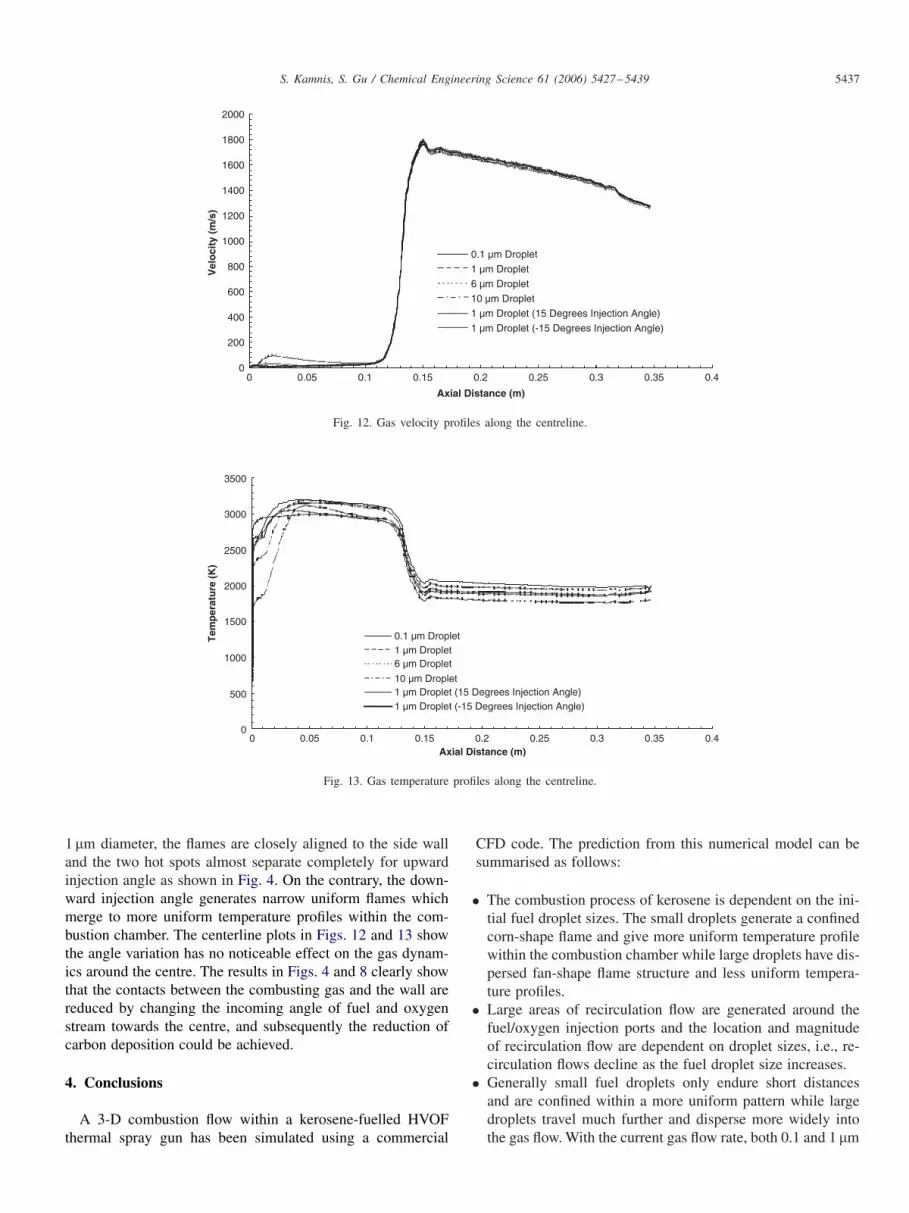
When powder particles are injected, ideally powder par-ticles should be confined within the centre of the gas flow.Therefore, it is important to examine the gas dynamics aroundthe centerline region. The velocity profiles in Fig. 12 show arapid rise of gas velocity in the convergent–divergent sectionand a slow decline and stabilisation in the parallel section. Thedroplet variation has almost no effect on the velocity historyin the centerline throughout the gun, consequently the accel-eration of powder particles and their momentum output willnot depend on fuel droplet sizes. The temperature profiles inFig. 13 show a reversed trend in comparison with the veloc-ity history within the nozzle. However, the droplet size hasa considerable effect on the temperature development in thecenterline region. The smaller the fuel droplet, a higher tem-perature profile is achieved throughout the gun. The decreaseof gas temperature according to the increase of the fuel dropletsize is more quantitatively shown by the final gas temperatureat the gun exit in Fig. 5. It needs to point out that although 0.1and 1 �m droplets have similar flame structure as discussedbefore, the variation of fuel droplet size changes the volumeratio of fuel to oxygen which does generate a slight discrep-ancy on the evaporation rate (shown in Fig. 9) between 0.1 and1 �m droplets, therefore a slight change of temperature profileswould be expected as more evidently shown in the centerlineplot. The results demonstrate that the powder particle heating

S. Kamnis, S. Gu / Chemical Engineering Science 61 (2006) 5427–5439 5435
Fig. 8. Droplet trajectories showing the droplet size evolution.
0.00E+00
2.00E-06
4.00E-06
6.00E-06
8.00E-06
1.00E-05
1.20E-05
1.40E-05
Position from F/O inlet (m)
Eva
po
rati
on
rat
e(kg
/s)
0.1 µm Droplet1 µm Droplet 6 µm Droplet 10 µm Droplet
0 0.005 0.01 0.015 0.02 0.025 0.03 0.035 0.04
Fig. 9. Evaporation rates along the core of the flames.

5436 S. Kamnis, S. Gu / Chemical Engineering Science 61 (2006) 5427–5439
U0=139 m/sH=0.1m
R=0.01728
0.9
0.8
0.7
0.6
0.5
0.4
0.3
0.2
0.1
00 0.1 0.2 0.3 0.4 0.5 0.6 0.7 0.8 0.9 1
-0.1
1
Radial Distance r/R
Vel
oci
ty U
/U0
0.1 µm Droplet x/H=0.005 10 µm Droplet x/H=0.005
0.1 µm Droplet x/H=0.05 10 µm Droplet x/H=0.05
0.1 µm Droplet x/H=0.7 10 µm Droplet x/H=0.7
0.1 µm Droplet x/H =1 10 µm Droplet x/H=1
Fig. 10. Gas velocity radial profiles within the combustion chamber.
T0=3210 K
H=0.1m
R=0.01728m
0
0.9
0.8
0.7
0.6
0.5
0.4
0.3
0.2
0.1
1
Radial Distance r/R
Tem
pera
ture
T/T
0
0 0.1 0.2 0.3 0.4 0.5 0.6 0.7 0.8 0.9 1
0.1 µm Droplet x/H=0.001
0.1 µm Droplet x/H=0.05
0.1 µm Droplet x/H=0.7
0.1 µm Droplet x/H =1
10 µm Droplet x/H=0.001
10 µm Droplet x/H=0.05
10 µm Droplet x/H=0.7
10 µm Droplet x/H=1
Fig. 11. Gas temperature radial profiles within the combustion chamber.
process is dependent on the fuel droplet size that implies theimportance of fuel atomisation process.
3.5. Injection angle
The current system implements a parallel injection mech-anism to all three ports. The results of droplet motions inFig. 8 show that large droplet stream disperses to great extent
and their flames have closer contact with the side wall as shownin Fig. 4. One of the major problems with the three injectionports is the carbon deposition which is a result of closer contactbetween the flames and walls and has detrimental effect on theoperation life of the nozzle. It is interesting to see whether thevariation of injection angle affects the combustion and gas dy-namics within the gun. In this study, injection angles are variedto 15◦ upward (+) and downward (−), respectively, accord-ing to the current injection axes. With the fuel droplet size of
S. Kamnis, S. Gu / Chemical Engineering Science 61 (2006) 5427–5439 5437
2000
1800
1600
1400
1200
1000
800
600
400
200
00 0.05 0.1 0.15 0.2 0.25 0.3 0.35 0.4
Axial Distance (m)
Vel
oci
ty (
m/s
)
0.1 µm Droplet
1 µm Droplet
6 µm Droplet
10 µm Droplet
1 µm Droplet (15 Degrees Injection Angle)
1 µm Droplet (-15 Degrees Injection Angle)
Fig. 12. Gas velocity profiles along the centreline.
0
500
1000
1500
2000
2500
3000
3500
0 0.05 0.1 0.15 0.2 0.25 0.3 0.35 0.4Axial Distance (m)
Tem
per
atu
re (
K)
0.1 µm Droplet1 µm Droplet 6 µm Droplet
10 µm Droplet 1 µm Droplet (15 Degrees Injection Angle) 1 µm Droplet (-15 Degrees Injection Angle)
Fig. 13. Gas temperature profiles along the centreline.
1 �m diameter, the flames are closely aligned to the side walland the two hot spots almost separate completely for upwardinjection angle as shown in Fig. 4. On the contrary, the down-ward injection angle generates narrow uniform flames whichmerge to more uniform temperature profiles within the com-bustion chamber. The centerline plots in Figs. 12 and 13 showthe angle variation has no noticeable effect on the gas dynam-ics around the centre. The results in Figs. 4 and 8 clearly showthat the contacts between the combusting gas and the wall arereduced by changing the incoming angle of fuel and oxygenstream towards the centre, and subsequently the reduction ofcarbon deposition could be achieved.
4. Conclusions
A 3-D combustion flow within a kerosene-fuelled HVOFthermal spray gun has been simulated using a commercial
CFD code. The prediction from this numerical model can besummarised as follows:
• The combustion process of kerosene is dependent on the ini-tial fuel droplet sizes. The small droplets generate a confinedcorn-shape flame and give more uniform temperature profilewithin the combustion chamber while large droplets have dis-persed fan-shape flame structure and less uniform tempera-ture profiles.
• Large areas of recirculation flow are generated around thefuel/oxygen injection ports and the location and magnitudeof recirculation flow are dependent on droplet sizes, i.e., re-circulation flows decline as the fuel droplet size increases.
• Generally small fuel droplets only endure short distancesand are confined within a more uniform pattern while largedroplets travel much further and disperse more widely intothe gas flow. With the current gas flow rate, both 0.1 and 1 �m

5438 S. Kamnis, S. Gu / Chemical Engineering Science 61 (2006) 5427–5439
fuel droplets have similar core length of the flames and evap-oration rate which implies that an optimised atomisor shouldproduce droplet size around 1 �m to achieve cost-effectiveoperation.
• The acceleration of powder particle is less sensitive to thevariation of fuel droplet size while more dependency is pre-dicted for the particle heating process. The current design ofthe three fuel/oxygen injection ports with large combustionchamber is able to generate uniform temperature and momen-tum output despite the variation of fuel droplet sizes.
• It is possible to overcome the problem of carbon depositionfrom the current design by changing the incoming angle offuel and oxygen stream towards the centre, which will effec-tively reduce the contact between the combusting gas and theinternal wall surfaces.
Notation
General symbols
A constant in eddy dissipation model = 4.0A0 constant in realizable �.� model = 4.04Ap surface area of the droplet, m2
As coefficient in realizable �.� modelB constant in eddy dissipation model = 0.5cp specific heat capacity, J kg−1 K−1
CD drag coefficientC1 constant for the linear pressure–strain model=1.8C2 constant for the linear pressure–strain model=0.6Ci,s vapour concentration at the droplet surface,
kg mol m−3
Ci,∞ vapour concentration at the bulk gas, kg mol m−3
C1� constant for the turbulent dissipation of energy =1.44
C2� constant for the turbulent dissipation of energy =1.92
C� coefficient for turbulent viscosityd diameter, mdp particle diameter, mDi,m diffusion coefficient of vapour in the bulk, m2 s−1
E enthalpy, J kg−1
FD drag force per unit particle, NFx additional acceleration, Ngx x component of gravitational acceleration, m2 s−1
Gb generation of turbulence energy due to buoyancy,kg m−1 s−2
Gk generation of turbulence energy due to mean ve-locity gradients, kg m−1 s−2
h convective heat transfer coefficient, W m−2 K−1
k kinetic energy, m2 s−2
K thermal conductivity, W m−1 K−1
Kc mass transfer coefficient, m s−1
K∞ thermal conductivity of the continuous phase,W m−1 K−1
mp mass of particle, kgMw,i molecular weight of species i
M,i molecular weight of reactant i
M,j molecular weight of product j
M,R molecular weight of reactant R
N number of chemical species in the systemNi molar flux of vapour, kg mol m−2 s−1
Nu Nussel numberp pressure, Papop operating pressure, Papsat saturated pressure, PaPr Prandtl number, cp�K−1∞Re relative Reynolds numberRed Reynolds number based on particle diameterRi,r net rate of production of species i due to reac-
tion r
s path of particleS source termSc Schmit number, �/�Di,m
t time, sT temperature, KTL Langrangian integral timeT∞ local temperature of the continuous phase, Ku velocity, m s−1
U mean velocity, m s−1
vi,r stoichiometric coefficient for reactant i in re-action r
vj,r stoichiometric coefficient for product j in re-action r
vR,r stoichiometric coefficient for reactant R in re-action r
YM contribution of the fluctuating dilatation incompressible turbulence to the overall dissipa-tion rate, kg m−1 s−2
YP mass fraction of product P
YR mass fraction of a particular reactant, R
Xi spatial co-ordinate, m
Greek symbols
� Kronecker symbol� turbulence dissipation rate, m2 s−3
�p particle emissivity, dimensionlessR radiation temperature, (G/46)1/4
� viscosity, kg m−1 s−1
� density, kg m−3
� Prandtl number� deviatoric stress tensor� molecular kinematic viscosity� shape factor
Subscripts
eff effective value in reference to the addition ofturbulent and non-turbulent contribution of avariable
i,j , l co-ordinate indicesk kinetic energyp particlet turbulent context� turbulence dissipation rate

S. Kamnis, S. Gu / Chemical Engineering Science 61 (2006) 5427–5439 5439
Acknowledgements
The authors would like to acknowledge financial support forthe research studentship from the School of Engineering andApplied Science in Aston University, the EPSRC (Engineeringand Physical Sciences Research Council, UK) and MetallisationLtd UK.
References
Cheng, D., Xu, Q., Trapaga, G., Lavernia, E.J., 2001. A numerical studyof high-velocity oxygen fuel thermal spraying process Part I: gas phasedynamics. Metallurgical and Materials Transactions A 32, 1609–1620.
Gu, S., Eastwick, C.N., Simmons, K.A., McCartney, D.G., 2001.Computational fluid dynamic modeling of gas flow characteristics in ahigh-velocity oxy-fuel thermal spray system. Journal of Thermal SprayTechnology 10, 461–469.
Haider, A., Levenspiel, O., 1989. Drag coefficient and terminal velocity ofspherical and nonspherical particles. Powder Technology 58, 63–70.
Hassan, B., Oberkampf, W.L., Neiser, R.A., Roemer, T.J., 1995.Computational fluid dynamic analysis of a high velocity oxygen-fuel(HVOF) thermal spray torch. In: Berndt, C.C. (Ed.), Thermal Spray Scienceand Technology. ASM International, Materials Park, OH, pp. 193–198.
Kamnis, S., Gu, S., 2005. Numerical modelling of propane combustion ina high velocity oxygen fuel thermal spray gun. Chemical Engineering &Processing, available online.
Launder, B.E., Spalding, D.B., 1972. Lectures in Mathematical Models ofTurbulence. Academic Press, London, England.
Li, M., Christofides, P.D., 2003. Modeling and analysis of HVOFthermal spray process accounting for powder size distribution. ChemicalEngineering Science 58, 849–857.
Li, M., Christodes, P.D., 2004. Feedback control of HVOF thermal sprayprocess accounting for powder size distribution. Journal of Thermal SprayTechnology 13, 108–120.
Li, M., Shi, D., Christofides, P.D., 2004. Diamond jet hybrid HVOF thermalspray: gas-phase and particle behavior modeling and feedback controldesign. Industrial and Engineering Chemistry Research 43, 3632–3652.
Li, M., Shi, D., Christodes, P.D., 2005. Modeling and control of HVOFthermal spray processing of WC-Co coatings. Powder Technology 156,177–194.
Lipatnikov, A.N., Chomiak, J., 2002. Turbulent flame speed andthickness: phenomenology, evaluation and application in multi-dimensionalsimulations. Progress in Energy and Combustion Science 28, 1–74.
Lopez, A.R., Hassen, B., Oberkampf, W.L., Neiser, R.A., Roemer, T.J.,1998. Computational fluid dynamics analysis of a wire-feed, high-velocityoxygen fuel (HVOF) thermal spray torch. Journal of Thermal SprayTechnology 7, 374–382.
Morsi, S.A., Alexander, A.J., 1972. An investigation of particle trajectoriesin two-phase flow systems. Journal of Fluid Mechanics 55, 193–208.
Mostaghimi, J., Chandra, S., Ghafouri-Azar, R., Dolatabadi, A., 2003.Modeling thermal spray coating processes: a powerful tool in design andoptimization. Surface and Coatings Technology 163, 1–11.
Oberkampf, W.L., Talpallikar, M., 1996a. Analysis of a high velocity oxygen-fuel (HVOF) thermal spray torch Part 1: numerical formulation. Journalof Thermal Spray Technology 5, 53–61.
Oberkampf, W.L., Talpallikar, M., 1996b. Analysis of a high velocity oxygen-fuel (HVOF) thermal spray torch Part 2: computational results. Journal ofThermal Spray Technology 5, 62–68.
Peric, M., 1990. Analysis of pressure–velocity coupling on non-orthogonalgrids. Numerical Heat Transfer, Part B: Fundamentals 17, 63–82.
Power, G.D., Smith, E.B., Barber, T.J., Chiapetta, L.M., 1991. Analysis ofa combustion (HVOF) spray deposition gun. UTRC Report No. 91-8,UTRC, East Hartford, CT, USA.
Raithby, G.D., Schneider, G.E., 1979. Numerical solution of problems incompressible fluid flow: treatment of the velocity–pressure coupling.Numerical Heat Transfer 2, 417–440.
Ranz, W.E., Marshall, W.R., 1952a. Evaporation from drops, Part I. ChemicalEngineering Progress 48, 141–146.
Ranz, W.E., Marshall, W.R., 1952b. Evaporation from drops, Part II. ChemicalEngineering Progress 48, 173–180.
Reitz, R.D., 1987. Modeling atomization processes in high-pressure vaporizingsprays. Atomization and Spray Technology 3, 309–337.
Reuss, D.L., Kuo, T.W., Khalighi, B., Haworth, D.C., Rosilik, M., 1995.Particle image velocimetry measurements in a high-swirl engine used forevaluation of computational fluid dynamics calculations. SAE 952381.
Shih, T.H., Liou, W.W., Shabbir, A., Zhu, J., 1995. A new �.� eddy viscositymodel for high Reynolds number turbulent flows. Computers & Fluids 24,227–238.
Smith, E.B., Power, G.D., Barber, T.J., Chiapetta, L.M., 1992. Applicationof computational fluid dynamics to the HVOF thermal spray gun. In:Berndt, C.C. (Ed.), Thermal Spray: International Advances in CoatingsTechnology. ASM International, Materials Park, OH, pp. 805–810.
Stephen, B.P., 2001. Turbulent Flows. ISBN 0 521 59125 2, CambridgeUniversity Press, Cambridge.
Suh, E.S., Rutland, C.J., 1999. Numerical study of fuel/air mixture preparationin a GDI engine. SAE 1999-01-3657.
Swank, W.D., Fincke, J.R., Haggard, D.C., Irons, G., 1994. HVOF gas flowfield characteristics. In: Proceedings of the Seventh National ThermalSpray Conference, pp. 313–318.
Van Doormal, J.P., Raithby, G.D., McDonald, B.H., 1987. The segregatedapproach to predicting viscous compressible fluid flows. ASME Journalof Turbomachinery 109, 268–277.
Zhang, D., Harris, S.J., McCartney, D.G., 2003. Microstructure formationand corrosion behaviour in HVOF-sprayed Inconel 625 coatings. MaterialScience Engineering A 344, 45–56.