Embed Size (px)
Citation preview

at SciVerse ScienceDirect
Environmental Pollution 169 (2012) 160e166
Contents lists available
Environmental Pollution
journal homepage: www.elsevier .com/locate/envpol
Occurrence and exposure to polycyclic aromatic hydrocarbons and theirderivatives in a rural Chinese home through biomass fuelled cooking
Junnan Ding a, Junjun Zhong b, Yifeng Yang a, Bengang Li a, Guofeng Shen a, Yuhong Su b, Chen Wang a,Wei Li a, Huizhong Shen a, Bin Wang a, Rong Wang a, Ye Huang a, Yanyan Zhang a, Hongying Cao a,Ying Zhu a, Staci L.M. Simonich c, Shu Tao a,*
a Laboratory for Earth Surface Processes, College of Urban and Environmental Science, Peking University, Beijing 100871, ChinabCollege of Chemistry and Chemical Engineering, Xinjiang University, Urumqi 830046, Chinac Environmental and Molecular Toxicology and Department of Chemistry, Oregon State University, Corvallis, OR 97331, USA
a r t i c l e i n f o
Article history:Received 2 October 2011Accepted 6 October 2011
Keywords:Rural indoor airSolid fuelPAHsNitro-PAHsOxygenated-PAHs
* Corresponding author.E-mail address: [email protected] (S. Tao).
0269-7491/$ e see front matter � 2012 Elsevier Ltd.doi:10.1016/j.envpol.2011.10.008
a b s t r a c t
The concentration and composition of PAHs emitted from biomass cooking fuel were characterized ina rural non-smoking household in northern China. Twenty-two parent PAHs (pPAHs), 12 nitro-PAHs(nPAHs), and 4 oxy-PAHs (oPAHs) were measured in the kitchen, bedroom, and outdoors during bothsummer and winter. The most severe contamination occurred in the kitchen in the winter, where thedaily mean concentrations of pPAHs, nPAHs, and oPAHs were 7500 � 4100, 38 � 29, and 8400 � 9200 ng/m3, respectively. Our results suggest that the nPAHs were largely from secondary formation in ambientair while oPAHs were either from primary emission of biomass burning or secondary formation frompPAHs in the kitchen. The daily mean benzo(a)pyrene equivalent exposure concentration was as high as200 � 160 ng/m3 in the winter for the housewife who did the cooking compared to 59 � 37 ng/m3 for thecontrol group that did not cook.
� 2012 Elsevier Ltd. All rights reserved.
1. Introduction
During the past three decades, China has experienced rapideconomic development and environmental deterioration includingsevere air pollution (World Bank, 2007). Among many air pollut-ants, polycyclic aromatic hydrocarbons (PAHs) are one of the majorpublic health concerns due to their carcinogenic potential (Xue andWarshawsky, 2005). It has been reported that inhalation exposureof the Chinese population to 16 PAHs in ambient air causea significant risk of lung cancer morbidity (Zhang et al., 2009).Given that most people spend more time indoors and PAHconcentrations in rural indoor air are higher than those in ambientair, the overall PAH exposure risk to rural residents from indoor airmay be more severe than ambient air (Mumford et al., 1990; Luet al., 2006). This is especially true in northern China in winter,when solid fuels are widely used for heating and windows anddoors are usually closed. Given China’s large rural population ofover 600 million and their heavy reliance on solid fuel for cookingand heating, more attention should be paid to rural indoor airpollution. In fact, among various sources, rural residential
All rights reserved.
combustion of solid fuel accounted for a large fraction of the totalPAH emission in China (Zhang et al., 2008).
To date, information on PAH indoor air pollution in rural Chinafrom indoor biomass combustion is limited. In the limited numberof studies that exist, high PAH concentrations have been measuredin several rural locations (Mumford et al., 1990; Lu et al., 2006). Forexample, in rural households in Xuanwei where firewood was usedindoors, the measured benzo(a)pyrene in indoor air was as high3249 ng/m3 (Mumford et al., 1990). For a regional assessment onindoor air quality and population exposure risk, large scale repre-sentative investigations are needed. However, smaller studiesconducted under controlled conditions are also needed in order tocharacterize the pattern of PAH contamination, to understand theprocesses that change the PAH composition from emission toexposure, and to identify other factors affecting indoor air quality.
Although most studies have focused on the 16 USEPA priorityPAHs, there are many other PAHs which are hazardous to humanhealth but not included in this list. For example, in addition to the16 parent PAHs, nitro-PAHs (nPAHs), oxy-PAHs (oPAHs), and highmolecular weight (MW > 302) PAHs are also a concern for humanhealth (Purohit and Basu, 2000; Bolton et al., 2000; USEPA, 2010).
The aim of this research was to characterize the indoor airpollution from parent PAHs (pPAHs), nPAHs, and oPAHs in a typicalrural household in northern China where biomass was used for
pPA
H15
, ng/
m3
12000
6000
3000
0
9000
d1 d2 d3 d4 d1 d2 d3 d4 d1 d2 d3 d4 d1 d2 d3 d1 d2 d3 d1 d2 d3
kitchen outdoor bedroom kitchen outdoor bedroom
Winter Summer
gaseous
particulate
S: StrawW: WoodL: LPG
S S W W S S W W S S W W L S W L S W L S W
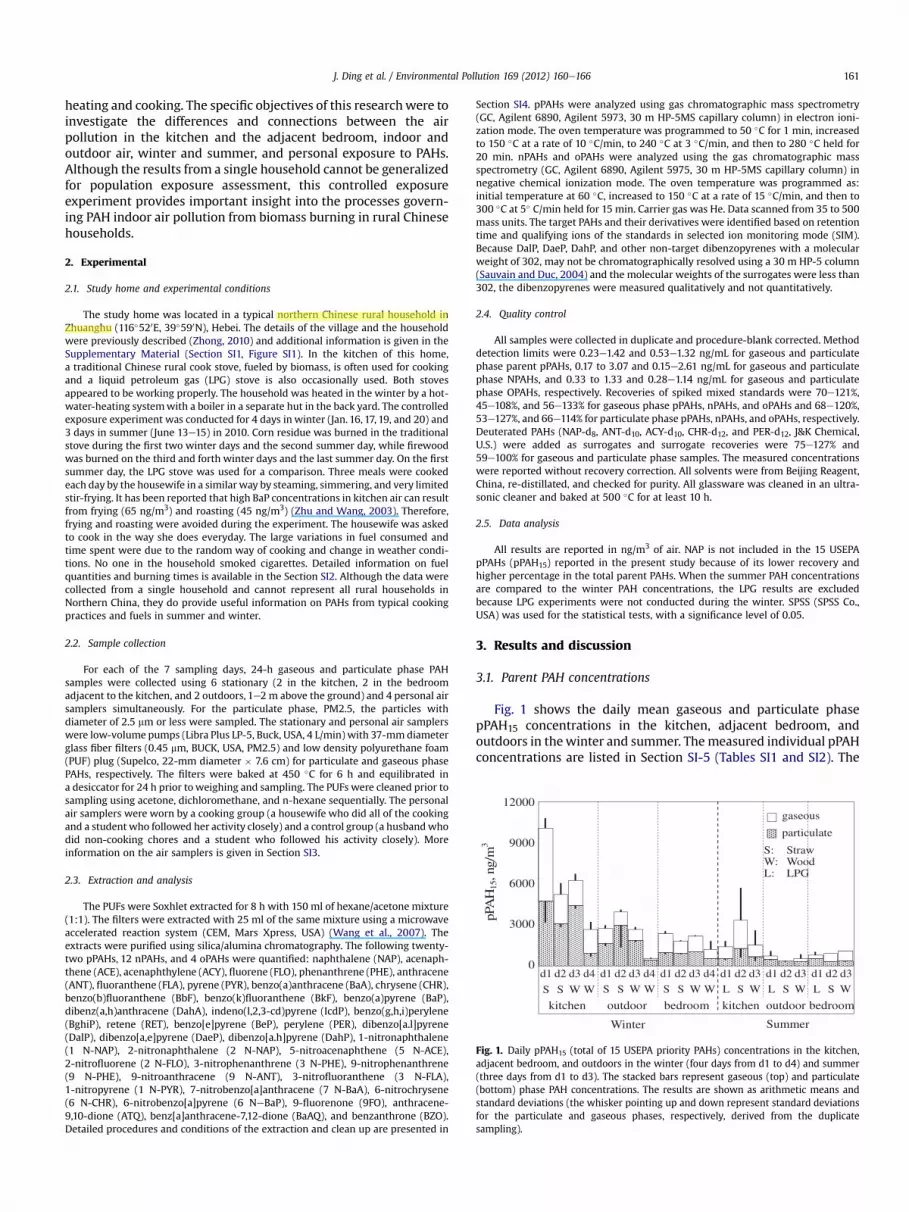
Fig. 1. Daily pPAH15 (total of 15 USEPA priority PAHs) concentrations in the kitchen,adjacent bedroom, and outdoors in the winter (four days from d1 to d4) and summer(three days from d1 to d3). The stacked bars represent gaseous (top) and particulate(bottom) phase PAH concentrations. The results are shown as arithmetic means andstandard deviations (the whisker pointing up and down represent standard deviationsfor the particulate and gaseous phases, respectively, derived from the duplicatesampling).
J. Ding et al. / Environmental Pollution 169 (2012) 160e166 161
heating and cooking. The specific objectives of this researchwere toinvestigate the differences and connections between the airpollution in the kitchen and the adjacent bedroom, indoor andoutdoor air, winter and summer, and personal exposure to PAHs.Although the results from a single household cannot be generalizedfor population exposure assessment, this controlled exposureexperiment provides important insight into the processes govern-ing PAH indoor air pollution from biomass burning in rural Chinesehouseholds.
2. Experimental
2.1. Study home and experimental conditions
The study home was located in a typical northern Chinese rural household inZhuanghu (116�520E, 39�590N), Hebei. The details of the village and the householdwere previously described (Zhong, 2010) and additional information is given in theSupplementary Material (Section SI1, Figure SI1). In the kitchen of this home,a traditional Chinese rural cook stove, fueled by biomass, is often used for cookingand a liquid petroleum gas (LPG) stove is also occasionally used. Both stovesappeared to be working properly. The household was heated in the winter by a hot-water-heating systemwith a boiler in a separate hut in the back yard. The controlledexposure experiment was conducted for 4 days in winter (Jan. 16, 17, 19, and 20) and3 days in summer (June 13e15) in 2010. Corn residue was burned in the traditionalstove during the first two winter days and the second summer day, while firewoodwas burned on the third and forth winter days and the last summer day. On the firstsummer day, the LPG stove was used for a comparison. Three meals were cookedeach day by the housewife in a similar way by steaming, simmering, and very limitedstir-frying. It has been reported that high BaP concentrations in kitchen air can resultfrom frying (65 ng/m3) and roasting (45 ng/m3) (Zhu and Wang, 2003). Therefore,frying and roasting were avoided during the experiment. The housewife was askedto cook in the way she does everyday. The large variations in fuel consumed andtime spent were due to the random way of cooking and change in weather condi-tions. No one in the household smoked cigarettes. Detailed information on fuelquantities and burning times is available in the Section SI2. Although the data werecollected from a single household and cannot represent all rural households inNorthern China, they do provide useful information on PAHs from typical cookingpractices and fuels in summer and winter.
2.2. Sample collection
For each of the 7 sampling days, 24-h gaseous and particulate phase PAHsamples were collected using 6 stationary (2 in the kitchen, 2 in the bedroomadjacent to the kitchen, and 2 outdoors, 1e2 m above the ground) and 4 personal airsamplers simultaneously. For the particulate phase, PM2.5, the particles withdiameter of 2.5 mm or less were sampled. The stationary and personal air samplerswere low-volume pumps (Libra Plus LP-5, Buck, USA, 4 L/min) with 37-mmdiameterglass fiber filters (0.45 mm, BUCK, USA, PM2.5) and low density polyurethane foam(PUF) plug (Supelco, 22-mm diameter � 7.6 cm) for particulate and gaseous phasePAHs, respectively. The filters were baked at 450 �C for 6 h and equilibrated ina desiccator for 24 h prior to weighing and sampling. The PUFs were cleaned prior tosampling using acetone, dichloromethane, and n-hexane sequentially. The personalair samplers were worn by a cooking group (a housewife who did all of the cookingand a student who followed her activity closely) and a control group (a husbandwhodid non-cooking chores and a student who followed his activity closely). Moreinformation on the air samplers is given in Section SI3.
2.3. Extraction and analysis
The PUFs were Soxhlet extracted for 8 h with 150 ml of hexane/acetone mixture(1:1). The filters were extracted with 25 ml of the same mixture using a microwaveaccelerated reaction system (CEM, Mars Xpress, USA) (Wang et al., 2007). Theextracts were purified using silica/alumina chromatography. The following twenty-two pPAHs, 12 nPAHs, and 4 oPAHs were quantified: naphthalene (NAP), acenaph-thene (ACE), acenaphthylene (ACY), fluorene (FLO), phenanthrene (PHE), anthracene(ANT), fluoranthene (FLA), pyrene (PYR), benzo(a)anthracene (BaA), chrysene (CHR),benzo(b)fluoranthene (BbF), benzo(k)fluoranthene (BkF), benzo(a)pyrene (BaP),dibenz(a,h)anthracene (DahA), indeno(l,2,3-cd)pyrene (IcdP), benzo(g,h,i)perylene(BghiP), retene (RET), benzo[e]pyrene (BeP), perylene (PER), dibenzo[a.l]pyrene(DalP), dibenzo[a,e]pyrene (DaeP), dibenzo[a.h]pyrene (DahP), 1-nitronaphthalene(1 N-NAP), 2-nitronaphthalene (2 N-NAP), 5-nitroacenaphthene (5 N-ACE),2-nitrofluorene (2 N-FLO), 3-nitrophenanthrene (3 N-PHE), 9-nitrophenanthrene(9 N-PHE), 9-nitroanthracene (9 N-ANT), 3-nitrofluoranthene (3 N-FLA),1-nitropyrene (1 N-PYR), 7-nitrobenzo[a]anthracene (7 N-BaA), 6-nitrochrysene(6 N-CHR), 6-nitrobenzo[a]pyrene (6 NeBaP), 9-fluorenone (9FO), anthracene-9,10-dione (ATQ), benz[a]anthracene-7,12-dione (BaAQ), and benzanthrone (BZO).Detailed procedures and conditions of the extraction and clean up are presented in
Section SI4. pPAHs were analyzed using gas chromatographic mass spectrometry(GC, Agilent 6890, Agilent 5973, 30 m HP-5MS capillary column) in electron ioni-zation mode. The oven temperature was programmed to 50 �C for 1 min, increasedto 150 �C at a rate of 10 �C/min, to 240 �C at 3 �C/min, and then to 280 �C held for20 min. nPAHs and oPAHs were analyzed using the gas chromatographic massspectrometry (GC, Agilent 6890, Agilent 5975, 30 m HP-5MS capillary column) innegative chemical ionization mode. The oven temperature was programmed as:initial temperature at 60 �C, increased to 150 �C at a rate of 15 �C/min, and then to300 �C at 5� C/min held for 15 min. Carrier gas was He. Data scanned from 35 to 500mass units. The target PAHs and their derivatives were identified based on retentiontime and qualifying ions of the standards in selected ion monitoring mode (SIM).Because DalP, DaeP, DahP, and other non-target dibenzopyrenes with a molecularweight of 302, may not be chromatographically resolved using a 30 m HP-5 column(Sauvain and Duc, 2004) and the molecular weights of the surrogates were less than302, the dibenzopyrenes were measured qualitatively and not quantitatively.
2.4. Quality control
All samples were collected in duplicate and procedure-blank corrected. Methoddetection limits were 0.23e1.42 and 0.53e1.32 ng/mL for gaseous and particulatephase parent pPAHs, 0.17 to 3.07 and 0.15e2.61 ng/mL for gaseous and particulatephase NPAHs, and 0.33 to 1.33 and 0.28e1.14 ng/mL for gaseous and particulatephase OPAHs, respectively. Recoveries of spiked mixed standards were 70e121%,45e108%, and 56e133% for gaseous phase pPAHs, nPAHs, and oPAHs and 68e120%,53e127%, and 66e114% for particulate phase pPAHs, nPAHs, and oPAHs, respectively.Deuterated PAHs (NAP-d8, ANT-d10, ACY-d10, CHR-d12, and PER-d12, J&K Chemical,U.S.) were added as surrogates and surrogate recoveries were 75e127% and59e100% for gaseous and particulate phase samples. The measured concentrationswere reported without recovery correction. All solvents were from Beijing Reagent,China, re-distillated, and checked for purity. All glassware was cleaned in an ultra-sonic cleaner and baked at 500 �C for at least 10 h.
2.5. Data analysis
All results are reported in ng/m3 of air. NAP is not included in the 15 USEPApPAHs (pPAH15) reported in the present study because of its lower recovery andhigher percentage in the total parent PAHs. When the summer PAH concentrationsare compared to the winter PAH concentrations, the LPG results are excludedbecause LPG experiments were not conducted during the winter. SPSS (SPSS Co.,USA) was used for the statistical tests, with a significance level of 0.05.
3. Results and discussion
3.1. Parent PAH concentrations
Fig. 1 shows the daily mean gaseous and particulate phasepPAH15 concentrations in the kitchen, adjacent bedroom, andoutdoors in thewinter and summer. Themeasured individual pPAHconcentrations are listed in Section SI-5 (Tables SI1 and SI2). The
J. Ding et al. / Environmental Pollution 169 (2012) 160e166162
variations in the measured concentrations of the duplicate sampleswere relatively low with only a few exceptions. The daily meanpPAH15 concentrations in the kitchen were 6100 � 3100 and2400 � 1600 ng/m3 in the winter and summer, respectively, whichwere 2.4e5.3 times higher than the pPAH15 concentrations in thebedroom and outdoors. In the summer, the daily mean pPAH15concentrations in the kitchen were 1400, 3300, and 1500 ng/m3 onthe days when LPG, straw, and wood were burned (PM2.5 were0.42 � 0.02, 0.57 � 0.00, and 0.38 � 0.25, respectively). Previousstudies have reported high PAH concentrations from burningbiomass fuels in kitchens in other regions of China (Mumford et al.,1990; Lu et al., 2006) and in other developing countries (Bhargavaet al., 2004). The significant difference (p < 0.05) in the pPAH15concentrations in the kitchen between winter and summer wasprimarily due to minimal ventilation in the winter when both thekitchen door andwindowwere kept closed. LPG is often considereda cleaner energy source than biomass (Deng et al., 1998). However,the kitchen pPAH15 concentration when LPG was used as the soleenergy source (1400 � 490 ng/m3) was similar to the pPAH15concentration when wood was burned (1500 � 1400 ng/m3). HighPM2.5 and organic carbon concentrations were also measured in thekitchen when LPG was used (Zhong, 2010). Additional studies areneeded to understand LPG emissions during cooking because morerural Chinese families are shifting from the use of biomass and coalto LPG as a “clean” fuel (Deng et al., 1998).
Frying and roasting can generate relatively high PAH concen-trations (Zhu and Wang, 2003). In this study, frying and roastingwere avoided to focus on PAH emissions from the fuels used in thecooking. It was previously reported that the pPAH15 concentrationin cooking fumes, measured 0.5 m above the cooking pan ina Chinese kitchen with no frying, was less than 50 ng/m3 (Zhu andWang, 2003). The very high pPAH15 concentrations wemeasured inthe kitchen were relatively unaffected by cooking fumes.
Retene (RET) is a major pyrolysis product of conifer trees and isoften referred to as a marker of firewood combustion or forest fires(Ramdahl, 1983). However, there was no significant difference inRET concentrations in the kitchen air when firewood or cornresidue were burned, suggesting that it is unlikely a unique tracerfor firewood in this study. The emission of RET from rice and wheatstraw combustion has also been reported in the literature (Hayset al., 2005). In addition, the median indoor RET concentrations inwood burning homes in Sweden during winter were comparable tohomes without wood burning (p > 0.05) (Gustafson et al., 2008).There was also no significant difference in RET concentrations(p > 0.05) in the kitchen when LPG (4.73 � 1.23, n ¼ 2), straw(6.28 � 2.82, n ¼ 2), and wood (2.10 � 0.82, n ¼ 2) were burnedduring the summer experiment.
The pPAH15 concentration in outdoor air in winter (2500 � 1400ng/m3) was 5.6 times higher than in the summer (450 � 210 ng/m3).However, both the winter and summer outdoor pPAH15 concentra-tions were significantly lower than the corresponding concentrationsin the kitchen (p < 0.05). In terms of air pPAH15 concentration, theaverage indoor/outdoor ratioswere2.4 and3.8 forkitchen and0.8 and1.8 for bedroom in the winter and summer, respectively, indicatingheavycontamination in kitchen air. Thedaily variation in outdoor PAHconcentrations was not correlated with the kitchen PAH concentra-tions because the outdoor PAH concentrations were strongly influ-enced by meteorological conditions (Liu et al., 2007a). Although theoutdoor PAH concentrations were lower than the kitchen concentra-tions, they were much higher than PAH concentrations reported forurban areas in China, including Taiyuan and Tianjin, during the sameseasons (Wu et al., 2005; Fu et al., 2010). Ambient air PAH concen-trations in thenorthernChinaPlainwere ashighas those in large citiesin winter due to solid fuel combustion (Liu et al., 2007b). BaP is theonly PAH listed in the Chinese ambient air quality standard. In the
winter, the mean ambient BaP concentration (124 � 83.2 ng/m3) inthis studywasmore than one order ofmagnitude higher than China’sstandard (10 ng/m3, daily average).
In the bedroom adjacent to the kitchen, the daily mean pPAH15concentrations were 1900� 520 and 980� 110 ng/m3 in thewinterand the summer, respectively, and the former was significantlyhigher than the latter (p< 0.05). In the winter, the daily variation inPAH concentration (d1 > d3 > d2 > d4) was similar between thekitchen and the adjacent bedroom (correlated significantly,p < 0.05), suggesting that the bedroom PAH concentrations weremainly from the kitchen when all doors and windows in thebedroom were closed in cold winter. In the summer, there was nocorrelation between the PAH concentrations in the bedroom andkitchen or between the bedroom and outdoors. It appears that thePAHs in the bedroom adjacent to the kitchen were likely from bothoutdoors and the kitchen during the summer.
3.2. Composition profiles of pPAHs
The composition profiles of 21 PAHs (in both the gas and partic-ulate phases) in the kitchen, outdoors, and bedroom, measuredduring summer andwinter, are shown in the Section SI6 (Figure SI2).Itwas found that the compositionprofilesweredifferent between thewinter and summer but were similar among individual days of thesame season. In summer, the lowermolecularweight PAHs, PYR, PHE,and FLO, dominated the PAH profile and contributed 66, 88, and 91%of the total pPAH concentration in the kitchen, bedroom, andoutdoors, respectively. However, in the winter, the higher molecularweight PAHs on particulate matter made up a larger fraction of thePAH profile (8 PAHs from BaA to BghiP contributed 29, 32, and 31% oftotal pPAH concentrations inwinter compared to 16, 1, and 1% in thesummer in the kitchen, bedroom, and outdoors, respectively).Because the fuels and cooking methods used in summer and winterexperiments were the same, the difference between winter andsummer PAH profiles is likely due to outdoor air diluting indoor PAHemissions during the summer experiment. The composition profilescan also be affected by temperature, while temperatures were surelydifferent between the two seasons and between indoor and outdoorin the winter.
The PAH emission factors (EFs) from the burning of corn residuewere measured using a similar stove (Shen et al., 2011) and theseemission profiles were compared to the air PAH profiles (Figure SI3)measured in this study when corn is used. A significant correlationexisted (p < 0.05) between the PAH EFs and measured PAH airconcentrations in the kitchen, adjacent bedroom, and outdoorswhen corn residue was used in both seasons for the gaseous phasepPAHs, but not the particulate phase pPAHs (Figure SI4). Thissuggests that the profile of gaseous phase pPAHs did not changesignificantly after emission given the relatively short distances fromthe stove to the kitchen, adjacent bedroom, or immediate outdoorenvironment. On the other hand, the profile of particulate phasepPAHs appears to have changed significantly from emission to airlikely due to partition of PAHs and deposition of particulates afteremission.
Ratios of PAH isomers can be used for source apportionment ifthe ratios do not change significantly from sources to receptors(Watson, 1984; Zuo et al., 2007). For example, the FlA/(FLA þ PYR)ratio from coal and biomass burning is larger than 0.5 and this ratiois smaller than 0.5 from petroleum combustion (Yunker et al.,2002). However, this assumption may not always hold true andsignificant changes in the isomer ratios have been demonstrated ina field study (Zhang et al., 2005). Using the measured air PAHconcentrations when corn residue was combusted in the winterand the EFs for corn residue measured under similar conditions(Shen et al., 2011), four commonly used isomer ratios, including
J. Ding et al. / Environmental Pollution 169 (2012) 160e166 163
ANT/(ANT þ PHE), FLA/(FLA þ PYR), BaA/(BaA þ CHR), and IcdP/(IcdP þ BghiP), were calculated and compared for the gaseous andparticulate phases (see detailed results in the Section SI7(Table SI3)). With all of windows closed in the winter, the PAHsin the bedroom were primarily from the kitchen. However, signif-icant differences (p < 0.05) existed between the measured gaseousphase ratios (0.10, 0.55, and 0.53) in the kitchen and reported cornresidue EFs (0.17, 0.88, and 0.61) for ANT/(ANT þ PHE), BaA/(BaA þ CHR), and IcdP/(IcdP þ BghiP), respectively. Significantdifferences (p < 0.05) between the ratios in the kitchen andbedroom were also apparent for gaseous phase ANT/(ANT þ PHE)(0.10 vs. 0.05) and particulate phase ANT/(ANT þ PHE) (0.12 vs.0.07), as well as for BaA/(BaA þ CHR) (0.62 vs. 0.55) and IcdP/(IcdPþ BghiP) (0.60 vs. 0.54) ratios. It appears that these ratios maychange significantly during transport and should be used with carefor source identification even within short distance indoors.
3.3. nPAH and oPAH concentrations
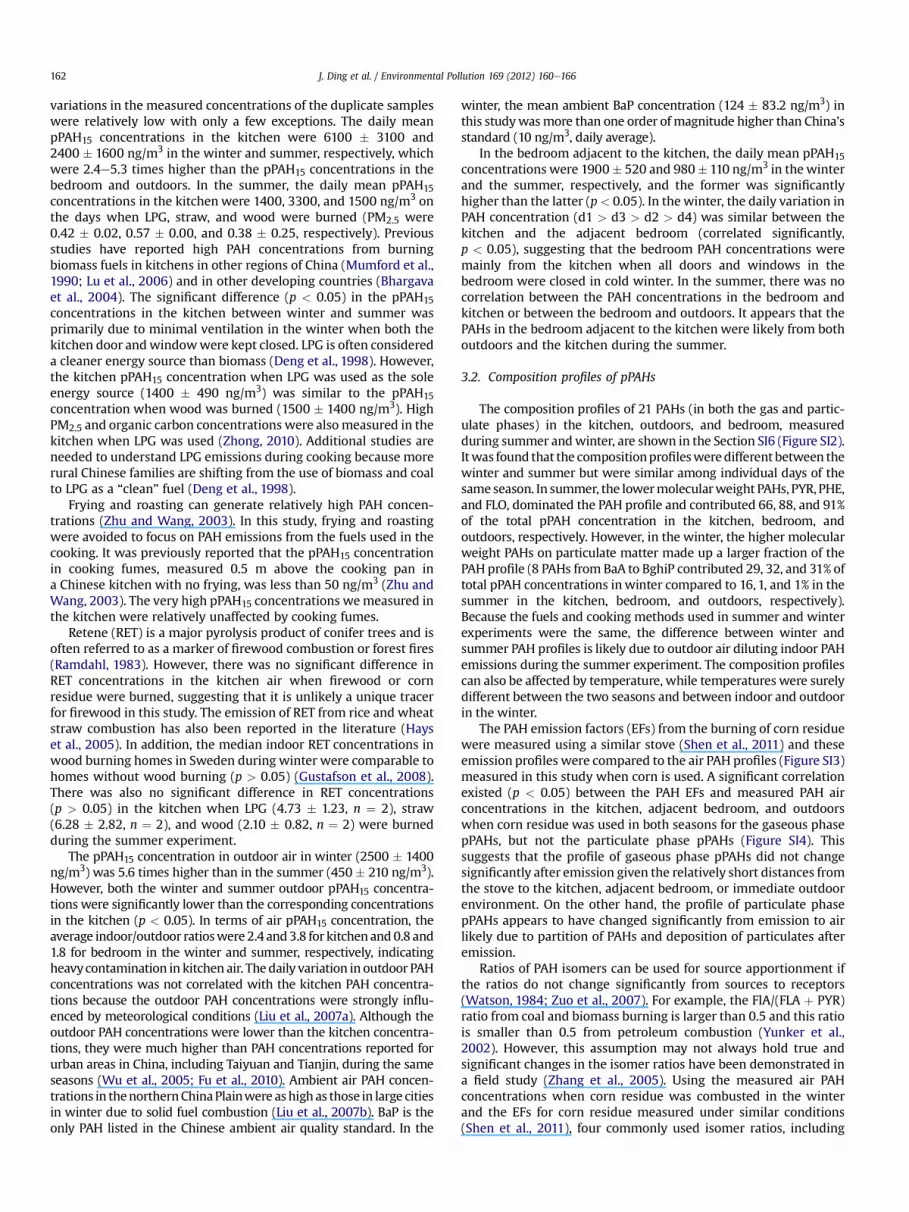
The measured nPAH and oPAH concentrations in the gaseousand particulate phases in the kitchen, outdoors, and bedroom,during winter and summer experiments, are shown in Fig. 2. Thedetailed data are provided in Section SI-5(Tables SI1 and SI2). Thedaily mean concentrations of 12 nPAHs were relatively low andvaried from 2.8 � 0.7 (bedroom, summer) to 38 � 29 (kitchen,winter) ng/m3. On the other hand, the daily mean concentration ofoPAHs in the kitchen in the winter was 8400 � 9200 ng/m3, morethan two orders of magnitude higher than the nPAH concentrationsand even higher than the pPAH15 concentrations (6100 � 3100 ng/m3). Like the pPAHs, there was no significant difference in oPAH ornPAH concentrations between corn residues (nPAHs 34 � 24,oPAHs 5200 � 4000 ng/m3, n ¼ 4) and firewood (nPAHs 45 � 42,oPAHs 12 000 � 14000 ng/m3, n ¼ 4) experiments (p > 0.05) in thewinter. The highest oPAH, nPAH, and PM2.5 concentrations weremeasured in the kitchen on the third day of the winter experimentwhen wood was burned.
There were significant correlations between pPAH, nPAH, andoPAH concentrations for the three locations and for both seasons,with r values of 0.942 (nPAHs-pAH15), 0.948 (oPAHs-pPAH15) and0.960 (nPAHs-oPAHs) respectively (p < 0.05) (Fig. 3). This suggeststhat these compounds were from the same sources, giving the factthat the emission of these compounds is not location or seasondependent.
oPA
Hs,
ng/
m3
nPA
Hs,
ng/
m3
80
40
20
0
60
d1 d2 d3 d4 d1 d2 d3 d4 d1 d2 d3 d4 d1 d2 d3 d1 d2 d3 d1 d2 d3
kitchen outdoor bedroom kitchen outdoor bedroom
Winter Summer
gaseous
particulate
S S W W S S W W S S W W L S W L S W L S W
S: StrawW: WoodL: LPG
Fig. 2. The measured nPAH (left panel) and oPAH (right panel) concentrations in the kitchen(three days from d1 to d3). The stacked bars represent gaseous (top) and particulate (bottomdeviations (the whiskers pointing up and down represent standard deviations for the parti
The nPAH and oPAH outdoor and bedroom concentrations weresignificantly lower than the kitchen concentrations. Like pPAHs, thenPAH and oPAHdaily variation in concentrationwas similar betweenthe kitchen and the adjacent bedroom in the winter, suggesting thatthe kitchen was an important source to the bedroom in winter. Thesummer oPAH concentration (420 � 170 ng/m3) in the kitchen wasmore than an order of magnitude lower than in the winter due togood ventilation with the window and door opened. The oPAH andnPAH concentrations in ambient air were 1500� 1100 and 11�6 ng/m3 in the winter and 11 � 11 and 1.1 � 0.8 ng/m3 in the summer,respectively. Previous studies have also reported that nPAH concen-trations in urban ambient air were 1e2 orders of magnitude lowerthan oPAH concentrations (Walgraeve et al., 2010). The summer PM-bound 1 N-PYR concentrations in urban areas in Shenyang(0.029� 0.024) and Beijing (0.010� 0.002 ng/m3) (Tang et al., 2005;Wang, 2010) were similar to our outdoor 1 N-PYR concentrations(0.016 � 0.019 ng/m3). However, in winter, our measured outdoor1N-PYR concentrations (0.91�0.74 ng/m3)were significantly higherthan previously reported for Shenyang (0.179 � 0.019 ng/m3) (Tanget al., 2005). Our winter outdoor oPAH concentrations were similarto those in urban areas of Beijing (Wang, 2010).
Of the PAH derivatives, 9FO, ATQ, and BZO contributed 95e99%of the total oPAH and nPAH concentration. The winter daily mean9FO, ATQ, and BZO concentrations in the kitchen were3400� 4000, 2600� 3300, and 2400� 2100 ng/m3, respectively. Ithas been reported that both nPAHs and oPAHs can be formedduring incomplete combustion or pPAH aging process (Albinetet al., 2008; Walgraeve et al., 2010). Although it was difficult tofully identify their sources, the ratio of individual nPAH or oPAHconcentrations to their corresponding pPAH concentration providesome perspective. Fig. 4 (left panel) shows these ratios for the threedominant oPAHs. The highest ratios were found in the kitchen andthe ratios in the winter were significantly higher than those in thesummer. This suggests oPAH formation from combustion source inthe kitchen. The high oPAH concentrations in the kitchen duringthe winter, relative to summer, suggest that secondary formation ofoPAHs in warm kitchen in the winter cannot be excluded althoughit was primarily due to limited ventilation. Higher time resolutionsampling is needed to characterize the oPAH sources in the kitchen.For nPAHs (Fig. 4, right panel), the ratios in the kitchen were low,with a single exception, and the highest ratios were measured inambient air during the summer. High ambient temperatures arefavorable for the formation of nPAHs due to enhanced reaction
24000
8000
0
16000
d1 d2 d3 d4 d1 d2 d3 d4 d1 d2 d3 d4 d1 d2 d3 d1 d2 d3 d1 d2 d3
kitchen outdoor bedroom kitchen outdoor bedroom
Winter Summer
gaseous
particulate
S: Straw
W: Wood
L: LPG
S S W W S S W W S S W W L S W L S W L S W
, adjacent bedroom, and outdoors in the winter (four days from d1 to d4) and summer) phase PAH concentrations. The results are shown as arithmetic means and standardculate and gaseous phases, respectively).

log(
oPA
Hs)
,log(
ng/m
3 ) 4.5
0.5
2.5
3.5
1.5
2.0
-0.5
0.5
1.0
1.5
0.0
4.5
0.5
2.5
3.5
1.5
log(
nPA
Hs)
,log(
ng/m
3 )
log(
oPA
Hs)
,log(
ng/m
3 )
BA C
r = 0.942r = 0.948 r = 0.960
2.4 3.0 3.6 4.2 2.4 3.0 3.6 4.2 -0.5 0.5 1.5 2.00.0 1.0log(pPAHs),log(ng/m3 m/gn(gol,)sHAPn(gol) 3)log(pPAHs),log(ng/m3)
Fig. 3. Correlations between oPAH and pPAH (A), nPAH and pPAH (B), and oPAH and nPAH (C) concentrations.
J. Ding et al. / Environmental Pollution 169 (2012) 160e166164
between pPAHs and reactive species (Wilson et al., 1995). Our datasuggest that nPAHs could from secondary formation in ambient airduring the summer.
3.4. Gas-particle partitioning
pPAHs and their derivatives are present in gaseous and/orcondensed phases, depending on the properties of compounds andatmospheric conditions (Albinet et al., 2008). Gas-particle parti-tioning of organic compounds is often described by a partitioncoefficient (Kp, m3/mg), defined as the ratio of mass concentration ofthe particulate phase (ng/mg) and the volume concentration ofgaseous phase (ng/m3) (Pankow, 1987). Fig. 5 shows the log-transformed Kp of pPAHs (left panel) and derivatives (right panel)measured in the kitchen, outdoors, and bedroom in the winter andsummer against the log-transformed molecular weight (MWt) ofthe compound. Molecular weight was used instead of vapor pres-sure because accurate vapor pressure data was not available all ofthe PAH derivatives. Similar to previous reports in the literature(Albinet et al., 2008), logKp increased as logMWt increased. For bothseasons, the Kp values of pPAHs in ambient air (triangle in Fig. 5)were higher than those in the kitchen and bedroom. This may bedue to lower outside temperatures. In the winter, Kp values ofintermediate molecular weight PAHs in the bedroom were signifi-cantly lower than those in the outdoors and kitchen. This may bebecause the diffusion of gaseous phase PAHs from the kitchen to theadjacent bedroom was faster than transport of particulate phasePAHs from the kitchen to the bedroom. The Kp values for thederivatives were generally higher than those of pPAHs, likelybecause that the vapor pressures of nPAHs and oPAHs are usuallylower than those of corresponding pPAHs (Walgraeve et al., 2010).Although a similar relationship between Kp and MWt was observedfor nPAHs and oPAHs, the seasonal differences were much larger
9FO/FLO
ATQ/ANT
AaAQ/BaA
24
12
6
0
18
kitchen outdoor bedroom
winter kitchen outdoor bedroom
summer
Rat
io o
f oPA
H/p
PAH
Fig. 4. Ratios of individual oPAH/pPAH (left panel) and nPAH/pPAH (right panel) in the kitchday means). The results are shown as arithmetic means and standard deviations.
than for pPAHs. A similar trend was found for pPAHs and theirderivatives in ambient air in two French valleys (Albinet et al.,2008).
Gas-particle partitioning of organic compounds is thought to becontrolled by absorption and/or adsorption which is related to theparticle surface area and black carbon content (Goss andSchwarzenbach, 1998). These two mechanisms can be distin-guished based on the slope of a scatter plot of the log-transformedKp against log-transformed subcooled liquid vapor pressure (P0). Aslope steeper than �1.0 (or shallower than �0.6) suggestsadsorption (or absorption) domination (Goss and Schwarzenbach,1998). The calculated logKp values were plotted against logP0 forpPAHs and the slopes for the kitchen, bedroom, and ambient airvaried from �0.2 to �0.5, implying that the gas-particle partition-ing was governed by absorption (Section SI8-Figure SI-5). Absorp-tion was also the dominant mechanism for freshly emitted pPAHsfrom crop residues burned under similar conditions (Shen et al.,2011). The slopes for the bedroom and ambient air were shal-lower than the slope for the kitchen air. This difference may beexplained by slow desorption kinetics when the PM from thekitchen entered less contaminated air, at lower temperatures(Tsapakis and Stephanou, 2003).
3.5. Exposure
The relatively high exposure in the kitchen in the winter wasconfirmed by the results obtained using the personal sampler. Inthe winter, the measured mean pPAH15 concentration was2660 � 1120 ng/m3 for the cooking group, which was significantlyhigher than 1530 � 244 ng/m3 of the control group (p < 0.05). Thisis especially true for particulate phase PAHs (1610 � 980 and684 � 258 ng/m3), corresponding to the relatively high level ofparticulate phase PAHs in kitchen air in the winter. However, there
kitchen outdoor bedroom
winterkitchen outdoor bedroom
summer
0.4
0.2
0.1
0.0
0.3
(1N-NAP+2N-NAP)/NAP
5N-ACE/ACE
2N-FLO/FLO
9N-ANT/ANT
3N-FLA/FLA
1N-PYR/PYR
(3N-PHE+9N-PHE)/PHE
7N-BaA/BaA
6N-CHR/CHR
6N-BaP/BaP
Rat
io o
f nPA
H/p
PAH
en, adjacent bedroom, and outdoors in the winter (four day means) and summer (two

logk
p, lo
g(ng
/m3 )
0.0
-2.0
-4.0
-6.0
-8.0
summer winter
kitchenbedroomoutdoor
kitchenbedroomoutdoor
summer winter
kitchenbedroomoutdoor
kitchenbedroomoutdoor
2.1 2.2 2.3 2.4
log(MWt)2.5 2.1 2.2 2.3 2.4
log(MWt)2.5
logk
p, lo
g(ng
/m3 ) -2.0
-4.0
-6.0
-8.0
0.0
Fig. 5. Dependence of the log-transformed partition coefficient (Kp) of pPAHs (left panel) and derivatives (right panel) on the log-transformed molecular weight (MWt) in thekitchen (circle), outdoors (triangle), and adjacent bedroom (diamond) in the winter (white) and summer (grey).
J. Ding et al. / Environmental Pollution 169 (2012) 160e166 165
was no significant difference in the exposure concentrations ofpPAH15 between the two groups in the summer (p > 0.05) likelydue to the better ventilation with open window. It appears thatkitchen ventilation is critical to the indoor inhalation exposure inrural household.
BaP is the only PAH regulated by Chinese air quality standards(daily average) for ambient (10 ng/m3) and indoor (1.0 ng/m3) air(General Administration of Quality Supervision, 2002; Bureau ofEnvironmental Protection of P.R.C., 1996). In the winter, themeasured BaP concentrations in the study home exceeded thestandards by factors of 49e548, 31 to 187, and 1e19 times in thekitchen, adjacent bedroom, and outdoors, respectively. Even theaverage summer kitchen concentration exceeded the standard by57 times. These data suggest that there is a high inhalation cancerrisk for the residents of this study home. These high PAH concen-trations were confirmed with personal air samplers (see detaileddata in Section SI-5 (Tables SI1 and SI2)). In the winter, the dailymean BaP exposure to the cooking group was 200 � 160 ng/m3,compared with 59 � 37 ng/m3 for the control group. The exposuresin the summerwere 2.0� 0.41 and 1.6� 0.27 ng/m3 for the cookingand control groups, respectively.
In addition to BaP, other PAHs were measured in the study. Usingthe concentrations of 17 pPAHs (total of gaseous and particulatephases excluding NAP, RET, and the three dibenzopyrenes) andassociated relative potency factors (RPFs) (Purohit and Basu, 2000),total benzo(a)pyrene equivalent concentrations (BaPeq) of thepPAHs were calculated (Section SI9 (Table SI4)). The daily meanBaPeq concentrations were 710 � 540 and 12 � 1.3 ng/m3 for thecooking group in the winter and summer, compared to 230 � 140and 13 � 2.0 ng/m3 for the control group, respectively. Because theRPF for DalP is 30 times higher than the RPF for BaP, the dibenzo-pyrene isomers should be quantified in future studies. A recent studyfound that the total excess inhalation cancer risk in Beijing would beunderestimated by 23% if the dibenzopyrene isomers were notincluded in the risk calculation (Jia et al., 2011). In addition, it waspreviously estimated that the mean exposure of the Chinese pop-ulation to BaPeq in ambient air was 7.64 ng/m3, leading to an excessannual lung cancermorbidity rate of 0.65�10�5 (Zhang et al., 2009).This value is much lower than what we have estimated for thecooking group and even lower than that of the control group. Thecooking group was exposed to very high concentrations of oPAHs(1240 � 1100 ng/m3) in the winter. Because the carcinogenic effectsof oPAHs and nPAHs are not well quantified, the inhalation cancerrisk from these PAH derivatives was not determined. Although theresults of this study cannot be generalized to the entire Chinesepopulation, a high inhalation cancer risk to a housewife in northernChina has beenmeasured. In addition, PAHs other than the 16 USEPApriority PAHs should be included in future studies.
4. Conclusion
High PAH concentrations were measured in the indoor air of thehousehold and the most severe contamination occurred in thekitchen in the winter. The measured concentrations of pPAHs,nPAHs, and oPAHs in the kitchen in the winter were as high as7500 � 4100, 38 � 29, and 8400 � 9200 ng/m3, respectively. ThePAHs in bedroom air were mainly from the kitchen in the winterand from ambient air in the summer. High level of oPAHs in thekitchen air suggests that oPAHs are primarily from the biomassburning. The daily mean benzo(a)pyrene equivalent exposureconcentrations were 200� 160 and 59� 37 ng/m3 in the winter forthose who cooked or not in this particular household.
Acknowledgements
Funding for this study was provided by the National NaturalScience Foundation of China (41001343, 41130754, 40703029),Beijing Municipal Government (YB20101000101), and NIEHS (P42ES016465).
Appendix. Supplementary data
Supplementary data associated with this article can be found inthe online version, at doi:10.1016/j.envpol.2010.01.021.
References
Albinet, A., Leoz-Garziandia, E., Budzinski, H., Villenave, E., Jaffrezo, J., 2008.Nitrated and oxygenated derivatives of polycyclic aromatic hydrocarbons in theambient air of two French alpine valleys Part 1: concentrations, sources andgas/particle partitioning. Atmos. Environ. 42, 43e54.
Bhargava, A., Khanna, R.N., Bhargava, S.K., Kumar, S., 2004. Exposure risk to carci-nogenic PAHs in indoor-air during biomass combustion whilst cooking in ruralIndia. Atmos. Environ. 38, 4761e4767.
Bolton, J.L., Trush, M.A., Penning, T.M., Dryhurst, G., Monks, T.J., 2000. Role ofquinones in toxicology. Chem. Res. Toxicol. 13, 135e160.
Bureau of Environmental Protection of P.R.C., 1996. Ambient Air Quality Standard ofR.P.C. GB 3095-1996. Bureau of Environmental Protection of China, Beijing.
Deng, K.Y., Zhang, L.J., He, L., 1998. Study on energy strategy of sustainable devel-opment in rural area of China. I. Analysis of energy conditions in rural area ofChina. Trans. CSAE 14, 19e25.
Fu, S., Yang, Z.Z., Li, K., Xu, X.B., 2010. Spatial characteristics and major sources ofpolycyclic aromatic hydrocarbons from soil and respirable particulate matter ina mega-city. China. Bull. Environ. Contam. Toxicol. 85, 15e21.
General Administration of Quality Supervision, Inspection and Quarantine of P.R.C.Ministry of Health of P.R.C. Bureau of Environmental Protection of P.R.C. 2002.Indoor Air Quality Standard of P.R.C. GB/T 1883-2002, Beijing.
Goss, K., Schwarzenbach, R.P., 1998. Gas/solid and gas/liquid partitioning of organiccompounds: critical evaluation of the interpretation of equilibrium constants.Environ. Sci. Technol. 32, 2025e2032.
Gustafson, P., Östman, C., Sällsten, G., 2008. Indoor levels of polycyclic aromatichydrocarbons in homes with or without wood burning for heating. Environ. Sci.Technol. 42, 5074e5080.

J. Ding et al. / Environmental Pollution 169 (2012) 160e166166
Hays, M.D., Fine, P.M., Geron, C.D., Kleeman, M.J., Gullett, B.K., 2005. Open burningof agricultural biomass: physical and chemical properties of particle-phaseemissions. Atmos. Environ. 39, 6747e6764.
Jia, Y.L., Stong, D., Wang, W.T., Schrlau, J., Tao, S., Simonich, S.L.M., 2011. Reduction incancer risk due to source control measures during the 2008 Beijing Olympics.Environ. Health Perspect. 119, 815e820.
Liu, Y.N., Tao, S., Yang, Y.F., Dou, H., Yang, Y., Coveney, R.M., 2007a. Inhalationexposure of traffic police officers to polycyclic aromatic hydrocarbons (PAHs)during the winter in Beijing, China. Sci. Total Environ. 383, 98e105.
Liu, S.Z., Tao, S., Liu, W.X., Liu, Y.N., Dou, H., Zhao, J.Y., Wang, L.G., Wang, J.F.,Tian, Z.F., Gao, Y., 2007b. Atmospheric polycyclic aromatic hydrocarbons inNorth China: a wintertime study. Environ. Sci. Technol. 41, 8256e8261.
Lu, C.G., Gao, X., Yu, Q., Li, C.L., Chen, L.M., 2006. Indoor air polycyclic aromatichydrocarbons in rural tibetan residence and the depositions on human respi-ratory tract. J. Fudan Univ. (in Chinese) 45, 714e718.
Mumford, J.L., Helmes, C.T., Lee, X., Seidenberg, J., Nesnow, S., 1990. Mouse skintumorigenicity studies of indoor coal and wood combustion emissions fromhomes of residents in Xuan Wei, China with high lung cancer mortality.Carcinogenesis 11, 397e403.
Pankow, J., 1987. Review and comparative analysis of the theories on partitioningbetween the gas and aerosol particulate phases in the atmosphere. Atmos.Environ. 21, 2275e2283.
Purohit, V., Basu, A.K., 2000. Mutagenicity of nitroaromatic compounds. Chem. Res.Toxicol. 13, 673e692.
Ramdahl, T., 1983. Retene e a molecular marker of wood combustion in ambient air.Nature 306, 580e583.
Sauvain, J.J., Duc, T.V., 2004. Approaches to identifying and quantifying polycyclicaromatic hydrocarbons of molecular weight 302 in diesel particulates. J. Sep.Sci. 27, 78e88.
Shen, G.F., Wang, W., Yang, Y.F., Ding, J.N., Xue, M., Min, Y.J., Zhu, C., Shen, H.Z., Li, W.,Wang, B., Wang, R., Wang, X.L., Tao, S., Russell, A.G., 2011. Emission of PAHs fromindoor crop residue burning in a typical rural stove: emission factors, sizedistributions and gas-particle partitioning. Environ. Sci. Technol. 45,1206e1212.
Tang, N., Hattori, T., Taga, R., Igarashi, K., Yang, X.Y., Tamura, K., Kakimoto, H.,Mishukov, V.F., Toriba, A., Kizu, R., Hayakawa, K., 2005. Polycyclic aromatichydrocarbons and nitropolycyclic aromatic hydrocarbons in urban air particu-lates and their relationship to emission sources in the pan-Japan Sea countries.Atmos. Environ. 39, 5817e5826.
Tsapakis, M., Stephanou, E.G., 2003. Collection of gas and particle semi-volatileorganic compounds: use of an oxidant denuder to minimize polycyclicaromatic hydrocarbons degradation during high-volume air sampling. Atmos.Environ. 37, 4935e4944.
USEPA, 2010. Development of a Relative Potency Factor (RPF) Approach for Poly-cyclic Aromatic Hydrocarbon (PAH) Mixtures, an External Review Draft. U.S.
Environmental Protection Agency, Integrated Risk Information System (IRIS),Washington, DC.
Walgraeve, C., Demesstere, K., Dewulf, J., Zimmermann, R., van Langenhove, H.,2010. Oxygenated polycyclic aromatic hydrocarbons in atmospheric particulatematter: molecular characterization and occurrence. Atmos. Environ. 44,1831e1846.
Wang, W.T., 2010. Regional distribution and air-soil exchange of polycyclic aromatichydrocarbons (PAHs) and their derivatives in Beijing-Tianjin area. Ph.D.Dissertation, Peking University, Beijing, China.
Wang, W.T., Meng, B.J., Lu, X.X., Liu, Y., Tao, S., 2007. Extraction of polycyclicaromatic hydrocarbons and organochlorine pesticides from soils: a comparisonbetween Soxhlet extraction, microwave-assisted extraction and acceleratedsolvent extraction techniques. Anal. Chim. Acta 602, 211e222.
Watson, J.G., 1984. Overview of receptor model principles. J. Air Pollut. ControlAssoc. 34, 619e623.
Wilson, N.K., McCurdy, T.R., Chuang, J.C., 1995. Concentrations and phase distribu-tions of nitrated and oxygenated polycyclic aromatic hydrocabrons in ambientair. Atmos. Environ. 29, 2575e2584.
World Bank report, 2007. Cost of Pollution in China. Economic Estimates of PhysicalDamages. Office of the Publisher of the World Bank, Washington, D.C.
Wu, S.P., Tao, S., Zhang, Z.H., Lan, T., Zuo, Q., 2005. Distribution of particle-phasehydrocarbons, PAHs and OCPs in Tianjin, China. Atmos. Environ. 39, 7420e7432.
Xue, W.L., Warshawsky, D., 2005. Metabolic activation of polycyclic and heterocyclicaromatic hydrocarbons and DNA damage: a review. Toxicol. Appl. Pharmacol.206, 73e93.
Yunker, M.B., Macdonald, R.W., Vingarzan, R., Mitchell, H.R., Goyette, D.,Sylvestre, S., 2002. PAHs in the Fraser River basin: a critical appraisal PAH ratiosas indicators of PAH source and composition. Org. Geochem. 33, 489e515.
Zhang, X.L., Tao, S., Liu, W.X., Yang, Y., Zuo, Q., Liu, S.Z., 2005. Source diagnostics ofpolycyclic aromatic hydrocarbons based on species ratios: a multimediaapproach. Environ. Sci. Technol. 39, 9109e9114.
Zhang, Y.X., Dou, H., Chang, B., Wei, Z.C., Qiu, W.X., Liu, S.Z., Liu, W.X., Tao, S., 2008.Emission of polycyclic aromatic hydrocarbons from indoor straw burning andemission inventory updating in China. Ann. NY Acad. Sci. 1140, 218e227.
Zhang, Y.X., Tao, S., Shen, H.Z., Ma, J.M., 2009. Inhalation exposure to ambientpolycyclic aromatic hydrocarbons and lung cancer risk of Chinese population.Proc. Nat. Acad. Sci. U S A 106, 21063e21067.
Zhong, J.J., 2010. Indoor Particulate Matter Air Pollution and Human Exposure fromCooking Practices in a Rural Northern China Home. M.S. Thesis, XingjianUniversity. Wulumuqi, China.
Zhu, L.Z., Wang, J., 2003. Sources and patterns of polycyclic aromatic hydrocarbonspollution in kitchen air, China. Chemosphere 50, 611e618.
Zuo, Q., Duan, Y.H., Yang, Y., Wang, X.J., Tao, S., 2007. Source apportionment ofpolycyclic aromatic hydrocarbons in surface soil in Tianjin, China. Environ.Pollut. 147, 303e310.