Embed Size (px)
Citation preview
1
A Quantitative Means of Comparing Competitive Advantage among Airlines with
Heterogeneous Business Models: Analysis of U.S. Airlines
Loren Moir
Griffith University
Gui Lohmann
Griffith University
Abstract
Increasing heterogeneity amongst airline business models makes objectively
comparing their competitive advantage increasingly difficult. In this study, we develop
an instrument that objectively quantifies the competitive advantage of airlines within a
single market, the US. The data sample includes nine US airlines with product and
financial data gathered from 2011 to 2013. The consolidated data enable the calculation
of a product index and a cost index. The product index incorporates four sub-indices
(revenue, connectivity, convenience and comfort), while the cost index incorporates
three sub-indices (unit cost, aircraft and labour). The developed model enables the
identification of the hybrid business models that are successfully pursuing an integrated
cost leadership and differentiation strategy. The results also confirm that competitive
heterogeneity exists whilst demonstrating that competitive advantage can be mutually
exclusive to the respective airline’s strategic proposition.
Keywords: Airline business models; Competitive advantage; Airline strategy;
Integrated strategy; Product and organisational architecture
Highlights
• Airline business models have increased in terms of diversification
• Diversification increases the difficulty in understanding competitive advantages
2
• The proposed model enables the identification of the hybrid business model
• Results confirm competitive heterogeneity amongst airlines in the US
3
1. Introduction
Academic studies have demonstrated that airline business models are diverging from
the two homogeneous strategic archetypes (e.g., Jean & Lohmann, 2016, Lohmann &
Koo, 2013). This new level of competitive heterogeneity amongst airlines challenges
Porter’s (1985) original competitive advantage (CA) theory, which stated that firms
could either compete on the basis of cost or differentiation. In the airline context, the
Laker Airways example from the 1980s demonstrates the risks of pursuing both a cost
and differentiation strategy. Skipping forward three decades, the airline industry is now
served by a spectrum of airline business models that compete both regarding cost and
differentiation.
For example, JetBlue, an airline identified by academics as presenting a ‘hybrid’
business model proposition (Doustaler and Flouris, 2006), maintains a mission to offer
a differentiated product at a cost-effective price. Their pursuit of an integrated strategy
suggests that an airline can compete both regarding product and cost. Firms that pursue
an integrated strategy are considered to be more adaptable to shifting macroeconomic
and microeconomic conditions.
Competitive heterogeneity has made comparisons between airlines increasingly more
difficult. Without distinct cost or product advantages, CA stems from overall value
creation, which is achieved primarily through innovations or technology in the supply
chain (Holloway, 2008). Comparing traditional key performance indicators (KPIs) such
as cost per available seat mile (CASM) and revenue per available seat mile (RASM) in
isolation is currently considered ineffective. Instead, a holistic assessment of both the
airline and the market is required to identify value created and thus overall CA.
This paper aims to conceptualise an instrument through which CA can be quantified
and thus compared among airlines with heterogeneous business models. The conceptual
model assumes that competitive heterogeneity exists within the airline industry. An
instrument that measures CA is beneficial to airline managers at a strategic level. The
paper also considers the hypothesised integrated cost leadership and differentiation
strategy (integrated strategy), developing a technique by which the results can be
applied to the ‘airline realised business strategies’ model. This model was originally
conceived by Doustaler and Flouris (2006), enabling the identification of successful
integrated strategies.
4
2. Literature Review
Strategic context
Airline business models
Early airline strategy literature recognised that airlines follow Porter’s (1985) CA
model. The traditional strategy included pursuing either a cost leadership strategy (low-
cost carrier – LCC model or ‘Southwest model’ original proposition) or a differentiation
strategy (full-service network carrier – FSNC model). Alamdari and Fagan (2005)
noted that LCCs started to diverge from the traditional LCC model by offering
additional products and services. Button and Ison (2008) and Button (2012) cast doubt
over the sustainability of the pure LCC business model. This divergence from the LCC
archetype has been described as hybridisation. Airlines such as JetBlue openly state
that their strategy is to pursue a hybrid business model. The ‘JetBlue Experience’ offers
a differentiated product at a cost-effective price (JetBlue Airways Corporation, 2014).
Dostaler and Flouris (2006) hypothesised that hybridisation could be considered an
integrated cost leadership and differentiation strategy.
The Airlines-within-airlines (AWA) model is a strategic response by FSNCs to combat
the rise of LCCs. The AWA model enabled FSNCs to pursue a cost leadership or focus
strategy by operating a portfolio of airlines in various market segments (Graham and
Vowels, 2006). As discussed by Whyte and Lohmann (2015), the Jetstar portfolio of
five airlines, owned mostly in part by Qantas, remains one of the most successful
examples of AWA. The AWA model ended in the United States following the
discontinuation of Ted in 2009; however, it continues to be successful throughout both
Europe and the Asia-Pacific region, which jointly account for over 90 % of worldwide
AWAs (Pearson and Merkert, 2014). The vulnerabilities to an FSNC by pursuing an
AWA strategy are discussed by Gillen and Gados (2008).
Charter airlines can be defined as an ‘airline that provides point-to-point services to
popular holiday and leisure destinations, often as part of an inclusive tour (also known
as a package tour)’ (Whyte & Lohmann, 2017, p. 113). Charter airlines can be
considered another business model that tends to conform to the homogeneity of LCCs
but operates with a focus strategy.
Of the business models currently in play, hybridisation, AWAs and charter airlines are
all strategic responses to the heterogenic competitive landscape within the industry.
Although the traditional business models still exist as a benchmark, the degree of
5
conformity to those archetypes now varies through a phenomenon referred to as
business model convergence (Daft and Albers, 2013 & 2015).
Conceptualising airline business model convergence
Alamdari and Fagan (2005) demonstrated that contemporary LCCs were diverging
from the traditional LCC archetype. They identified Ryanair and Easyjet as the airlines
that conformed most closely to the original LCC model, but even those two maintained
only 79 % conformance (Alamdari and Fagan, 2005, p. 384). Tsoukalas, Belobaba and
Swelbar (2008) and Belobaba, Odoni and Barnhart (2009) further demonstrated that
FSNCs are also diverging from the traditional FSNC archetype. Their studies also
demonstrated a narrowing of unit costs between US-based LCCs and FSNCs during the
period between 1995 and 2006. This continued divergence from both strategic
propositions is now collectively known as ‘airline business model convergence’ (Daft
and Albers, 2013 & 2015). Traditionally, business model convergence represents a
weakening in an airlines’ strategic position; however, ‘convergence also has positive
effects if it reflects the diffusion of efficient processes and practices among firms’ (Daft
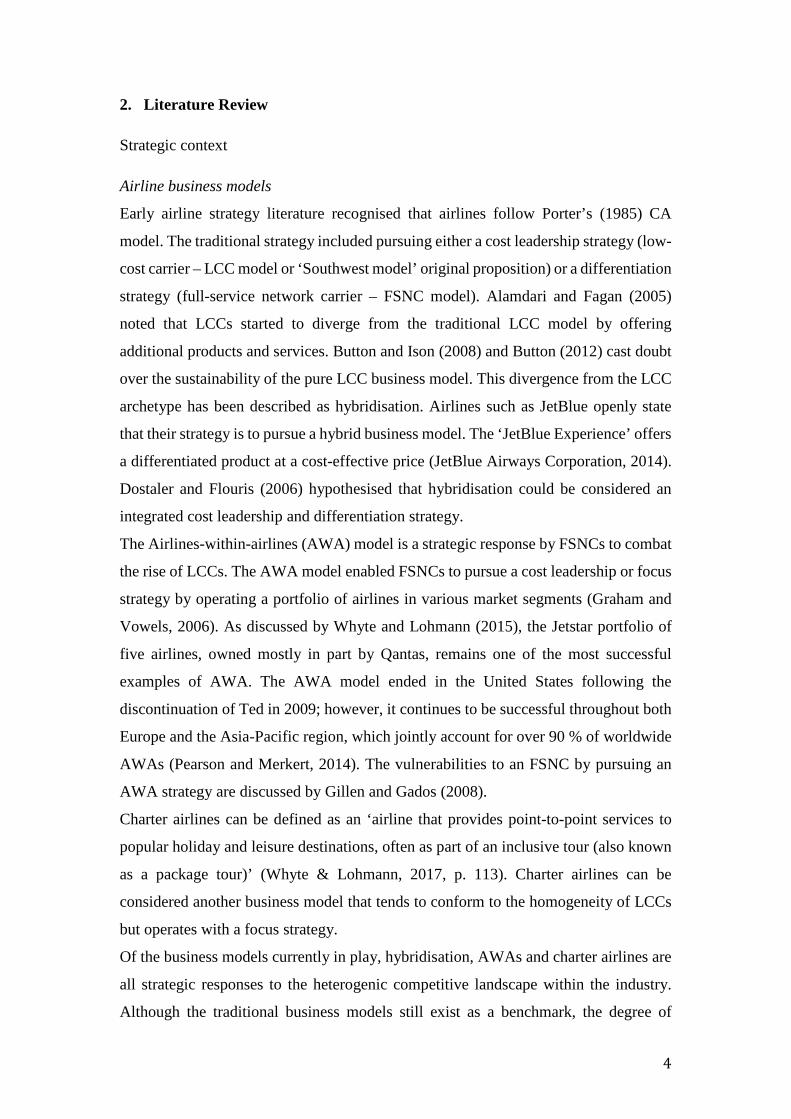
and Albers, 2013, p. 47). Airline business model convergence has raised questions
regarding the possible existence of an integrated cost leadership/differentiation strategy
(see Figure 1).
Figure 1: Business model divergence from homogeneous strategic archetypes. Adapted from Doustaler
and Flouris (2006)
Integrated cost leadership/differentiation strategy
Porter’s (1985) CA literature considers the risks associated with being ‘stuck in the
middle’ and identifies Laker Airways as the classic example. Dostaler and Flouris
(2006) revisited Porter’s theory and introduced the concept of an ‘integrated cost
Cost Leadership
LCC Model Differentiation
FSNC Model
Stuck in the middle OR
Integrated cost leadership /
differentiation strategy?
6
leadership/differentiation strategy’ in an airline context, or put more simply, the ‘best
cost-provider’. As described by Dostaler and Flouris (2006), an integrated strategy is
achieved by creating value through optimising the trade-off between product and cost.
For that reason, this model has also been referred to as the ‘trade-off model’. Dostaler
and Flouris (2006) draw on the more recent works to create a case for an integrated
strategy. They propose a simple, objective method for measuring an airlines’
effectiveness with this strategy (referred to as the ‘airline realised business strategies’
model). Although it proposes a simple method for joint comparison of cost versus
differentiation, this model is limited in that it stops short of providing a method of
quantifying cost and differentiation for the purposes of comparison.
Although a method to determine cost and differentiation for comparison is not
presented by Dostaler and Flouris (2006), other authors have created relevant methods
that can be adapted to this model. Pearce and Smyth (2006), Tsoukalas et al. (2008) and
Belobaba et al. (2009) all apply the delineated unit cost method for a cost model
comparison between airlines. In this method, the unit costs of the respective airlines are
corrected for labour costs, fuel costs, distribution costs, transport-related costs and other
related infrastructure costs. The actual delineation technique applied by the
aforementioned authors is dependent upon the accounting policies of the airlines being
compared. Methods for differentiation comparisons have been developed by Lohmann
and Koo (2013), building on the work of Mason and Morrison (2008). Currently,
holistic methods for comparing airline business models within the literature have been
shown to be both qualitative and quantitative.
Academic techniques for comparing airline business models
Qualitative techniques
A qualitative analysis of business model convergence was conducted by Jarach, Zerbini
and Miero (2009). Their case study analysed survey results from senior executives from
six European airlines. The consensus among the respondents was that all airlines,
regardless of their business model, were competing for the same passengers. Business
travellers were considered to be the most lucrative client base, and the LCC respondents
were willing to offer greater flexibility to secure their business. Therefore, despite their
lack of quantitative data, these results are important, as they highlight a series of
conscious decisions made by airline managers to strategically shift their business model.
7
Using O’Connell’s (2007) template, Pearson, O’Connell, Pitfield and Ryley (2015)
assessed the strategic capability of 22 Asian FSNCs to compete with LCCs. Although
using a quantitative approach through the use of mathematical formulae, the data set is
qualitative, as it uses senior managers’ responses to 74 questions posed by the
researchers. This qualitative methodology is endorsed by IATA as an effective tool for
measuring strategic capability, as it enables comparisons between airlines with non-
homogenised financial reporting practices. Effective comparisons can thus be made
between airlines based in different countries as well as airlines owned privately or by
the government that choose not to report specific financial data. Where homogenised
financial data is available, quantitative methodologies can effectively be employed.
Quantitative techniques
The application of quantitative methodologies for business model comparison mitigates
the subjective results that are attained through the aforementioned qualitative survey
methods. However, a quantitative business model analysis using financial data is not
without risk, as emphasised by Karwowski (2016). Differing accounting policies
between airlines can skew the results. The following three quantitative methods, which
rely on homogenised financial data, are worthy of note.
Mason and Morrison (2008) examined the product and organisational architecture
(POA) of six European LCCs from 2005 to 2006. Product architecture identifies three
components of service quality: connectivity, convenience and comfort. Organisational
architecture identifies input choices: distribution channels, aircraft, labour and airports.
Indices are formed for each of the component/input choices using the ‘best in class’
methodology. The POA model utilises a total of 37 variables to form 11 indices per
sample airline. By applying the POA model, Mason and Morrison (2008) quantified
the hybridisation of LCCs, and their study was a precursor for the ‘Airline business
model spectrum’ developed by Lohmann and Koo (2013).
The airline business model spectrum was first conceived by Lohmann and Koo (2013)
and subsequently revisited by Jean and Lohmann (2016). The airline business model
spectrum focused on 20 of the 37 variables originally adopted by Mason and Morrison
(2008); these variables formed six indices (revenue, connectivity, convenience, comfort,
aircraft, labour) that were then averaged to measure the index of each airline along the
business model spectrum.
8
Flouris and Walker (2007) developed an effective two-step process for comparing
financial performance between different business models. The two steps are financial
ratio analysis and stock performance analysis. The comparison undertaken by Flouris
and Walker’s post-September 11, 2011 between WestJet and Air Canada showed the
LCC WestJet outperforming Air Canada due to WestJet’s lower cost structure and
lower break-even load factor. The limitations of the Flouris and Walker (2007) method
is that it only compares financial output; it does not consider the product or cost inputs
of the various business models.
Summary of airline business model analyses
The quantitative techniques employed by Mason and Morrison (2008), Lohmann and
Koo (2013) and Flouris and Walker (2007) are all adapted to the conceptual CA
methodology proposed by this paper. Currently, limited quantitative methodologies
exist that exclusively compare CA between business models. Pearson, Pitfield and
Ryley (2015) assessed the intangible resources of CA among 49 airlines across three
business models. Similar to Pearson, O’Connell, Pitfield and Ryley (2015), this
methodology employed personal responses from senior managers, thus making the
assessment qualitative and potentially subjective. Therefore, the methodology proposed
by this paper is a quantitative approach using financial metrics, enabling a means of
objectively comparing CA between heterogeneous business models.
3. Methodology
Conceptualising the competitive advantage model
An airline whose product creates the most customer perceived value is deemed to have
the greatest CA (Pearson, Pitfield and Ryley (2015). Thus, the conceptual CA model
presented herein identifies which airlines create the greatest value in their product while
enabling comparisons between airlines with heterogeneous strategies. The CA model
employs product and cost inputs as the genesis for the calculation of product, cost and
CA scores. The various scores are then applied to identify which airlines are successful
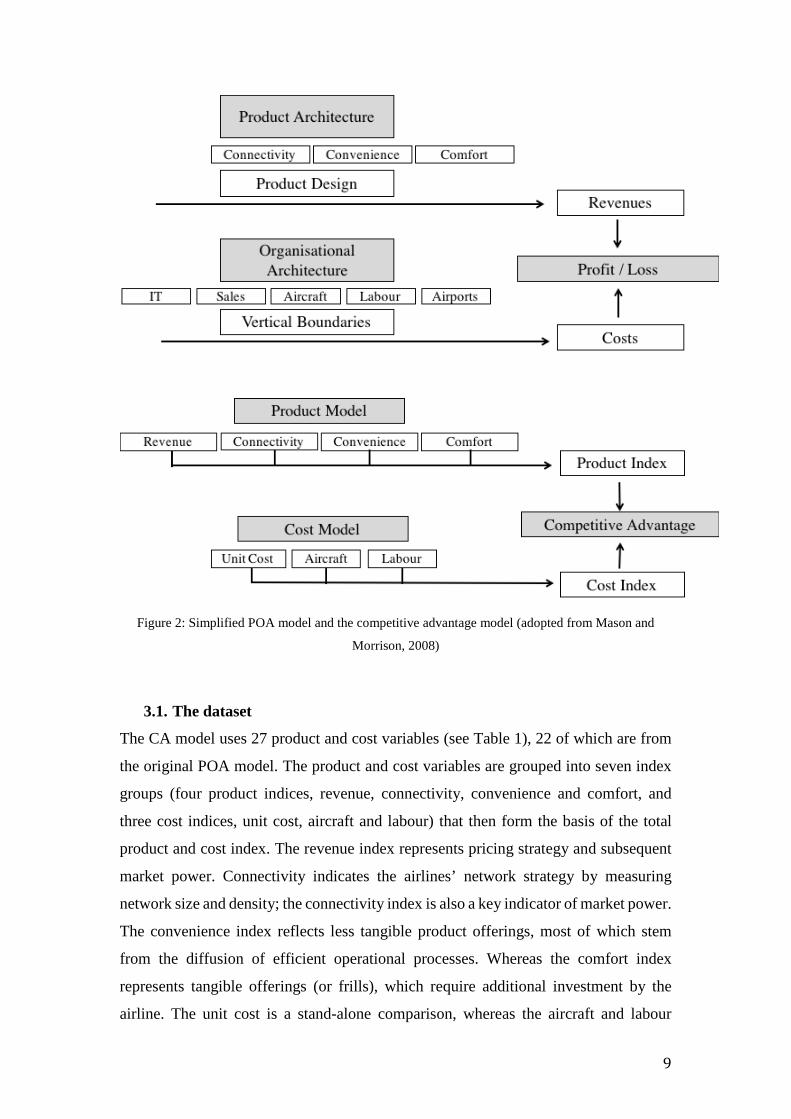
in pursuing an integrated cost leadership/differentiation strategy. The POA originally
presented by Mason and Morrison has provided the template for the CA model (both
presented in Figure 2).
9
Figure 2: Simplified POA model and the competitive advantage model (adopted from Mason and
Morrison, 2008)
3.1. The dataset
The CA model uses 27 product and cost variables (see Table 1), 22 of which are from
the original POA model. The product and cost variables are grouped into seven index
groups (four product indices, revenue, connectivity, convenience and comfort, and
three cost indices, unit cost, aircraft and labour) that then form the basis of the total
product and cost index. The revenue index represents pricing strategy and subsequent
market power. Connectivity indicates the airlines’ network strategy by measuring
network size and density; the connectivity index is also a key indicator of market power.
The convenience index reflects less tangible product offerings, most of which stem
from the diffusion of efficient operational processes. Whereas the comfort index
represents tangible offerings (or frills), which require additional investment by the
airline. The unit cost is a stand-alone comparison, whereas the aircraft and labour
10
indices are both measurements of productivity. The sample includes nine US airlines
(Alaska Airlines, American Airlines, Delta Air Lines, Frontier Airlines, Hawaiian
Airlines, JetBlue Airways, Southwest Airlines, Spirit Airlines and United Airlines)
whose financial and product data is taken from fiscal years 2011 through 2013. The
sample group was chosen to provide a mix of pre-identified FSNCs, LCCs and hybrid
carriers. Of the total 729 variables in the data sample, 720 were successfully populated,
giving a completion ratio of over 98.7 %.
The period (2011-2013) was chosen largely due to the availability of homogenised
financial reporting, which was challenging to identify due to multiple airline mergers
pre-period and post-period. Fuel prices during the period were also relatively consistent
with an average price of USD 2.99 per gallon and a monthly standard deviation of only
16c. This contrasts with the three-year period immediately before 2011 and post-2013
during which the monthly standard deviation was 73c and 68c respectively (Index
Mundi, 2017). Although the fuel price was characterised as being unusually high, price
consistency would ensure a degree of rationality in airline executives’ strategic decision
making. Frontier Airlines was included in the sample group despite being owned by
private equity firm Indigo Partners. A complete data set exists for CA modelling;
however, due to the lack of financial reporting, financial comparisons are limited.
Data sources include airline annual reports (SEC Form 10K), Bureau of Transportation
Statistics (BTS), the MIT Airline Data Project, Google maps and industry websites
SeatGuru, SeatExpert and AIRFLEETS. Other industry reports and media statements
have been used to provide a context where required with the applicable citations.
Differences from the Mason and Morrison (2008) POA model
The POA model was chosen because it effectively delineates product and cost inputs
for an airline business model. The CA model then uses the delineated data to calculate
the total product and cost indices, which can be then compared to other airlines within
the airline market. Figure 2 shows the original nine indices that formed the POA model
and the conceptual CA model, which has adopted seven of the original nine indices. As
highlighted above, five additional variables that were not considered by the POA model
have been included in the CA model. The additional variables, along with other specific
differences, are presented herein.
11
Customer Satisfaction
Due to the availability of BTS data, customer complaints, denied boarding, and
mishandled baggage were included as components of the convenience index. However,
five variables (denied boardings for 2011, 2012 and 2013 and mishandled baggage for
2012 and 2013) remain unfilled for Spirit, as that airline was not required by the DOT
to report these data during that period due to their size.
Fuel Efficiency
Fuel KPIs were included in the aircraft index, as fuel efficiency now forms an important
component of an airline’s cost KPI. In 2013, JetBlue’s fuel cost accounted for 37.9 %
of their total operating costs (JetBlue Airways Corporation, 2014). In the same year,
JetBlue announced they would retrofit their entire A320 family fleet with fuel-saving
‘sharklets’ as part of a commitment to reducing fuel cost. The ‘sharklet’ (or winglet)
can reduce fuel burn by up to 4 % while also increasing aircraft range, enabling greater
commercial opportunities (JetBlue Airways Corporation, 2013; Airbus, 2013). Other
fuel-saving initiatives or tangible investments available to airlines include newer
aircraft and engines, fuel saving software and fuel saving operating procedures. The
fuel variables in the CA model include the following:
• Fuel cost per gallon – this variable can be managed at the strategic level through
effective hedging, greater buying power and strategic fuel tankering (carrying
additional fuel from airports with a lower fuel price);
• Fuel quantity per available seat mile (ASM) – this variable can be managed at
both the operational and tactical level. Techniques include fuel-saving operating
procedures, operating from less congested airports and more direct flight
routing where possible;
• Price per ASM – the final fuel variable can be managed using similar techniques
as the previous two variables.
Stage Length
Stage length was not considered as a variable in the original POA model. However, the
airline business model spectrum by Lohmann and Koo (2013) included stage length as
a component of connectivity. The CA model has allocated stage length as a component
of the aircraft index with longer stage lengths seen as a strategic method for reducing
pressure on unit costs. Alamdari and Fagan (2004) suggested that LCCs historically
12
pursued shorter stage lengths, but emphasised that contemporary LCCs were tending
towards longer stages in excess of 1000 nm, similar to those in this particular sample.
Other differences of note
The market structure was considered by Mason and Morrison (2008) to be mutually
exclusive to both the product and organisational architectures. However, key indicators
of market structure are represented in the product model via both the revenue index
(pricing strategy) and connectivity index (network/supply strategy). Sales and
distribution indices were excluded due to the lack of available data. Spirit and Alaska
were the only airlines to comprehensively report the breakdown of their distribution
channels. Differences in the calculation of indices also exist with the CA model (see
Table 1) employing a Z-distribution with equal weighting given to each variable (as
opposed to the weighted ‘best in class’ methodology).
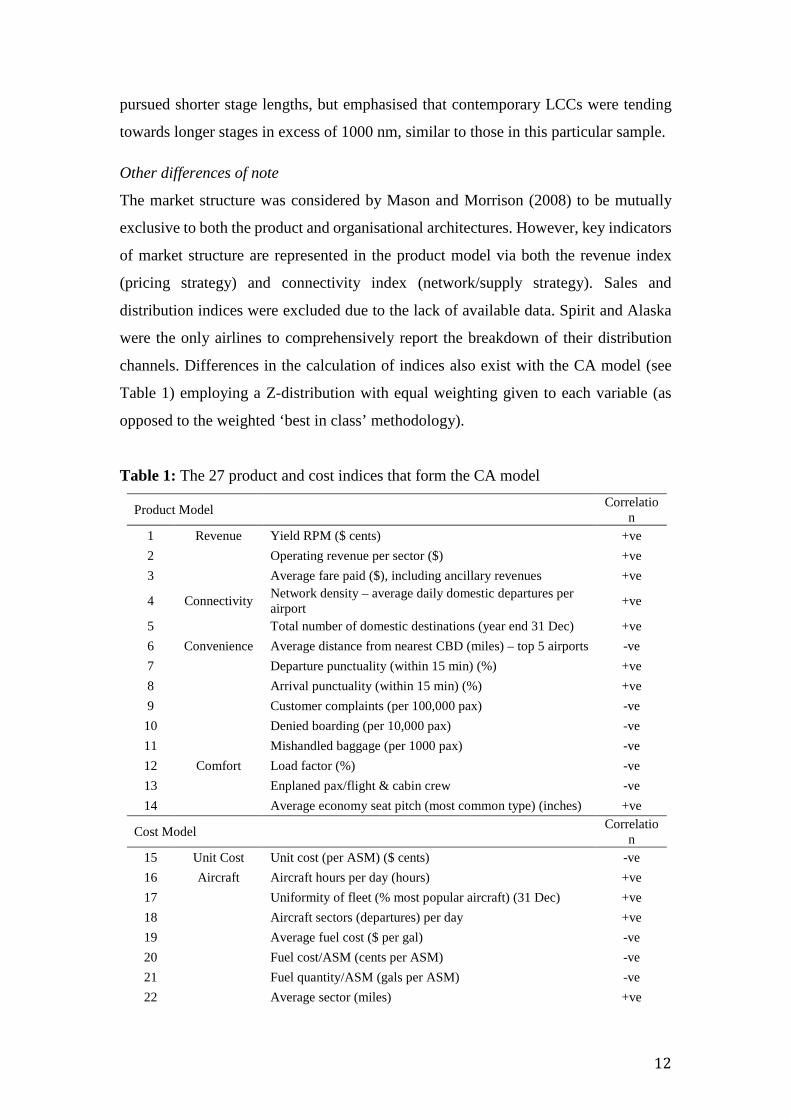
Table 1: The 27 product and cost indices that form the CA model
Product Model
Correlation
1 Revenue Yield RPM ($ cents) +ve 2 Operating revenue per sector ($) +ve 3 Average fare paid ($), including ancillary revenues +ve
4 Connectivity Network density – average daily domestic departures per airport +ve
5 Total number of domestic destinations (year end 31 Dec) +ve 6 Convenience Average distance from nearest CBD (miles) – top 5 airports -ve 7 Departure punctuality (within 15 min) (%) +ve 8 Arrival punctuality (within 15 min) (%) +ve 9 Customer complaints (per 100,000 pax) -ve
10 Denied boarding (per 10,000 pax) -ve 11 Mishandled baggage (per 1000 pax) -ve 12 Comfort Load factor (%) -ve 13 Enplaned pax/flight & cabin crew -ve 14 Average economy seat pitch (most common type) (inches) +ve
Cost Model
Correlation
15 Unit Cost Unit cost (per ASM) ($ cents) -ve 16 Aircraft Aircraft hours per day (hours) +ve 17 Uniformity of fleet (% most popular aircraft) (31 Dec) +ve 18 Aircraft sectors (departures) per day +ve 19 Average fuel cost ($ per gal) -ve 20 Fuel cost/ASM (cents per ASM) -ve 21 Fuel quantity/ASM (gals per ASM) -ve 22 Average sector (miles) +ve
13
23 Labour Enplaned pax/total employees +ve 24 Employees/aircraft -ve 25 Personnel cost per ASM ($ cents) -ve 26 Flight & cabin crew/total employee (%) +ve 27 ASM/employee (000) +ve
Calculation of indices
A Z-distribution is used as a means to standardise variables with a score from 0 to 1.
Unlike the POA model, the conceptual CA methodology does not apply weightings to
each of the indices. A future iteration of the study could apply weightings for a more
accurate representation of indices, but additional research would initially be required
about the suitability of the respective weightings. Product and cost indices are scored
from 0 to 1, whilst the CA score (product index plus cost index) is scored from 0 to 2
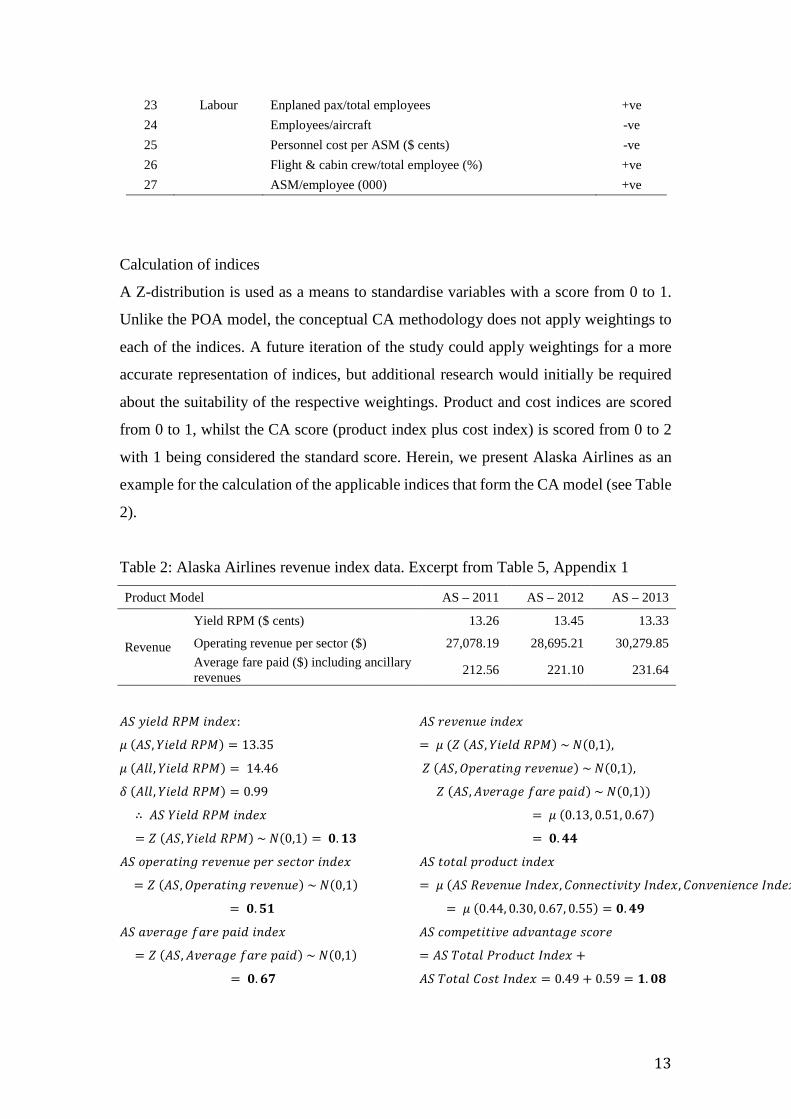
with 1 being considered the standard score. Herein, we present Alaska Airlines as an
example for the calculation of the applicable indices that form the CA model (see Table
2).
Table 2: Alaska Airlines revenue index data. Excerpt from Table 5, Appendix 1
Product Model AS – 2011 AS – 2012 AS – 2013
Revenue
Yield RPM ($ cents) 13.26 13.45 13.33
Operating revenue per sector ($) 27,078.19 28,695.21 30,279.85 Average fare paid ($) including ancillary revenues 212.56 221.10 231.64
𝐴𝐴𝐴𝐴 𝑦𝑦𝑦𝑦𝑦𝑦𝑦𝑦𝑦𝑦 𝑅𝑅𝑅𝑅𝑅𝑅 𝑦𝑦𝑖𝑖𝑦𝑦𝑦𝑦𝑖𝑖:
𝜇𝜇 (𝐴𝐴𝐴𝐴,𝑌𝑌𝑦𝑦𝑦𝑦𝑦𝑦𝑦𝑦 𝑅𝑅𝑅𝑅𝑅𝑅) = 13.35
𝜇𝜇 (𝐴𝐴𝑦𝑦𝑦𝑦,𝑌𝑌𝑦𝑦𝑦𝑦𝑦𝑦𝑦𝑦 𝑅𝑅𝑅𝑅𝑅𝑅) = 14.46
𝛿𝛿 (𝐴𝐴𝑦𝑦𝑦𝑦,𝑌𝑌𝑦𝑦𝑦𝑦𝑦𝑦𝑦𝑦 𝑅𝑅𝑅𝑅𝑅𝑅) = 0.99
∴ 𝐴𝐴𝐴𝐴 𝑌𝑌𝑦𝑦𝑦𝑦𝑦𝑦𝑦𝑦 𝑅𝑅𝑅𝑅𝑅𝑅 𝑦𝑦𝑖𝑖𝑦𝑦𝑦𝑦𝑖𝑖
= 𝑍𝑍 (𝐴𝐴𝐴𝐴,𝑌𝑌𝑦𝑦𝑦𝑦𝑦𝑦𝑦𝑦 𝑅𝑅𝑅𝑅𝑅𝑅) ~ 𝑁𝑁(0,1) = 𝟎𝟎.𝟏𝟏𝟏𝟏
𝐴𝐴𝐴𝐴 𝑜𝑜𝑜𝑜𝑦𝑦𝑜𝑜𝑜𝑜𝑜𝑜𝑦𝑦𝑖𝑖𝑜𝑜 𝑜𝑜𝑦𝑦𝑟𝑟𝑦𝑦𝑖𝑖𝑟𝑟𝑦𝑦 𝑜𝑜𝑦𝑦𝑜𝑜 𝑠𝑠𝑦𝑦𝑠𝑠𝑜𝑜𝑜𝑜𝑜𝑜 𝑦𝑦𝑖𝑖𝑦𝑦𝑦𝑦𝑖𝑖
= 𝑍𝑍 (𝐴𝐴𝐴𝐴,𝑂𝑂𝑜𝑜𝑦𝑦𝑜𝑜𝑜𝑜𝑜𝑜𝑦𝑦𝑖𝑖𝑜𝑜 𝑜𝑜𝑦𝑦𝑟𝑟𝑦𝑦𝑖𝑖𝑟𝑟𝑦𝑦) ~ 𝑁𝑁(0,1)
= 𝟎𝟎.𝟓𝟓𝟏𝟏
𝐴𝐴𝐴𝐴 𝑜𝑜𝑟𝑟𝑦𝑦𝑜𝑜𝑜𝑜𝑜𝑜𝑦𝑦 𝑓𝑓𝑜𝑜𝑜𝑜𝑦𝑦 𝑜𝑜𝑜𝑜𝑦𝑦𝑦𝑦 𝑦𝑦𝑖𝑖𝑦𝑦𝑦𝑦𝑖𝑖
= 𝑍𝑍 (𝐴𝐴𝐴𝐴,𝐴𝐴𝑟𝑟𝑦𝑦𝑜𝑜𝑜𝑜𝑜𝑜𝑦𝑦 𝑓𝑓𝑜𝑜𝑜𝑜𝑦𝑦 𝑜𝑜𝑜𝑜𝑦𝑦𝑦𝑦) ~ 𝑁𝑁(0,1)
= 𝟎𝟎.𝟔𝟔𝟔𝟔
𝐴𝐴𝐴𝐴 𝑜𝑜𝑦𝑦𝑟𝑟𝑦𝑦𝑖𝑖𝑟𝑟𝑦𝑦 𝑦𝑦𝑖𝑖𝑦𝑦𝑦𝑦𝑖𝑖
= 𝜇𝜇 (𝑍𝑍 (𝐴𝐴𝐴𝐴,𝑌𝑌𝑦𝑦𝑦𝑦𝑦𝑦𝑦𝑦 𝑅𝑅𝑅𝑅𝑅𝑅) ~ 𝑁𝑁(0,1),
𝑍𝑍 (𝐴𝐴𝐴𝐴,𝑂𝑂𝑜𝑜𝑦𝑦𝑜𝑜𝑜𝑜𝑜𝑜𝑦𝑦𝑖𝑖𝑜𝑜 𝑜𝑜𝑦𝑦𝑟𝑟𝑦𝑦𝑖𝑖𝑟𝑟𝑦𝑦) ~ 𝑁𝑁(0,1),
𝑍𝑍 (𝐴𝐴𝐴𝐴,𝐴𝐴𝑟𝑟𝑦𝑦𝑜𝑜𝑜𝑜𝑜𝑜𝑦𝑦 𝑓𝑓𝑜𝑜𝑜𝑜𝑦𝑦 𝑜𝑜𝑜𝑜𝑦𝑦𝑦𝑦) ~ 𝑁𝑁(0,1))
= 𝜇𝜇 (0.13, 0.51, 0.67)
= 𝟎𝟎.𝟒𝟒𝟒𝟒
𝐴𝐴𝐴𝐴 𝑜𝑜𝑜𝑜𝑜𝑜𝑜𝑜𝑦𝑦 𝑜𝑜𝑜𝑜𝑜𝑜𝑦𝑦𝑟𝑟𝑠𝑠𝑜𝑜 𝑦𝑦𝑖𝑖𝑦𝑦𝑦𝑦𝑖𝑖
= 𝜇𝜇 (𝐴𝐴𝐴𝐴 𝑅𝑅𝑦𝑦𝑟𝑟𝑦𝑦𝑖𝑖𝑟𝑟𝑦𝑦 𝐼𝐼𝑖𝑖𝑦𝑦𝑦𝑦𝑖𝑖,𝐶𝐶𝑜𝑜𝑖𝑖𝑖𝑖𝑦𝑦𝑠𝑠𝑜𝑜𝑦𝑦𝑟𝑟𝑦𝑦𝑜𝑜𝑦𝑦 𝐼𝐼𝑖𝑖𝑦𝑦𝑦𝑦𝑖𝑖,𝐶𝐶𝑜𝑜𝑖𝑖𝑟𝑟𝑦𝑦𝑖𝑖𝑦𝑦𝑦𝑦𝑖𝑖𝑠𝑠𝑦𝑦 𝐼𝐼𝑖𝑖𝑦𝑦𝑦𝑦𝑖𝑖
= 𝜇𝜇 (0.44, 0.30, 0.67, 0.55) = 𝟎𝟎.𝟒𝟒𝟒𝟒
𝐴𝐴𝐴𝐴 𝑠𝑠𝑜𝑜𝑐𝑐𝑜𝑜𝑦𝑦𝑜𝑜𝑦𝑦𝑜𝑜𝑦𝑦𝑟𝑟𝑦𝑦 𝑜𝑜𝑦𝑦𝑟𝑟𝑜𝑜𝑖𝑖𝑜𝑜𝑜𝑜𝑜𝑜𝑦𝑦 𝑠𝑠𝑠𝑠𝑜𝑜𝑜𝑜𝑦𝑦
= 𝐴𝐴𝐴𝐴 𝑇𝑇𝑜𝑜𝑜𝑜𝑜𝑜𝑦𝑦 𝑅𝑅𝑜𝑜𝑜𝑜𝑦𝑦𝑟𝑟𝑠𝑠𝑜𝑜 𝐼𝐼𝑖𝑖𝑦𝑦𝑦𝑦𝑖𝑖 +
𝐴𝐴𝐴𝐴 𝑇𝑇𝑜𝑜𝑜𝑜𝑜𝑜𝑦𝑦 𝐶𝐶𝑜𝑜𝑠𝑠𝑜𝑜 𝐼𝐼𝑖𝑖𝑦𝑦𝑦𝑦𝑖𝑖 = 0.49 + 0.59 = 𝟏𝟏.𝟎𝟎𝟎𝟎
14
Negative correlation
The Alaska Airlines sample represents all variables that make a positive correlation to
the total index. In the case of those variables in Table 1 that provide a negative
correlation to the total index, the calculated Z-score is then subtracted from 1. The
calculation of the Alaska Airlines unit cost index is presented as an example as follows:
Example: Alaska Airlines unit cost index:
𝜇𝜇 (𝐴𝐴𝐴𝐴,𝑈𝑈𝑖𝑖𝑦𝑦𝑜𝑜 𝐶𝐶𝑜𝑜𝑠𝑠𝑜𝑜) = 11.91
𝜇𝜇 (𝐴𝐴𝑦𝑦𝑦𝑦,𝑈𝑈𝑖𝑖𝑦𝑦𝑜𝑜 𝐶𝐶𝑜𝑜𝑠𝑠𝑜𝑜) = 12.64
𝛿𝛿 (𝐴𝐴𝑦𝑦𝑦𝑦,𝑈𝑈𝑖𝑖𝑦𝑦𝑜𝑜 𝐶𝐶𝑜𝑜𝑠𝑠𝑜𝑜) = 1.43
∴ 𝐴𝐴𝐴𝐴 𝑈𝑈𝑖𝑖𝑦𝑦𝑜𝑜 𝐶𝐶𝑜𝑜𝑠𝑠𝑜𝑜 𝑦𝑦𝑖𝑖𝑦𝑦𝑦𝑦𝑖𝑖 = 1 − [𝑍𝑍 (𝐴𝐴𝐴𝐴,𝑌𝑌𝑦𝑦𝑦𝑦𝑦𝑦𝑦𝑦 𝑅𝑅𝑅𝑅𝑅𝑅) ~ 𝑁𝑁(0,1)] = 𝟎𝟎.𝟔𝟔𝟎𝟎
Therefore, by taking unit cost as an example, the lower the unit cost, the higher the unit
cost index, and subsequently the higher the total cost index.
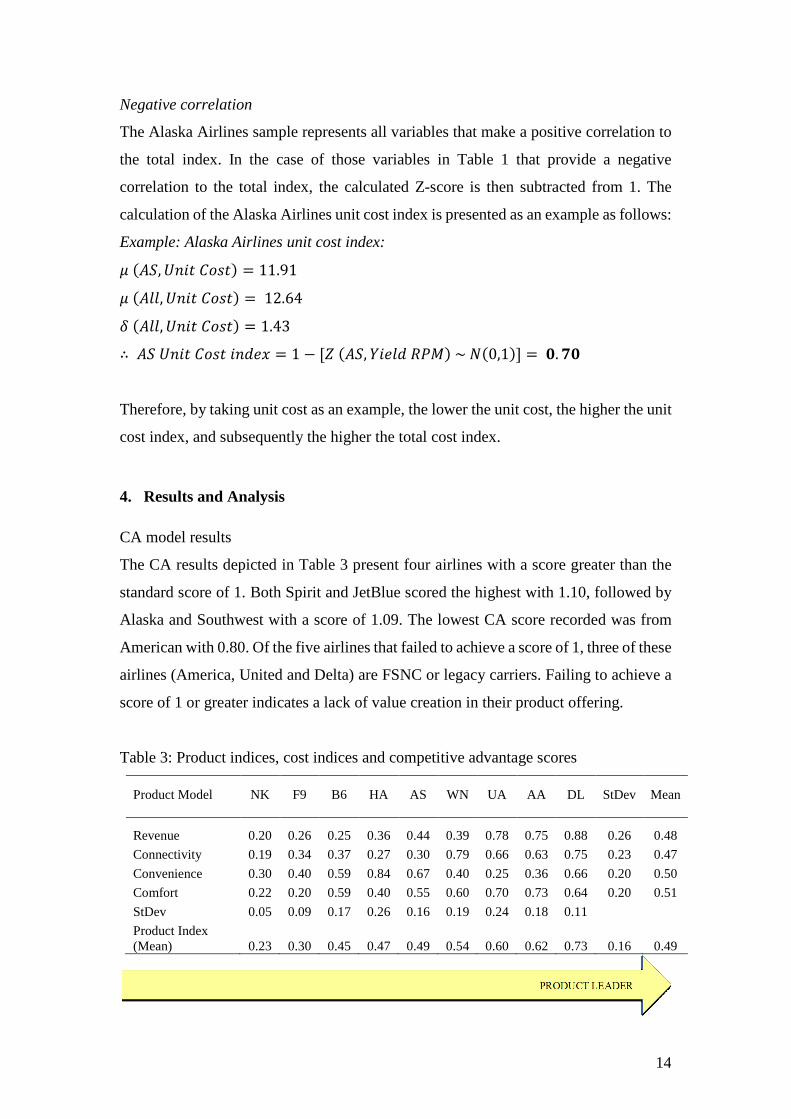
4. Results and Analysis
CA model results
The CA results depicted in Table 3 present four airlines with a score greater than the
standard score of 1. Both Spirit and JetBlue scored the highest with 1.10, followed by
Alaska and Southwest with a score of 1.09. The lowest CA score recorded was from
American with 0.80. Of the five airlines that failed to achieve a score of 1, three of these
airlines (America, United and Delta) are FSNC or legacy carriers. Failing to achieve a
score of 1 or greater indicates a lack of value creation in their product offering.
Table 3: Product indices, cost indices and competitive advantage scores Product Model NK F9 B6 HA AS WN UA AA DL StDev Mean Revenue 0.20 0.26 0.25 0.36 0.44 0.39 0.78 0.75 0.88 0.26 0.48 Connectivity 0.19 0.34 0.37 0.27 0.30 0.79 0.66 0.63 0.75 0.23 0.47 Convenience 0.30 0.40 0.59 0.84 0.67 0.40 0.25 0.36 0.66 0.20 0.50 Comfort 0.22 0.20 0.59 0.40 0.55 0.60 0.70 0.73 0.64 0.20 0.51 StDev 0.05 0.09 0.17 0.26 0.16 0.19 0.24 0.18 0.11 Product Index (Mean) 0.23 0.30 0.45 0.47 0.49 0.54 0.60 0.62 0.73 0.16 0.49
15
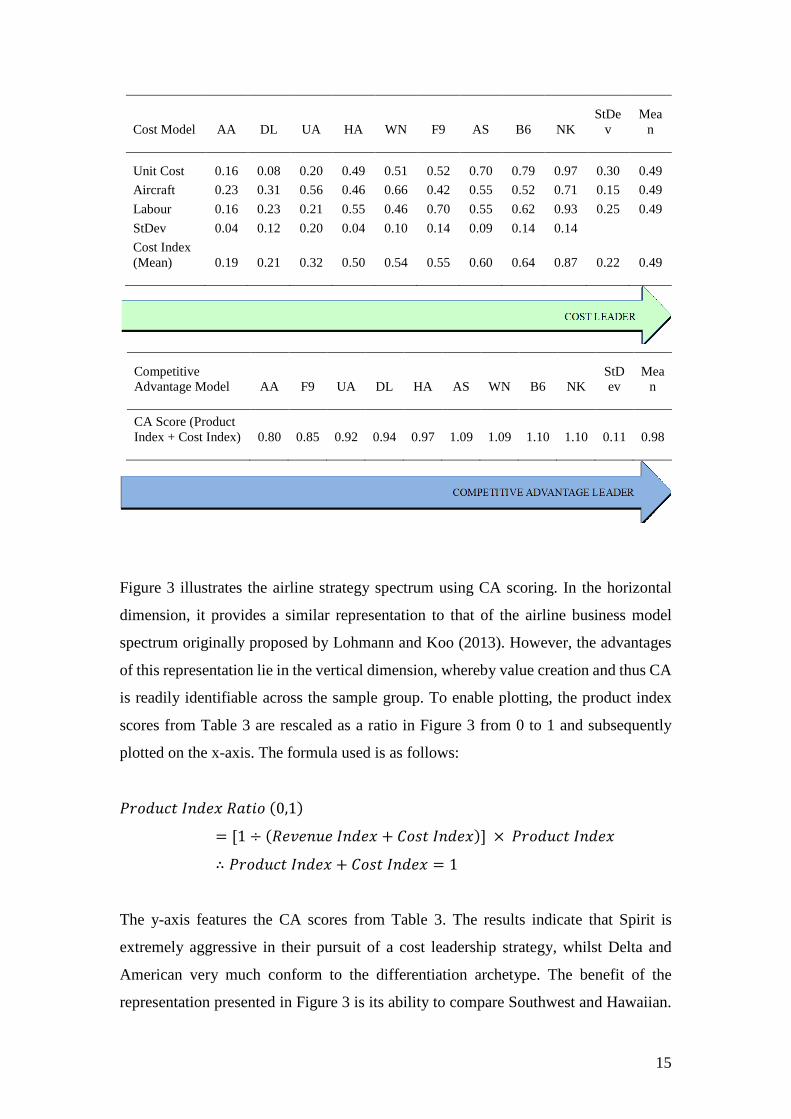
Cost Model AA DL UA HA WN F9 AS B6 NK StDe
v Mea
n Unit Cost 0.16 0.08 0.20 0.49 0.51 0.52 0.70 0.79 0.97 0.30 0.49 Aircraft 0.23 0.31 0.56 0.46 0.66 0.42 0.55 0.52 0.71 0.15 0.49 Labour 0.16 0.23 0.21 0.55 0.46 0.70 0.55 0.62 0.93 0.25 0.49 StDev 0.04 0.12 0.20 0.04 0.10 0.14 0.09 0.14 0.14 Cost Index (Mean) 0.19 0.21 0.32 0.50 0.54 0.55 0.60 0.64 0.87 0.22 0.49
Competitive Advantage Model AA F9 UA DL HA AS WN B6 NK
StDev
Mean
CA Score (Product Index + Cost Index) 0.80 0.85 0.92 0.94 0.97 1.09 1.09 1.10 1.10 0.11 0.98
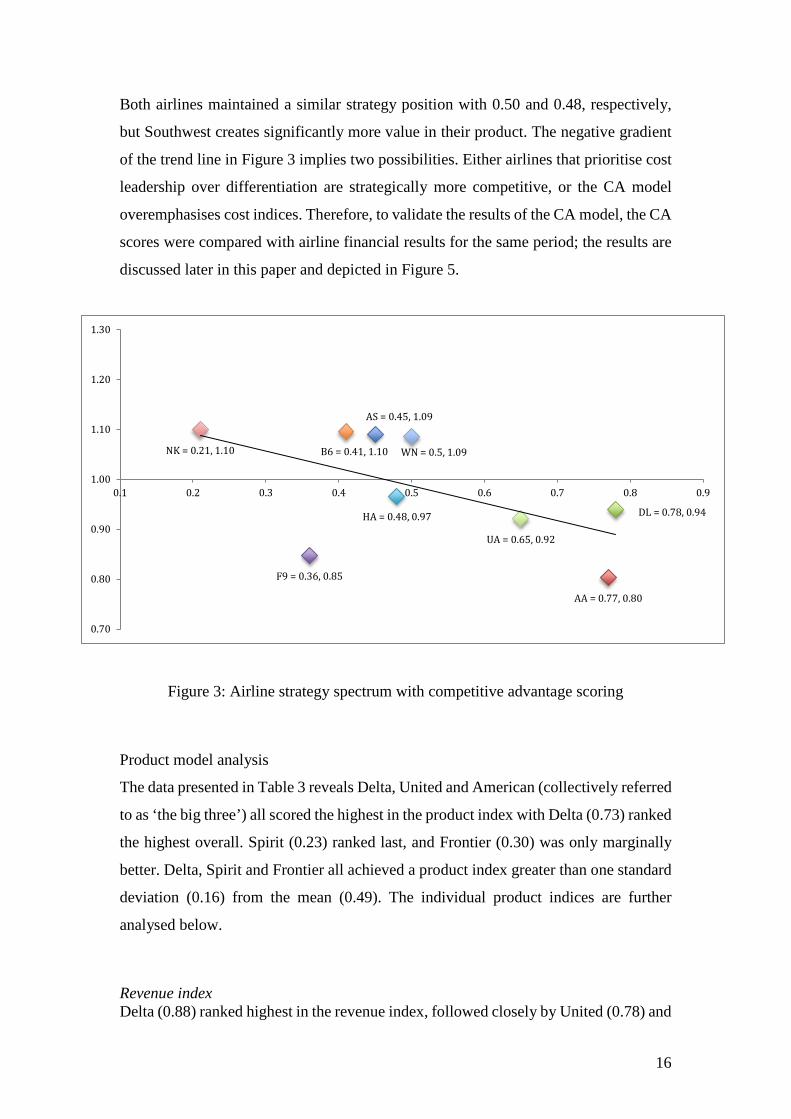
Figure 3 illustrates the airline strategy spectrum using CA scoring. In the horizontal
dimension, it provides a similar representation to that of the airline business model
spectrum originally proposed by Lohmann and Koo (2013). However, the advantages
of this representation lie in the vertical dimension, whereby value creation and thus CA
is readily identifiable across the sample group. To enable plotting, the product index
scores from Table 3 are rescaled as a ratio in Figure 3 from 0 to 1 and subsequently
plotted on the x-axis. The formula used is as follows:
𝑅𝑅𝑜𝑜𝑜𝑜𝑦𝑦𝑟𝑟𝑠𝑠𝑜𝑜 𝐼𝐼𝑖𝑖𝑦𝑦𝑦𝑦𝑖𝑖 𝑅𝑅𝑜𝑜𝑜𝑜𝑦𝑦𝑜𝑜 (0,1)
= [1 ÷ (𝑅𝑅𝑦𝑦𝑟𝑟𝑦𝑦𝑖𝑖𝑟𝑟𝑦𝑦 𝐼𝐼𝑖𝑖𝑦𝑦𝑦𝑦𝑖𝑖 + 𝐶𝐶𝑜𝑜𝑠𝑠𝑜𝑜 𝐼𝐼𝑖𝑖𝑦𝑦𝑦𝑦𝑖𝑖)] × 𝑅𝑅𝑜𝑜𝑜𝑜𝑦𝑦𝑟𝑟𝑠𝑠𝑜𝑜 𝐼𝐼𝑖𝑖𝑦𝑦𝑦𝑦𝑖𝑖
∴ 𝑅𝑅𝑜𝑜𝑜𝑜𝑦𝑦𝑟𝑟𝑠𝑠𝑜𝑜 𝐼𝐼𝑖𝑖𝑦𝑦𝑦𝑦𝑖𝑖 + 𝐶𝐶𝑜𝑜𝑠𝑠𝑜𝑜 𝐼𝐼𝑖𝑖𝑦𝑦𝑦𝑦𝑖𝑖 = 1
The y-axis features the CA scores from Table 3. The results indicate that Spirit is
extremely aggressive in their pursuit of a cost leadership strategy, whilst Delta and
American very much conform to the differentiation archetype. The benefit of the
representation presented in Figure 3 is its ability to compare Southwest and Hawaiian.
16
Both airlines maintained a similar strategy position with 0.50 and 0.48, respectively,
but Southwest creates significantly more value in their product. The negative gradient
of the trend line in Figure 3 implies two possibilities. Either airlines that prioritise cost
leadership over differentiation are strategically more competitive, or the CA model
overemphasises cost indices. Therefore, to validate the results of the CA model, the CA
scores were compared with airline financial results for the same period; the results are
discussed later in this paper and depicted in Figure 5.
Figure 3: Airline strategy spectrum with competitive advantage scoring
Product model analysis
The data presented in Table 3 reveals Delta, United and American (collectively referred
to as ‘the big three’) all scored the highest in the product index with Delta (0.73) ranked
the highest overall. Spirit (0.23) ranked last, and Frontier (0.30) was only marginally
better. Delta, Spirit and Frontier all achieved a product index greater than one standard
deviation (0.16) from the mean (0.49). The individual product indices are further
analysed below.
Revenue index Delta (0.88) ranked highest in the revenue index, followed closely by United (0.78) and
AS = 0.45, 1.09
AA = 0.77, 0.80
DL = 0.78, 0.94
F9 = 0.36, 0.85
HA = 0.48, 0.97
B6 = 0.41, 1.10 WN = 0.5, 1.09NK = 0.21, 1.10
UA = 0.65, 0.92
0.70
0.80
0.90
1.00
1.10
1.20
1.30
0.1 0.2 0.3 0.4 0.5 0.6 0.7 0.8 0.9
17
American (0.75). However, this is to be expected due in large part to Delta’s larger
aircraft and longer stage lengths, resulting in higher revenue per sector and a higher
average fare paid. The distinction between ‘the big three’ came with yield where Delta
achieved 16.35c, followed by Southwest with 15.59c. The lowest score in the revenue
index was Spirit (0.20). While the margin was not considered a variable in the revenue
model, Spirit clearly had the highest margin out of the sample group. Overall, the
revenue index is weighted towards airlines that engage in long-haul operations with
larger aircraft, as a strong positive correlation exists between these types of operations
and both the average fare paid and the operating revenue per sector.
Connectivity index Southwest’s incredibly high network density led them to be ranked highest (0.79) in
the connectivity index. Southwest completed an average of 36.7 daily departures per
airport, more than twice that of second-ranked American with 15.93. Achieving market
share through network density is essential to the Southwest strategy since migrating
from their original LCC proposition. The 2011 connectivity data for Southwest was
omitted due to the lack of consolidated reporting for both Southwest and AirTran
following their May 2011 merger. Spirit (0.19) ranked the lowest in the connectivity
index due to their thin network density and small network. The Spirit network density
(5.8 departures per airport per day) was the second lowest, whilst Frontier (2.8
departures per airport per day) registered the lowest. Given that both airlines compete
on price (ultra-low-cost carrier (ULCC) model), network density is not a critical
strategic component with respect to capturing market share (vis-à-vis Southwest). The
connectivity index is limited to only mainline or parent airlines with their regional
subsidiaries not included. Given the significant regional networks of the big three, they
would expect to rank higher if these data were included.
Convenience index Hawaiian (0.84), which ranked sixth overall for product index, achieved the highest
ranking in the convenience index. The Hawaiian sample is unique when compared to
the continental-based airlines, as Hawaiian enjoys the benefits of operating from less
congested airports in less congested airspace and lacks rigorous winter weather at
Honolulu airport. This is reflected in their superior on-time performance (OTP), which
exceeds 90 % for both arrivals and departures. Alaska Airlines ranked second in OTP,
also due largely to operating in less congested regions. Additionally, due to the smaller
18
population centres in which Hawaiian operates, airports tend to be more proximate to
the central business district or tourism precinct. The average distance for the top five
airports was 4.4 miles; JetBlue was the only other airline with an average distance
below 10 miles (9.87 miles).
Of the remaining three customer service KPIs measured by the DOT, the results were
varied across the sample group. Spirit received an average of 8.03 customer complaints
per 100,000 passengers, more than double of any other airline. Despite their much
publicised ‘bare fare’ product, Spirit still appears to struggle with customer
expectations. JetBlue had the lowest denied boarding rate of less than 0.01 per 10,000
passengers due largely to their no overselling policy. The JetBlue guaranteed seat
policy positively contributes to the convenience index, but risks increased spoilage and
places additional pressure on the airline to increase yields. The average mishandled
baggage rate was 2.72 per 1,000 passengers with a standard deviation of 0.59. United
(3.62) and Southwest (3.48) were the worst performers, possibly due to logistics
congestion at their busy hub airports. JetBlue (2.00) was the best performer in this class.
Comfort index ‘The big three’ achieved the highest comfort indices with American (0.73) ranking the
highest overall. The standout variable for ‘the big three’ was enplaned passengers per
crew. American (3,745 pax per crew) scored greater than one standard deviation from
the mean (5,522 pax per crew), whereas, at the negative end of the spectrum, Hawaiian
(7796 pax per crew) also exceeded one standard deviation. The average load factor
across the sample group was 83.92 % with a standard deviation of 2.47. With a
relatively small standard deviation, no significant conclusions can be drawn. The final
variable in the comfort index was the average economy seat pitch. Due to the challenges
in obtaining a weighted fleet average, the most common aircraft type was chosen with
the data obtained from the websites SeatGuru or SeatExpert. In many cases, the pitch
size varied across the same fleet. Thus, the most common seat pitch was chosen. JetBlue
had the largest economy seat pitch of 33 inches across the sample, whilst ULCCs
Frontier and Spirit both registered the lowest at 28 inches. The lower density
configuration on JetBlue, similar to their no overselling policy, puts additional pressure
on yield. Lastly, the availability of premium classes and their impact on customer
perceived value was not included in the model but could be considered for future
19
iterations.
Cost model analysis
The data in Table 3 show Spirit (0.87) ranked the highest overall in the cost index,
having achieved market leadership in 11 of the 13 individual cost indices; these results
are indicative of the ULCC business model. Furthermore, their index of 0.87 was more
than one standard deviation higher than second-ranked JetBlue (0.64). American (0.18)
ranked the lowest overall, followed by other legacy airlines Delta (0.20) and United
(0.37), as all three airlines are subject to legacy cost structures. The respective cost
indices are further analysed below.
Unit cost index The unit cost index is the only index that considers a single variable. Unlike Pearce and
Smyth (2006), Tsoukalas et al. (2008) and Belobaba et al. (2009) chose to delineate
unit costs in their respective analyses. However, it has been shown that there is no
distinct advantage in delineating the unit cost in the CA model, as the major
components of unit cost are further analysed in the aircraft and labour indices. Spirit,
which pursues an aggressive cost leadership strategy, was the market leader with a unit
cost of 9.97c per ASM. JetBlue (11.48c) ranked second, which is surprising given that
they maintain the lowest density aircraft configuration, placing upward pressure on unit
costs. ‘The big three’ all ranked the lowest for unit costs given their pursuit of a
differentiation strategy compounded by their legacy cost structures.
Aircraft index As initially indicated by their unit cost, Spirit (0.71) ranked the highest in the aircraft
index with American (0.23) ranking the lowest. Spirit maintained the highest aircraft
utilisation at 12.73 hours per day, followed by JetBlue at 11.80 hours. Both strategies
are not without risk, as highly geared aircraft utilisation makes the airline susceptible
to rolling delays across the network. Therefore, as hypothesised, both airlines suffered
the worst OTP for both arrivals and departures. Three airlines, Alaska, Frontier and
Spirit, all maintained 100 % fleet uniformity. ‘The big three’ all ranked the lowest.
Southwest, which traditionally maintained 100 % fleet uniformity, regressed to 88 %
following their acquisition of AirTran. JetBlue, which maintained 69 % fleet uniformity
in 2013, had announced their intention to migrate back towards a uniform fleet of A320
family aircraft to improve efficiency (JetBlue Airways Corporation, 2013). Southwest
maintained the highest level of sectors per day at 5.89, enabled by the shortest average
20
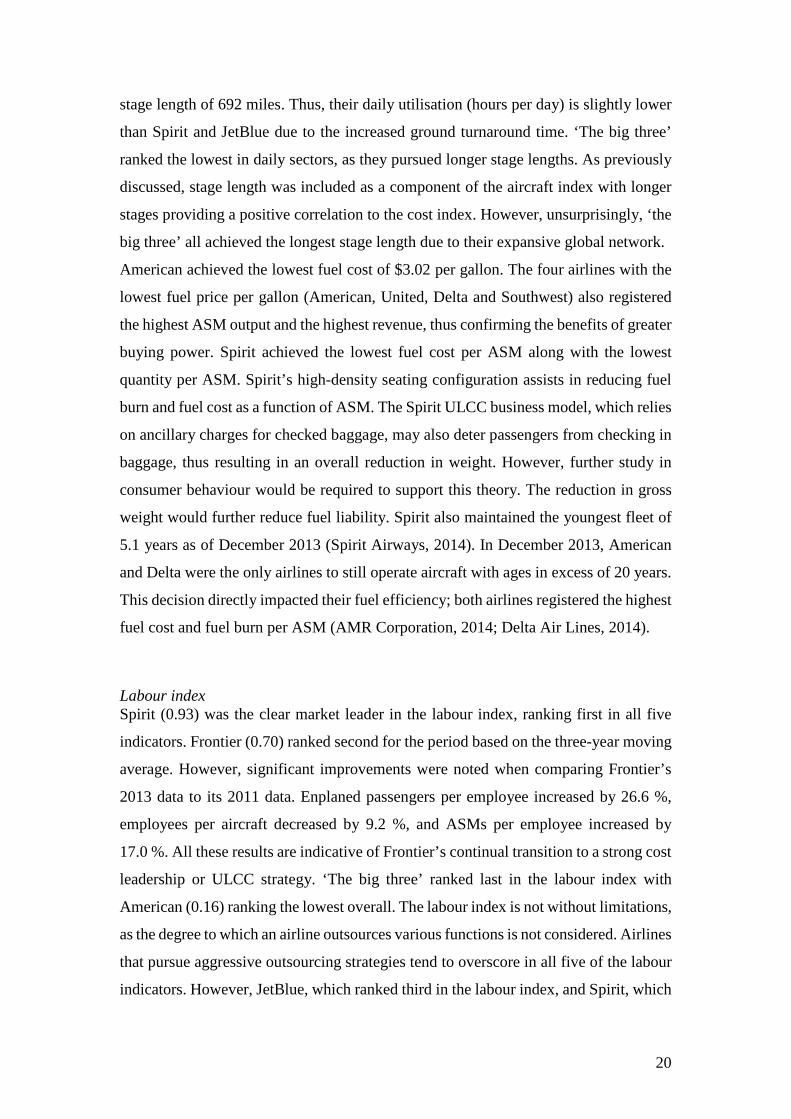
stage length of 692 miles. Thus, their daily utilisation (hours per day) is slightly lower
than Spirit and JetBlue due to the increased ground turnaround time. ‘The big three’
ranked the lowest in daily sectors, as they pursued longer stage lengths. As previously
discussed, stage length was included as a component of the aircraft index with longer
stages providing a positive correlation to the cost index. However, unsurprisingly, ‘the
big three’ all achieved the longest stage length due to their expansive global network.
American achieved the lowest fuel cost of $3.02 per gallon. The four airlines with the
lowest fuel price per gallon (American, United, Delta and Southwest) also registered
the highest ASM output and the highest revenue, thus confirming the benefits of greater
buying power. Spirit achieved the lowest fuel cost per ASM along with the lowest
quantity per ASM. Spirit’s high-density seating configuration assists in reducing fuel
burn and fuel cost as a function of ASM. The Spirit ULCC business model, which relies
on ancillary charges for checked baggage, may also deter passengers from checking in
baggage, thus resulting in an overall reduction in weight. However, further study in
consumer behaviour would be required to support this theory. The reduction in gross
weight would further reduce fuel liability. Spirit also maintained the youngest fleet of
5.1 years as of December 2013 (Spirit Airways, 2014). In December 2013, American
and Delta were the only airlines to still operate aircraft with ages in excess of 20 years.
This decision directly impacted their fuel efficiency; both airlines registered the highest
fuel cost and fuel burn per ASM (AMR Corporation, 2014; Delta Air Lines, 2014).
Labour index Spirit (0.93) was the clear market leader in the labour index, ranking first in all five
indicators. Frontier (0.70) ranked second for the period based on the three-year moving
average. However, significant improvements were noted when comparing Frontier’s
2013 data to its 2011 data. Enplaned passengers per employee increased by 26.6 %,
employees per aircraft decreased by 9.2 %, and ASMs per employee increased by
17.0 %. All these results are indicative of Frontier’s continual transition to a strong cost
leadership or ULCC strategy. ‘The big three’ ranked last in the labour index with
American (0.16) ranking the lowest overall. The labour index is not without limitations,
as the degree to which an airline outsources various functions is not considered. Airlines
that pursue aggressive outsourcing strategies tend to overscore in all five of the labour
indicators. However, JetBlue, which ranked third in the labour index, and Spirit, which
21
ranked first, both registered the highest level of outsourcing for this period with 16.4 %
and 15.8 %, respectively (MIT, 2016).
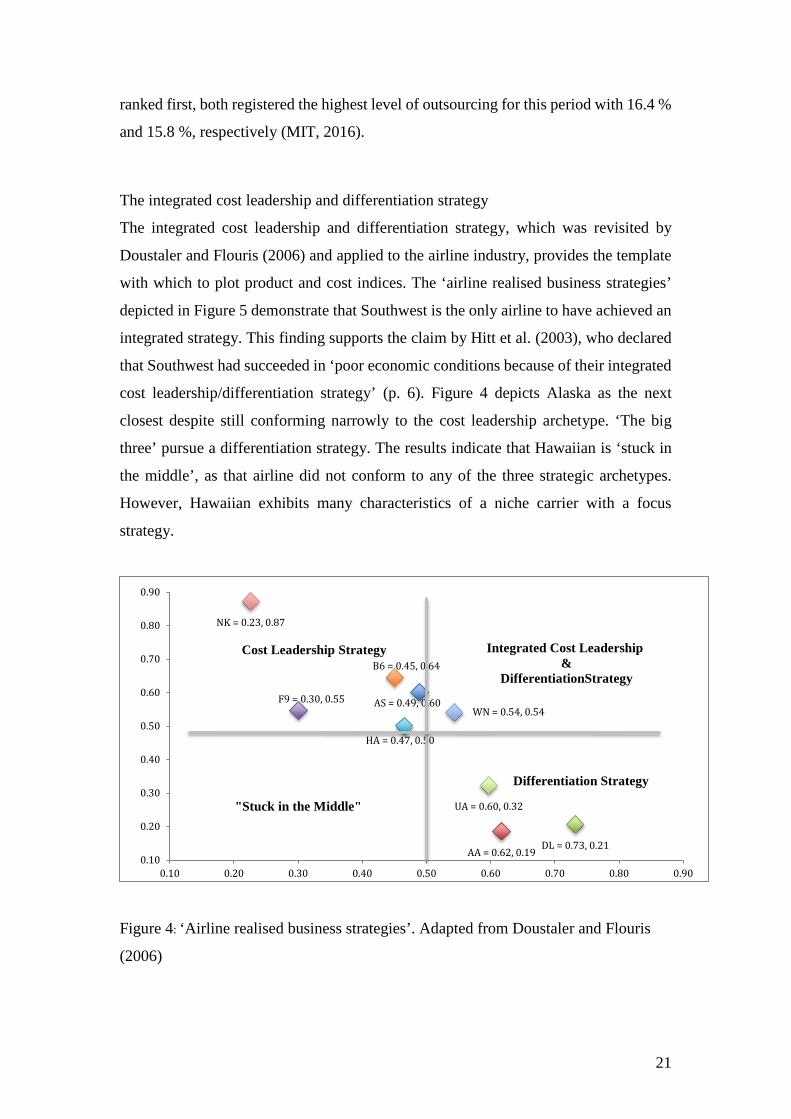
The integrated cost leadership and differentiation strategy
The integrated cost leadership and differentiation strategy, which was revisited by
Doustaler and Flouris (2006) and applied to the airline industry, provides the template
with which to plot product and cost indices. The ‘airline realised business strategies’
depicted in Figure 5 demonstrate that Southwest is the only airline to have achieved an
integrated strategy. This finding supports the claim by Hitt et al. (2003), who declared
that Southwest had succeeded in ‘poor economic conditions because of their integrated
cost leadership/differentiation strategy’ (p. 6). Figure 4 depicts Alaska as the next
closest despite still conforming narrowly to the cost leadership archetype. ‘The big
three’ pursue a differentiation strategy. The results indicate that Hawaiian is ‘stuck in
the middle’, as that airline did not conform to any of the three strategic archetypes.
However, Hawaiian exhibits many characteristics of a niche carrier with a focus
strategy.
Figure 4: ‘Airline realised business strategies’. Adapted from Doustaler and Flouris
(2006)
AS = 0.49, 0.60
AA = 0.62, 0.19 DL = 0.73, 0.21
F9 = 0.30, 0.55
HA = 0.47, 0.50
B6 = 0.45, 0.64
WN = 0.54, 0.54
NK = 0.23, 0.87
UA = 0.60, 0.32
0.10
0.20
0.30
0.40
0.50
0.60
0.70
0.80
0.90
0.10 0.20 0.30 0.40 0.50 0.60 0.70 0.80 0.90
Cost Leadership Strategy Integrated Cost Leadership &
DifferentiationStrategy
"Stuck in the Middle"
Differentiation Strategy
22
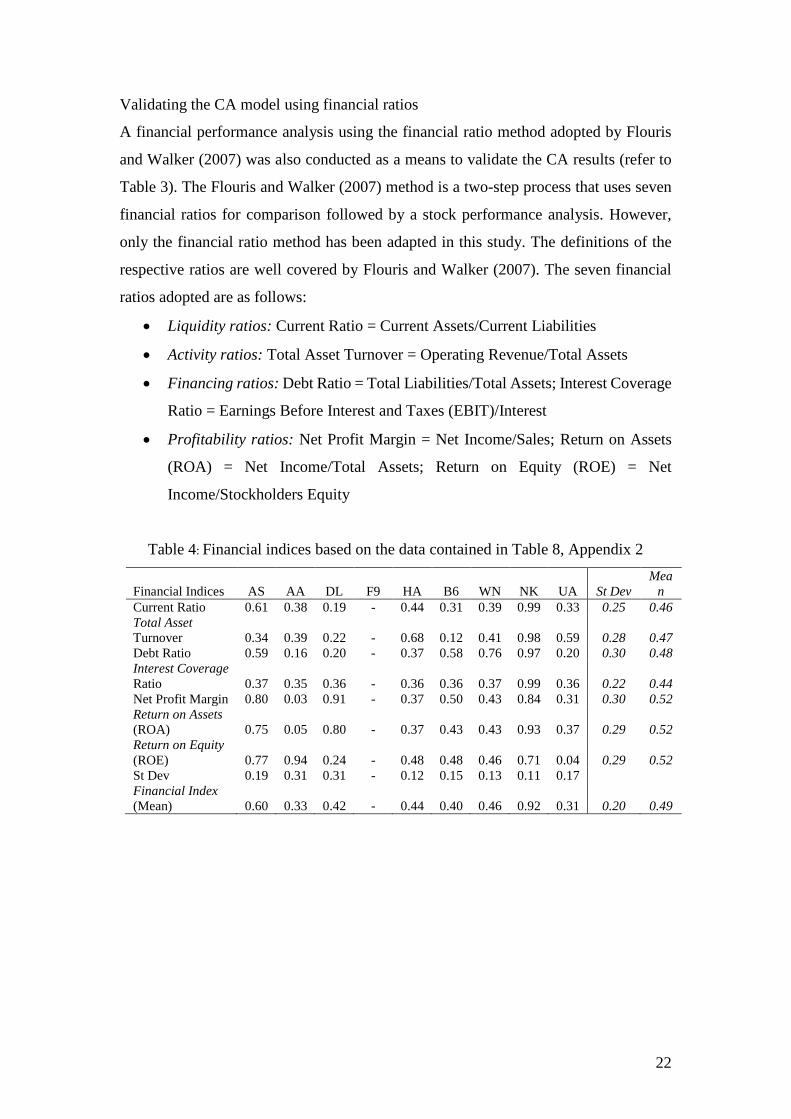
Validating the CA model using financial ratios
A financial performance analysis using the financial ratio method adopted by Flouris
and Walker (2007) was also conducted as a means to validate the CA results (refer to
Table 3). The Flouris and Walker (2007) method is a two-step process that uses seven
financial ratios for comparison followed by a stock performance analysis. However,
only the financial ratio method has been adapted in this study. The definitions of the
respective ratios are well covered by Flouris and Walker (2007). The seven financial
ratios adopted are as follows:
• Liquidity ratios: Current Ratio = Current Assets/Current Liabilities
• Activity ratios: Total Asset Turnover = Operating Revenue/Total Assets
• Financing ratios: Debt Ratio = Total Liabilities/Total Assets; Interest Coverage
Ratio = Earnings Before Interest and Taxes (EBIT)/Interest
• Profitability ratios: Net Profit Margin = Net Income/Sales; Return on Assets
(ROA) = Net Income/Total Assets; Return on Equity (ROE) = Net
Income/Stockholders Equity
Table 4: Financial indices based on the data contained in Table 8, Appendix 2
Financial Indices AS AA DL F9 HA B6 WN NK UA St Dev Mea
n Current Ratio 0.61 0.38 0.19 - 0.44 0.31 0.39 0.99 0.33 0.25 0.46 Total Asset Turnover 0.34 0.39 0.22 - 0.68 0.12 0.41 0.98 0.59 0.28 0.47 Debt Ratio 0.59 0.16 0.20 - 0.37 0.58 0.76 0.97 0.20 0.30 0.48 Interest Coverage Ratio 0.37 0.35 0.36 - 0.36 0.36 0.37 0.99 0.36 0.22 0.44 Net Profit Margin 0.80 0.03 0.91 - 0.37 0.50 0.43 0.84 0.31 0.30 0.52 Return on Assets (ROA) 0.75 0.05 0.80 - 0.37 0.43 0.43 0.93 0.37 0.29 0.52 Return on Equity (ROE) 0.77 0.94 0.24 - 0.48 0.48 0.46 0.71 0.04 0.29 0.52 St Dev 0.19 0.31 0.31 - 0.12 0.15 0.13 0.11 0.17 Financial Index (Mean) 0.60 0.33 0.42 - 0.44 0.40 0.46 0.92 0.31 0.20 0.49
23
Financial indices are formulated using the same Z-distribution method applied to the
calculation of the product and cost indices. To enable a comparison between CA scores
and the financial ratios, both sets of data were redistributed using a Z-distribution from
0 to 1. The comparative data shown in Figure 5 demonstrates that a positive correlation
exists between the CA scores and the financial index. The mean of the index difference
is 0.19 with a standard deviation of 0.17. Of the nine airlines, only two airlines had a
difference that exceeded the standard deviation of 0.17. Frontier was not included in
the comparison; as financial data was not available for the period. Southwest and
JetBlue were the exceptions to the model, as they experienced a difference that
exceeded two standard deviations. Overall, the comparative results demonstrate that a
positive correlation exists between the CA model and financial performance, but further
research is required to investigate the case of Southwest and JetBlue. In-depth analyses
of the individual financial ratios are outside of the scope of this paper. However, some
points of note will be highlighted in the individual airline analysis in the following
section.
Individual airline analysis
The individual airline analyses below highlight the salient strengths and weaknesses
of the sample airlines, including any limitations with their respective data.
24
Alaska Airlines (AS) ranked third overall for CA, conforming narrowly to the cost
leadership archetype. Alaska’s primary strength was convenience (0.67), supported by
its strong OTP, which was achieved by operating in less congested airports and airspace.
No significant variance was observed in the Alaska data set across the period,
suggesting that the airline is stable in their strategic position.
American Airlines (AA), which confirms strongly to the differentiation (FSNC)
archetype, ranked last for both CA and cost index due to their legacy cost structures. In
2011, American filed for bankruptcy protection, which enabled cost restructuring.
When comparing the 2013 and 2011 data, improvements of greater than 10 % were
noted for all five labour indicators as a direct result of Chapter 11 restructuring. The
three-year data set excluded US Airways data following the finalisation of their merger
in December 2013; consolidated reporting for American Airlines and US Airways
began the next year. The economic benefits of the merger would be best analysed in a
future iteration of the CA model.
Delta Airlines (DL) was the product leader of the sample group but still failed to achieve
a parity CA score due to their cost index (0.21). No significant changes were noted
between 2013 and 2011, which suggests the airline is mature in their strategy and any
economic benefits stemming from their 2008 merger with Northwest have already been
realised. Delta operates a significantly older fleet, which is not considered a variable
for customer perceived value but is reflected in their increased fuel quantity per ASM
and fuel cost per ASM. As of December 2013, the airline was still operating DC9-50
aircraft with an average age of 34.9 years (Delta Air Lines, 2014). Maintenance, repair
and overhaul (MRO) costs were not considered in the CA model, but a correlation
would exist between MRO costs and aircraft age.
Frontier Airlines (F9) achieved the second lowest CA score, narrowly conforming to a
cost leadership strategy. However, comparisons between 2013 and 2011 show
significant improvements with a reduction in unit cost of 9.4 % and an increase in
labour productivity with enplaned passengers per employee increasing by 26.6 % and
ASMs per employee increasing by 16.0 %. These results reflect Frontier’s transition
towards a ULCC whilst highlighting the limitations of using a three-year moving
average in the CA model. In late 2013, Frontier was acquired by Indigo Partners, an
equity firm with a history of managing ULCC start-ups and transitions. Indigo recently
had investments in Wizz Air, Spirit and Tiger Airways with all these projects
culminating in raising capital through an IPO. A future iteration of the CA model would
25
likely demonstrate that Frontier pursues an aggressive cost leadership strategy, similar
to that of Spirit. Financial comparisons are unavailable for Frontier, as they are a
privately-owned airline with no balance sheets publicly available.
Hawaiian Airlines (HA), which ranked sixth in both product and cost indices, was the
only airline ‘stuck in the middle’, having failed to conform to a strategic archetype.
However, in the context of the sample group, Hawaiian is very much considered a niche
carrier with a focus strategy. The Hawaiian data sample also includes turboprop
regional operations, which tends to skew the results towards higher costs and lower
productivity. All other airline samples excluded regional operations, as the mainline
data available was mutually exclusive to the various regional subsidiaries. As
previously stated, Hawaiian is ranked highest in OTP due to their niche network.
JetBlue Airways (B6) tied for first in CA score and ranked second overall for cost index.
The airline’s strength was in their second-ranked unit cost (11.48c) despite maintaining
a two-class lower density configuration. The airline also pursued an aggressive
outsourcing strategy, ranking the highest for operational outsourcing at 16.4 %. As a
result, the labour index is positively skewed. Additional research is also required with
respect to the differences in Z-scores when comparing JetBlue’s CA results to their
financial performance, as depicted in Figure 5. The current difference is 0.51, but the
standard deviation is only 0.17.
Southwest Airlines (WN) was the only airline identified as achieving an integrated
strategy based on the CA model. Historically, Southwest conformed to the cost
leadership model, but Alamdari and Fagan (2005) identified Southwest’s migration
away from the LCC archetype and towards identification as a hybrid archetype. The
results confirm the earlier claims by Hitt et al. (2003), who had identified Southwest as
having a successful integrated cost leadership/differentiation strategy. With regards to
the data set, the 2011 total number of destinations was the only variable omitted due to
individual reporting of Southwest and AirTran. Their merger was finalised on 2 May
2011, and consolidated financial reporting was available for the remainder of that fiscal
year. However, the route network was not harmonised until 2012 (Southwest Airlines,
2012).
Spirit Airlines (NK) was deemed the cost leader with a mean cost index of 0.87. Spirit
achieved market leadership in 11 of the 13 individual cost indices. These results are
indicative of the Spirit ULCC model, which relies significantly on high aircraft
utilisation, high-density aircraft configuration and high employee productivity.
26
Furthermore, their aggressive pursuit of a cost leadership strategy is also reflected in
their product index of 0.23, which was the lowest overall. Spirit maintained the
strongest financial position for the period due largely to their 2011 capital raising IPO.
Spirit reported 15.77 % operational outsourcing for the data period, the second highest
of the data set behind JetBlue (MIT, 2016). Spirit relies heavily on labour outsourcing
as a cost reduction strategy. However, outsourcing ratios are not integrated into the CA
model. Thus, labour indices may over score, resulting in skewed data.
United Airlines (UA) achieved the best cost index of ‘the big three’. However, short-
term comparisons between 2013 and 2011 show that despite the anticipated economies
of scale and scope following its 2010 merger with Continental, unit costs have increased
by 8.8 % and labour indicators have also weakened. Yield improvement was only
marginal at 1.9 %. Post-merger consolidated financial reporting commenced for the
fiscal year 2011. However, given that Continental maintained their operating certificate
for that period, some statistics were reported to the DOT individually. In the case of
individual reporting, both airlines’ data was retrospectively consolidated with
weightings applied based on their respective contribution to the total ASM output.
Destination data was the only item that could not be identified due to the overlap in
networks in 2011.
Conclusion
Overall, the CA model identified a trend towards airlines with lower cost structures
maintaining a greater level of CA within the market sample. As presented, ULCC Spirit
was the CA leader, whilst FSNC American was considered the least competitive.
However, Frontier, which also conformed strongly to the LCC archetype, achieved the
second lowest CA score overall, reconfirming that the creation of value in the product
offer is mutually exclusive to the strategic proposition of the airline. Finally, the results
demonstrated that based on the three-year snapshot of data, Southwest was the only
airline successfully conforming to the proposed integrated strategy. The results,
although important, are consistent with earlier work and as such, serve only to validate
the effectiveness of the methodology developed in this study.
The aim of this paper was to develop an instrument by which CA could be quantified
and thus compared amongst airlines with heterogeneous business models. The POA
method by Mason and Morrison (2008) was chosen as the foundation of the CA model.
27
The CA model demonstrated that competitive heterogeneity exists amongst the sample
group of US airlines. Similar to the Lohmann and Koo (2013) method, the model also
presents the sample group along a continuum of strategic propositions. However, the
advantage of this application is that the results are two dimensional, presenting not only
the strategic proposition but also the value created by each airline. The two-dimensional
presentation of the CA model further enables the identification of airlines that are
successful in pursuing an integrated cost leadership/differentiation strategy by applying
the results to the ‘airline realised business strategies’ conceptualised by Doustaler and
Flouris (2006). Despite achieving the aim of developing a methodology, the robustness
of the methodology presented herein still comes into question as it utilises only a three-
year snap shot of data. A future iteration of the CA model would adopt an extended
timeframe, enabling time series analysis to forecast changes in strategy or financial
position.
The CA model is also limited in that it relies on homogenised financial reporting from
the sample group of airlines; thus, the US airline industry was chosen for the conceptual
study. However, challenges may exist for future applications of this model, particularly
in different markets where homogenised reporting is not available. Qualitative methods,
particularly those employed by Pearson, O’Connell, Pitfield and Ryley (2015) and
Pearson, Pitfield and Ryley (2015), can, therefore, be more effective where financial
data is not available. Furthermore, the variables contained within the model are in no
way exhaustive. Weightings for each of the indices and variables were not considered,
as per the original POA by Mason and Morrison (2008). Additional research would be
required to determine the level of strategic importance placed on each variable before
a suitable weighting could be applied. Outsourcing coefficients were also not included
despite the availability of that data from MIT. The CA model, similar to the POA model
and ‘airline business model spectrum’ developed by Lohmann and Koo (2013), applies
standardised data for comparison, which assumes a level of mutual dependence in the
data set. As highlighted in the analysis, airlines that choose to pursue a focus strategy,
such as Hawaiian, may skew the results when applying a standardised data technique.
Regarding future research, other aspects to be considered include the positive
correlation between the CA model with other key components of market structure
(regional feeders, code-sharing, global alliances and loyalty programmes), as well as
other tangible product offerings. Additional areas of academic study include the
application of game theory, competitive heterogeneity and integrated strategies.

28
29
References
Airbus, 2013. Airbus launches Sharklet retrofit for in-service A320 Family aircraft.
http://www.airbus.com/newsevents/news-events-single/detail/airbus-launches-
sharklet-retrofit-for-in-service-a320-family-aircraft/
Alamdari, F., Fagan, S., 2005. Impact of the adherence to the original low-cost model
on the profitability of low-cost airlines. Transport Reviews, 25(3), 377-392.
doi:10.1080/01441640500038748
AMR Corporation, 2014. 2013 Annual Report. http://phx.corporate-ir.net/4p3a.URL
Belobaba, P., Odoni, A. R., Barnhart, C., 2009. The Global Airline Industry.
Chichester, West Sussex, U.K: Wiley. doi:10.2514/4.867026
Button, K., 2012. Low-cost airlines: A failed business model? Transportation Journal,
51(2), 197-219. doi:10.5325/transportationj.51.2.0197
Button, K., Ison, S., 2008. The economics of low-cost airlines: Introduction. Research
in Transportation Economics, 24(1), 1-4. doi:10.1016/j.retrec.2009.01.008
Daft, J., Albers, S., 2013. A conceptual framework for measuring airline business
model convergence. Journal of Air Transport Management, 28, 47-54.
doi:10.1016/j.jairtraman.2012.12.010
Daft, J., Albers, S., 2015. An empirical analysis of airline business model
convergence. Journal of Air Transport Management, 46, 3-11.
doi:10.1016/j.jairtraman.2015.03.008
Delta Air Lines, 2014. 2013 Annual Report. http://ir.delta.com/
Dostaler, I., Flouris, T., 2006. Stuck in the middle revisited: The case of the airline
industry. Journal of Aviation/Aerospace Education & Research, 15(2), 33-45.
Flouris, F., Walker, T., 2007. Financial comparisons across different business models
in the Canadian airline industry. Journal of Air Transport Management, 12, 25-
52.
Gillen, D., Gados, A., 2008. Airlines within airlines: Assessing the vulnerabilities of
mixing business models. Research on Transportation Economics, 24, 25-35.
doi:10.1016/j.retrec.2009.01.002
Graham, B., Vowles, T. M., 2006. Carriers within carriers: A strategic response to
low‐cost airline competition. Transport Reviews, 26(1), 105-126. doi:
10.1080/01441640500179377
30
Hoskisson, R., Hitt, M.A. and Ireland, R.D., 2003. Administración
estratégica. Internacional Thompson.
Holloway, S., 2008. Straight and Level – Practical Airline Economics. Surrey,
England: Ashgate Publishing Limited.
Index Mundi, 2017. Jet Fuel Prices. http://www.indexmundi.com/
Jarach, D., Zerbini, F., Miniero, G., 2009. When legacy carriers converge with low-
cost carriers: Exploring the fusion of European airline business models through
a case-based analysis. Journal of Air Transport Management, 15, 287–293.
doi:10.1016/j.jairtraman.2009.01.003
Jean, D. A., Lohmann, G., 2016. Revisiting the airline business model spectrum: The
influence of post global financial crisis and airline mergers in the US (2011 –
2013). Research in Transportation Business and Management, 21, (2016), 76-
83.
JetBlue Airways Corporation, 2013. 2012 Annual Report. http://investor.jetblue.com/
JetBlue Airways Corporation, 2014. 2013 Annual Report. http://investor.jetblue.com/
Karwowski, M., 2016. The risk in using financial reports in the study of airline
business models. Journal of Air Transport Management, 55, 185-192.
doi:10.1016/j.jairtraman.2016.05.009
Lohmann, G., Koo, T., 2013. The airline business model spectrum. Journal of Air
Transport Management, 31, 7-,9. doi:10.1016/j.jairtraman.2012.10.005
Mason, K. J., Morrison, W. G., 2008. Towards a means of consistently comparing
airline business models with an application to the ‘low cost’ airline sector.
Research in Transportation Economics, 24(1), 75-84.
doi:10.1016/j.retrec.2009.01.006
MIT, 2016. Airline Data Project. http://web.mit.edu/airlinedata/www/default.html
O'Connell, J.F., 2007. The Strategic Response of Full Service Airlines to the Low
Cost Carrier: Threat and the Perception of Passengers to Each Type of Carrier
(PhD thesis). Cranfield University.
Pearce, B., Smyth, M., 2006. Airline Cost Performance.
http://www.iata.org/whatwedo/documents/economics/airline_cost_performance.
Pearson, J., Merkert, R., 2000. Airlines-within-airlines: A business model moving
East. Journal of Air Transport Management, 38, (2014) 21-26.
31
Pearson, J., O’Connell, J., F., Pitfield, D., Ryley, T., 2015. The strategic capability of
Asian network airlines to compete with low-cost carriers. Journal of Air
Transport Management, 47, (2015) 1-10.
Pearson, J., Pitfield, D., Ryley, T., 2015. Intangible resources of competitive
advantage: Analysis of 49 Asian airlines across three business models. Journal
of Air Transport Management, 47, (2015) 179-189.
Porter, M. E., 1985. Competitive advantage: Creating and sustaining superior
performance. New York & London: Free Press.
Southwest Airlines, 2012. 2011 Annual Report. http://investors.southwest.com/
Spirit Airlines, 2014. 2013 Annual Report. http://ir.spirit.com/
Tsoukalas, G., Belobaba, P., Swelbar, W., 2008. Cost convergence in the US airline
industry: An analysis of unit costs 1995–2006. Journal of Air Transport
Management, 14(4), 179-187. doi:10.1016/j.jairtraman.2008.04.005
Whyte, R., Lohmann, G., 2015. The carrier-within-a-carrier strategy: An analysis of
Jetstar. Journal of Air Transport Management, 42, pp.141-148.
Whyte, R., Lohmann, G., 2017. Airline business models (Chapter 7). In: Budd, L. &
Ison, S. (eds.). Air Transport Management: An international perspective. Oxon
& New York: Routledge, 107-120.