Embed Size (px)
Citation preview
CAPABILITIES AND COMPETITIVE ADVANTAGE IN THE FOREST INDUSTRY
Edited by
JUHA-ANTTI LAMBERG
Aalto University School of Science and Technology
MIRVA PELTONIEMI
Aalto University School of Science and Technology
AALTO UNIVERSITY SCHOOL OF SCIENCE AND TECHNOLOGY
FACULTY OF INFORMATION AND NATURAL SCIENCES
DEPARTMENT OF INDUSTRIAL ENGINEERING AND MANAGEMENT
1
FOREWORD
The research reported in this publication was conducted in "Capabilities and competitive
advantage in the forest industry" project funded by ForestCluster Ltd and Finnish Funding
Agency for Technology and Innovation (Tekes). The project was a part of Radical Market
Innovations Program managed by ForestCluster Ltd. The research was undertaken between
June 2009 and May 2010.
We thank Kaija Pehu-Lehtonen (MetsäBotnia), Esa Torniainen (VTT), and Suvi Nenonen
(Vectia) for their insightful comments and professionalism during the research process.
Moreover, we gratefully acknowledge support received from Rector Matti Pursula (TKK),
Christine Hagström-Näsi (ForestCluster Ltd), Lars Gädda (ForestCluster Ltd), and Markku
Leskelä prior, during, and after the project. Finally, the research work benefited from active
communications with dozens of forest industry specialists. We have an impossible mission to
credit each of them individually. Yet, their willingness to help hugely benefited our research
efforts.
Editors
2
LIST OF CONTRIBUTORS
ARNE KÖHLER, M.Sc. (Tech.), is Researcher at Aalto University School of Science and
Technology, at Institute of Strategy. He recently graduated from Department of Industrial
Engineering and Management, majoring in strategy and international business while attaining
a minor in applied mathematics. His major academic interests include competitive dynamics
and organizational ecology.
B.Sc. (Tech.) OLA LAAKSONEN studies towards a Master of Science in Technology degree at
Aalto University School of Science and Technology. He is interested in the dynamics of the
forest industry, social network analysis and institutional theory.
DR. JUHA-ANTTI LAMBERG is Professor of Strategic Management at Aalto University School
of Science and Technology. His research interests include continuity and change in strategy;
especially in the contexts of retail industry and paper industry. He has published articles in, for
example, Strategic Management Journal, Industrial and Corporate Change, Journal of
Management Studies, and Organization Studies. Prof. Lamberg won the Carolyn Dexter Award
for best international paper in the 2009 Academy of Management conference and the Sloan
Foundation’s Industry Studies Best Paper Prize in the 2008 Academy of Management
conference.
M.Sc. (Tech.) JAAKKO LINNAKANGAS is a graduate from the Department of Industrial
Engineering and Management, Aalto University School of Science and Technology. He majored
in strategic management with computer sciences as his minor. His main interests are related to
technology management and strategic marketing.
DR. MIRVA PELTONIEMI works as Postdoctoral Researcher at Institute of Strategy, Aalto
University School of Science and Technology. She has Doctor of Science in Technology degree
from Tampere University of Technology. Her thesis research focused on the evolution of the
games industry. Currently she works on industry evolution in several empirical settings,
including games, retail and forest industries.
3
M.Sc. (Business) ANTTI SIHVONEN works as Researcher at Department of Marketing and
Management, Aalto University School of Economics. His research interests include strategic
marketing, dynamic capabilities and resource-based competition. He is associated with
StratMark and GloStra research groups.
M.Sc. (Business) ULRIIKKA TIKKANEN is a graduate form Turku School of Economics.
Currently she works at Institute of Strategy, Aalto University School of Science and
Technology. She is interested in knowledge management, innovation dynamics and
stakeholder theory.
4
CONTENTS
FOREWORD 1
LIST OF CONTRIBUTORS 2
CONTENTS 4
CHAPTER 1
EXECUTIVE SUMMARY 6
JUHA-ANTTI LAMBERG AND MIRVA PELTONIEMI
CHAPTER 2
INTRODUCTION 12
MIRVA PELTONIEMI AND ARNE KÖHLER
CHAPTER 3
THE STRUCTURE AND EVOLUTION OF CAPABILITIES RESEARCH IN 1986–2009: A BIBLIOMETRIC STUDY 25
OLA LAAKSONEN
CHAPTER 4
OPERATIONALIZATION OF CAPABILITIES: A REVIEW 67
MIRVA PELTONIEMI, OLA LAAKSONEN AND ULRIIKKA TIKKANEN
5
CHAPTER 5
CAPABILITY EVOLUTION IN THE FINNISH FOREST CLUSTER: A QUALITATIVE APPROACH 81
ULRIIKKA TIKKANEN
CHAPTER 6
EVOLUTION OF CAPABILITIES IN THE FINNISH FOREST INDUSTRY: A QUANTITATIVE APPROACH 135
JAAKKO LINNAKANGAS
CHAPTER 7
DYNAMIC CAPABILITIES OF EXPLOITATION AND EXPLORATION IN COMPETITIVE SETTINGS 208
ARNE KÖHLER
CHAPTER 8
SUCCESS STRATEGIES IN DECLINING INDUSTRIES: A CASE SURVEY 267
ANTTI SIHVONEN
6
CHAPTER 1
CAPABILITIES AND COMPETITIVE ADVANTAGE IN THE FOREST
INDUSTRY: EXECUTIVE SUMMARY
JUHA-ANTTI LAMBERG
Aalto University School of Science and Technology [email protected]
MIRVA PELTONIEMI
Aalto University School of Science and Technology [email protected]
Capabilities are those knowledge, skills, and competencies that allow firms to operate in the
market place. What makes capabilities a challenge is the fact that they materialize only in
realized actions (patents, investments, sold products etc.). Otherwise, they are embedded in
processes, and routine-like interactions. From this vantage point, our research project focused
on the following questions:
1. What capabilities does the Forest Cluster possess?
2. What are the strengths and weaknesses compared to international competitors?
3. How and why capabilities interact with cluster evolution?
4. How capabilities enable (and hinder) innovation and renewal?
Regarding the first research question, the Finnish Forest Cluster demonstrates strong
knowledge and skills in all areas of pulp and paper industry. Equally, as a result of decades’ long
7
experience in international business firms posses deep managerial knowledge and routines
related to supply chain management on a global scale. However, when we compare Finnish
firms to other industries or even to other firms in the same industry yet from a different
geographic area, we may witness alarming narrowness in the expressed set of capabilities.
Regarding the second research question, the comparative analysis reported in this book,
supported by earlier similar studies, shows that the Finnish / Scandinavian cluster is clearly the
most viable actor in the global paper industry. A worrying example, however, is the rapid
erosion of the North American cluster which culminated in the demise of Beloit in the late
1990s. At the moment, Scandinavian cluster is still the dynamic ‘engine’ of the whole industry
being forerunner in new product launches, innovative activities, and a vivid network of a
variety of organizations. Relative to the North American story, heterogeneity of organizations
and activities can be seen as trademarks of healthy development for the cluster as an entity.
However, as a variety of existing cluster evolution studies exhibits: competitive advantage at
cluster level is extremely vulnerable when firms turn from development mode to low-cost
strategy.
Regarding the third research question, our theoretical work in conjunction with the results
from our international comparative work, demonstrate that variation in capability portfolio is a
necessary antecedent of successful cluster evolution. However, it is both conceptually, and
from the point of view of cluster policy, problematic to derive cluster level ‘capability portfolio’
from the capabilities identified in the firm level studies. That is, firm-specific capabilities do not
necessarily contribute to cluster level vitality. Vice versa, cluster level capabilities may not
contribute to firm level competitive success. Logically, the link exist yet (a) it does not neatly
materialize as empirical observations (the idea in capabilities really is that they are causally
ambiguous); and (b) the interests of different actors may collide (and often do) in ways that
prevent the use of shared knowledge and skills. Building on existing studies in cluster literature
(especially Menzel and Fornahl, 2010), we may reason that the fundamental measure of cluster
level capabilities is the number of employees in the focal object of research. That is, individual
employees (from paper engineers to sales personnel) are the repository of capabilities. The
problem is that all these capabilities are tied to firm level activities, processes, and structures
not easily accessible when the interests of the whole cluster are at stake. This means that
cluster level policy making (strategy in other words) needs to address the links between
existing and new organizations as a way to keep the cluster vital.
8
Regarding the fourth research question, existing capabilities are the stock of innovations,
renewal, and inertia. New capabilities emerge as we write yet capability evolution takes time,
capabilities are always embedded in existing architectures, and are difficult to identify even by
the actors themselves (i.e. it is relatively easy to acquire knowledge about an individual’s
knowledge and skills yet no one literally knows what an organization can do expect focusing on
the realized activities). Thus, any viable strategy for the future must be based on the existing
capabilities simultaneously understanding the dynamics of the market place. The few existing
studies on cluster renewal (especially studies focusing on the rejuvenation of the Ruhr are
metal industry) demonstrate that (a) birth of new firms and organizations is the way to
facilitate cluster renewal as new organizational actors create the new business models which
change the ways business is conducted, and raise the overall level of activity at the cluster level;
and (b) changes in the cluster and firm architectures (i.e. structures and incentives that drive
activities to certain directions) allow the full use of existing capabilities or even awakening of
‘dormant capabilities’. Such architectural innovations, could be, for example, organized
markets for ideas (allowing transactions between organizations that have ideas but no
capabilities with organizations that posses capabilities but no ideas); massive emergence of
spin-off companies; reduction or lowering boundaries between different clusters (e.g. between
SHOKs in the Finnish context); and active creation of inter-organizational projects (‘virtual
firms’) along shared business ideas. Finally, a powerful yet hardly controllable mechanism for
renewal is increasing competition. On global scale, we can already witness how price
competition drives companies to explore new business opportunities. Brought to the Finnish
context, this further underlines the need to have new firms even with interests overlapping
with those of the incumbent organizations.
Our widespread research also resulted in more material based findings which also catalyzed
preliminary problem solving discussion among the research group. These more emergent issues
are listed below.
9
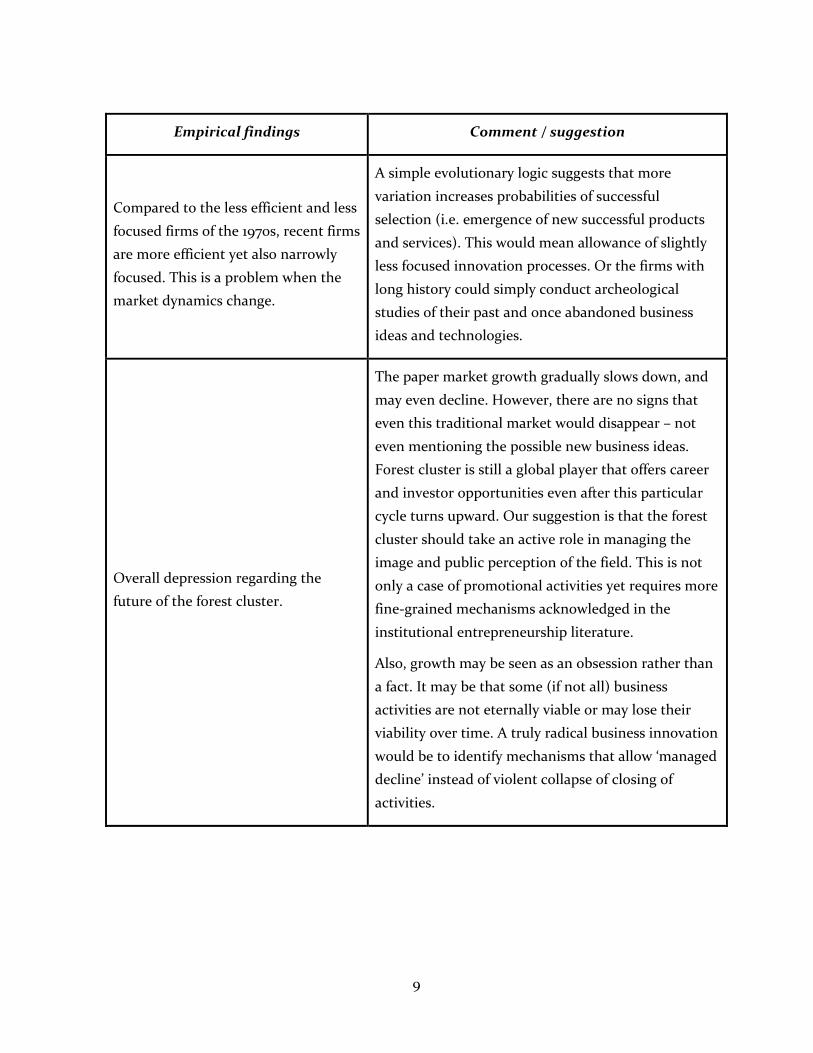
Empirical findings Comment / suggestion
Compared to the less efficient and less
focused firms of the 1970s, recent firms
are more efficient yet also narrowly
focused. This is a problem when the
market dynamics change.
A simple evolutionary logic suggests that more
variation increases probabilities of successful
selection (i.e. emergence of new successful products
and services). This would mean allowance of slightly
less focused innovation processes. Or the firms with
long history could simply conduct archeological
studies of their past and once abandoned business
ideas and technologies.
Overall depression regarding the
future of the forest cluster.
The paper market growth gradually slows down, and
may even decline. However, there are no signs that
even this traditional market would disappear – not
even mentioning the possible new business ideas.
Forest cluster is still a global player that offers career
and investor opportunities even after this particular
cycle turns upward. Our suggestion is that the forest
cluster should take an active role in managing the
image and public perception of the field. This is not
only a case of promotional activities yet requires more
fine-grained mechanisms acknowledged in the
institutional entrepreneurship literature.
Also, growth may be seen as an obsession rather than
a fact. It may be that some (if not all) business
activities are not eternally viable or may lose their
viability over time. A truly radical business innovation
would be to identify mechanisms that allow ‘managed
decline’ instead of violent collapse of closing of
activities.
10
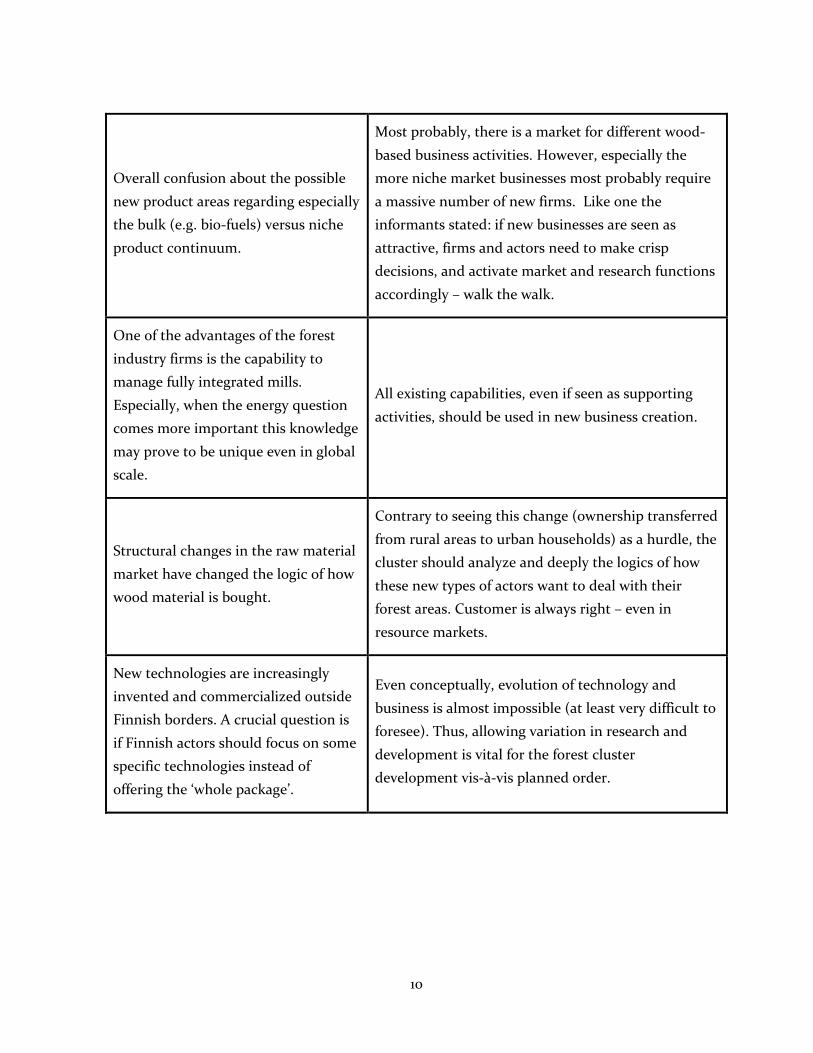
Overall confusion about the possible
new product areas regarding especially
the bulk (e.g. bio-fuels) versus niche
product continuum.
Most probably, there is a market for different wood-
based business activities. However, especially the
more niche market businesses most probably require
a massive number of new firms. Like one the
informants stated: if new businesses are seen as
attractive, firms and actors need to make crisp
decisions, and activate market and research functions
accordingly – walk the walk.
One of the advantages of the forest
industry firms is the capability to
manage fully integrated mills.
Especially, when the energy question
comes more important this knowledge
may prove to be unique even in global
scale.
All existing capabilities, even if seen as supporting
activities, should be used in new business creation.
Structural changes in the raw material
market have changed the logic of how
wood material is bought.
Contrary to seeing this change (ownership transferred
from rural areas to urban households) as a hurdle, the
cluster should analyze and deeply the logics of how
these new types of actors want to deal with their
forest areas. Customer is always right – even in
resource markets.
New technologies are increasingly
invented and commercialized outside
Finnish borders. A crucial question is
if Finnish actors should focus on some
specific technologies instead of
offering the ‘whole package’.
Even conceptually, evolution of technology and
business is almost impossible (at least very difficult to
foresee). Thus, allowing variation in research and
development is vital for the forest cluster
development vis-à-vis planned order.
11
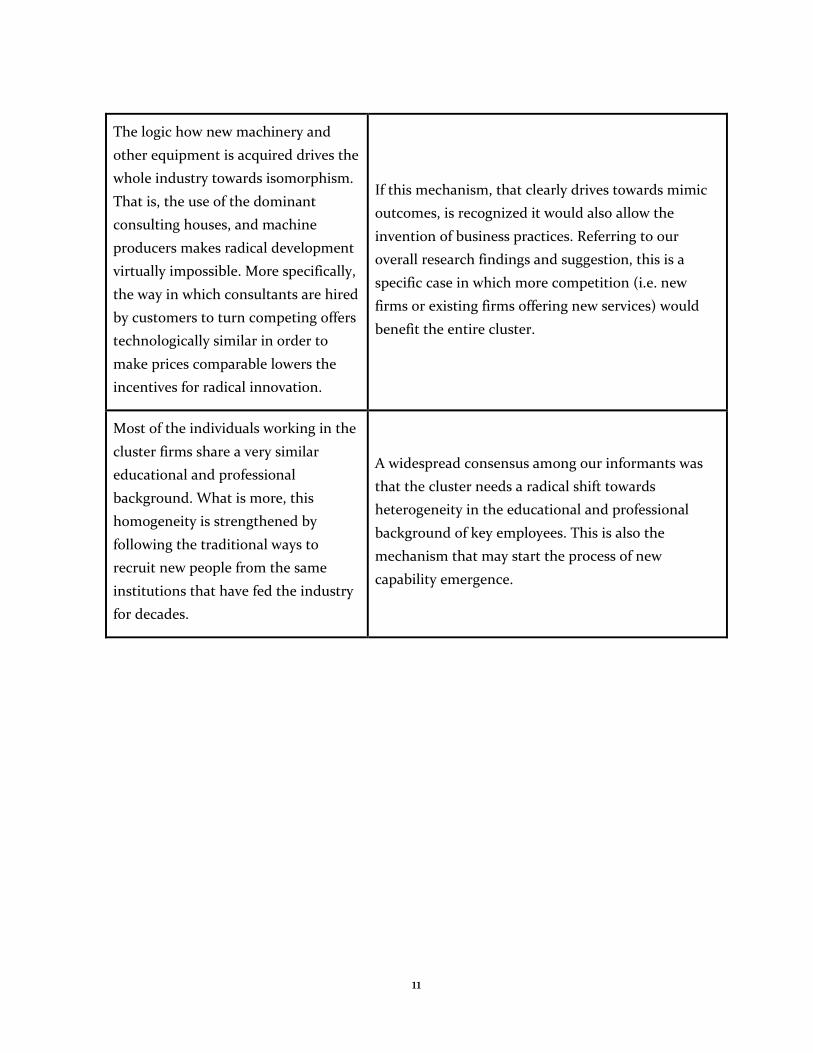
The logic how new machinery and
other equipment is acquired drives the
whole industry towards isomorphism.
That is, the use of the dominant
consulting houses, and machine
producers makes radical development
virtually impossible. More specifically,
the way in which consultants are hired
by customers to turn competing offers
technologically similar in order to
make prices comparable lowers the
incentives for radical innovation.
If this mechanism, that clearly drives towards mimic
outcomes, is recognized it would also allow the
invention of business practices. Referring to our
overall research findings and suggestion, this is a
specific case in which more competition (i.e. new
firms or existing firms offering new services) would
benefit the entire cluster.
Most of the individuals working in the
cluster firms share a very similar
educational and professional
background. What is more, this
homogeneity is strengthened by
following the traditional ways to
recruit new people from the same
institutions that have fed the industry
for decades.
A widespread consensus among our informants was
that the cluster needs a radical shift towards
heterogeneity in the educational and professional
background of key employees. This is also the
mechanism that may start the process of new
capability emergence.
12
CHAPTER 2
INTRODUCTION
MIRVA PELTONIEMI
Aalto University School of Science and Technology [email protected]
ARNE KÖHLER
Aalto University School of Science and Technology [email protected]
1 BACKGROUND AND OBJECTIVES
The main objective of the research reported in the current publication is to assess the
capabilities of the shareholders of ForestCluster Ltd (1) in relation to international competitors
and (2) as enablers of new business models and technological innovations. Here capabilities are
understood as a collection of routines and knowhow that combined enable firms to conduct
their business and to learn new capabilities as environmental change demands.
Capabilities are situated between intension and action, and they enable the firm to produce
intended outcomes (Dosi et al., 2000). Capabilities are higher-level routines that enable the
firm to produce significant outputs of a particular type (Winter, 2003). Whether an
organization has a certain capability is often a matter of degree (Winter, 2000). In literature
capabilities are often divided into technological, organizational and market capabilities, and
most studies aim at finding out the amount of a specific type of capability a particular firm
possesses (see Section 4 in the present publication).
13
Capability is an organization-level concept. Capabilities are built from lower-level routines,
individual skills, technological equipment and other assets that the firm possesses (Dosi et al.,
2000). Dynamic capabilities allow the firm to change in order to address rapidly changing
environments (Teece et al., 1997). This takes place through reconfiguring their resources to
respond to changing markets (Galunic and Eisenhardt, 2001, Brown and Eisenhardt, 1997).
Organizational architecture defines how capabilities and other resources are organized in the
firm (Jacobides, 2006, Galunic and Eisenhardt, 2001). Thus existing capabilities may be
reorganized to achieve a desired change in the firm’s operations. Dynamic capabilities are
learned and stable patterns of collective activity, that are used to continuously improve the
effectiveness of the organization (Zollo and Winter, 2002).
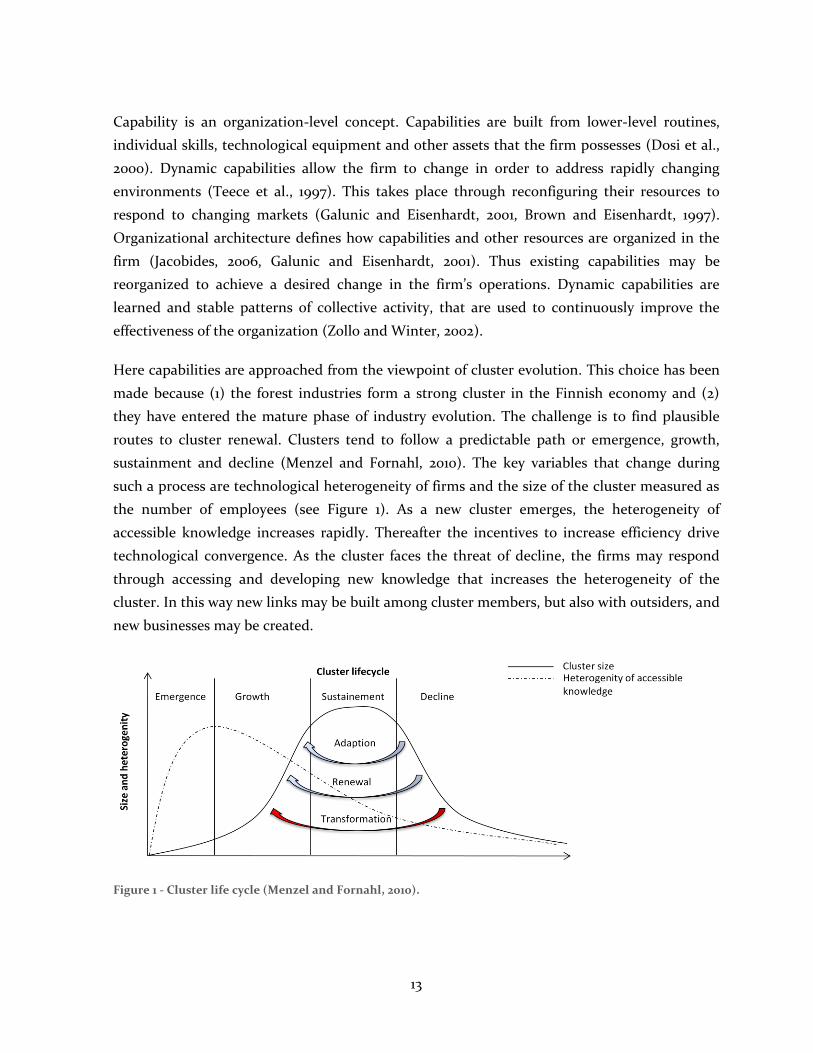
Here capabilities are approached from the viewpoint of cluster evolution. This choice has been
made because (1) the forest industries form a strong cluster in the Finnish economy and (2)
they have entered the mature phase of industry evolution. The challenge is to find plausible
routes to cluster renewal. Clusters tend to follow a predictable path or emergence, growth,
sustainment and decline (Menzel and Fornahl, 2010). The key variables that change during
such a process are technological heterogeneity of firms and the size of the cluster measured as
the number of employees (see Figure 1). As a new cluster emerges, the heterogeneity of
accessible knowledge increases rapidly. Thereafter the incentives to increase efficiency drive
technological convergence. As the cluster faces the threat of decline, the firms may respond
through accessing and developing new knowledge that increases the heterogeneity of the
cluster. In this way new links may be built among cluster members, but also with outsiders, and
new businesses may be created.
Figure 1 - Cluster life cycle (Menzel and Fornahl, 2010).
14
In the research reported here, the main puzzle is to understand how and why capabilities are
related to cluster renewal. Capabilities emerge slowly as a product of history. This means that
competitive advantage must be built on the existing set of capabilities as the development of
new capabilities takes time. Moreover, not having a clear picture of the capabilities that exist is
an important hurdle in finding new paths for capability development. So far capabilities
research has concentrated on the firm level. For example, of the five most highly cited
capabilities studies none go beyond the firm level (Teece et al., 1997, Kogut and Zander, 1992,
Leonard-Barton, 1992, Grant, 1996, Eisenhardt and Martin, 2000). Thus there is both an
academic and a practical need to look at capabilities at the cluster level.
The above reasoning leads us to pose four research questions:
5. What capabilities does the Forest Cluster possess?
6. What are the strengths and weaknesses compared to international competitors?
7. How and why capabilities interact with cluster evolution?
8. How capabilities enable (and hinder) innovation and renewal?
To answer the questions above, we first conduct an international comparison of the capability
accumulation of forest industry firms. This forms a diagnosis that will guide further empirical
work reported in the remainder of the report.
2 DIAGNOSIS – INTERNATIONAL COMPARISON OF CAPABILITY ACCUMULATION IN FOREST INDUSTRIES
Taking a quantitative perspective, capabilities may be best observed in the activities of
organizations. Actions are manifestations of internal organizational capabilities in the external
product-market environment. As Kiesler and Sproull (1982) first contended the capability to
take action always precedes action. Moreover, managers, and hence firms, are more likely to
engage in activities in which they possess some comparative advantage to competitors
(Levinthal and March, 1993, March, 1991). On the other hand, as organizations take action, they
garner experience – constantly moving down a learning curve – and process knowledge that
over time becomes solidified in routines (Nelson and Winter, 1982). The sum of routines, both
tacit and explicit, in turn constitutes what is generally known as organizational capabilities
(Teece et al., 1997). Organizations sequence of prior moves hence reveals organizations
15
competitive strengths and indicate capabilities possessed and gained over the course of the
organizations observed history.
Action data has been sourced using quantitative content analysis methods (Krippendorff, 1980)
of newsfeed data. The newsfeeds relating to the 200 largest paper & pulp industry firms during
1989-2009 was collected. This was done with an automated categorizing process based on
finding key terms in each newsfeed. The resulting codification was of astoundingly high
validity. However, we recognize that the cluster includes firms from a broader range of
industries. Still, the paper and pulp companies remain at the heart of the industry and though
the sample cannot give absolute values for any action it succeeds in presenting a comparative
view – a sufficient method for finding strengths and weaknesses. For a more detailed
description of the content analysis method refer to the methodology section in chapter 7.
Looking at the prior actions of the Finnish forest cluster (here analyzed as a part of a broader
Nordic cluster1) it portrays a vibrant and highly experienced image of the Nordic companies.
This bird’s-eye view suggests that the Finnish forest cluster owns competitive capabilities in
comparison to other regional groupings. Nonetheless, the overview of industry activity fails to
paint the whole picture; in the light of the findings, how and why do certain patterns of
activities emerge? Four interesting aspects rise from analyzing the history of actions taken
across regions in the forest industry during the past two decades. These relate to (1) the
intensity of capability accumulation, (2) innovation capabilities, (3) collaboration capabilities
and (4) restructuring capabilities.
2.1 Intensity of capability accumulation
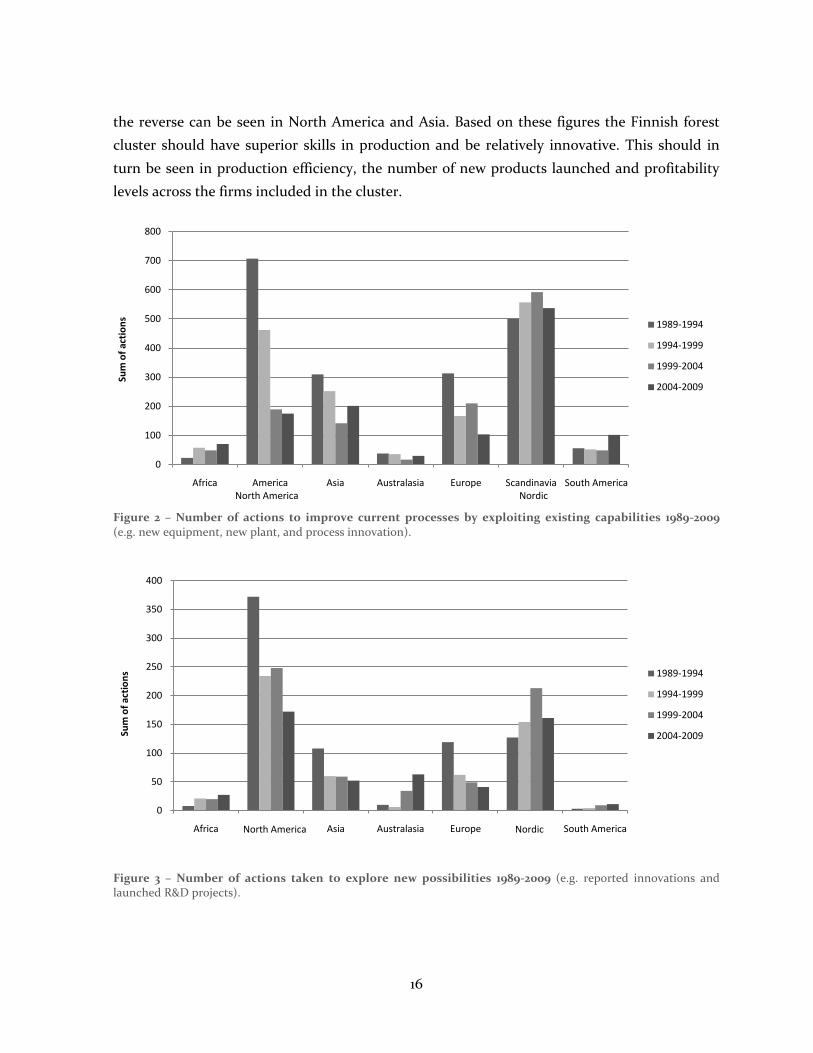
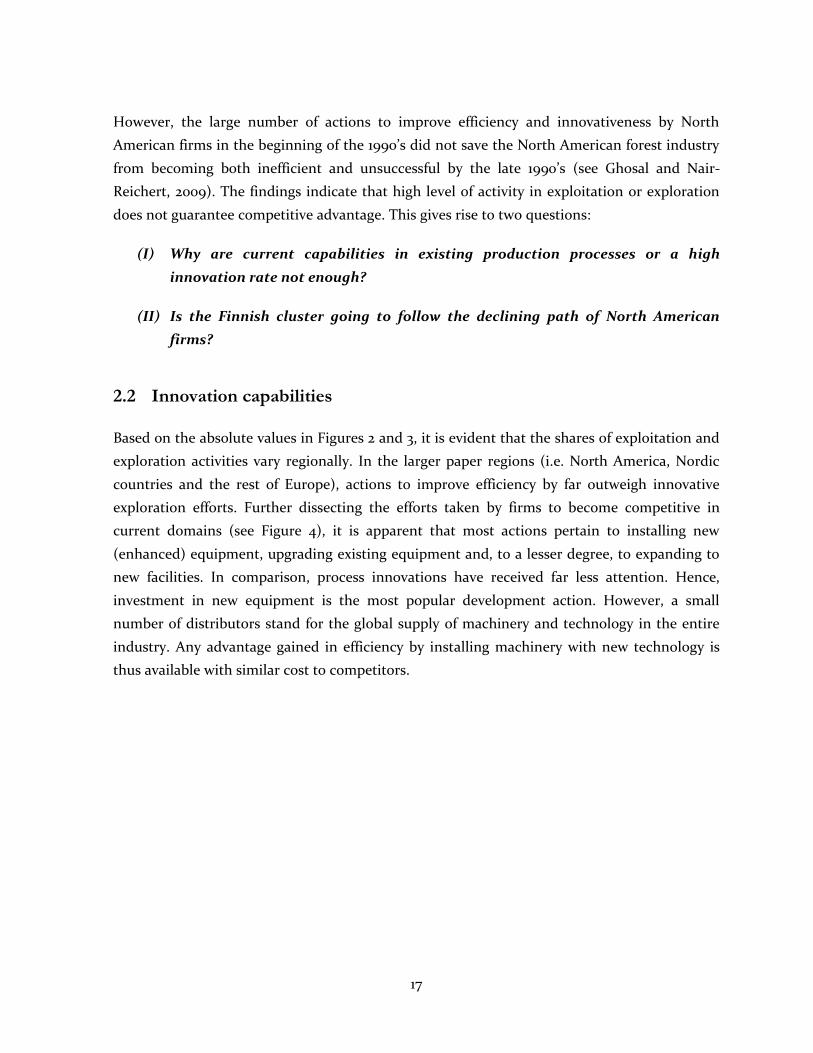
First, analyzing the development actions taken by regional clusters reveals that the Nordic
firms have garnered more experience than firms in other regions. Figure 2 presents the amount
of actions firms have taken in aggregate from 1989 to 2009 focusing on developing the
efficiency of current operations, whereas Figure 3 includes actions that aim at creating value
through innovation. Furthermore, the sum of both exploitation and exploration activity of
Nordic firms has been rising between each five-year period except in 2004-2009. In contrast,
1 The Finnish and Swedish forest clusters are highly interlinked and over the period of study a large part of the firms have merged or acquired across the border of Finland and Sweden. Other Nordic companies are scarce in the sample (n=1). Note, that the sample is constructed in an illustrative manner and contains paper & pulp firms as well as machinery producers, but no other parts of the cluster (e.g. chemicals). Hence, findings are not absolute but provide a basis for comparison.
16
the reverse can be seen in North America and Asia. Based on these figures the Finnish forest
cluster should have superior skills in production and be relatively innovative. This should in
turn be seen in production efficiency, the number of new products launched and profitability
levels across the firms included in the cluster.
Figure 2 – Number of actions to improve current processes by exploiting existing capabilities 1989-2009 (e.g. new equipment, new plant, and process innovation).
Figure 3 – Number of actions taken to explore new possibilities 1989-2009 (e.g. reported innovations and launched R&D projects).
0
100
200
300
400
500
600
700
800
Africa America Asia Australasia Europe Scandinavia South America
Sum
of
acti
on
s
1989-1994
1994-1999
1999-2004
2004-2009
0
50
100
150
200
250
300
350
400
Africa America Asia Australasia Europe Scandinavia South America
Sum
of
acti
on
s 1989-1994
1994-1999
1999-2004
2004-2009
Nordic North America
Nordic North America
17
However, the large number of actions to improve efficiency and innovativeness by North
American firms in the beginning of the 1990’s did not save the North American forest industry
from becoming both inefficient and unsuccessful by the late 1990’s (see Ghosal and Nair-
Reichert, 2009). The findings indicate that high level of activity in exploitation or exploration
does not guarantee competitive advantage. This gives rise to two questions:
(I) Why are current capabilities in existing production processes or a high
innovation rate not enough?
(II) Is the Finnish cluster going to follow the declining path of North American
firms?
2.2 Innovation capabilities
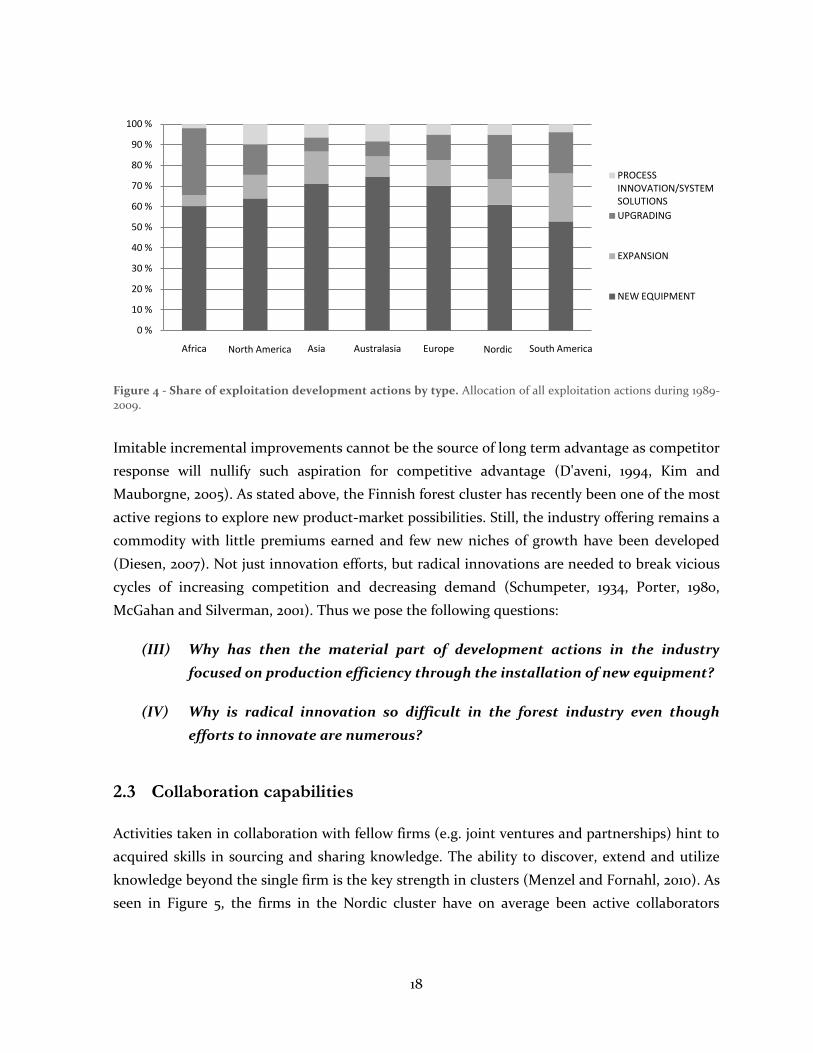
Based on the absolute values in Figures 2 and 3, it is evident that the shares of exploitation and
exploration activities vary regionally. In the larger paper regions (i.e. North America, Nordic
countries and the rest of Europe), actions to improve efficiency by far outweigh innovative
exploration efforts. Further dissecting the efforts taken by firms to become competitive in
current domains (see Figure 4), it is apparent that most actions pertain to installing new
(enhanced) equipment, upgrading existing equipment and, to a lesser degree, to expanding to
new facilities. In comparison, process innovations have received far less attention. Hence,
investment in new equipment is the most popular development action. However, a small
number of distributors stand for the global supply of machinery and technology in the entire
industry. Any advantage gained in efficiency by installing machinery with new technology is
thus available with similar cost to competitors.
18
Figure 4 - Share of exploitation development actions by type. Allocation of all exploitation actions during 1989-2009.
Imitable incremental improvements cannot be the source of long term advantage as competitor
response will nullify such aspiration for competitive advantage (D'aveni, 1994, Kim and
Mauborgne, 2005). As stated above, the Finnish forest cluster has recently been one of the most
active regions to explore new product-market possibilities. Still, the industry offering remains a
commodity with little premiums earned and few new niches of growth have been developed
(Diesen, 2007). Not just innovation efforts, but radical innovations are needed to break vicious
cycles of increasing competition and decreasing demand (Schumpeter, 1934, Porter, 1980,
McGahan and Silverman, 2001). Thus we pose the following questions:
(III) Why has then the material part of development actions in the industry
focused on production efficiency through the installation of new equipment?
(IV) Why is radical innovation so difficult in the forest industry even though
efforts to innovate are numerous?
2.3 Collaboration capabilities
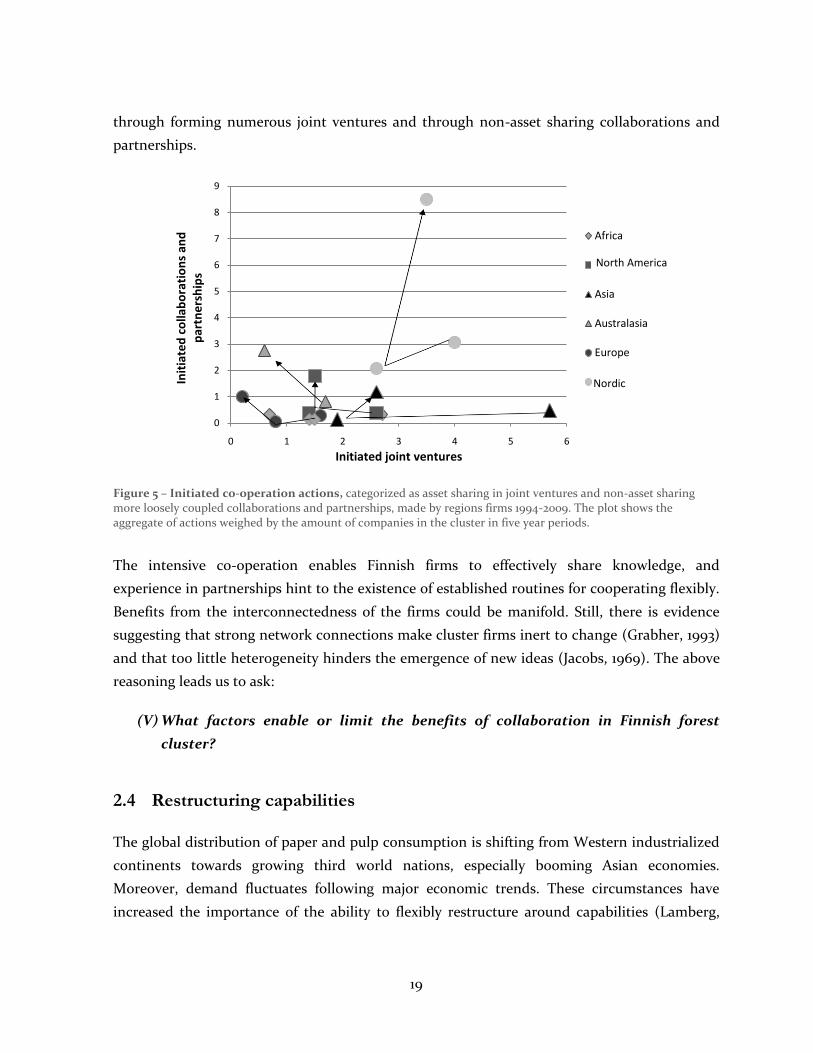
Activities taken in collaboration with fellow firms (e.g. joint ventures and partnerships) hint to
acquired skills in sourcing and sharing knowledge. The ability to discover, extend and utilize
knowledge beyond the single firm is the key strength in clusters (Menzel and Fornahl, 2010). As
seen in Figure 5, the firms in the Nordic cluster have on average been active collaborators
0 %
10 %
20 %
30 %
40 %
50 %
60 %
70 %
80 %
90 %
100 %
Africa America Asia Australasia Europe Scandinavia South America
PROCESS INNOVATION/SYSTEM SOLUTIONS
UPGRADING
EXPANSION
NEW EQUIPMENT
Nordic North America
19
through forming numerous joint ventures and through non-asset sharing collaborations and
partnerships.
Figure 5 – Initiated co-operation actions, categorized as asset sharing in joint ventures and non-asset sharing more loosely coupled collaborations and partnerships, made by regions firms 1994-2009. The plot shows the aggregate of actions weighed by the amount of companies in the cluster in five year periods.
The intensive co-operation enables Finnish firms to effectively share knowledge, and
experience in partnerships hint to the existence of established routines for cooperating flexibly.
Benefits from the interconnectedness of the firms could be manifold. Still, there is evidence
suggesting that strong network connections make cluster firms inert to change (Grabher, 1993)
and that too little heterogeneity hinders the emergence of new ideas (Jacobs, 1969). The above
reasoning leads us to ask:
(V) What factors enable or limit the benefits of collaboration in Finnish forest
cluster?
2.4 Restructuring capabilities
The global distribution of paper and pulp consumption is shifting from Western industrialized
continents towards growing third world nations, especially booming Asian economies.
Moreover, demand fluctuates following major economic trends. These circumstances have
increased the importance of the ability to flexibly restructure around capabilities (Lamberg,
0
1
2
3
4
5
6
7
8
9
0 1 2 3 4 5 6
Init
iate
d c
olla
bo
rati
on
s an
d
par
tne
rsh
ips
Initiated joint ventures
Africa
America
Asia
Australasia
Europe
ScandinaviaNordic
North America
20
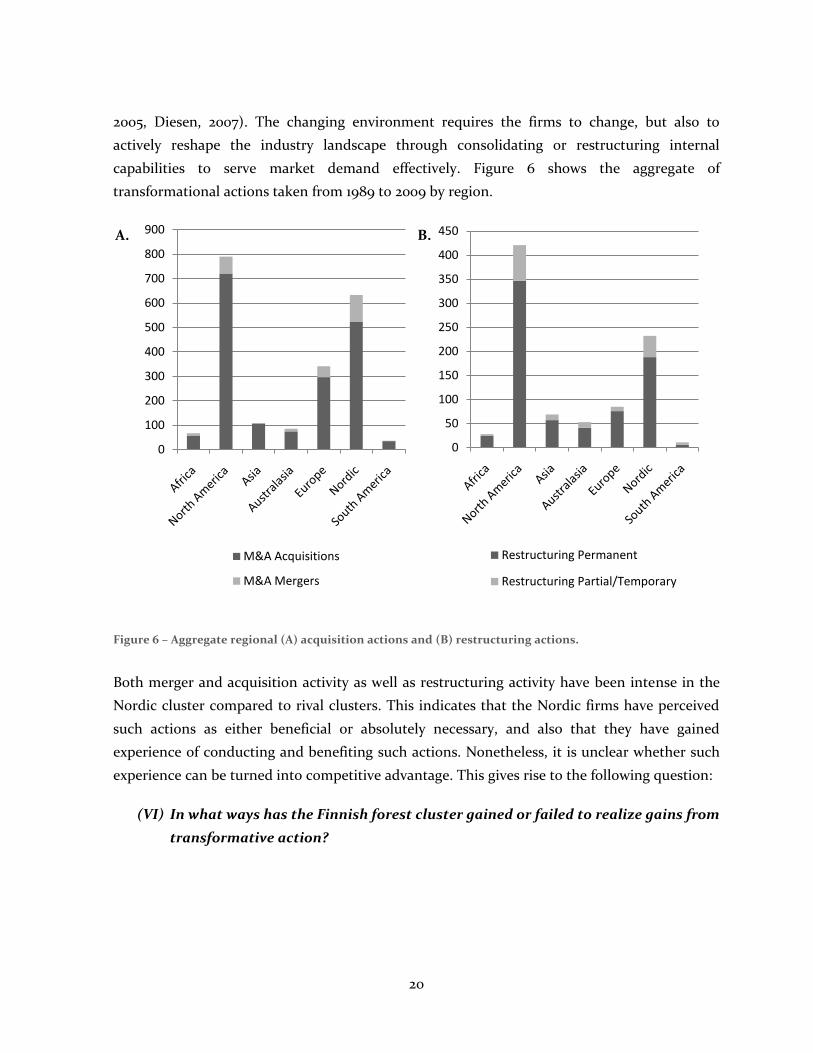
2005, Diesen, 2007). The changing environment requires the firms to change, but also to
actively reshape the industry landscape through consolidating or restructuring internal
capabilities to serve market demand effectively. Figure 6 shows the aggregate of
transformational actions taken from 1989 to 2009 by region.
Figure 6 – Aggregate regional (A) acquisition actions and (B) restructuring actions.
Both merger and acquisition activity as well as restructuring activity have been intense in the
Nordic cluster compared to rival clusters. This indicates that the Nordic firms have perceived
such actions as either beneficial or absolutely necessary, and also that they have gained
experience of conducting and benefiting such actions. Nonetheless, it is unclear whether such
experience can be turned into competitive advantage. This gives rise to the following question:
(VI) In what ways has the Finnish forest cluster gained or failed to realize gains from
transformative action?
0
100
200
300
400
500
600
700
800
900
M&A Acquisitions
M&A Mergers
0
50
100
150
200
250
300
350
400
450
Restructuring Permanent
Restructuring Partial/Temporary
A. B.
21
3 RESEARCH PROCESS
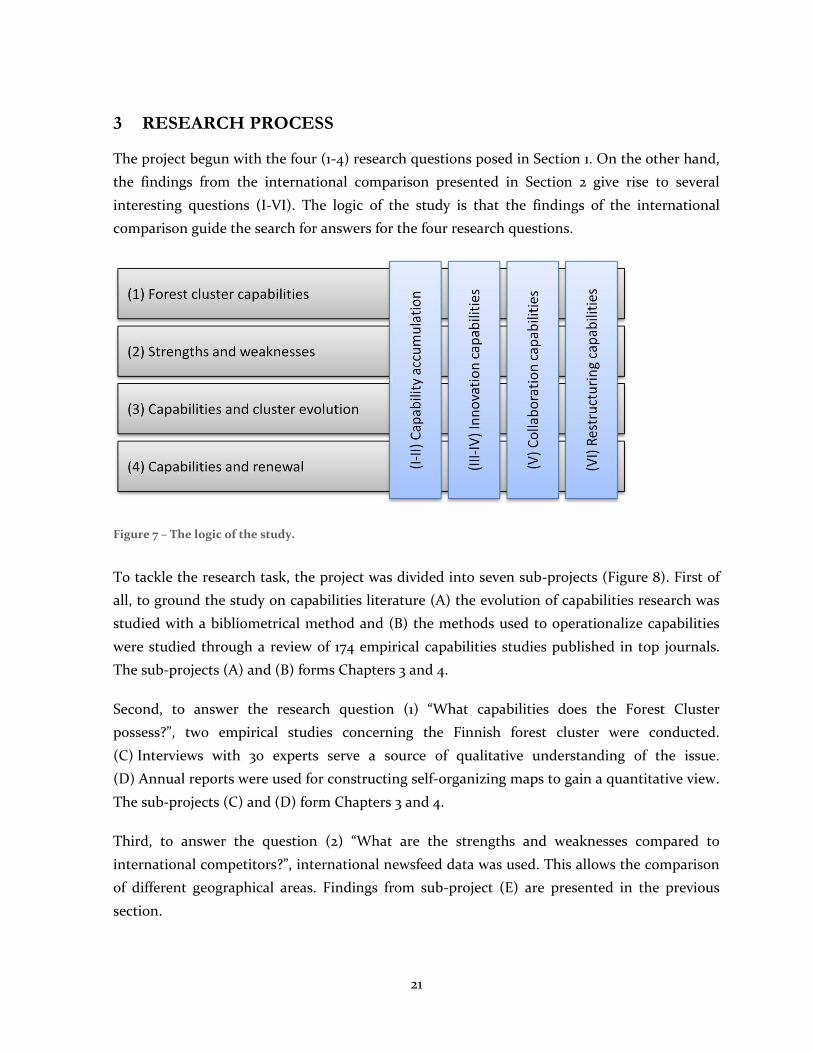
The project begun with the four (1-4) research questions posed in Section 1. On the other hand,
the findings from the international comparison presented in Section 2 give rise to several
interesting questions (I-VI). The logic of the study is that the findings of the international
comparison guide the search for answers for the four research questions.
Figure 7 – The logic of the study.
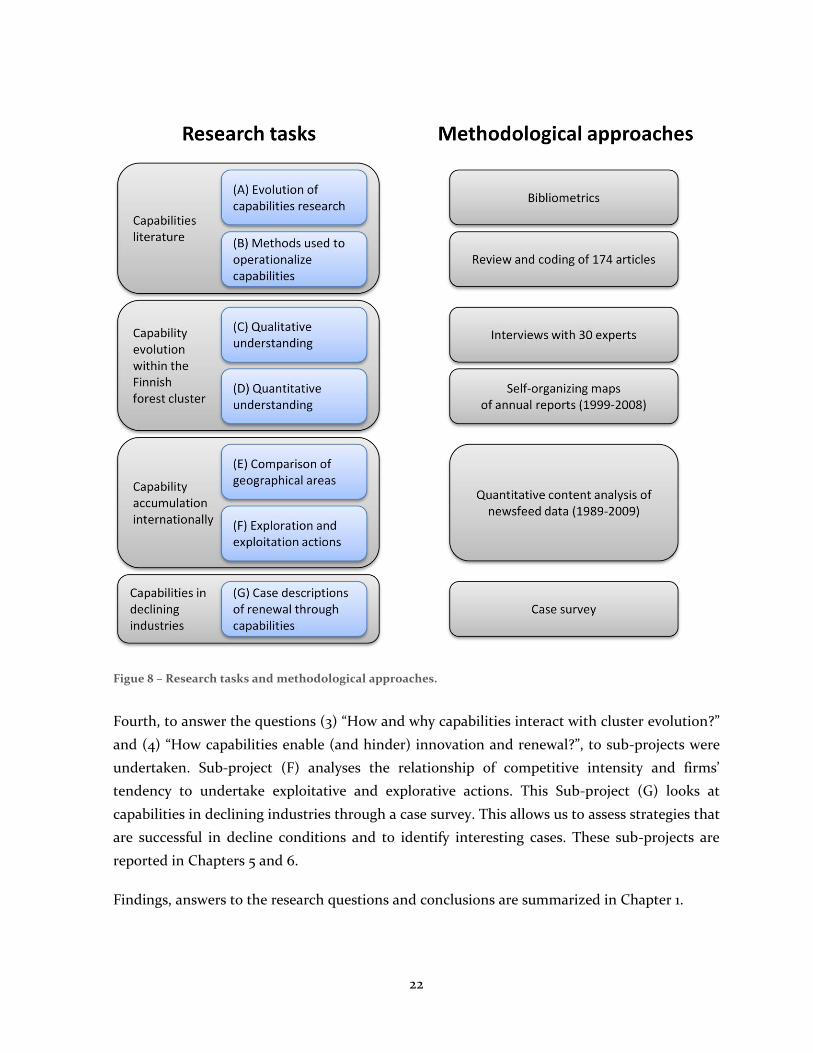
To tackle the research task, the project was divided into seven sub-projects (Figure 8). First of
all, to ground the study on capabilities literature (A) the evolution of capabilities research was
studied with a bibliometrical method and (B) the methods used to operationalize capabilities
were studied through a review of 174 empirical capabilities studies published in top journals.
The sub-projects (A) and (B) forms Chapters 3 and 4.
Second, to answer the research question (1) “What capabilities does the Forest Cluster
possess?”, two empirical studies concerning the Finnish forest cluster were conducted.
(C) Interviews with 30 experts serve a source of qualitative understanding of the issue.
(D) Annual reports were used for constructing self-organizing maps to gain a quantitative view.
The sub-projects (C) and (D) form Chapters 3 and 4.
Third, to answer the question (2) “What are the strengths and weaknesses compared to
international competitors?”, international newsfeed data was used. This allows the comparison
of different geographical areas. Findings from sub-project (E) are presented in the previous
section.
22
Figue 8 – Research tasks and methodological approaches.
Fourth, to answer the questions (3) “How and why capabilities interact with cluster evolution?”
and (4) “How capabilities enable (and hinder) innovation and renewal?”, to sub-projects were
undertaken. Sub-project (F) analyses the relationship of competitive intensity and firms’
tendency to undertake exploitative and explorative actions. This Sub-project (G) looks at
capabilities in declining industries through a case survey. This allows us to assess strategies that
are successful in decline conditions and to identify interesting cases. These sub-projects are
reported in Chapters 5 and 6.
Findings, answers to the research questions and conclusions are summarized in Chapter 1.
23
REFERENCES
BROWN, S. L. & EISENHARDT, K. M. 1997. The art of continuous change: Linking complexity
theory and time-paced evolution in relentlessly shifting organizations. Administrative
Science Quarterly, 42, 1-34.
D'AVENI, R. 1994. Hypercompetition: Managing the dynamics of strategic maneuvering, New
York, NY, Free Press.
DIESEN, M. 2007. Economics of pulp and paper industry. Paper making science and
technology. Jyväskylä, FI: Gummerus.
DOSI, G., NELSON, R. & WINTER, S. 2000. The nature and dynamics of organizational
capabilities, Oxford University Press.
EISENHARDT, K. M. & MARTIN, J. A. 2000. Dynamic capabilities: What are they? Strategic
Management Journal, 21, 1105-1121.
GALUNIC, D. C. & EISENHARDT, K. M. 2001. Architectural innovation and modular corporate
forms. Academy of Management Journal, 44, 1229-1249.
GHOSAL, V. & NAIR-REICHERT, U. 2009. Investments in modernization, innovation and gains
in productivity: Evidence from firms in the global paper industry. Research Policy, 38,
536-547.
GRABHER, G. 1993. The weakness of strong ties. the lock-in of regional development in the Ruhr
area, London, Routledge.
GRANT, R. M. 1996. Prospering in dynamically-competitive environments: Organizational
capability as knowledge integration. Organization Science, 7, 375-387.
JACOBIDES, M. G. 2006. The architecture and design of organizational capabilities. Industrial
and Corporate Change, 15, 151-171.
JACOBS, J. 1969. The Economy of Cities, New York, NY, Vintage books.
KIESLER, S. & SPROULL, L. 1982. Managerial response to changing environments - Pespectives
on problem sensing from social cognition. Administrative Science Quarterly, 27, 548-
570.
KIM, W. & MAUBORGNE, R. 2005. Blue Ocean Strategy, Boston, MA, Harvard Business School
Press.
KOGUT, B. & ZANDER, U. 1992. Knowledge of the firm, combinative capabilities, and the
replication of technology. Organization Science, 3, 383-397.
KRIPPENDORFF, K. 1980. Content Analysis. An Introduction to its Methodology, London, UK,
The Sage Commtext Series, Sage Publications Ltd.
24
LAMBERG, J. A. 2005. Strategic actions and path dependence: Profiles and archetypes of
competitive behavior in a global industry, Helsinki, FI, Helsinki University of
Technology.
LEONARD-BARTON, D. 1992. Core capabilities and core rigidities - A paradox in managing
new product development. Strategic Management Journal, 13, 111-125.
LEVINTHAL, D. A. & MARCH, J. G. 1993. The myopia of learning. Strategic Management
Journal, 14, 95-112.
MARCH, J. G. 1991. Exploration and exploitation in organizational learning. Organization
Science, 2, 71-87.
MCGAHAN, A. M. & SILVERMAN, B. S. 2001. How does innovative activity change as industries
mature? International Journal of Industrial Organization, 19, 1141-1160.
MENZEL, M. P. & FORNAHL, D. 2010. Cluster life cycles-dimensions and rationales of cluster
evolution. Industrial and Corporate Change, 19, 205-238.
NELSON, R. R. & WINTER, S. G. 1982. An evolutionary theory of economic change, Cambridge,
Belknap Press of of Harvard University Press.
PORTER, M. E. 1980. Competitive Strategy: Techniques for analyzing Industries and
Competitors, New York, NY, Free Press.
SCHUMPETER, J. A. 1934. The theory of economic development : an inquiry into profits, capital,
credit, interest, and the business cycle, Cambridge, Harvard University Press.
TEECE, D. J., PISANO, G. & SHUEN, A. 1997. Dynamic capabilities and strategic management.
Strategic Management Journal, 18, 509-533.
WINTER, S. G. 2000. The satisficing principle in capability learning. Strategic Management
Journal, 21, 981-996.
WINTER, S. G. 2003. Understanding dynamic capabilities. Strategic Management Journal, 24,
991-995.
ZOLLO, M. & WINTER, S. G. 2002. Deliberate learning and the evolution of dynamic
capabilities. Organization Science, 13, 339-351.
25
CHAPTER 3
THE STRUCTURE AND EVOLUTION OF CAPABILITIES RESEARCH IN 1986–2009:
A BIBLIOMETRIC STUDY
OLA LAAKSONEN
Aalto University School of Science and Technology [email protected]
1 INTRODUCTION
The term ‘capabilities’ floats in the literature like an iceberg in a foggy Arctic sea, one iceberg among many, not easily recognized as different from several icebergs near by (Dosi, Nelson & Winter 2000, p. 3).
Since the ideas proposed by, for example, Penrose (1959), Wernerfelt (1984), and Barney (1991),
and the subsequent emergence of the ‘resource-based view of the firm’, the concept of
capabilities has become a focal area in business strategy research. In contrast to the industrial-
organization tradition that emphasizes the analysis of external forces, the resource-based view
(RBV) has an internal focus (Armstrong & Shimizu 2007) since it considers a firm’s resources
the key to its competitiveness. In order to gain advantage related to its competitors, a firm has
to build resources that are valuable, rare, and hard to imitate and substitute (Barney 1991) or an
‘asset stock’ that is hard to replicate (Dierickx & Cool 1989).2
2 There is no consensus on whether to use the term ‘resource-based theory’ or ‘resource-based view’ when referring
to this stream of literature (Acedo, Barroso & Galan 2006). For a debate on whether the resource-based view is a theory, see Priem and Butler (2001a, 2001b) and Barney (2001). The term ‘resource-based view’ is used consistently throughout this study.
26
Capabilities are one building block of this asset stock. According to Barney (1991; building on
Daft 1983), a firm’s resources include “all assets, capabilities, organizational processes, firm
attributes, information etc. controlled by a firm that enable the firm to conceive of and
implement strategies that improve its efficiency and effectiveness.” (p. 101.) In other words,
capabilities are a central part of the resource base of an organization and thus, according to the
resource-based view, an important factor in defining a firm’s competitiveness.
There are quite many literature reviews on the resource-based view and related concepts3.
Usually, however, the concept of capabilities is not explicitly discussed in these reviews and the
understanding of capabilities remains fragmented4. This is why it is justified to conduct a
structured review on capabilities research in particular. Firstly, this approach has the potential
of revealing the most important works within capabilities research. Secondly, it can shed light
on the use of the concept of capabilities and its relatedness to other concepts such as
organizational routines (Nelson & Winter 1982), dynamic capabilities (Teece, Pisano & Shuen
1997), combinative capabilities (Kogut & Zander 1992), and absorptive capacity (Cohen &
Levinthal 1990) that are also important to the resource-based view.
Hence, this study is a bibliometric review of the structure and evolution of academic
capabilities research between 1986 and 2009. A bibliometric analysis is a structured and a
relatively objective way to study a field of research (Nerur, Rasheed & Natarajan 2008). The
citation data of more than 2700 articles from 39 academic journals is analyzed with citation
analysis, co-citation analysis, and keyword analysis techniques. This is also a longitudinal study:
the time period is divided into four sub-periods in order to shed light on the evolution of
capabilities research.
To conclude, this study seeks answers to the following research questions:
i) What are the most important academic publications in capabilities research?
ii) How has the focus of capabilities research evolved between 1986 and 2009?
The first research question is answered by conducting a citation analysis. The second research
question is answered by co-citation and keyword analysis techniques.
3 See, for example, Becker (2004) on organizational routines, Wang & Ahmed (2007), Arendt & Bromiley (2009) or
Ambrosini & Bowman (2009) on dynamic capabilities, and Acedo, Barroso & Galan (2006) or Newbert (2007) on the resource-based view. 4
Peng, Schroeder, and Shah (2008) make an exception since they review the concept of capabilities separately, too, but from an operations management rather than a strategic management perspective.
27
The term ’capabilities’ is not defined here since this study adopts a wide view of this construct.
Capabilities research is simply considered to consist of research in business and management
that deals with the concept of capabilities – regardless of how the authors define this concept.
Hence, the aim of this study is to shed light on the use of the concept of capabilities within the
fields of management and business rather than to delve into one specific definition.
2 METHOD AND DATA
This section first introduces the umbrella term ‘bibliometrics’ and then explains the data
collection process. This is followed by the description of the three specific techniques – citation
analysis, co-citation analysis, and keyword analysis – employed in conducting the bibliometric
analyses.
2.1 Bibliometrics
Pritchard (1969) offered one of the first definitions of the term ‘bibliometrics’ (Broadus 1987).
According to him, bibliometrics is “the application of mathematics and statistical methods to
books and other media of communication” (p. 349) in order to “shed light on the processes of
written communication” (p. 348). Having criticized Pritchard’s definition as too vague and after
reviewing various prior definitions, Broadus (1987) concludes that “bibliometrics is the
quantitative study of physical published units, or of bibliographic units, or of the surrogates for
either” (p. 376). These bibliographic units are, for example, citations or keywords in academic
articles. Generally speaking, the term bibliometrics thus covers a set of methods for analyzing
the structure of scholarly communication, its task being to “provide evolutionary models of
science, technology, and scholarship” (White & McCain 1989, p. 119).
The bibliometric methods employed in this study are citation analysis, co-citation analysis, and
keyword analysis. Similar techniques have been used, for example, in the fields of management
information systems (Culnan & Swanson 1986), strategic management (Martinsons, Everett &
Chan 2001, Ramos-Rodríguez & Ruíz-Navarro 2004, Nerur, Rasheed & Natarajan 2008),
knowledge management (Ponzi 2002), marketing (Hoffman & Holbrook 1993, Baumgartner &
Pieters 2003), operations management (Pilkington & Liston-Heyes 1999, Pilkington & Meredith
2009), entrepreneurship (Schildt, Zahra & Sillanpää 2006), and economics (Cahlik 2000).
The most interesting bibliometric review from the viewpoint of this study is the one of Acedo,
Barroso, and Galan (2006) on the resource-based view. Even though their study makes
28
interesting remarks on the concept of capabilities, it does not discuss this concept separately.
Thus, it seems that the structure and evolution of capabilities research in particular has not
previously been analyzed with bibliometric techniques.
2.2 Data
A citation is the basic unit of analysis in bibliometric research. In this study, this citation data
was retrieved from articles in academic journals. There are two reasons for this. Firstly, articles
published in journals can be considered ‘certified knowledge’ since they have been reviewed
and accepted by other researchers (Ramos-Rodríquez & Ruíz-Navarro 2004). Secondly, the
citation data of these journals is easily accessed through ISI Web of Science
(www.isiknowledge.com). The citation data used in this study was retrieved from the Social
Sciences Citation Index (SSCI) in the ISI Web of Science. This database indexes over 2000
journals from various social science disciplines.
The first step in gathering bibliometric data was the selection of journals from which the
citation data were retrieved. This is an important step in the data gathering process since the
selection of journals affects both the number and quality of the articles included in the analysis.
The aim in this study was to choose journals that are of high quality and that are associated
with capabilities research from the viewpoint of management and business.
There are three approaches to choosing the journals. The first approach is to rely on the
researcher’s or others experts’ judgement in choosing the most prominent journals (e.g.,
Pilkington & Meredith 2009). This approach is problematic since it violates the objectivity
principle of a bibliometric study (Acedo, Barroso & Galan 2006). The second alternative is to
choose the journals based on their impact factors (e.g., Järvinen & Sillanpää 2007) or the
number of citations they have received (e.g., Cahlik 2000). The impact factor is based on the
number of citations that articles in a journal have received and it can be used in evaluating the
journal’s quality in comparison to other journals in the same field (ISI Journal Citation Report,
Social Science 2008 Edition). The third method is to choose journals that are publishing most
actively in the specific field of research under consideration (e.g., Schildt, Zahra & Sillanpää
2006) – in this case, in capabilities research.
In this study, a combination of the two latter methods was used. Firstly, based on impact
factors, the top 40 journals from the areas of business and management were identified from
the ISI Journal Citation Report. Secondly, the 40 journals that included the largest number of
29
capabilities-related articles were identified (using the search word capabilit* in the SSCI). The
first list has a relative emphasis on strategic and general management journals, while the
second list includes more journals from the fields of operations and technology management.
Finally, the top 25 journals from each of these two rankings were combined into a single list,
which, after deleting the overlaps, comprised 39 journals. This list is shown in Appendix 1.
Next, a search from these 39 journals in the SSCI was conducted through ISI Web of Science.
The records in the SSCI were available from 1 January, 1986, and thus the investigated time
period was set to 1986–June 2009. In order to achieve a longitudinal view on capabilities
research, the time period was divided into four six-year sub-periods: 1986–1991, 1992–1997,
1998–2003, and 2004–2009. The search word used was capabilit*, but the search word capability
OR capabilities would have yielded the same number of results. The searches yielded a total of
2,753 articles with words beginning with “capabilit” in their titles, abstracts, or keywords. These
articles are called citing articles. These citing articles cited a total of 79,406 articles that are
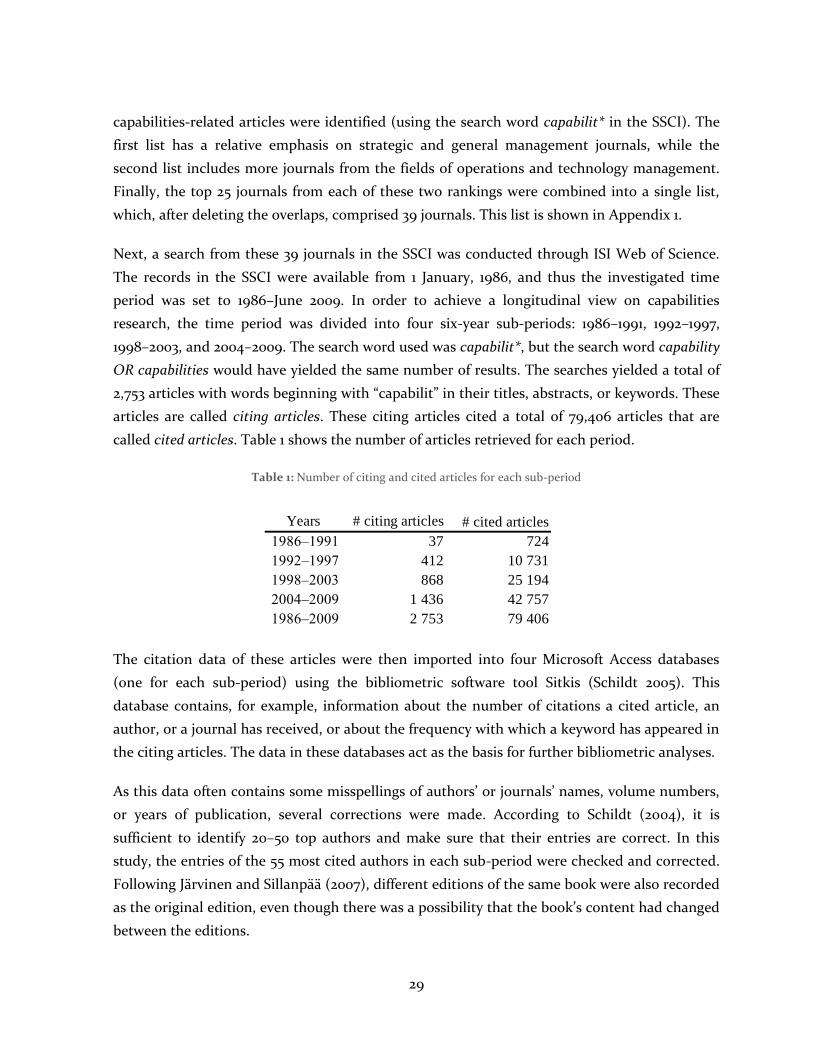
called cited articles. Table 1 shows the number of articles retrieved for each period.
Table 1: Number of citing and cited articles for each sub-period
The citation data of these articles were then imported into four Microsoft Access databases
(one for each sub-period) using the bibliometric software tool Sitkis (Schildt 2005). This
database contains, for example, information about the number of citations a cited article, an
author, or a journal has received, or about the frequency with which a keyword has appeared in
the citing articles. The data in these databases act as the basis for further bibliometric analyses.
As this data often contains some misspellings of authors’ or journals’ names, volume numbers,
or years of publication, several corrections were made. According to Schildt (2004), it is
sufficient to identify 20–50 top authors and make sure that their entries are correct. In this
study, the entries of the 55 most cited authors in each sub-period were checked and corrected.
Following Järvinen and Sillanpää (2007), different editions of the same book were also recorded
as the original edition, even though there was a possibility that the book’s content had changed
between the editions.
Years # citing articles # cited articles
1986–1991 37 724
1992–1997 412 10 731
1998–2003 868 25 194
2004–2009 1 436 42 757
1986–2009 2 753 79 406
30
Also, the keywords that had appeared most frequently in the articles were identified and their
spelling was checked. In addition, different conjugations were unified. For example, the
keywords R-and-D and research-and-development were changed into R&D, and the keyword
Resource-based theory was changed into Resource-based view.
2.3 Citation Analysis
Citation analysis is the systematic analysis of citation patterns in a scientific discipline. Citation
analysis is based on the assumption that when authors cite a document in their work, that
document is somehow important for their research. That is why frequently cited articles can be
regarded as more important building blocks of a research stream than articles with fewer
citations. (Ramos-Rodríquez & Ruíz-Navarro 2004.)
In this study, a citation analysis was conducted in order to find the most cited documents
within capabilities research. In addition, the changes in the relative citation frequencies of the
most cited documents were investigated. The relative citation frequency of a document in a
sub-period is calculated by dividing the number of citations the document has received by the
total number of citing articles in the sub-period. Thus, the relative frequency is the percentage
of citing articles that have cited the document in question.
2.4 Co-citation Analysis and Cluster Formation
In his seminal article, Small (1973) defines co-citation as the frequency with which two
documents are cited jointly by a third document. The number of co-citations can be
interpreted as a measure for the similarity of content of the two documents (Ramos-Rodríquez
& Ruíz-Navarro 2004). Even though an author may cite one document for the purpose of
criticizing it and another document for giving credit to it, the popularity of the co-citation
method indicates that high co-citation strength is generally considered to indicate high
similarity of the two cited articles. Thus, co-citation analysis is a method for separating more
homogeneous research streams from a larger field of study (ibid.).
In this study, co-citation analysis is used to form separate clusters of highly cited articles in the
capabilities research stream. The aim is to separate groups of important articles with high
mutual co-citation strength from each other, in order to see in what kinds of different ways the
concept of capabilities is dealt with in the literature. Thus, this study has a ‘micro’ approach to
co-citation analysis since it aims to describe the structure and historical development of an
31
individual research stream; whereas a ‘macro’ approach would focus on the overall structure of
scientific disciplines (Gmür 2003).
A normalized value of co-citation strength was used in order to emphasize proximity between
similar references that are cited less often than the most common references (Schildt &
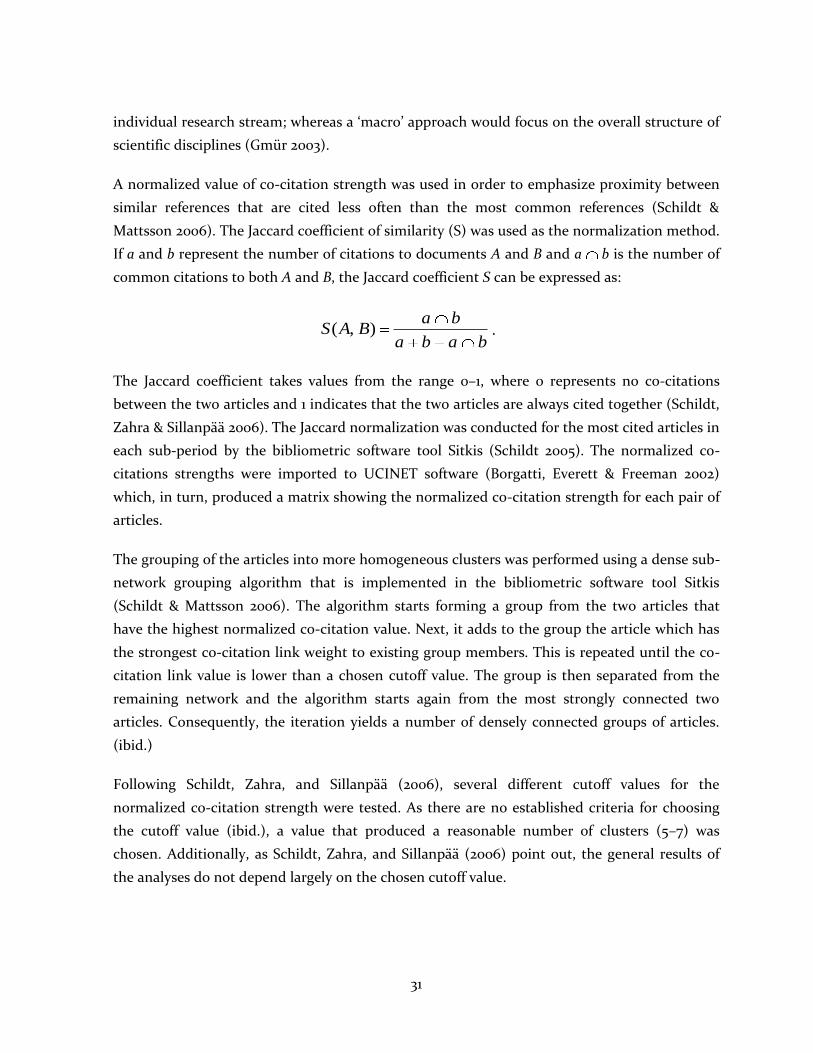
Mattsson 2006). The Jaccard coefficient of similarity (S) was used as the normalization method.
If a and b represent the number of citations to documents A and B and a b is the number of
common citations to both A and B, the Jaccard coefficient S can be expressed as:
.
The Jaccard coefficient takes values from the range 0–1, where 0 represents no co-citations
between the two articles and 1 indicates that the two articles are always cited together (Schildt,
Zahra & Sillanpää 2006). The Jaccard normalization was conducted for the most cited articles in
each sub-period by the bibliometric software tool Sitkis (Schildt 2005). The normalized co-
citations strengths were imported to UCINET software (Borgatti, Everett & Freeman 2002)
which, in turn, produced a matrix showing the normalized co-citation strength for each pair of
articles.
The grouping of the articles into more homogeneous clusters was performed using a dense sub-
network grouping algorithm that is implemented in the bibliometric software tool Sitkis
(Schildt & Mattsson 2006). The algorithm starts forming a group from the two articles that
have the highest normalized co-citation value. Next, it adds to the group the article which has
the strongest co-citation link weight to existing group members. This is repeated until the co-
citation link value is lower than a chosen cutoff value. The group is then separated from the
remaining network and the algorithm starts again from the most strongly connected two
articles. Consequently, the iteration yields a number of densely connected groups of articles.
(ibid.)
Following Schildt, Zahra, and Sillanpää (2006), several different cutoff values for the
normalized co-citation strength were tested. As there are no established criteria for choosing
the cutoff value (ibid.), a value that produced a reasonable number of clusters (5–7) was
chosen. Additionally, as Schildt, Zahra, and Sillanpää (2006) point out, the general results of
the analyses do not depend largely on the chosen cutoff value.
baba
baBAS ),(
32
After identifying the separate clusters of articles for each sub-period, a picture of the clusters
was drawn with Pajek software (Batagelj & Mrvar 2009). In these network pictures, the distance
and the width of the line between two nodes (articles) represent the normalized co-citation
strength between the two articles. The distances between the articles are determined by a non-
metric multidimensional scaling (MDS) algorithm (Scott 2000).
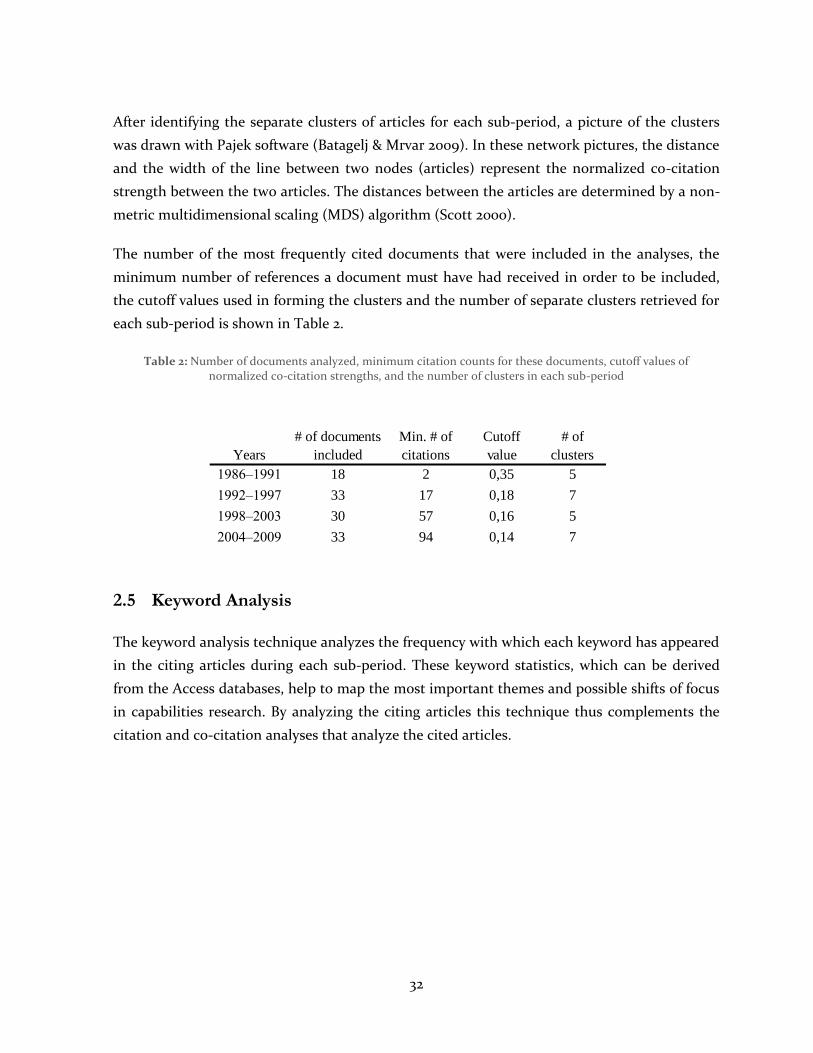
The number of the most frequently cited documents that were included in the analyses, the
minimum number of references a document must have had received in order to be included,
the cutoff values used in forming the clusters and the number of separate clusters retrieved for
each sub-period is shown in Table 2.
Table 2: Number of documents analyzed, minimum citation counts for these documents, cutoff values of normalized co-citation strengths, and the number of clusters in each sub-period
2.5 Keyword Analysis
The keyword analysis technique analyzes the frequency with which each keyword has appeared
in the citing articles during each sub-period. These keyword statistics, which can be derived
from the Access databases, help to map the most important themes and possible shifts of focus
in capabilities research. By analyzing the citing articles this technique thus complements the
citation and co-citation analyses that analyze the cited articles.
Years
# of documents
included
Min. # of
citations
Cutoff
value
# of
clusters
1986–1991 18 2 0,35 5
1992–1997 33 17 0,18 7
1998–2003 30 57 0,16 5
2004–2009 33 94 0,14 7
33
3 RESULTS
The following sections present the most interesting findings from the citation analyses, co-
citation analyses, and keyword analyses. The aim is to highlight the most important areas of
inquiry and shifts in focus of capabilities research.
3.1 Citation Analyses
Appendix 2 presents the 30 most cited documents in the overall period between 1986 and 2009
and their raw and relative citation frequencies in each sub-period. The documents are ranked
based on the number of citations they have received.
One of the most important remarks that can be made from these citation statistics is that very
few of the 30 most cited articles have been cited during the first sub-period 1986–1991. For
example, the book The Theory of the Growth of the Firm by Penrose (1959), which is nowadays
considered one of the most important building blocks of the resource-based view (Acedo,
Barroso & Galan 2006), was not cited by the citing articles during the first sub-period. This
suggests that capabilities research as a separate field of inquiry had not yet emerged during this
sub-period, even though many of the most important documents had been published in the
1980s or before.
In addition, the citation counts in the sub-period 1986–1991 are generally very low: the article
Visual Interactive Modelling in Operational Research: Successes and Opportunities by Bell (1985)
was the only document that gained more than two citations. This is why the first sub-period
has been excluded from the following co-citation and keyword analyses: the results would be
neither interesting nor reliable.
Nelson and Winter’s (1982) book An Evolutionary Theory of Economic Change seems to have
maintained the most stable popularity throughout the overall period. In addition to Barney’s
(1991) article on the resource-based view, it is the only document that has been in the top five
in each of the three latter sub-periods. Especially the chapters 3–5 in An Evolutionary Theory of
Economic Change5 are considered important for the capabilities discussion (Foss 2003).
According to Foss (2003), “re-reading the chapters makes one realize that perhaps not so much
5 These chapters are named The Foundations of Contemporary Orthodoxy (Ch. 3), Skills (Ch. 4), and Organizational
Capabilities and Behavior (Ch. 5).
34
essential has happened in two succeeding decades of work on capabilities, competence,
evolutionary, etc., theories of the firm that goes beyond Nelson and Winter’s treatment.” (p.
186.)
Even though Nelson and Winter’s (1982) book seems to have initially been the most influential
work on capabilities, the article Dynamic Capabilities and Strategic Management by Teece,
Pisano, and Shuen (1997) is the most cited document in the overall period of 1986–2009. It is
often cited as the seminal work on dynamic capabilities (Easterby-Smith, Lyles & Peteraf 2009),
even though already Williamson (1991) noted the emergence of this concept. The dynamic
capabilities perspective builds on the traditional resource-based view, but regards it as static
and considers that it has neglected the influence of market dynamism. Thus, the construct of
dynamic capabilities aims at explaining how certain firms succeed in gaining competitive
advantage in situations of rapid change (Eisenhardt & Martin 2000). Teece and colleagues
(1997) define dynamic capabilities as “the firm’s ability to integrate, build, and reconfigure
internal and external competences to address rapidly changing environments” (p. 516).
The third most cited document is Barney’s (1991) article Firm Resources and Sustained
Competitive Advantage. Barney builds his quest for sustained competitive advantage on the
assumption that resources are heterogeneously distributed across firms and that these resource
differences are somewhat stable. Barney (1991) views capabilities as one type of these firm
resources. According to him, these resources can be a source of sustained competitive
advantage only if they are valuable, rare, imperfectly imitable, and non-substitutable (this has
later been called the ‘VRIN’ framework).
The fourth most cited document is Cohen and Levinthal’s (1990) article Absorptive Capacity: A
New Perspective on Learning and Innovation. Absorptive capacity is defined as “the ability of a
firm to recognize the value of new, external information, assimilate it, and apply it to
commercial ends” (p. 128). Thus, absorptive capacity is a kind of a capability. Absorptive
capacity is especially important in product development, where both prior knowledge and the
ability to exploit external knowledge are essential. One important remark that Cohen and
Levinthal make is the path-dependence of absorptive capacity: prior knowledge affects the
firm’s ability to learn new things in the future. This is true with capabilities as well: early
investments in certain capabilities may to some extent limit the capability development
alternatives the firm has in the future.
The fifth most cited document is Kogut and Zander’s (1992) article Knowledge of the Firm,
Combinative Capabilities, and the Replication of Technology. The concept of combinative
35
capabilities introduced in the article is in many ways similar to Cohen and Levinthal’s (1990)
absorptive capacity. Combinative capability is defined as the ability to exploit and recombine
both internal and external knowledge and capabilities in order to learn new things. It, too, is a
path-dependent phenomenon since it resides in the firm’s organizing structure and social
relationships that are not easy to change. This is why learning by reconfiguring current
capabilities is often simpler than learning by creating totally new capabilities. Kogut and
Zander’s view that firms learn new skills by combining their current capabilities is thus
somewhat similar to the view Teece, Pisano, and Shuen (1997) would adopt five years later.
The diverse nature of capabilities research is quite clearly illustrated by the range of topics that
the most cited documents cover. Not surprisingly, the most cited documents include the
seminal works on capabilities and routines (Nelson & Winter 1982) and the resource-based
view (Barney 1991). The three other documents can be characterized as more recent
modifications to these initial ideas. Even though these modifications – dynamic capabilities,
absorptive capacity, and combinative capabilities – are named differently, they all share a
common theme: the reconfiguration of current capabilities.
The five most cited documents also illustrate the fragmented nature of capabilities research:
only the work of Nelson and Winter (1982) deals specifically with capabilities. For the other of
the five most cited works, the concept of capabilities is rather a building block for further
consideration than a separate field of study on its own.
In addition, the most cited works are not explicit in how the concept of capabilities is related to
the concepts they deal with, i.e. dynamic capabilities, absorptive capacity, resources,
knowledge, and combinative capabilities. For example, as Wang and Ahmed (2007) note,
Teece, Pisano and Shuen’s (1997) definition of capabilities is hardly different from their
definition of dynamic capabilities.6 Absorptive capacity, on the other hand, is defined as a type
of a capability (Cohen & Levinthal 1990) without addressing the question of what capabilities
are.
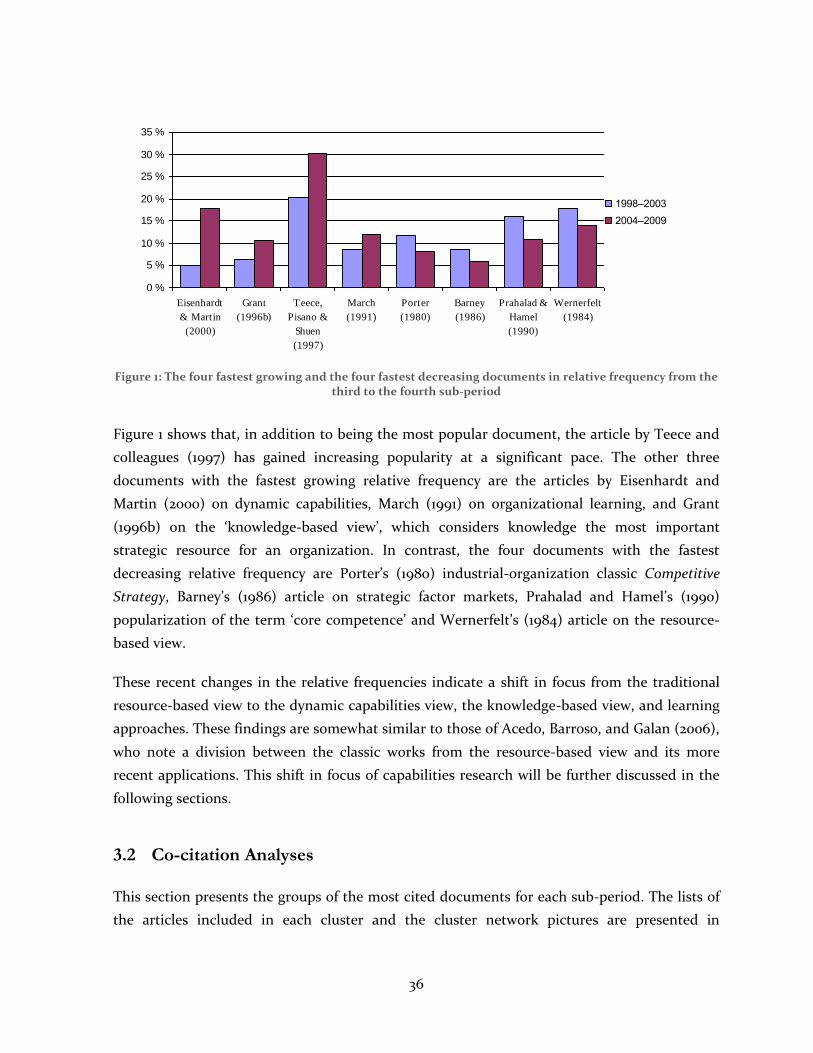
Of the 25 most cited documents, Figure 1 presents the four fastest growing and the four fastest
decreasing documents in relative frequency from the third to the fourth sub-period.
6 According to Teece, Pisano, and Shuen (1997), “The term ‘capabilities’ emphasizes the key role of strategic
management in appropriately adapting, integrating, and reconfiguring internal and external organizational skills, resources, and functional competences to match the requirements of a changing environment.” (p. 515.) They define dynamic capabilities as “the firm’s ability to integrate, build, and reconfigure internal and external competences to address rapidly changing environments” (p. 516).
36
Figure 1: The four fastest growing and the four fastest decreasing documents in relative frequency from the third to the fourth sub-period
Figure 1 shows that, in addition to being the most popular document, the article by Teece and
colleagues (1997) has gained increasing popularity at a significant pace. The other three
documents with the fastest growing relative frequency are the articles by Eisenhardt and
Martin (2000) on dynamic capabilities, March (1991) on organizational learning, and Grant
(1996b) on the ‘knowledge-based view’, which considers knowledge the most important
strategic resource for an organization. In contrast, the four documents with the fastest
decreasing relative frequency are Porter’s (1980) industrial-organization classic Competitive
Strategy, Barney’s (1986) article on strategic factor markets, Prahalad and Hamel’s (1990)
popularization of the term ‘core competence’ and Wernerfelt’s (1984) article on the resource-
based view.
These recent changes in the relative frequencies indicate a shift in focus from the traditional
resource-based view to the dynamic capabilities view, the knowledge-based view, and learning
approaches. These findings are somewhat similar to those of Acedo, Barroso, and Galan (2006),
who note a division between the classic works from the resource-based view and its more
recent applications. This shift in focus of capabilities research will be further discussed in the
following sections.
3.2 Co-citation Analyses
This section presents the groups of the most cited documents for each sub-period. The lists of
the articles included in each cluster and the cluster network pictures are presented in
0 %
5 %
10 %
15 %
20 %
25 %
30 %
35 %
Eisenhardt
& Martin
(2000)
Grant
(1996b)
Teece,
Pisano &
Shuen
(1997)
March
(1991)
Porter
(1980)
Barney
(1986)
Prahalad &
Hamel
(1990)
Wernerfelt
(1984)
1998–2003
2004–2009
37
Appendices 3–6. Following Gmür (2003), only the clusters that include at least three documents
that are all connected to each other by a node are discussed here. This leaves out all clusters
with less than three documents and cluster S in which the three works are not all linked to
each other. In addition, articles outside of the clusters (i.e. articles in cluster 0) are not
discussed here.
3.2.1 Clusters in 1986–1991
As noted before, the citation counts for the cited articles in this sub-period are very small.
Hence, the only reliable conclusion that can be made is that capabilities research was not yet
established during this sub-period, even though the theoretical foundations of the more recent
capabilities discussion were laid at that time. This is why the results of the co-citation analyses
for this sub-period are not further discussed here. However, the results of the co-citation
analyses for this sub-period are presented in Appendix 3. These results include a list and a
network picture of the five clusters (clusters A–E) that emerged at a normalized cut-off value of
0.35.
3.2.2 Clusters in 1992–1997
In this sub-period, seven clusters of articles emerged at a cut-off value of 0.18. These clusters
(clusters F–L) are listed and depicted as a network picture in Appendix 4. Clusters F, G, H, and
I include at least three documents and are discussed here.
Cluster F: The Resource-Based View. This cluster consists of works on the resource-based view
(Penrose 1959, Wernerfelt 1984, Barney 1991, Dierickx & Cool 1989) and on some of its
applications. These include, for example, Prahalad and Hamel’s (1990) popularization of the
term ‘core competence’, Leonard-Barton’s (1992) article on capabilities in product
development, and Amit and Schoemaker’s (1993) work on the role of capabilities and other
factors in generating economic rent. The works by Porter (1980, 1985) are not generally
considered a building block of the capabilities discussion since they focus on the impact of
external forces on competitiveness. However, Porter’s 1980 book Competitive Strategy is placed
in this cluster, which indicates its influence on the whole field of strategic management (Nerur,
Rasheed & Natarajan 2008).
Cluster G: Organization Theory and Organizational Learning. This cluster contains two works
on both organization theory and on organizational learning. James March being a co-author in
38
one work on both of these topics is probably one reason why these two research streams are
situated in the same cluster. The two organization theory classics in this cluster are March and
Simon’s (1958) book Organizations and Thompson’s (1967) book Organizations in Action. Both
of these works are rather all-inclusive studies on how organizations function. Issues covered in
these two books include, for example, control, incentives, structures, and rationality in
organizations.
The two other works in this cluster are Argyris and Schön’s (1978) book and Levitt and March’s
(1988) article that are both titled Organizational Learning. Argyris and Schön (1978)
concentrate more on individual learning within single organizations (Levitt & March 1988),
whereas Levitt and March (ibid.) examine the process of organizational learning. They view
learning as a routine-based, history-dependent, and target-oriented phenomenon.
Organizational learning thus has features quite similar to those later attributed to
organizational capabilities (e.g., Dosi, Nelson & Winter 2000).
Cluster H: Capabilities and Environmental Change. Studies in this cluster focus on economic
and technological change and their relatedness to organizational capabilities. In addition to
Nelson and Winter’s (1982) classic An Evolutionary Theory of Economic Change this cluster
consists of two works that concentrate on technological change (Tushman & Anderson 1986)
and on different kinds of innovations (Henderson & Clark 1990). Tushman and Anderson
(1986) view technological changes as either competence enhancing (that build on existing
capabilities) or competence destroying (that require new kinds of capabilities). Henderson and
Clark (1990), on the other hand, investigate the interplay between innovations and different
organizational capabilities.
Cluster I: Early Knowledge-Based Approaches. This rather fragmented cluster contains Lippman
and Rumelt’s (1982) article on efficiency differences between firms under competition and two
articles on the early knowledge-based view. These two works are Winter’s (1987) article
Knowledge and Competence as Strategic Assets and Kogut and Zander’s (1992) article that
introduces the concept of combinative capabilities.
3.2.3 Clusters in 1998–2003
In this sub-period, five clusters of articles emerged at a cut-off value of 0.16. The articles in
these clusters (clusters M–Q) are listed and depicted as a network picture in Appendix 5.
Clusters M, N, and O include at least three documents and are discussed here.
39
Cluster M: The Resource-Based View and Dynamic Capabilities. This cluster in very similar to
cluster F in 1992–1997: it contains the seminal works on the RBV and some of its applications.
In addition to the applications in cluster F, cluster M introduces a new one: the construct of
dynamic capabilities (Teece, Pisano & Shuen 1997).
Cluster N: Knowledge-Based Approaches. This cluster consists of works that focus on knowledge
as an important strategic resource for organizations. Except for Winter’s (1987) article (that
appeared already in cluster I), all of the works in this cluster have been published in the 1990s.
This is a sign of the relative newness of this “knowledge-based view” of the firm. Even though
all of the works in this cluster have this unifying theme, they also differ in how they approach
it. Zander and Kogut (1995) and Szulanski (1996), for example, examine the transfer of
capabilities (such as best practice) within organizations. Cohen and Levinthal’s (1990) article on
absorptive capacity has already been discussed in the previous section. Nonaka (1994) and
Nonaka and Takeuchi (1995), on the other hand, concentrate on the dynamic processes related
to the creation and transformation of tacit and explicit knowledge within organizations.
Cluster O: Organizational Learning. This cluster is very similar to cluster G in 1992–1997.
Thompson’s (1967) book has been replaced by March’s (1991) article on explorative and
exploitative actions in organizational learning. This framework is somewhat similar to the
division of capabilities into productive and dynamic types (see, for example, Jacobides 2006).
Applying this analogy, dynamic capabilities are directed towards exploring new resource
configurations (Teece, Pisano & Shuen 1997, Eisenhardt & Martin 2000) whereas productive
(e.g., Jacobides & Winter 2005) or ‘zero-level’ capabilities (Winter 2003) aim at making the
most out of the firm’s current resources.
3.2.4 Clusters in 2004–2009
In this sub-period, six clusters of articles emerged at a cut-off value of 0.13. The articles in these
clusters (clusters R–W) are listed and depicted as a network picture in Appendix 6. Clusters R,
T, V, and W include at least three documents and are discussed here.
Cluster R: The Resource-Based View and Dynamic Capabilities. This cluster is quite similar to
clusters F and M in the previous sub-periods. In addition to Teece, Pisano, and Shuen’s (1997)
article, also the two other works on dynamic capabilities (Eisenhardt & Martin 2000, Zollo &
Winter 2002) are placed in this cluster. It is interesting that the knowledge-based view and
learning approaches have formed separate clusters but the dynamic capabilities view is very
40
tightly connected to the representative works of the resource-based view. As Wang and Ahmed
(2007) and Acedo, Barroso and Galan (2006) note in their reviews, the construct of dynamic
capabilities is complementary to the resource-based view. The findings in this cluster analysis
indicate the same. It thus seems that Williamson (1991) has been on the right track when
pondering on where the concept of dynamic capabilities would be placed in regard to the
resource-based view:
The leading efficiency approaches to business strategy are the resource-based and the dynamic capabilities approach … It is not obvious to me how these two literatures will play out – either individually or in combination. Plainly, they deal with core issues. Possibly they will be joined. (p. 76.)
Cluster R also includes three works on the knowledge-based view (Cohen & Levinthal 1990,
Kogut & Zander 1992, Grant 1996b). Most probably, this results from the choice of the cut-off
value for the normalized co-citation strength and does not indicate any significant change in
the structure of capabilities research.
Cluster T: Organizational Learning. This cluster is very similar to clusters G and O in the
previous sub-periods. The works on organization theory have dropped out and this cluster
consists of works on organizational learning. In addition to Levitt and March’s (1988) and
March’s (1991) articles that had appeared in the previous clusters, too, this cluster includes
Levinthal and March’s (1993) article The Myopia of Learning. This article is a further
investigation of exploration and exploitation in organizational learning and “the learning
capabilities of organizations” (ibid.).
Cluster V: Transaction Cost Economics. The most important works in this cluster are
Williamson’s (1975, 1985) books on transaction cost economics. Transaction cost economics
offers a “governance perspective” to business strategy as opposed to the resource-based views
that Williamson (1999) calls the “competence perspective”. At first sight, Williamson’s ideas
seem to be cited as an antithesis to the capabilities view. For example, Williamson (1975, 1985)
views the firm as a governance structure whereas the competence perspective considers the
firm a bundle of related resources (Williamson 1999). Researchers within the competence
perspective, on the other hand, have criticized transaction cost economics as static (ibid.).
More recently, however, there has been interest in how capabilities and transaction costs
overlap and complement each other (ibid.) and co-evolve (Jacobides & Winter 2005). Teece,
Pisano and Shuen (1997), too, build their theory of dynamic capabilities partly on Williamson’s
works.
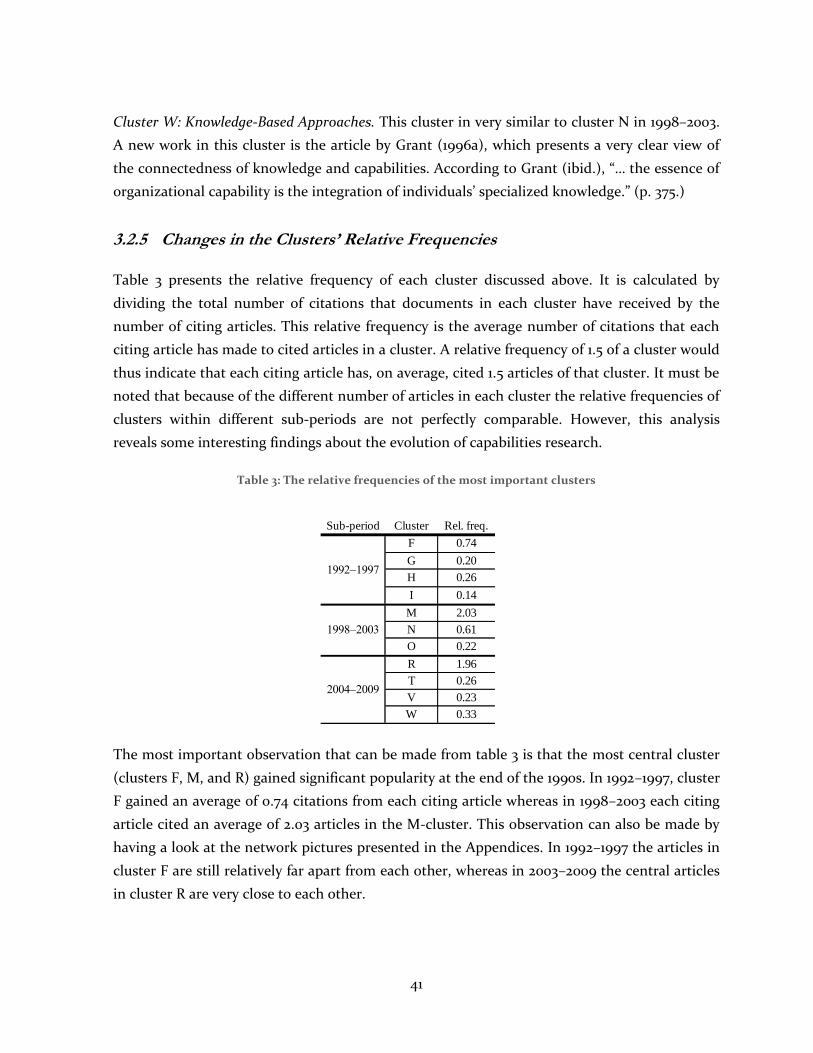
41
Cluster W: Knowledge-Based Approaches. This cluster in very similar to cluster N in 1998–2003.
A new work in this cluster is the article by Grant (1996a), which presents a very clear view of
the connectedness of knowledge and capabilities. According to Grant (ibid.), “… the essence of
organizational capability is the integration of individuals’ specialized knowledge.” (p. 375.)
3.2.5 Changes in the Clusters’ Relative Frequencies
Table 3 presents the relative frequency of each cluster discussed above. It is calculated by
dividing the total number of citations that documents in each cluster have received by the
number of citing articles. This relative frequency is the average number of citations that each
citing article has made to cited articles in a cluster. A relative frequency of 1.5 of a cluster would
thus indicate that each citing article has, on average, cited 1.5 articles of that cluster. It must be
noted that because of the different number of articles in each cluster the relative frequencies of
clusters within different sub-periods are not perfectly comparable. However, this analysis
reveals some interesting findings about the evolution of capabilities research.
Table 3: The relative frequencies of the most important clusters
The most important observation that can be made from table 3 is that the most central cluster
(clusters F, M, and R) gained significant popularity at the end of the 1990s. In 1992–1997, cluster
F gained an average of 0.74 citations from each citing article whereas in 1998–2003 each citing
article cited an average of 2.03 articles in the M-cluster. This observation can also be made by
having a look at the network pictures presented in the Appendices. In 1992–1997 the articles in
cluster F are still relatively far apart from each other, whereas in 2003–2009 the central articles
in cluster R are very close to each other.
Sub-period Cluster Rel. freq.
F 0.74
G 0.20
H 0.26
I 0.14
M 2.03
N 0.61
O 0.22
R 1.96
T 0.26
V 0.23
W 0.33
1992–1997
1998–2003
2004–2009
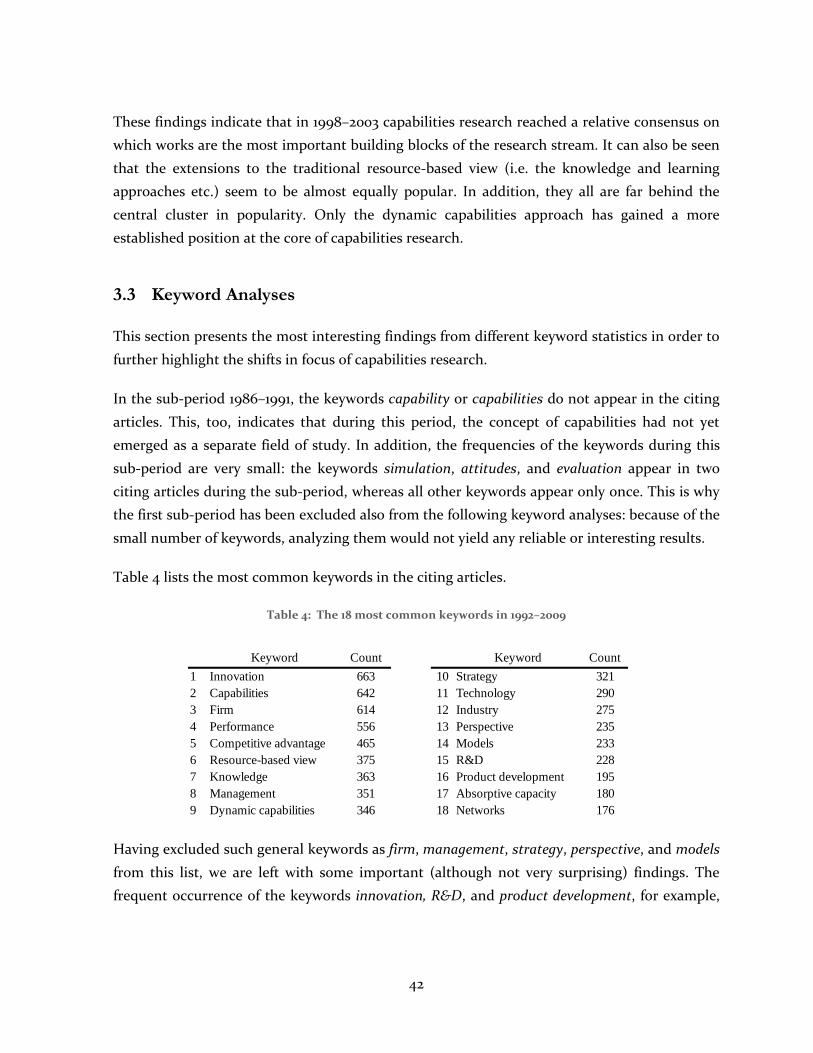
42
These findings indicate that in 1998–2003 capabilities research reached a relative consensus on
which works are the most important building blocks of the research stream. It can also be seen
that the extensions to the traditional resource-based view (i.e. the knowledge and learning
approaches etc.) seem to be almost equally popular. In addition, they all are far behind the
central cluster in popularity. Only the dynamic capabilities approach has gained a more
established position at the core of capabilities research.
3.3 Keyword Analyses
This section presents the most interesting findings from different keyword statistics in order to
further highlight the shifts in focus of capabilities research.
In the sub-period 1986–1991, the keywords capability or capabilities do not appear in the citing
articles. This, too, indicates that during this period, the concept of capabilities had not yet
emerged as a separate field of study. In addition, the frequencies of the keywords during this
sub-period are very small: the keywords simulation, attitudes, and evaluation appear in two
citing articles during the sub-period, whereas all other keywords appear only once. This is why
the first sub-period has been excluded also from the following keyword analyses: because of the
small number of keywords, analyzing them would not yield any reliable or interesting results.
Table 4 lists the most common keywords in the citing articles.
Table 4: The 18 most common keywords in 1992–2009
Having excluded such general keywords as firm, management, strategy, perspective, and models
from this list, we are left with some important (although not very surprising) findings. The
frequent occurrence of the keywords innovation, R&D, and product development, for example,
Keyword Count Keyword Count
1 Innovation 663 10 Strategy 321
2 Capabilities 642 11 Technology 290
3 Firm 614 12 Industry 275
4 Performance 556 13 Perspective 235
5 Competitive advantage 465 14 Models 233
6 Resource-based view 375 15 R&D 228
7 Knowledge 363 16 Product development 195
8 Management 351 17 Absorptive capacity 180
9 Dynamic capabilities 346 18 Networks 176
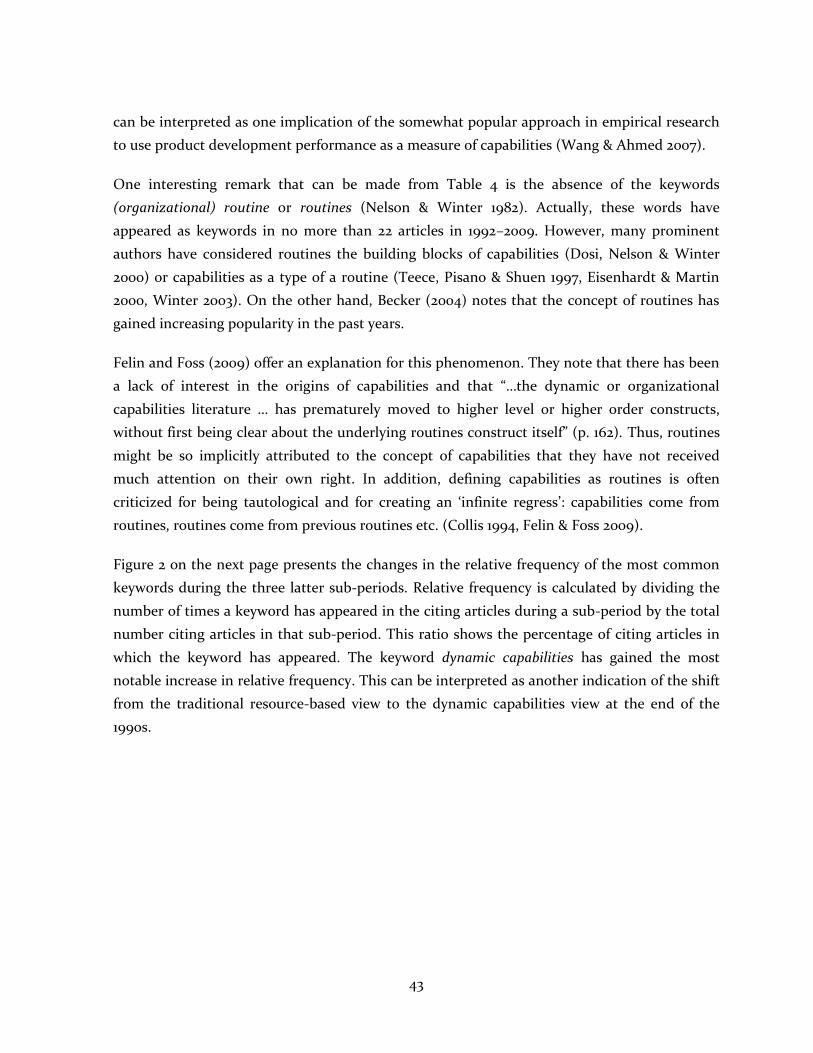
43
can be interpreted as one implication of the somewhat popular approach in empirical research
to use product development performance as a measure of capabilities (Wang & Ahmed 2007).
One interesting remark that can be made from Table 4 is the absence of the keywords
(organizational) routine or routines (Nelson & Winter 1982). Actually, these words have
appeared as keywords in no more than 22 articles in 1992–2009. However, many prominent
authors have considered routines the building blocks of capabilities (Dosi, Nelson & Winter
2000) or capabilities as a type of a routine (Teece, Pisano & Shuen 1997, Eisenhardt & Martin
2000, Winter 2003). On the other hand, Becker (2004) notes that the concept of routines has
gained increasing popularity in the past years.
Felin and Foss (2009) offer an explanation for this phenomenon. They note that there has been
a lack of interest in the origins of capabilities and that “…the dynamic or organizational
capabilities literature … has prematurely moved to higher level or higher order constructs,
without first being clear about the underlying routines construct itself” (p. 162). Thus, routines
might be so implicitly attributed to the concept of capabilities that they have not received
much attention on their own right. In addition, defining capabilities as routines is often
criticized for being tautological and for creating an ‘infinite regress’: capabilities come from
routines, routines come from previous routines etc. (Collis 1994, Felin & Foss 2009).
Figure 2 on the next page presents the changes in the relative frequency of the most common
keywords during the three latter sub-periods. Relative frequency is calculated by dividing the
number of times a keyword has appeared in the citing articles during a sub-period by the total
number citing articles in that sub-period. This ratio shows the percentage of citing articles in
which the keyword has appeared. The keyword dynamic capabilities has gained the most
notable increase in relative frequency. This can be interpreted as another indication of the shift
from the traditional resource-based view to the dynamic capabilities view at the end of the
1990s.
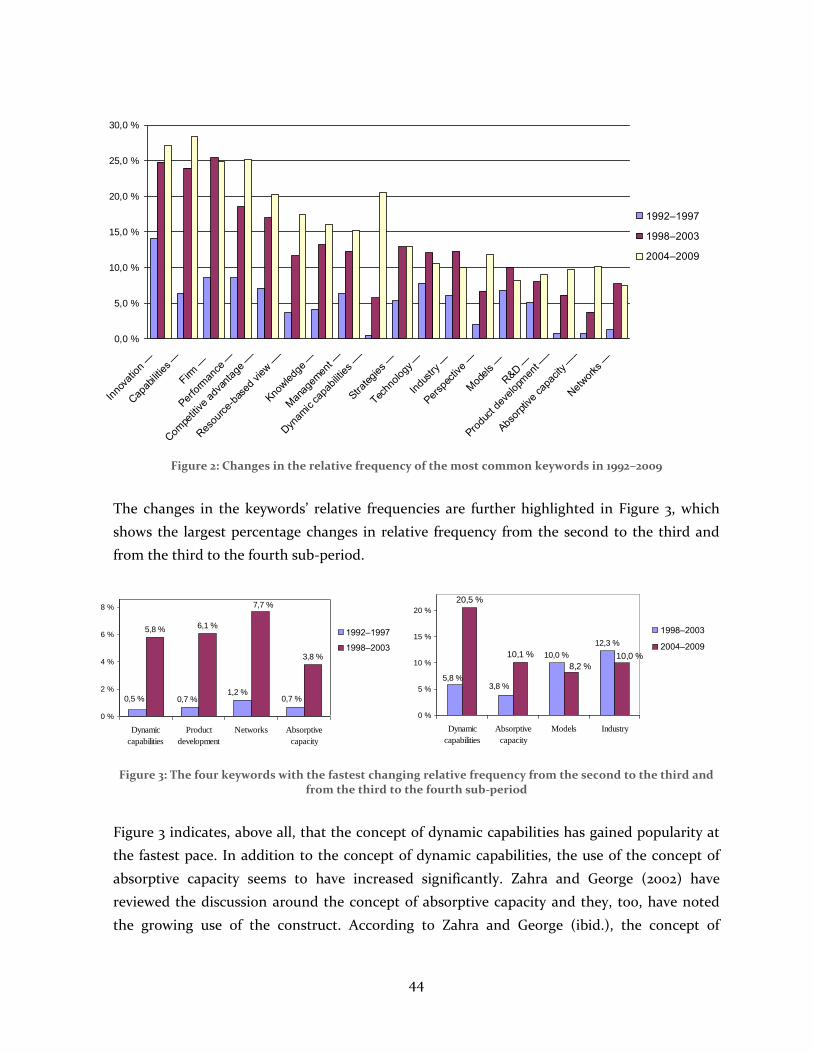
44
Figure 2: Changes in the relative frequency of the most common keywords in 1992–2009
The changes in the keywords’ relative frequencies are further highlighted in Figure 3, which
shows the largest percentage changes in relative frequency from the second to the third and
from the third to the fourth sub-period.
Figure 3: The four keywords with the fastest changing relative frequency from the second to the third and from the third to the fourth sub-period
Figure 3 indicates, above all, that the concept of dynamic capabilities has gained popularity at
the fastest pace. In addition to the concept of dynamic capabilities, the use of the concept of
absorptive capacity seems to have increased significantly. Zahra and George (2002) have
reviewed the discussion around the concept of absorptive capacity and they, too, have noted
the growing use of the construct. According to Zahra and George (ibid.), the concept of
0,0 %
5,0 %
10,0 %
15,0 %
20,0 %
25,0 %
30,0 %
Inno
vatio
n —
Cap
abilitie
s —
Firm —
Perfo
rman
ce —
Com
petitive
adva
ntag
e —
—
Res
ource-
base
d view
——
Knowledg
e —
Man
agem
ent —
Dyn
amic cap
abilit
ies —
—
Strategies
—
Techn
olog
y —
Indu
stry
—
Persp
ectiv
e —
Mod
els —
R&D
—
Produ
ct d
evelop
men
t ——
Absor
ptive
capa
city —
—
Net
wor
ks —
1992–1997
1998–2003
2004–2009
10,0 %
12,3 %
20,5 %
10,1 %
3,8 %5,8 %
10,0 %
8,2 %
0 %
5 %
10 %
15 %
20 %
Dynamic
capabilities
Absorptive
capacity
Models Industry
1998–2003
2004–2009
5,8 % 6,1 %
3,8 %
0,7 %0,5 % 0,7 %1,2 %
7,7 %
0 %
2 %
4 %
6 %
8 %
Dynamic
capabilities
Product
development
Networks Absorptive
capacity
1992–1997
1998–2003
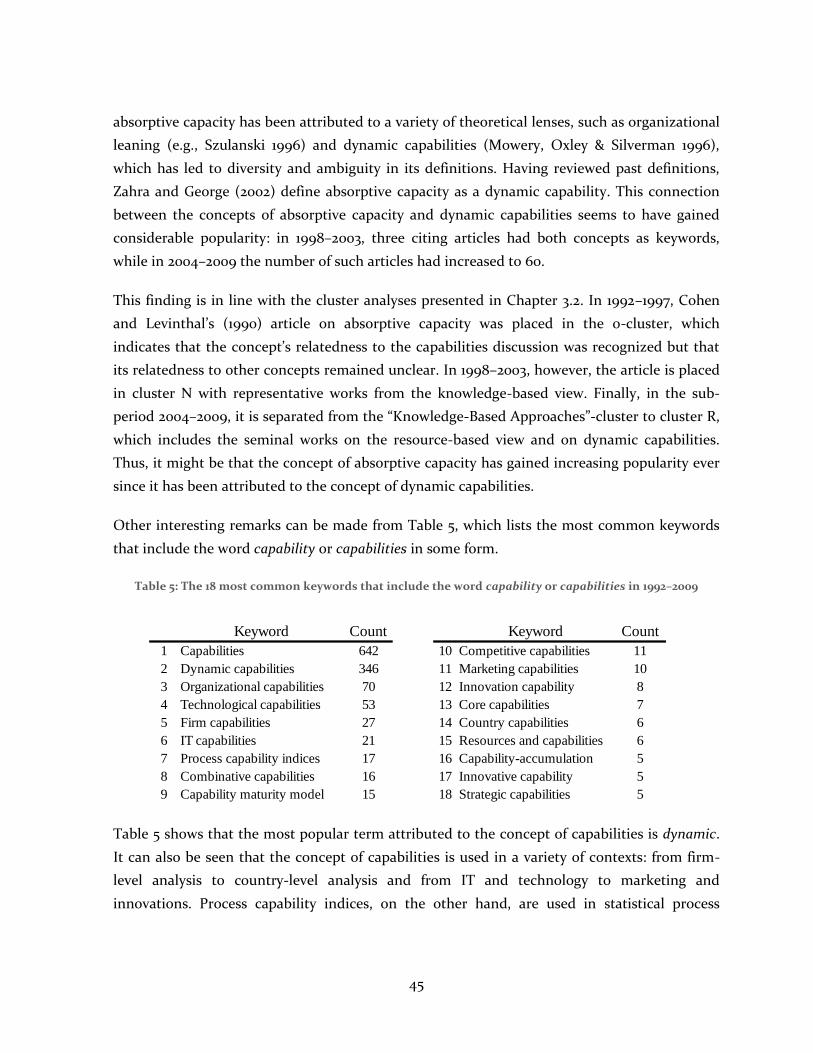
45
absorptive capacity has been attributed to a variety of theoretical lenses, such as organizational
leaning (e.g., Szulanski 1996) and dynamic capabilities (Mowery, Oxley & Silverman 1996),
which has led to diversity and ambiguity in its definitions. Having reviewed past definitions,
Zahra and George (2002) define absorptive capacity as a dynamic capability. This connection
between the concepts of absorptive capacity and dynamic capabilities seems to have gained
considerable popularity: in 1998–2003, three citing articles had both concepts as keywords,
while in 2004–2009 the number of such articles had increased to 60.
This finding is in line with the cluster analyses presented in Chapter 3.2. In 1992–1997, Cohen
and Levinthal’s (1990) article on absorptive capacity was placed in the 0-cluster, which
indicates that the concept’s relatedness to the capabilities discussion was recognized but that
its relatedness to other concepts remained unclear. In 1998–2003, however, the article is placed
in cluster N with representative works from the knowledge-based view. Finally, in the sub-
period 2004–2009, it is separated from the “Knowledge-Based Approaches”-cluster to cluster R,
which includes the seminal works on the resource-based view and on dynamic capabilities.
Thus, it might be that the concept of absorptive capacity has gained increasing popularity ever
since it has been attributed to the concept of dynamic capabilities.
Other interesting remarks can be made from Table 5, which lists the most common keywords
that include the word capability or capabilities in some form.
Table 5: The 18 most common keywords that include the word capability or capabilities in 1992–2009
Table 5 shows that the most popular term attributed to the concept of capabilities is dynamic.
It can also be seen that the concept of capabilities is used in a variety of contexts: from firm-
level analysis to country-level analysis and from IT and technology to marketing and
innovations. Process capability indices, on the other hand, are used in statistical process
Keyword Count Keyword Count
1 Capabilities 642 10 Competitive capabilities 11
2 Dynamic capabilities 346 11 Marketing capabilities 10
3 Organizational capabilities 70 12 Innovation capability 8
4 Technological capabilities 53 13 Core capabilities 7
5 Firm capabilities 27 14 Country capabilities 6
6 IT capabilities 21 15 Resources and capabilities 6
7 Process capability indices 17 16 Capability-accumulation 5
8 Combinative capabilities 16 17 Innovative capability 5
9 Capability maturity model 15 18 Strategic capabilities 5
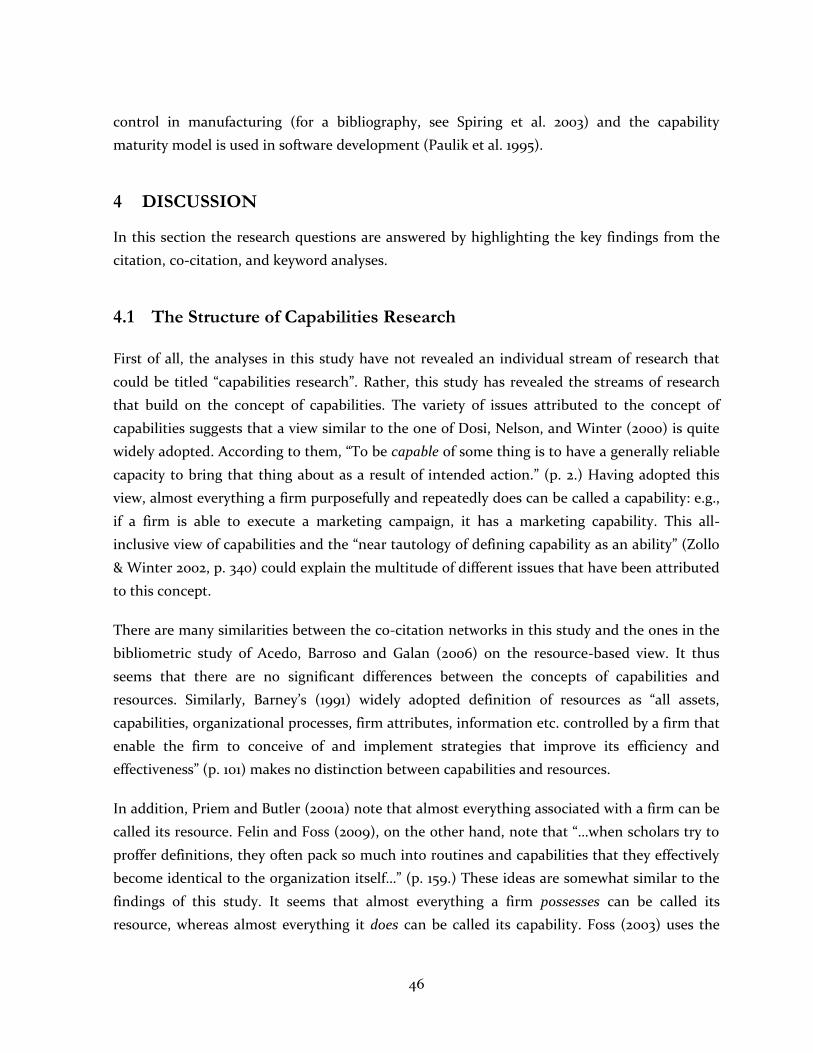
46
control in manufacturing (for a bibliography, see Spiring et al. 2003) and the capability
maturity model is used in software development (Paulik et al. 1995).
4 DISCUSSION
In this section the research questions are answered by highlighting the key findings from the
citation, co-citation, and keyword analyses.
4.1 The Structure of Capabilities Research
First of all, the analyses in this study have not revealed an individual stream of research that
could be titled “capabilities research”. Rather, this study has revealed the streams of research
that build on the concept of capabilities. The variety of issues attributed to the concept of
capabilities suggests that a view similar to the one of Dosi, Nelson, and Winter (2000) is quite
widely adopted. According to them, “To be capable of some thing is to have a generally reliable
capacity to bring that thing about as a result of intended action.” (p. 2.) Having adopted this
view, almost everything a firm purposefully and repeatedly does can be called a capability: e.g.,
if a firm is able to execute a marketing campaign, it has a marketing capability. This all-
inclusive view of capabilities and the “near tautology of defining capability as an ability” (Zollo
& Winter 2002, p. 340) could explain the multitude of different issues that have been attributed
to this concept.
There are many similarities between the co-citation networks in this study and the ones in the
bibliometric study of Acedo, Barroso and Galan (2006) on the resource-based view. It thus
seems that there are no significant differences between the concepts of capabilities and
resources. Similarly, Barney’s (1991) widely adopted definition of resources as “all assets,
capabilities, organizational processes, firm attributes, information etc. controlled by a firm that
enable the firm to conceive of and implement strategies that improve its efficiency and
effectiveness” (p. 101) makes no distinction between capabilities and resources.
In addition, Priem and Butler (2001a) note that almost everything associated with a firm can be
called its resource. Felin and Foss (2009), on the other hand, note that “…when scholars try to
proffer definitions, they often pack so much into routines and capabilities that they effectively
become identical to the organization itself…” (p. 159.) These ideas are somewhat similar to the
findings of this study. It seems that almost everything a firm possesses can be called its
resource, whereas almost everything it does can be called its capability. Foss (2003) uses the
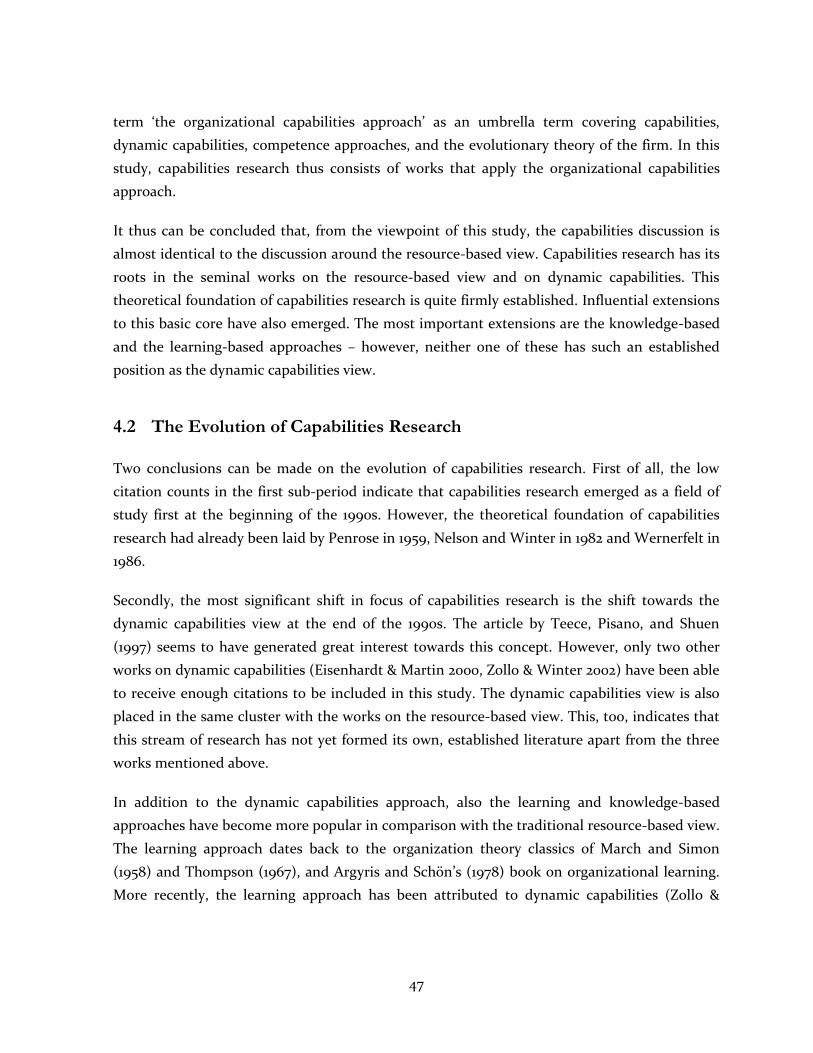
47
term ‘the organizational capabilities approach’ as an umbrella term covering capabilities,
dynamic capabilities, competence approaches, and the evolutionary theory of the firm. In this
study, capabilities research thus consists of works that apply the organizational capabilities
approach.
It thus can be concluded that, from the viewpoint of this study, the capabilities discussion is
almost identical to the discussion around the resource-based view. Capabilities research has its
roots in the seminal works on the resource-based view and on dynamic capabilities. This
theoretical foundation of capabilities research is quite firmly established. Influential extensions
to this basic core have also emerged. The most important extensions are the knowledge-based
and the learning-based approaches – however, neither one of these has such an established
position as the dynamic capabilities view.
4.2 The Evolution of Capabilities Research
Two conclusions can be made on the evolution of capabilities research. First of all, the low
citation counts in the first sub-period indicate that capabilities research emerged as a field of
study first at the beginning of the 1990s. However, the theoretical foundation of capabilities
research had already been laid by Penrose in 1959, Nelson and Winter in 1982 and Wernerfelt in
1986.
Secondly, the most significant shift in focus of capabilities research is the shift towards the
dynamic capabilities view at the end of the 1990s. The article by Teece, Pisano, and Shuen
(1997) seems to have generated great interest towards this concept. However, only two other
works on dynamic capabilities (Eisenhardt & Martin 2000, Zollo & Winter 2002) have been able
to receive enough citations to be included in this study. The dynamic capabilities view is also
placed in the same cluster with the works on the resource-based view. This, too, indicates that
this stream of research has not yet formed its own, established literature apart from the three
works mentioned above.
In addition to the dynamic capabilities approach, also the learning and knowledge-based
approaches have become more popular in comparison with the traditional resource-based view.
The learning approach dates back to the organization theory classics of March and Simon
(1958) and Thompson (1967), and Argyris and Schön’s (1978) book on organizational learning.
More recently, the learning approach has been attributed to dynamic capabilities (Zollo &
48
Winter 2002). The knowledge-based approach has emerged more recently and all of its most
representative works have been published in the 1990s.
5 LIMITATIONS
The main limitation of a co-citation analysis is that an author may cite a document for multiple
reasons. Co-citation analysis predicts that most citations are made in order to agree with a
work and thus high co-citation strength would indicate high similarity of content between two
documents. However, an author may cite a document also in order to show disagreement with
its ideas. In this study this is partly the case with the works by Williamson (1975, 1985), which
are probably quite often cited as an antithesis for the resource-based view. Porter’s (1980, 1985)
industrial-organization books, on the other hand, seem to be among the most cited works
because of their vast influence on all strategic management research (Nerur, Rasheed &
Natarajan 2008).
Another limitation of bibliometric techniques is that they only focus on the most cited
documents. Because older documents have been exposed to the scientific community for a
longer time they are more likely to be cited. Thus, the most recent developments of capabilities
research are not covered in this study. However, as Ramos-Rodríguez and Ruíz-Navarro (2004)
note, citation count can be considered rather a sign of influence than of quality. Thus, an
analysis based on citation counts is a good way to reveal the intellectual bases of a discipline.
Some limitations also result from the research design of this study. The results have been
influenced by, for example, the journals chosen to be included in the study, the division of the
overall time period into four sub-periods, the algorithms used for generating the clusters of
articles and their network pictures, the chosen cut-off values for the normalized co-citation
strengths, and the search word capabilit* used in searching for the articles in ISI Web of
Science. Due to an easy access through ISI Web of Science, only citations in journal articles
have been analyzed – thus leaving out citations made in books, congress proceedings, and
doctoral theses, for example.
All of these subjective choices also violate the objectivity principle of a bibliometric study.
Some of the limitations mentioned above have no solution (Ramos-Rodríguez & Ruíz-Navarro
2004). The other limitations have been approached by following earlier studies. No conclusions
have been made based on unreliable findings such as the co-citation network of the first sub-
period (1986–1991).
49
6 CONCLUSIONS
Because of the wide range of topics that are placed within capabilities research, the results
obtained in this study are rather general. Now that a wide picture of the use of the concept of
capabilities has been drawn, it would be of value to focus more specifically on some of the
topics within capabilities research. These include, for example, the concepts of dynamic
capabilities, absorptive capacity, and combinative capabilities. Additionally, it would be
interesting to further delve into different forms of capabilities such as marketing, innovation,
or product development capabilities. A bibliometric analysis concentrating specifically on
dynamic capabilities, for example, would be suitable for identifying the origins and more recent
developments of this rapidly growing research stream. A large share of the most cited works in
capabilities research are conceptual and a review of empirical capabilities research would be of
value, too.
The research questions in this study were: “What are the most important academic
publications in capabilities research?” and “How has the focus of capabilities research evolved
between 1986 and 2009?” Looking back at the results of this study, it could be argued that the
bibliometric techniques used may not have been the most appropriate for answering these
questions. If the term ‘capabilities research’ is used to refer to conceptual and empirical
research on capabilities per se, this research is not very well covered in this study. Since this
kind of research has not been very popular (Felin & Foss 2009), such works are not among the
most cited documents that have been analyzed here.
In contrast, this study has investigated to what kinds of topics the concept of capabilities has
been attributed in the past. This study has thus adopted a wide view on capabilities and the
term ‘capabilities research’ is used to refer to research that builds on the concept of capabilities.
This stream of research covers such topics as dynamic capabilities, organizational learning,
knowledge, and technological change. The analyses conducted in this study offer a rather
comprehensive view on the structure and evolution of this kind of research on capabilities.
50
REFERENCES
ACEDO, F. J., BARROSO, C. & GALAN, J. L. (2006). The resource-based theory: dissemination
and main trends. Strategic Management Journal, 27, 621–636.
AMBROSINI, V. & BOWMAN, C. (2009). What are dynamic capabilities and are they a useful
construct in strategic management? International Journal of Management Reviews, 11(1), 29–
49.
AMIT, R. & SCHOEMAKER, P. J. H. (1993). Strategic assets and organizational rent. Strategic
Management Journal, 14, 33–46.
ARENDT, R. A. & BROMILEY, P. (2009). Assessing the dynamic capabilities view: Spare change,
everyone? Strategic Organization, 7(1), 75–90.
ARGYRIS, C. & SCHÖN, D. A. (1978). Organizational Learning. Addison-Wesley: Reading, MA.
ARMSTRONG, C. E. & SHIMIZU, K. (2007). A review of approaches to empirical research on
the resource-based view of the firm. Journal of Management, 33(6), 959–986.
BARNEY, J. B. (1986). Strategic factor markets: expectations, luck, and business strategy.
Management Science, 32(10), 1231–1241.
BARNEY, J. B. (1991). Firm resources and sustained competitive advantage. Journal of
Management, 17(1), 99–120.
BARNEY, J. B. (2001). Is the resource-based “view” a useful perspective for strategic
management? Yes. Academy of Management Review, 26(1), 41–56.
BATAGELJ, V. & MRVAR, A. (2009). Pajek 1.24. [Available at http://vlado.fmf.uni-
lj.si/pub/networks/pajek/]
BAUMGARTNER, H. & PIETERS, R. (2003). The structural influence of marketing journals: A
citation analysis of the discipline and its subareas over time. Journal of Marketing, 67, 123–
139.
BECKER, M. C. (2004). Organizational routines: a review of the literature. Industrial and
Corporate Change, 13(4), 643–677.
BELL, P. C. (1985). Visual Interactive Modelling in Operational Research: Successes and
Opportunities. The Journal of the Operational Research Society, 36(11), 975–982.
BORGATTI, S. P., EVERETT, M. G. & FREEMAN, L. C. (2002). Ucinet for Windows: Software for
Social Network Analysis. Harvard, MA: Analytic Technologies.
BROADUS, R. N. (1987). Toward a definition of “bibliometrics.” Scientometrics, 12(5–6), 373–
379.
51
CAHLIK, T. (2000). Search for fundamental articles in economics. Scientometrics, 49(3), 389–
402.
CLARK, K. B. & FUJIMOTO, T. (1991). Product Development Performance: Strategy,
Organization, and Management in the World Auto Industry. Harvard Business School Press:
Boston, MA.
COHEN, W. M. & LEVINTHAL, D. A. (1990). Absorptive capacity: A new perspective on
learning and innovation. Administrative Science Quarterly, 35, 128–152.
COLLIS, D. J. (1994). Research note: How valuable are organizational capabilities? Strategic
Management Journal, 15, 143–152.
CULNAN, M. J. & SWANSON, E. B. (1986). Research in management information systems,
1980-1984: Points of work and reference. MIS Quarterly, 10(3), 289-302.
CYERT, R. M. & MARCH, J. G. (1963). A Behavioral Theory of the Firm. Prentice-Hall:
Englewood Cliffs, NJ.
DAFT, R. (1983). Organization theory and design. West: New York.
DAY, G. S. (1994). The capabilities of market-driven organizations. Journal of Marketing, 58(4),
37–52.
DIERICKX, I. & COOL, K. (1989). Asset stock accumulation and sustainability of competitive
advantage. Management Science, 35(12), 1504–1511.
DOSI, G. R., NELSON, R. R. & WINTER, S. G. (2000). Introduction: The nature and dynamics of
organizational capabilities. In G. R. Dosi, R. R. Nelson & S. G. Winter (Eds.), The Nature and
Dynamics of Organizational Capabilities. Oxford University Press: Oxford.
DYER, J. H. & SINGH, H. (1998). The relational view: Cooperative strategy and sources of
interorganizational competitive advantage. Academy of Management Review, 23(4), 660–
679.
EASTERBY-SMITH, M., LYLES, M. A. & PETERAF, M. A. (2009). Dynamic capabilities: Current
debates and future directions. British Journal of Management, 20, S1–S8.
EISENHARDT, K. M. & MARTIN, J. A. (2000). Dynamic capabilities: What are they? Strategic
Management Journal, 21, 1105–1121.
EISENHARDT, K. M. (1989). Building theories from case-study research. Academy of
Management Review, 14(4), 532–550.
FELIN, T. & FOSS, N. J. (2009). Organizational routines and capabilities: Historical drift and a
course-correction toward microfoundations. Scandinavian Journal of Management, 25, 157–
167.
52
FOSS, N. J. (2003). Bounded rationality and tacit knowledge in the organizational capabilities
approach: An evaluation and a stock-taking. Industrial and Corporate Change, 12, 185–201.
GMÜR, M. (2003). Co-citation analysis and the search for invisible colleges: A methodological
evaluation. Scientometrics, 57(1), 27–57.
GRANT, R. M. (1991). The resource-based view theory of competitive advantage: implications
for strategy formulation. California Management Review, 33(3), 114–135.
GRANT, R. M. (1996a). Prospering in dynamically-competitive environments: Organizational
capability as knowledge integration. Organization Science, 7(4), 375–387.
GRANT, R. M. (1996b). Toward a knowledge-based theory of the firm. Strategic Management
Journal, 17(Winter Special Issue), 109–122.
HAYES, R. H., WHEELWRIGHT, S. C. (1984). Restoring Our Competitive Edge: Competing
Through Manufacturing. Wiley: New York.
HAYES, R. H., WHEELRIGHT, S. C. & CLARK, K. B. (1988). Dynamic Manufacturing. The Free
Press: New York.
HENDERSON, R. M. & CLARK, K. B. (1990). Architectural innovation: The reconfiguration of
existing product technologies and the failure of established firms. Administrative Science
Quarterly, 35, 9–30.
HENDERSON, R. M. & COCKBURN, I. (1994). Measuring competence? Exploring firm effects in
pharmaceutical research. Strategic Management Journal, 15, 63–84.
HOFFMAN, D. L. & HOLBROOK, M. B. (1993). The intellectual structure of consumer research:
A bibliometric study of author cocitations in the first 15 years of the Journal of Consumer
Research. Journal of Consumer Research, 19(4), 505–517.
ISI Journal Citation Report, Social Science 2008 Edition. [Available at www.isiknowledge.com]
ITAMI, H. & ROEHL, T. (1987). Mobilizing Invisible Assets. Harvard University Press:
Cambridge, MA.
JACOBIDES, M. G. & WINTER, S. G. (2005). The co-evolution of capabilities and transaction
costs: Explaining the institutional structure of production. Strategic Management Journal,
26, 395–413.
JACOBIDES, M. G. (2006). The architecture and design of organizational capabilities. Industrial
and Corporate Change, 15(1), 151–171.
JÄRVINEN, J. M. J. & SILLANPÄÄ, A. K. (2007). The evolution of evolution: A bibliometric study
on evolutionary research, Helsinki University of Technology, Espoo.
KOGUT, B. & ZANDER, U. (1992). Knowledge of the firm, combinative capabilities, and the
replication of technology. Organization Science, 3(3), 383–397.
53
LAWRENCE, P. R. & LORSCH, J. W. (1967). Organization and Environment: Managing
Differentiation and Integration. Irwin: Homewood, IL.
LEONARD-BARTON, D. (1992). Core capabilities and core rigidities: A paradox in managing
new product development. Strategic Management Journal, 13, 111–125.
LEVINTHAL, D. A. & MARCH, J. G. (1993). The myopia of learning. Strategic Management
Journal, 14, 95–112.
LEVITT, B. & MARCH, J. G. (1988). Organizational learning. Annual Review of Sociology, 14,
319–340.
LIPPMAN, S. A. & RUMELT, R. P. (1982). Uncertain imitability: An analysis of interfirm
differences in efficiency under competition. The Bell Journal of Economics, 13(2), 418–438.
MARCH, J. G. & SIMON, H. A. (1958). Organizations. Wiley: New York.
MARCH, J. G. (1991). Exploration and exploitation in organizational learning. Organization
Science, 2(1), 71–87.
MARTINSONS, M. G., EVERETT, J. E. & CHAN, K. (2001). Mapping the scholarly development
of strategic management. Journal of Information Science, 27(2), 101–110.
MOWERY, D. C., OXLEY, J. E. & SILVERMAN, B. S. (1996). Strategic alliances and interfirm
knowledge transfer. Strategic Management Journal, 17(Winter Special Issue), 77–91.
NELSON, R. R. & WINTER, S. G. (1982). An Evolutionary Theory of Economic Change. Harvard
University Press: Cambridge, MA.
NERUR, S. P., RASHEED, A. A. & NATARAJAN, V. (2008). The intellectual structure of the
strategic management field: An author co-citation analysis. Strategic Management Journal,
29, 319–336.
NEWBERT, S. L. (2007). Empirical research on the resource-based view of the firm: An
assessment and suggestions for future research. Strategic Management Journal, 28, 121–156.
NONAKA I. & TAKEUCHI, H. (1995). The Knowledge-Creating Company. Oxford University
Press: New York.
NONAKA, I. (1994). A dynamic theory of organizational knowledge creation. Organization
Science, 5(1), 14–37.
PAULIK, M. C., WEBER, C. V., CURTIS, B. & CHRISSIS, M. B. (1995). The Capability Maturity
Model: Guidelines for Improving the Software Process. Addison-Wesley: Boston.
PENG, D. X., SCHROEDER, R. G. & SHAH, R. (2008). Linking routines to operations
capabilities: A new perspective. Journal of Operations Management, 26, 730–748.
PENROSE, E. T. (1959). The Theory of the Growth of the Firm. Basil Blackwell: Oxford.
54
PETERAF, M. A. (1993). The cornerstones of competitive advantage: A resource-based view.
Strategic Management Journal, 14, 179–191.
PILKINGTON, A. & LISTON-HEYES, C. (1999). Is production and operations management a
discipline? A citation/co-citation study. International Journal of Operations & Production
Management, 19(1), 7–20.
PILKINGTON, A. & MEREDITH, J. (2009). The evolution of the intellectual structure of
operations management—1980–2006: A citation/co-citation analysis. Journal of Operations
Management, 27, 185–202.
PONZI, L. J. (2002). The intellectual structure and interdisciplinary breadth of Knowledge
Management: A bibliometric study of its early stage of development. Scientometrics, 55(2),
259–272.
PORTER, M. E. (1980). Competitive Strategy. Free Press: New York.
PORTER, M. E. (1985). Competitive Advantage. Free Press: New York.
PRAHALAD, C. K. & HAMEL, G. (1990). The core competence of the corporation. Harvard
Business Review, May–June, 79–91.
PRIEM, R. L. & BUTLER, J. E. (2001a). Is the resource-based “view” a useful perspective for
strategic management research? Academy of Management Review, 26(1), 22–40.
PRIEM, R. L. & BUTLER, J. E. (2001b). Tautology in the resource-based view and the
implications of externally determined resource value: Further comments. Academy of
Management Review, 26(1), 57–66.
PRITCHARD, A. (1969). Statistical bibliography or bibliometrics? Journal of Documentation, 25,
348–349.
RAMOS-RODRÍGUEZ, A.-R. & RUÍZ-NAVARRO, J. (2004). Changes in the intellectual
structure of strategic management research: A bibliometric study of the Strategic
Management Journal, 1980–2000. Strategic Management Journal, 25, 981–1004.
SCHILDT, H. A. & MATTSSON, J. T. (2006). A dense network sub-grouping algorithm for co-
citation analysis and its implementation in the software tool Sitkis. Scientometrics, 67(1),
143–163.
SCHILDT, H. A. (2004). SITKIS: Software for Bibliometric Data Management and Analysis v1.0.
MANUAL. Helsinki University of Technology: Institute of Strategy and International
Business. [Available at: www.hut.fi/~hschildt/sitkis]
SCHILDT, H. A. (2005). SITKIS: Software for Bibliometric Data Management and Analysis v1.5.
Helsinki University of Technology: Institute of Strategy and International Business.
[Available at: www.hut.fi/~hschildt/sitkis]
55
SCHILDT, H. A., ZAHRA, S. A. & SILLANPÄÄ, A. (2006). Scholarly communities in
entrepreneurship research: A co-citation analysis. Entrepreneurship Theory and Practice,
30(3), 399–415.
SCOTT, J. (2000). Social Network Analysis: A Handbook. Sage Publications: Thousand Oaks,
CA.
SMALL, H. (1973). Co-citation in the scientific literature: A new measure of the relationship
between two documents. Journal of the American Society for Information Science, 24(4),
265–269.
SPIRING, F., LEUNG, B., CHENG, S. & YEUNG, A. (2003). A bibliography of process capability
papers. Quality and Reliability Engineering International, 19, 445–460.
STALK, G., EVANS, P. & SHULMAN, L. E. (1992). Competing on capabilities: The new rules of
corporate strategy. Harvard Business Review, March–April, 57–69.
SZULANSKI, G. (1996). Exploring internal stickness: Impediments to the transfer of best
practice within the firm. Strategic Management Journal, 17(Winter Special Issue), 27–43.
TEECE, D. J. (1986). Profiting from technological innovation: Implications for integration,
collaboration, licensing and public policy. Research Policy, 15, 285–305.
TEECE, D. J., Pisano, G. & Shuen, A. (1997). Dynamic capabilities and strategic management.
Strategic Management Journal, 18(7), 509–533.
THOMPSON, J. D. (1967). Organizations in Action. McGraw-Hill: New York.
TUSHMAN, M. L. & ANDERSON, P. (1986). Technological discontinuities and organizational
environments. Administrative Science Quarterly, 31, 439–465.
WANG, C. L. & AHMED, P. K. (2007). Dynamic capabilities: A review and research agenda.
International Journal of Management Reviews, 9(1), 31–51.
WERNERFELT, B. (1984). A resource-based view of the firm. Strategic Management Journal, 5,
171–180.
WHEELWRIGHT, S. C. & CLARK, K. B. (1992). Revolutionizing Product Development. Free
Press: New York.
WHITE, H. D. & MCCAIN, K. W. (1989). Bibliometrics. In M. E. Williams (Ed.), Annual Review
of Information Science and Technology, Volume 24. Elsevier: Amsterdam.
WILLIAMSON, O. E. (1975). Markets and Hierarchies: Analysis and Antitrust Implications. Free
Press: New York.
WILLIAMSON, O. E. (1985). The Economic Institutions of Capitalism: Firms, Markets,
Relational Contracting. Free Press: New York.
56
WILLIAMSON, O. E. (1991). Strategizing, economizing, and economic organization. Strategic
Management Journal, 12(Winter Special Issue), 75–94.
WILLIAMSON, O. E. (1999). Strategy research: Governance and competence perspectives.
Strategic Management Journal, 20, 1087–1108.
WINTER, S. G. (1987). Knowledge and competence as strategic assets. In D. J. Teece (Ed.), The
Competitive Challenge: Strategies for Industrial Innovation and Renewal. Harper & Row: New
York.
WINTER, S. G. (2003). Understanding dynamic capabilities. Strategic Management Journal, 24,
991–995.
ZAHRA, S. A. & GEORGE, G. (2002). Absorptive capacity: A review, reconceptualization, and
extension. Academy of Management Review, 27(2), 185–203.
ZANDER, U. & KOGUT, B. (1995). Knowledge and the speed of transfer and imitation of
organizational capabilities: An empirical test. Organization Science, 6(1), 76–92.
ZOLLO, M. & WINTER, S. G. (2002). Deliberate learning and the evolution of dynamic
capabilities. Organization Science, 13(3), 339–351.
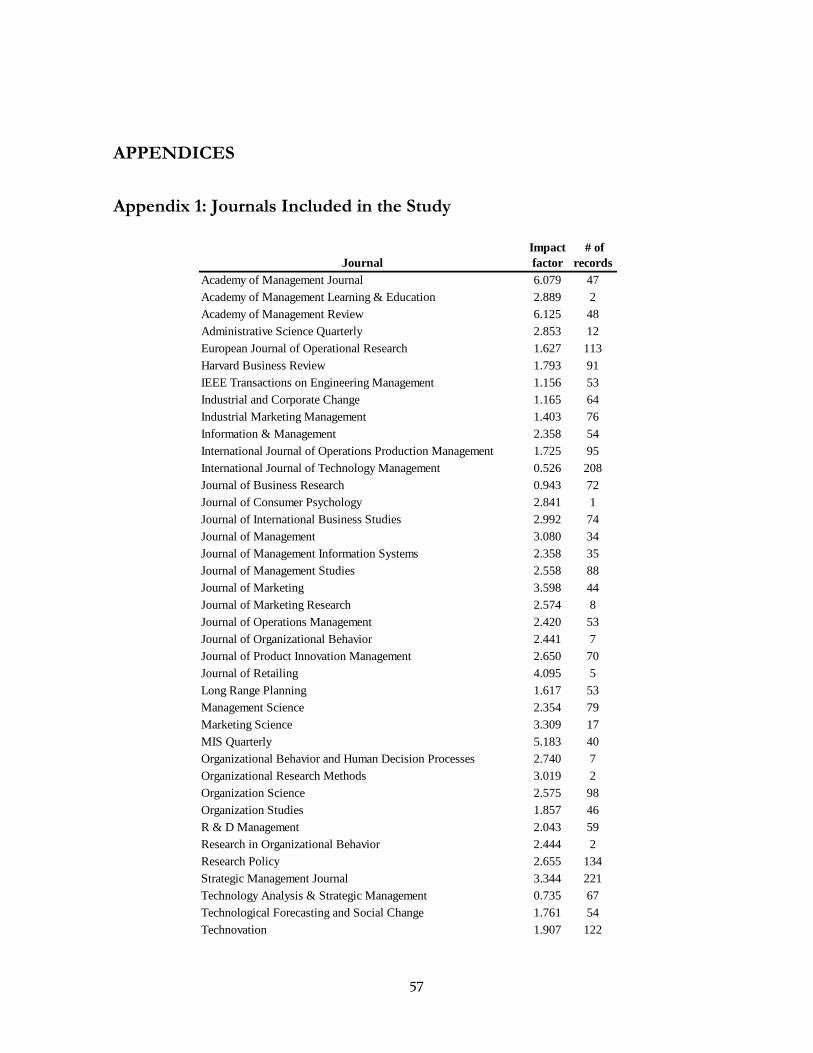
57
APPENDICES
Appendix 1: Journals Included in the Study
Journal
Impact
factor
# of
records
Academy of Management Journal 6.079 47
Academy of Management Learning & Education 2.889 2
Academy of Management Review 6.125 48
Administrative Science Quarterly 2.853 12
European Journal of Operational Research 1.627 113
Harvard Business Review 1.793 91
IEEE Transactions on Engineering Management 1.156 53
Industrial and Corporate Change 1.165 64
Industrial Marketing Management 1.403 76
Information & Management 2.358 54
International Journal of Operations Production Management 1.725 95
International Journal of Technology Management 0.526 208
Journal of Business Research 0.943 72
Journal of Consumer Psychology 2.841 1
Journal of International Business Studies 2.992 74
Journal of Management 3.080 34
Journal of Management Information Systems 2.358 35
Journal of Management Studies 2.558 88
Journal of Marketing 3.598 44
Journal of Marketing Research 2.574 8
Journal of Operations Management 2.420 53
Journal of Organizational Behavior 2.441 7
Journal of Product Innovation Management 2.650 70
Journal of Retailing 4.095 5
Long Range Planning 1.617 53
Management Science 2.354 79
Marketing Science 3.309 17
MIS Quarterly 5.183 40
Organizational Behavior and Human Decision Processes 2.740 7
Organizational Research Methods 3.019 2
Organization Science 2.575 98
Organization Studies 1.857 46
R & D Management 2.043 59
Research in Organizational Behavior 2.444 2
Research Policy 2.655 134
Strategic Management Journal 3.344 221
Technology Analysis & Strategic Management 0.735 67
Technological Forecasting and Social Change 1.761 54
Technovation 1.907 122
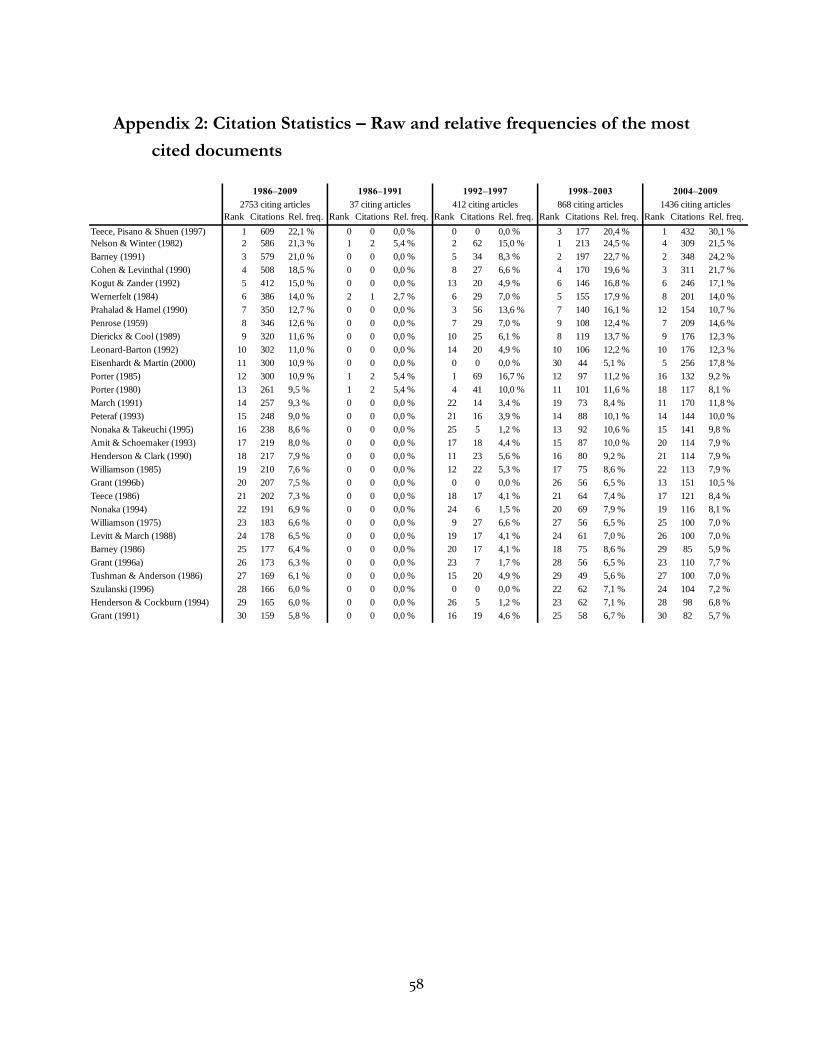
58
Appendix 2: Citation Statistics – Raw and relative frequencies of the most
cited documents
Rank Citations Rel. freq. Rank Citations Rel. freq. Rank Citations Rel. freq. Rank Citations Rel. freq. Rank Citations Rel. freq.
Teece, Pisano & Shuen (1997) 1 609 22,1 % 0 0 0,0 % 0 0 0,0 % 3 177 20,4 % 1 432 30,1 %
Nelson & Winter (1982) 2 586 21,3 % 1 2 5,4 % 2 62 15,0 % 1 213 24,5 % 4 309 21,5 %
Barney (1991) 3 579 21,0 % 0 0 0,0 % 5 34 8,3 % 2 197 22,7 % 2 348 24,2 %
Cohen & Levinthal (1990) 4 508 18,5 % 0 0 0,0 % 8 27 6,6 % 4 170 19,6 % 3 311 21,7 %
Kogut & Zander (1992) 5 412 15,0 % 0 0 0,0 % 13 20 4,9 % 6 146 16,8 % 6 246 17,1 %
Wernerfelt (1984) 6 386 14,0 % 2 1 2,7 % 6 29 7,0 % 5 155 17,9 % 8 201 14,0 %
Prahalad & Hamel (1990) 7 350 12,7 % 0 0 0,0 % 3 56 13,6 % 7 140 16,1 % 12 154 10,7 %
Penrose (1959) 8 346 12,6 % 0 0 0,0 % 7 29 7,0 % 9 108 12,4 % 7 209 14,6 %
Dierickx & Cool (1989) 9 320 11,6 % 0 0 0,0 % 10 25 6,1 % 8 119 13,7 % 9 176 12,3 %
Leonard-Barton (1992) 10 302 11,0 % 0 0 0,0 % 14 20 4,9 % 10 106 12,2 % 10 176 12,3 %
Eisenhardt & Martin (2000) 11 300 10,9 % 0 0 0,0 % 0 0 0,0 % 30 44 5,1 % 5 256 17,8 %
Porter (1985) 12 300 10,9 % 1 2 5,4 % 1 69 16,7 % 12 97 11,2 % 16 132 9,2 %
Porter (1980) 13 261 9,5 % 1 2 5,4 % 4 41 10,0 % 11 101 11,6 % 18 117 8,1 %
March (1991) 14 257 9,3 % 0 0 0,0 % 22 14 3,4 % 19 73 8,4 % 11 170 11,8 %
Peteraf (1993) 15 248 9,0 % 0 0 0,0 % 21 16 3,9 % 14 88 10,1 % 14 144 10,0 %
Nonaka & Takeuchi (1995) 16 238 8,6 % 0 0 0,0 % 25 5 1,2 % 13 92 10,6 % 15 141 9,8 %
Amit & Schoemaker (1993) 17 219 8,0 % 0 0 0,0 % 17 18 4,4 % 15 87 10,0 % 20 114 7,9 %
Henderson & Clark (1990) 18 217 7,9 % 0 0 0,0 % 11 23 5,6 % 16 80 9,2 % 21 114 7,9 %
Williamson (1985) 19 210 7,6 % 0 0 0,0 % 12 22 5,3 % 17 75 8,6 % 22 113 7,9 %
Grant (1996b) 20 207 7,5 % 0 0 0,0 % 0 0 0,0 % 26 56 6,5 % 13 151 10,5 %
Teece (1986) 21 202 7,3 % 0 0 0,0 % 18 17 4,1 % 21 64 7,4 % 17 121 8,4 %
Nonaka (1994) 22 191 6,9 % 0 0 0,0 % 24 6 1,5 % 20 69 7,9 % 19 116 8,1 %
Williamson (1975) 23 183 6,6 % 0 0 0,0 % 9 27 6,6 % 27 56 6,5 % 25 100 7,0 %
Levitt & March (1988) 24 178 6,5 % 0 0 0,0 % 19 17 4,1 % 24 61 7,0 % 26 100 7,0 %
Barney (1986) 25 177 6,4 % 0 0 0,0 % 20 17 4,1 % 18 75 8,6 % 29 85 5,9 %
Grant (1996a) 26 173 6,3 % 0 0 0,0 % 23 7 1,7 % 28 56 6,5 % 23 110 7,7 %
Tushman & Anderson (1986) 27 169 6,1 % 0 0 0,0 % 15 20 4,9 % 29 49 5,6 % 27 100 7,0 %
Szulanski (1996) 28 166 6,0 % 0 0 0,0 % 0 0 0,0 % 22 62 7,1 % 24 104 7,2 %
Henderson & Cockburn (1994) 29 165 6,0 % 0 0 0,0 % 26 5 1,2 % 23 62 7,1 % 28 98 6,8 %
Grant (1991) 30 159 5,8 % 0 0 0,0 % 16 19 4,6 % 25 58 6,7 % 30 82 5,7 %
2004–2009
1436 citing articles
1992–1997
412 citing articles
1998–2003
868 citing articles
1986–2009
2753 citing articles
1986–1991
37 citing articles
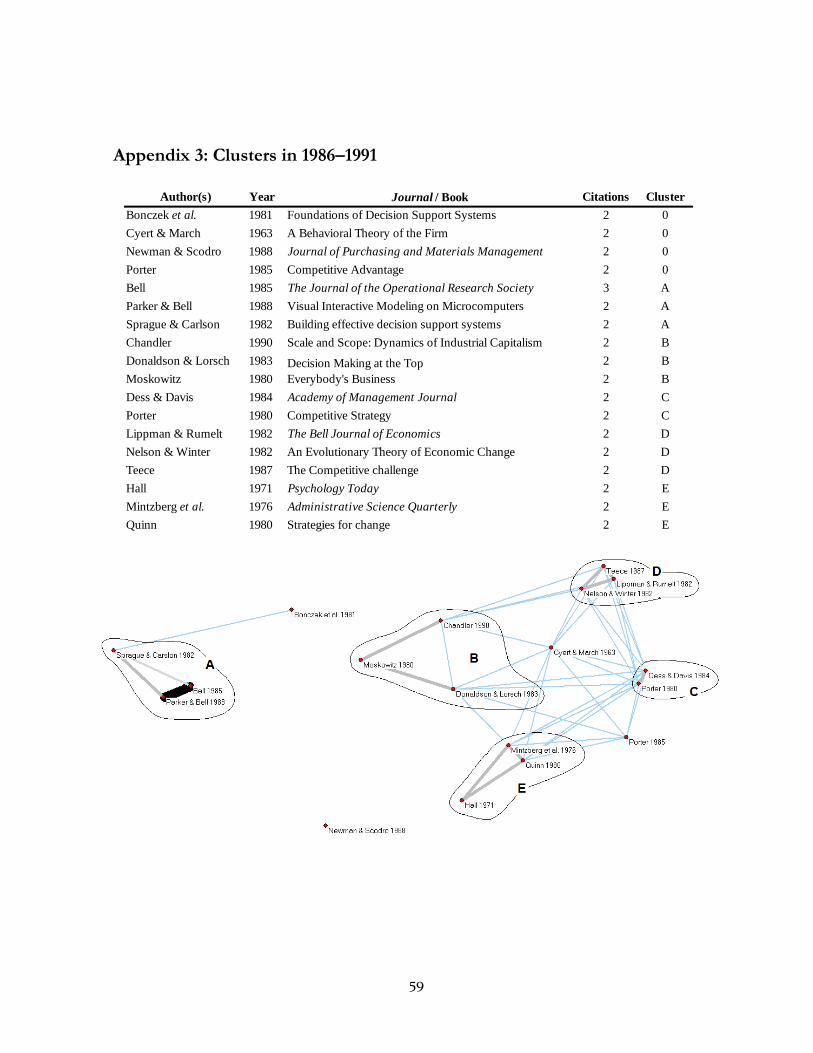
59
Appendix 3: Clusters in 1986–1991
Author(s) Year Journal / Book Citations Cluster
Bonczek et al. 1981 Foundations of Decision Support Systems 2 0
Cyert & March 1963 A Behavioral Theory of the Firm 2 0
Newman & Scodro 1988 Journal of Purchasing and Materials Management 2 0
Porter 1985 Competitive Advantage 2 0
Bell 1985 The Journal of the Operational Research Society 3 A
Parker & Bell 1988 Visual Interactive Modeling on Microcomputers 2 A
Sprague & Carlson 1982 Building effective decision support systems 2 A
Chandler 1990 Scale and Scope: Dynamics of Industrial Capitalism 2 B
Donaldson & Lorsch 1983 Decision Making at the Top 2 B
Moskowitz 1980 Everybody's Business 2 B
Dess & Davis 1984 Academy of Management Journal 2 C
Porter 1980 Competitive Strategy 2 C
Lippman & Rumelt 1982 The Bell Journal of Economics 2 D
Nelson & Winter 1982 An Evolutionary Theory of Economic Change 2 D
Teece 1987 The Competitive challenge 2 D
Hall 1971 Psychology Today 2 E
Mintzberg et al. 1976 Administrative Science Quarterly 2 E
Quinn 1980 Strategies for change 2 E
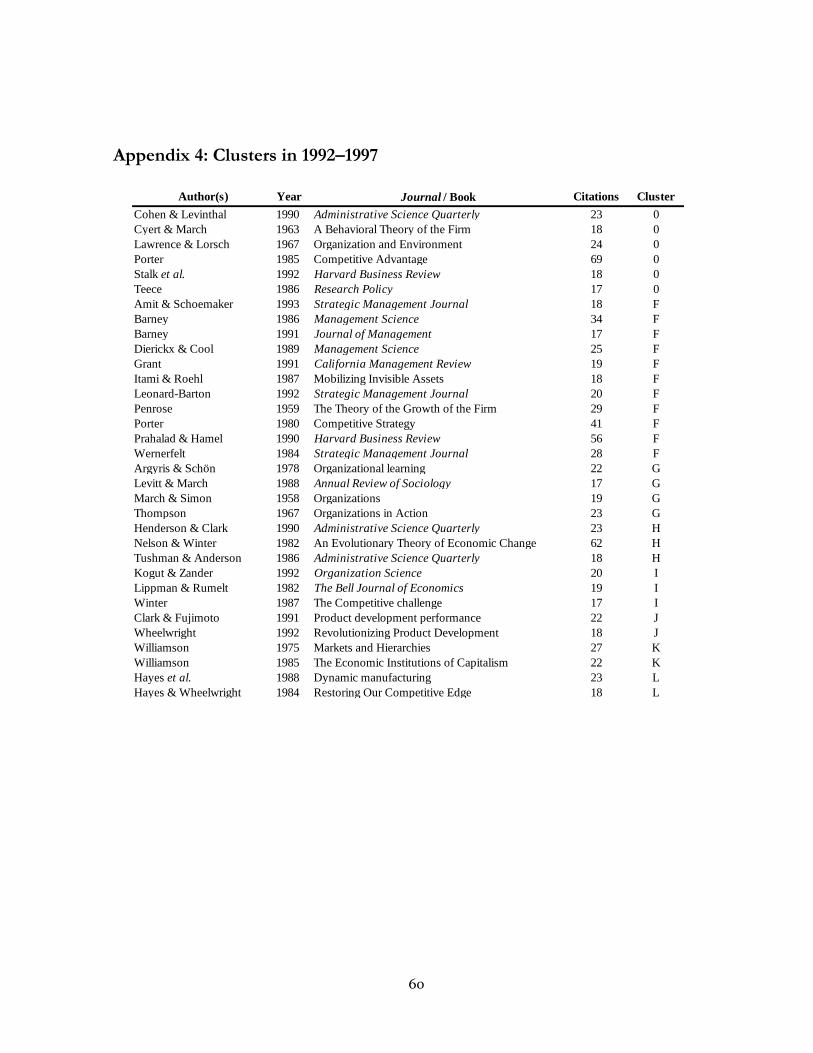
60
Appendix 4: Clusters in 1992–1997
Author(s) Year Journal / Book Citations Cluster
Cohen & Levinthal 1990 Administrative Science Quarterly 23 0
Cyert & March 1963 A Behavioral Theory of the Firm 18 0
Lawrence & Lorsch 1967 Organization and Environment 24 0
Porter 1985 Competitive Advantage 69 0
Stalk et al. 1992 Harvard Business Review 18 0
Teece 1986 Research Policy 17 0
Amit & Schoemaker 1993 Strategic Management Journal 18 F
Barney 1986 Management Science 34 F
Barney 1991 Journal of Management 17 F
Dierickx & Cool 1989 Management Science 25 F
Grant 1991 California Management Review 19 F
Itami & Roehl 1987 Mobilizing Invisible Assets 18 F
Leonard-Barton 1992 Strategic Management Journal 20 F
Penrose 1959 The Theory of the Growth of the Firm 29 F
Porter 1980 Competitive Strategy 41 F
Prahalad & Hamel 1990 Harvard Business Review 56 F
Wernerfelt 1984 Strategic Management Journal 28 F
Argyris & Schön 1978 Organizational learning 22 G
Levitt & March 1988 Annual Review of Sociology 17 G
March & Simon 1958 Organizations 19 G
Thompson 1967 Organizations in Action 23 G
Henderson & Clark 1990 Administrative Science Quarterly 23 H
Nelson & Winter 1982 An Evolutionary Theory of Economic Change 62 H
Tushman & Anderson 1986 Administrative Science Quarterly 18 H
Kogut & Zander 1992 Organization Science 20 I
Lippman & Rumelt 1982 The Bell Journal of Economics 19 I
Winter 1987 The Competitive challenge 17 I
Clark & Fujimoto 1991 Product development performance 22 J
Wheelwright 1992 Revolutionizing Product Development 18 J
Williamson 1975 Markets and Hierarchies 27 K
Williamson 1985 The Economic Institutions of Capitalism 22 K
Hayes et al. 1988 Dynamic manufacturing 23 L
Hayes & Wheelwright 1984 Restoring Our Competitive Edge 18 L
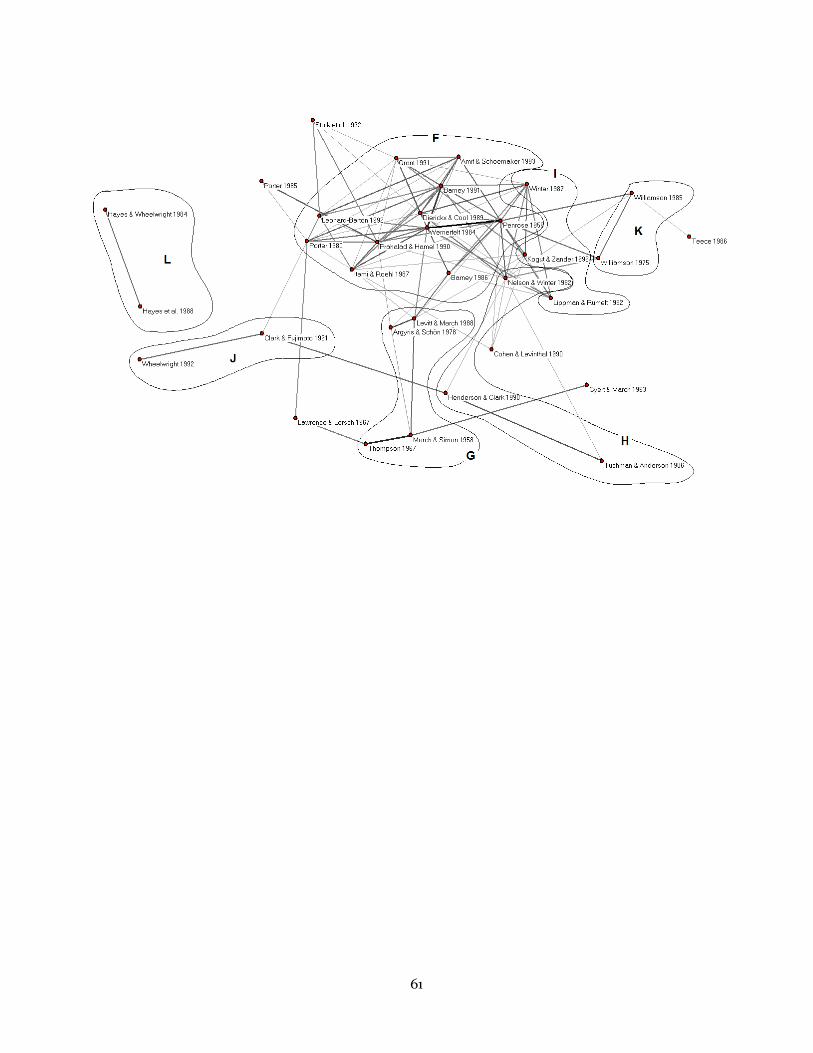
61
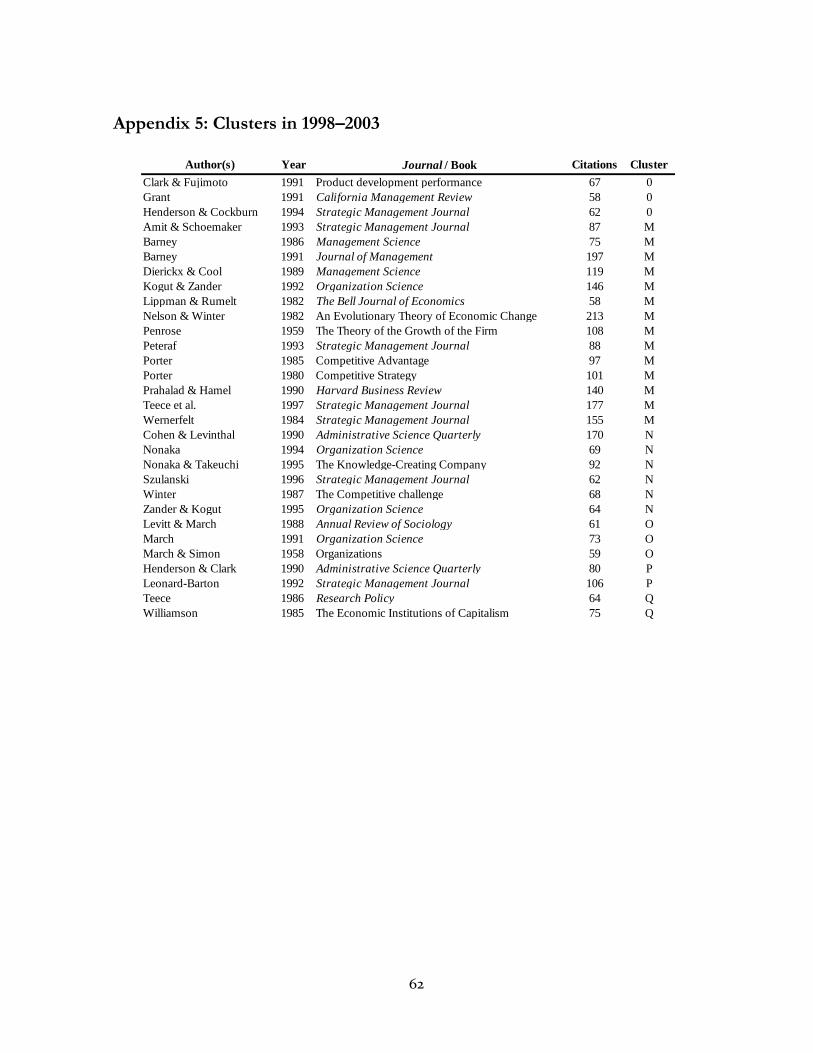
62
Appendix 5: Clusters in 1998–2003
Author(s) Year Journal / Book Citations Cluster
Clark & Fujimoto 1991 Product development performance 67 0
Grant 1991 California Management Review 58 0
Henderson & Cockburn 1994 Strategic Management Journal 62 0
Amit & Schoemaker 1993 Strategic Management Journal 87 M
Barney 1986 Management Science 75 M
Barney 1991 Journal of Management 197 M
Dierickx & Cool 1989 Management Science 119 M
Kogut & Zander 1992 Organization Science 146 M
Lippman & Rumelt 1982 The Bell Journal of Economics 58 M
Nelson & Winter 1982 An Evolutionary Theory of Economic Change 213 M
Penrose 1959 The Theory of the Growth of the Firm 108 M
Peteraf 1993 Strategic Management Journal 88 M
Porter 1985 Competitive Advantage 97 M
Porter 1980 Competitive Strategy 101 M
Prahalad & Hamel 1990 Harvard Business Review 140 M
Teece et al. 1997 Strategic Management Journal 177 M
Wernerfelt 1984 Strategic Management Journal 155 M
Cohen & Levinthal 1990 Administrative Science Quarterly 170 N
Nonaka 1994 Organization Science 69 N
Nonaka & Takeuchi 1995 The Knowledge-Creating Company 92 N
Szulanski 1996 Strategic Management Journal 62 N
Winter 1987 The Competitive challenge 68 N
Zander & Kogut 1995 Organization Science 64 N
Levitt & March 1988 Annual Review of Sociology 61 O
March 1991 Organization Science 73 O
March & Simon 1958 Organizations 59 O
Henderson & Clark 1990 Administrative Science Quarterly 80 P
Leonard-Barton 1992 Strategic Management Journal 106 P
Teece 1986 Research Policy 64 Q
Williamson 1985 The Economic Institutions of Capitalism 75 Q
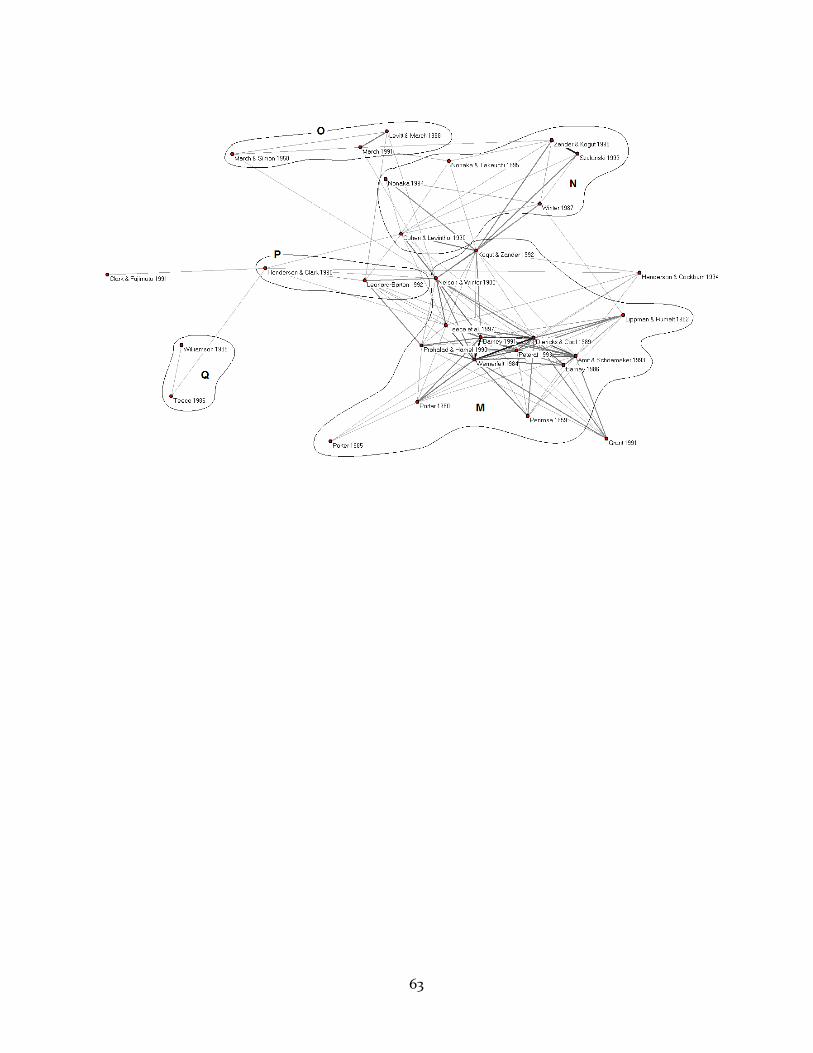
63
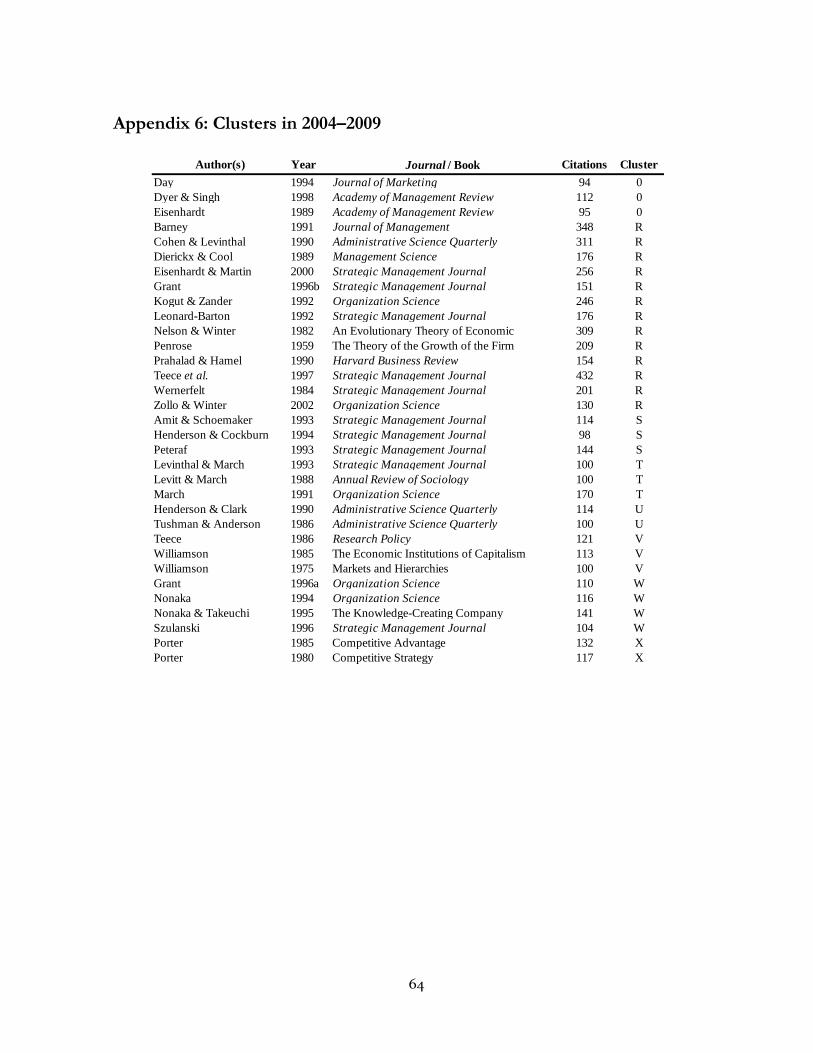
64
Appendix 6: Clusters in 2004–2009
Author(s) Year Journal / Book Citations Cluster
Day 1994 Journal of Marketing 94 0
Dyer & Singh 1998 Academy of Management Review 112 0
Eisenhardt 1989 Academy of Management Review 95 0
Barney 1991 Journal of Management 348 R
Cohen & Levinthal 1990 Administrative Science Quarterly 311 R
Dierickx & Cool 1989 Management Science 176 R
Eisenhardt & Martin 2000 Strategic Management Journal 256 R
Grant 1996b Strategic Management Journal 151 R
Kogut & Zander 1992 Organization Science 246 R
Leonard-Barton 1992 Strategic Management Journal 176 R
Nelson & Winter 1982 An Evolutionary Theory of Economic 309 R
Penrose 1959 The Theory of the Growth of the Firm 209 R
Prahalad & Hamel 1990 Harvard Business Review 154 R
Teece et al. 1997 Strategic Management Journal 432 R
Wernerfelt 1984 Strategic Management Journal 201 R
Zollo & Winter 2002 Organization Science 130 R
Amit & Schoemaker 1993 Strategic Management Journal 114 S
Henderson & Cockburn 1994 Strategic Management Journal 98 S
Peteraf 1993 Strategic Management Journal 144 S
Levinthal & March 1993 Strategic Management Journal 100 T
Levitt & March 1988 Annual Review of Sociology 100 T
March 1991 Organization Science 170 T
Henderson & Clark 1990 Administrative Science Quarterly 114 U
Tushman & Anderson 1986 Administrative Science Quarterly 100 U
Teece 1986 Research Policy 121 V
Williamson 1985 The Economic Institutions of Capitalism 113 V
Williamson 1975 Markets and Hierarchies 100 V
Grant 1996a Organization Science 110 W
Nonaka 1994 Organization Science 116 W
Nonaka & Takeuchi 1995 The Knowledge-Creating Company 141 W
Szulanski 1996 Strategic Management Journal 104 W
Porter 1985 Competitive Advantage 132 X
Porter 1980 Competitive Strategy 117 X
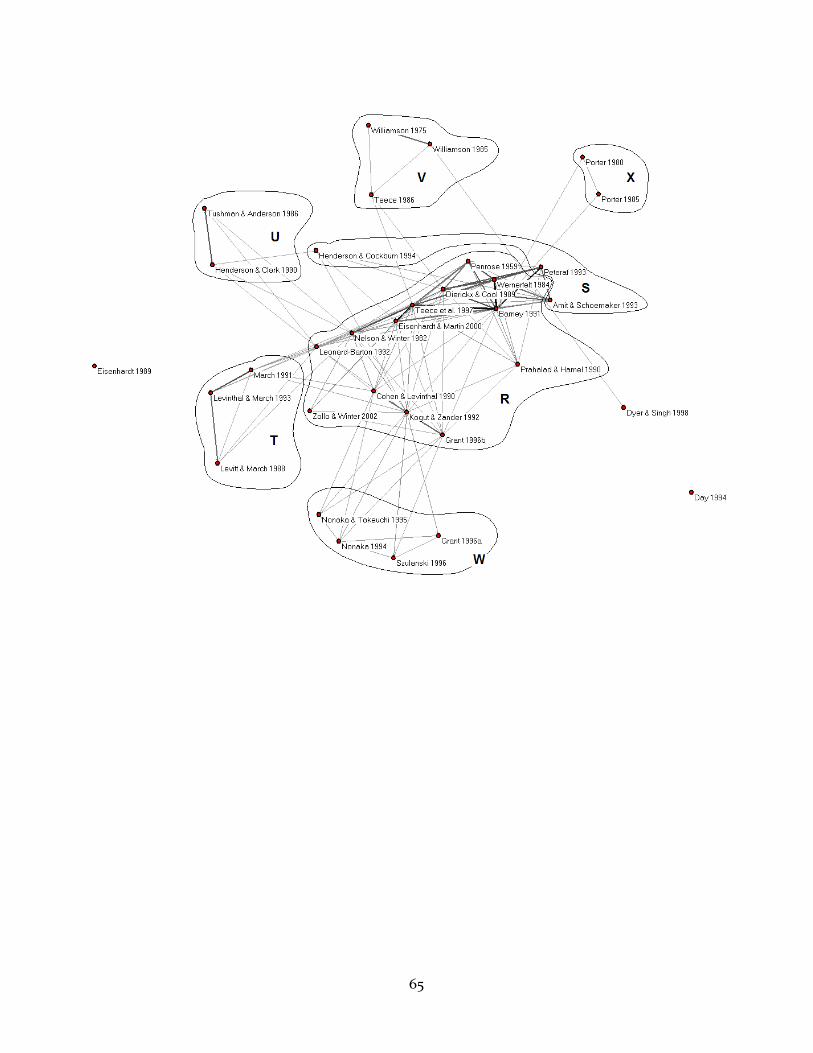
65
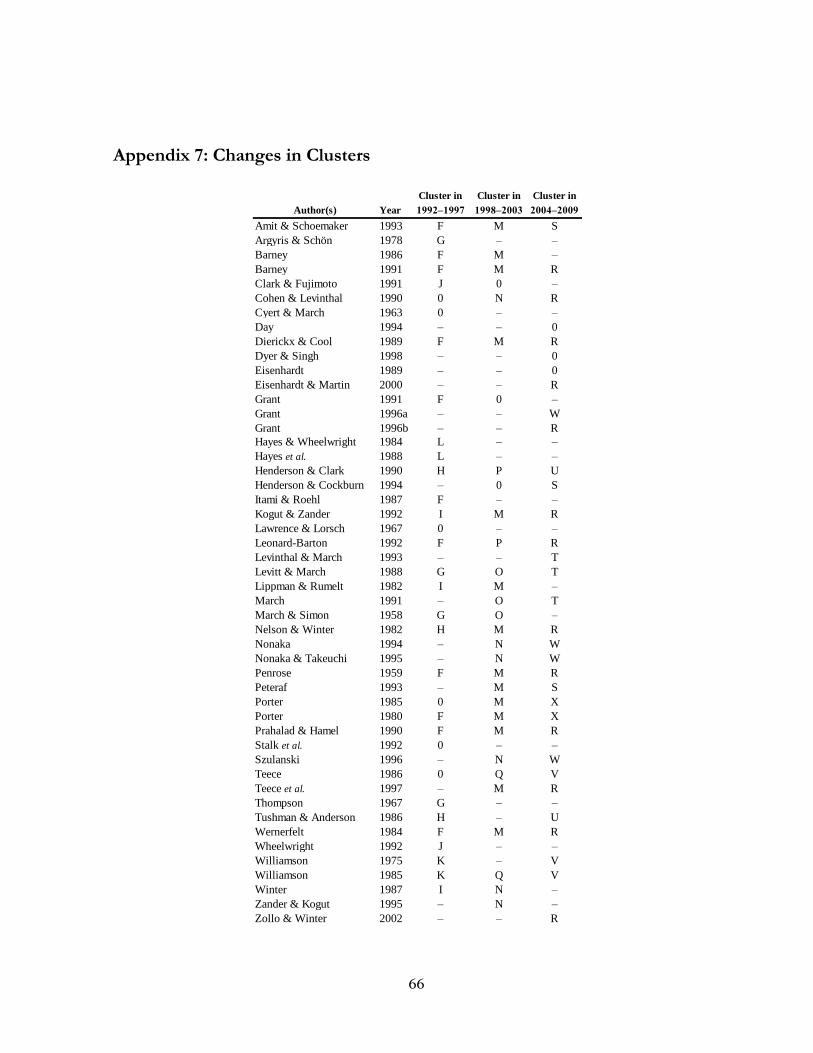
66
Appendix 7: Changes in Clusters
Cluster in Cluster in Cluster in
Author(s) Year 1992–1997 1998–2003 2004–2009
Amit & Schoemaker 1993 F M S
Argyris & Schön 1978 G – –
Barney 1986 F M –
Barney 1991 F M R
Clark & Fujimoto 1991 J 0 –
Cohen & Levinthal 1990 0 N R
Cyert & March 1963 0 – –
Day 1994 – – 0
Dierickx & Cool 1989 F M R
Dyer & Singh 1998 – – 0
Eisenhardt 1989 – – 0
Eisenhardt & Martin 2000 – – R
Grant 1991 F 0 –
Grant 1996a – – W
Grant 1996b – – R
Hayes & Wheelwright 1984 L – –
Hayes et al. 1988 L – –
Henderson & Clark 1990 H P U
Henderson & Cockburn 1994 – 0 S
Itami & Roehl 1987 F – –
Kogut & Zander 1992 I M R
Lawrence & Lorsch 1967 0 – –
Leonard-Barton 1992 F P R
Levinthal & March 1993 – – T
Levitt & March 1988 G O T
Lippman & Rumelt 1982 I M –
March 1991 – O T
March & Simon 1958 G O –
Nelson & Winter 1982 H M R
Nonaka 1994 – N W
Nonaka & Takeuchi 1995 – N W
Penrose 1959 F M R
Peteraf 1993 – M S
Porter 1985 0 M X
Porter 1980 F M X
Prahalad & Hamel 1990 F M R
Stalk et al. 1992 0 – –
Szulanski 1996 – N W
Teece 1986 0 Q V
Teece et al. 1997 – M R
Thompson 1967 G – –
Tushman & Anderson 1986 H – U
Wernerfelt 1984 F M R
Wheelwright 1992 J – –
Williamson 1975 K – V
Williamson 1985 K Q V
Winter 1987 I N –
Zander & Kogut 1995 – N –
Zollo & Winter 2002 – – R
67
CHAPTER 4
OPERATIONALIZATION OF CAPABILITIES: A REVIEW
MIRVA PELTONIEMI
Aalto University School of Science and Technology [email protected]
OLA LAAKSONEN
Aalto University School of Science and Technology [email protected]
ULRIIKKA TIKKANEN
Aalto University School of Science and Technology, Turku School of Economics [email protected]
1 INTRODUCTION
Despite the popularity of capabilities in explaining competitive advantage (Henderson and
Cockburn, 1994, Teece et al., 1997, Eisenhardt and Martin, 2000, Zollo and Winter, 2002),
empirical work relating to the concept has not to date developed common methodological
solutions and established operationalizations for different types of capabilities. Capability
remains a problematic construct both conceptually and empirically. Thus there is a need to
look at how the problem of operationalizing capabilities has been solved. The present paper
aims at examining empirical capabilities research to shed light on the variables and
operationalizations used.
68
Recent reviews (Newbert, 2007, Wang and Ahmed, 2007, Armstrong and Shimizu, 2007) on the
resource-based view of the firm and dynamic capabilities have touched the issue of empirical
grounding, but still their emphasis has been on conceptual rather than empirical issues. We
follow Armstrong and Shimizu’s (2007) approach in reviewing the empirical work through
classifications, but take the analysis to the level of variables: How do capabilities manifest in
empirical material? When does a capability exist? When is there a lot of a capability and when
only a little? Some reviews on empirical work assess the level of empirical support for a theory
through meta-analysis (e.g. Newbert, 2007, Wang and Ahmed, 2007, Ketchen et al., 1997,
Dalton et al., 2003, Campbell-Hunt, 2000) whereas others assess the choices made in
operationalization (e.g. Karren and Barringer, 2002, Zwijze-Koning and de Jong, 2007, Lohrke,
2009, Añón Higón et al., 2009). The present paper falls under the latter category.
2 METHOD
2.1 Identification of empirical capabilities articles
The first decision was to choose the journals to be included in our study. We chose to include
Strategic Management Journal, Administrative Science Quarterly, Academy of Management
Journal, Research Policy, Journal of Management, Journal of Management Studies and
Organization Science due to their high impact factors, high ratio of empirical articles and
general high regard in the academic community. The search was conducted in ISI Web of
Science and includes all articles published in 1986-2009.
The method applied in identifying empirical capabilities articles followed that used by David
and Han (2004) and Newbert (2007) in reviews on empirical work on the transaction cost
economics and the resource-based view of the firm, respectively. We proceeded as follows.
1. Ensure relevance by requiring that selected articles contain the word capabilit* in title,
abstract or keywords.
2. Ensure empirical content by requiring that selected articles also contain at least one of
the following method-related keywords in title, abstract or keywords: data, empirical,
test*, finding*, result, results, qualitative, quantitative, or evidence.
3. Ensure empirical content by reading through the remaining abstracts and discard those
that do not contain empirical work.
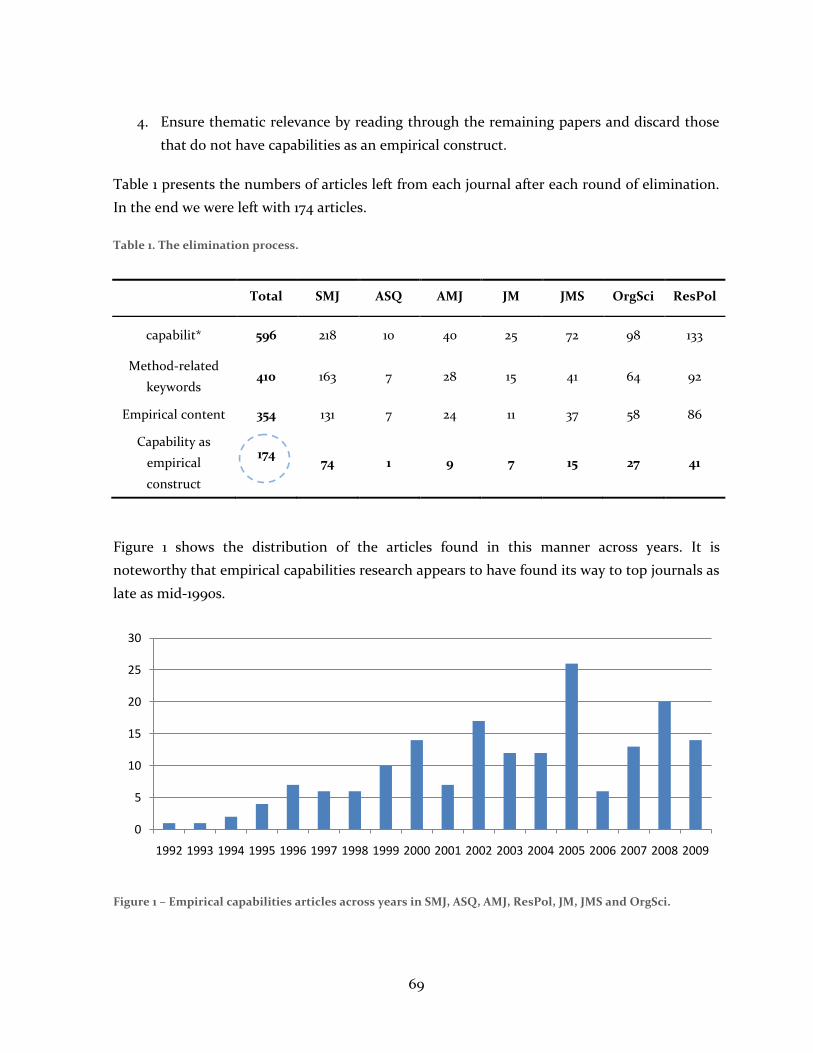
69
4. Ensure thematic relevance by reading through the remaining papers and discard those
that do not have capabilities as an empirical construct.
Table 1 presents the numbers of articles left from each journal after each round of elimination.
In the end we were left with 174 articles.
Table 1. The elimination process.
Total SMJ ASQ AMJ JM JMS OrgSci ResPol
capabilit* 596 218 10 40 25 72 98 133
Method-related
keywords 410 163 7 28 15 41 64 92
Empirical content 354 131 7 24 11 37 58 86
Capability as
empirical
construct
174 74 1 9 7 15 27 41
Figure 1 shows the distribution of the articles found in this manner across years. It is
noteworthy that empirical capabilities research appears to have found its way to top journals as
late as mid-1990s.
Figure 1 – Empirical capabilities articles across years in SMJ, ASQ, AMJ, ResPol, JM, JMS and OrgSci.
0
5
10
15
20
25
30
1992 1993 1994 1995 1996 1997 1998 1999 2000 2001 2002 2003 2004 2005 2006 2007 2008 2009
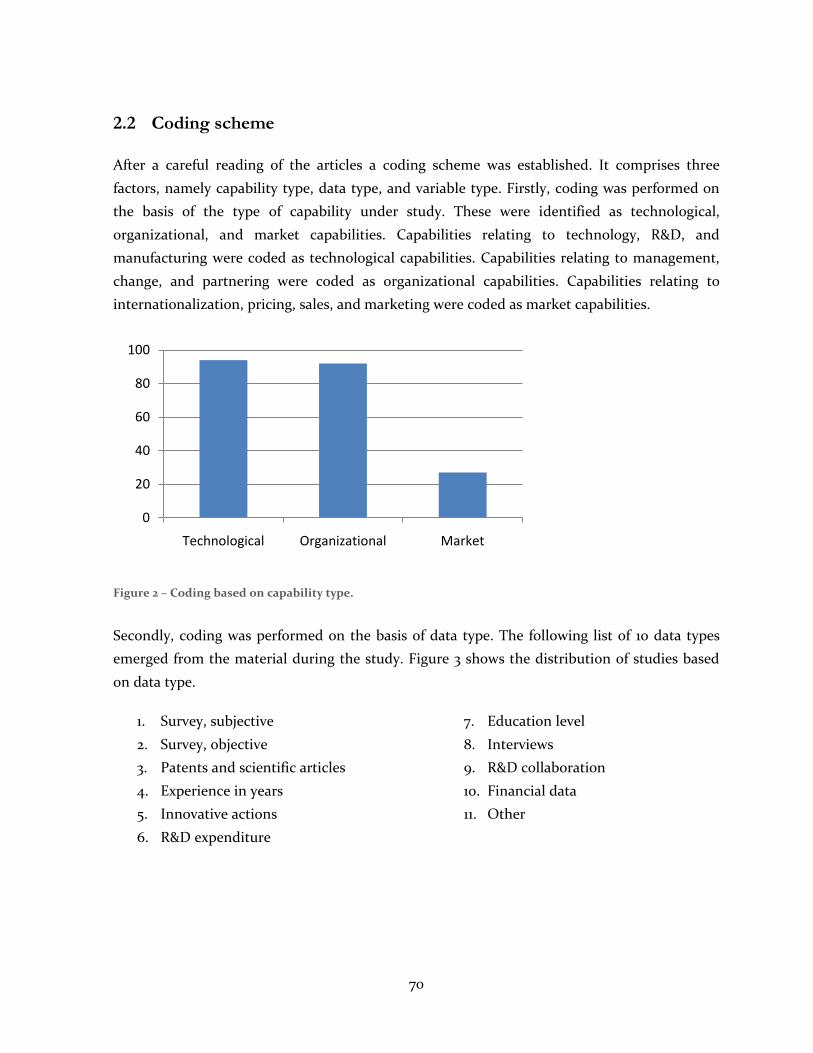
70
2.2 Coding scheme
After a careful reading of the articles a coding scheme was established. It comprises three
factors, namely capability type, data type, and variable type. Firstly, coding was performed on
the basis of the type of capability under study. These were identified as technological,
organizational, and market capabilities. Capabilities relating to technology, R&D, and
manufacturing were coded as technological capabilities. Capabilities relating to management,
change, and partnering were coded as organizational capabilities. Capabilities relating to
internationalization, pricing, sales, and marketing were coded as market capabilities.
Figure 2 – Coding based on capability type.
Secondly, coding was performed on the basis of data type. The following list of 10 data types
emerged from the material during the study. Figure 3 shows the distribution of studies based
on data type.
1. Survey, subjective
2. Survey, objective
3. Patents and scientific articles
4. Experience in years
5. Innovative actions
6. R&D expenditure
7. Education level
8. Interviews
9. R&D collaboration
10. Financial data
11. Other
0
20
40
60
80
100
Technological Organizational Market
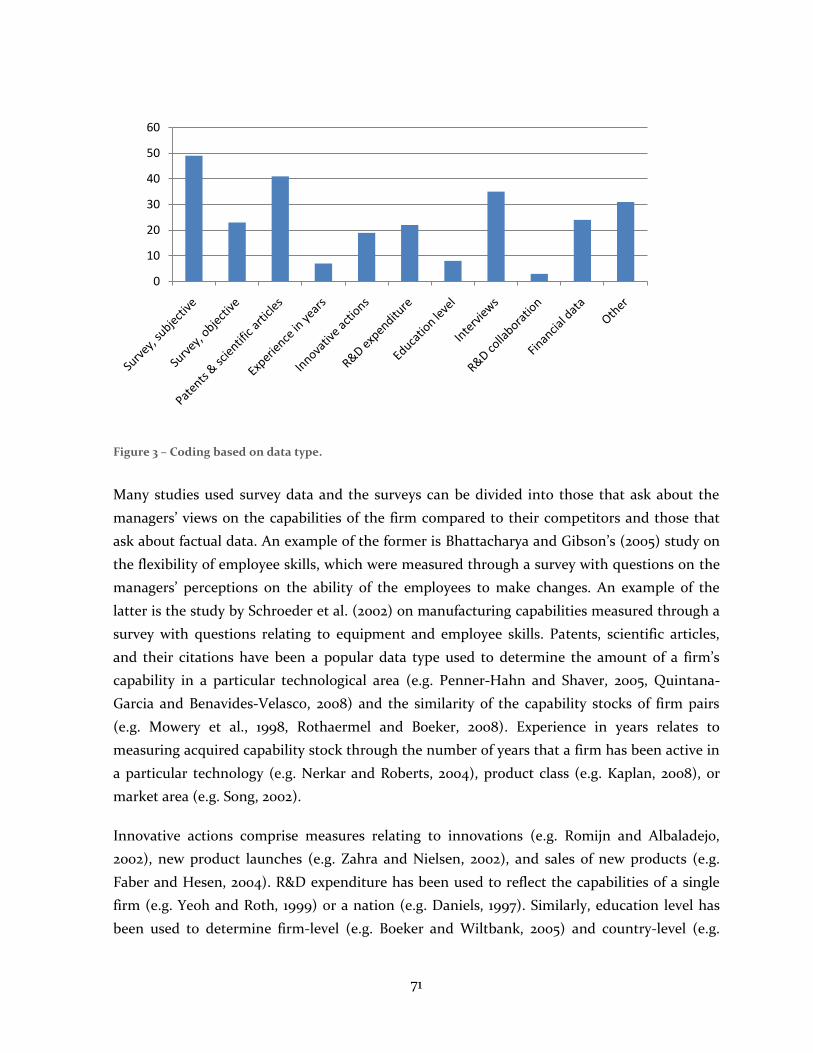
71
Figure 3 – Coding based on data type.
Many studies used survey data and the surveys can be divided into those that ask about the
managers’ views on the capabilities of the firm compared to their competitors and those that
ask about factual data. An example of the former is Bhattacharya and Gibson’s (2005) study on
the flexibility of employee skills, which were measured through a survey with questions on the
managers’ perceptions on the ability of the employees to make changes. An example of the
latter is the study by Schroeder et al. (2002) on manufacturing capabilities measured through a
survey with questions relating to equipment and employee skills. Patents, scientific articles,
and their citations have been a popular data type used to determine the amount of a firm’s
capability in a particular technological area (e.g. Penner-Hahn and Shaver, 2005, Quintana-
Garcia and Benavides-Velasco, 2008) and the similarity of the capability stocks of firm pairs
(e.g. Mowery et al., 1998, Rothaermel and Boeker, 2008). Experience in years relates to
measuring acquired capability stock through the number of years that a firm has been active in
a particular technology (e.g. Nerkar and Roberts, 2004), product class (e.g. Kaplan, 2008), or
market area (e.g. Song, 2002).
Innovative actions comprise measures relating to innovations (e.g. Romijn and Albaladejo,
2002), new product launches (e.g. Zahra and Nielsen, 2002), and sales of new products (e.g.
Faber and Hesen, 2004). R&D expenditure has been used to reflect the capabilities of a single
firm (e.g. Yeoh and Roth, 1999) or a nation (e.g. Daniels, 1997). Similarly, education level has
been used to determine firm-level (e.g. Boeker and Wiltbank, 2005) and country-level (e.g.
0
10
20
30
40
50
60
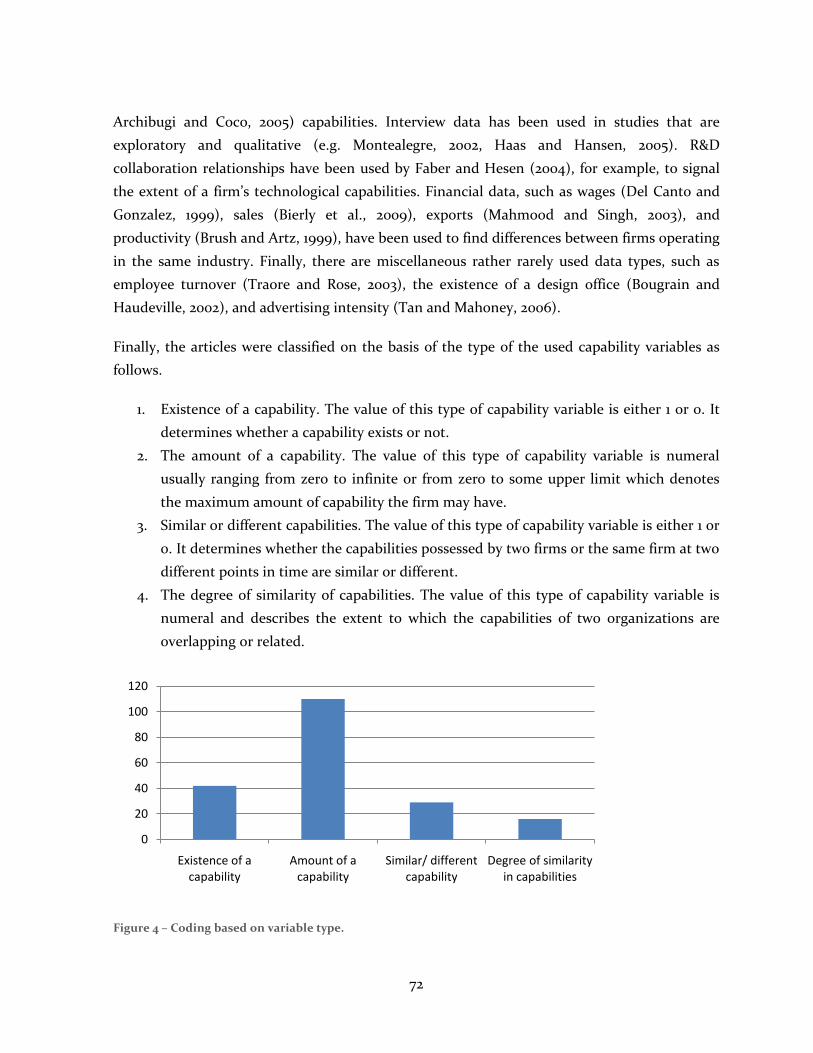
72
Archibugi and Coco, 2005) capabilities. Interview data has been used in studies that are
exploratory and qualitative (e.g. Montealegre, 2002, Haas and Hansen, 2005). R&D
collaboration relationships have been used by Faber and Hesen (2004), for example, to signal
the extent of a firm’s technological capabilities. Financial data, such as wages (Del Canto and
Gonzalez, 1999), sales (Bierly et al., 2009), exports (Mahmood and Singh, 2003), and
productivity (Brush and Artz, 1999), have been used to find differences between firms operating
in the same industry. Finally, there are miscellaneous rather rarely used data types, such as
employee turnover (Traore and Rose, 2003), the existence of a design office (Bougrain and
Haudeville, 2002), and advertising intensity (Tan and Mahoney, 2006).
Finally, the articles were classified on the basis of the type of the used capability variables as
follows.
1. Existence of a capability. The value of this type of capability variable is either 1 or 0. It
determines whether a capability exists or not.
2. The amount of a capability. The value of this type of capability variable is numeral
usually ranging from zero to infinite or from zero to some upper limit which denotes
the maximum amount of capability the firm may have.
3. Similar or different capabilities. The value of this type of capability variable is either 1 or
0. It determines whether the capabilities possessed by two firms or the same firm at two
different points in time are similar or different.
4. The degree of similarity of capabilities. The value of this type of capability variable is
numeral and describes the extent to which the capabilities of two organizations are
overlapping or related.
Figure 4 – Coding based on variable type.
0
20
40
60
80
100
120
Existence of a capability
Amount of a capability
Similar/ different capability
Degree of similarity in capabilities
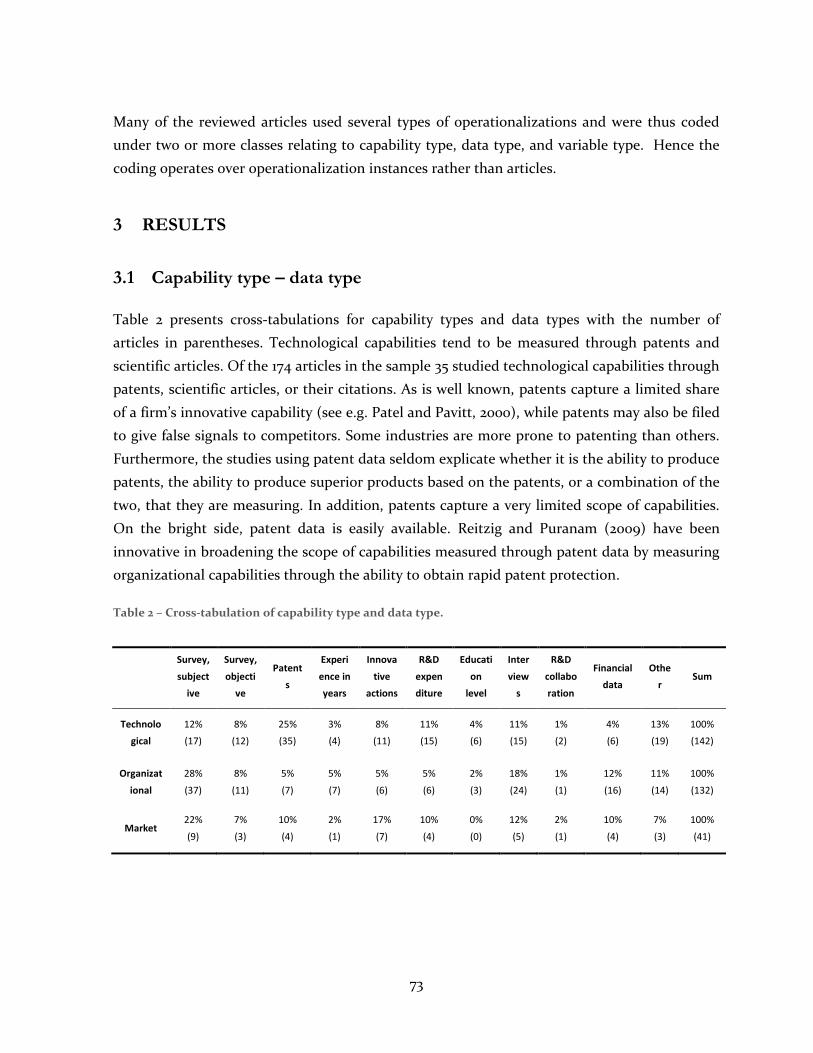
73
Many of the reviewed articles used several types of operationalizations and were thus coded
under two or more classes relating to capability type, data type, and variable type. Hence the
coding operates over operationalization instances rather than articles.
3 RESULTS
3.1 Capability type – data type
Table 2 presents cross-tabulations for capability types and data types with the number of
articles in parentheses. Technological capabilities tend to be measured through patents and
scientific articles. Of the 174 articles in the sample 35 studied technological capabilities through
patents, scientific articles, or their citations. As is well known, patents capture a limited share
of a firm’s innovative capability (see e.g. Patel and Pavitt, 2000), while patents may also be filed
to give false signals to competitors. Some industries are more prone to patenting than others.
Furthermore, the studies using patent data seldom explicate whether it is the ability to produce
patents, the ability to produce superior products based on the patents, or a combination of the
two, that they are measuring. In addition, patents capture a very limited scope of capabilities.
On the bright side, patent data is easily available. Reitzig and Puranam (2009) have been
innovative in broadening the scope of capabilities measured through patent data by measuring
organizational capabilities through the ability to obtain rapid patent protection.
Table 2 – Cross-tabulation of capability type and data type.
Survey,
subject
ive
Survey,
objecti
ve
Patent
s
Experi
ence in
years
Innova
tive
actions
R&D
expen
diture
Educati
on
level
Inter
view
s
R&D
collabo
ration
Financial
data
Othe
r Sum
Technolo
gical
12%
(17)
8%
(12)
25%
(35)
3%
(4)
8%
(11)
11%
(15)
4%
(6)
11%
(15)
1%
(2)
4%
(6)
13%
(19)
100%
(142)
Organizat
ional
28%
(37)
8%
(11)
5%
(7)
5%
(7)
5%
(6)
5%
(6)
2%
(3)
18%
(24)
1%
(1)
12%
(16)
11%
(14)
100%
(132)
Market 22%
(9)
7%
(3)
10%
(4)
2%
(1)
17%
(7)
10%
(4)
0%
(0)
12%
(5)
2%
(1)
10%
(4)
7%
(3)
100%
(41)
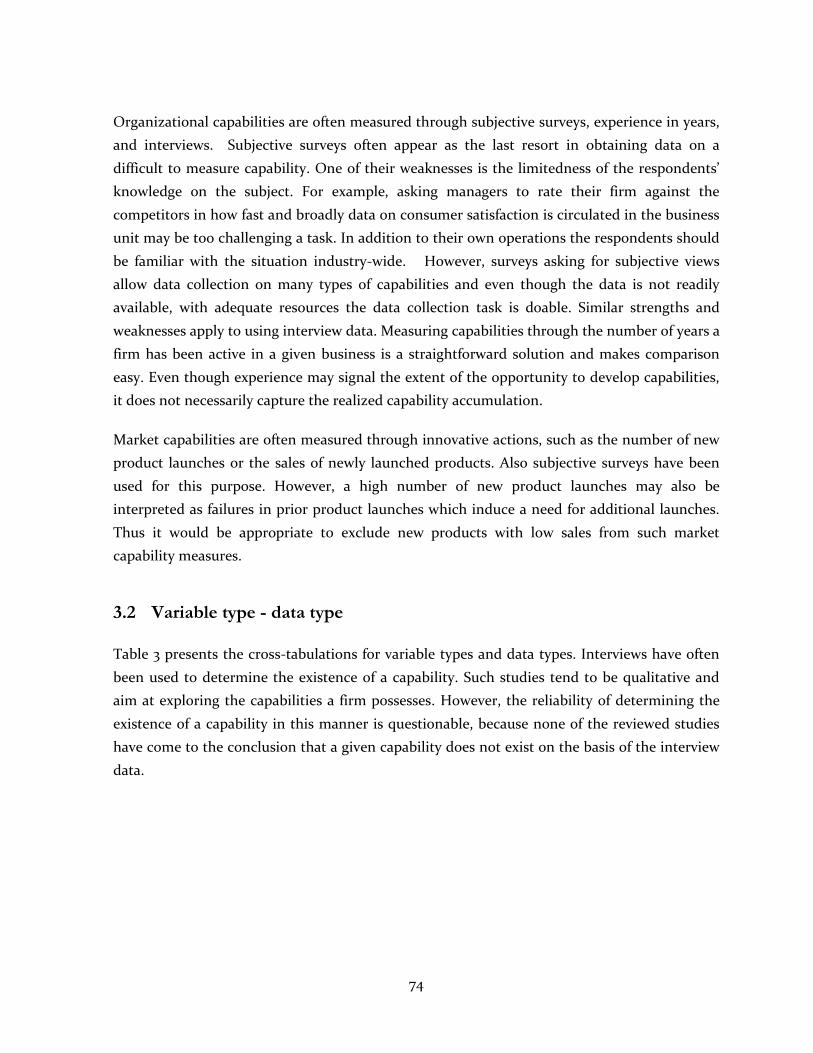
74
Organizational capabilities are often measured through subjective surveys, experience in years,
and interviews. Subjective surveys often appear as the last resort in obtaining data on a
difficult to measure capability. One of their weaknesses is the limitedness of the respondents’
knowledge on the subject. For example, asking managers to rate their firm against the
competitors in how fast and broadly data on consumer satisfaction is circulated in the business
unit may be too challenging a task. In addition to their own operations the respondents should
be familiar with the situation industry-wide. However, surveys asking for subjective views
allow data collection on many types of capabilities and even though the data is not readily
available, with adequate resources the data collection task is doable. Similar strengths and
weaknesses apply to using interview data. Measuring capabilities through the number of years a
firm has been active in a given business is a straightforward solution and makes comparison
easy. Even though experience may signal the extent of the opportunity to develop capabilities,
it does not necessarily capture the realized capability accumulation.
Market capabilities are often measured through innovative actions, such as the number of new
product launches or the sales of newly launched products. Also subjective surveys have been
used for this purpose. However, a high number of new product launches may also be
interpreted as failures in prior product launches which induce a need for additional launches.
Thus it would be appropriate to exclude new products with low sales from such market
capability measures.
3.2 Variable type - data type
Table 3 presents the cross-tabulations for variable types and data types. Interviews have often
been used to determine the existence of a capability. Such studies tend to be qualitative and
aim at exploring the capabilities a firm possesses. However, the reliability of determining the
existence of a capability in this manner is questionable, because none of the reviewed studies
have come to the conclusion that a given capability does not exist on the basis of the interview
data.
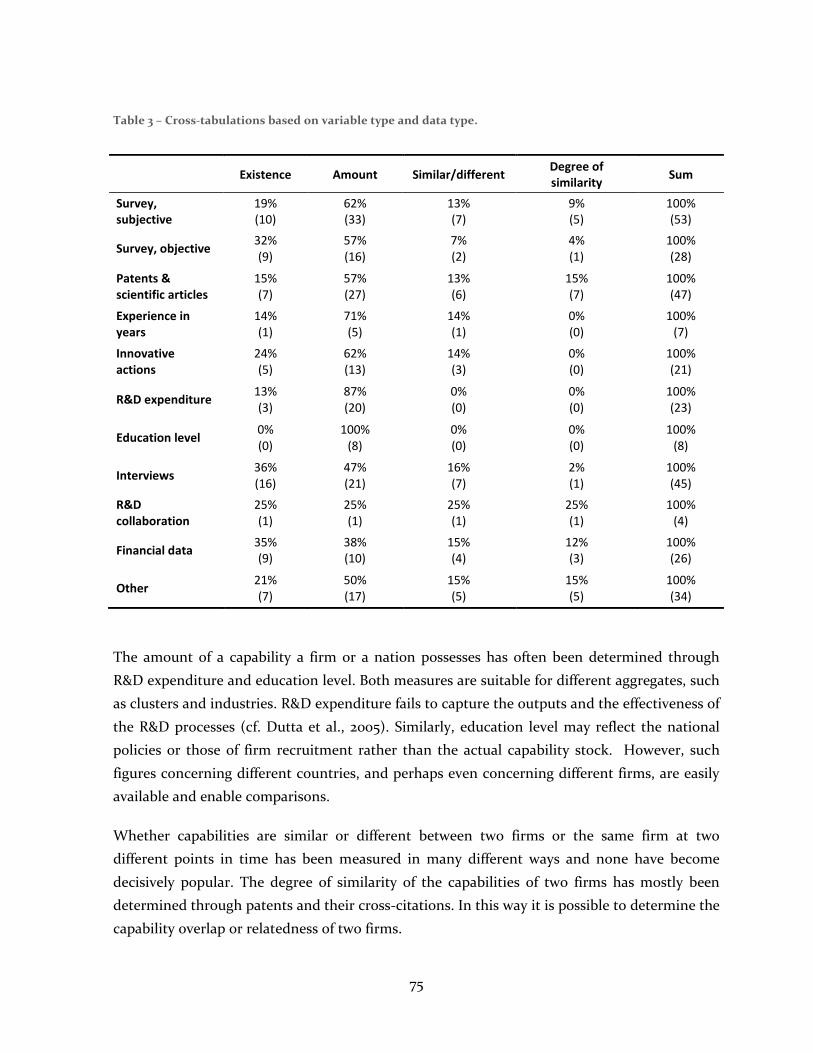
75
Table 3 – Cross-tabulations based on variable type and data type.
Existence Amount Similar/different
Degree of similarity
Sum
Survey, subjective
19% (10)
62% (33)
13% (7)
9% (5)
100% (53)
Survey, objective 32% (9)
57% (16)
7% (2)
4% (1)
100% (28)
Patents & scientific articles
15% (7)
57% (27)
13% (6)
15% (7)
100% (47)
Experience in years
14% (1)
71% (5)
14% (1)
0% (0)
100% (7)
Innovative actions
24% (5)
62% (13)
14% (3)
0% (0)
100% (21)
R&D expenditure 13% (3)
87% (20)
0% (0)
0% (0)
100% (23)
Education level 0% (0)
100% (8)
0% (0)
0% (0)
100% (8)
Interviews 36% (16)
47% (21)
16% (7)
2% (1)
100% (45)
R&D collaboration
25% (1)
25% (1)
25% (1)
25% (1)
100% (4)
Financial data 35% (9)
38% (10)
15% (4)
12% (3)
100% (26)
Other 21% (7)
50% (17)
15% (5)
15% (5)
100% (34)
The amount of a capability a firm or a nation possesses has often been determined through
R&D expenditure and education level. Both measures are suitable for different aggregates, such
as clusters and industries. R&D expenditure fails to capture the outputs and the effectiveness of
the R&D processes (cf. Dutta et al., 2005). Similarly, education level may reflect the national
policies or those of firm recruitment rather than the actual capability stock. However, such
figures concerning different countries, and perhaps even concerning different firms, are easily
available and enable comparisons.
Whether capabilities are similar or different between two firms or the same firm at two
different points in time has been measured in many different ways and none have become
decisively popular. The degree of similarity of the capabilities of two firms has mostly been
determined through patents and their cross-citations. In this way it is possible to determine the
capability overlap or relatedness of two firms.
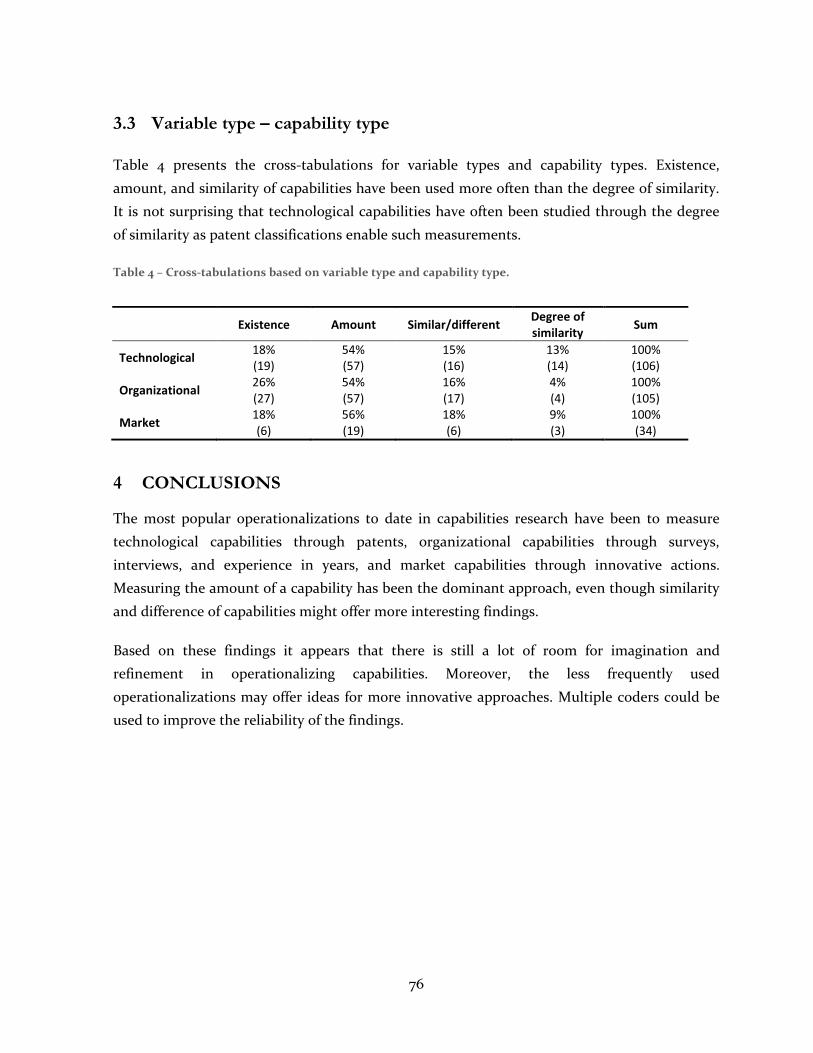
76
3.3 Variable type – capability type
Table 4 presents the cross-tabulations for variable types and capability types. Existence,
amount, and similarity of capabilities have been used more often than the degree of similarity.
It is not surprising that technological capabilities have often been studied through the degree
of similarity as patent classifications enable such measurements.
Table 4 – Cross-tabulations based on variable type and capability type.
Existence Amount Similar/different
Degree of similarity
Sum
Technological 18% (19)
54% (57)
15% (16)
13% (14)
100% (106)
Organizational 26% (27)
54% (57)
16% (17)
4% (4)
100% (105)
Market 18% (6)
56% (19)
18% (6)
9% (3)
100% (34)
4 CONCLUSIONS
The most popular operationalizations to date in capabilities research have been to measure
technological capabilities through patents, organizational capabilities through surveys,
interviews, and experience in years, and market capabilities through innovative actions.
Measuring the amount of a capability has been the dominant approach, even though similarity
and difference of capabilities might offer more interesting findings.
Based on these findings it appears that there is still a lot of room for imagination and
refinement in operationalizing capabilities. Moreover, the less frequently used
operationalizations may offer ideas for more innovative approaches. Multiple coders could be
used to improve the reliability of the findings.
77
REFERENCES
AÑÓN HIGÓN, D., BOZKURT, Ö., CLEGG, J., GRUGULIS, I., SALIS, S., VASILAKOS, N. &
WILLIAMS, A. M. 2009. The determinants of retail productivity: A critical review of the
evidence. International Journal of Management Reviews, 11.
ARCHIBUGI, D. & COCO, A. 2005. Measuring technological capabilities at the country level: A
survey and a menu for choice. Research Policy, 34, 175-194.
ARMSTRONG, C. E. & SHIMIZU, K. 2007. A review of approaches to empirical research on the
resource-based view of the firm. Journal of Management, 33, 959-986.
BHATTACHARYA, M. & GIBSON, D. E. 2005. The effects of flexibility in employee skills,
employee behaviors, and human resource practices on firm performance. Journal of
Management, 31, 622-640.
BIERLY, P. E., DAMANPOUR, F. & SANTORO, M. D. 2009. The Application of External
Knowledge: Organizational Conditions for Exploration and Exploitation. Journal of
Management Studies, 46, 481-509.
BOEKER, W. & WILTBANK, R. 2005. New venture evolution and managerial capabilities.
Organization Science, 16, 123-133.
BOUGRAIN, F. & HAUDEVILLE, B. 2002. Innovation, collaboration and SMEs internal research
capacities. Research Policy, 31, 735-747.
BRUSH, T. H. & ARTZ, K. W. 1999. Toward a contingent resource-based theory: The impact of
information asymmetry on the value of capabilities in veterinary medicine. Strategic
Management Journal, 20, 223-250.
CAMPBELL-HUNT, C. 2000. What have we learned about generic competitive strategy? A
meta-analysis. Strategic Management Journal, 21, 127-154.
DALTON, D. R., DAILY, C. M., CERTO, S. T. & ROENGPITYA, R. 2003. Meta-analyses of
financial performance and equity: Fusion or confusion? Academy of Management
Journal, 46, 13-26.
DANIELS, P. L. 1997. National technology gaps and trade - An empirical study of the influence
of globalisation. Research Policy, 25, 1189-1207.
DAVID, R. J. & HAN, S. K. 2004. A systematic assessment of the empirical support for
transaction cost economics. Strategic Management Journal, 25, 39-58.
DEL CANTO, J. G. & GONZALEZ, I. S. 1999. A resource-based analysis of the factors
determining a firm's R&D activities. Research Policy, 28, 891-905.
DUTTA, S., NARASIMHAN, O. & RAJIV, S. 2005. Conceptualizing and measuring capabilities:
Methodology and empirical application. Strategic Management Journal, 26, 277-285.
78
EISENHARDT, K. M. & MARTIN, J. A. Year. Dynamic capabilities: What are they? In, 2000.
1105-1121.
FABER, J. & HESEN, A. B. 2004. Innovation capabilities of European nations - Cross-national
analyses of patents and sales of product innovations. Research Policy, 33, 193-207.
HAAS, M. R. & HANSEN, M. T. 2005. When using knowledge can hurt performance: The value
of organizational capabilities in a management consulting company. Strategic
Management Journal, 26, 1-24.
HENDERSON, R. & COCKBURN, I. 1994. Measuring competence - Exploring firm effects in
pharmaceutical research. Strategic Management Journal, 15, 63-84.
KAPLAN, S. 2008. Cognition, capabilities, and incentives: Assessing firm response to the fiber-
optic revolution. Academy of Management Journal, 51, 672-695.
KARREN, R. J. & BARRINGER, M. W. 2002. A review and analysis of the policy-capturing
methodology in organizational research: Guidelines for research and practice.
Organizational Research Methods, 5, 337-361.
KETCHEN, D. J., COMBS, J. G., RUSSELL, C. J., SHOOK, C., DEAN, M. A., RUNGE, J., LOHRKE,
F. T., NAUMANN, S. E., HAPTONSTAHL, D. E., BAKER, R., BECKSTEIN, B. A.,
HANDLER, C., HONIG, H. & LAMOUREUX, S. 1997. Organizational configurations and
performance: A meta-analysis. Academy of Management Journal, 40, 223-240.
LOHRKE, F. T., HOLLOWAY, B. B., WOOLLEY, T. W. 2009. Conjoint Analysis in
Entrepreneurship Research A Review and Research Agenda. Organizational Research
Methods, Forthcoming.
MAHMOOD, I. P. & SINGH, J. 2003. Technological dynamism in Asia. Research Policy, 32, 1031-
1054.
MONTEALEGRE, R. 2002. A process model of capability development: Lessons from the
electronic commerce strategy at Bolsa de Valores de Guayaquil. Organization Science,
13, 514-531.
MOWERY, D. C., OXLEY, J. E. & SILVERMAN, B. S. 1998. Technological overlap and interfirm
cooperation: implications for the resource-based view of the firm. Research Policy, 27,
507-523.
NERKAR, A. & ROBERTS, P. W. 2004. Technological and product-market experience and the
success of new product introductions in the pharmaceutical industry. Strategic
Management Journal, 25, 779-799.
NEWBERT, S. L. 2007. Empirical research on the resource-based view of the firm: An
assessment and suggestions for future research. Strategic Management Journal, 28, 121-
146.
79
PATEL, P. & PAVITT, K. 2000. How technological competencies help define the core (not the
boundaries) of the firm. In: DOSI, G., NELSON, R. R. & WINTER, S. G. (eds.) The nature
and dynamics of organizational capabilities Oxford: Oxford University Press.
PENNER-HAHN, J. & SHAVER, J. M. 2005. Does international research and development
increase patent output? An analysis of Japanese pharmaceutical firms. Strategic
Management Journal, 26, 121-140.
QUINTANA-GARCIA, C. & BENAVIDES-VELASCO, C. A. 2008. Innovative competence,
exploration and exploitation: The influence of technological diversification. Research
Policy, 37, 492-507.
REITZIG, M. & PURANAM, P. 2009. Value appropriation as a organizational capability: The
case of IP protection through patents. Strategic Management Journal, 30, 765-789.
ROMIJN, H. & ALBALADEJO, M. 2002. Determinants of innovation capability in small
electronics and software firms in southeast England. Research Policy, 31, 1053-1067.
ROTHAERMEL, F. T. & BOEKER, W. 2008. Old technology meets new technology:
Complementarities, similarities, and alliance formation. Strategic Management Journal,
29, 47-77.
SCHROEDER, R. G., BATES, K. A. & JUNTTILA, M. A. 2002. A resource-based view of
manufacturing strategy and the relationship to manufacturing performance. Strategic
Management Journal, 23, 105-117.
SONG, J. 2002. Firm capabilities and technology ladders: Sequential foreign direct investments
of Japanese electronics firms in East Asia. Strategic Management Journal, 23, 191-210.
TAN, D. & MAHONEY, J. T. 2006. Why a multinational firm chooses expatriates: Integrating
resource-based, agency and transaction costs perspectives. Journal of Management
Studies, 43, 457-484.
TEECE, D. J., PISANO, G. & SHUEN, A. 1997. Dynamic capabilities and strategic management.
Strategic Management Journal, 18, 509-533.
TRAORE, N. & ROSE, A. 2003. Determinants of biotechnology utilization by the Canadian
industry. Research Policy, 32, 1719-1735.
WANG, C. L. & AHMED, P. K. 2007. Dynamic capabilities: A review and research agenda.
International Journal of Management Reviews, 9, 31-51.
YEOH, P. L. & ROTH, K. 1999. An empirical analysis of sustained advantage in the US
pharmaceutical industry: Impact of firm resources and capabilities. Strategic
Management Journal, 20, 637-653.
ZAHRA, S. A. & NIELSEN, A. P. 2002. Sources of capabilities, integration and technology
commercialization. Strategic Management Journal, 23, 377-398.

80
ZOLLO, M. & WINTER, S. G. 2002. Deliberate learning and the evolution of dynamic
capabilities. Organization Science, 13, 339-351.
ZWIJZE-KONING, K. & DE JONG, M. 2007. Evaluating the communication satisfaction
questionnaire as a communication audit tool. Management Communication Quarterly,
20, 261-282.
81
CHAPTER 5
CAPABILITY EVOLUTION IN THE FINNISH FOREST CLUSTER: A
QUALITATIVE APPROACH
ULRIIKKA TIKKANEN
Aalto University School of Science and Technology, Turku School of Economics [email protected]
1 INTRODUCTION
Discretionary differences exist within an industry and do matter as opposed to the view that
the differences between the firms are not discretionary but rather reflect the differences
between the contexts in which firms operate. It is often claimed that the competitive advantage
is determined by a combination of supply-side and demand-side factors. On the demand-side,
the productive activities of the firm must correspond to a market need. On the supply side, the
firm must have the capabilities not only to serve that market need, but to serve it more
efficiently than its competitors. Not only specialized knowledge can provide a basis for
sustainable advantage, because it resides in individuals; and because the rents generated by
specialized knowledge are more likely to be appropriated by individuals than by the firm. The
critical source of competitive advantage is knowledge integration (Nelson 1991, 61; Grant 1996,
380).
Strategy, structure and capabilities can be seen as defining a relatively stable firm character.
Strategy connotes a broad set of commitments made by a firm that define its objectives and the
ways it intends to pursue them: it can be written down or lay in the management culture of the
firm. Structure is defined as the way the activities in the firm are governed and organized: it
defines what the firm actually does, given the broad strategy. Both strategy and structure call
82
forth and mold core capabilities of the firm: the firm can be understood as a hierarchy of
organizational routines, which in turn are building blocks of the capabilities of the firm (Nelson
1991, 61, 67-68). Choices around how to capture value all help determine the architecture or
design of a business. Having a differentiated yet effective and efficient “strategic architecture”
to an enterprise´s business model is important (Teece 2007, 1330) Under competition, superior
profitability is likely to be more associated with resource and capability-based advantages than
with positioning advantages resulting from market and segment selection.
Distinctive organizational capabilities may bear their importance insofar as they can be shown
to shape persistently the destiny of individual firms – profitability, growth and probability of
survival. The relative competitive position of the firm is determined by how its resources and
capabilities are acquired, developed and deployed. A successful organization derives
competitive strength from its excellence in a small number of capability clusters where it can
sustain a leadership position over time (Dosi et al, 2003; Maritan, 2001; Grant 1996).
Also Ethiraj, Kale, Krishnan and Singh (2005, 28) note that organizational capabilities reflect
the evolutionary process of deliberate firm-specific investments along with the largely tacit
“learning-by-doing” in which firms engage. This, in turn, results in heterogeneity of firms and
the consequent differences in their performance. The process reflects the competence of
individuals and of the organizing principles by which relationships among individuals, groups,
and members in an industrial network are structured and coordinated. These principles of
coordination of individual and functional competence generate the capabilities of a firm. These
capabilities concern the ability to manufacture major industrial innovations (Zander & Kogut
1995).
1.1 The objective and the structure of the study
The purpose of the current study is to develop an understanding of the factors that have affected
the capability evolution in the Finnish forest cluster.
The second chapter introduces the concept of organizational capabilities. To understand the
main themes of this study, it is important to understand the evolution of the term “capabilities”
and the different aspects of the theme.
The third chapter focuses on data and methods used in this particular study. First, the
qualitative methods of research are discussed in general. Second, the chosen research method,
83
interviews, is analyzed. In the fourth sub-chapter, the methods of collecting data in this
particular study are described. Then, the interview outline in this particular study is introduced
and the different aspects of the interview outline are discussed. The last sub-chapter reports
the analysis-phase of the empirical process.
The fourth chapter concentrates on the empirical findings of this study. The data are divided
into capability-evolution related themes which have emerged from the data. Finally,
conclusions are made.
2 ORGANIZATIONAL CAPABILITIES
2.1.1 Capability definitions and evolution
There is still no exhaustive definition of organizational capabilities. Researchers emphasize
differing themes and capabilities could even be seen floating “in the literature like an iceberg in
a foggy Arctic sea, one iceberg among many, not easily recognized as different from several
icebergs near by” (Dosi et al, 2003). According to Winter´s commonly cited definition, “an
organizational capability is a higher-level routine (or a collection of routines) that, together
with its implementing input flows, confers upon an organization´s management a set of
decision options for producing significant outputs of a particular type” (Winter 2003, 991).
There is a broad consensus that capabilities derive from organizational routines: they involve
organized activity and they are typically exercised repetitiously. Routinization of organizational
activities embeds capabilities into organizational memory, engendering a unique configuration
of firm resources. However, it is argued that routines are not the only building blocks of
capabilities (Knight & Cavusgil 2004, 127; Dosi et. al. 2008, 1167). As Dosi et. al (2008, 1168) note,
capabilities involve organized activity, and the exercise of a capability is typically repetitious in
many cases and the individual skills are the building blocks of those routines. They derive the
idea that a successful large corporation derives competitive strength from its excellence in a
small number of capability clusters where it can sustain a leadership position over time.
Several authors propose different classifications of capabilities. For example, Loasby (1998)
defines capabilities as “the least definable kinds of productive resources” which make possible
different future activities. He distinguishes capabilities between direct and indirect capabilities.
The former are required for productive activities and the latter for transactions. Indirect
capabilities can be divided into two groups: gaining control of other capabilities or by obtaining
84
access to them. Both direct and indirect capabilities develop through specialization. Indirect
capabilities reduce the costs of particular transactions by embodying knowledge of particular
circumstances and particular relationships (Loasby 1998, 152). According to Day (1994),
capabilities are complex bundles of skills and collective learning, exercised through
organizational processes that ensure superior coordination of functional activities. He divides
capabilities into three categories: “Outside-In Processes” (e.g. market sensing and technology
monitoring), “Inside-Out Processes” (e.g. HRM and manufacturing) and “Spanning processes”
(e.g. pricing, purchasing and new product development).
During the last decade, the main stress of capability discussion has been transferred towards
dynamic capabilities-approach. For example, Helfat and Peteraf (2003, 999) classify capabilities
as either operational or dynamic. An operational capability generally involves performing an
activity, such as manufacturing a particular product, using a collection of routines to execute
and coordinate the variety of tasks required to perform the activity. Dynamic capabilities do
not involve production of a good or provision of a marketable service. Instead, dynamic
capabilities build, integrate, or reconfigure operational capabilities. Operational as well as
dynamic capabilities include two sets of routines: those which perform individual tasks and
those which coordinate these tasks. The need to coordinate tasks implies that a capability
involves coordinated effort by individuals. In turn, Winter (2003) divides capabilities into a
hierarchy. In his analogy, zero-level capabilities show “how we earn a living now”. Without
them, the firm could not collect the revenue from its customers that allow it to buy more
inputs and and do the whole process over again. By contrast, capabilities that would change the
product, the production process, the scale, or the markets served are not at the zero level. New
product development is a prototypical example of a first-order “dynamic capability”.
Teece (2007, 1319) argues that sustainable advantage requires more than the ownership of
difficult-to-replicate (knowledge) assets. It also requires unique and difficult-to-replicate
dynamic capabilities. These capabilities can be harnessed to continuously create, extend,
upgrade, protect, and keep relevant the enterprise´s unique asset base. Dynamic capabilities
can be disaggregated into the capacity 1) to sense and shape opportunities and threats, 2) to
seize opportunities, and 3) to maintain competitiveness through enhancing, combining,
protecting, and, when necessary, reconfiguring the business enterprise´s intangible and
tangible assets. Dynamic capabilities include capabilities required to adapt to changing
customer and technological opportunities. They also embrace the enterprise´s capacity to
shape the ecosystem it occupies, develop new products and processes, and design and
implement viable business models.
85
Nevertheless, scholars have differing views about the contents and formation of the concept.
Teece, Pisano and Shuen (1997), in their early framework on the agenda, define dynamic
capabilities as the outcome of the firm´s processes, positions and paths. The first include
questions of coordination/integration, learning and reconfiguration and transformation. The
second include technological, financial, reputational, structural, institutional and market assets
and organizational boundaries. The third are shaped by path dependencies and technological
opportunities. Augier and Teece (2006, 406-407) claim that dynamic capabilities have multiple
origins, some rooted in routinized behavior, some in asset selection/investment choices, and
others rooted in creative and differentiated entrepreneurial acts, which involve unusual skills
that are not particularly imitable. Teece´s framework indicates that the extent to which an
enterprise develops and employs superior (non-imitable) dynamic capabilities will determine
the nature and amount of intangible assets that it will create or assemble and the level of
economic profits it can earn in the future (Teece 2007). Zollo and Winter (2002, 340), and
Wang and Ahmed (2007, 35) in turn, concentrate on the behavioral orientation of the concept.
According to them, dynamic capabilities are learned and stable patterns of collective activity
through which the organization systematically generates and modifies its operating routines in
pursuit of improved effectiveness. The purpose of dynamic capabilities is to integrate,
reconfigure, renew and recreate its resources and, most importantly, upgrade and reconstruct
its core capabilities in response to the changing environment to attain and sustain competitive
advantage.
In fact, change appears to be one of the most central concepts in the most recent dynamic
capabilities research. Teece (2007, 1320) claims that dynamic capabilities include the capacity to
shape the ecosystem the enterprise occupies, to develop new products and processes, and to
design and implement viable business models. On the other hand, it has been argued that
while some capabilities may deal specifically with adaptation, learning, and change process, all
of them have the potential to accommodate change. However, learning, change and adaptation
do not necessarily require the intervention of dynamic capabilities as intermediaries. Change
could occur by force majeure from the environment. Such change behaviors do not depend on
dynamic capabilities: Winter proposes “ad hoc problem solving” for a term for such behavior. It
is not routine; thus, ad hoc problem solving and dynamic capabilities are two different ways to
change. Dynamic capabilities typically involve long-term commitments to specialized resources
(see Winter 2003; Helfat and Peteraf 2003, 998).
Maintaining superior performance ultimately requires the continual renewal of competitive
advantages through innovation and the development of new capabilities. Grant (1996) claims
86
that there are two dimensions to such renewal: extending existing capabilities to encompass
additional types of knowledge and reconfiguring existing knowledge into new types of
capabilities.
Continuous innovation in competitive environments tends to be the result of the deployment
and extension of a continuing core of capabilities rather than the constant creation of new
capabilities. Achieving flexible integration, either through continually integrating new tacit
knowledge or through constantly reconfiguring existing knowledge, is likely to impose
substantial costs in terms of reducing the efficiency of knowledge integration. Capabilities also
change over time, as the company builds on its core capabilities and absorptive capacity to
identify the new market opportunities, and to develop the new project- and functional
capabilities required to satisfy new commercial objectives, and to introduce the organizational
changes to meet increasing demand (Grant 1996; Davies & Brady 2000).
2.1.2 Capabilities in mature industries
As forest sector companies operate in a relatively mature industry, it makes sense to investigate
previous research relating to the capabilities on other industries which have reached their
maturity stage. As Mitchell (1994, 575) notes, organizational capabilities are retained within a
product market as firms age and grow. Capabilities change over time, as the company builds on
its core capabilities and absorptive capacity to identify the new market opportunities, develop
the new project and functional capabilities required to satisfy new commercial objectives, and
introduce the organizational changes to meet increasing demand (Davies & Brady 2000, 948-
949). Relative to new enterprises, established firms often possess a wider array of resources and
capabilities that they can leverage in additional markets. By virtue of size and longevity,
established firms may hold larger and more developed stocks of individual resources and
capabilities (Helfat & Lieberman 2002, 734).
The science and technology policy discourse has been leaning toward a more innovation-
centered approach with an increasing emphasis on the development of technologies and the
application of knowledge at the expense of the creation of knowledge. According to Knight and
Cavusgil (2004), the aspects of capabilities relate to the shifting character of the business
environment which leads to appropriately adapting, integrating and re-configuring knowledge
based capabilities toward the changing environment.
87
Kogut and Zander (1992) introduce the concept of combinative capability, which refers to
generating new applications from existing knowledge (e.g. innovations). By combinative
capabilities, they mean the intersection of the capability of the firm to exploit its knowledge
and the unexplored potential of the technology. They claim that switching to new capabilities
is difficult, as neither the knowledge embedded in the current relationships and principles is
well understood, nor the social fabric required to support the new learning known. It is the
stability of these relationships that generates the characteristics of inertia in the capabilities of
an organization. Van den Bosch, Volbreda and de Boer (1999, 556-557) extend this view by
distinguishing three types of combinative capabilities a firm has at its disposal: systems
capabilities, coordination capabilities and socialization capabilities. Systems capabilities are
used to integrate explicit knowledge: they provide a memory for handling routine situations.
Coordination capabilities enhance knowledge absorption through relations between members
of a group. Socialization capabilities may influence absorptive capacity by specifying broad,
tacitly understood rules for appropriate action under unspecified contingencies. Socialization
capabilities are found in firms with a strong identity. Here, one can find a coherent set of
beliefs, a high degree of shared values, a common language, and a strongly agreed-upon kind of
appropriate behavior.
New product and process development projects are obvious, visible arenas for conflict between
the need for innovation and retention of important capabilities (Leonard-Barton 1992). Klepper
(2002) claims that the individual capabilities and the experience of the founder in related
industries is closely tied to the performance of the firm in the automobile industry. His
research of diversifying and de novo entrants to the automobile industry showed that prior
experience imparted competitive advantage. Even though diversifying entrants from related
industries (e.g. bicycles) were compelled to learn new techniques of manufacturing and
structure the organization more precisely, technological change often led to new innovations.
As Teece (2007, 1328) notes, the existence of established assets and routines exacerbates
problems of excessive risk aversion. Specifically, both the isolation effect and the certainty
effect can be intensified by the existence of established assets, causing incumbent enterprises
to become comparably more risk averse than new entrants. In terms of innovative activity, this
excessive risk aversion leads to biased decision making and limits the probability that
incumbent enterprises will explore risky radical innovations. He also argues (2007, 1335) that a
key to sustained profitable growth is the ability to recombine and to reconfigure assets and
organizational structures as the enterprise grows, and as markets and technologies change.
Incumbent enterprises possessing fixed assets may further tend to limit their new investments
88
to innovations that are “close-in” to the existing asset base. They tend to narrowly focus search
activities to exploit established technological and organizational assets. This effect makes it
difficult for these enterprises to see potential radical innovations. Incumbent enterprises tend
to frame new problems in a manner consistent with the enterprise´s current knowledge base,
assets, and/or established problem-solving heuristics and established business model. This
means that managers may not successfully address opportunities or potential innovations even
when they do recognize them.
2.1.3 Forest industry
Traditionally, the technological competencies and know-how have been the leading triggers of
development in the forest industry. As Tremblay (1999, 798) notes, technological capabilities
embody the resources required to manage and actualize the generation of technical change.
These resources are accumulated and embodied in people (skills, knowledge and experience)
and organizational systems. However, there has been much evidence that the forest sector has
been realizing that competitive advantage rests on more than just technological excellence.
In empirical studies of the forest industry, both tangible and intangible firm resources have
been found to have an important role in creating value-added, enhancing competitiveness, and
achieving success in a modern business environment. To become and stay competitive,
industries must develop and update their technological knowledge bases much quicker than
ever before. Survival in the increasingly tightening market competition requires strategic
decision-making and the constant development of business and manufacturing processes as
well a more innovation-centered approach.
However, break-through innovations are not usually the most important driving factors of
competitive position and performance of the firms in the pulp and paper industry. It seems that
the firms that succeed in implementing even small gains in productivity on year-to-year basis
via investments in upgrading and modernization, as well as making changes to the supply-
chain, would in the medium-to-longer run gain competitive advantage relative to those firms
who were not successful in implementing such strategies (Ghosal & Nair-Reichert 2008).
Process innovations in the forest product industry seem to occur in improvements in raw
material utilization, computer-aided manufacturing and customized machinery, for example.
Also these categories listed under innovations tend to fall on incremental improvements to
enhance efficiency. For example, R&D efforts in the pulp and paper industry are not focused on
89
radical innovations. They are instead oriented towards improving the quality and features of
existing products and improving manufacturing processes and acquisition of embodied
technology available in international markets instead of on the development of in-house
technology (see Diaz-Balteiro et. al. 2006; Hovgaard & Hansen 2004; Tremblay 1999).
As Lähtinen and Toppinen (2008) note in their investigation on Finnish sawmills, companies
are not alike even in a resource-dependent, mature industry operating within the same
business environment. The internal characteristics of firms differ from each other and cause
variation in the company-wise financial performance. The core capabilities of the firm
influence the outcome of wood product innovations (Bull & Ferguson 2006). The presence of
appropriate technology, governance structure and firm wide learning culture will increase the
likelihood that the product will achieve success.
3 DATA & METHODS
3.1 Qualitative research methods
Qualitative research genres have become increasingly important modes of inquiry for the social
sciences and applied fields. Qualitative research is pragmatic, interpretive and grounded in the
lived experiences of people. These interests take qualitative researchers into natural settings,
and foster pragmatism in using multiple methods for exploring a topic. Hence, qualitative
research is a broad approach to the study of social phenomena (Marshall & Rossman 2006, 1-2).
The processes and phenomena of the world are described before theorized, understood before
explained, and seen as concrete qualities before abstract quantities. The qualitative stance
involves focusing on the cultural, and situated aspects of human thinking, learning, knowing,
acting, and it is opposed to “technified” approaches to the study of human lives (Kvale &
Brinkmann 2009, 12).
According to Malhotra and Birks (2007, 152) qualitative research can be defined as an
unstructured, primarily exploratory design based on small samples, intended to provide insight
and understanding. Qualitative research is a mixture of the rational, explorative and intuitive,
where the skills and experiences of the researcher play an important role in the analysis of data.
Qualitative research is often focused on social process and not on social structures, which is
often the case in quantitative research (Ghauri et al. 1995, 84). Typical examples requiring
qualitative research are research problems focusing on uncovering a person’s experience or
90
behavior, or trying to uncover and understand a phenomenon about which very little is known
(Ghauri et al. 1995, 85), like is the case in this research.
The aim of qualitative research is to illustrate real life, dealing with quality and meanings rather
than absolute quantity. The idea is that reality is incoherent, and therefore reality cannot be
dealt in arbitrary ways, but as clearly as possible (Hirsjärvi et al. 2003). A foundation for
qualitative research is to describe real life by understanding the research subject
comprehensively (Hirsjärvi, Remes & Sajavaara 2000, 152). Also, not having hypotheses is
characteristic to qualitative research (Eskola – Suoranta 2003, 19–20). In order to get a
comprehensive understanding on the study subject, a qualitative approach to this research
would be justified (see Zalan – Lewis 2004, 510). Moreover, the author’s aim is to find new
insights and to learn about this subject, thus supporting the choice of qualitative research
approach (see Eskola – Suoranta 2003, 19–20).
Basing one’s decisions only on a qualitative approach is not sufficient for carrying out a viable
research. One should in addition decide on the research strategy. Five major research strategies
are experiments, surveys, archival analysis, histories and case studies. This poses a challenge to
the author, as it is important to choose a strategy that would be convenient to carry out, as well
as that would be generating accurate research information (Yin 1985). Every type of empirical
research has an implicit, if not explicit, research design. The design is the logical sequence that
connects the empirical data to a study´s initial research questions and, ultimately, to its
conclusions (Yin 2003, 20). In qualitative research, conformability is seen as the criteria for
neutral approach. This can be reached when the researcher has conformed with various
techniques that the research is trustworthy and applicable to other scenarios (see Lincoln &
Guba 1985). A well and carefully done research design makes it possible for a reader to follow
the flow of the research and estimate its trustworthiness.
When design requirements have been specified, decisions must be made on how requirements
should be met and information collected. The type of required primary data depends upon the
research problem and research design. The normal choices of primary data collection in
qualitative research are observations, surveys and interviews in addition to other written or
visual material (Ghauri & Gronhaug 2002; Marshall & Rossman 2006). Practical reasons often
justify the choice of an interview. An interview can be more informative, less time consuming
and leave out other methods. Koskinen, Alasuutari and Peltonen (2005) also note that it is easy
to be misguided when observing a certain phenomenon if one does not confirm his or her
91
findings by interviewing. The selection of how to conduct the interview and who should be
interviewed, have a great importance in selecting the case for the research.
3.2 Interview as a data collection method
According to Kvale & Brinkmann (2009), the qualitative research interview attempts to
understand the world from the subjects´ point of view, to unfold the meaning of their
experiences, and to uncover their lived world prior to scientific explanations. The research
interview is based on conversations of daily life and is a professional conversation: it has a
purpose and it involves a specific approach and technique. An interview is a conversation that
has a structure and a purpose, and it is also an active process where interviewer and
interviewee produce knowledge through their relationship. The production of data goes
beyond a mechanical following of rules and rests upon the interviewers´ skills and situated
personal judgment in the posing of questions. Knowledge of the topic of the interview is in
particular required for the art of posing second questions when following up interviewee´s
answers (Kvale & Brinkmann 2009, 82). According to Stone (1978, 67) the major difference
between data collection via the questionnaire and the interview is that in the case of the former
technique the respondent reads the questions and records his responses to the questions, while
in the case of the latter method the interviewer both presents the questions to the subject and
records the elicited responses and thus they can be considered as alternative data collection
tools.
Interview reports have tended to evoke rather standardized objections about their quality from
the mainstream of modern social science (Kvale & Brinkmann 2009). Some claim that
interviews are not objective, but subjective. Still, the objectivity of the interview has to be
discussed specifically for each of the multiple meanings of objectivity, as relevant to the
interview inquiry in question. It is also often argued that interviews are too person dependent –
flexible context sensitive and dependent on the personal interrelationships. Furthermore,
interviews are claimed to be not trustworthy – unacknowledged bias may entirely invalidate the
results of an interview inquiry. A recognized bias or subjective perspective, may, however,
come to highlight specific aspects of phenomena investigated and bring new dimensions
forward. It is also claimed the interview findings are not generalizable because of too few
subjects. Still, in postmodern conceptions of social sciences the goal of global generalization is
replaced by a transferability of knowledge from one situation to another, taking into account
the contextuality and heterogeneity of social knowledge (Kvale & Brinkmann 2009, 169-171).
92
According to an epistemology that takes as its starting point the elimination of human
subjectivity in research, the qualitative interview based on interpersonal interaction is
unscientific. Although no single authoritative definition of science exists, according to which
the interview can be unequivocally be categorized as scientific or unscientific. Interview data
consist of meaningful statements based on interpretations; they are thus not strictly separated.
Interview statements can be ambigious and contradictory and the findings may not be
intersubjectively reproducible. The open structure of research interviewing is an asset as well as
a problem field in interview investigations: no standard rules or procedures exist for
conducting an interview (Kvale & Brinkmann 2009).
The key questions when planning an interview investigation are:
why: clarifying the purpose of the study
what: obtaining pre-knowledge of the subject matter to be investigated
how: becoming familiar with different techniques of interviewing and analyzing, and
deciding which to apply in order to obtain the intended knowledge.
In general, there are three different types of interviews classified by their prescriptive.
Structured interview refers normally to survey research interviews, where the researcher sets
the questions and the running order of them and offers even answer possibilities. A semi-
structured interview allows the interviewee more freedom. Answering in own words, deflection
from the question outline and even proposal of own questions are made possible for the
interviewee. An unstructured interview strives to minimize the influence of the researcher on
the interview. At clearest form, the interviewer has only a general interest that he/she wants to
talk about with the interviewee (Koskinen et al. 2005). In the course of an interview, the
subjects can change their descriptions of, and attitudes toward, a theme. They may discover
new aspects of the themes they are describing, and suddenly see relations that they had not
been aware of earlier (Kvale & Brinkmann 2009, 31).
In an interview, the aim is to collect information in a methodically determined way. Interviews
are conducted under circumstances set by the interviewer (Hirsjärvi & Hurme 1995). While
interviewing, the interviewer can make observations and control the interview situation and
environment. The interviewer can note possible disturbing effects during the interview or
perceive unwillingness of the interviewee that affect on the validity of the research (Malhotra &
Birks 2006). As Kvale and Brinkmann (2009, 164) note, the quality of an interview is decisive for
93
the quality of the subsequent analysis, verification, and reporting of the interview findings. It
can be monitored through six quality criteria:
the extent of spontaneous, rich, specific and relevant answers from the interviewee
the extent of short interviewer questions and longer interviewee answers
the degree to which the interviewer follows up and clarifies the meanings of the
relevant aspects of the answers
to a large extent, the interview being interpreted throughout the interview
the interviewer attempting to verify his or her interpretations of the subject´s answers
over the course of the interview
the interview being “self-reported”, a self-reliant story that hardly requires additional
explanations.
Due to the exploratory nature of this research, an interview is considered relevant: getting
information from a specialist who has deep knowledge on the industry puts in advance the
most relevant issues to be further developed. An exploratory interview is usually open, with
little preplanned structure. The interviewer introduces an issue, an area to be charted, or a
problem to be uncovered, then follows up on the subject´s answers and seeks new information
about and new angles on the topic (Kvale & Brinkmann 2009, 105-106). Due to the availability
of the interviewer, interviewing allows open-ended questions and the interviewer can ensure
that the complex instructions or sequences can be adhered to (Brewerton & Millward 2001, 74)
unlike when colleting data via questionnaires. This was the case in the course of this research
as well.
3.3 Data
3.3.1 Data collection
The data were collected using semi-structured interviews arranged along themes to provide a
wide scope for the data collection. Thematizing an interview study involves clarifying the
theme of the study – developing a conceptual and theoretical understanding of the phenomena
to be investigated in order to establish the base to which new knowledge will be added and
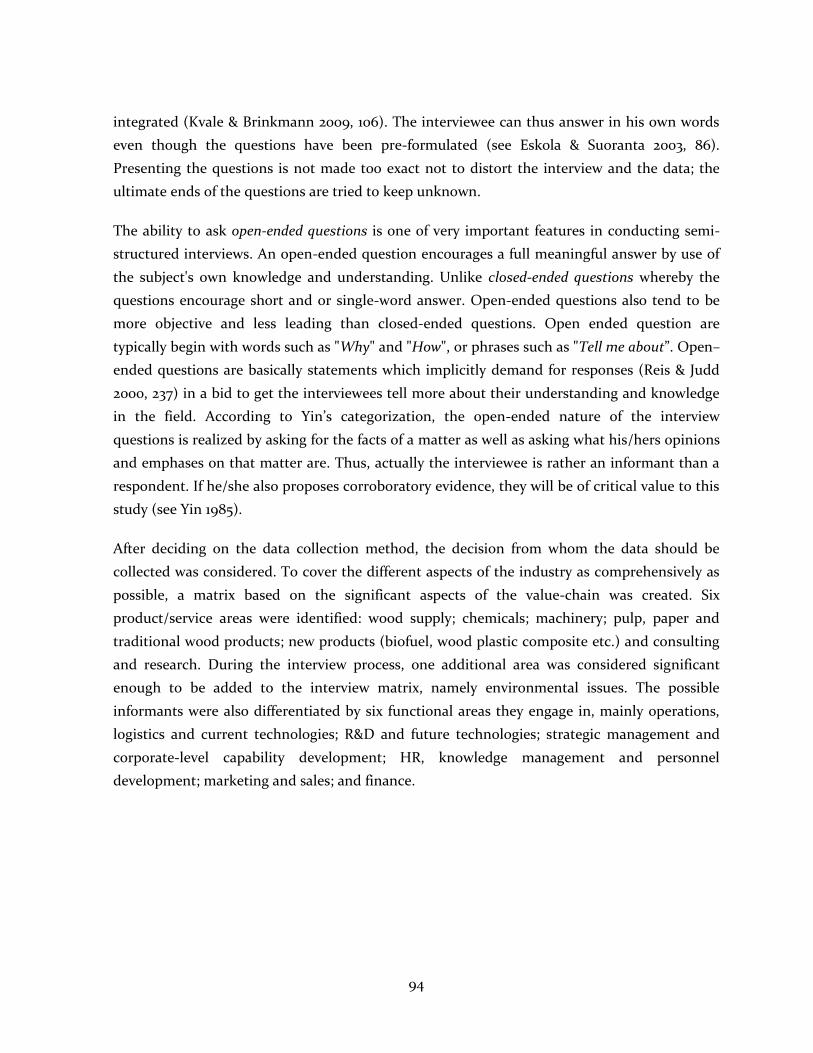
94
integrated (Kvale & Brinkmann 2009, 106). The interviewee can thus answer in his own words
even though the questions have been pre-formulated (see Eskola & Suoranta 2003, 86).
Presenting the questions is not made too exact not to distort the interview and the data; the
ultimate ends of the questions are tried to keep unknown.
The ability to ask open-ended questions is one of very important features in conducting semi-
structured interviews. An open-ended question encourages a full meaningful answer by use of
the subject's own knowledge and understanding. Unlike closed-ended questions whereby the
questions encourage short and or single-word answer. Open-ended questions also tend to be
more objective and less leading than closed-ended questions. Open ended question are
typically begin with words such as "Why" and "How", or phrases such as "Tell me about”. Open–
ended questions are basically statements which implicitly demand for responses (Reis & Judd
2000, 237) in a bid to get the interviewees tell more about their understanding and knowledge
in the field. According to Yin’s categorization, the open-ended nature of the interview
questions is realized by asking for the facts of a matter as well as asking what his/hers opinions
and emphases on that matter are. Thus, actually the interviewee is rather an informant than a
respondent. If he/she also proposes corroboratory evidence, they will be of critical value to this
study (see Yin 1985).
After deciding on the data collection method, the decision from whom the data should be
collected was considered. To cover the different aspects of the industry as comprehensively as
possible, a matrix based on the significant aspects of the value-chain was created. Six
product/service areas were identified: wood supply; chemicals; machinery; pulp, paper and
traditional wood products; new products (biofuel, wood plastic composite etc.) and consulting
and research. During the interview process, one additional area was considered significant
enough to be added to the interview matrix, namely environmental issues. The possible
informants were also differentiated by six functional areas they engage in, mainly operations,
logistics and current technologies; R&D and future technologies; strategic management and
corporate-level capability development; HR, knowledge management and personnel
development; marketing and sales; and finance.
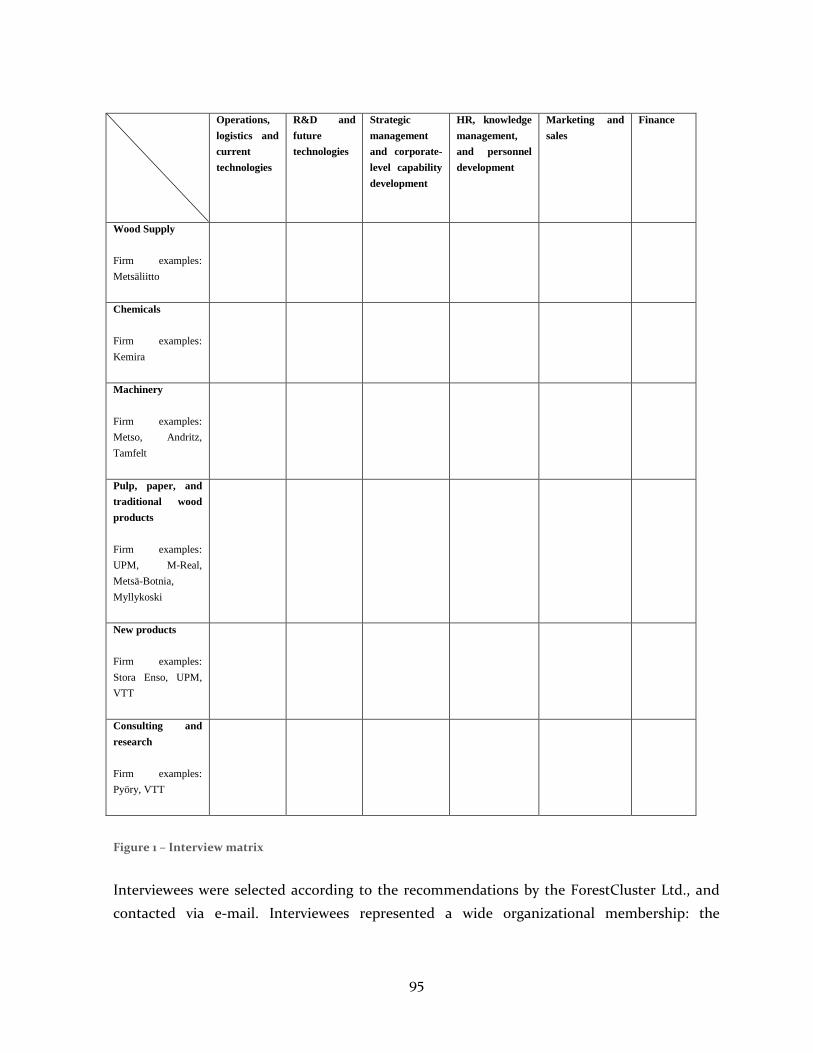
95
Operations,
logistics and
current
technologies
R&D and
future
technologies
Strategic
management
and corporate-
level capability
development
HR, knowledge
management,
and personnel
development
Marketing and
sales
Finance
Wood Supply
Firm examples:
Metsäliitto
Chemicals
Firm examples:
Kemira
Machinery
Firm examples:
Metso, Andritz,
Tamfelt
Pulp, paper, and
traditional wood
products
Firm examples:
UPM, M-Real,
Metsä-Botnia,
Myllykoski
New products
Firm examples:
Stora Enso, UPM,
VTT
Consulting and
research
Firm examples:
Pyöry, VTT
Figure 1 – Interview matrix
Interviewees were selected according to the recommendations by the ForestCluster Ltd., and
contacted via e-mail. Interviewees represented a wide organizational membership: the
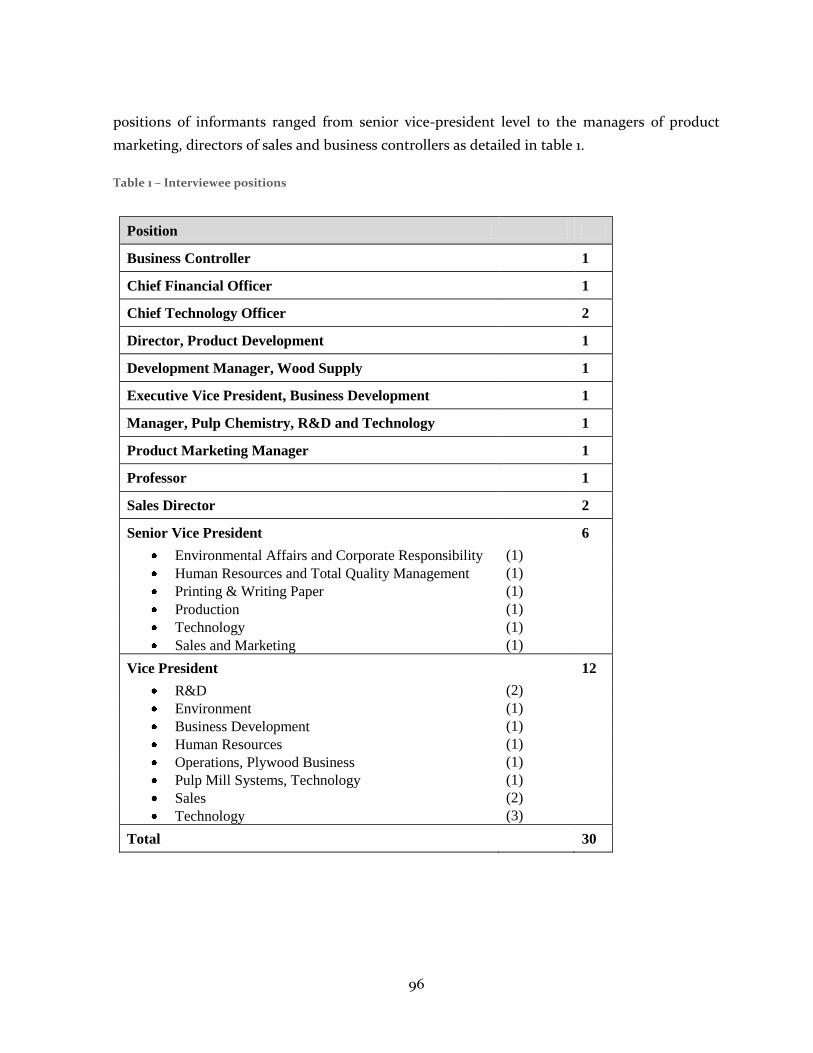
96
positions of informants ranged from senior vice-president level to the managers of product
marketing, directors of sales and business controllers as detailed in table 1.
Table 1 – Interviewee positions
Position
Business Controller
1
Chief Financial Officer
1
Chief Technology Officer
2
Director, Product Development
1
Development Manager, Wood Supply
1
Executive Vice President, Business Development
1
Manager, Pulp Chemistry, R&D and Technology
1
Product Marketing Manager
1
Professor
1
Sales Director
2
Senior Vice President
6
Environmental Affairs and Corporate Responsibility (1)
Human Resources and Total Quality Management (1)
Printing & Writing Paper (1)
Production (1)
Technology (1)
Sales and Marketing (1)
Vice President
12
R&D (2)
Environment (1)
Business Development (1)
Human Resources (1)
Operations, Plywood Business (1)
Pulp Mill Systems, Technology (1)
Sales (2)
Technology (3)
Total
30
97
During the time period from September 2009 to April 2010, a total of 30 interviews were
conducted. Most of the interviews took place in the premises of the organization the
interviewee represented, excepting one interview which was conducted through telephone. In
most of the interviews, two interviewers were present. The duration of the interviews ranged
between 40 minutes and one and a half an hour, the average being approximately one hour.
The interviews were conducted in Finnish because both the interviewers and the interviewees
spoke Finnish fluently. Hence, the quotations represented in following sections are translated
from Finnish to English.
In the beginning of the interview, the interviewees were explained the purpose of the research.
They were also asked if the interviews could be audio-recorded and notes could be taken.
However, the issue of confidentiality was emphasized. All except one of the interviews were
audio-recorded. Detailed notes of the non-recorded interview were taken during the interview
and then transcribed as soon as possible after the interview. The interviewees were also
explained some key concepts related to the interview questions in order to make sure that they
understood these concepts same way than the interviewer did. The actual interview questions
asked related to the background of the interviewee and their experience in the industry. After
these introductory questions, the actual focus of this research was introduced.
After the interview, the transcription was sent to the informants via e-mail for further remarks
and corrections. Besides, a draft of preliminary results was sent to the interviewees in April 2010
for prospective comments.
3.3.2 Interview outline
A central instrument that guides the interview is a clear outline. The two principal functions
are to make sure the interviewee presents the required questions and to let the interview flow
as naturally as possible. Researchers argue that the outline works as a memory tool that helps
to realize what has already been covered and what still needs to be emphasized (Koskinen et al.
2005).
An interview outline was formed based on the review of the literature and several discussions
between the interviewing team. The interview outline was divided in three themes:
Exploitation. It refers to the capabilities which are related to the incremental
improvements. Exploitation actions are considered important because they provide the
basis for more radical innovations.
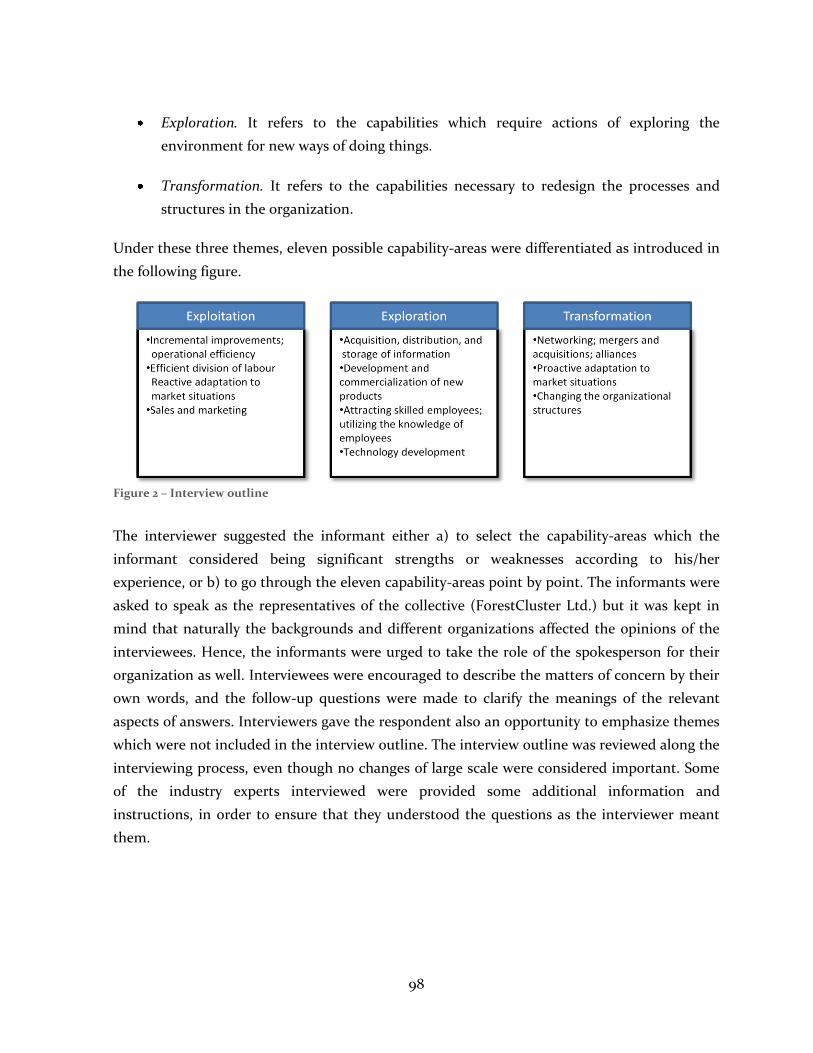
98
Exploration. It refers to the capabilities which require actions of exploring the
environment for new ways of doing things.
Transformation. It refers to the capabilities necessary to redesign the processes and
structures in the organization.
Under these three themes, eleven possible capability-areas were differentiated as introduced in
the following figure.
Figure 2 – Interview outline
The interviewer suggested the informant either a) to select the capability-areas which the
informant considered being significant strengths or weaknesses according to his/her
experience, or b) to go through the eleven capability-areas point by point. The informants were
asked to speak as the representatives of the collective (ForestCluster Ltd.) but it was kept in
mind that naturally the backgrounds and different organizations affected the opinions of the
interviewees. Hence, the informants were urged to take the role of the spokesperson for their
organization as well. Interviewees were encouraged to describe the matters of concern by their
own words, and the follow-up questions were made to clarify the meanings of the relevant
aspects of answers. Interviewers gave the respondent also an opportunity to emphasize themes
which were not included in the interview outline. The interview outline was reviewed along the
interviewing process, even though no changes of large scale were considered important. Some
of the industry experts interviewed were provided some additional information and
instructions, in order to ensure that they understood the questions as the interviewer meant
them.
99
3.3.3 Data analysis
The interpretation of qualitative data may be seen as the most difficult task in a case study. A
challenge is that data analysis must be connected to data collection during the whole research.
Consequently theory develops as the data is gathered (Ghauri 2004, 117). The process of data
analysis includes clarifying and understanding text data, preparing the data for interpretation
(Creswell 2003, 190). Generic steps may be followed to analyze the data (Creswell 2003, 191–192):
(1) Organizing and preparing the data for analysis, (2) Obtaining a general sense of the data by
reading it through, (3) Analyzing the data in a more detailed manner by coding it, (4) Using the
coding process to construct a description of the phenomenon and themes for analysis, (5)
Advancing how the description and themes will be represented in the research text, and (6)
Making an interpretation on the data. Analysis of data does not take place in a single stage after
collecting the data. It is a continuous, systematic process which runs simultaneously with data
collection. In analyzing qualitative data, the aim is to produce new information by clarifying
the data with the purpose of condensing the data without losing information. In other words, it
aims at increasing the informative value of data by clarifying and simplifying scattered data.
Data analysis is the process of bringing order, structure and meaning to the mass of
unstructured data. While undertaking fieldwork one should be searching for common themes
start coding or develop some early concepts (Daymon & Holloway 2002; Ghauri & Gronhaug
2002).
According to Eskola and Suoranta (2003), there is three ways of analyzing interviews. They can
be resolved and directly analyzed by trusting the intuition of the researcher. It is also possible
to resolve the data and use coding. The third way is to combine the above with resolving and
coding that leads the researcher to data analysis. Interviewer may learn throughout an
investigation. The conversations with the subjects can extend and alter his or her
understanding of the phenomena. The interviewees bring forth new and unexpected aspects of
the phenomena studied; and during analysis of the transcribed interviews new distinctions may
be discovered (Kvale & Brinkmann 2009, 112).
The researchers first transcribed the interview word for word for getting a tool for analysis,
except for one interviewee who wished her interview not to be transcribed. It is easier to have a
glance over the entity of the interview, and thus all the material will be handled, not forgetting
anything of importance from the analysis. Second, the transcriptions were read through for
obtaining a general sense of what it involves.
100
Then, the interviews were reread thoroughly several times, simultaneously marking the
similarities and differences among the words, phrases, terms, and labels the informants (see
Corley, Gioia & Nag 2007; Corley & Gioia 2004). After reading through the transcriptions, a
computer-based analysis program, Atlas.ti, was utilized to support and systematize the data
coding. It enables the recording and cross-referencing the codes emerging from the data. With
the support of the program, there was an effort to discern the codes that were similar in their
essence in order to discern first-order categories. According to Corley and Gioia (2007), first-
order categories employ language expressing similar ideas among the informants. Then, the
coding of interviews was continued in this manner until no more distinct conceptual patterns
shared by the informants could be ascertained.
Following the analysis strategy introduced by Corley, Gioia and Nag (2007); and Corley and
Gioia (2004), the development of the first-order themes was followed by discerning
relationships among these categories. These links enabled clustering them into second-order
themes, which refer to researcher-induced concepts in a more abstract level. The second-order
themes were then collated into overarching dimensions in order to finish a framework linking
the issues emerging from the data.
In the following chapter, the results of the data analysis are represented by introducing one
dimension at a time. The figures in the beginning of the chapters describe the dimensions,
second-order themes, and first-order categories that are discussed in the sub-chapters.
3.3.4 Trustworthiness of the study
The issue of trustworthiness is for the researcher to persuade his or her audiences that the
findings of the study are worth taking into account of and paying attention to. To enable this
persuasion, researchers have conventionally found it practical to consider the following four
issues: truth value, applicability, consistency and neutrality of study (Lincoln & Guba 1985).
According to Ghauri et al. (1995, 95) data which cannot be statistically analyzed and are
difficult to measure in numbers are often called qualitative; such as strong, weak, difficult and
easy. One main problem of analyzing qualitative data is that, on one hand the number of
observations is so low and, on the other hand, the information on the case(s) is so in-depth that
it is very easy for the researcher to be drawn into the sheer volume of cases. With qualitative
methods the analysis is also difficult because data collection and analysis are often done
simultaneously, and sometimes the research problem is even formulated or reformulated at the
same time (Ghauri et al. 1995, 95- 96).
101
Issues of reliability and validity go beyond technical or conceptual concerns and raise
epistemological questions about the objectivity of knowledge produced through interview
research. In principle, a well-crafted interview can be an objective research method in the sense
of being unbiased. Contrary to common opinion, knowledge produced in interviews need not
be subjective, but qualitative interviews may, in principle, be an objective mode of inquiry with
respect to several key meanings of objectivity. Reliability pertains to the consistency and
trustworthiness of research findings; it is often treated in relation to the issue of whether a
finding is reproducible at other times and by other researchers. This concerns whether the
subjects will change their answers during an interview and whether they will give different
replies to different interviewers (Kvale & Brinkmann 2009).
Validation comes to depend on the quality of craftsmanship during an investigation, on
continually checking, questioning and theoretically interpreting the findings. The validity of an
investigation rests upon the soundness of the theoretical presuppositions of a study and upon
the logic of the derivations from theory to the research questions of the study. The validity of
knowledge produced involves the adequacy of the design and the methods used. The validity of
interviewing pertains to the trustworthiness and the quality of interviewing – careful
questioning to the meaning what is said and a continual checking of the information obtained
(Kvale & Brinkmann 2009).
The objective of testing reliability is to minimize the errors and biases in a study. The general
way of approaching the reliability problem is to make as many steps as operational as possible
(Yin 2003, 37-38). The responsibility of the researcher is to provide a data base that makes
transferability judgments possible for potential appliers. The purpose of transferability is to
provide proper description of the methodological choices and case selection in order to enable
possible transfer (Lincoln & Guba 1985). Lincoln and Guba (1985) emphasize that researchers
cannot achieve complete transferability in qualitative studies, but the data should be described
in such detail that the potential appliers are able to judge the transferability themselves. Thus,
for a research to be transferable, the data must be collected in a transferable way, and the
selection of research focus must be explicit. Kirk and Miller (1985, 22) refer to transparency as
“apparent validity” and it implies, that the reader of a qualitative research report is able to see
the basic processes of data collection (Rubin & Rubin 1995, 85). A transparent report allows the
reader to assess the intellectual strengths and weaknesses, the biases, and the
conscientiousness of the interviewer (Rubin & Rubin 1995, 85). In the course of this research,
the transparency has been achieved through thorough reporting the data collection process in
detail (see previous chapters), so that readers are able to evaluate how the research was
102
conducted. In order to able easy access to the data collected, it has been saved in the form of
recordings, and transcripts as well.
Several steps were taken to ensure the trustworthiness of the data. The reliability of this
research was increased mainly via the reliability of interview schedules. Before the interviews,
the respondents were explained the purpose of this research as well as the interview procedure.
They were notified about the audio-recorders and about the notes taken. However, it was
emphasized that the interviewees were not to be identified in the final results. The anonymity
to some extent even increases the reliability, as the interviewees may feel more confident
commenting on issues anonymously.
During the interviewing process, regular meetings were arranged between the industry experts
and the research group, in which the industry experts were shown drafts and preliminary
results of the interview study to comment on. The preliminary results of the study were also
represented in two seminars arranged to enable correspondence between research groups and
the representatives of ForestCluster Ltd., and to serve as a sounding board for propositions, and
to solicit questions about the data collection and analysis procedures.
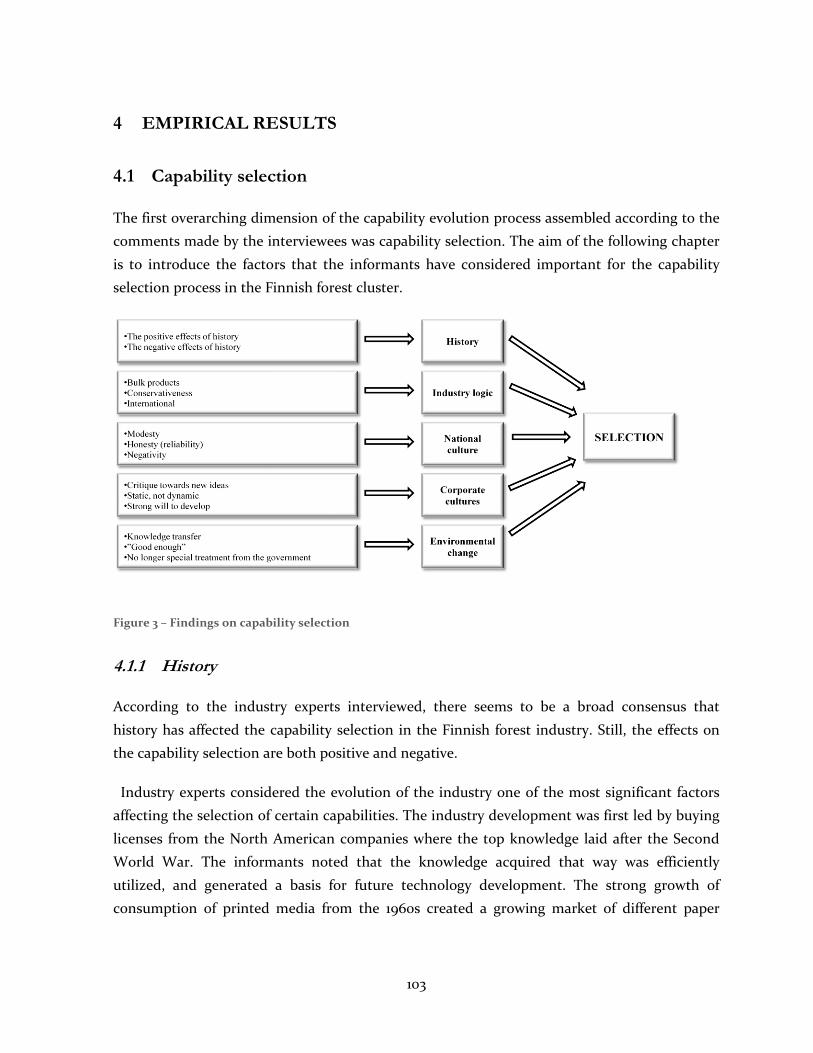
103
4 EMPIRICAL RESULTS
4.1 Capability selection
The first overarching dimension of the capability evolution process assembled according to the
comments made by the interviewees was capability selection. The aim of the following chapter
is to introduce the factors that the informants have considered important for the capability
selection process in the Finnish forest cluster.
Figure 3 – Findings on capability selection
4.1.1 History
According to the industry experts interviewed, there seems to be a broad consensus that
history has affected the capability selection in the Finnish forest industry. Still, the effects on
the capability selection are both positive and negative.
Industry experts considered the evolution of the industry one of the most significant factors
affecting the selection of certain capabilities. The industry development was first led by buying
licenses from the North American companies where the top knowledge laid after the Second
World War. The informants noted that the knowledge acquired that way was efficiently
utilized, and generated a basis for future technology development. The strong growth of
consumption of printed media from the 1960s created a growing market of different paper
104
products. Consumption of paper and cardboard products was incrementally increasing every
year. The enormous technological development progress from the 1970s to the 2000s was
gradually based on the profitability and technological system development. In the former
decades, it was typical to develop new products and innovations from the viewpoint that they
could lead to improvements in functional aspects. Hence, the informants suggested that it was
logical to concentrate on the capabilities which are related to development of technology and
processes.
The co-operation between Finnish forest industry firms seems to have been more intense in the
former decades. The joint research and development facilities enabled co-operative ventures
and innovations which have been introduced successfully. The establishment of joint sales and
marketing was mentioned as one of the distinctive features of the past decades. Interviewees
suggested that the joint marketing co-operatives were of high importance for the profitability,
and provided forest companies a strong position abroad. For example, it was noted that “Finns
have been largely the leaders of the technological area, and that has been based to the fact that
these clusters have been active inside the companies operating in multiple industries, and the
cooperation has been easier to understand.”
As ”the main idea was that not every firm should build their own sales channels – that we do
certain areas together and join forces, and that was a very smart move, and it kind of forced us
to co-operate”, these co-operative actions also deepened the networking capabilities between
domestic firms. The networks encouraged the firms to develop capabilities relating to reactive
adaptation, described by one informant as “rapid and flexible reactions” to market situations as
well.
However, also differing views were represented. Sales and marketing being shared, companies
had to face severe competition in other areas. “Marketing was co-operative. What was left,
then; it did not make sense to try to do anything else than compete in the areas of building
even more factories and negotiating the finances needed. It was quite primitive.” Some
informants regarded them leading into alienation between companies and their customers
which, in turn, resulted in the situation in which the capabilities related to customer
relationships were hindered. As one interviewee indicated, ”sales companies and competitors
thought that discourse with customers was unnecessary – it has left behind a culture in which
the communication with customers was not seen valuable.”
The environmental conditions in Finland, especially from the viewpoint of the forest industry
might have been among the most challenging in the world but also a trigger for development.
105
For example, logistics have been a very challenging task, and adapting to the Finnish
environmental conditions around the year have been the trigger into shaping capabilities
related to e.g. logistics. As an interviewee suggested, “When we have had to run this business
all year round, in every circumstance – we have improved here, or at least have been able to
adjust into these circumstantial factors.”
4.1.2 Industry logic
The industry experts interviewed considered forest industry still very conservative. The product
life-cycles have been long and the new product innovations fairly infrequent compared to other
industries. As one interviewee from pulp and paper industry noted, ”if you compare paper and
cardboard industry to tele communications, the product life-cycles tend to be about 52 weeks
[in tele communications industry]. And here [in paper industry], the product life-cycles are
approximately 100 years. New product innovations, they are relatively unusual.” Hence, the
commercialization capabilities have not been selected into development, as there has not been
a constant flow of new products. The conservativeness of the industry is also visible in the
attitudes towards change. As two informants from the paper industry indicated, ”we prefer to
do things the way it has always been done, the same products”; and “we are a paper producer,
we make newsprint, and it will be similar until the end.”
The commercialization of new products has not been that straight-forward without verification
of the credibility and proven savings. Hence, the conservative nature of the industry has
hindered capabilities of new product development and commercialization. The capabilities
selected into development have been mostly technological and related to manufacturing and
improving efficiency. As stated, “The way of thinking has been production-inspired, that is we
have developed technologies to improve efficiency.”; and “the operations models and processes
which have been pitched to the utmost.”
The bulk products seem to be the main source of core business but the profits of producing
them in Finland are ever declining because of the high costs of raw material and labor. Hence,
there is a strong need for “new products which might be sources of the cash flow in the future”.
Tightening profit margins have developed strong cost pressures to the companies in the
industry and hence, the improvements have been mostly incremental. As one informant
explained, ”paper is a commodity product and its real price will be declining until it reaches
zero. We have advanced productivity but the actual products.. Our forest companies, they base
their actions on the wood and do not fiddle with the value chain.”
106
It has been indicated that the forest industry products have been traditionally seen as
commodity and hence it is difficult for one production unit to differentiate itself from the
competing ones because the products sold are “of uniform quality and do not create changes”
in the processes of the customer. Product differentiation, if not impossible to conduct, was
considered unprofitable in most cases. “In these bulk markets, product differentiation creates
only new costs: development costs, logistics-related costs.. When you develop differentiated
product variants, all they create is costs – storage costs, for example.”
Some informants were also quite negative towards the capability of the industry to renew itself.
As a chief technological officer stated, “the innovators might come outside the forest industry.
Bio refineries and that kind of things.. The forest industry has been quite incompetent in
redefining itself”. Still, some informants saw possibilities in the “businesses created nearby”. It
was stated that “the forest companies could take their share” by offering their current
infrastructure to the new companies generated near by.
The internationalization of the industry has had its own influence on the capabilities in which
companies are willing to invest in. According to interviewees, the paper industry was the first
to internationalize in Finland. That image has traditionally facilitated the recruitments into the
forest industry. Several informants suggested that the most skilled and hard-working people
tended to seek their way into the forest sector. As an SVP from chemicals industry claimed, “it
was like US Navy: join the navy, see the world. And those who went abroad, they worked 24
hours a day.” In the past decade, the amount of competitors has increased when companies
outside the Western countries have entered the field. Even though Western companies are still
suspicious of the quality of the outputs of the more unfamiliar producers the “border line has
been shifting towards the approval of even more crucial aspects relating to production from a
wider array of firms.” As an informant from machine building industry indicated, “five years
ago no Western factory would even consider the possibility of importing equipment from
China, no way. But then, let´s say about two years ago, they began to approve some parts which
were not in contact with processes. They were like, okay – why not they do it, it is not the end
of the world.”
4.1.3 National culture
Among other factors introduced, it seems that national culture direct the capability selection
process. In certain situations, honesty – “obeying the laws and willingness to do the right
things”, gives a positive added value to the business but in some other situations it does not.
107
Positive added value could be created when the customer values the reliability of the Finnish
way of dealing with situations. The Finns were said to quite commonly underestimate their
products: “this is quite good, but then there are certain aspects that could be improved”. Some
customers may appreciate the modest attitude but some may claim that it creates uncertainty.
Typical feature mentioned of Finnish national culture, modesty, is noted as one of the factors
that hinder marketing capabilities of the forest cluster companies. Some informants claimed
that modesty could lead as far as international competitors “stealing” the ideas of the Finnish
counterparts. Interviewees assumed that also the “introvert nature of the Finns” might hinder
the capability be able to commercialize their ideas and sell the products or services.
Some informants claimed that modesty and negativity have led to an atmosphere in which the
striving for consensus has been a factor hindering innovative capabilities. Some interviewees
commented that it has been a challenge to present differing views in the organizations.
However, the changing work environment and new generation of employees have shaken the
traditional way of thinking. One interviewee noted that ”working in the community is
nowadays quite different. When new generations of employees are recruited, the ways of co-
operation tend to be distinct from the previous ones.” It was also pointed out that the
willingness to discuss controversial topics “differs from the traditional Finnish paper mill
community” when new generations of employees change the way of thinking.
4.1.4 Firm culture
The static nature of the industry has affected, for example, the managerial capabilities. “The
besetting sin” has been that employees with strong specialized knowledge bases are promoted
to managerial positions, and consequently “he or she may not be able to adapt to changing
role.” They might still “want to concentrate on their specialized area of knowledge, and ignore
the importance of the leadership of people.” Also the vacancy mindset has had its consequences
on the rigidity of the industry. The organization structures have been inflexible because of the
many organization levels created around central employees. As a VP from machine building
industry remarked, “when we move up in the organization, everyone has a certain, limited box
– kind of an own organization, which builds up several mini-organizations.” It has also been
noted that ”when organizations grow and develop more organization levels”, the possibilities
for proactive adaptation decrease.
108
The mindset mentioned above has also had its effects on the capabilities to absorb and exploit
the information from outside the company borders. As one informant argued, the traditional
way of thinking has been based “on the thought that we know our stuff and can manage on our
own.. We haven´t admitted that we could learn from the knowledge outside the organization.”
Even if the organizations would be willing to remove some vacancies to strengthen the
adaptability, they would have to negotiate a unanimous decision with the trade unions which,
according to one interviewee, “have made the decision making process extremely stiff.”
According to the interviewees, the openness towards new ideas and “radical ways of thinking”
has been traditionally underestimated in the Finnish forest cluster firms. Interviewees
indicated that “when someone comes out with an idea, threatening factors are usually
highlighted” instead of “trying to develop the idea further and discover the possible positive
aspects.” Technological solutions might have taken the primary role in both implementation of
”new ideas” and redesign of business processes, yet the main challenges are seldom purely
technological. That might be the case because technological problems are often more straight
forward to solve because they can be better observed, defined and they have a “right” solution.
Also, breaking the long-standing structures and building a new operations model is considered
challenging because of the critique towards new ways of doing things and previous failures. As
one informant stated, “A considerable portion of staff argue that it will not be possible, and
base their arguments on the fact that it wasn´t possible in, for example, 1973.”
However, willingness to develop leading products and technologies has been a significant
driving force in the industry. “The engineer-like willingness to take ideas further” has created
the role of Finnish companies as the leading technology producers. When investing, there has
been an attitude of “always wanting to bring in some new, to be forerunners.” Among
informants, these attitudes were criticized as well. As noted by one interviewee, the industry
players “somehow got stuck in being technology slaves. I mean, we have always tried to develop
bigger, more beautiful and more complex.” An interviewee from the chemicals industry even
used the word “over-engineering” to describe the prevailing orientation in the research and
development in the industry.
4.1.5 Environmental change
Changes in the business environment, for example distribution of manufacturing into the
countries in which the raw material and labor costs are more affordable, have posed challenges
for the knowledge transfer. An interviewee from the chemicals industry noted that maintaining
109
competitiveness might require ”looking into the countries where the pulp making will be in the
future. We can still develop technology even if it would be used somewhere else – there is a
strong demand for know-how.” The comments reflect the idea that in changing environment,
organizations are forced to focus on knowledge sharing capabilities. When establishing new
production plants abroad, for example, the companies need to acquire the capabilities to
transfer the process knowledge needed for the successful establishment of production plants.
As a SVP from machine building industry cited, “in the global business, the core knowledge is
very limited resource. It is a big challenge how you can put this resource into supporting China,
Japan, Brazil and all those countries at the same time.”
Still, several interviewees were concerned about the extent of knowledge spilling over abroad.
The interviewees have regarded the declining path of the North American firms as an
exemplary on the issue. When the investment rate in North America was its highest, “the
North-American companies flourished”. The top knowledge seemed to be a couple of decades
ago still in North America and then “the Scandinavian forest industry began to develop and
also the technological know-how followed.” Some of the informants also pointed out that many
companies “are thinking of themselves, not the national interest”. As an interviewee from the
machine building industry noted, “if this industry is mitigated in Finland, we will have to move
with our research and development resources towards the countries which have the best
hands-on know-how.”
The informants regarded the capability to produce high-quality outputs a particular strength of
the industry. However, it was stated that the importance of quality factors has been declined
and the competition is based mainly on the price of the product. As an informant noted, “Low
cost good enough – there is no need to produce the best quality.” There has been a growing
need for complexity reduction, thus ”not that many basically similar product types are needed”.
As an informant stated, ”we don´t have to provide the best quality anymore – instead, we
should have the quality fit for purpose. Good enough is enough.”
According to the interviewees, the cost pressures have limited the opportunities to develop new
products. “There is always the threat that the hunt of cost savings drives us to a situation where
development is not worthwhile any longer.” It has been indicated that “many competitors have
succeeded without developing anything”. Instead, different kinds of capabilities have reasserted
their importance. Capability to build relationships with customers, for example, has been noted
to be of high significance. As an interviewee from paper industry noted, “We have clearly aimed
at building partnerships with the customer so that we can further improve and develop the
110
products we sell well. It could be bulk sales but we can also add value by ensuring that the
performance of the product in the customer´s processes is of high value.”
Traditionally, the forest industry has received some special treatment from the government.
The policy makers have considered that the “relatively big and responsible domestic buyers are
a good thing.” It has also been indicated that former solution and “gimmick” towards the
profitability challenges was the devaluation of the Finnish currency. Joining the Euro area has
abolished that possibility and “the problems won´t be solved so easily anymore.” Tightening
competition regulations have had an effect on the selection of the capabilities firms want to
acquire and develop, as well. According to interviewees, the openness and transparency in the
forest industry has been declining radically in the last decades. One of the interviewees even
stated that the “operations of the Competition Office have made discourse impossible.” Several
interviewees argued that the competition regulations have had a considerable effect on the
possibilities to develop collaboration capabilities and build networks in which information
could be exchanged. “Nowadays we can co-operate through different research arenas but the
actual development which might lead to innovation – there, the boundaries are rapidly faced.”
In some cases, restriction of collaboration is considered going to the extremes. For example,
one informant told us a story of him and his colleague from competing organization settling a
casual appointment of going to see a ice-hockey game together. “We both had to report the
event in detail to our superiors, and write a certain memo about the reason for the meeting and
guarantee that we will not be discussing work-related topics, and sign on the dotted line.”
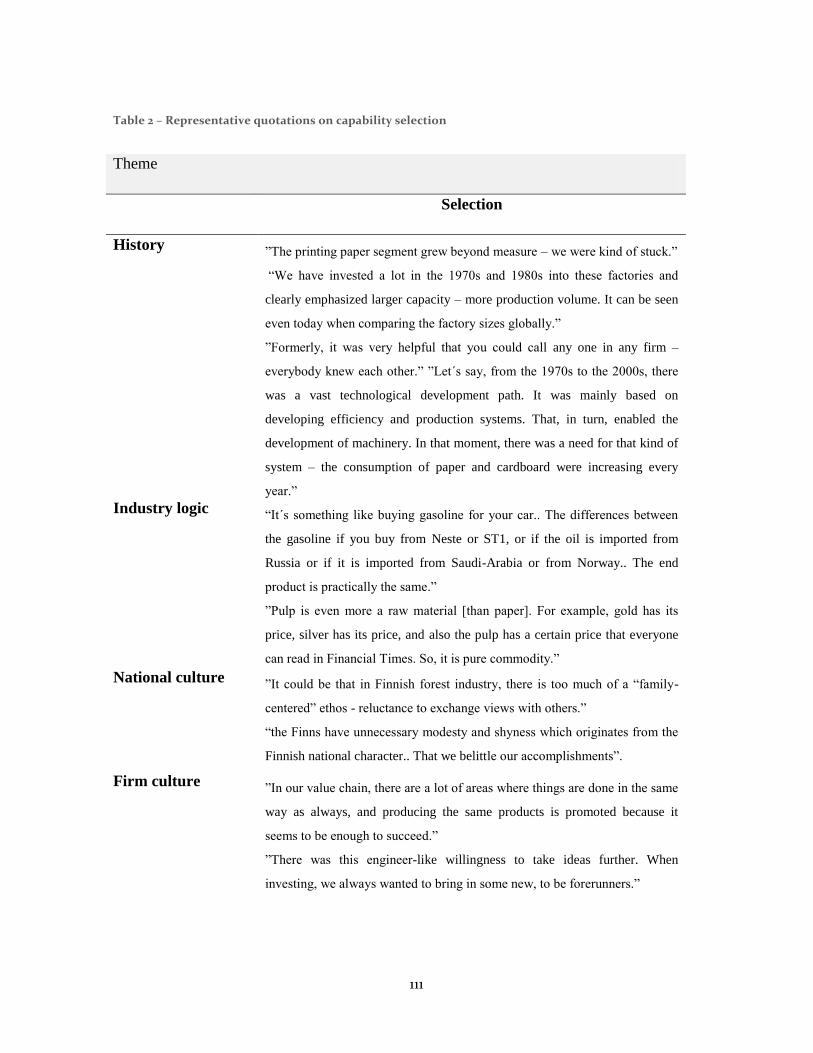
111
Table 2 – Representative quotations on capability selection
Theme
Selection
History ”The printing paper segment grew beyond measure – we were kind of stuck.”
“We have invested a lot in the 1970s and 1980s into these factories and
clearly emphasized larger capacity – more production volume. It can be seen
even today when comparing the factory sizes globally.”
”Formerly, it was very helpful that you could call any one in any firm –
everybody knew each other.” ”Let´s say, from the 1970s to the 2000s, there
was a vast technological development path. It was mainly based on
developing efficiency and production systems. That, in turn, enabled the
development of machinery. In that moment, there was a need for that kind of
system – the consumption of paper and cardboard were increasing every
year.”
Industry logic “It´s something like buying gasoline for your car.. The differences between
the gasoline if you buy from Neste or ST1, or if the oil is imported from
Russia or if it is imported from Saudi-Arabia or from Norway.. The end
product is practically the same.”
”Pulp is even more a raw material [than paper]. For example, gold has its
price, silver has its price, and also the pulp has a certain price that everyone
can read in Financial Times. So, it is pure commodity.”
National culture ”It could be that in Finnish forest industry, there is too much of a “family-
centered” ethos - reluctance to exchange views with others.”
“the Finns have unnecessary modesty and shyness which originates from the
Finnish national character.. That we belittle our accomplishments”.
Firm culture ”In our value chain, there are a lot of areas where things are done in the same
way as always, and producing the same products is promoted because it
seems to be enough to succeed.”
”There was this engineer-like willingness to take ideas further. When
investing, we always wanted to bring in some new, to be forerunners.”
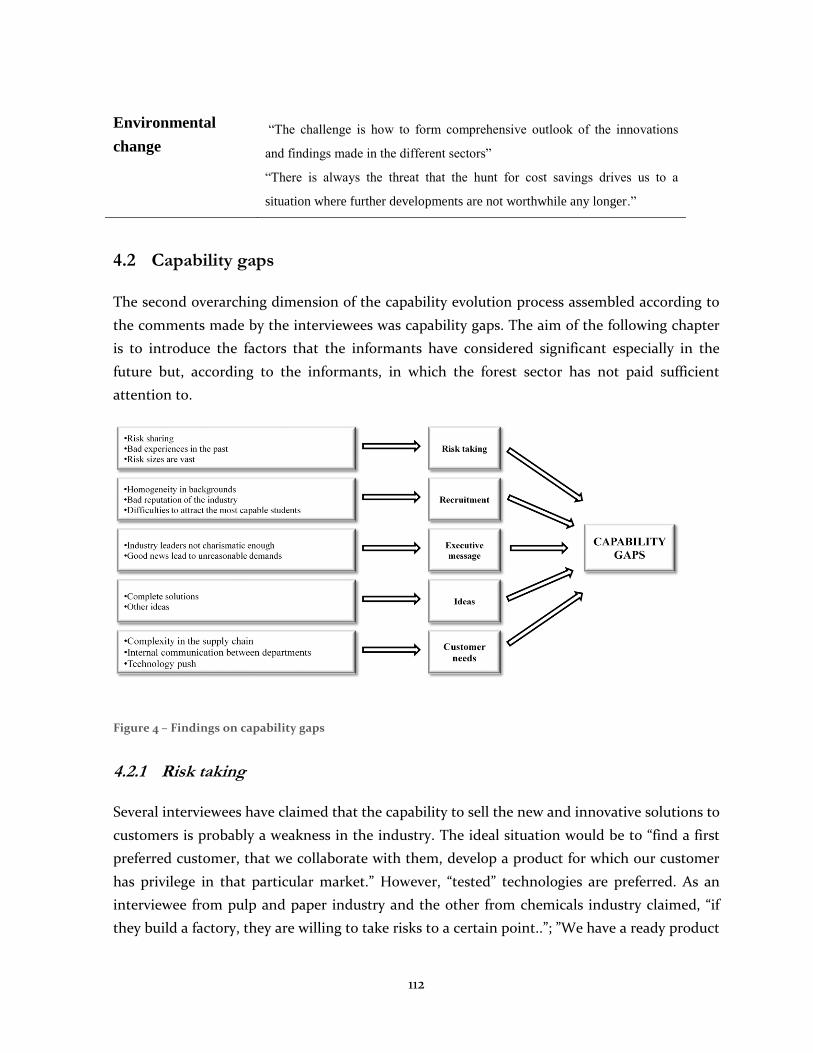
112
Environmental
change
“The challenge is how to form comprehensive outlook of the innovations
and findings made in the different sectors”
“There is always the threat that the hunt for cost savings drives us to a
situation where further developments are not worthwhile any longer.”
4.2 Capability gaps
The second overarching dimension of the capability evolution process assembled according to
the comments made by the interviewees was capability gaps. The aim of the following chapter
is to introduce the factors that the informants have considered significant especially in the
future but, according to the informants, in which the forest sector has not paid sufficient
attention to.
Figure 4 – Findings on capability gaps
4.2.1 Risk taking
Several interviewees have claimed that the capability to sell the new and innovative solutions to
customers is probably a weakness in the industry. The ideal situation would be to “find a first
preferred customer, that we collaborate with them, develop a product for which our customer
has privilege in that particular market.” However, “tested” technologies are preferred. As an
interviewee from pulp and paper industry and the other from chemicals industry claimed, “if
they build a factory, they are willing to take risks to a certain point..”; ”We have a ready product
113
but we haven´t found the customer who would be willing to buy it.” A R&D manager also
indicated, ” If one has developed a new piece of machinery, customers are not ready to bring it
on line before they see that it functions well in two or three other factories.” According to
respondents, customers are actually interested in new products and services “but there should
be vast production volumes” if they are willing to take the risk and invest on completely new
solutions or to modify existing structures. As stated by a R&D manager, “Changing the big
picture, it requires kind of a snap in the brain so that you go along.” However, the interviewees
pointed out that risk sharing possibilities should be created, for instance, through ”developing
new businesses” which should begin with “promoting entrepreneurship.”
However, carefulness and even risk aversion are considered logical as risk sizes can be
measured in billions. When ”it is the case of a couple of millions, the firms are willing to take
the risks and try out new. But considering the change of the whole production unit, the fear of
malfunctions is often overwhelming. It is about several dozens, even hundreds of millions. No
one is willing to risk the functionality of the organization as a whole.” The networking
capabilities with customers should be also advanced because it was seen decreasing risk
aversion.
The negative experiences from the past tend to affect the decisions concerning risk taking. An
informant named an example of a large pulp mill which was built in Germany in the 1990s and
was based on completely new technology. Several mistakes were made, and quite rapidly they
had to close the whole production unit. “These kinds of examples of the radical thought have
induced that the firms are not so enthusiastic to search for large changes.” Hence, the
interviewees call for the attitudes which would be more accepting towards possible failures. ”In
EU, and especially in Finland.. There should be this, encouraging.. That not everything should
be perfect at once – that one could experiment, and succeed, and fail.”
4.2.2 Recruitment
Several informants pointed out that the development of the present human resources has been
a particular strength in the forest industry companies. Hence, the companies have invested in
maintaining and broadening the capability base of the employees. However, the need of
substance knowledge of the application area has led to the recruitment of the employees with
homogenous backgrounds. As a SVP of research and development stated, “Our problem is that
we have too many paper engineers when we should have physicists, chemists, mathematicians,
and then a couple of paper engineers.” The recruitment of people with differing backgrounds
114
was seen as important factor in renewal process. The current needs of broader employee base
were clearly emphasized in several interviews, but the “profiles are too often created based on
the existing structure.. We should clearly reform in a larger scale” As an informant from
machine building industry stated, the recruitment should also support the changing strategies:
“to become a global service provider, we need a wide range of employees. We should hire them
all around the world and they should mainly be local talents. From knowledge-perspective, it
becomes a challenge that we should have a network through which we could recruit skilled
people around the world.”
Traditional educational structures in Finland were considered well-established but they might
“feed these competences built in the past. And then, the young people study both qualitatively
and quantitatively the things that were important in the past.” Also, the attractiveness of the
industry was seen as poor. As stated, ”the educational base has traditionally been very good but
the problem is that young people are not funneled into the industry anymore.” The image of
the industry, created mostly be public media reporting “plant closures, lay-offs and such” has
led to a situation in which “the attractiveness of the whole industry has been such that lately no
distinct talents have found their way to the relevant education. When looking into the
admittance statistics into the universities, this industry is quite poor rated.”
4.2.3 Executive message
Creating a positive image for the industry is also seen important as a means of attracting skilled
individuals, “when we have a positive drive, it creates an environment in which people want to
come to.” As a chief technology put it, “We are in big trouble right now because we should
report our issues truthfully - We have plenty of things with which we can be able to compete in
the future.” The overall understanding was that the leaders should not delude either general
public or current employees with misinformation or palliate the truth. Instead, they should
create an image of the industry in which “something new will arise from these ruins”. As a
means of creating the image, one interviewee proposed that the managers ”should not always
complain in the media how miserable this is.. Instead, they should be giving an example that
this is not a dying business.”
As interviewees indicated, the charisma of the messenger has an impact on the comprehension
of the message. As one informant noted “on account of everything, it would be worthwhile to
have media-capable leaders” in the industry. Other interviewee noted that “most of the CEOs
are, kind of, gray.” He also pointed out that ”they are part of the group of engineers who act
115
based on the facts” and even though he did not deny that they are working hard, he stressed
that “they have not enough charisma to be front men of this industry”. Another informant
noted that the front men “are not painting a big picture about the direction where we are
headed, or give a good example.”
According to the interviewees, delivering the executive message should be given more
importance. The core communication “should be verified from the executive group, and it
should be veracious and transparent” and the companies should “have clear core messages, and
repeat them” because there is always someone present who hears that message for the first
time. However, informants recognized that those messages are not so often delivered to general
public, and the emphasis of the ”communications relate to the stock exchange values,
information about new sales and such.”
Even the good news may be difficult to pass to the general public. Many interviewees noted
that delivering positive news may result to unreasonable demands. ”If you say anything more or
less positive, there is always someone demanding something”. The “unreasonable demands”
seemed to be related to the media fuelling an erroneous impression that change and
innovations could be created “overnight”. As one interviewee told us, “the thought of renewal
through research and development taking place during few months is ridiculous.”
4.2.4 Ideas
All companies need a rich portfolio of ideas where to choose the ones which will be discussed
and developed further. According to the informants, there are several areas which have a strong
profit potential but which are not sufficiently exploited. For example, several respondents
considered environmental knowledge and corporate social responsibility issues as being fields
of know-how which could have potential, if sufficiently commercialized, to increase their
importance in the future.
Also offering complete solutions is increasing its significance in the forest industry. Several
informants have emphasized the importance of finding the synergies between the whole
supply-chain and delivering larger concepts. As a VP from machine building sector noted, “we
don´t get the inquiry to deliver certain parts of the factory that often any more. It is more and
more like, deliver the whole concept.” For example, the combination of products and services is
regarded as a potential area of growth. It seems that utilizing the product and service
combinations has occurred earlier as well but the companies have not been able to
116
commercialize the service-side of the combination. As one informant noted, the service aspects
related to products have been ”a tool for broadening our market share. We have not been able
to commercialize it, though.” After-sales support, for instance, was one particular issue
mentioned several times during the interviews from which the forest companies could take
advantage of.
4.2.5 Customer needs
The informants have stressed the growing importance of the knowledge of the end customer´s
needs. As stated by one informant, ”it is not necessarily crucial what your primary customer
thinks about the product. Often the more crucial factor is that what their customer
appreciates.” The networking capabilities through the whole supply-chain are regarded
insufficient among the interviewees. As an interviewee pointed out, the companies should
better ”understand that the customer has its own customers, and that their needs could wiggle
the whole supply chain.”
Complexity in the supply chain has been stated to be one of the key barriers hindering the
innovative capabilities. Complicated products require certain level of expertise from all the
members of the supply chain, and therefore represent a barrier to involving intermediaries. As
one informant from paper industry claimed, “We aren´t just getting over that there are so many
people that block the message away. For example, in the fine paper segment, you have to sell
the product for us, and we have many difficulties in understanding that, and then we have to
sell the product to our wholesalers. And then they have to sell the product to the 200 000
printing companies which have to sell that to their millions of customers.” The more
complicated the products are, the more training should be provided for partners. There has
been a broad consensus that strengthening the networking capabilities with customers could
lead to significant profits. Stability and continuity were considered important in inter-firm
relationships, as well. As a Senior Vice president of sales and marketing told us, ”we should
have more co-operational projects with our customers in which the product, kind of sells itself,
and probably the whole process and market launch would be faster, then.”
Several interviewees stated that the “engineer-like mindset” mentioned in the previous chapter
could lead to the ”development of the products for the sake of the development, and not for the
sake of the customer needs.” Industry experts claimed that the knowledge of customer needs is
delivered insufficiently between the units with market-connection and the departments of
research and development: “they do not necessarily realize that the information they possess
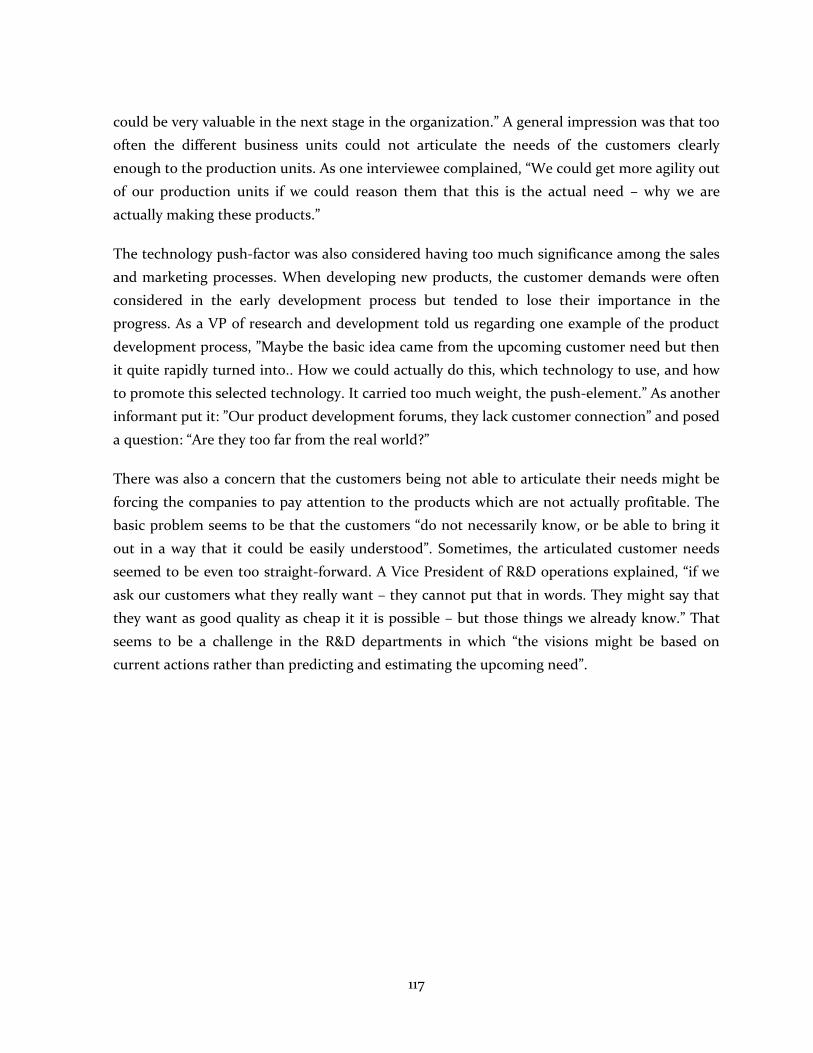
117
could be very valuable in the next stage in the organization.” A general impression was that too
often the different business units could not articulate the needs of the customers clearly
enough to the production units. As one interviewee complained, “We could get more agility out
of our production units if we could reason them that this is the actual need – why we are
actually making these products.”
The technology push-factor was also considered having too much significance among the sales
and marketing processes. When developing new products, the customer demands were often
considered in the early development process but tended to lose their importance in the
progress. As a VP of research and development told us regarding one example of the product
development process, ”Maybe the basic idea came from the upcoming customer need but then
it quite rapidly turned into.. How we could actually do this, which technology to use, and how
to promote this selected technology. It carried too much weight, the push-element.” As another
informant put it: ”Our product development forums, they lack customer connection” and posed
a question: “Are they too far from the real world?”
There was also a concern that the customers being not able to articulate their needs might be
forcing the companies to pay attention to the products which are not actually profitable. The
basic problem seems to be that the customers “do not necessarily know, or be able to bring it
out in a way that it could be easily understood”. Sometimes, the articulated customer needs
seemed to be even too straight-forward. A Vice President of R&D operations explained, “if we
ask our customers what they really want – they cannot put that in words. They might say that
they want as good quality as cheap it it is possible – but those things we already know.” That
seems to be a challenge in the R&D departments in which “the visions might be based on
current actions rather than predicting and estimating the upcoming need”.
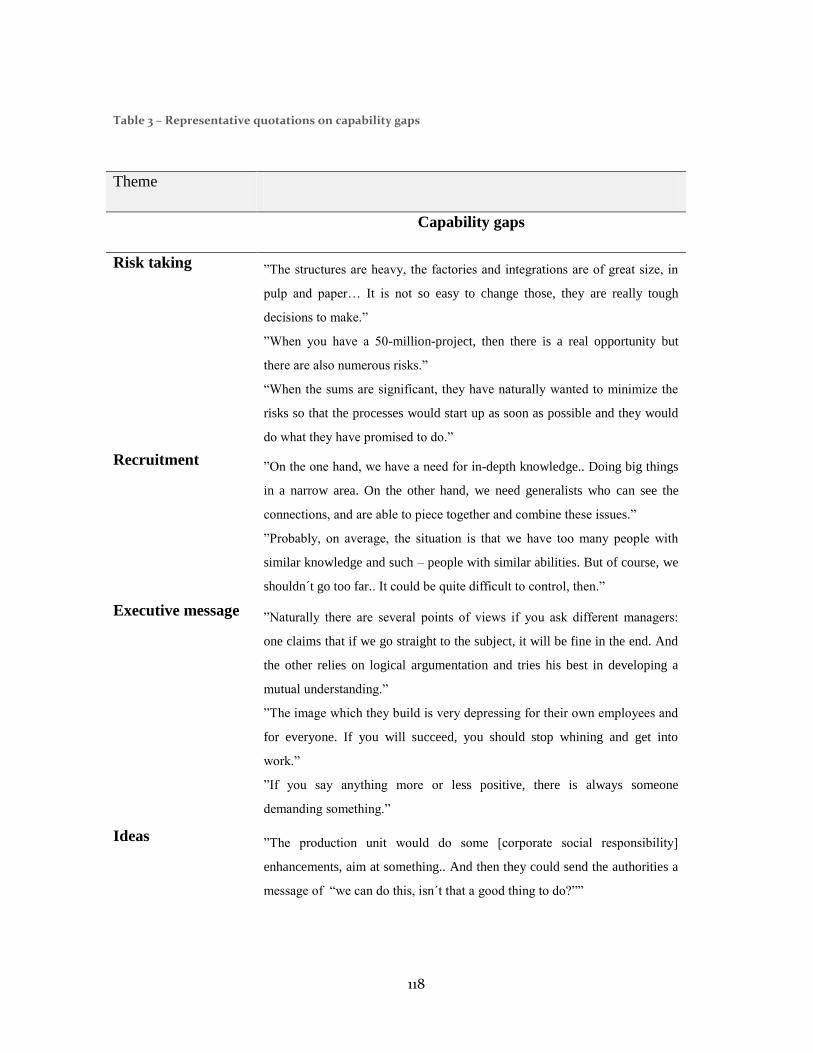
118
Table 3 – Representative quotations on capability gaps
Theme
Capability gaps
Risk taking ”The structures are heavy, the factories and integrations are of great size, in
pulp and paper… It is not so easy to change those, they are really tough
decisions to make.”
”When you have a 50-million-project, then there is a real opportunity but
there are also numerous risks.”
“When the sums are significant, they have naturally wanted to minimize the
risks so that the processes would start up as soon as possible and they would
do what they have promised to do.”
Recruitment ”On the one hand, we have a need for in-depth knowledge.. Doing big things
in a narrow area. On the other hand, we need generalists who can see the
connections, and are able to piece together and combine these issues.”
”Probably, on average, the situation is that we have too many people with
similar knowledge and such – people with similar abilities. But of course, we
shouldn´t go too far.. It could be quite difficult to control, then.”
Executive message ”Naturally there are several points of views if you ask different managers:
one claims that if we go straight to the subject, it will be fine in the end. And
the other relies on logical argumentation and tries his best in developing a
mutual understanding.”
”The image which they build is very depressing for their own employees and
for everyone. If you will succeed, you should stop whining and get into
work.”
”If you say anything more or less positive, there is always someone
demanding something.”
Ideas ”The production unit would do some [corporate social responsibility]
enhancements, aim at something.. And then they could send the authorities a
message of “we can do this, isn´t that a good thing to do?””
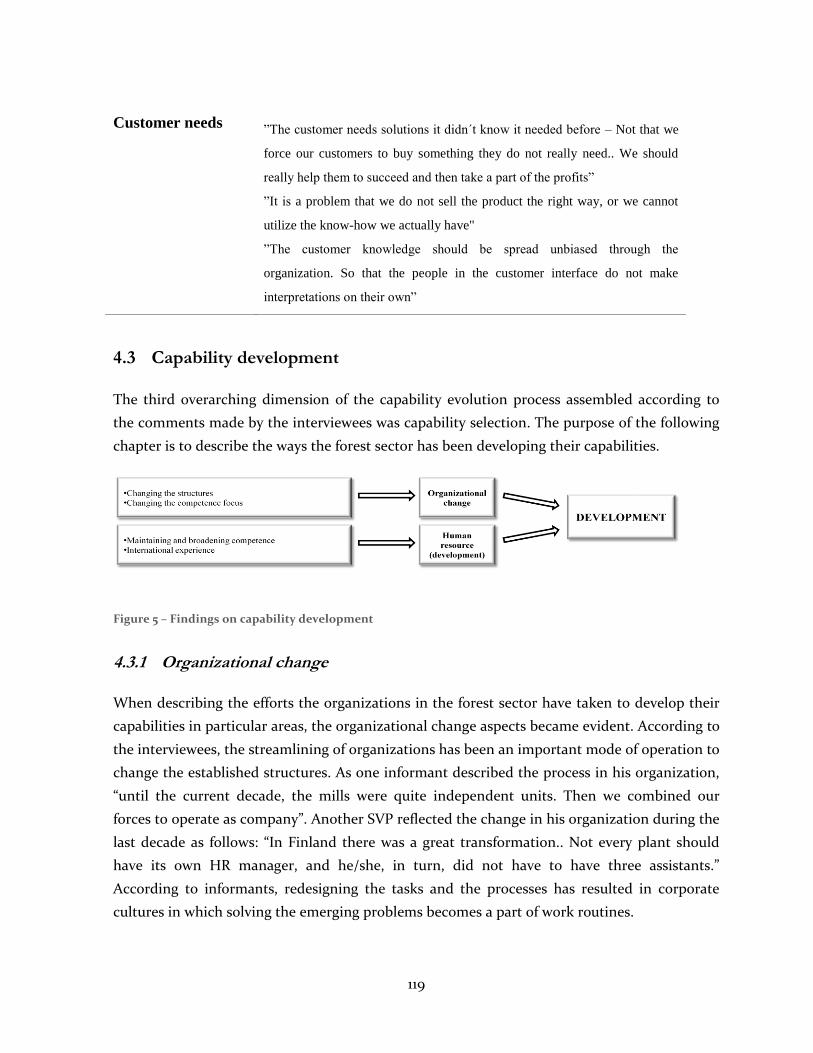
119
4.3 Capability development
The third overarching dimension of the capability evolution process assembled according to
the comments made by the interviewees was capability selection. The purpose of the following
chapter is to describe the ways the forest sector has been developing their capabilities.
Figure 5 – Findings on capability development
4.3.1 Organizational change
When describing the efforts the organizations in the forest sector have taken to develop their
capabilities in particular areas, the organizational change aspects became evident. According to
the interviewees, the streamlining of organizations has been an important mode of operation to
change the established structures. As one informant described the process in his organization,
“until the current decade, the mills were quite independent units. Then we combined our
forces to operate as company”. Another SVP reflected the change in his organization during the
last decade as follows: “In Finland there was a great transformation.. Not every plant should
have its own HR manager, and he/she, in turn, did not have to have three assistants.”
According to informants, redesigning the tasks and the processes has resulted in corporate
cultures in which solving the emerging problems becomes a part of work routines.
Customer needs ”The customer needs solutions it didn´t know it needed before – Not that we
force our customers to buy something they do not really need.. We should
really help them to succeed and then take a part of the profits”
”It is a problem that we do not sell the product the right way, or we cannot
utilize the know-how we actually have"
”The customer knowledge should be spread unbiased through the
organization. So that the people in the customer interface do not make
interpretations on their own”
120
Competence focus change was also a theme emerging from several interviews. Focusing on one
segment and investing in the development of that particular sector, “expertise in a particular
area”, was seen as means of enhancing capabilities. As an interviewee from the pulp industry
explained, ”Our company has had to transform from a large producing organization into a
market pulp supplier.. So we have to break our habits and thoughts.”
The organizations have attempted to change through mergers and acquisitions as well. For
example, an informant from machine building industry regarded ”acquisitions of smaller
technology firms” as a natural part of development of technologies. As he indicated, ”when
there has been skilled innovators and entrepreneurs, they have developed and commercialized
technology” in a smaller scale, and ”it has been profitable for us to buy the whole firm to
acquire that technology”. As a result, the entrepreneurial capabilities may have been
transferred into the organization.
4.3.2 HR
Maintaining and broadening competence bases of the employees have been largely based on
the fact that the knowledge requirements seem to have been increasing gradually. As an
interviewee explained, for example “the middle management assignments have become wider
of context.” Deeper understanding of the issues related to the work assignments seem to be
needed more often. Training in an industry is the formal procedure which a company uses to
facilitate employees’ learning so that their resultant behavior contributes to the attainment of
the company’s goals and objectives. When the knowledge bases of the employees grow, they
are offered more challenging tasks. As an informant from machine building sector noted, it is
crucial to offer interesting and multi-faceted positions to retain the most promising employees:
”younger people do not want simple, narrow tasks anymore”. “Those days are gone when you
worked for the same firm from cradle to grave”, and retention of key personnel and clarifying
their commitment to organization facilitates the development of organizational capabilities.
Some informants pointed out the importance of the tools for rewarding employees. The
cultures of using differing rewarding tools seem to be quite young in the Finnish forest
industry, and therefore unknown by both superiors as well as the subordinates.
As an important tool for broadening the knowledge bases of the individuals employed in the
industry, the interviewees have mentioned job rotation opportunities. Nowadays, the
companies are of sufficient size to offer opportunities for job rotation inside the firms. As a SVP
of human resources indicated, “The crucial issue for development could be the job rotation
121
between the firms – that people move between organizations and also from the supplier
organization to customer organization. That is how we could get different angles of views”
The job rotation aspects are also related to the international opportunities. There is a broad
consensus that the forest industry offers possibilities for the individuals willing to work abroad.
Globally, “the positions offered are various”. That aspect has been an advantage when
developing the HR capabilities, and also when collaboration capabilities are considered. Even
though “the ideal situation would be that we could recruit locally”, the knowledge level abroad
is not usually sufficient and firms must send their employees from Finland. As an informant
from a paper company noted, “We should export the know-how, and there is only two ways to
do it. Either you move abroad or you engage in export business. It is clear that more and more
people have to earn their living abroad in a way or another.” However, several interviewees
stressed that it is not very simple to find employees who are willing to move abroad and “who
are able to succeed in an international arena”. Also activating people “to take the opportunity
in the earlier phase of the career” was also seen as a significant factor. Another issue emerging
from the interviews was taking advantage of all the profits possible from the internationally
experienced employees has been a concern. As one interviewee from chemicals industry told
us, “the companies may be not able to repatriate the employees.. Are they able to exploit the
experience which they have invested in?” When an expatriate located in South America, for
instance, comes back to home country ”they shouldn´t put him to manage issues of Northern
Finland.”
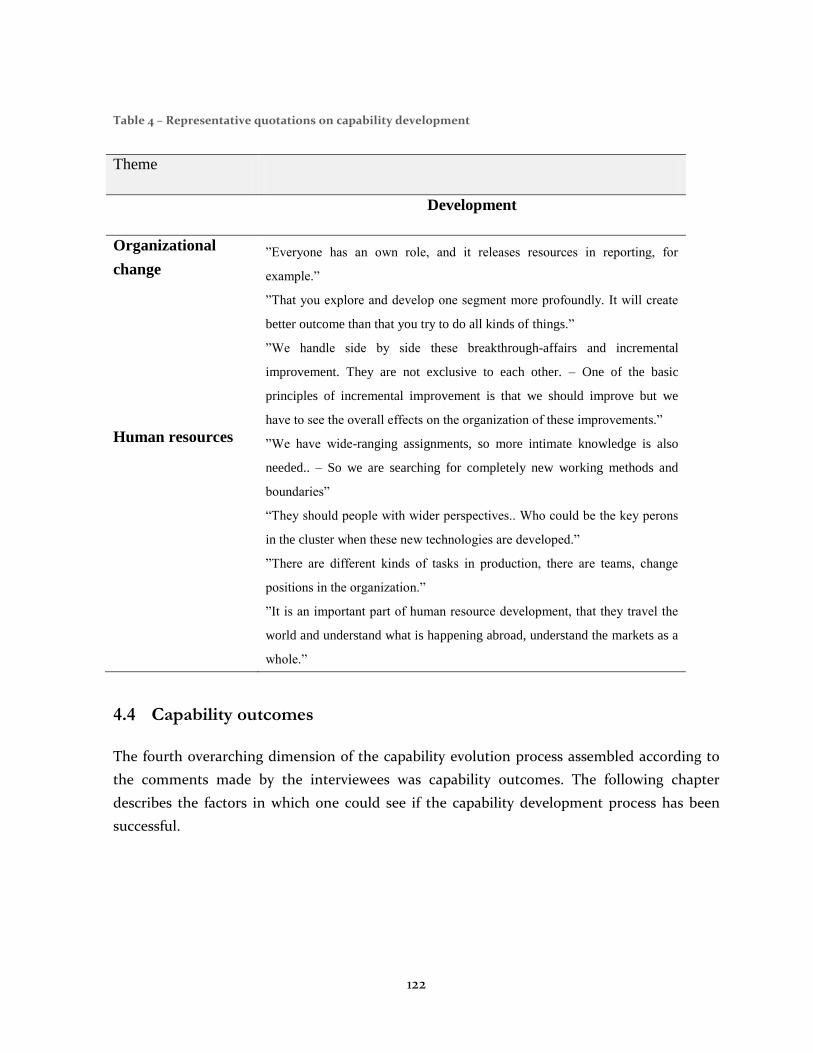
122
Table 4 – Representative quotations on capability development
Theme
Development
Organizational
change
”Everyone has an own role, and it releases resources in reporting, for
example.”
”That you explore and develop one segment more profoundly. It will create
better outcome than that you try to do all kinds of things.”
”We handle side by side these breakthrough-affairs and incremental
improvement. They are not exclusive to each other. – One of the basic
principles of incremental improvement is that we should improve but we
have to see the overall effects on the organization of these improvements.”
Human resources ”We have wide-ranging assignments, so more intimate knowledge is also
needed.. – So we are searching for completely new working methods and
boundaries”
“They should people with wider perspectives.. Who could be the key perons
in the cluster when these new technologies are developed.”
”There are different kinds of tasks in production, there are teams, change
positions in the organization.”
”It is an important part of human resource development, that they travel the
world and understand what is happening abroad, understand the markets as a
whole.”
4.4 Capability outcomes
The fourth overarching dimension of the capability evolution process assembled according to
the comments made by the interviewees was capability outcomes. The following chapter
describes the factors in which one could see if the capability development process has been
successful.
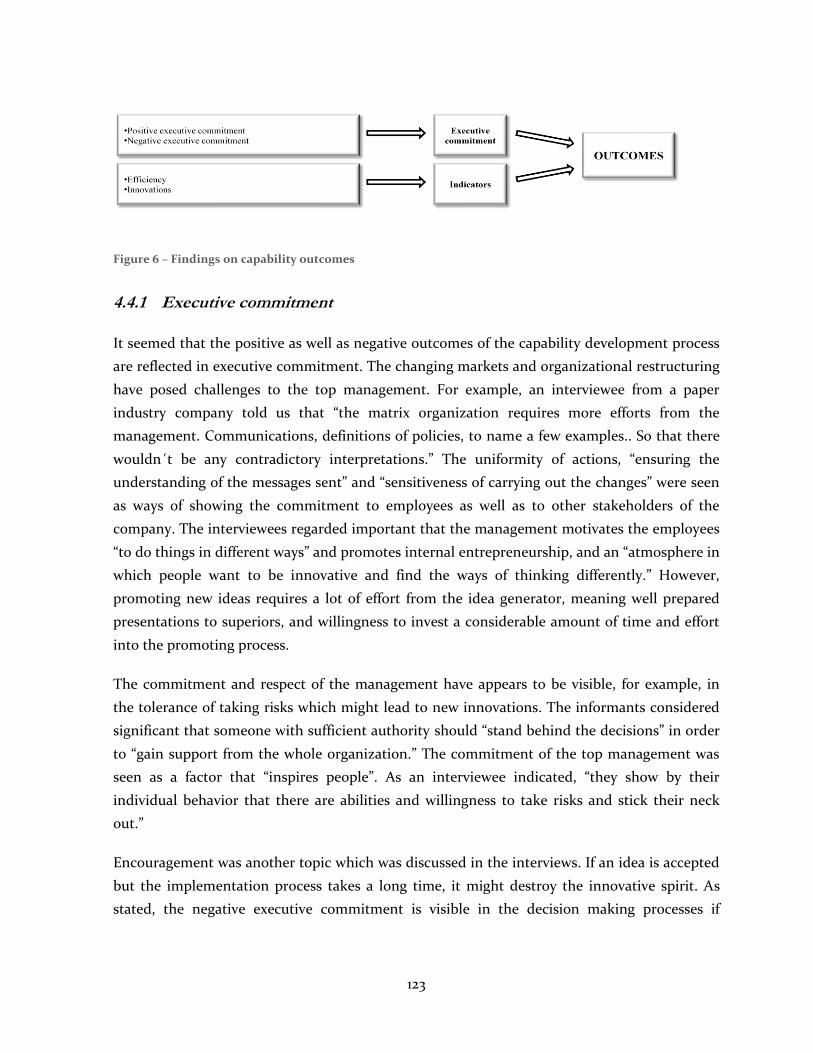
123
Figure 6 – Findings on capability outcomes
4.4.1 Executive commitment
It seemed that the positive as well as negative outcomes of the capability development process
are reflected in executive commitment. The changing markets and organizational restructuring
have posed challenges to the top management. For example, an interviewee from a paper
industry company told us that “the matrix organization requires more efforts from the
management. Communications, definitions of policies, to name a few examples.. So that there
wouldn´t be any contradictory interpretations.” The uniformity of actions, “ensuring the
understanding of the messages sent” and “sensitiveness of carrying out the changes” were seen
as ways of showing the commitment to employees as well as to other stakeholders of the
company. The interviewees regarded important that the management motivates the employees
“to do things in different ways” and promotes internal entrepreneurship, and an “atmosphere in
which people want to be innovative and find the ways of thinking differently.” However,
promoting new ideas requires a lot of effort from the idea generator, meaning well prepared
presentations to superiors, and willingness to invest a considerable amount of time and effort
into the promoting process.
The commitment and respect of the management have appears to be visible, for example, in
the tolerance of taking risks which might lead to new innovations. The informants considered
significant that someone with sufficient authority should “stand behind the decisions” in order
to “gain support from the whole organization.” The commitment of the top management was
seen as a factor that “inspires people”. As an interviewee indicated, “they show by their
individual behavior that there are abilities and willingness to take risks and stick their neck
out.”
Encouragement was another topic which was discussed in the interviews. If an idea is accepted
but the implementation process takes a long time, it might destroy the innovative spirit. As
stated, the negative executive commitment is visible in the decision making processes if
124
management “do the definition of policy needed.. It remains in the front line and then they
give advise afterwards.. It does not take things further.”
4.4.2 Indicators
How are the outcomes of the capability creation and development processes measured, then?
On one hand, the industry experts mentioned different efficacy indicators which might
describe the outcomes of the capability evolution process. On the other hand, innovations
seemed to be regarded as an indicator of successful capability development.
Concentrating on the technological capabilities and improving efficiency has enabled forest
industry to continuously increase its production volumes. As one interviewee indicated, they
are mostly “simple values, like mean velocity of paper machines”. There has been a broad
consensus among the informants that the forest industry has been successful in creating
capabilities related to improvements in efficiency of the processes. As a SVP stated, there has
been “amazing development in unit sizes”. Investments in machinery and improving
production technology stemming from the “cost reduction mentality” have “made possible to
produce more tons with less costs”. As one interviewee from paper industry noted, “Paper per
employee-indicators, they have been increasing year by year.”
According to the interviewees, the outcomes of the restructuring have enabled more flexible
processes and have facilitated constant flow of information. As a business controller put it,
“Our trump card is clearly that we are able to direct our efforts towards right things. We are
able to conduct better analyses and inform the management level more quickly”. Another
evident issue about the restructuring processes has been that restructuring enables the cost
savings when “less crew is needed.” Improving the supply chain management systems has also
been a factor in which the benefits could be seen. As an interviewee explained, “We are able to
manufacture and distribute the products effectively and they are of high quality.”
According to the interviewees, the product and process innovations indicate the success of
capability development. Even though some informants suggested that “innovativeness may not
traditionally have been that much emphasized in the industry”, especially the number or the
lack of “customer-related innovations, and new products approved by the customer” was
mentioned as an indicator reflecting the quality of the capabilities developed. However, new
ideas of doing things can be also related to cost-efficiency. For example, a Vice President of
sales and marketing noted, “decreasing the quantity of the different product types” has been a
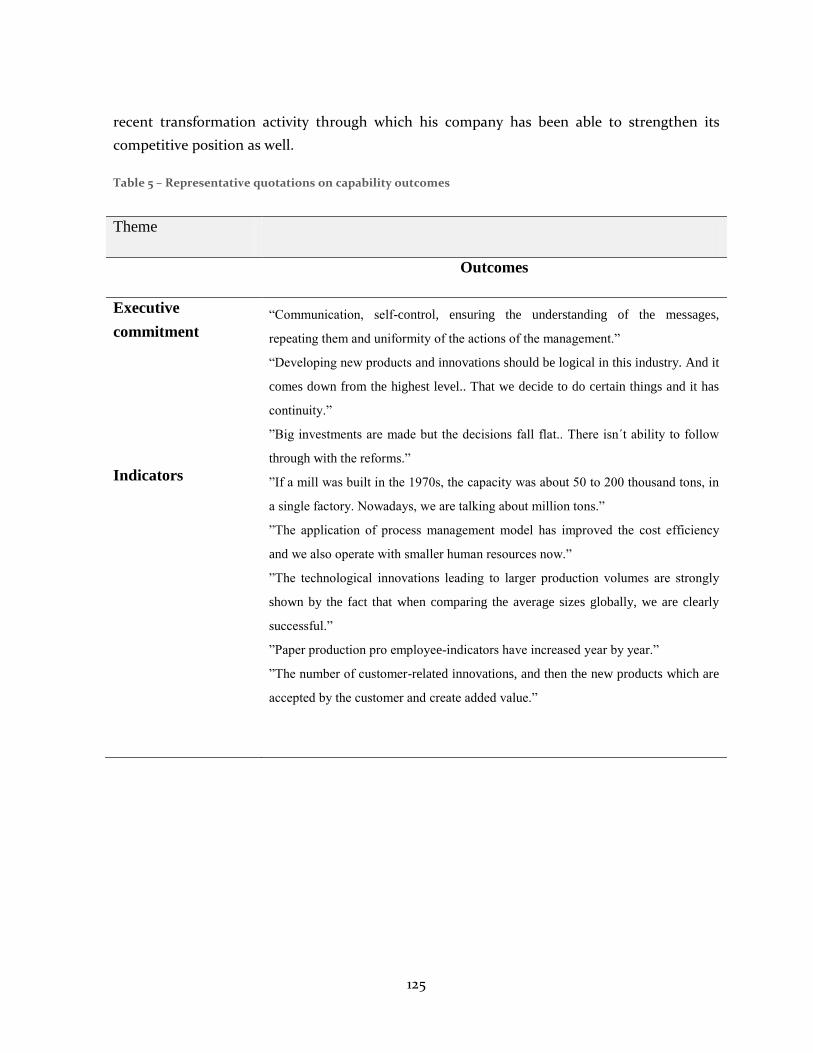
125
recent transformation activity through which his company has been able to strengthen its
competitive position as well.
Table 5 – Representative quotations on capability outcomes
Theme
Outcomes
Executive
commitment
“Communication, self-control, ensuring the understanding of the messages,
repeating them and uniformity of the actions of the management.”
“Developing new products and innovations should be logical in this industry. And it
comes down from the highest level.. That we decide to do certain things and it has
continuity.”
”Big investments are made but the decisions fall flat.. There isn´t ability to follow
through with the reforms.”
Indicators ”If a mill was built in the 1970s, the capacity was about 50 to 200 thousand tons, in
a single factory. Nowadays, we are talking about million tons.”
”The application of process management model has improved the cost efficiency
and we also operate with smaller human resources now.”
”The technological innovations leading to larger production volumes are strongly
shown by the fact that when comparing the average sizes globally, we are clearly
successful.”
”Paper production pro employee-indicators have increased year by year.”
”The number of customer-related innovations, and then the new products which are
accepted by the customer and create added value.”
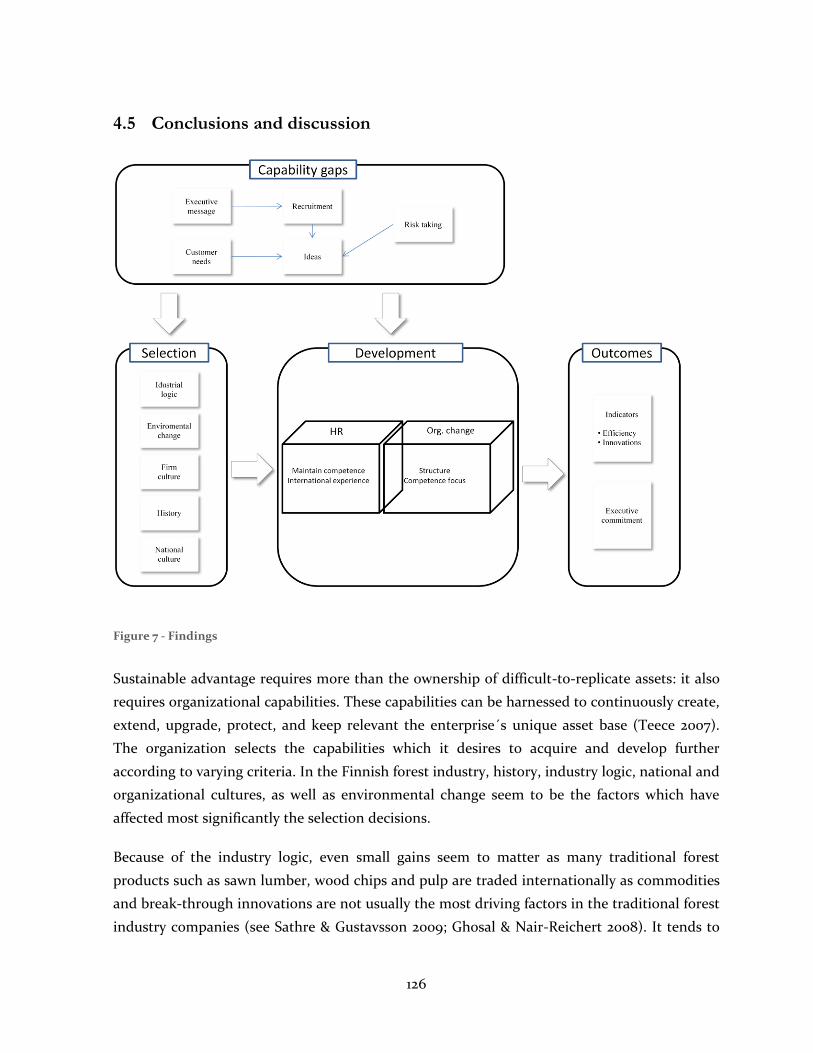
126
4.5 Conclusions and discussion
Figure 7 - Findings
Sustainable advantage requires more than the ownership of difficult-to-replicate assets: it also
requires organizational capabilities. These capabilities can be harnessed to continuously create,
extend, upgrade, protect, and keep relevant the enterprise´s unique asset base (Teece 2007).
The organization selects the capabilities which it desires to acquire and develop further
according to varying criteria. In the Finnish forest industry, history, industry logic, national and
organizational cultures, as well as environmental change seem to be the factors which have
affected most significantly the selection decisions.
Because of the industry logic, even small gains seem to matter as many traditional forest
products such as sawn lumber, wood chips and pulp are traded internationally as commodities
and break-through innovations are not usually the most driving factors in the traditional forest
industry companies (see Sathre & Gustavsson 2009; Ghosal & Nair-Reichert 2008). It tends to
127
lead to selection of the capabilities which could enhance the efficiency of the processes. That
seems to be in line with the previous research themes on the forest industry which suggest that
innovations tend to be incremental. Among other issues, the static nature of the organizational
cultures and the conservativeness of the industry have affected the capability selection process.
The interviewee insights on the subject tend to follow the logic introduced by Tremblay (1999)
and Hovgaard and Hansen (2004), as the improvements of the features of the existing products,
manufacturing capabilities and concentration on process innovations have been among the
main development efforts in the Finnish forest sector.
Dynamic capabilities include capabilities required to adapt to changing customer and
technological opportunities. They also embrace the enterprise´s capacity to shape the
ecosystem it occupies, develop new products and processes, and design and implement viable
business models (Teece 2007). The results of the present study indicate that the Finnish forest
cluster has traditionally been able to select the capabilities needed for the excellence in the
technological area. However, the selected capabilities have often been related to incremental
improvements, such as upgrading the machinery to match the current standards and be of a
better quality than the base of the competitors. As indicated by Augier and Teece (2006), the
asset investment choices may actually be one source of the capabilities. Accordingly, some
capabilities are rooted in routinized processes. In this case, these might include the reactive
adaptation to market situations or efficient division of labor in which the Finnish forest cluster
seems to be relatively successful. Additionally, some capabilities are rooted in creative and
differentiated entrepreneurial actions involving unusual skills (Augier & Teece 2006). Among
the industry informants, there was a broad consensus that these kinds of capabilities are
commonly underdeveloped in the Finnish forest sector.
The strong urge to stay ahead in the technological development by investing in the product
development actions seemed to be regarded as a particular strength of the industry among the
interviewees. Nevertheless, there seemed to be a consensus that the firms might not be able to
stay competitive in the future just by maintaining the current capability bases. When existing
firms enter a new market in which they do not currently participate in, they should either
develop new capabilities or alter the existing ones. A particular set of capabilities serves as a
platform into other markets and related product areas (Helfat & Lieberman 2002; Zander &
Kogut 1995). It seemed that the capabilities needed in changing markets are rather different
from those required in the past decades. There was a mutual understanding that
internationalization of the industry and various knowledge transfer challenges have affected
the capability selection decisions in the Finnish forest sector. For instance, the excellence in
128
producing outputs of extremely high quality seemed to have lost its importance in the past
decades because the customers seemed to appreciate the products which were more affordable
and of “sufficient quality”.
Capability gaps, meaning the reasons why certain capabilities the industry experts regarded as
important but which were not currently been selected and developed extensively further were
discussed extensively in the interviews. It seemed that the executive message generated by the
forest industry leaders was not comprehensively communicated to the general public, and not
even to the employees of the organizations. That, in turn, resulted in challenges in recruitment
of the skilled individuals who might have the potential of generating innovations and
distinctive capabilities to recombine their knowledge to improve the innovation (see Zander &
Kogut 1995). It was argued that the homogeneity of the educational backgrounds also hindered
capabilities which enhance innovation by breaking down the thought worlds that arise because
people not only know different things, but know those things differently (see Eisenhardt &
Martin 2000).
In the Finnish forest industry, risk aversion tends to affect the possibility that incumbent firms
will explore radical innovations. As stated in the interviews, the firms seem to limit their
investments to innovations that are close-in to the existing asset base (Teece 2007) and to focus
search activities to exploit established technological and process-related assets. This effect
makes it difficult for these enterprises to see potential radical innovations (Teece 2007). It was
also evident that networking capabilities between suppliers and customers should be enhanced
to promote the possible innovations.
Deep knowledge of the customers´ needs tend to enhance the innovative capabilities and the
creation of new ideas. They typically involve participation of people who bring together
different sources of expertise. These sources of expertise are essential for superior products
because they address a unique aspect of product quality (Eisenhardt & Martin 2000). In the
Finnish forest industry, the communication and information flow between departments seem
to be insufficient. Most organizational capabilities require integrating the specialist knowledge
bases of a number of individuals. Inventors shape the way of which these capabilities evolve by
using networks to overcome problems such as uncertainty and incomplete information (Nerkar
& Paruchuri 2005; Grant 1996). For instance, the capability of mobilizing a new product is
determined by the communication of tacit and explicit knowledge both internally and
externally (Bull & Ferguson 2006). The interviewees indicated that these knowledge bases
might not be sufficient enough to support the development and commercialization of new
129
innovations. For instance, the knowledge associated with product development, the technology
in question and an understanding of sales and marketing practices were not seen as
confronting sufficiently. The divisions of marketing and research and development seem to
lack the communication channel through which they could exchange views and transfer the
information.
The development of the capabilities seems to occur through organizational change and several
human resource development actions. Firms tend to develop their adaptive capability to
identify and capitalize on emerging market opportunities through evolution of organizational
forms (Wang & Ahmed 2007). That seems to be true in the Finnish forest industry as well.
Achieving internal cooperation requires good incentive alignment and shared goals throughout
the organization. Particularly in large traditional hierarchies, achieving functional integration is
a major organizational accomplishment (Augier & Teece 2006). Accordingly, the development
of selected capabilities was often carried out by reorganizing the structures of the companies.
Removing the unnecessary barriers and organizational levels were considered important to
enhance the capabilities needed in changing business environments.
Creation, absorption, integration and reconfiguration of knowledge within the organization,
and between the firm and organizations external to it, is important (Teece 2007; Verona &
Ravasi 2003) in capability development. Interviewees stressed the importance of the human
resource development activities as a tool for capability development. Attracting the skilled
employees and broadening their knowledge bases by, for instance, job rotation opportunities or
possibilities to work abroad were mentioned as means of developing organizational
capabilities.
The capabilities of learning from partners, integrating external information and transforming it
into firm-specific knowledge (see Verona & Ravasi 2003; Wang & Ahmed 2007) seem to be
demonstrating in the actions the firms take to create different networks between the different
players in the industry, as well as when mergers and acquisitions were discussed. Several
interviewees noted that firms appear to take account not only the resources they have, but also
of gaps between their pre-entry resources and those required for entry. Thus, established firms
with critical resource gaps are more likely to enter markets using modes of entry such as
acquisition, joint venture, or parent spin-offs (Helfat & Lieberman 2002, 734). For instance, the
acquisitions of smaller firms possessing the skills relevant to acquiring organization was seen as
an important way of developing technological capabilities.
130
Galunic and Eisenhardt (2001) emphasize the role of the managers: managers manipulating the
resources into new productive assets in the context of changing markets, shape dynamic
capabilities. In fact, the executive commitment was mentioned by several informants as
manifesting the efforts taken in the capability development. The negative outcomes of
executive commitment, in turn, were regarded as avoiding the responsibilities and not being
able to insure the employees and other stakeholders of the actions taken.
The firm could be investing in the capability to achieve lower production costs from the
economies of scale that result from the increased capacity (Maritan 2001) as discussed in the
interviews. It seems that the outcomes of “zero-order capabilities” (see Winter 2003) which
indicate how firms “earn their living now” tend to be the ones the Finnish forest sector has
been successful in developing. Accordingly, the interviewees regarded different efficiency
indicators as the most important manifestations of successful capability development.
131
REFERENCES
AUGIER, M. & TEECE, D. J. 2006. Understanding complex organization: the role of know-how,
internal structure, and human behavior in the evolution of capabilities, Industrial and
Corporate Change, 15, 395-416.
AUGIER, M. & TEECE, D. J. 2009. Dynamic Capabilities and the Role of Managers in Business
Strategy and Economic Performance, Organization Science, 20, 410-421.
BLYLER, M. & COFF, R.W. 2003. Dynamic capabilities, social capital, and rent appropriation:
Ties that split pies. Strategic Management Journal, 24, 677-686.
BONARDI, J. P., HOLBURN, G. L. F. & BERGH, R. G. V. 2006. Nonmarket strategy
performance: Evidence from US electric utilities. Academy of Management Journal, 49,
1209-1228.
BREWERTON, P. & MILLWARD, L. 2001. Organisational Research methods. Sage Publications:
United Kingdom.
BULL, L. & FERGUSON, I. 2006. Factors influencing the success of wood product innovation in
Australia and New Zealand. Forest Policy and Economics, 8, 742-750.
CAPRON, L. & Mitchell, W. 2009. Selection Capability: How Capability Gaps and Internal
Social Frictions Affect Internal and External Strategic Renewal. Organization Science,
20, 294-312.
CARPANO, C., RAHMAN, M. 2006. International competition in mature, localized industries:
Evidence from the US furniture industry. Journal of Business Research 59, 630-637.
COLLIS, D. J. 1994. Research note: how valuable are organizational capabilities? Strategic
management journal, Winter special issue 15, 143-152.
CORLEY, K. & GIOIA, D. A. 2004. Identity ambiguity and change in the wake of a corporate
spin-off. Administrative Science Quarterly, 49, 173-208.
DAVIES, A. & BRADY, T. 2000. Organisational capabilities and learning in complex product
systems: towards repeatable solutions. Research Policy, 29, 931-953.
DAY, G. S. 1994. The capabilities of market-driven organizations, Journal of marketing, 58, 37-
52.
DIAZ-BALTEIRO, L., HERRUZO, A. C., MARTINEZ, M. & GONZALEZ-PACHON, J. 2006. An
analysis of productive efficiency and innovation activity using DEA: An application to
Spain´s wood-based industry. Forest Policy and Economics, 8, 762-773.
DOSI, G., FAILLO, M. & MARENGO, L. 2008. Organizational capabilities, patterns of
knowledge accumulation and governance structures in business firms: An introduction.
Organization Studies, 29, 1165-1185.
ESKOLA, J. & SUORANTA, J. 2003. Johdatus laadulliseen tutkimukseen. Vastapaino: Finland.
132
ETHIRAJ, S. K., KALE, P., KRISHNAN, M. S. & SINGH, J. V. 2005. Where do capabilities come
from and how do they matter? A study in the software services industry. Strategic
Management Journal, 26, 25-45.
GALUNIC, D. C. & EISENHARDT, K. M. 2001. Architectural innovation and modular corporate
forms. Academy of Management Journal, 44, 1229-1249.
GAVETTI, G. 2005. Cognition and hierarchy: Rethinking the microfoundations of capabilities'
development. Organization Science, 16, 599-617.
GHAURI, P., GRONHAUG, K. & KRISTIANSLUND, I. 1995. Research Methods in Business
Studies – A practical guide. Prentice Hall: United Kingdom.
GHOSAL, V. & NAIR-REICHERT, U. 2009. Investments in modernization, innovation and gains
in productivity: Evidence from firms in the global paper industry. Research Policy, 38,
536-547.
GRANT, R. M. 1996. Prospering in dynamically-competitive environments: Organizational
capability as knowledge integration. Organization Science, 7, 375-387.
HARDSTONE, G. A. P. 2004. Capabilities, structures and strategies re-examined: Incumbent
firms and the emergence of complex product systems (CoPS) in mature industries.
Technology Analysis & Strategic Management, 16, 173-196.
HELFAT, C. E. & Lieberman, M.B 2002. The birth of capabilities: market entry and the
importance of pre-history. Industrial and Corporate Change, 11, 725-760.
HELFAT, C. E. & PETERAF, M. A. 2003. The dynamic resource-based view: Capability
lifecycles, Strategic Management Journal, 24, 997-1010.
HIRSJÄRVI, S. & HURME, H. 1995. Teemahaastattelu. Yliopistopaino: Finland.
HIRSJÄRVI, S., REMES, P., & SAJAVAARA, P. 2000. Tutki ja kirjoita. Tammi: Finland.
HOOPES, D. G. & MADSEN, T. L. 2008. A capability-based view of competitive heterogeneity.
Industrial and Corporate Change, 17, 393-426.
HOVGAARD, A. & HANSEN, E. 2004. Innovativeness in the forest products industry. Forest
Products Journal, 54, 26-33.
KIM, L. 1998. Crisis construction and organizational learning: Capability building in catching-
up at Hyundai Motor.
KIRK, J. & MILLER, M. L. 1985. Reliability and validity in qualitative research. Sage Publications:
United States of America.
KLEPPER, S. 2002. The capabilities of new firms and the evolution of the US automobile
industry.
KNIGHT, G. A & CAVUSGIL, S. T. 2004. Innovation, Organizational Capabilities, and the Born-
Global Firm, Journal of International Business Studies, 35, 124-141.
133
KOGUT, B. & ZANDER, U. 1992. Knowledge of the firm, combinative capabilities, and the
replication of technology. Organization science, 3, 383-397.
KUSUNOKI, K., NONAKA, I. & NAGATA, A. 1998. Organizational Capabilities in Product
Development of Japanese Firms: A Conceptual Framework and Empirical Findings.
Organization Science, 9, 699-718.
KVALE, S. & BRINKMANN, S. 2009. InterViews. Learning the Craft of Qualitative Research
Interviewing. Second edition. SAGE Publications, Los Angeles.
LAZONIK, W. & PRENCIPE, A. 2005. Dynamic capabilities and sustained innovation: strategic
control and financial commitment at Rolls-Royce plc. Industrial and Corporate Change,
14, 501-542.
LEONARD-BARTON, D. 1992. Core capabilities and core rigidities: a paradox in managing new
product development. Strategic Management Journal, Summer Special Issue 13, 111-125.
LINCOLN, Y.S. & GUBA, E.G. 1985. Naturalistic Inquiry. Beverly Hill, CA: Sage.USA
LOASBY, B. J. 1998. The organisation of capabilities, Journal of economic behavior &
organization, 35, 139-160.
LÄHTINEN, K. & TOPPINEN, A. 2008. Financial performance in Finnish large- and medium-
sized sawmills: The effects of value-added creation and cost-efficiency seeking. Journal
of Forest Economics, 14, 289-305.
MALHOTRA, N. K. & BIRKS, D. F. 2007. Marketing Research, An applied Approach. Pearson
Education Limited: Spain.
MARITAN, C. A. 2001. Capital investment as investing in organizational capabilities: An
empirically grounded process model. Academy of Management Journal, 44, 513-531.
MARSHALL, C. & ROSSMAN, G. B. 2006. Designing Qualitative Research. Fourth edition. Sage
Publications, Thousand Oaks.j
MITCHELL, W. 1994. The Dynamics of Evolving Markets: The Effects of Business Sales and Age
on Dissolutions and Divestitures. Administrative Science Quarterly, 39, 575-602.
NAG, R., CORLEY, K. G., GIOIA, D. A. 2007. The intersection of organizational identity,
knowledge, and practice: Attempting strategic change via knowledge grafting. Academy
of Management Journal, 50, 821-847.
NELSON, R. R. 1991. Why do firms differ, and how does it matter. Strategic Management
Journal, 12, 61-74.
NERKAR, A. & PARUCHURI, S. 2005. Evolution of R&D capabilities: The role of knowledge
networks within a firm. Management Science, 51, 771-785.
REIS, H. T. & JUDD, C. M. 2000. Handbook of research methods in social and personality
psychology; Cambridge University Press,
134
REPENNING, N. P. & STERMAN, J. D. 2002. Capability traps and self-confirming attribution
errors in the dynamics of process improvement, Administrative Science Quarterly, 47,
265-295.
ROTHAERMEL, F. T. & HESS, A. M. 2007. Building dynamic capabilities: Innovation driven by
individual-, firm-, and network-level effects. Organization Science, 18, 898-921.
RUBIN, H. J. & RUBIN, I. S. 1995. Qualitative Interviewing – The Art of Hearing Data. Sage
Publications: United States of America.
SAKO, M. 2004. Supplier development at Honda, Nissan and Toyota: comparative case studies
of organizational capability enhancement. Industrial and Corporate Change, 13, 281-308.
STONE, E. 1978. Research methods in organizational behaviour. Scott, Foresman and
Company: United States of America.
TEECE, D. J. 2007. Explicating dynamic capabilities: The nature and microfoundations of
(sustainable) enterprise performance. Strategic Management Journal, 28, 1319-1350.
TEECE, D. J., PISANO, G. & SHUEN, A. 1997. Dynamic capabilities and strategic management.
Strategic Management Journal, 18, 509-533.
TREMBLAY, P. J. 1999. Organize to generate innovation. International Journal of Technology
Management, 17, 797-813.
VAN DEN BOSCH, F. A. J., VOLBERDA, H. W. & DE BOER, M. 1999. Coevolution of Firm
Absorptive Capacity and Knowledge Environment: Organizational Forms and
Combinative Capabilities. Organization Science, 10, 551-568.
VERONA, G. & RAVASI, D. 2003. Unbundling dynamic capabilities: an exploratory study of
continuous product innovation. Industrial and corporate change, 12, 577-606.
WANG, C. L. & AHMED, P. K. 2007. Dynamic capabilities: A review and research agenda.
International Journal of Management Reviews, 9, 31-51.
WINTER, S. G. 2003. Understanding dynamic capabilities. Strategic management journal, 24,
991-995.
YIN, R. K. 1985 & 2003. Case Study Research. Design and Methods. Third edition. Sage
Publications, Thousand Oaks.
ZANDER, U. & KOGUT, B. 1995. Knowledge and the speed of the transfer and imitation of
organizational capabilities – an empirical test. Organization Science, 6, 76-92.
ZOTT, C. 2003. Dynamic capabilities and the emergence of intraindustry differential firm
performance: Insights from a simulation study. Strategic Management Journal, 24, 97-
125.
135
CHAPTER 6
EVOLUTION OF CAPABILITIES IN THE FINNISH FOREST INDUSTRY: A QUANTITATIVE APPROACH
JAAKKO LINNAKANGAS
Aalto University School of Science and Technology [email protected]
1 INTRODUCTION
1.1 Background and motivation
An essential question for organizations is how to create and sustain competitive advantage in
the long term. Over time researchers have tried to answer this question with a number of
theories. In the last decades the dominant ones have proposed that organization’s resources
and capabilities are behind firms’ superior performance. Competition forces companies to
continuously create and reconfigure their resources and capabilities to fit the changing
competitive environment (e.g. Augier and Teece 2009).
The same applies for clusters. In the globalized world companies’ activities have spread over
country borders and things such as comparative advantage have become less important in
competition. Cluster’s performance has become very dependent on how it can develop its
capabilities (Porter 1998) and on the knowledge the cluster possesses (Tallman et al. 2004). Its
innovativeness depends on its ability to recombine technological and organizational
capabilities (Heidenreich 2005). Knowledge and capabilities of a cluster are getting more and
more attention, even in traditional mature industries which also can be knowledge intensive
(Porter 1998).
136
The forest industry has traditionally been one of the main drivers of Finnish economy. Today,
Finnish forest industry is undergoing an era of, perhaps its history’s most prominent, change.
As a result, companies have experienced a decline in their performance. Changes, for example,
in technology, competition, and demand are reshaping the setting in which companies are
operating. Global competition, developing countries’ growth, changes in energy price, and so
forth, are all challenges for Finnish forest companies. Finnish forest cluster must capitalize its
current capabilities in new ways or develop new ones.
In a recent article concerning dynamic capabilities authors call for more research in several
areas (Easterby-Smith et al. 2009). Among other things, they call for more longitudinal studies
in the research of capability creation and evolution. They suggest research on capabilities’ link
to functional capabilities such as IT, R&D and marketing. They wish to see research including
more traditional industries. And they note that attention should be given to links between
capabilities and micro issues such as managerial cognition.
1.2 Objectives and scope of the study
The main objective of this study is to identify capabilities that have been developed in the
Finnish forest cluster firms in the last ten years. Another objective is to find out whether
companies have developed similar capability portfolios with each other and to find out which
capabilities have been developed simultaneously.
The objectives of the study can be presented in the following research question and its sub-
questions:
How have firms in the Finnish forest cluster developed their capability portfolios in the
last ten years?
What capabilities have they developed?
Have they developed capabilities consistently?
How are developed capabilities linked to innovation?
Regarding the first sub-question, firms have conceptually unlimited number of activities that
they do. Therefore it is necessary to define what counts as capability in this study. Because
sample firms differ in terms of their technological fields, capabilities must not be assessed
through outputs (for example through patents). Second sub-question is aimed at answering to
whether firms have developed some capabilities not only occasionally but consistently. This is
137
because organizations maintain and develop their capabilities by exercising them (Nelson and
Winter 1982). The third sub-question is aimed at linking developed capabilities to cluster’s
innovativeness because the study is made as a part of innovation programme.
To achieve these objectives, it is necessary to define criteria upon which the assessment of
capability development is based on – to define what is counted as capability development and
how it is measured. In this study the focus is on firms’ capability portfolios. Therefore how
individual capabilities are developed is not in the scope of this study but which capabilities are
developed. Assessment of capabilities’ or capability portfolios’ appropriateness to the
competitive environment is also not in the scope of this study. Therefore capabilities’ link to
performance is not covered, and it is not discussed whether companies have developed ‘good’
or ‘bad’ portfolios of capabilities.
1.3 Structure of the study
The remainder of the study is organized as follows. Next two chapters (chapters 2 and 3)
discuss prior literature of the subject and chapter 4 summarizes them together and the theory
framework is presented. After the literature part the empirical part starts with the used
methodology in chapter 5. It is followed by the research process in chapter 6, which leads to
results and discussion in chapters 7-8.
2 CAPABILITIES
2.1 Introduction
The literature on strategic management has given more and more attention to ‘capabilities’ in
the last decades as an extension to the resource-based view (Dosi et al. 2000:13; Easterby-Smith
et al. 2009:S1). A myriad of definitions for capabilities has emerged, and many different forms
of capabilities have been suggested to exist. For example Teece et al. (1997) discuss dynamic
capabilities, Winter (2000) discusses operational capabilities, whereas Mayer and Salomon
(2006) note that capabilities come in many forms, such as technological, managerial,
operational, marketing-based, etc. Collis (1994) states that there are almost as many definitions
for organizational capabilities as there are authors on the subject. This chapter is supposed to
shed light on the subject of capabilities. First, a practically inseparable resource-based theory of
a firm is presented.
138
2.2 The resource-based view
2.2.1 Definition of the RBV
The resourced-based view (RBV) is one of the many theories trying to explain why some firms
succeed and others do not. The theory is often put head-to-head with the traditional industrial
organization model (for example in Wernerfelt 1984; Barney 1991; Grant 1996a; Teece et al. 1997;
Barney 2001) which proposes that firm’s long-term performance results mainly from how a firm
can respond and adapt to the pressure from ‘competitive forces’. The industrial organization
model emphasizes factors such as how easy it is for new companies to enter the industry, how
intense is the competition, and how easily a product can be substituted with another. It is
assumed that to be in competitive advantage a company has to have in some way unique
product or service compared to competitors – for example in terms of product performance. In
brief, the model emphasizes the link between external environment and firm’s actions when
trying to explain differences in firms’ performances.
The resource-based model takes a rather divergent view. RBV assumes that the unique
products are eventually imitable by competitors, and therefore the competitive advantage
gained with them can only be temporary (e.g. Barney 1991). Penrose (1959) has been
acknowledged to be the first one who rose the idea that firm’s profitability and growth should
be thought primarily as a result from organization’s unique characteristics. These distinctive
characteristics are usually simply called resources. At the simplest, resources are defined as
“anything which could be thought of as a strength or weakness of a given firm” (Wernerfelt
1984:192). To be more precise, resources are defined as “all assets, capabilities, organizational
processes, firm attributes, information, knowledge etc. controlled by a firm” (Barney 1991:101).
However, the resource-based view and industrial organization model are not mutually
exclusive. RBV can be seen as a complement for the industrial organization model in a way that
resources make the competitive actions against industry forces possible (Amit and Schoemaker
1993). There have been studies made about the relative effects of industry and firm attributes
on firm’s long-term performance, and it seems that firm-specific attributes play a greater role
than the industry (Cool and Schendel 1988; Rumelt 1991; Barney 2001).
139
2.2.2 Value of resources
There are different types of resources. As an example, Wernerfelt (1984) mentions brand
names, in-house knowledge, machinery, and capital. Resources differ in how much they can
contribute to firm performance (Barney 1991). Barney introduces four well-known requirements
that can be given for resources which can lead to a sustainable competitive advantage (so-
called VRIN resources). First, they must be valuable in a way that they are meaningful for a
firm’s strategy. Second, they must be rare, since otherwise they would not be an advantage
compared to competitors who could also possess the same resources. Third, they must not be
substitutable, meaning that any other alternative resource available cannot be used by
competitors to implement a similar strategy. Last, they must be imperfectly imitable for the
same reasons than the last two requirements. In line with Barney, Amit and Schoemaker (1993)
propose that resources are strategically valuable when they are difficult to buy, sell, imitate or
substitute. According to them, also firm-specificity, durability, and scarcity add resources’
value. Moreover they argue that the value of firm’s assets depends on their complementarity,
meaning that resources’ strategic value is dependent also on other resources that a firm has in
its use. Wernerfelt (1984) notes this by emphasizing a firm’s whole resource portfolio rather
than just individual resources. Those resources and capabilities that are in this sense valuable
are strategic (Amit and Schoemaker 1993). Amit and Schoemaker propose that when a firm
enjoys a set of strategic assets it can generate organizational rents.
The greatest distinction is usually made between tangible and intangible resources (Galbreath
2005). Tangible resources are physical assets which can be touched, such as production
machines and buildings. Intangible resources are untouchable, such as knowledge, capabilities,
culture, and brands. Intangible assets are typically seen as more valuable than tangible assets
(Barney 2001:648), but some authors have argued that this is not always the case. Miller and
Shamsie (1996) argue that property-based resources are more valuable when the environment
is stable and predictable, and that knowledge contributes more to performance when the
environment is changing and unpredictable. Few can totally disagree with the proposition that
a firm with superior resources has a competitive advantage. However, because obtaining and
maintaining resources is costly, the firm with best resources is not necessarily the most
profitable one (Becerra 2008), and firms have to optimize their resources with their scarce
resources.
140
2.3 What are capabilities?
2.3.1 Defining capabilities
Organizational capabilities are often defined through so-called routines (e.g. Nelson and
Winter 1982; Grant 1996b; Eisenhardt and Martin 2000). At the simplest, routines mean how
things are done in an organization (Nelson and Winter 1982:400). More accurately, routines are
organization’s all the regular and predictable behavioral patterns (Nelson and Winter 1982:14).
The notion of routines is quite broad including all the patterned activities in an organization
from well-specified technical routines to business strategies (ibid.). Routines at the highest
level can even be as broad as describing the strategy and structure of a firm (Bruderer and
Singh 1996).
Winter defines organizational capabilities as a collection of routines, which combined with
other resources give options for different types of outputs (Winter 2000:992). There are other
similar definitions, such as capabilities being the efficiency of converting inputs into desired
outputs (Dutta et al. 2005), filling the gap between intention and outcome (Dosi et al. 2000),
firm's capacity to deploy resources - usually in combination - using organizational processes to
effect a desired end (Amit and Schoemaker 1993), and ability to perform a coordinated set of
tasks, utilizing organization’s resources, for achieving a particular end result (Helfat and
Peteraf 2003:999). Grant (1996a) sees capabilities being primarily an integration of a huge
network of routines in an organization. Most of these definitions share same ideas. Capabilities
are collective and continuous activities in a firm resulting in some types of outputs. For
example some companies can be seen as having a strong R&D capability resulting in a large
number of patents, and some can be thought as having a strong logistics capability resulting in
economical, fast or timely logistics. In using its capability an organization needs also its other
resources, such as production machines, for achieving its objectives.
Which capabilities are the most valuable for a firm? 'Core capabilities' are said to differentiate a
firm strategically from others (Leonard-Barton 1992; Kogut and Kulatilaka 2001) and 'distinctive
capabilities' to provide competitive advantage (Day 1994; D'Este 2002). Both of them are used
to describe organization’s unique skills and knowledge. In the resourced-based theories of firm-
specific advantage, particularly the concept of technological capabilities comes up (Mayer and
Salomon 2006).
141
2.3.2 Technological capabilities
Technological capabilities define the roots of a firm's sustainable competitive advantage (Lee et
al. 2001). There is no well-established definition for the concept of technology in prior
literature. Nelson and Winter (1982:104) discuss technology by writing “skills, organization, and
‘technology’ are intimately intertwined in a functioning routine, and it is difficult to say exactly
where one aspect ends and another begins”. Levinthal and March (1981) see technology as any
semi-stable way how an organization functions and deals with its environment. Zyglidopoulos
(1999) distinguishes, referring to several authors, two dimensions of technology. The narrow
dimension is formed only by codifiable explicit information which is held in patents, manuals
and blueprints, while the broad dimension is in tacit form. He argues that, from the resource-
based perspective, technology is embodied in physical and human assets in an organization –
that is routines and capabilities.
The concept of technological capabilities is as vague as the technology itself. The concept of
technological capabilities is often linked tightly to a firm’s R&D activities and has been
analyzed with firms’ products and patents (Stuart and Podolny 1996). More abstract approach
is also common. Mayer and Salomon (2006) handle technological capabilities as an ability to
fulfill customer’s requirements in many different aspects such as cost. Bell and Pavitt (Bell and
Pavitt 1995:78) define technological capabilities as “the resources needed to generate and
manage technological change, including skills, knowledge, experience and organizational
systems”. Figueiredo (2002:74) views them as “resources needed to generate and manage
improvements in processes and production organisation, products, equipment, and
engineering projects”. Nelson and Winter (1982) prefer discussing knowledge which an
organization holds as a whole and thus defines the boundaries for firm’s choices regarding
technology.
The discussion above suggests that a set of different capabilities, or dimensions of knowledge,
define firm’s technological capabilities. After all, firms are formed by different types of
capabilities in order to carry out their technological activities (Figueiredo 2003). This view is
supported by Dosi (1982) who notes that firms’ non-technological assets influence the direction
of its technological trajectory because it’s more likely that firms will develop those technologies
which can be supported by their existing assets. Wernerfelt (1984) proposes that by specifying a
resource profile for a firm, it is possible to find the optimal product-market activities for it. For
example a firm with strong marketing capability is probable to develop products which
142
especially benefit from marketing. Peteraf (1993:188) argues that firms tend to enter those
markets where firm’s resource capabilities match the market’s resource requirements.
2.4 Capabilities and path-dependence
As discussed, organizations change their routines in order to adapt to the changing
environment. However, firms cannot once in a while jump from one optimal state to another,
because changing the organization does not happen quickly, it’s costly, and because history
matters (Teece et al. 1997). Organization’s current state is molded by the path which it has
travelled and its history and current state restrict its possibilities in the future (ibid.).
History is not only a source of restrictions though. A company’s unique historical conditions
can be one reason why it can possess a set of resources and capabilities which are difficult to
imitate by the competitors and thus they can lead to a competitive advantage (Barney 1991).
Strong path-dependence is one characteristic of capabilities (Helfat and Peteraf 2003). The
phenomenon is called learning-by-doing (Pisano 2000), experience accumulation (Zollo and
Winter 2002), capability accumulation (Bell and Pavitt 1995; Figueiredo 2002; 2003), and
strengthening capabilities with use (Zahra et al. 2006). Because of learning by doing, exploiting
existing capabilities leads to cumulative and incremental improvement in them (Kogut and
Kulatilaka 2001). Building and maintaining strong capabilities therefore require consistent and
systematic development over time. However, systematic development of capabilities that were
successful in the past might not always be an advantage in the future. Accumulating old
expertise when change would be required can lead to competency traps (Levitt and March
1988:322) and capabilities can become rigidities (Leonard-Barton 1992).
2.5 Identifying and measuring capabilities
2.5.1 Obstacles in measurement
How can one say if a firm has a certain capability or not? Winter (2000) proposes that there is
no clear limit for having or not having one. The definitions in chapter 2.3.1, which use inputs
and outputs in defining capabilities, lead to an idea that capabilities could be identified by
observing the inputs i.e. the routines and resources in a firm, to see what a firm really does and
thus is capable of doing. Another way could be observing the outputs i.e. the tangible and
143
intangible results of firm activities, as a proof of an existing capability. The former might be
more complex to do because of the ambiguous nature of capabilities (Barney 1991).
What about assessing the strength of a capability? One characteristic of intangible resources is
that they are difficult to measure (Saaty et al. 2003). There exist no established measures for
capabilities, and that has been one of the problems in prior capability research (Robins and
Wiersema 1995; Dutta et al. 2005; Laamanen and Wallin 2009). Measuring capabilities is also
questionable in a sense that capabilities are firm-specific (Amit and Schoemaker 1993), which
makes them less comparable between firms. Dutta, Narasimhan et al. (2005) note that since
capabilities are in the middle of inputs and outputs, they should both be taken into account in
an assessment of capabilities. This carries conviction, considering that firms producing
identical outputs with different inputs, or vice versa, must have different strengths in their
capabilities. It has also been proposed that different external conditions can hinder the
comparison of capabilities between firms (Figueiredo 2003; Dutta et al. 2005). Helfat (1997)
points out that capabilities can be complementary in the sense that it is difficult to explain
some achieved output with some specific capability. In a similar manner Flynn and Flynn
(2004) discuss the interaction of capabilities: how they can be mutually reinforcing and
debilitating, and how other capabilities can lay the foundation for new capabilities.
To summarize, the outcomes of firm’s activities cannot be explained only by individual
capabilities. Capabilities function together with each other as a portfolio, and a changing
external environment requires changing configurations in capabilities. In developing
capabilities firms confront opportunity costs, meaning that they have limited assets for
developing capabilities (Dierickx and Cool 1989). Hence, developing one capability means less
development possibilities for other capabilities. Firm management has to choose an optimal
portfolio of capabilities to develop. Saaty, Vargas et al. (2003) suggest that resource allocation
and prioritization can be used as a measurement for intangible resources. Assuming that
management’s mental models drive the resource allocation, their attention reflects the
development of capabilities.
2.5.2 Attention for capabilities
Research on mental models of firm leaders has been seen as a potential addition to the
resource-based theory of a firm (Barr et al. 1992). It has been widely agreed that managers drive
the development of firm capabilities (Levinthal and Myatt 1994; Tripsas and Gavetti 2000;
Adner and Helfat 2003; Helfat and Peteraf 2003; Gavetti 2005; Zahra et al. 2006; Eggers and
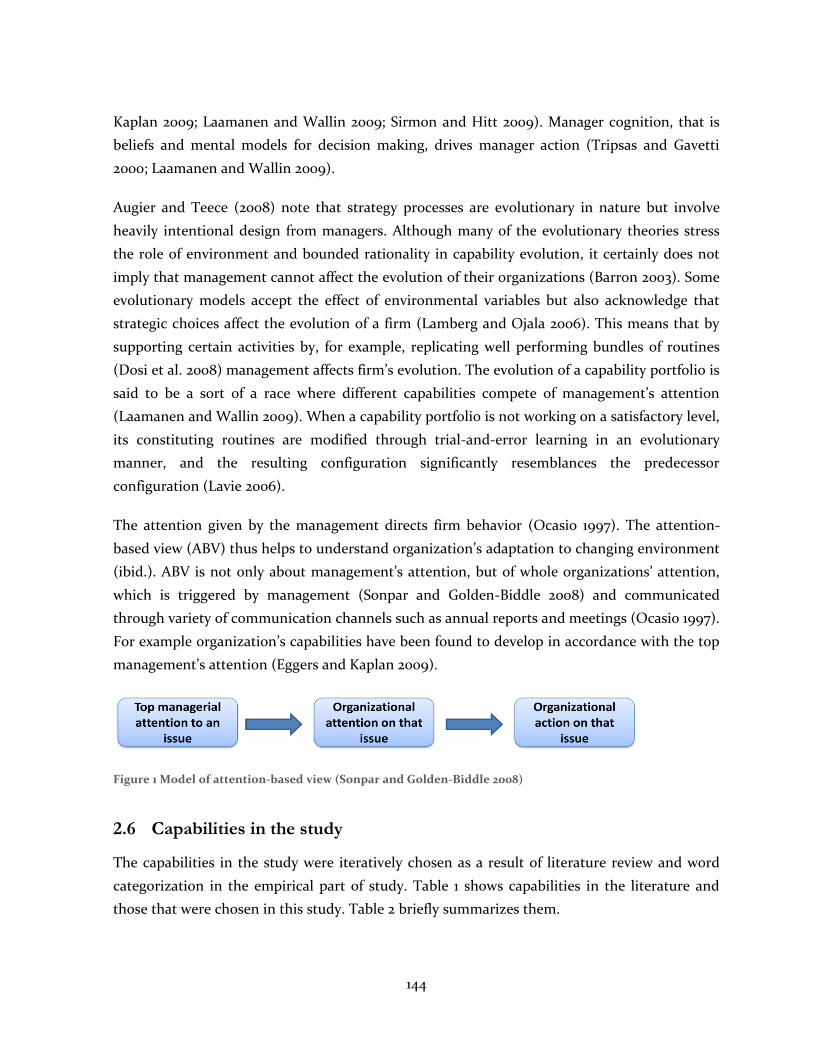
144
Kaplan 2009; Laamanen and Wallin 2009; Sirmon and Hitt 2009). Manager cognition, that is
beliefs and mental models for decision making, drives manager action (Tripsas and Gavetti
2000; Laamanen and Wallin 2009).
Augier and Teece (2008) note that strategy processes are evolutionary in nature but involve
heavily intentional design from managers. Although many of the evolutionary theories stress
the role of environment and bounded rationality in capability evolution, it certainly does not
imply that management cannot affect the evolution of their organizations (Barron 2003). Some
evolutionary models accept the effect of environmental variables but also acknowledge that
strategic choices affect the evolution of a firm (Lamberg and Ojala 2006). This means that by
supporting certain activities by, for example, replicating well performing bundles of routines
(Dosi et al. 2008) management affects firm’s evolution. The evolution of a capability portfolio is
said to be a sort of a race where different capabilities compete of management’s attention
(Laamanen and Wallin 2009). When a capability portfolio is not working on a satisfactory level,
its constituting routines are modified through trial-and-error learning in an evolutionary
manner, and the resulting configuration significantly resemblances the predecessor
configuration (Lavie 2006).
The attention given by the management directs firm behavior (Ocasio 1997). The attention-
based view (ABV) thus helps to understand organization’s adaptation to changing environment
(ibid.). ABV is not only about management’s attention, but of whole organizations’ attention,
which is triggered by management (Sonpar and Golden-Biddle 2008) and communicated
through variety of communication channels such as annual reports and meetings (Ocasio 1997).
For example organization’s capabilities have been found to develop in accordance with the top
management’s attention (Eggers and Kaplan 2009).
Figure 1 Model of attention-based view (Sonpar and Golden-Biddle 2008)
2.6 Capabilities in the study
The capabilities in the study were iteratively chosen as a result of literature review and word
categorization in the empirical part of study. Table 1 shows capabilities in the literature and
those that were chosen in this study. Table 2 briefly summarizes them.
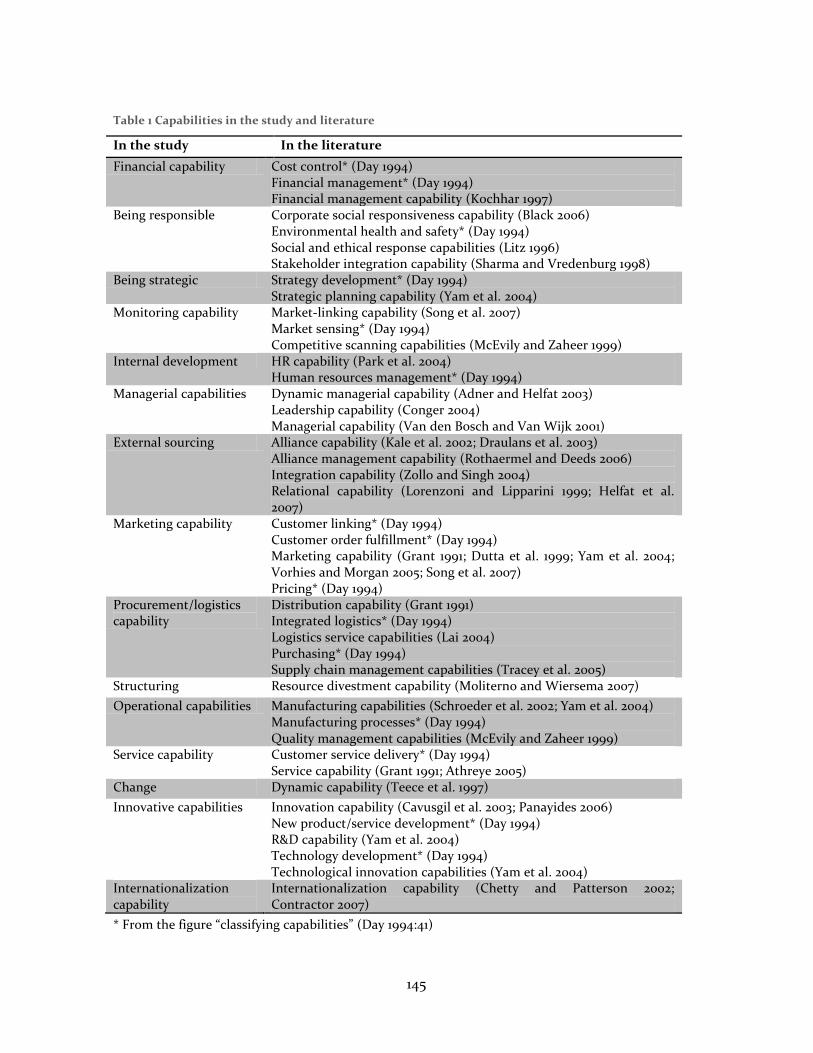
145
Table 1 Capabilities in the study and literature
In the study In the literature
Financial capability Cost control* (Day 1994) Financial management* (Day 1994) Financial management capability (Kochhar 1997)
Being responsible Corporate social responsiveness capability (Black 2006) Environmental health and safety* (Day 1994) Social and ethical response capabilities (Litz 1996) Stakeholder integration capability (Sharma and Vredenburg 1998)
Being strategic Strategy development* (Day 1994) Strategic planning capability (Yam et al. 2004)
Monitoring capability Market-linking capability (Song et al. 2007) Market sensing* (Day 1994) Competitive scanning capabilities (McEvily and Zaheer 1999)
Internal development HR capability (Park et al. 2004) Human resources management* (Day 1994)
Managerial capabilities Dynamic managerial capability (Adner and Helfat 2003) Leadership capability (Conger 2004) Managerial capability (Van den Bosch and Van Wijk 2001)
External sourcing Alliance capability (Kale et al. 2002; Draulans et al. 2003) Alliance management capability (Rothaermel and Deeds 2006) Integration capability (Zollo and Singh 2004) Relational capability (Lorenzoni and Lipparini 1999; Helfat et al. 2007)
Marketing capability Customer linking* (Day 1994) Customer order fulfillment* (Day 1994) Marketing capability (Grant 1991; Dutta et al. 1999; Yam et al. 2004; Vorhies and Morgan 2005; Song et al. 2007) Pricing* (Day 1994)
Procurement/logistics capability
Distribution capability (Grant 1991) Integrated logistics* (Day 1994) Logistics service capabilities (Lai 2004) Purchasing* (Day 1994) Supply chain management capabilities (Tracey et al. 2005)
Structuring Resource divestment capability (Moliterno and Wiersema 2007)
Operational capabilities Manufacturing capabilities (Schroeder et al. 2002; Yam et al. 2004) Manufacturing processes* (Day 1994) Quality management capabilities (McEvily and Zaheer 1999)
Service capability Customer service delivery* (Day 1994) Service capability (Grant 1991; Athreye 2005)
Change Dynamic capability (Teece et al. 1997)
Innovative capabilities Innovation capability (Cavusgil et al. 2003; Panayides 2006) New product/service development* (Day 1994) R&D capability (Yam et al. 2004) Technology development* (Day 1994) Technological innovation capabilities (Yam et al. 2004)
Internationalization capability
Internationalization capability (Chetty and Patterson 2002; Contractor 2007)
* From the figure “classifying capabilities” (Day 1994:41)
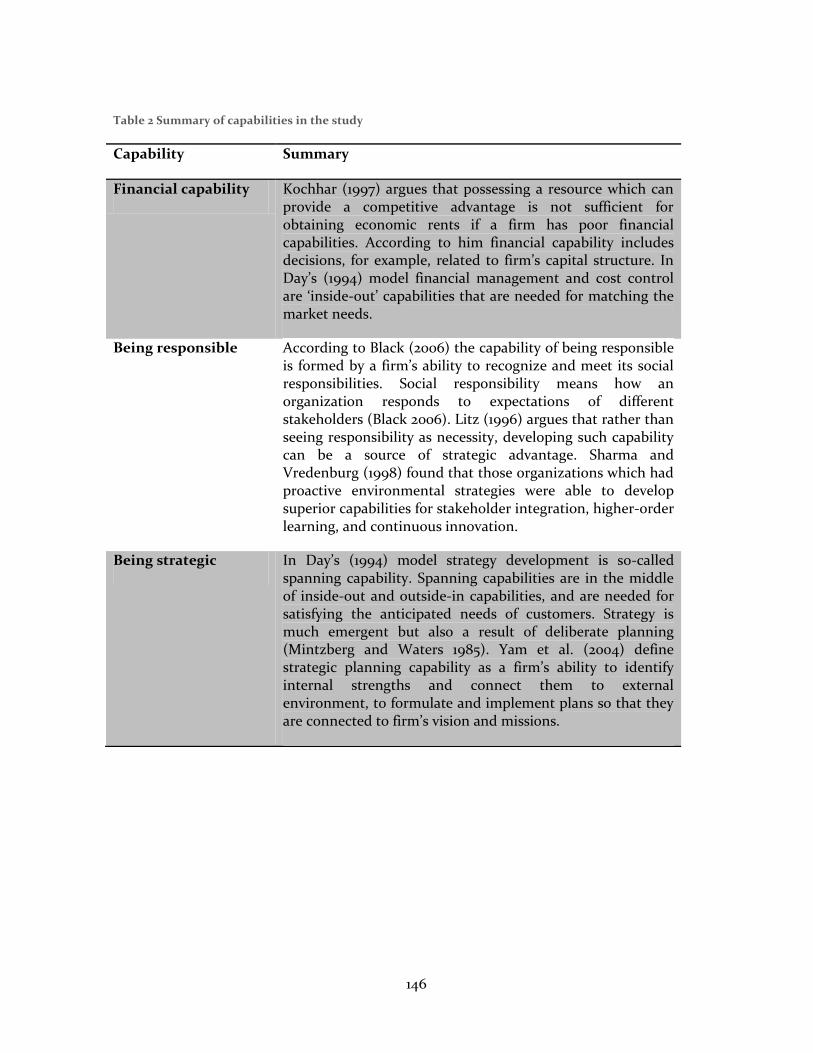
146
Table 2 Summary of capabilities in the study
Capability Summary
Financial capability Kochhar (1997) argues that possessing a resource which can provide a competitive advantage is not sufficient for obtaining economic rents if a firm has poor financial capabilities. According to him financial capability includes decisions, for example, related to firm’s capital structure. In Day’s (1994) model financial management and cost control are ‘inside-out’ capabilities that are needed for matching the market needs.
Being responsible According to Black (2006) the capability of being responsible is formed by a firm’s ability to recognize and meet its social responsibilities. Social responsibility means how an organization responds to expectations of different stakeholders (Black 2006). Litz (1996) argues that rather than seeing responsibility as necessity, developing such capability can be a source of strategic advantage. Sharma and Vredenburg (1998) found that those organizations which had proactive environmental strategies were able to develop superior capabilities for stakeholder integration, higher-order learning, and continuous innovation.
Being strategic In Day’s (1994) model strategy development is so-called spanning capability. Spanning capabilities are in the middle of inside-out and outside-in capabilities, and are needed for satisfying the anticipated needs of customers. Strategy is much emergent but also a result of deliberate planning (Mintzberg and Waters 1985). Yam et al. (2004) define strategic planning capability as a firm’s ability to identify internal strengths and connect them to external environment, to formulate and implement plans so that they are connected to firm’s vision and missions.
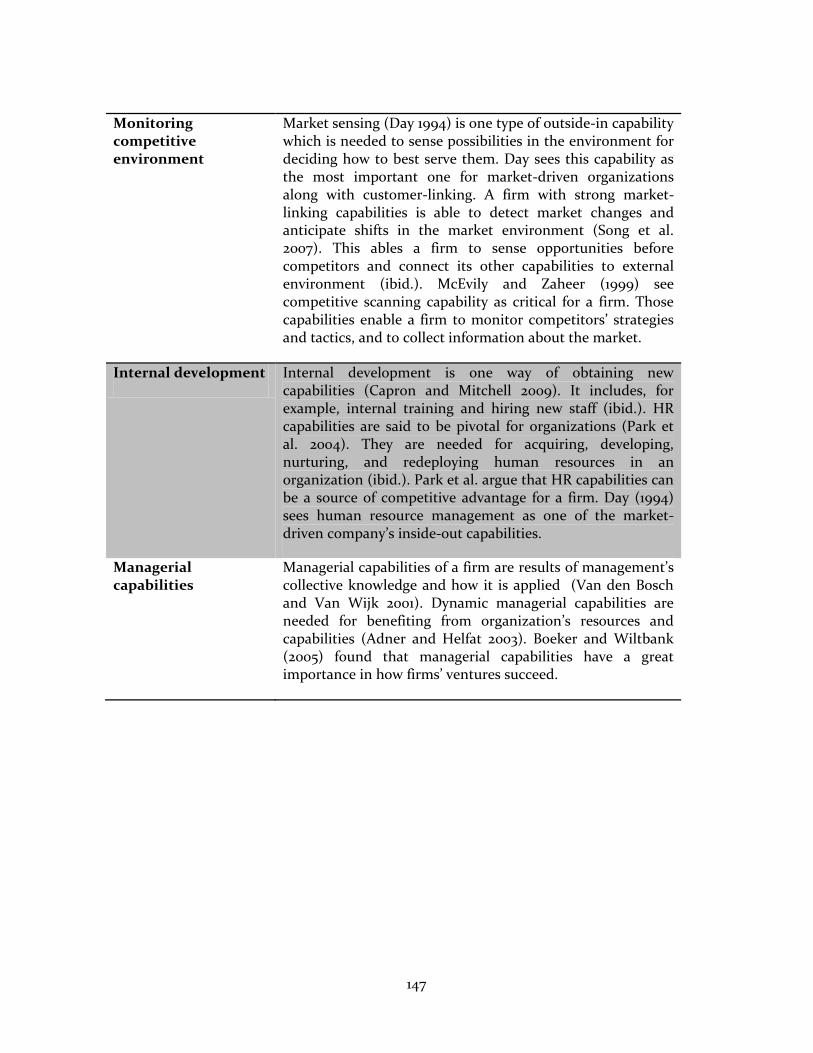
147
Monitoring competitive environment
Market sensing (Day 1994) is one type of outside-in capability which is needed to sense possibilities in the environment for deciding how to best serve them. Day sees this capability as the most important one for market-driven organizations along with customer-linking. A firm with strong market-linking capabilities is able to detect market changes and anticipate shifts in the market environment (Song et al. 2007). This ables a firm to sense opportunities before competitors and connect its other capabilities to external environment (ibid.). McEvily and Zaheer (1999) see competitive scanning capability as critical for a firm. Those capabilities enable a firm to monitor competitors’ strategies and tactics, and to collect information about the market.
Internal development Internal development is one way of obtaining new capabilities (Capron and Mitchell 2009). It includes, for example, internal training and hiring new staff (ibid.). HR capabilities are said to be pivotal for organizations (Park et al. 2004). They are needed for acquiring, developing, nurturing, and redeploying human resources in an organization (ibid.). Park et al. argue that HR capabilities can be a source of competitive advantage for a firm. Day (1994) sees human resource management as one of the market-driven company’s inside-out capabilities.
Managerial capabilities
Managerial capabilities of a firm are results of management’s collective knowledge and how it is applied (Van den Bosch and Van Wijk 2001). Dynamic managerial capabilities are needed for benefiting from organization’s resources and capabilities (Adner and Helfat 2003). Boeker and Wiltbank (2005) found that managerial capabilities have a great importance in how firms’ ventures succeed.
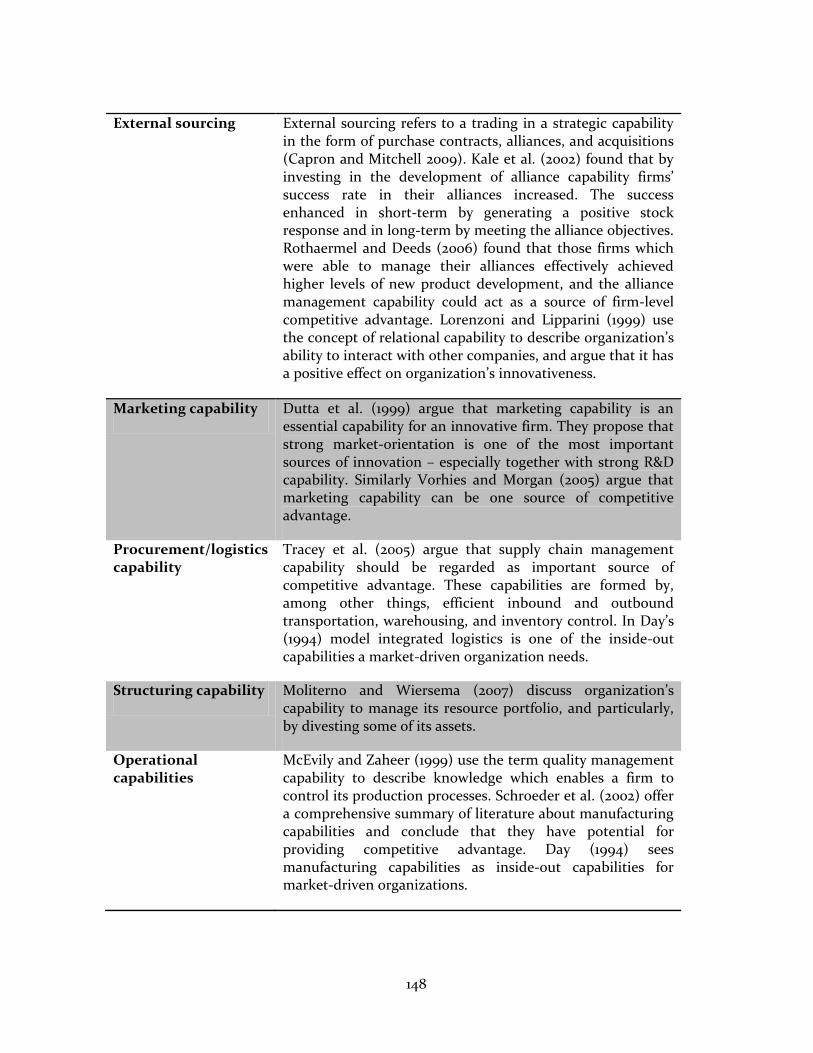
148
External sourcing External sourcing refers to a trading in a strategic capability in the form of purchase contracts, alliances, and acquisitions (Capron and Mitchell 2009). Kale et al. (2002) found that by investing in the development of alliance capability firms’ success rate in their alliances increased. The success enhanced in short-term by generating a positive stock response and in long-term by meeting the alliance objectives. Rothaermel and Deeds (2006) found that those firms which were able to manage their alliances effectively achieved higher levels of new product development, and the alliance management capability could act as a source of firm-level competitive advantage. Lorenzoni and Lipparini (1999) use the concept of relational capability to describe organization’s ability to interact with other companies, and argue that it has a positive effect on organization’s innovativeness.
Marketing capability Dutta et al. (1999) argue that marketing capability is an essential capability for an innovative firm. They propose that strong market-orientation is one of the most important sources of innovation – especially together with strong R&D capability. Similarly Vorhies and Morgan (2005) argue that marketing capability can be one source of competitive advantage.
Procurement/logistics capability
Tracey et al. (2005) argue that supply chain management capability should be regarded as important source of competitive advantage. These capabilities are formed by, among other things, efficient inbound and outbound transportation, warehousing, and inventory control. In Day’s (1994) model integrated logistics is one of the inside-out capabilities a market-driven organization needs.
Structuring capability Moliterno and Wiersema (2007) discuss organization’s capability to manage its resource portfolio, and particularly, by divesting some of its assets.
Operational capabilities
McEvily and Zaheer (1999) use the term quality management capability to describe knowledge which enables a firm to control its production processes. Schroeder et al. (2002) offer a comprehensive summary of literature about manufacturing capabilities and conclude that they have potential for providing competitive advantage. Day (1994) sees manufacturing capabilities as inside-out capabilities for market-driven organizations.
149
Service capability Customer service delivery is a spanning-capability in between the customer and a firm (Day 1994). Grant (1991) treats service capabilities as one factor behind differentiation and competitive advantage of a firm.
Change Dynamic capabilities (Teece et al. 1997) are behind organization’s ability to change. They come in many forms and can thus overlap with other capabilities in this study. Dynamic capabilities also include recognition of changes externally (Helfat et al. 2007). Therefore they are closely related to monitoring capability.
Innovative capabilities
Firm’s innovative performance is dependent on its innovation capability (Cavusgil et al. 2003). Sometimes it is thought to be an independent capability (Panayides 2006) but it is also acknowledged that it may come in many forms such as R&D capability or resource allocation (Yam et al. 2004).
Internationalization capability
Internationalization capability can be defined as a firm’s ability to reproduce an organization and staff in a foreign location (Contractor 2007). Contractor argues that this capability can be a distinctive one - learnt only in some organizations.
150
3 ORGANIZATIONAL EVOLUTION
This chapter discusses organizational evolution. Organizations are seen here as bundles of
resources and capabilities (Amit and Schoemaker 1993) and the evolution is thus approached
from the perspective of capability development. Before going into how organizations evolve,
the concepts of configuration and fitness are discussed, as they have been used before for
modeling evolutionary processes in strategic management (Siggelkow 2001).
3.1 Organizational configurations
Configurational approach is an important part of strategic management (Fiss 2007; Helfat et al.
2007). Any multidimensional constellation of conceptually distinct characteristics in a firm can
be thought of as a configuration (Meyer et al. 1993). The concept is quite broad, as these
characteristics can differ from organizational structures to activities and resources (Fiss 2007).
Configurations are not comprehensive descriptions of organizations but are used to describe
organizations’ strategies (Miller 1986; 1996).
The approach fits in to the resourced-based view (Black and Boal 1994; Delery and Doty 1996;
Miller 1996) and the capabilities perspective (Barron 2003; Lavie 2006; Helfat et al. 2007).
Dynamic capability literature discusses how organizations reconfigure their capabilities (Teece
et al. 1997) and how capability configurations are vital for creating value for customers (Sirmon
et al. 2007). One approach to organizational configurations is to look at capability portfolios
(Lavie 2006).
Why to look at capability portfolios rather than individual capabilities? First of all, as discussed
in earlier chapters, organization’s technological capabilities are formed by a set of capabilities
and resources rather than just one ‘technological capability’. It has been also argued that
resources are too often seen as individual entities which can lead to a competitive advantage
(Black and Boal 1994). Black and Boal propose that the way how a network of organization’s
resources is combined, or configured, is more vital for achieving competitive advantage than
individual resources. There are a number of examples of configurational approach in the
resource-based view. Kogut and Kulatilaka (2001) analyze firm’s choice of optimal capability
set. Galunic and Rodan (1998) discuss how resources can be reconfigured. Dierickx and Cool
(1989) handle assets as bundles. Flynn and Flynn (2004) note that capabilities can be built upon
each other. Some authors discuss assets (Teece 1986; Amit and Schoemaker 1993; Helfat 1997)
and capabilities (Moorman and Slotegraaf 1999) as complementaries. Teece, Pisano et al. (2000)
151
argue that technological innovations require different complementary capabilities. Being a
complementary is an essential part of configurations because it means that “the strategic value
of each asset's relative magnitude [may] increase with an increase in the relative magnitude of
other Strategic Assets” (Amit and Schoemaker 1993:39). Similarly, activities are complementary
“if doing (more of) any one of them increases the returns to doing (more of) the others”
(Milgrom and Roberts 1995:181).
Conceptually capability development takes place at different levels (Laamanen and Wallin
2009). Laamanen and Wallin propose that at the level of individual capabilities the interest is in
what ways those capabilities are developed, but at the level of a capability portfolio the interest
is in which capabilities company develops and which it does not. Levinthal (2000) argues that a
changing environment pressures an organization to re-evaluate and possibly repackage its
capabilities because a new environment can make some capabilities less and some more
valuable than they used to be. He also notes that changes in the environment may influence
the complementarity among sets of capabilities. For example new manufacturing technique
may place a premium on a different set of human-resource practices.
In brief, configurations mean different sets of choices made. As an example, if an organization
has A choices to make with B options in all of them, the total number of possible configurations
with these choices is . Delery and Doty (1996:804) summarize configurational approach well
by noting that “configurational theories are concerned with how the pattern of multiple
independent variables is related to a dependent variable rather than with how individual
independent variables are related to the dependent variable”. For example configurations can
be approached by looking at how multiple characteristics of an organization are related to
organization’s performance.
Configurations are also used in the context of organizational change (Siggelkow 2002). When
markets and technologies change, an organization must reconfigure its assets and structures
(Teece 2007). Generally it is not enough for a firm to change individual activities but it must
change a number of activities at the same time (Porter and Siggelkow 2008). By reconfiguring, a
firm can maintain its evolutionary fitness and escape unwanted path-dependencies (Teece
2007).
152
3.2 Organizational fitness
The framework of fitness was originally created in the context of evolutionary biology (Wright
1931), but is now considered relevant also to strategic management (Venkatraman and Camillus
1984) and organizational research (Ruef 1997; Beinhocker 1999; Gavetti and Levinthal 2000;
Siggelkow 2001). Though, there is no established definition for it in the field of business studies
(McCarthy and Tan 2000). The concept is usually associated with terms competitiveness,
effectiveness, profitability, return on investment, and customer satisfaction (ibid).
Organizational fitness can be distinguished into two types: internal fitness and environmental
fitness (Miller 1992). Siggelkow (2001) calls these internal fit and external fit. He approaches
internal fit as interactions of firm’s choices, how its internal logic work and external fit as the
appropriateness of the configuration to the prevailing external environment (ibid.).
Fitness landscapes are often used for illustrating the concept. Kauffman’s (1993) NK-model
discusses rugged fitness landscapes in the context of genotype mutations. The interest in
fitness landscapes was originally in organisms’ evolution - in an evolutionary process of
variation and selection. How organism’s performance changes in its environment when some of
its elements are changed? What kinds of combinations of genes are behind organism’s survival?
These types of analogies from biology are often used for modeling organizational evolution
(Nelson and Winter 1982; Bruderer and Singh 1996; Gavetti and Levinthal 2000). For example
organizational routines are treated as genes, which define organization’s possible behavior in a
similar way than genes define living organism’s behavior. As biological populations adapt to
their habitat with variations in their genes, organizations are thought to adapt to their
competitive environment by changing their routines (Nelson and Winter 1982). If capabilities
are viewed as higher level routines (Winter 2000), organizations adapt with changes in their
capabilities.
Firm’s performance can be simplified as being a function of its configuration. If a firm is
thought of as a system that has N attributes in its configuration, performance is a function of N
variables. These attributes can be activities, structures, capabilities, resources, etc. (Siggelkow
2001). A performance landscape can be created by mapping the function to N+1 dimensional
space where the extra dimension is the firm’s performance. Thus, fitness landscapes are
representations of all the possible configurations and performance of a population. For the
purpose of illustration in three dimensions, Siggelkow uses two variables in his paper. Although
visualization is difficult, the same logic can be used also with more dimensions.
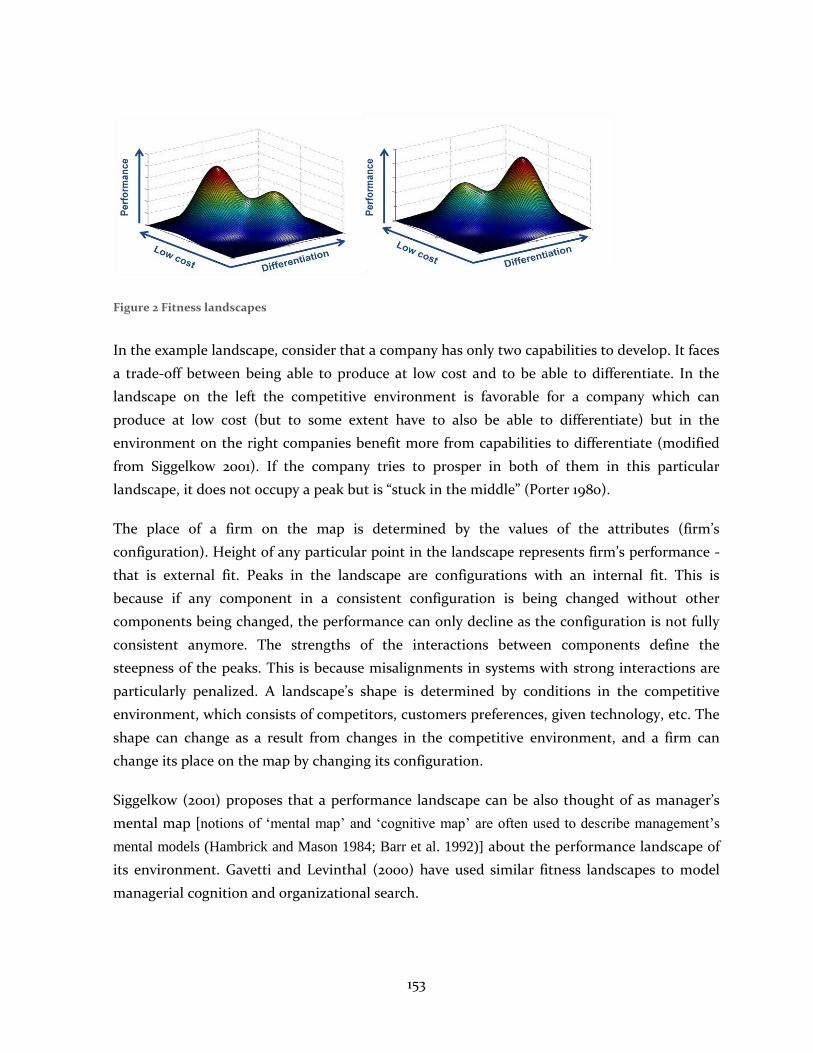
153
Figure 2 Fitness landscapes
In the example landscape, consider that a company has only two capabilities to develop. It faces
a trade-off between being able to produce at low cost and to be able to differentiate. In the
landscape on the left the competitive environment is favorable for a company which can
produce at low cost (but to some extent have to also be able to differentiate) but in the
environment on the right companies benefit more from capabilities to differentiate (modified
from Siggelkow 2001). If the company tries to prosper in both of them in this particular
landscape, it does not occupy a peak but is “stuck in the middle” (Porter 1980).
The place of a firm on the map is determined by the values of the attributes (firm’s
configuration). Height of any particular point in the landscape represents firm’s performance -
that is external fit. Peaks in the landscape are configurations with an internal fit. This is
because if any component in a consistent configuration is being changed without other
components being changed, the performance can only decline as the configuration is not fully
consistent anymore. The strengths of the interactions between components define the
steepness of the peaks. This is because misalignments in systems with strong interactions are
particularly penalized. A landscape’s shape is determined by conditions in the competitive
environment, which consists of competitors, customers preferences, given technology, etc. The
shape can change as a result from changes in the competitive environment, and a firm can
change its place on the map by changing its configuration.
Siggelkow (2001) proposes that a performance landscape can be also thought of as manager’s
mental map [notions of „mental map‟ and „cognitive map‟ are often used to describe management‟s
mental models (Hambrick and Mason 1984; Barr et al. 1992)] about the performance landscape of
its environment. Gavetti and Levinthal (2000) have used similar fitness landscapes to model
managerial cognition and organizational search.
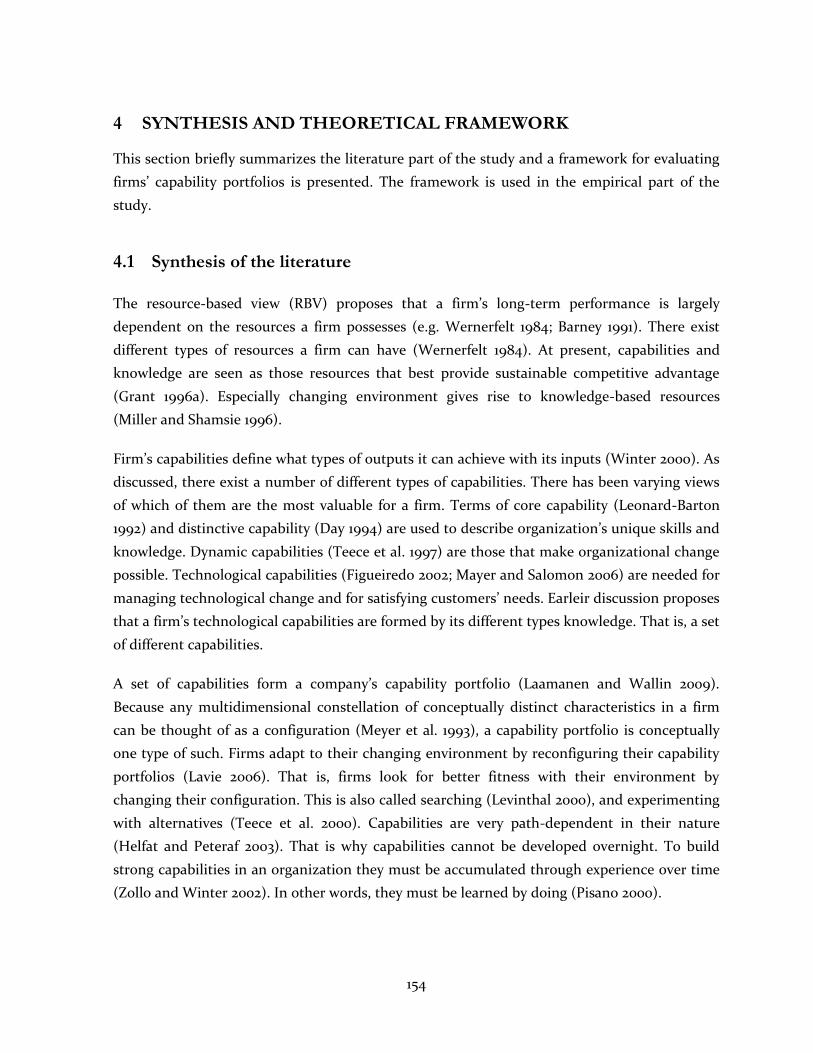
154
4 SYNTHESIS AND THEORETICAL FRAMEWORK
This section briefly summarizes the literature part of the study and a framework for evaluating
firms’ capability portfolios is presented. The framework is used in the empirical part of the
study.
4.1 Synthesis of the literature
The resource-based view (RBV) proposes that a firm’s long-term performance is largely
dependent on the resources a firm possesses (e.g. Wernerfelt 1984; Barney 1991). There exist
different types of resources a firm can have (Wernerfelt 1984). At present, capabilities and
knowledge are seen as those resources that best provide sustainable competitive advantage
(Grant 1996a). Especially changing environment gives rise to knowledge-based resources
(Miller and Shamsie 1996).
Firm’s capabilities define what types of outputs it can achieve with its inputs (Winter 2000). As
discussed, there exist a number of different types of capabilities. There has been varying views
of which of them are the most valuable for a firm. Terms of core capability (Leonard-Barton
1992) and distinctive capability (Day 1994) are used to describe organization’s unique skills and
knowledge. Dynamic capabilities (Teece et al. 1997) are those that make organizational change
possible. Technological capabilities (Figueiredo 2002; Mayer and Salomon 2006) are needed for
managing technological change and for satisfying customers’ needs. Earleir discussion proposes
that a firm’s technological capabilities are formed by its different types knowledge. That is, a set
of different capabilities.
A set of capabilities form a company’s capability portfolio (Laamanen and Wallin 2009).
Because any multidimensional constellation of conceptually distinct characteristics in a firm
can be thought of as a configuration (Meyer et al. 1993), a capability portfolio is conceptually
one type of such. Firms adapt to their changing environment by reconfiguring their capability
portfolios (Lavie 2006). That is, firms look for better fitness with their environment by
changing their configuration. This is also called searching (Levinthal 2000), and experimenting
with alternatives (Teece et al. 2000). Capabilities are very path-dependent in their nature
(Helfat and Peteraf 2003). That is why capabilities cannot be developed overnight. To build
strong capabilities in an organization they must be accumulated through experience over time
(Zollo and Winter 2002). In other words, they must be learned by doing (Pisano 2000).
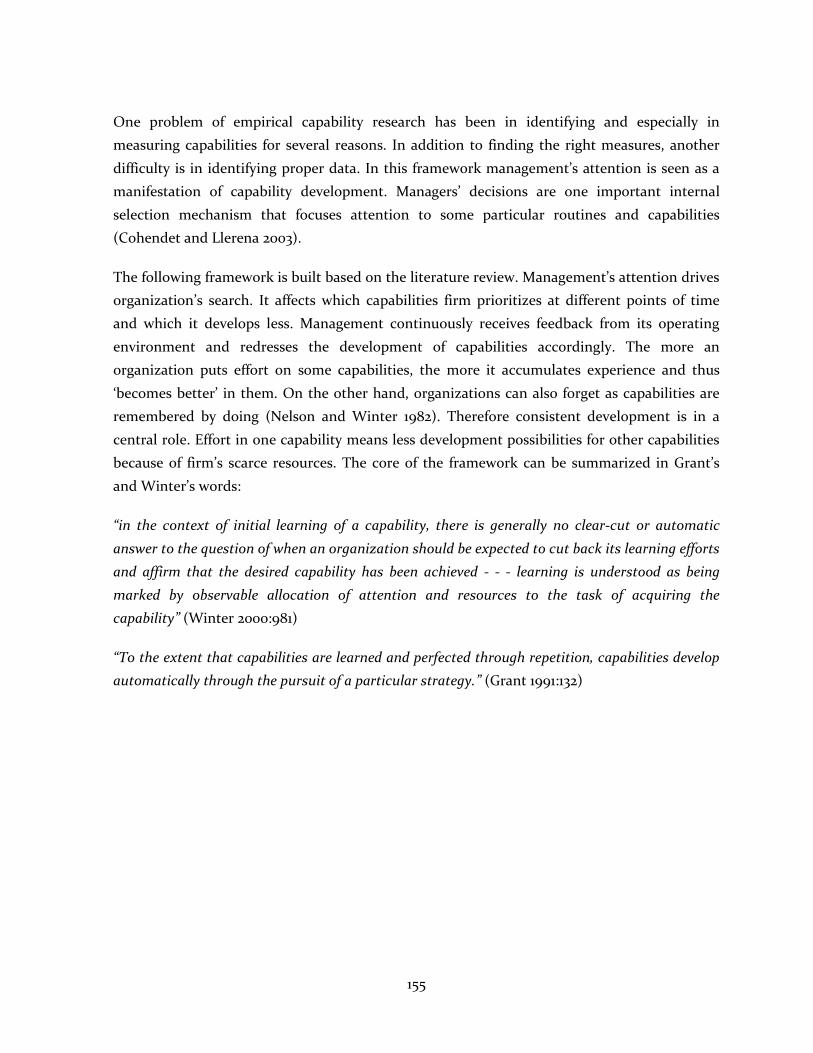
155
One problem of empirical capability research has been in identifying and especially in
measuring capabilities for several reasons. In addition to finding the right measures, another
difficulty is in identifying proper data. In this framework management’s attention is seen as a
manifestation of capability development. Managers’ decisions are one important internal
selection mechanism that focuses attention to some particular routines and capabilities
(Cohendet and Llerena 2003).
The following framework is built based on the literature review. Management’s attention drives
organization’s search. It affects which capabilities firm prioritizes at different points of time
and which it develops less. Management continuously receives feedback from its operating
environment and redresses the development of capabilities accordingly. The more an
organization puts effort on some capabilities, the more it accumulates experience and thus
‘becomes better’ in them. On the other hand, organizations can also forget as capabilities are
remembered by doing (Nelson and Winter 1982). Therefore consistent development is in a
central role. Effort in one capability means less development possibilities for other capabilities
because of firm’s scarce resources. The core of the framework can be summarized in Grant’s
and Winter’s words:
“in the context of initial learning of a capability, there is generally no clear-cut or automatic
answer to the question of when an organization should be expected to cut back its learning efforts
and affirm that the desired capability has been achieved - - - learning is understood as being
marked by observable allocation of attention and resources to the task of acquiring the
capability” (Winter 2000:981)
“To the extent that capabilities are learned and perfected through repetition, capabilities develop
automatically through the pursuit of a particular strategy.” (Grant 1991:132)
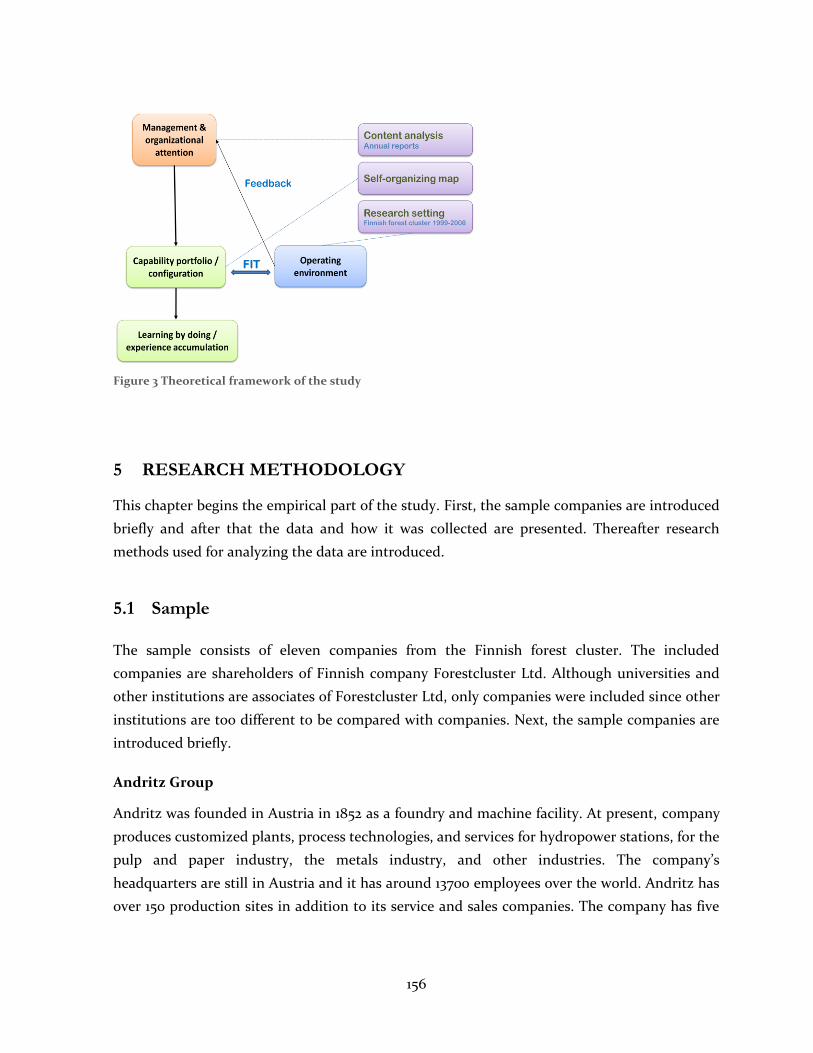
156
Figure 3 Theoretical framework of the study
5 RESEARCH METHODOLOGY
This chapter begins the empirical part of the study. First, the sample companies are introduced
briefly and after that the data and how it was collected are presented. Thereafter research
methods used for analyzing the data are introduced.
5.1 Sample
The sample consists of eleven companies from the Finnish forest cluster. The included
companies are shareholders of Finnish company Forestcluster Ltd. Although universities and
other institutions are associates of Forestcluster Ltd, only companies were included since other
institutions are too different to be compared with companies. Next, the sample companies are
introduced briefly.
Andritz Group
Andritz was founded in Austria in 1852 as a foundry and machine facility. At present, company
produces customized plants, process technologies, and services for hydropower stations, for the
pulp and paper industry, the metals industry, and other industries. The company’s
headquarters are still in Austria and it has around 13700 employees over the world. Andritz has
over 150 production sites in addition to its service and sales companies. The company has five
157
business areas (hydro, pulp & paper, metals, environment & process, and feed & biofuel) of
which pulp and paper and hydro are the largest ones in terms of sales.
Ciba
Switzerland-rooted Ciba was founded in 1884 as a chemicals company. The roots of the present
Ciba reach a bit further to 1758 when a Swiss chemicals company Geigy Ltd. started with
chemical and dye products. After several mergers and new names Ciba Specialty Chemicals was
spun off from its parent company and got a name Ciba Inc. Eventually in 2009 Ciba became a
part of BASF which has about 330 production sites and 97000 employees globally. Ciba itself
has around 12500 employees and 59 production sites in 120 countries. Nowadays Ciba’s business
is divided into three areas: plastic additives, coating effects, and water & paper treatment.
Kemira
Kemira was founded in 1920 as the state sulphuric acid and superphosphate plants. Originally
Kemira supplied products for state’s powder plants and agroculture but a couple of decades
later it started producing also chemicals for Finnish industries. In the latter part of the 20th
century Kemira entered new fields through acquisitions and mergers and started to
internationalize heavily. At present, Kemira is divided into five units. Paper, Water and Oil &
Mining are focusing on water and fiber management. Tikkurila is focused on paints and
coatings business and a new ChemSolutions unit concentrates on organic acids and salts.
Kemira operates in 40 countries and has around 9400 employees.
Metso
Metso was established in 1999 when Valmet and Rauma were merged. Valmet produced paper
and board machines and Rauma concentrated on fiber technology, rock crushing and flow
control solutions. The history of Valmet roots back to 1750’s when a shipyard for building
warships was established in Suomenlinna in Helsinki. Valmet and Rauma-Raahe were born in
1940’s when several state-owned metal workshops were merged into Valmet and multiple
sawmills into Rauma-Raahe. In addition to paper machines, Valmet’s products have included
ships, aircraft, weapons, locomotives, tractors, marine engines, and elevators. In 2008 Metso
got a new organizational structure which consists of three segments: Mining & construction
technology consisting of mining and construction business lines, Energy & environmental
technology consisting of power, automation and recycling business lines, and Paper & fiber
technology which consists of paper, fiber, and tissue business lines. Metso has nearly 30000
employees over the world of which nearly one third is from Finland.
158
Metsä-Botnia
Metsä-Botnia was founded in 1973 but its oldest part was founded over 110 years ago. The
company has had several large owners including Metsäpohjanmaa, Nokia, Serlachius, Metsä-
Serla, and UPM. Today Metsä-Botnia is a subsidiary of Metsäliitto which owns, after recent
arrangements, most of the shares of the company. Its other noteworthy owner is UPM-
kymmene. Metsä-Botnia is one of the world’s top producers of chemical pulp with nearly 2000
employees.
Metsäliitto
Metsäliitto was founded in 1934 by forest owners in order to coordinate timber sales to
customers outside Finland. In the beginning of 1950’s Metsäliitto entered the mechanical forest
industry by establishing its own sawmills, and a couple of years later the company moved into
the chemical forest industry when it started to manufacture pulp, paper and board. A few
decades later Metsäliitto Group was started, formed by Metsäliitto Cooperative, Metsä-Serla,
Metsä-Botnia and Finnforest. Metsäliitto group is now one of the largest forest industry groups
in the world with more than 16000 employees in about 30 countries. It has five business areas:
wood supply, wood products, pulp, board & paper, and tissue & cooking papers. Its parent
company Metsäliitto cooperative has 130000 members and owns approximately half of the
private forests in Finland.
M-real
M-real is one of the leading producers of paperboard in Europe and a supplier of paper. Its
customers vary from printing houses to brand owners. Until 2001 the company was known by
the name Metsä-Serla Oy, which was established as a merger of Metsäliiton teollisuus Oy (one
branch of Metsäliitto cooperative) and Serlachius Oy at the end of 1986. At the same time
Metsä-Botnia became its subsidiary. Oldest roots of the firm go back to 1860’s when Serlachius
Oy’s first groundwood plant was started. M-real consists of four business areas. Consumer
packaging is responsible for supplying paperboard, specialty papers and packaging services.
Office paper business area produces uncoated fine papers. Other papers -business area is
focused on specialty papers. Market pulp & energy -area mainly sells pulp but also energy. M-
real has around 6500 employees.
Ponsse
Ponsse has the shortest history of the sample companies and is the smallest company of the
sample in terms of personnel. Its first tractor was taken into use not earlier than in the late
159
1960’s. Ponsse’s first forest tractor was made for inventor’s own use but quickly he started
supplying tractors also for others and set up Ponsse Oy in 1970. 1980’s and 1990’s were times of
growth for now internationally operating Ponsse. The company operates approximately in 40
countries and has around 1500 employees. Ponsse’s products include forest harvesters, control
systems, and services.
Stora Enso
Stora Enso was born as a merger of Swedish Stora (until 1984 Stora Kopparbergs Bergslag) and
Finnish Enso (former Enso-Gutzeit) in 1998. Out of all sample companies Stora Enso has the
longest history. Earliest traces of Stora Kopparberg’s mines in Falun can be found from the 13th
century. The first paper and sawmills were built in the latter half of the 18th century, and at the
mid-19th century company supplied its first paper machine. Paper and pulp production grew
together with Stora’s iron and steel production. In 1978 Stora left its iron business and focused
on energy and forest industries. Stora and Enso grew with several acquisitions and mergers,
and finally with large ones as they acquired Holtzmann in 1998 and Consolidated papers in
2006. In 2008 Stora Enso consisted of six business areas: newsprint & book paper, magazine
paper, fine paper, consumer board, industrial packaging, and wood products. Stora Enso is the
largest company in the sample in terms of personnel and sales.
Tamfelt
Tamfelt's history can be traced back to 1797 when a woolen and worsted mill was established in
Jokioinen. In 1882 Tamfelt took the first step from consumer products to paper industry when it
started producing felts for paper machines. Focus changed permanently when in the 1960's the
machine felt division exceeded the sales of woollen mill for the first time. In 1965 company
started producing filter fabrics and since then has focused on technical textiles. In 1981 the
company switched its name from Tampereen Verkatehdas Oy to Tamfelt Corp. Today Tamfelt
consists of Tamfelt PMC which produces paper and board machine clothing and Tamfelt
filtration whose products are filter fabrics, for example, to the forest, mining and chemical
industries. Tamfelt has around 1500 employees and is the smallest company in the sample in
terms of sales.
UPM
UPM-Kymmene was started in 1995 when Kymmene Oy and Repola Oy were merged.
Company's roots go back to 1870's when its first mechanical pulp, paper and sawmills were
started (although now its oldest mills are from the 15th century). At present, UPM consists of
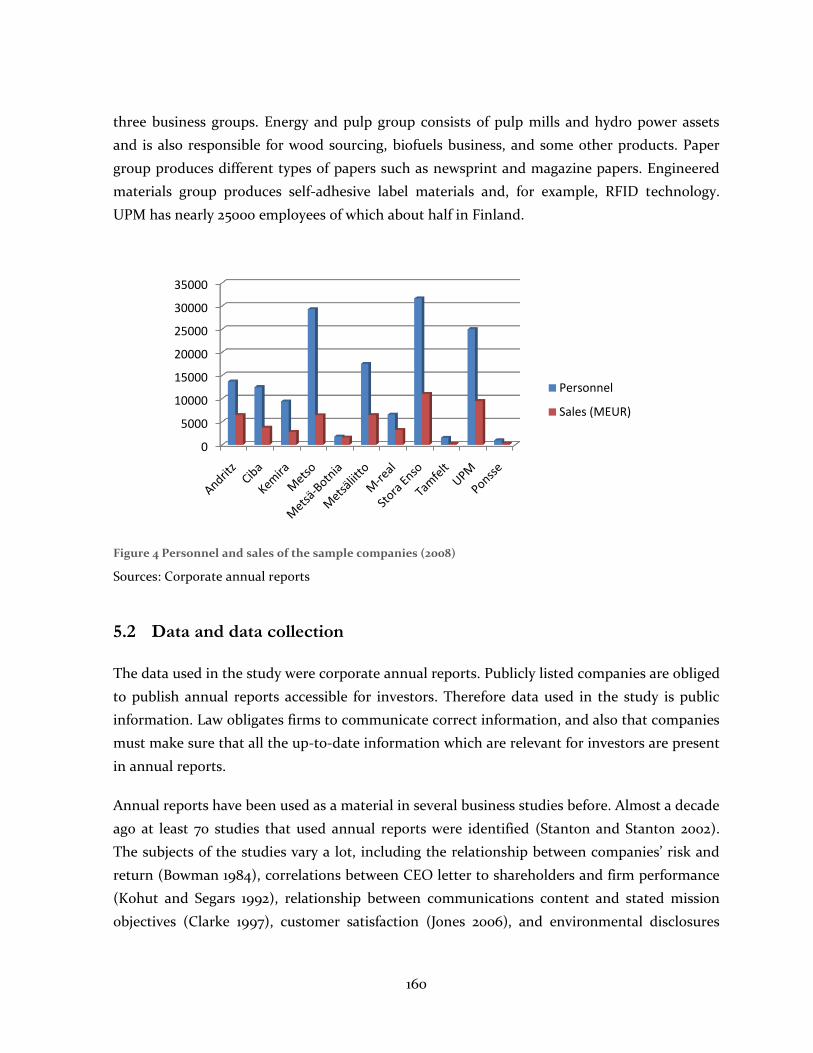
160
three business groups. Energy and pulp group consists of pulp mills and hydro power assets
and is also responsible for wood sourcing, biofuels business, and some other products. Paper
group produces different types of papers such as newsprint and magazine papers. Engineered
materials group produces self-adhesive label materials and, for example, RFID technology.
UPM has nearly 25000 employees of which about half in Finland.
Figure 4 Personnel and sales of the sample companies (2008)
Sources: Corporate annual reports
5.2 Data and data collection
The data used in the study were corporate annual reports. Publicly listed companies are obliged
to publish annual reports accessible for investors. Therefore data used in the study is public
information. Law obligates firms to communicate correct information, and also that companies
must make sure that all the up-to-date information which are relevant for investors are present
in annual reports.
Annual reports have been used as a material in several business studies before. Almost a decade
ago at least 70 studies that used annual reports were identified (Stanton and Stanton 2002).
The subjects of the studies vary a lot, including the relationship between companies’ risk and
return (Bowman 1984), correlations between CEO letter to shareholders and firm performance
(Kohut and Segars 1992), relationship between communications content and stated mission
objectives (Clarke 1997), customer satisfaction (Jones 2006), and environmental disclosures
0
5000
10000
15000
20000
25000
30000
35000
Personnel
Sales (MEUR)
161
(Neu et al. 1998). Bowman (1984) proposes that content analysis of annual reports can be of real
usefulness for understanding issues of corporate strategy and can serve as primary or
supplementary source of information. Sierilä (1989) argues that annual reports are too often
neglected in strategy research.
Also studies about managers’ cognition have used annual reports as material. Kaplan, Murray et
al. (2003) used word count measures in assessing managers’ recognition and response in
technological discontinuity. Osborne, Stubbart et al. (2001) used computer assisted content
analysis in their study related to cognitive strategic groups. Recently, Eggers and Kaplan (2009)
measured top management’s attention towards capabilities using CEO letters from annual
reports. In their study discussing managerial cognition and organizational renewal Barr et al.
(1992) acknowledge that annual reports may not be the ultimate data source but few rival
sources that provide insight into changing mental models of managers exist. They note that
annual reports are too important not to be given close attention by the top management in
terms of subject framing and word level editing. One of the strengths of annual reports is also
that they are suitable for longitudinal studies because they are published in consistent
intervals.
The annual reports were downloaded from companies’ websites in PDF-format, except one
which was in webpage format only but the content was the same as in the version released on
paper. Especially in the beginning of the millennium, companies released business and
environmental reports separately. In these cases they were merged into one. Altogether the
number of used annual reports was 101 from 11 companies, meaning that nine reports were not
available from the observation period. Six companies had all the ten annual reports and the
least was seven from one firm.
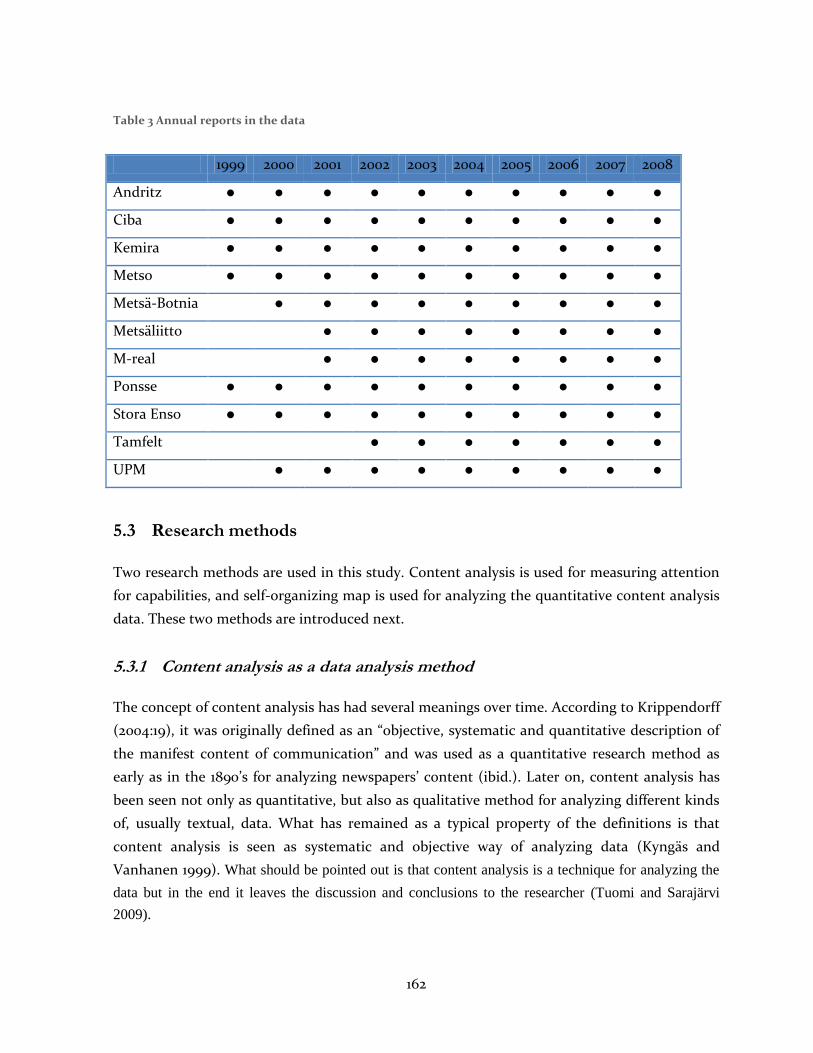
162
Table 3 Annual reports in the data
1999 2000 2001 2002 2003 2004 2005 2006 2007 2008
Andritz ● ● ● ● ● ● ● ● ● ●
Ciba ● ● ● ● ● ● ● ● ● ●
Kemira ● ● ● ● ● ● ● ● ● ●
Metso ● ● ● ● ● ● ● ● ● ●
Metsä-Botnia ● ● ● ● ● ● ● ● ●
Metsäliitto ● ● ● ● ● ● ● ●
M-real ● ● ● ● ● ● ● ●
Ponsse ● ● ● ● ● ● ● ● ● ●
Stora Enso ● ● ● ● ● ● ● ● ● ●
Tamfelt ● ● ● ● ● ● ●
UPM ● ● ● ● ● ● ● ● ●
5.3 Research methods
Two research methods are used in this study. Content analysis is used for measuring attention
for capabilities, and self-organizing map is used for analyzing the quantitative content analysis
data. These two methods are introduced next.
5.3.1 Content analysis as a data analysis method
The concept of content analysis has had several meanings over time. According to Krippendorff
(2004:19), it was originally defined as an “objective, systematic and quantitative description of
the manifest content of communication” and was used as a quantitative research method as
early as in the 1890’s for analyzing newspapers’ content (ibid.). Later on, content analysis has
been seen not only as quantitative, but also as qualitative method for analyzing different kinds
of, usually textual, data. What has remained as a typical property of the definitions is that
content analysis is seen as systematic and objective way of analyzing data (Kyngäs and
Vanhanen 1999). What should be pointed out is that content analysis is a technique for analyzing the
data but in the end it leaves the discussion and conclusions to the researcher (Tuomi and Sarajärvi
2009).
163
Using computers for automated content analysis has increased in popularity (Riffe et al. 1998).
At the simplest, content analysis is done by counting frequencies of words in the data but
better information can be retrieved with more advanced techniques where for example words’
contexts are examined or their relationships explored (Riffe et al. 1998). Perhaps the biggest
advantage of computer-aided analysis is the speed in which computers can go through large
amounts of data and if done properly, computers are reliable yielding always the same
information out of the data, and thus fulfilling the requirements of content analysis as being
‘systematic and objective’. This kind of data gathering is also called text data -mining, which is
one form of data mining. Data mining has been defined as extraction of implicit, previously
unknown and potentially useful information from data (Witten and Frank 2002).
As mentioned above, content analysis has had history both as qualitative and quantitative
research technique. Quantitative content analysis, either manual or automated, has been a
popular method for analyzing textual data - for instance in the field of business. Nearly all of
the studies listed in the preceding chapter using annual reports as material also used
quantitative content analysis as a research technique. Recently, these two approaches have
generated ‘a third movement’ in the form of mixed-methods research (Janasik et al. 2009).
Already fifteen years ago artificial intelligence software was used for analyzing content analysis
data in psychological studies (Gottschalk 1994). Janasik et al. propose that a technique called
‘self-organizing map’ can be a useful tool for analyzing qualitative (textual) data, by improving
the quality of inferences of the researcher and by providing a relatively objective approach. This
technique is introduced next.
5.3.2 Self-organizing map as a method for visualization
Self-organizing map, also called Kohonen map, is one of the most popular neural network
methods (Kohonen 2001). It is an algorithm that originates from artificial neural network
research, which studies algorithms that have analogies with the functioning of brain (ibid.).
What makes SOM special compared to other neural network methods is that it performs
unsupervised training (Kiang and Fisher 2008).
The self-organizing map (SOM) uses input data to produce a two-dimensional map as an
output. Input data consists of samples with n numerical attributes. The samples can therefore
be thought as vectors in n-dimensional space and attributes as the lengths of component
vectors. The output map consists of so-called nodes, also referred as neurons (see figure 6).
Node’s shape is usually hexagon but they can also be squares. Each node on the map has an
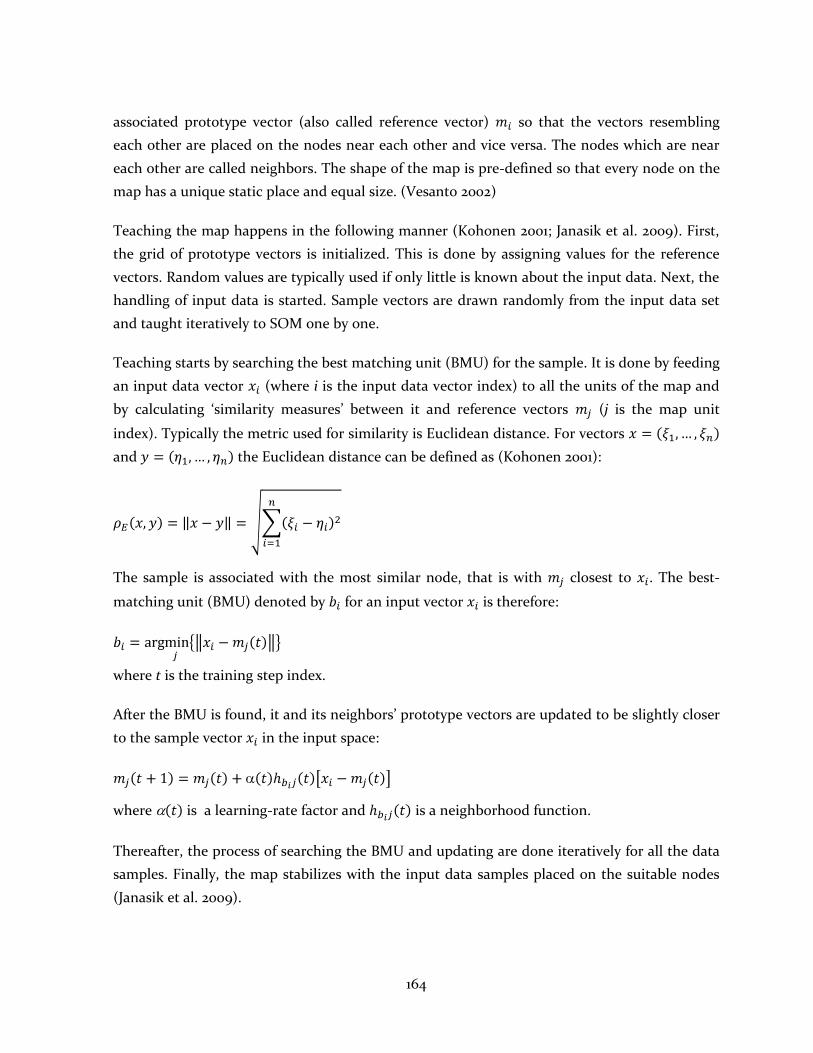
164
associated prototype vector (also called reference vector) so that the vectors resembling
each other are placed on the nodes near each other and vice versa. The nodes which are near
each other are called neighbors. The shape of the map is pre-defined so that every node on the
map has a unique static place and equal size. (Vesanto 2002)
Teaching the map happens in the following manner (Kohonen 2001; Janasik et al. 2009). First,
the grid of prototype vectors is initialized. This is done by assigning values for the reference
vectors. Random values are typically used if only little is known about the input data. Next, the
handling of input data is started. Sample vectors are drawn randomly from the input data set
and taught iteratively to SOM one by one.
Teaching starts by searching the best matching unit (BMU) for the sample. It is done by feeding
an input data vector (where i is the input data vector index) to all the units of the map and
by calculating ‘similarity measures’ between it and reference vectors (j is the map unit
index). Typically the metric used for similarity is Euclidean distance. For vectors
and the Euclidean distance can be defined as (Kohonen 2001):
The sample is associated with the most similar node, that is with closest to . The best-
matching unit (BMU) denoted by for an input vector is therefore:
where t is the training step index.
After the BMU is found, it and its neighbors’ prototype vectors are updated to be slightly closer
to the sample vector in the input space:
where is a learning-rate factor and is a neighborhood function.
Thereafter, the process of searching the BMU and updating are done iteratively for all the data
samples. Finally, the map stabilizes with the input data samples placed on the suitable nodes
(Janasik et al. 2009).
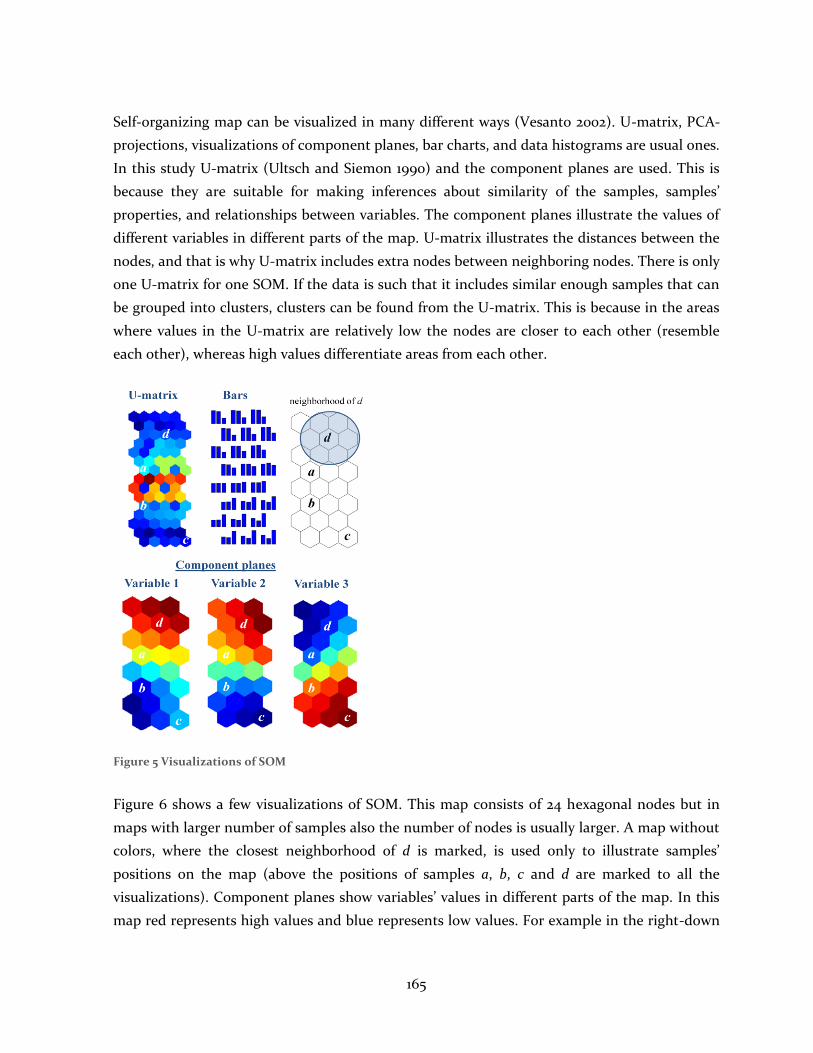
165
Self-organizing map can be visualized in many different ways (Vesanto 2002). U-matrix, PCA-
projections, visualizations of component planes, bar charts, and data histograms are usual ones.
In this study U-matrix (Ultsch and Siemon 1990) and the component planes are used. This is
because they are suitable for making inferences about similarity of the samples, samples’
properties, and relationships between variables. The component planes illustrate the values of
different variables in different parts of the map. U-matrix illustrates the distances between the
nodes, and that is why U-matrix includes extra nodes between neighboring nodes. There is only
one U-matrix for one SOM. If the data is such that it includes similar enough samples that can
be grouped into clusters, clusters can be found from the U-matrix. This is because in the areas
where values in the U-matrix are relatively low the nodes are closer to each other (resemble
each other), whereas high values differentiate areas from each other.
Figure 5 Visualizations of SOM
Figure 6 shows a few visualizations of SOM. This map consists of 24 hexagonal nodes but in
maps with larger number of samples also the number of nodes is usually larger. A map without
colors, where the closest neighborhood of d is marked, is used only to illustrate samples’
positions on the map (above the positions of samples a, b, c and d are marked to all the
visualizations). Component planes show variables’ values in different parts of the map. In this
map red represents high values and blue represents low values. For example in the right-down
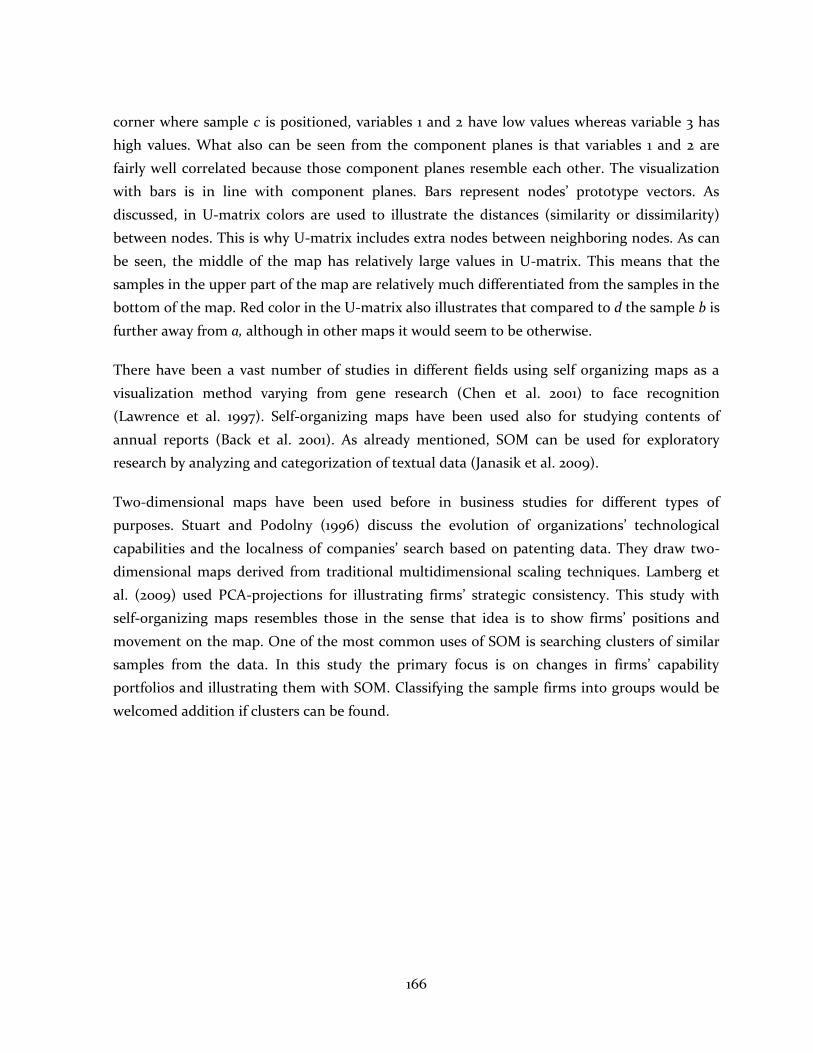
166
corner where sample c is positioned, variables 1 and 2 have low values whereas variable 3 has
high values. What also can be seen from the component planes is that variables 1 and 2 are
fairly well correlated because those component planes resemble each other. The visualization
with bars is in line with component planes. Bars represent nodes’ prototype vectors. As
discussed, in U-matrix colors are used to illustrate the distances (similarity or dissimilarity)
between nodes. This is why U-matrix includes extra nodes between neighboring nodes. As can
be seen, the middle of the map has relatively large values in U-matrix. This means that the
samples in the upper part of the map are relatively much differentiated from the samples in the
bottom of the map. Red color in the U-matrix also illustrates that compared to d the sample b is
further away from a, although in other maps it would seem to be otherwise.
There have been a vast number of studies in different fields using self organizing maps as a
visualization method varying from gene research (Chen et al. 2001) to face recognition
(Lawrence et al. 1997). Self-organizing maps have been used also for studying contents of
annual reports (Back et al. 2001). As already mentioned, SOM can be used for exploratory
research by analyzing and categorization of textual data (Janasik et al. 2009).
Two-dimensional maps have been used before in business studies for different types of
purposes. Stuart and Podolny (1996) discuss the evolution of organizations’ technological
capabilities and the localness of companies’ search based on patenting data. They draw two-
dimensional maps derived from traditional multidimensional scaling techniques. Lamberg et
al. (2009) used PCA-projections for illustrating firms’ strategic consistency. This study with
self-organizing maps resembles those in the sense that idea is to show firms’ positions and
movement on the map. One of the most common uses of SOM is searching clusters of similar
samples from the data. In this study the primary focus is on changes in firms’ capability
portfolios and illustrating them with SOM. Classifying the sample firms into groups would be
welcomed addition if clusters can be found.
167
6 DATA ANALYSIS
This chapter describes the whole process of how the analysis was done in practice from content
analysis to data preparation and creation of self-organizing maps. A thorough example is used
for elucidating the process. Figure 7 illustrates the process which Vesanto (2002) proposed for
data exploration process based on self-organizing map.
Figure 6 Applying the SOM in data mining (Vesanto 2002)
6.1 Content analysis process
The downloaded annual reports were first opened in Atlas.ti-software. The word cruncher
function of Atlas.ti was used for counting the word occurrences from annual reports. Word
cruncher’s stoplist was enabled in order to avoid miscalculations because some special
characters were counted as words without the stoplist. Atlas.ti exported the data into an Excel-
file.
After the word frequencies for all the words in annual reports were listed, they were
categorized to represent organizational routines (forming capabilities). Initially the number of
different words in annual reports was 35190. The words which occurred most were left out first.
These words included the most common words such as “the, that, it, of, etc”. Also those words
which occurred hundred times or less were left out (except country names, see below), which
means that the total number of occurrences for included words was more than the number of
annual reports. These steps were done because the most common and the least common terms
are typically not good candidates for terms (Janasik et al. 2009). Next, the rest 2016 words were
gone through manually. The words were categorized into groups according to what capabilities
they can represent. Because the capability literature was already familiarized, the groups were
similar to what had been found from the literature (see table 1). Those words were left out
168
which were meaningless regarding capabilities. These words included words such as ‘during’
and ‘January’. Eventually 359 keywords and their derivatives were used for describing
capabilities. For example efficien* includes derivatives efficiency, efficient, efficiently, and so on
(asterix indicates that word includes sequence of letters in front of it and the asterix can be
replaced with any letters). The frequency for every capability was counted as a sum of the
occurrences of its keywords.
All country names were included as keywords for internationalization capability although some
of them appeared less than 100 times. Occurrences for country names were counted from the
initial list of words (with 35190 words) using excel’s countif-function. The list of world countries
for the countif-function was downloaded from Gapminder’s website
(http://www.gapminder.org/wp-content/uploads/2008/11/formal-list-of-areas-0807011.xls).
6.2 Preparing the data and building self-organizing maps
The process of using self-organizing maps for text mining followed the way which has been
proposed by Janasik et al. (2009). Authors divide the process into six steps:
1. Select a document collection.
2. Automatically or manually choose the terminology to be used in encoding the
documents.
3. Transform, based on the terminology, the documents into numerical data.
4. Initiate the SOM iterations with varying parameters.
5. Study and interpret the resulting document maps and term distributions on the
maps.
6. Formulate the inferences that can be drawn from the maps.
Results and inferences are discussed later in this study, and the first steps were already taken in
the content analysis phase. These were choosing the document collection, namely annual
reports, and choosing the terminology to be used, which was done by choosing the words from
the list Atlas.ti produced (categorization of words). In that same list the terminology was
already in a numerical form, but this step differed slightly, since it was groups of words
representing capabilities rather than individual words that were used as dimensions for
initiating SOM. Therefore this phase also included summing the words in the groups.
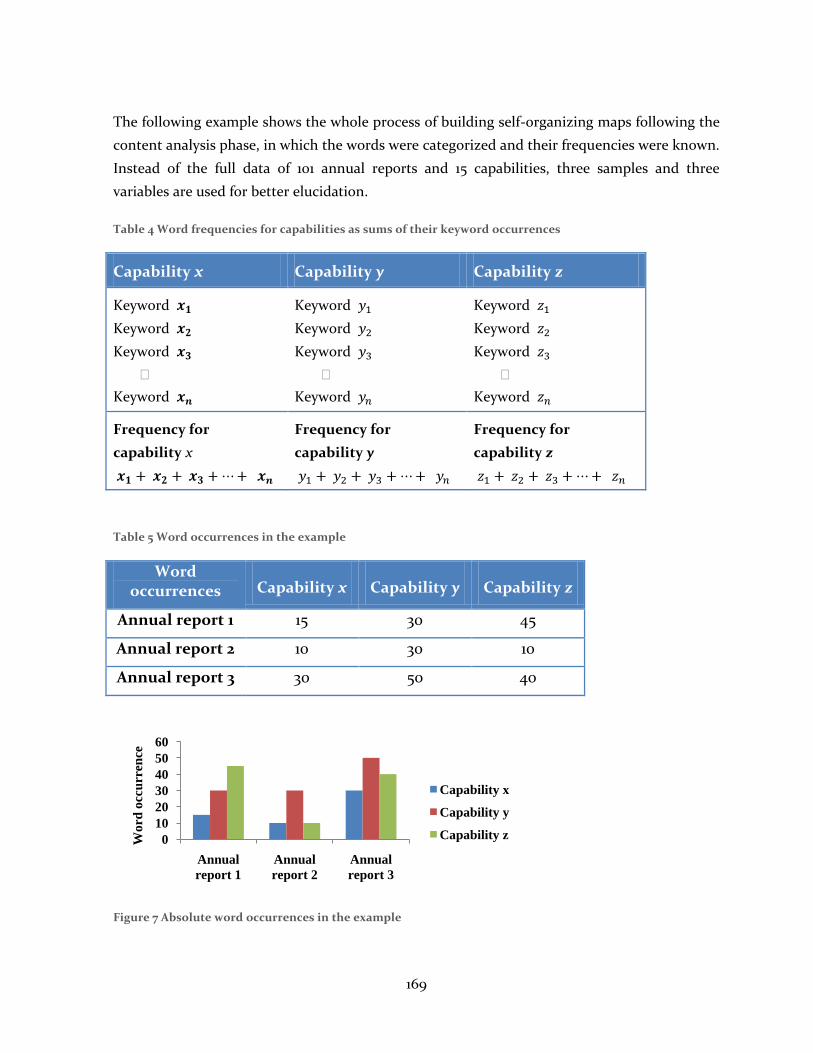
169
The following example shows the whole process of building self-organizing maps following the
content analysis phase, in which the words were categorized and their frequencies were known.
Instead of the full data of 101 annual reports and 15 capabilities, three samples and three
variables are used for better elucidation.
Table 4 Word frequencies for capabilities as sums of their keyword occurrences
Capability x Capability y Capability z
Keyword
Keyword
Keyword
⁞
Keyword
Keyword
Keyword
Keyword
⁞
Keyword
Keyword
Keyword
Keyword
⁞
Keyword
Frequency for
capability x
Frequency for
capability y
Frequency for
capability z
Table 5 Word occurrences in the example
Word occurrences Capability x Capability y Capability z
Annual report 1 15 30 45
Annual report 2 10 30 10
Annual report 3 30 50 40
Figure 7 Absolute word occurrences in the example
0
10
20
30
40
50
60
Annual
report 1
Annual
report 2
Annual
report 3
Wo
rd o
ccu
rren
ce
Capability x
Capability y
Capability z
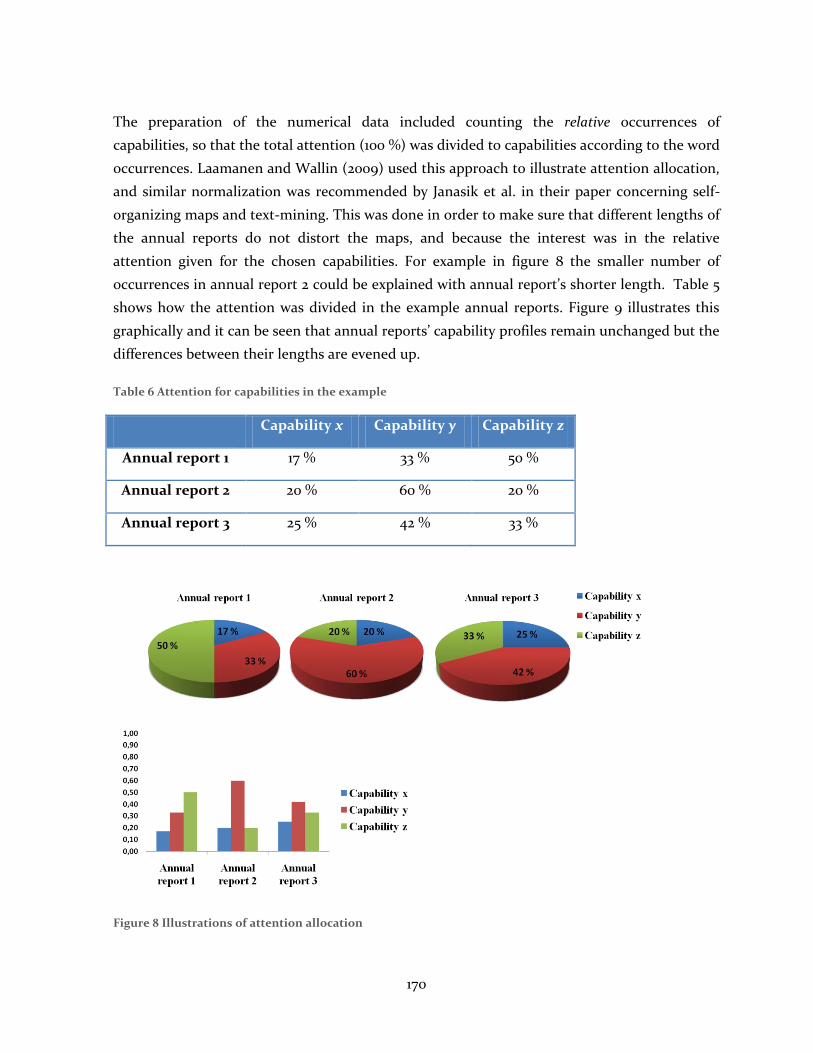
170
The preparation of the numerical data included counting the relative occurrences of
capabilities, so that the total attention (100 %) was divided to capabilities according to the word
occurrences. Laamanen and Wallin (2009) used this approach to illustrate attention allocation,
and similar normalization was recommended by Janasik et al. in their paper concerning self-
organizing maps and text-mining. This was done in order to make sure that different lengths of
the annual reports do not distort the maps, and because the interest was in the relative
attention given for the chosen capabilities. For example in figure 8 the smaller number of
occurrences in annual report 2 could be explained with annual report’s shorter length. Table 5
shows how the attention was divided in the example annual reports. Figure 9 illustrates this
graphically and it can be seen that annual reports’ capability profiles remain unchanged but the
differences between their lengths are evened up.
Table 6 Attention for capabilities in the example
Capability x Capability y Capability z
Annual report 1 17 % 33 % 50 %
Annual report 2 20 % 60 % 20 %
Annual report 3 25 % 42 % 33 %
Figure 8 Illustrations of attention allocation
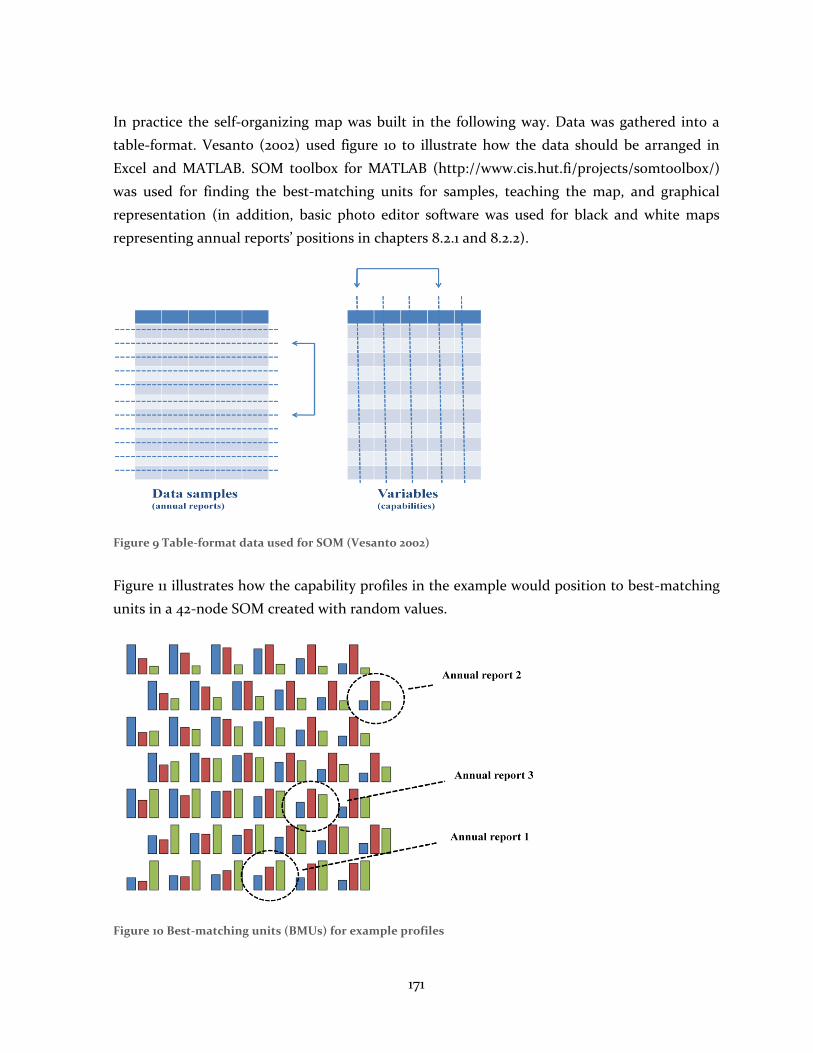
171
In practice the self-organizing map was built in the following way. Data was gathered into a
table-format. Vesanto (2002) used figure 10 to illustrate how the data should be arranged in
Excel and MATLAB. SOM toolbox for MATLAB (http://www.cis.hut.fi/projects/somtoolbox/)
was used for finding the best-matching units for samples, teaching the map, and graphical
representation (in addition, basic photo editor software was used for black and white maps
representing annual reports’ positions in chapters 8.2.1 and 8.2.2).
Figure 9 Table-format data used for SOM (Vesanto 2002)
Figure 11 illustrates how the capability profiles in the example would position to best-matching
units in a 42-node SOM created with random values.
Figure 10 Best-matching units (BMUs) for example profiles
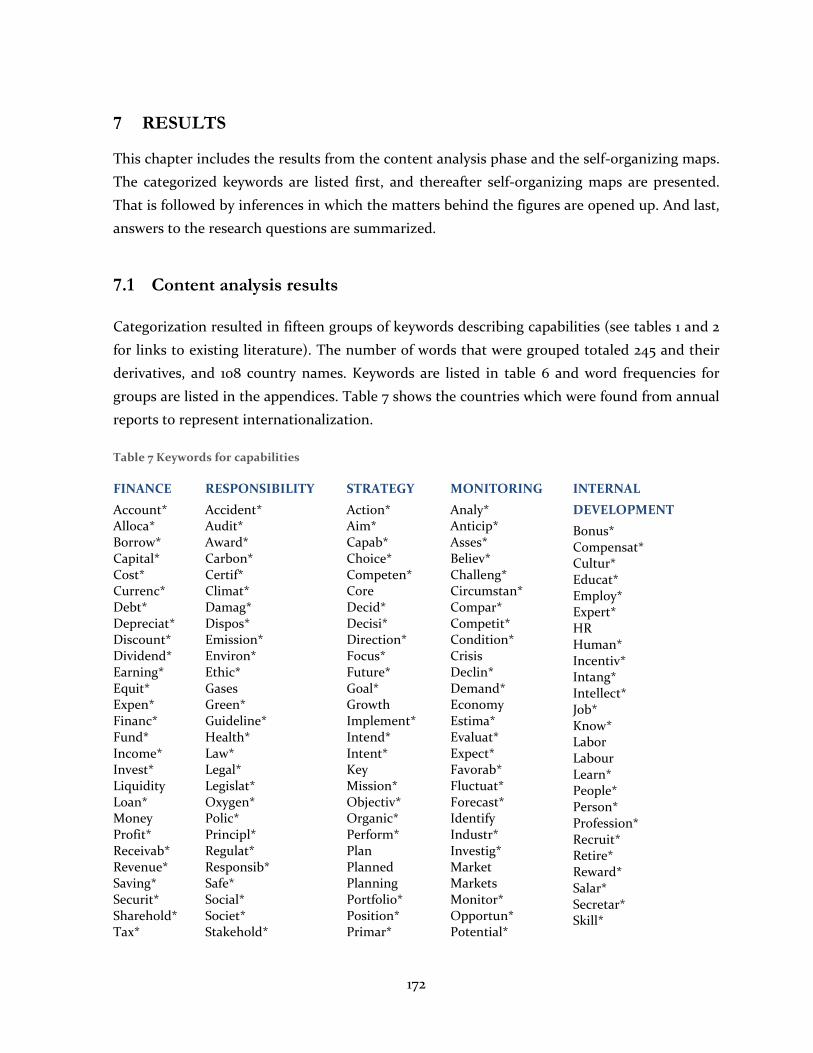
172
7 RESULTS
This chapter includes the results from the content analysis phase and the self-organizing maps.
The categorized keywords are listed first, and thereafter self-organizing maps are presented.
That is followed by inferences in which the matters behind the figures are opened up. And last,
answers to the research questions are summarized.
7.1 Content analysis results
Categorization resulted in fifteen groups of keywords describing capabilities (see tables 1 and 2
for links to existing literature). The number of words that were grouped totaled 245 and their
derivatives, and 108 country names. Keywords are listed in table 6 and word frequencies for
groups are listed in the appendices. Table 7 shows the countries which were found from annual
reports to represent internationalization.
Table 7 Keywords for capabilities
FINANCE
Account* Alloca* Borrow* Capital* Cost* Currenc* Debt* Depreciat* Discount* Dividend* Earning* Equit* Expen* Financ* Fund* Income* Invest* Liquidity Loan* Money Profit* Receivab* Revenue* Saving* Securit* Sharehold* Tax*
RESPONSIBILITY
Accident* Audit* Award* Carbon* Certif* Climat* Damag* Dispos* Emission* Environ* Ethic* Gases Green* Guideline* Health* Law* Legal* Legislat* Oxygen* Polic* Principl* Regulat* Responsib* Safe* Social* Societ* Stakehold*
STRATEGY
Action* Aim* Capab* Choice* Competen* Core Decid* Decisi* Direction* Focus* Future* Goal* Growth Implement* Intend* Intent* Key Mission* Objectiv* Organic* Perform* Plan Planned Planning Portfolio* Position* Primar*
MONITORING
Analy* Anticip* Asses* Believ* Challeng* Circumstan* Compar* Competit* Condition* Crisis Declin* Demand* Economy Estima* Evaluat* Expect* Favorab* Fluctuat* Forecast* Identify Industr* Investig* Market Markets Monitor* Opportun* Potential*
INTERNAL
DEVELOPMENT
Bonus* Compensat* Cultur* Educat* Employ* Expert* HR Human* Incentiv* Intang* Intellect* Job* Know* Labor Labour Learn* People* Person* Profession* Recruit* Retire* Reward* Salar* Secretar* Skill*
173
Turnover* Unallocated
Sustainab* Transparen* Waste*
Priorit* Risk* Seek* Strateg* Strength* Target* Vision*
Projected Recogni* Sector* Situation* Studies Study Trend* Uncertain* Volatil*
Specialist* Staff* Task* Team* Train* Wage* Worker* Workplace* Workforce*
MANAGE-
MENT
CEO Executive* Leadership Manag* MBA Senior
EXTERNAL
SOURCING
Acqui* Agreemen* Associate Associates Collabo* Contract* Coopera* Counterpart* Joint* Lease* Merg* Negotiat* Outsourc* Partner* Relation* Universit* Ventur*
MARKETING & SALES
Advertis* Brand* Consumer* Customer* Marketing* Sale* Sell* Sold Product Products
PROCUREMENT & LOGISTICS
Chain* Deliver* Distrib* Inventor* Location* Logistic* Procur* Purcha* Sourcing Transport* Shipp*
STRUCTURING
Department* Divest* Division* Integrat* Parent* Restruct* Struct* Subsid* Synerg* Unit Units
INTERNA-TIONALIZATION
Country names Geograph* Countr* Internatio* Global* World*
OPERATIONS
Effective* Efficien* Maintenance Manufactur* Optimi* Produce* Producti* Quality Utilis* Utiliz*
SERVICES
Servic*
CHANGE
Adjust* Chang* Flexib* Prevent* Proactiv* Renewal* Renewed Respond*
INNOVATIVENESS
Innovat* Patent* R&D Research*
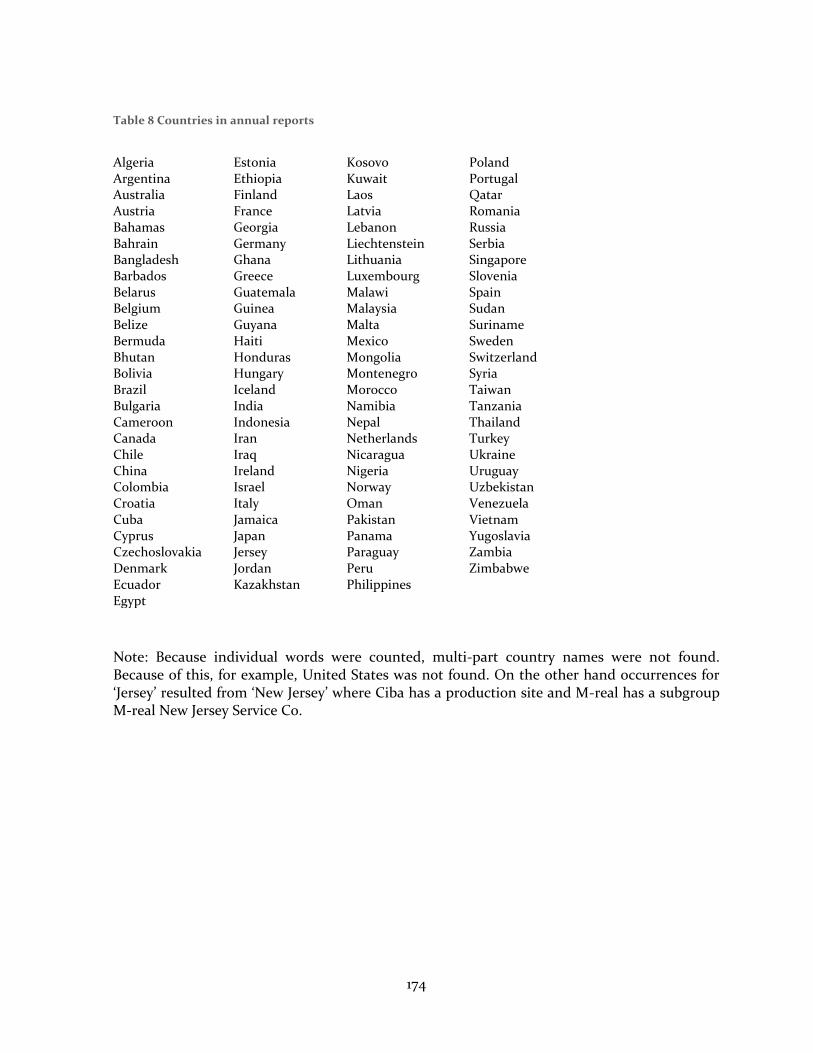
174
Table 8 Countries in annual reports
Algeria Argentina Australia Austria Bahamas Bahrain Bangladesh Barbados Belarus Belgium Belize Bermuda Bhutan Bolivia Brazil Bulgaria Cameroon Canada Chile China Colombia Croatia Cuba Cyprus Czechoslovakia Denmark Ecuador Egypt
Estonia Ethiopia Finland France Georgia Germany Ghana Greece Guatemala Guinea Guyana Haiti Honduras Hungary Iceland India Indonesia Iran Iraq Ireland Israel Italy Jamaica Japan Jersey Jordan Kazakhstan
Kosovo Kuwait Laos Latvia Lebanon Liechtenstein Lithuania Luxembourg Malawi Malaysia Malta Mexico Mongolia Montenegro Morocco Namibia Nepal Netherlands Nicaragua Nigeria Norway Oman Pakistan Panama Paraguay Peru Philippines
Poland Portugal Qatar Romania Russia Serbia Singapore Slovenia Spain Sudan Suriname Sweden Switzerland Syria Taiwan Tanzania Thailand Turkey Ukraine Uruguay Uzbekistan Venezuela Vietnam Yugoslavia Zambia Zimbabwe
Note: Because individual words were counted, multi-part country names were not found. Because of this, for example, United States was not found. On the other hand occurrences for ‘Jersey’ resulted from ‘New Jersey’ where Ciba has a production site and M-real has a subgroup M-real New Jersey Service Co.
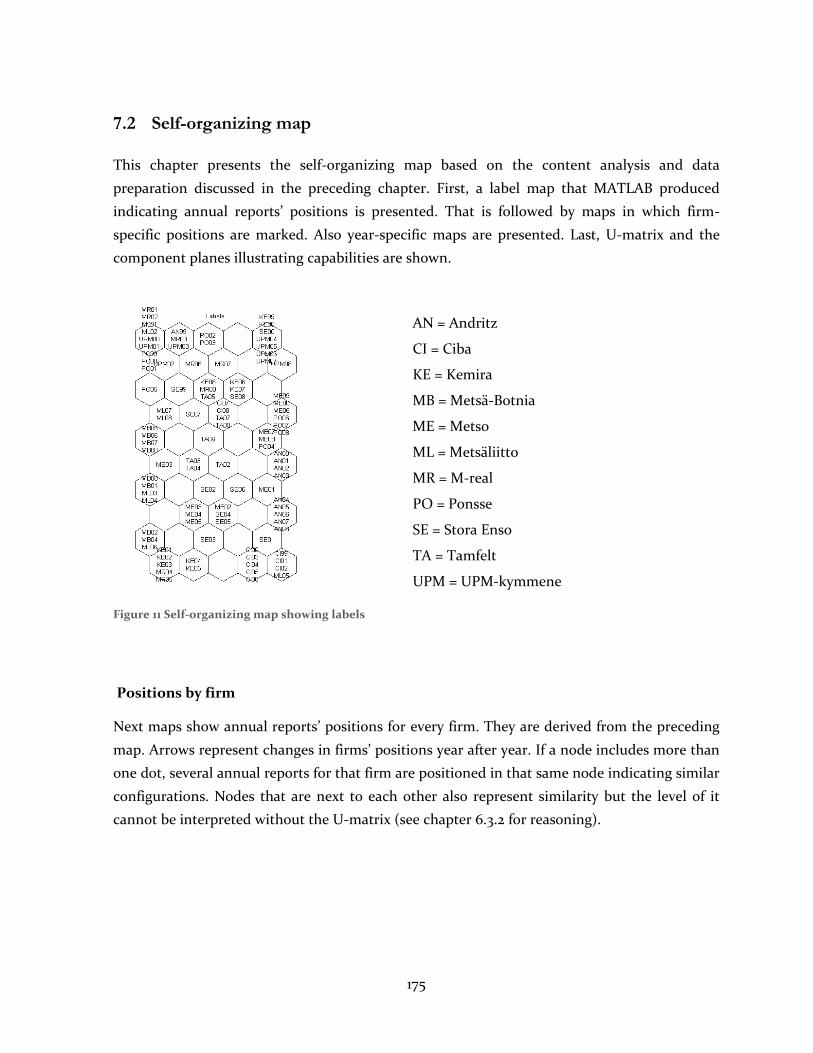
175
7.2 Self-organizing map
This chapter presents the self-organizing map based on the content analysis and data
preparation discussed in the preceding chapter. First, a label map that MATLAB produced
indicating annual reports’ positions is presented. That is followed by maps in which firm-
specific positions are marked. Also year-specific maps are presented. Last, U-matrix and the
component planes illustrating capabilities are shown.
Figure 11 Self-organizing map showing labels
AN = Andritz
CI = Ciba
KE = Kemira
MB = Metsä-Botnia
ME = Metso
ML = Metsäliitto
MR = M-real
PO = Ponsse
SE = Stora Enso
TA = Tamfelt
UPM = UPM-kymmene
Positions by firm
Next maps show annual reports’ positions for every firm. They are derived from the preceding
map. Arrows represent changes in firms’ positions year after year. If a node includes more than
one dot, several annual reports for that firm are positioned in that same node indicating similar
configurations. Nodes that are next to each other also represent similarity but the level of it
cannot be interpreted without the U-matrix (see chapter 6.3.2 for reasoning).
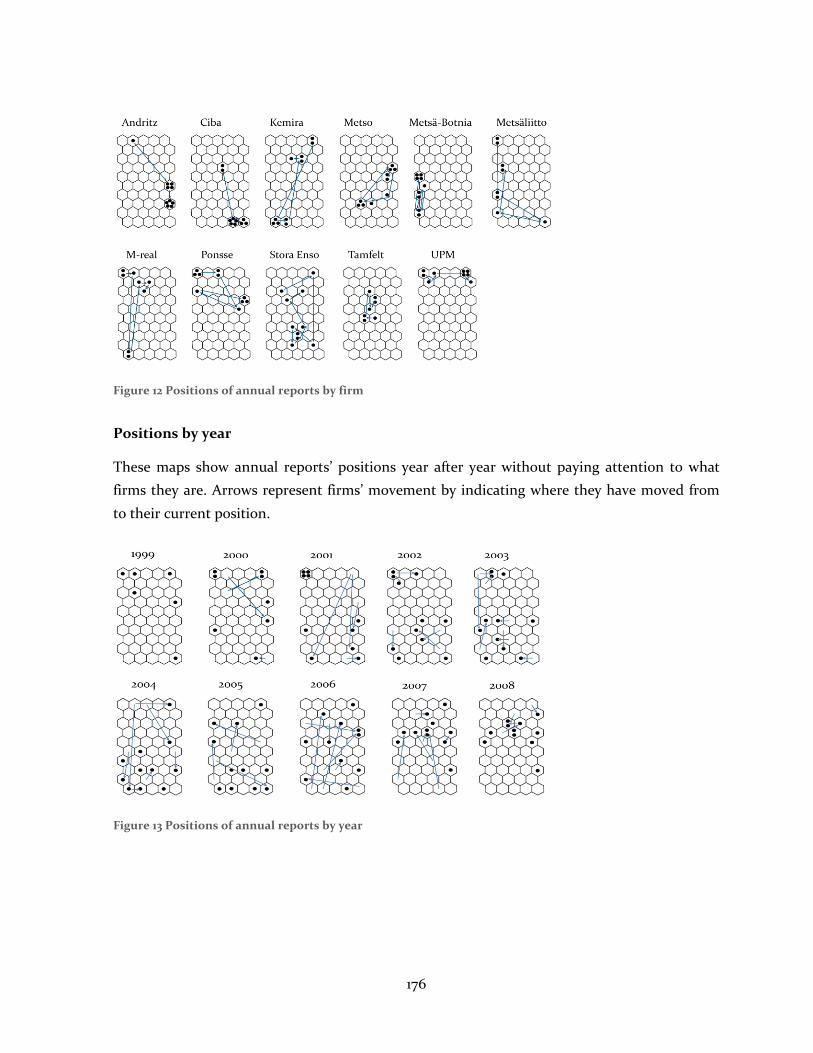
176
Figure 12 Positions of annual reports by firm
Positions by year
These maps show annual reports’ positions year after year without paying attention to what
firms they are. Arrows represent firms’ movement by indicating where they have moved from
to their current position.
Figure 13 Positions of annual reports by year
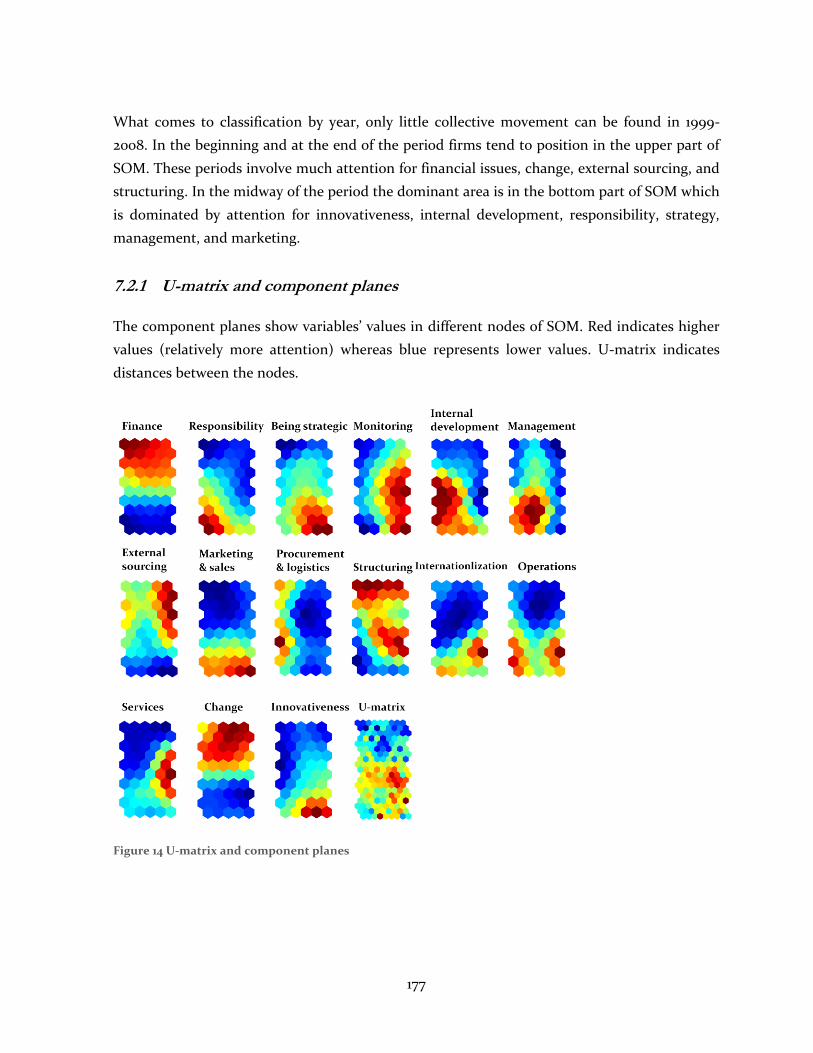
177
What comes to classification by year, only little collective movement can be found in 1999-
2008. In the beginning and at the end of the period firms tend to position in the upper part of
SOM. These periods involve much attention for financial issues, change, external sourcing, and
structuring. In the midway of the period the dominant area is in the bottom part of SOM which
is dominated by attention for innovativeness, internal development, responsibility, strategy,
management, and marketing.
7.2.1 U-matrix and component planes
The component planes show variables’ values in different nodes of SOM. Red indicates higher
values (relatively more attention) whereas blue represents lower values. U-matrix indicates
distances between the nodes.
Figure 14 U-matrix and component planes
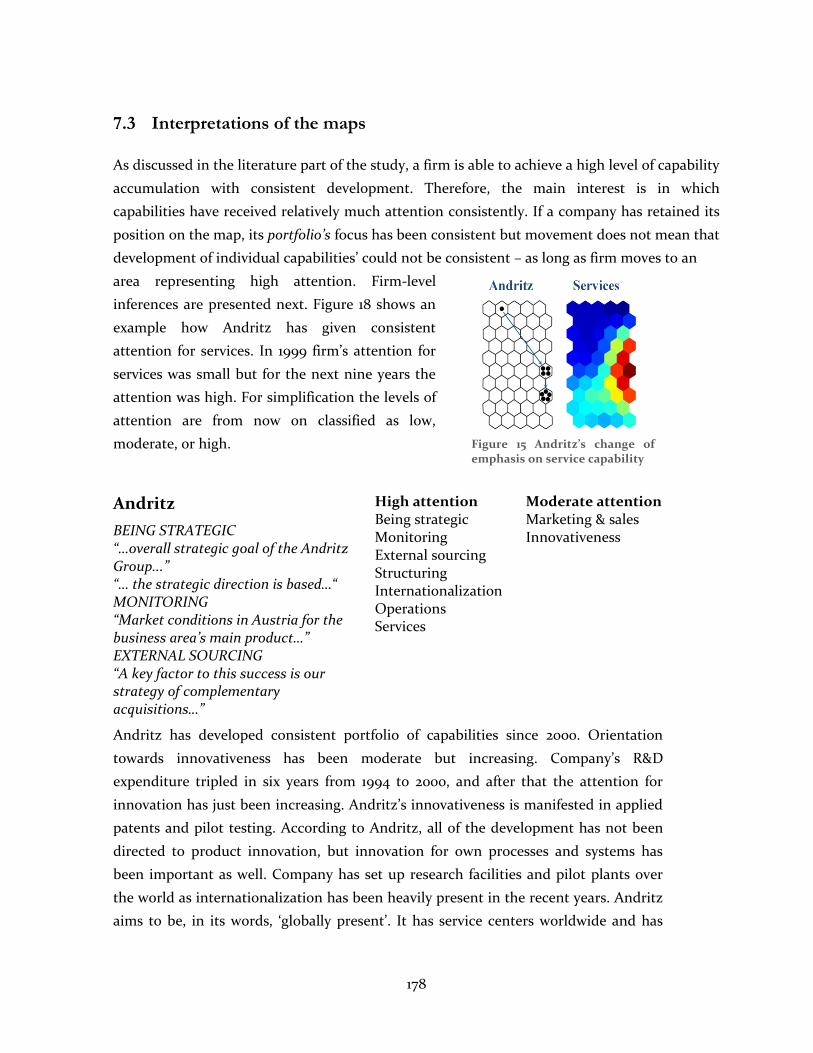
178
7.3 Interpretations of the maps
As discussed in the literature part of the study, a firm is able to achieve a high level of capability
accumulation with consistent development. Therefore, the main interest is in which
capabilities have received relatively much attention consistently. If a company has retained its
position on the map, its portfolio’s focus has been consistent but movement does not mean that
development of individual capabilities’ could not be consistent – as long as firm moves to an
area representing high attention. Firm-level
inferences are presented next. Figure 18 shows an
example how Andritz has given consistent
attention for services. In 1999 firm’s attention for
services was small but for the next nine years the
attention was high. For simplification the levels of
attention are from now on classified as low,
moderate, or high.
Figure 15 Andritz’s change of emphasis on service capability
Andritz
BEING STRATEGIC “…overall strategic goal of the Andritz Group...” “… the strategic direction is based…“ MONITORING “Market conditions in Austria for the business area’s main product…” EXTERNAL SOURCING “A key factor to this success is our strategy of complementary acquisitions…”
High attention Being strategic Monitoring External sourcing Structuring Internationalization Operations Services
Moderate attention Marketing & sales Innovativeness
Andritz has developed consistent portfolio of capabilities since 2000. Orientation
towards innovativeness has been moderate but increasing. Company’s R&D
expenditure tripled in six years from 1994 to 2000, and after that the attention for
innovation has just been increasing. Andritz’s innovativeness is manifested in applied
patents and pilot testing. According to Andritz, all of the development has not been
directed to product innovation, but innovation for own processes and systems has
been important as well. Company has set up research facilities and pilot plants over
the world as internationalization has been heavily present in the recent years. Andritz
aims to be, in its words, ‘globally present’. It has service centers worldwide and has
179
sought for foothold especially in the world’s growth areas. All of Andritz’s business
areas have consistently expanded their aftermarket services which are now an
essential part of the company’s business. For example, in 2000 one fourth of total sales
were services and most of the growth came from them. What comes to structuring,
year 1999 saw changes in group's structure following the change of ownership as
Andritz AG was integrated into its affiliate Andritz Internationale Technologie AG.
And later, acquisition of Ahlström involved restructuring as target company’s
structure was aligned with the acquirer. Andritz declares to actively restructure and
evaluate the productivity of its facilities. Operations development has received
attention also as Andritz emphasizes its quality management system in which Andritz
has allocated resources increasingly in order to cope with company’s growth.
Ciba
BEING STRATEGIC “…effectively links our core competencies with the consumer market…” MARKETING & SALES “…to address the needs of our customers...” INNOVATIVENESS “A new approach to innovation will be driven by targeted resource allocation…” RESPONSIBILITY “…products that help to mitigate the effects of climate change…”
High attention Responsibility Being strategic Monitoring Marketing & sales Innovativeness
Moderate attention Internal development Internationalization Operations Services
Company distinguishes itself from other sample companies with its notably strong
attention towards customers. Over the years Ciba has sought to be more and more
customer-oriented organization. Another thing gathering attention is Ciba's thrive for
product innovation. As a chemicals company Ciba pays particular attention also to
environmental responsibility. This has manifested in e.g. participation in non-profit
organization Carbon Disclosure Project.
180
Kemira
MARKETING & SALES “We adapt to our customers’ changing needs…” INTERNAL DEVELOPMENT “…give our people a greater say in how things are done at our company…” MANAGEMENT “The management development program PEAK addresses strategy…”
Moderate attention Responsibility Finance Being strategic Monitoring Internal development Management
External sourcing Structuring Marketing & sales Internationalization Operations Change Innovativeness
Kemira has had a sort of two modes in its capability development. Inconsistency has
resulted in only moderate attention. Other mode is dominated by structuring, finance
and change whereas other is focused more on internal development, responsibility,
and marketing. In 1999 company announced structural changes as the group
sharpened the focus of its business mix. Similarly, ten years later Kemira announced
structural changes when it decided to focus on water and fiber management
chemistry. In the mid-period Kemira’s attention shifted. Responsible business turned
from necessity into a way to stand out from competition. This was called
‘responsibility-driven growth’. Internal development was also in the focus. For
example, Kemira established a program called ‘Kemira from good to great’ to develop
corporate culture and to promote participation.
M-real
FINANCE “…closures of production capacity, a new cost savings programme, a working capital reduction programme and divestments of assets…” STRUCTURING “We will specify the other divestment targets later…” EXTERNAL SOURCING “M-real is participating in a number of cooperation projects.”
High attention Finance Change External sourcing Structuring
Moderate attention Responsibility Internal development Management Procurement & logistics Internationalization Operations
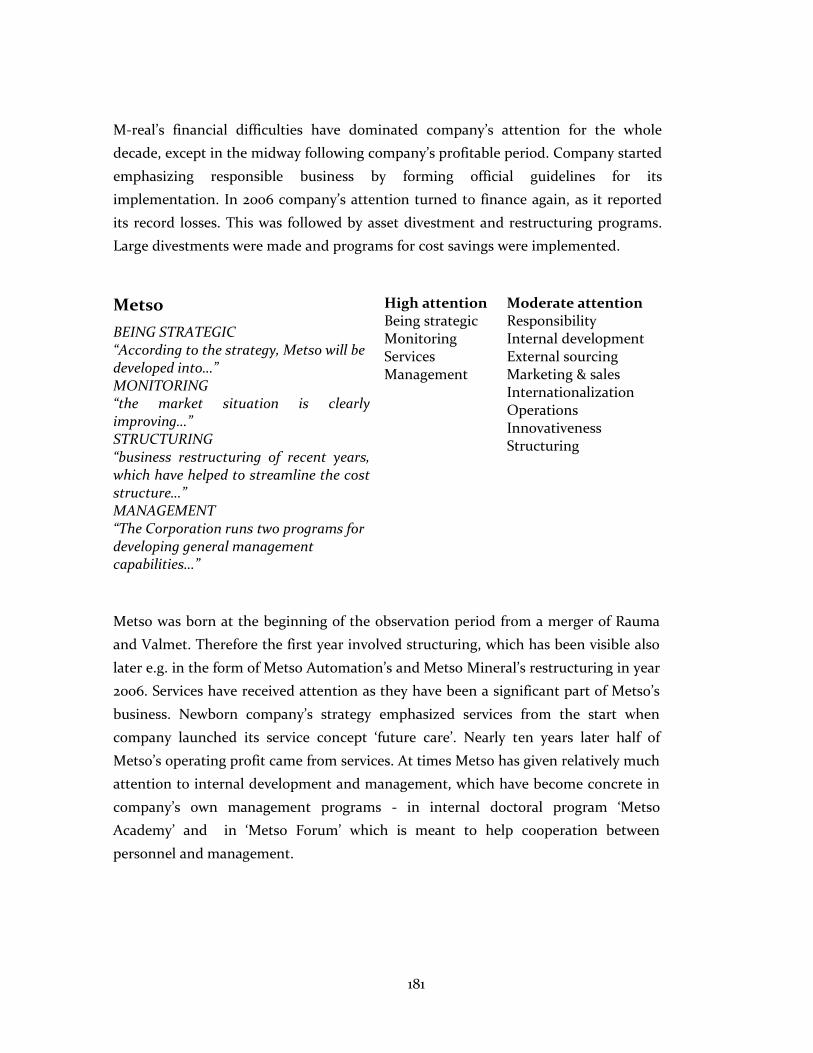
181
M-real’s financial difficulties have dominated company’s attention for the whole
decade, except in the midway following company’s profitable period. Company started
emphasizing responsible business by forming official guidelines for its
implementation. In 2006 company’s attention turned to finance again, as it reported
its record losses. This was followed by asset divestment and restructuring programs.
Large divestments were made and programs for cost savings were implemented.
Metso
BEING STRATEGIC “According to the strategy, Metso will be developed into…” MONITORING “the market situation is clearly improving…” STRUCTURING “business restructuring of recent years, which have helped to streamline the cost structure…” MANAGEMENT “The Corporation runs two programs for developing general management capabilities…”
High attention Being strategic Monitoring Services Management
Moderate attention Responsibility Internal development External sourcing Marketing & sales Internationalization Operations Innovativeness Structuring
Metso was born at the beginning of the observation period from a merger of Rauma
and Valmet. Therefore the first year involved structuring, which has been visible also
later e.g. in the form of Metso Automation’s and Metso Mineral’s restructuring in year
2006. Services have received attention as they have been a significant part of Metso’s
business. Newborn company’s strategy emphasized services from the start when
company launched its service concept ‘future care’. Nearly ten years later half of
Metso’s operating profit came from services. At times Metso has given relatively much
attention to internal development and management, which have become concrete in
company’s own management programs - in internal doctoral program ‘Metso
Academy’ and in ‘Metso Forum’ which is meant to help cooperation between
personnel and management.
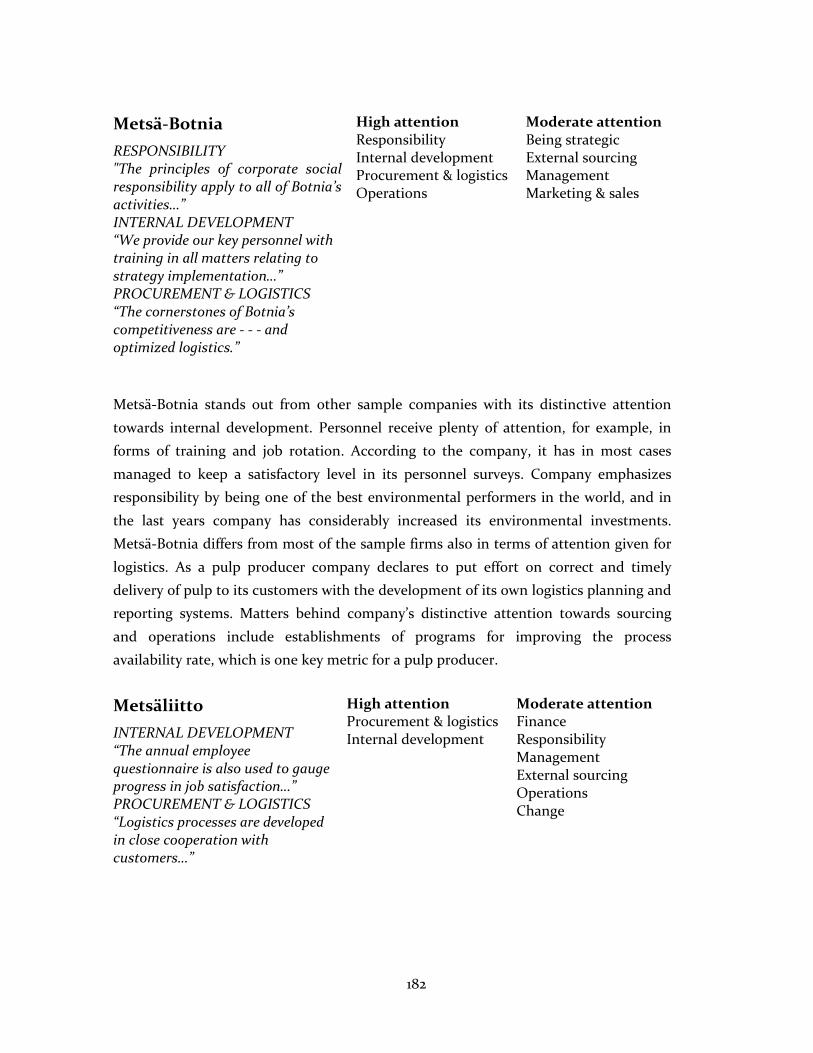
182
Metsä-Botnia
RESPONSIBILITY "The principles of corporate social responsibility apply to all of Botnia’s activities…” INTERNAL DEVELOPMENT “We provide our key personnel with training in all matters relating to strategy implementation…” PROCUREMENT & LOGISTICS “The cornerstones of Botnia’s competitiveness are - - - and optimized logistics.”
High attention Responsibility Internal development Procurement & logistics Operations
Moderate attention Being strategic External sourcing Management Marketing & sales
Metsä-Botnia stands out from other sample companies with its distinctive attention
towards internal development. Personnel receive plenty of attention, for example, in
forms of training and job rotation. According to the company, it has in most cases
managed to keep a satisfactory level in its personnel surveys. Company emphasizes
responsibility by being one of the best environmental performers in the world, and in
the last years company has considerably increased its environmental investments.
Metsä-Botnia differs from most of the sample firms also in terms of attention given for
logistics. As a pulp producer company declares to put effort on correct and timely
delivery of pulp to its customers with the development of its own logistics planning and
reporting systems. Matters behind company’s distinctive attention towards sourcing
and operations include establishments of programs for improving the process
availability rate, which is one key metric for a pulp producer.
Metsäliitto
INTERNAL DEVELOPMENT “The annual employee questionnaire is also used to gauge progress in job satisfaction…” PROCUREMENT & LOGISTICS “Logistics processes are developed in close cooperation with customers…”
High attention Procurement & logistics Internal development
Moderate attention Finance Responsibility Management External sourcing Operations Change
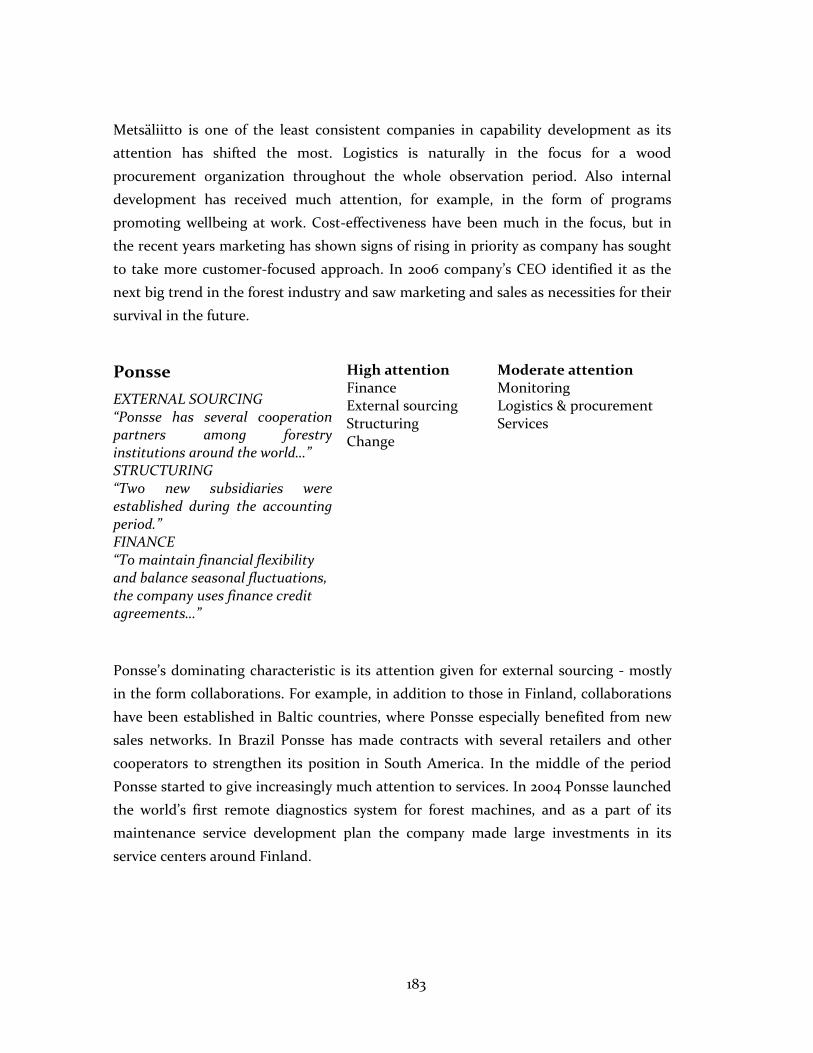
183
Metsäliitto is one of the least consistent companies in capability development as its
attention has shifted the most. Logistics is naturally in the focus for a wood
procurement organization throughout the whole observation period. Also internal
development has received much attention, for example, in the form of programs
promoting wellbeing at work. Cost-effectiveness have been much in the focus, but in
the recent years marketing has shown signs of rising in priority as company has sought
to take more customer-focused approach. In 2006 company’s CEO identified it as the
next big trend in the forest industry and saw marketing and sales as necessities for their
survival in the future.
Ponsse
EXTERNAL SOURCING “Ponsse has several cooperation partners among forestry institutions around the world…” STRUCTURING “Two new subsidiaries were established during the accounting period.” FINANCE “To maintain financial flexibility and balance seasonal fluctuations, the company uses finance credit agreements…”
High attention Finance External sourcing Structuring Change
Moderate attention Monitoring Logistics & procurement Services
Ponsse’s dominating characteristic is its attention given for external sourcing - mostly
in the form collaborations. For example, in addition to those in Finland, collaborations
have been established in Baltic countries, where Ponsse especially benefited from new
sales networks. In Brazil Ponsse has made contracts with several retailers and other
cooperators to strengthen its position in South America. In the middle of the period
Ponsse started to give increasingly much attention to services. In 2004 Ponsse launched
the world’s first remote diagnostics system for forest machines, and as a part of its
maintenance service development plan the company made large investments in its
service centers around Finland.
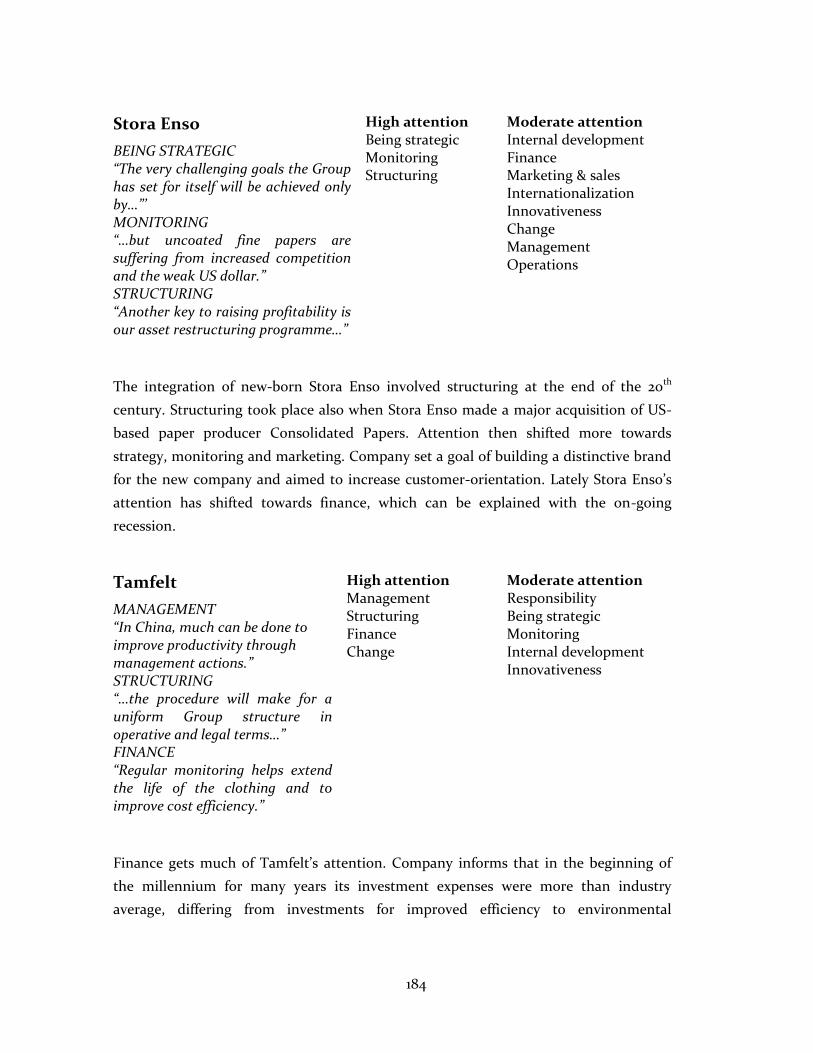
184
Stora Enso
BEING STRATEGIC “The very challenging goals the Group has set for itself will be achieved only by…”’ MONITORING “…but uncoated fine papers are suffering from increased competition and the weak US dollar.” STRUCTURING “Another key to raising profitability is our asset restructuring programme…”
High attention Being strategic Monitoring Structuring
Moderate attention Internal development Finance Marketing & sales Internationalization Innovativeness Change Management Operations
The integration of new-born Stora Enso involved structuring at the end of the 20th
century. Structuring took place also when Stora Enso made a major acquisition of US-
based paper producer Consolidated Papers. Attention then shifted more towards
strategy, monitoring and marketing. Company set a goal of building a distinctive brand
for the new company and aimed to increase customer-orientation. Lately Stora Enso’s
attention has shifted towards finance, which can be explained with the on-going
recession.
Tamfelt
MANAGEMENT “In China, much can be done to improve productivity through management actions.” STRUCTURING “…the procedure will make for a uniform Group structure in operative and legal terms…” FINANCE “Regular monitoring helps extend the life of the clothing and to improve cost efficiency.”
High attention Management Structuring Finance Change
Moderate attention Responsibility Being strategic Monitoring Internal development Innovativeness
Finance gets much of Tamfelt’s attention. Company informs that in the beginning of
the millennium for many years its investment expenses were more than industry
average, differing from investments for improved efficiency to environmental
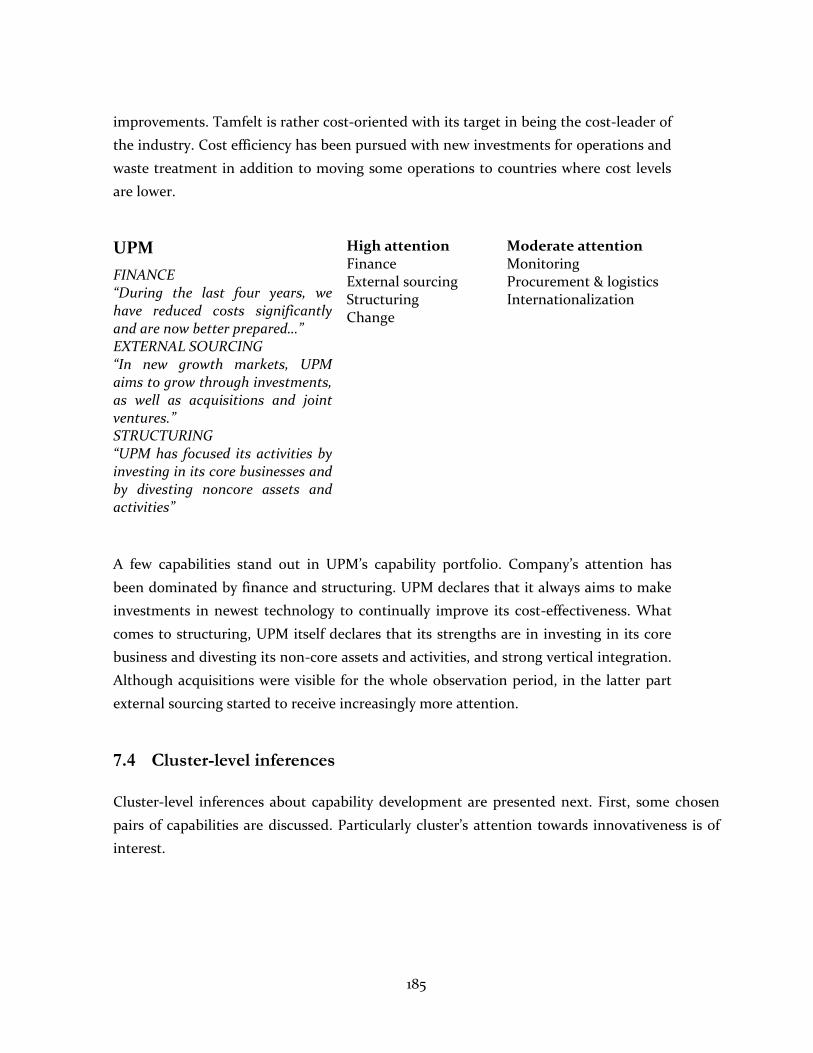
185
improvements. Tamfelt is rather cost-oriented with its target in being the cost-leader of
the industry. Cost efficiency has been pursued with new investments for operations and
waste treatment in addition to moving some operations to countries where cost levels
are lower.
UPM
FINANCE “During the last four years, we have reduced costs significantly and are now better prepared…” EXTERNAL SOURCING “In new growth markets, UPM aims to grow through investments, as well as acquisitions and joint ventures.” STRUCTURING “UPM has focused its activities by investing in its core businesses and by divesting noncore assets and activities”
High attention Finance External sourcing Structuring Change
Moderate attention Monitoring Procurement & logistics Internationalization
A few capabilities stand out in UPM’s capability portfolio. Company’s attention has
been dominated by finance and structuring. UPM declares that it always aims to make
investments in newest technology to continually improve its cost-effectiveness. What
comes to structuring, UPM itself declares that its strengths are in investing in its core
business and divesting its non-core assets and activities, and strong vertical integration.
Although acquisitions were visible for the whole observation period, in the latter part
external sourcing started to receive increasingly more attention.
7.4 Cluster-level inferences
Cluster-level inferences about capability development are presented next. First, some chosen
pairs of capabilities are discussed. Particularly cluster’s attention towards innovativeness is of
interest.
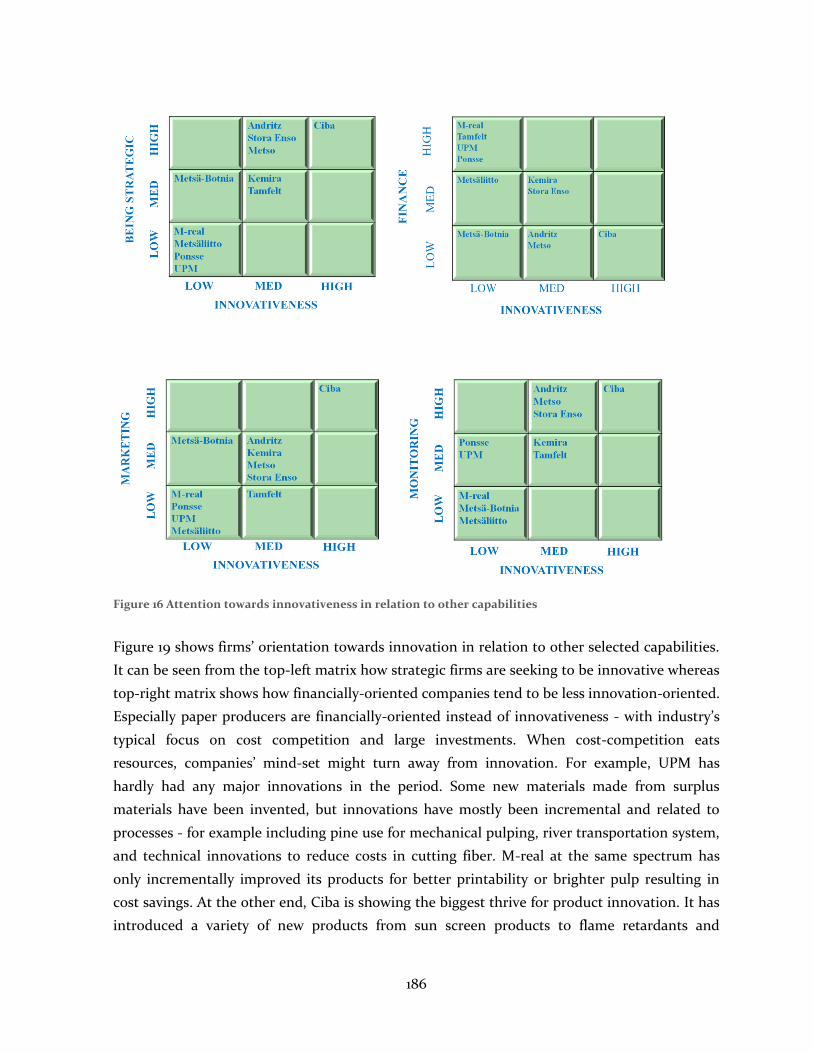
186
Figure 16 Attention towards innovativeness in relation to other capabilities
Figure 19 shows firms’ orientation towards innovation in relation to other selected capabilities.
It can be seen from the top-left matrix how strategic firms are seeking to be innovative whereas
top-right matrix shows how financially-oriented companies tend to be less innovation-oriented.
Especially paper producers are financially-oriented instead of innovativeness - with industry’s
typical focus on cost competition and large investments. When cost-competition eats
resources, companies’ mind-set might turn away from innovation. For example, UPM has
hardly had any major innovations in the period. Some new materials made from surplus
materials have been invented, but innovations have mostly been incremental and related to
processes - for example including pine use for mechanical pulping, river transportation system,
and technical innovations to reduce costs in cutting fiber. M-real at the same spectrum has
only incrementally improved its products for better printability or brighter pulp resulting in
cost savings. At the other end, Ciba is showing the biggest thrive for product innovation. It has
introduced a variety of new products from sun screen products to flame retardants and
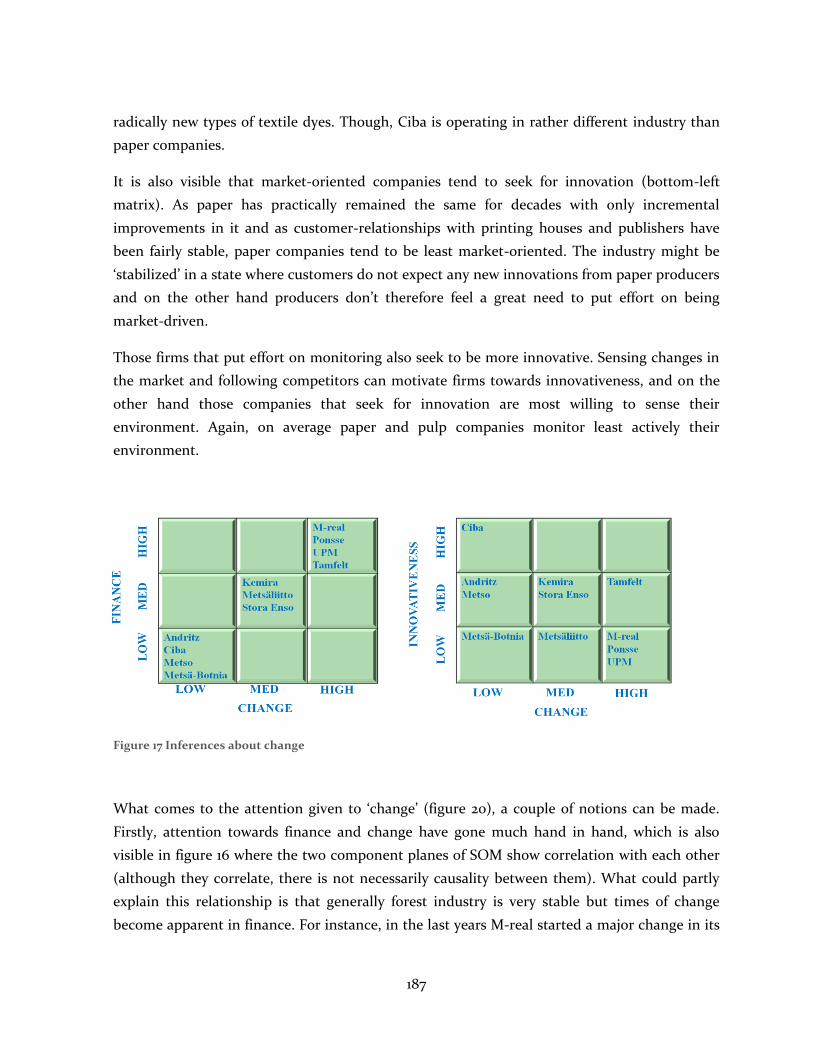
187
radically new types of textile dyes. Though, Ciba is operating in rather different industry than
paper companies.
It is also visible that market-oriented companies tend to seek for innovation (bottom-left
matrix). As paper has practically remained the same for decades with only incremental
improvements in it and as customer-relationships with printing houses and publishers have
been fairly stable, paper companies tend to be least market-oriented. The industry might be
‘stabilized’ in a state where customers do not expect any new innovations from paper producers
and on the other hand producers don’t therefore feel a great need to put effort on being
market-driven.
Those firms that put effort on monitoring also seek to be more innovative. Sensing changes in
the market and following competitors can motivate firms towards innovativeness, and on the
other hand those companies that seek for innovation are most willing to sense their
environment. Again, on average paper and pulp companies monitor least actively their
environment.
Figure 17 Inferences about change
What comes to the attention given to ‘change’ (figure 20), a couple of notions can be made.
Firstly, attention towards finance and change have gone much hand in hand, which is also
visible in figure 16 where the two component planes of SOM show correlation with each other
(although they correlate, there is not necessarily causality between them). What could partly
explain this relationship is that generally forest industry is very stable but times of change
become apparent in finance. For instance, in the last years M-real started a major change in its
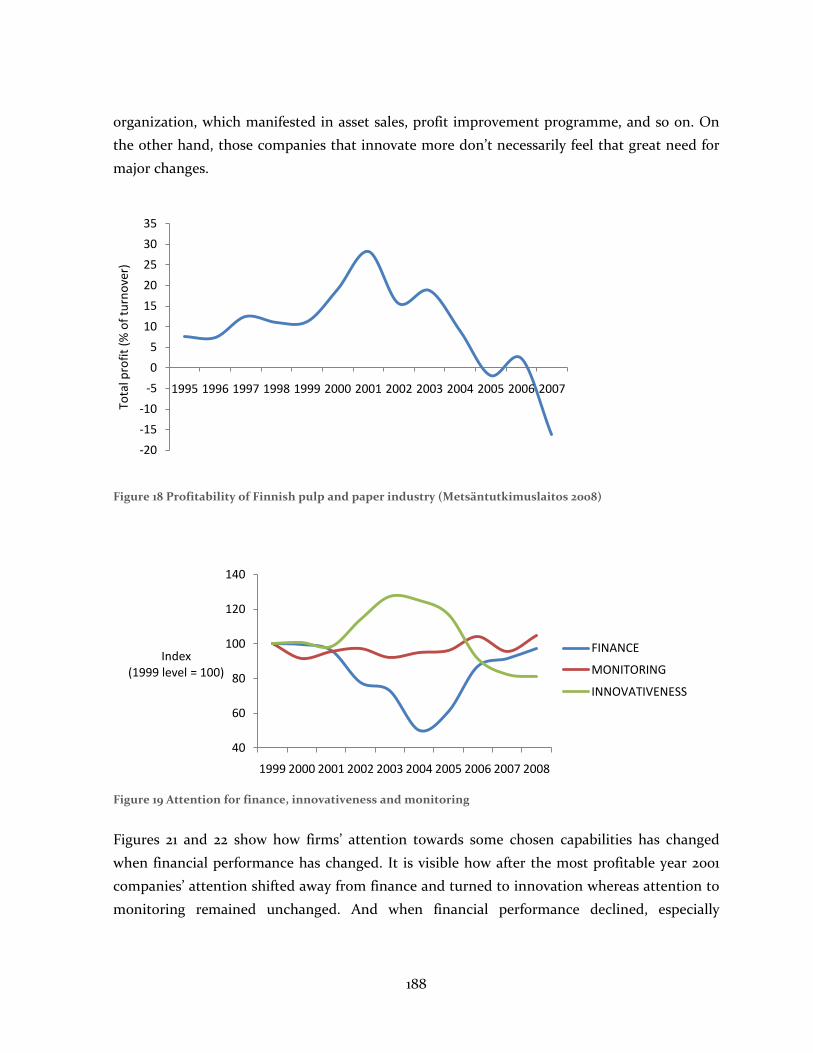
188
organization, which manifested in asset sales, profit improvement programme, and so on. On
the other hand, those companies that innovate more don’t necessarily feel that great need for
major changes.
Figure 18 Profitability of Finnish pulp and paper industry (Metsäntutkimuslaitos 2008)
Figure 19 Attention for finance, innovativeness and monitoring
Figures 21 and 22 show how firms’ attention towards some chosen capabilities has changed
when financial performance has changed. It is visible how after the most profitable year 2001
companies’ attention shifted away from finance and turned to innovation whereas attention to
monitoring remained unchanged. And when financial performance declined, especially
-20
-15
-10
-5
0
5
10
15
20
25
30
35
1995 1996 1997 1998 1999 2000 2001 2002 2003 2004 2005 2006 2007
Tota
l pro
fit
(% o
f tu
rno
ver)
40
60
80
100
120
140
1999 2000 2001 2002 2003 2004 2005 2006 2007 2008
Index (1999 level = 100)
FINANCE
MONITORING
INNOVATIVENESS
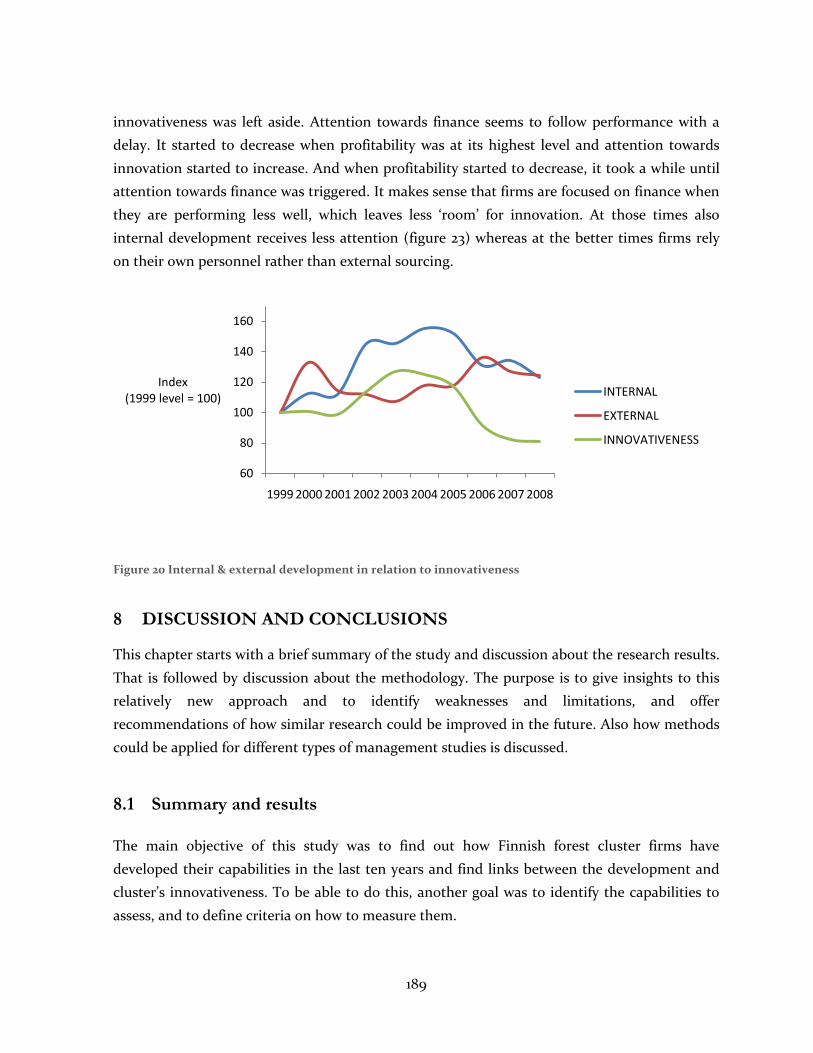
189
innovativeness was left aside. Attention towards finance seems to follow performance with a
delay. It started to decrease when profitability was at its highest level and attention towards
innovation started to increase. And when profitability started to decrease, it took a while until
attention towards finance was triggered. It makes sense that firms are focused on finance when
they are performing less well, which leaves less ‘room’ for innovation. At those times also
internal development receives less attention (figure 23) whereas at the better times firms rely
on their own personnel rather than external sourcing.
Figure 20 Internal & external development in relation to innovativeness
8 DISCUSSION AND CONCLUSIONS
This chapter starts with a brief summary of the study and discussion about the research results.
That is followed by discussion about the methodology. The purpose is to give insights to this
relatively new approach and to identify weaknesses and limitations, and offer
recommendations of how similar research could be improved in the future. Also how methods
could be applied for different types of management studies is discussed.
8.1 Summary and results
The main objective of this study was to find out how Finnish forest cluster firms have
developed their capabilities in the last ten years and find links between the development and
cluster’s innovativeness. To be able to do this, another goal was to identify the capabilities to
assess, and to define criteria on how to measure them.
60
80
100
120
140
160
1999 2000 2001 2002 2003 2004 2005 2006 2007 2008
Index(1999 level = 100)
INTERNAL
EXTERNAL
INNOVATIVENESS
190
So far practically anything that a firm has been good at has been called a capability and
frameworks of generic capabilities or such for identification are still missing. There are no
established methods for empirical research for identifying and measuring capabilities, although
different approaches have been used (Wang and Ahmed 2007). So far most of the studies have
been qualitative one firm case studies (ibid.). Research with larger samples is still rare. That is
not surprise as the concept of capabilities is still much on an abstract level and a bit unclear
even to academics (Dosi et al. 2000; Jacobides 2006). Especially, identifying capabilities that
can act as unique sources of competitive advantage is difficult. Collis (1994) notes that
competitive advantage lies in every single activity that a firm does and thus listing them is
impossible.
Most of the empirical capability research so far has been focused on measuring some chosen
capabilities (Peltoniemi et al. 2010). Dutta et al. (2005) proposed that capability level could be
measured as efficiency of turning inputs into outputs by comparing the achieved level to the
theoretical maximum. This requires that a capability has first been identified. And how can one
define the maximum and can everything be measured with inputs and outputs? The difficulty is
that knowledge and skills are hard to measure. For example R&D capabilities have been
measured with R&D expenditures as inputs and number of patents as outputs (George 2005),
but that data does not tell whole truth as there are also other dimensions of R&D capability
such as quality of products. Capabilities are by definition firm-specific, context-dependent, and
a source of heterogeneity in organizations. That makes them also difficult to compare between
firms.
To overcome these difficulties of measurement and identification, an alternative framework
was built based on the extant literature. Thereafter, the framework was applied in the empirical
part of the study. Capabilities to be included were chosen iteratively in the empirical part based
on capabilities that have been discussed in the prior literature. An objective was to define
capabilities that can be compared across the sample firms. The measurement adopted from
literature for assessing the level of capabilities was attention that is given for them and the data
used for measurement were corporate annual reports. It was assumed in the framework that
high attention in annual reports represents high development.
Even attention for errors does represent development. For example, in the case of Stora Enso’s
acquisition of Consolidated Papers learning took place in the form of trial-and-error learning
(Gavetti and Levinthal 2000; Patel and Pavitt 2000) and thus it can be thought of as
development. Because having a capability should be understood as relative to others (Winter
191
2000; Dutta et al. 2005), other firms’ attention could be used for benchmarking. This should be
kept in mind when interpreting the results. What results tell us is which firms have given
attention more than others. The best firms set the level which interpreted as high. That does
not necessarily imply general superiority (or inferiority) in that capability. That is, results could
look very different if firms were taken out of the sample and compared with other firms. In
addition, attention does not indicate how things are done in organizations. But studying that
was not in the scope of this study.
Fifteen capabilities were mapped at a firm level for eleven firms to be either high, moderate, or
low according to how much they were showing distinctive accumulation compared to others
(D'Este 2002), and some matters behind the attention were presented. Next, answers to the
initial research questions are summarized.
What capabilities have they developed?
The capabilities that emerged from the literature are present in differing levels for different
firms. Altogether fifteen capabilities were identified: financial capability, being responsible,
being strategic, monitoring, internal development, managerial capabilities, external sourcing,
marketing and sales, procurement and logistics, structuring, operational capabilities, service
capability, ability to change, innovative capabilities, and internationalization.
During the period under study capabilities’ relative importance at the cluster level changed. In
the beginning of the period, financial capabilities, change, and structuring were dominating.
But in the beginning of the millennium attention shifted. Firms became more market-oriented,
strategic, and innovation-oriented. What partially explains the shift away from finances is that
this period was the most profitable for pulp and paper industry. At the same time cluster firms
also shifted from external sources of knowledge to internal development. But a few years later
as profitability increasingly declined, companies started to move back to the state they were in
the beginning, with finance, structuring and change as dominating capabilities.
Every company in the sample has its own portfolio of capabilities. Paper and pulp companies
generally stand out as being the most financially oriented. But surprisingly, they don’t
distinguish themselves with attention towards operations. Innovation is typically not in their
portfolio. What connects chemical producers is that they give fairly much attention to
responsibility which is natural as they are probably the ones who are the most confronted by
192
environmental issues. Ciba is perhaps the most different from other firms. It has consistently
distinguished itself with its strong market-orientation, and attention towards strategy and
innovation. What was surprising is that international giants Stora Enso and UPM are not those
who give attention to internationalization the most, but Andritz clearly differs in this sense.
Have they developed capabilities consistently?
The results indicate that firms differ in terms of how consistent they have been in their
capability development. Regarding the whole portfolio, particularly Andritz, Ciba, M-real, UPM
have been consistent ones. Also Metsä-Botnia and Tamfelt have been relatively consistent.
Kemira can be described as semi-consistent as it has operated in two consistent ‘modes’ of very
different portfolios of capabilities.
But being inconsistent regarding the portfolio does not mean that individual capabilities could
not be given attention consistently. These capabilities are indicated by ‘high attention’ in the
results. For example, Metsäliitto has been one of the least consistent regarding the whole
portfolio but logistics have received regularly more attention than in other companies. Out of
all capabilities particularly finance, change, and structuring have been under regular attention
from a number of companies, whereas responsibility has in most cases been under attention
only for shorter periods of time. Overall, forest cluster firms seem to have rather stable
resource positions relative to others.
How are developed capabilities linked to innovation?
At cluster level capabilities’ links to each other were analyzed and three characteristics
promoting orientation towards innovation were identified:
Being strategic
Monitoring the external environment
Being market-oriented
What comes to the first one, it has been argued that strategic management skills boost
innovation (Teece et al. 1997), and that the most important characteristic making a firm
innovative is its strategic posture (Özsomer et al. 1997). Regarding monitoring, Day (1994) has
argued that the two most important capabilities for successful market-driven organizations are
193
customer-linking and market-sensing capabilities. Day’s argument resembles the results listed
above. Dutta et al. (1999) found that marketing capability is one of the most important
capabilities for an innovative firm – especially together with strong R&D. In this study it was
found that firms oriented towards marketing give also more attention to innovation.
A characteristic suppressing innovativeness was also identified. Those firms that are relatively
more concerned about financial issues were less oriented towards innovation, and at the times
when finance is dominating, firms are constraining their innovation. One reason behind this
might lie in ‘efficiency-thinking’. Many of the sample firms are operating in fields where
competition has so far been driven by costs and ever-increasing investments in new equipment
rather than by innovative new products.
To conclude, for an organization to be truly market-driven and innovative, emphasis should be
turned from internal processes and cost-control more to external environment (Day 1994). In
an old industrial district such as Finnish forest cluster customer relationships have been stable
for long and organizations have not necessarily felt a great pressure to be market-driven which
can constrain cluster’s renewal (Grabher 1993).
194
8.2 Weaknesses and limitations
The method of text-mining and SOM proposed by Janasik et al. (2009) is a promising addition
to content analysis and text mining. However, multiple weaknesses were confronted during the
empirical research process.
Automated content analysis was found to include some problems. Some of the chosen
keywords have biased the results because all the keywords’ contexts were not verified in the
data. Problems arise from words with multiple meanings and words in different contexts. For
example ‘personnel’ was interpreted as internal development but it can be questioned if, for
example, laying off personnel is internal development. Or if a company sells its plant it is
difficult to justify its marketing and sales skills with the keyword ‘sold’. What is problematic in
text-mining is that at the same time it is good to be used for large amount of data but on the
other hand verifying the context is difficult if the amount of data is large. The best keywords
are those that have few meanings and are rarely used in other contexts. For example companies
don’t like to mention ‘mission’ or ‘ethic’ in a negative sense. There are words that companies
like to mention a lot. They might claim to be innovative without any concrete proof about it.
Choosing the keywords require exhaustive beforehand knowledge about the companies, data,
and the industry. Emphasis really should be put on forming a good dictionary, and I would
recommend keeping it simple. There are also ready-made dictionaries varying from psychology
to business studies (for example by Harvard University).
Although annual reports are important documents for companies’ management, the language
written in them is not necessarily ‘from their pen’. Considering that written language has a
meaning (Janasik et al. 2009), also who has written the text must have a meaning. Annual
reports are usually written by the public relations department and accepted by the
management. They can also be written by the same people year after year, and they can be
based on the previous years’ annual reports. These factors can have an effect on the language
and can position the annual reports systematically near each other year after year. To better
represent management attention, it would perhaps be wise to use CEO letters in annual reports
for content analysis like Eggers and Kaplan (2009) instead of including whole annual reports.
Including the whole reports might still represent what is called whole organization’s attention
leading to organizational action (Sonpar and Golden-Biddle 2008).
Miller (1996) notes that configurational approaches often have a weakness where changing a
single variable or grouping algorithm can result in totally different results. The same weakness
195
is present in this study concerning self-organizing maps. If a few variables are for one firm
significantly different year after year compared to other firms, its annual reports tend to group
into same area although other variables would not differ that much from other firms. On the
other hand, deviations in variables can cause unexpectedly big changes in annual reports’
positions. For example finance, which naturally gets most of the attention, can vary a lot and
cause big leaps on the map. This can happen because of the structure of annual reports can
change. When attention for one capability increases it means less attention for other
capabilities in the used framework. Therefore deviations do not only affect the changed
capabilities but the whole portfolio when the values are calculated as shares of total attention.
8.3 Contribution, future research and managerial implications
The main contribution of this study is using the relatively new approach of combining content
analysis and self-organizing map in the field of management studies. Similar approach of
handling textual data has been used before, for example, for organizing document collections
on the Internet (comprehensive review in Janasik et al. 2009). Quantitative content analysis is
a traditional research method in this field, and is still widely in use, but using it together with
SOM has not been done. Even self-organizing map alone has been used only little for business
studies.
In addition to being a promising addition to content analysis, self-organizing map is a
convincing alternative for multidimensional scaling techniques presently used in many
management studies. For example illustrating organization's search in a rugged landscape (e.g.
Gavetti and Levinthal 2000) with different kinds of data could be one application. With a large
and accurate data set results could be very interesting. For example patents or monetary
resource allocation could be used as a more representative data. And with a larger number of
samples the results of SOM usually improve.
One of the most popular applications of SOM is finding clusters from data. So far in the field of
business it has been used for market segmentation (Kiang et al. 2006; Huang et al. 2007), but it
would be also an ideal method for finding strategic groups among industries (e.g. Cool and
Schendel 1988; Reger and Huff 1993; Osborne et al. 2001; D'Este 2002). However, less variables
(or much more samples) should be used than in this study if clustering would be an objective.
This is because every increase in the number of variables give samples a new dimension of how
to differentiate from other samples, which makes clustering more difficult. Investigating the
relationship between firm performance and strategic groups could also be rewarding.

196
Implications for managers mostly derive from the literature part of this study. Firstly,
everything in organizations cannot be given attention. Thus managers have to divide their
attention to an optimal set of capabilities for firm’s current situation. Secondly, different
communication channels in an organization can affect the firm behavior. That is, annual
reports and other channels for external communication can also serve as important channels
for internal communication.
197
REFERENCES
ADNER, R. & HELFAT, C. E. 2003. Corporate Effects and Dynamic Managerial Capabilities.
Strategic Management Journal 24(10): 1011-1025.
AMIT, R. & SCHOEMAKER, P. J. H. 1993. Strategic Assets and Organizational Rent. Strategic
Management Journal 14(1): 33-46.
ATHREYE, S. S. 2005. The Indian Software Industry and Its Evolving Service Capability.
Industrial and Corporate Change 14(3): 393-418.
AUGIER, M. & TEECE, D. J. 2008. Strategy as Evolution with Design: The Foundations of
Dynamic Capabilities and the Role of Managers in the Economic System. Organization
Studies 29(8-9): 1187-1208.
AUGIER, M. & TEECE, D. J. 2009. Dynamic Capabilities and the Role of Managers in Business
Strategy and Economic Performance. Organization Science 20(2): 410-421.
BACK, B., TOIVONEN, J., VANHARANTA, H. & VISA, A. 2001. Comparing Numerical Data and
Text Information from Annual Reports Using Self-Organizing Maps. International
Journal of Accounting Information Systems 2(4): 249-269.
BARNEY, J. 1991. Firm Resources and Sustained Competitive Advantage. Journal of Management
17(1): 99-120.
BARNEY, J. B. 2001. Resource-Based Theories of Competitive Advantage: A Ten-Year
Retrospective on the Resource-Based View. Journal of Management 27(6): 643-650.
BARR, P., STIMPERT, J. & HUFF, A. 1992. Cognitive Change, Strategic Action, and
Organizational Renewal. Strategic Management Journal: 15-36.
BARRON, D. 2003. Approaches to Strategy. In Faulkner, D. and Campbell, A. (eds.) The Oxford
Handbook of Strategy, pp. 80-103. New York: Oxford University Press.
BECERRA, M. 2008. A Resource-Based Analysis of the Conditions for the Emergence of Profits.
Journal of Management 34(6): 1110-1126.
BEINHOCKER, E. D. 1999. Robust Adaptive Strategies. Sloan Management Review 40(3): 95-+.
BELL, M. & PAVITT, K. 1995. The Development of Technological Capabilities. In ul Hague, I.
(eds.) Trade, Technology, and International Competitiveness, pp. 69-101. Washington
D.C.: World Bank Publications.
BLACK, J. A. & BOAL, K. B. 1994. Strategic Resources - Traits, Configurations and Paths to
Sustainable Competitive Advantage. Strategic Management Journal 15: 131-148.
BLACK, L. D. 2006. Corporate Social Responsibility as Capability. Journal of Corporate
Citizenship 23: 25-38.
BOEKER, W. & WILTBANK, R. 2005. New Venture Evolution and Managerial Capabilities.
Organization Science 16(2): 123-133.
198
BOWMAN, E. 1984. Content Analysis of Annual Reports for Corporate Strategy and Risk.
Interfaces: 61-71.
BRUDERER, E. & SINGH, J. V. 1996. Organizational Evolution, Learning, and Selection: A
Genetic-Algorithm-Based Model. Academy of Management Journal 39(5): 1322-1349.
CAPRON, L. & MITCHELL, W. 2009. Selection Capability: How Capability Gaps and Internal
Social Frictions Affect Internal and External Strategic Renewal. Organization Science
20(2): 294-312.
CAVUSGIL, S., CALANTONE, R. & ZHAO, Y. 2003. Tacit Knowledge Transfer and Firm
Innovation Capability. Journal of business & industrial marketing 18(1): 6-21.
CHEN, J. J. W., PECK, K., HONG, T. M., YANG, S. C., SHER, Y. P., SHIH, J. Y., WU, R., CHENG,
J. L., ROFFLER, S. R., WU, C. W. & YANG, P. C. 2001. Global Analysis of Gene
Expression in Invasion by a Lung Cancer Model. Cancer Research 61(13): 5223-5230.
CHETTY, S. & PATTERSON, A. 2002. Developing Internationalization Capability through
Industry Groups: The Experience of a Telecommunications Joint Action Group. Journal
of Strategic Marketing 10(1): 69-89.
CLARKE, G. 1997. Messages Fromceos: A Content Analysis Approach. Corporate
Communications: An International Journal 2(1): 31-39.
COHENDET, P. & LLERENA, P. 2003. Routines and Incentives: The Role of Communities in the
Firm. Industrial and Corporate Change 12(2): 271-297.
COLLIS, D. J. 1994. Research Note - How Valuable Are Organizational Capabilities. Strategic
Management Journal 15: 143-152.
CONGER, J. 2004. Developing Leadership Capability: What’s inside the Black Box. Academy of
Management Executive 18(3): 136-139.
CONTRACTOR, F. 2007. Is International Business Good for Companies? The Evolutionary or
Multi-Stage Theory of Internationalization Vs. The Transaction Cost Perspective.
Management International Review 47(3): 453-475.
COOL, K. & SCHENDEL, D. 1988. Performance Differences among Strategic Group Members.
Strategic Management Journal 9(3): 207-223.
D'ESTE, P. 2002. The Distinctive Patterns of Capabilities Accumulation and Inter-Firm
Heterogeneity: The Case of the Spanish Pharmaceutical Industry. Industrial and
Corporate Change: 847-874.
DAY, G. S. 1994. The Capabilities of Market-Driven Organizations. Journal of Marketing 58(4):
37-52.
199
DELERY, J. E. & DOTY, D. H. 1996. Modes of Theorizing in Strategic Human Resource
Management: Tests of Universalistic, Contingency, and Configurational Performance
Predictions. Academy of Management Journal 39(4): 802-835.
DIERICKX, I. & COOL, K. 1989. Asset Stock Accumulation and Sustainability of Competitive
Advantage. Management Science 35(12): 1504-1511.
DOSI, G. 1982. Technological Paradigms and Technological Trajectories - a Suggested
Interpretation of the Determinants and Directions of Technical Change. Research Policy
11(3): 147-162.
DOSI, G., FAILLO, M. & MARENGO, L. 2008. Organizational Capabilities, Patterns of
Knowledge Accumulation and Governance Structures in Business Firms: An
Introduction. Organization Studies 29(8-9): 1165-1185.
DOSI, G., NELSON, R. R. & WINTER, S. G. 2000. Introduction: The Nature and Dynamics of
Organizational Capabilities. In Dosi, G., Nelson, R.R. and Winter, S.G. (eds.) The
Nature and Dynamics of Organizational Capabilities, pp. 1-22. New York: Oxford
University Press.
DRAULANS, J., DEMAN, A. & VOLBERDA, H. 2003. Building Alliance Capability: Management
Techniques for Superior Alliance Performance. Long Range Planning 36(2): 151-166.
DUTTA, S., NARASIMHAN, O. & RAJIV, S. 1999. Success in High-Technology Markets: Is
Marketing Capability Critical? Marketing Science 18(4): 547-568.
DUTTA, S., NARASIMHAN, O. & RAJIV, S. 2005. Conceptualizing and Measuring Capabilities:
Methodology and Empirical Application. Strategic Management Journal 26(3): 277-285.
EASTERBY-SMITH, M., LYLES, M. A. & PETERAF, M. A. 2009. Dynamic Capabilities: Current
Debates and Future Directions. British Journal of Management 20: S1-S8.
EGGERS, J. & KAPLAN, S. 2009. Cognition and Renewal: Comparing Ceo and Organizational
Effects on Incumbent Adaptation to Technical Change. Organization Science 20(2): 461.
EISENHARDT, K. M. & MARTIN, J. A. 2000. Dynamic Capabilities: What Are They?
FIGUEIREDO, P. N. 2002. Does Technological Learning Pay Off? Inter-Firm Differences in
Technological Capability-Accumulation Paths and Operational Performance
Improvement. Research Policy 31(1): 73-94.
FIGUEIREDO, P. N. 2003. Learning, Capability Accumulation and Firms Differences: Evidence
from Latecomer Steel. Industrial and Corporate Change 12(3): 607-643.
FISS, P. C. 2007. A Set-Theoretic Approach to Organizational Configurations. Academy of
Management Review 32(4): 1180-1198.
FLYNN, B. & FLYNN, E. 2004. An Exploratory Study of the Nature of Cumulative Capabilities.
Journal of Operations Management 22(5): 439-457.
200
GALBREATH, J. 2005. Which Resources Matter the Most to Firm Success? An Exploratory
Study of Resource-Based Theory. Technovation 25(9): 979-987.
GALUNIC, D. C. & Rodan, S. 1998. Resource Recombinations in the Firm: Knowledge Structures
and the Potential for Schumpeterian Innovation. Strategic Management Journal 19(12):
1193-1201.
GAVETTI, G. 2005. Cognition and Hierarchy: Rethinking the Microfoundations of Capabilities'
Development. Organization Science 16(6): 599-617.
GAVETTI, G. & LEVINTHAL, D. 2000. Looking Forward and Looking Backward: Cognitive and
Experiential Search. Administrative Science Quarterly 45(1): 113-137.
GEORGE, G. 2005. Learning to Be Capable: Patenting and Licensing at the Wisconsin Alumni
Research Foundation 1925-2002. Industrial and Corporate Change 14(1): 119-151.
GOTTSCHALK, L. 1994. The Development, Validation, and Applications of a Computerized
Measurement of Cognitive Impairment from the Content Analysis of Verbal Behavior.
Journal of clinical psychology 50(3): 349-360.
GRABHER, G. 1993. The Weakness of Strong Ties. The Lock-in of Regional Development in the
Ruhr Area. In Grabher, G. (eds.) The Embedded Firm: On the Socioeconomics of
Industrial Networks, pp. 255-277. London: Routledge.
GRANT, R. M. 1991. The Resource-Based Theory of Competitive Advantage - Implications for
Strategy Formulation. California Management Review 33(3): 114-135.
GRANT, R. M. 1996a. Prospering in Dynamically-Competitive Environments: Organizational
Capability as Knowledge Integration. Organization Science 7(4): 375-387.
GRANT, R. M. 1996b. Toward a Knowledge-Based Theory of the Firm. Strategic Management
Journal 17: 109-122.
HAMBRICK, D. C. & MASON, P. A. 1984. Upper Echelons - the Organization as a Reflection of
Its Top Managers. Academy of Management Review 9(2): 193-206.
HEIDENREICH, M. 2005. The Renewal of Regional Capabilities Experimental Regionalism in
Germany. Research Policy 34(5): 739-757.
HELFAT, C. E. 1997. Know-How and Asset Complementarity and Dynamic Capability
Accumulation: The Case of R&D. Strategic Management Journal 18(5): 339-360.
HELFAT, C. E., FINKELSTEIN, S., MITCHELL, W., PETERAF, M. A. & WINTER, S. G. 2007.
Dynamic Capabilities: Understanding Strategic Change in Organizations. Oxford, U.K.:
Blackwell Publishing.
HELFAT, C. E. & PETERAF, M. A. 2003. The Dynamic Resource-Based View: Capability
Lifecycles. Strategic Management Journal 24(10): 997-1010.
201
HUANG, J. J., TZENG, G. H. & ONG, C. S. 2007. Marketing Segmentation Using Support Vector
Clustering. Expert Systems with Applications 32(2): 313-317.
JACOBIDES, M. G. 2006. The Architecture and Design of Organizational Capabilities. Industrial
and Corporate Change 15(1): 151-171.
JANASIK, N., HONKELA, T. & BRUUN, H. 2009. Text Mining in Qualitative Research
Application of an Unsupervised Learning Method. Organizational Research Methods
12(3): 436-460.
JONES, M. A. 2006. A Content Analysis of Customer Satisfaction in Annual Reports. Journal of
Consumer Satisfaction, Dissatisfaction and Complaining Behavior 19: 59.
KALE, P., DYER, J. & SINGH, H. 2002. Alliance Capability, Stock Market Response, and Long-
Term Alliance Success: The Role of the Alliance Function. Strategic Management
Journal: 747-767.
KAPLAN, S., MURRAY, F. & HENDERSON, R. 2003. Discontinuities and Senior Management:
Assessing the Role of Recognition in Pharmaceutical Firm Response to Biotechnology.
Industrial and Corporate Change 12(2): 203-233.
KAUFFMAN, S. 1993. The Origins of Order: Self Organization and Selection in Evolution. New
York: Oxford University Press.
KIANG, M. & FISHER, D. 2008. Selecting the Right Mba Schools–an Application of Self-
Organizing Map Networks. Expert Systems with Applications 35(3): 946-955.
KIANG, M. Y., HU, M. Y. & FISHER, D. M. 2006. An Extended Self-Organizing Map Network for
Market Segmentation - a Telecommunication Example. Decision Support Systems 42(1):
36-47.
KOCHHAR, R. 1997. Strategic Assets, Capital Structure, and Firm Performance. Journal of
Financial and Strategic Decisions 10(3): 23-36.
KOGUT, B. & KULATILAKA, N. 2001. Capabilities as Real Options. Organization Science 12(6):
744-758.
KOHONEN, T. 2001. Self-Organizing Maps. Berlin, Heidelberg: Springer.
KOHUT, G. & SEGARS, A. 1992. The President's Letter to Stockholders: An Examination of
Corporate Communication Strategy. Journal of Business Communication 29(1): 7.
KRIPPENDORFF, K. 2004. Content Analysis: An Introduction to Its Methodology. Thousand
Oaks, London, New Delhi: Sage Publications, Inc.
KYNGÄS, H. & VANHANEN, L. 1999. Sisällön Analyysi. Hoitotiede 11(1).
LAAMANEN, T. & WALLIN, J. 2009. Cognitive Dynamics of Capability Development Paths.
Journal of Management Studies 46(6): 950-981.
202
LAI, K. 2004. Service Capability and Performance of Logistics Service Providers. Transportation
Research Part E 40(5): 385-399.
LAMBERG, J.-A. & OJALA, J. 2006. Evolution of Competitive Strategies in Global Forestry
Industries: Introduction. In Lamberg, J.-A., Näsi, J., Ojala, J. and Sajasalo, P. (eds.) The
Evolution of Competitive Strategies in Global Forestry Industries: Comparative
Perspectives, pp. 1-29. Dordrecht: Springer.
LAMBERG, J. A., TIKKANEN, H., NOKELAINEN, T. & SUUR-INKEROINEN, H. 2009.
Competitive Dynamics, Strategic Consistency, and Organizational Survival. Strategic
Management Journal 30(1): 45-60.
LAVIE, D. 2006. Capability Reconfiguration: An Analysis of Incumbent Responses to
Technological Change. Academy of Management Review 31(1): 153-174.
LAWRENCE, S., GILES, C. L., TSOI, A. C. & BACK, A. D. 1997. Face Recognition: A
Convolutional Neural-Network Approach. Ieee Transactions on Neural Networks 8(1):
98-113.
LEE, C., LEE, K. & PENNINGS, J. M. 2001. Internal Capabilities, External Networks, and
Performance: A Study on Technology-Based Ventures. Strategic Management Journal
22(6-7): 615-640.
LEONARD-BARTON, D. 1992. Core Capabilities and Core Rigidities - a Paradox in Managing
New Product Development. Strategic Management Journal 13: 111-125.
LEVINTHAL, D. & MARCH, J. G. 1981. A Model of Adaptive Organizational Search. Journal of
Economic Behavior & Organization 2(4): 307-333.
LEVINTHAL, D. & MYATT, J. 1994. Co-Evolution of Capabilities and Industry: The Evolution of
Mutual Fund Processing. Strategic Management Journal 15: 45-62.
LEVINTHAL, D. A. 2000. Organizational Capabilities in Complex Worlds. In Dosi, G., Nelson,
R.R. and Winter, S.G. (eds.) The Nature and Dynamics of Organizational Capabilities,
pp. 363-376. New York: Oxford University Press.
LEVITT, B. & MARCH, J. G. 1988. Organizational Learning. Annual Review of Sociology 14: 319-
340.
LITZ, R. 1996. A Resource-Based-View of the Socially Responsible Firm: Stakeholder
Interdependence, Ethical Awareness, and Issue Responsiveness as Strategic Assets.
Journal of Business Ethics 15(12): 1355-1363.
LORENZONI, G. & LIPPARINI, A. 1999. The Leveraging of Interfirm Relationships as a
Distinctive Organizational Capability: A Longitudinal Study. Strategic Management
Journal 20(4): 317-338.
203
MAYER, K. J. & SALOMON, R. M. 2006. Capabilities, Contractual Hazards, and Governance:
Integrating Resource-Based and Transaction Cost Perspectives. Academy of
Management Journal 49(5): 942-959.
MCCARTHY, I. P. & TAN, Y. K. 2000. Manufacturing Competitiveness and Fitness Landscape
Theory. Journal of Materials Processing Technology 107(1-3): 347-352.
MCEVILY, B. & ZAHEER, A. 1999. Bridging Ties: A Source of Firm Heterogeneity in
Competitive Capabilities. Strategic Management Journal 20(12): 1133-1156.
Metsäntutkimuslaitos 2008. Metsätilastollinen Vuosikirja 2008. Vammala:
Metsäntutkimuslaitos.
MEYER, A. D., TSUI, A. S. & HININGS, C. R. 1993. Configurational Approaches to
Organizational Analysis. Academy of Management Journal 36(6): 1175-1195.
MILGROM, P. & ROBERTS, J. 1995. Complementarities and Fit - Strategy, Structure, and
Organizational-Change in Manufacturing. Journal of Accounting & Economics 19(2-3):
179-208.
MILLER, D. 1986. Configurations of Strategy and Structure - Towards a Synthesis. Strategic
Management Journal 7(3): 233-249.
MILLER, D. 1992. Environmental Fit Versus Internal Fit. Organization Science 3(2): 159-178.
MILLER, D. 1996. Configurations Revisited. Strategic Management Journal 17(7): 505-512.
MILLER, D. & SHAMSIE, J. 1996. The Resource-Based View of the Firm in Two Environments:
The Hollywood Film Studios from 1936 to 1965. Academy of Management Journal 39(3):
519-543.
MINTZBERG, H. & WATERS, J. A. 1985. Of Strategies, Deliberate and Emergent. Strategic
Management Journal 6(3): 257-272.
MOLITERNO, T. & WIERSEMA, M. 2007. Firm Performance, Rent Appropriation, and the
Strategic Resource Divestment Capability. Strategic Management Journal 28(11): 1065.
MOORMAN, C. & SLOTEGRAAF, R. J. 1999. The Contingency Value of Complementary
Capabilities in Product Development. Journal of Marketing Research 36(2): 239-257.
NELSON, R. R. & WINTER, S. G. 1982. An Evolutionary Theory of Economic Change. Cambridge,
MA: Harvard Business School Press.
NEU, D., WARSAME, H. & PEDWELL, K. 1998. Managing Public Impressions: Environmental
Disclosures in Annual Reports. Accounting, Organizations and Society 23(3): 265-282.
OCASIO, W. 1997. Towards an Attention-Based View of the Firm. Strategic Management
Journal 18: 187-206.
204
OSBORNE, J. D., STUBBART, C. I. & RAMAPRASAD, A. 2001. Strategic Groups and Competitive
Enactment: A Study of Dynamic Relationships between Mental Models and
Performance. Strategic Management Journal 22(5): 435-454.
PANAYIDES, P. 2006. Enhancing Innovation Capability through Relationship Management and
Implications for Performance. European Journal of Innovation Management 9(4): 466.
PARK, H., GARDNER, T. & WRIGHT, P. 2004. Hr Practices or Hr Capabilities: Which Matters?
Insights from the Asia Pacific Region. Asia Pacific Journal of Human Resources 42(3):
260.
PATEL, P. & PAVITT, K. 2000. How Technological Competencies Help Define the Core (Not
the Boundaries) of the Firm. In Dosi, G., Nelson, R.R. and Winter, S.G. (eds.) The
Nature and Dynamics of Organizational Capabilities, pp. 313-333. New York: Oxford
University Press.
PELTONIEMI, M., LAAKSONEN, O. & TIKKANEN, U. 2010. Operationalization of capabilities:
A review. In Lamberg, J-A. & Peltoniemi M. Capabilities and competitive advantage in
the forest industry. Research report. Aalto University School of Science and Technology.
PENROSE, E. T. 1959. The Theory of the Growth of the Firm. Oxford: B. Blackwell.
PETERAF, M. A. 1993. The Cornerstones of Competitive Advantage - a Resource-Based View.
Strategic Management Journal 14(3): 179-191.
PISANO, G. P. 2000. In Search of Dynamic Capabilities: The Origins of R&D Competence in
Biopharmaceuticals. In Dosi, G., Nelson, R.R. and Winter, S.G. (eds.) The Nature and
Dynamics of Organizational Capabilities, pp. 363-376. New York: Oxford University
Press.
PORTER, M. 1980. Competitive Strategy: Techniques for Analyzing Industries and Competitors,
New York: Free Press.
PORTER, M. & SIGGELKOW, N. 2008. Contextuality within Activity Systems and Sustainability
of Competitive Advantage. Academy of Management Perspectives 22(2): 34-56.
PORTER, M. E. 1998. Clusters and the New Economics of Competition. Harvard Business
Review 76(6): 77-+.
REGER, R. K. & HUFF, A. S. 1993. Strategic Groups - a Cognitive Perspective. Strategic
Management Journal 14(2): 103-123.
RIFFE, D., LACY, S. & FICO, F. 1998. Analyzing Media Messages. New Jersey: Lawrence Erlbaum
Associates, Inc.
ROBINS, J. & WIERSEMA, M. F. 1995. A Resource-Based Approach to the Multibusiness Firm -
Empirical-Analysis of Portfolio Interrelationships and Corporate Financial Performance.
Strategic Management Journal 16(4): 277-299.
205
ROTHAERMEL, F. & DEEDS, D. 2006. Alliance Type, Alliance Experience and Alliance
Management Capability in High-Technology Ventures. Journal of business venturing
21(4): 429-460.
RUEF, M. 1997. Assessing Organizational Fitness on a Dynamic Landscape: An Empirical Test
of the Relative Inertia Thesis. Strategic Management Journal 18(11): 837-853.
SAATY, T., VARGAS, L. & DELLMANN, K. 2003. The Allocation of Intangible Resources: The
Analytic Hierarchy Process and Linear Programming. Socio-Economic Planning Sciences
37(3): 169-184.
SCHROEDER, R., BATES, K. & JUNTTILA, M. 2002. A Resource-Based View of Manufacturing
Strategy and the Relationship to Manufacturing Performance. Strategic Management
Journal 23(2): 105-117.
SHARMA, S. & VREDENBURG, H. 1998. Proactive Corporate Environmental Strategy and the
Development of Competitively Valuable Organizational Capabilities. Strategic
Management Journal 19(8): 729-753.
SIERILÄ, P. 1989. Strategioita Vuosikertomuksista Tulkittuna. Paperi ja puu 70: 220-225.
SIGGELKOW, N. 2001. Change in the Presence of Fit: The Rise, the Fall, and the Renaissance of
Liz Claiborne. The Academy of Management Journal 44(4): 838-857.
SIGGELKOW, N. 2002. Evolution toward Fit. Administrative Science Quarterly 47(1): 125-159.
SIRMON, D. G. & HITT, M. A. 2009. Contingencies within Dynamic Managerial Capabilities:
Interdependent Effects of Resource Investment and Deployment on Firm Performance.
Strategic Management Journal 30(13): 1375-1394.
SIRMON, D. G., HITT, M. A. & IRELAND, R. D. 2007. Managing Firm Resources in Dynamic
Environments to Create Value: Looking inside the Black Box. Academy of Management
Review 32(1): 273-292.
SONG, M., DI BENEDETTO, C. & NASON, R. 2007. Capabilities and Financial Performance:
The Moderating Effect of Strategic Type. Journal of the Academy of Marketing Science
35(1): 18-34.
SONPAR, K. & GOLDEN-BIDDLE, K. 2008. Using Content Analysis to Elaborate Adolescent
Theories of Organization. Organizational Research Methods 11(4): 795-814.
STANTON, P. & STANTON, J. 2002. Corporate Annual Reports: Research Perspectives Used.
Accounting, Auditing & Accountability Journal 15(4): 478-500.
STUART, T. & PODOLNY, J. 1996. Local Search and the Evolution of Technological
Capabilities. Strategic Management Journal 17: 21-38.
TALLMAN, S., JENKINS, M., HENRY, N. & PINCH, S. 2004. Knowledge, Clusters, and
Competitive Advantage. Academy of Management Review 29(2): 258-271.
206
TEECE, D. J. 1986. Profiting from Technological Innovation - Implications for Integration,
Collaboration, Licensing and Public-Policy. Research Policy 15(6): 285-305.
TEECE, D. J. 2007. Explicating Dynamic Capabilities: The Nature and Microfoundations of
(Sustainable) Enterprise Performance. Strategic Management Journal 28(13): 1319-1350.
TEECE, D. J., PISANO, G. & SHUEN, A. 1997. Dynamic Capabilities and Strategic Management.
Strategic Management Journal 18(7): 509-533.
TEECE, D. J., PISANO, G. & SHUEN, A. 2000. Dynamic Capabilities and Strategic Management.
In Dosi, G., Nelson, R.R. and Winter, S.G. (eds.) The Nature and Dynamics of
Organizational Capabilities, pp. 334-362. New York: Oxford University Press.
TRACEY, M., LIM, J. S. & VONDEREMBSE, M. A. 2005. The Impact of Supply-Chain
Management Capabilities on Business Performance. Supply Chain Management-an
International Journal 10(3-4): 179-191.
TRIPSAS, M. & GAVETTI, G. 2000. Capabilities, Cognition, and Inertia: Evidence from Digital
Imaging. Strategic Management Journal 21(10-11): 1147-1161.
TUOMI, J. & SARAJÄRVI, A. 2009. Laadullinen Tutkimus Ja Sisällönanalyysi. Helsinki: Tammi.
ULTSCH, A. & SIEMON, H. 1990. Kohonen’s Self Organizing Feature Maps for Exploratory Data
Analysis. (eds.) Proceedings of International Neural Network Conference (Innc’90), pp.
305–308. Dordrecht, Netherlands: Kluwer.
VAN DEN BOSCH, F. & VAN WIJK, R. 2001. Creation of Managerial Capabilities through
Managerial Knowledge Integration: A Competence-Based Perspective. In Sanchez, R.
(eds.) Knowledge Management and Organizational Competence, pp. 159-176. New York:
Oxford University Press.
WANG, C. L. & AHMED, P. K. 2007. Dynamic Capabilities: A Review and Research Agenda.
International Journal of Management Reviews 9(1): 31-51.
VENKATRAMAN, N. & CAMILLUS, J. C. 1984. Exploring the Concept of Fit in Strategic
Management. Academy of Management Review 9(3): 513-525.
WERNERFELT, B. 1984. A Resource-Based View of the Firm. Strategic Management Journal: 171-
180.
VESANTO, J. 2002. Data Exploration Process Based on the Self-Organizing Map. PhD thesis.
Espoo, Finland: Helsinki University of Technology.
WINTER, S. G. 2000. The Satisficing Principle in Capability Learning. Strategic Management
Journal 21(10-11): 981-996.
WITTEN, I. H. & FRANK, E. 2002. Data Mining: Practical Machine Learning Tools and
Techniques with Java Implementations. ACM SIGMOD Record 31(1): 76-77.
207
VORHIES, D. & MORGAN, N. 2005. Benchmarking Marketing Capabilities for Sustainable
Competitive Advantage. Journal of Marketing 69(1): 80-94.
WRIGHT, S. 1931. Evolution in Mendelian Populations. Genetics 16(2): 97-159.
YAM, R. C. M., GUAN, J. C., PUN, K. F. & TANG, E. P. Y. 2004. An Audit of Technological
Innovation Capabilities in Chinese Firms: Some Empirical Findings in Beijing, China.
Research Policy 33(8): 1123-1140.
ZAHRA, S., SAPIENZA, H. & DAVIDSSON, P. 2006. Entrepreneurship and Dynamic
Capabilities: A Review, Model and Research Agenda. Journal of Management Studies
43(4): 917-955.
ZOLLO, M. & SINGH, H. 2004. Deliberate Learning in Corporate Acquisitions: Post-Acquisition
Strategies and Integration Capability in Us Bank Mergers. Strategic Management
Journal 25(13): 1233-1256.
ZOLLO, M. & WINTER, S. G. 2002. Deliberate Learning and the Evolution of Dynamic
Capabilities. Organization Science 13(3): 339-351.
ZYGLIDOPOULOS, S. 1999. Initial Environmental Conditions and Technological Change.
Journal of Management Studies 36(2): 241-262.
ÖZSOMER, A., CALANTONE, R. & DI BENEDETTO, A. 1997. What Makes Firms More
Innovative? A Look at Organizational and Environmental Factors. Journal of business &
industrial marketing 12(6): 400-416.
208
CHAPTER 7
DYNAMIC CAPABILITIES OF EXPLOITATION AND EXPLORATION IN
COMPETITIVE SETTINGS
ARNE KÖHLER
Aalto University School of Science and Technology [email protected]
1 INTRODUCTION
Important contributions of extant research on competitive actions aside – addressing the
importance of issues such as the amount (Young et al., 1996), speed (Miller and Chen, 1994;
Chen, 1996; Ferrier, Smith and Grimm, 1999), sequence (Ferrier, 2001), and scope of actions
(Miller and Chen, 1996) – little is still known about the nature of actions firms take in such
dynamic competitive environments. Two separate and contradicting views emerge from
literature regarding how incumbents cope given fierce rivalry. On the one hand, to stay ahead
in highly competitive markets, firms can exploit existing capabilities and take actions to
enhance the “current ways of doing things” (Kirzner, 1973). Faced with stiff competition, firms
have been suggested to increase focus on the core activities (Porter, 1980; Harrigan and Porter,
1983; Ocasio, 1995), cost efficiency (Singh, 1986; Castrogiovanni, 1991) and short term
competitiveness (Cameron, Kim and Whetten, 1987; Lumpkin and Dess, 2001) to protect the
current business and in order to remain competitive. On the other hand, faced with high
competition firms take action to “create new things to do” (Kirzner, 1973), i.e. to innovate and
explore market opportunities. A popular management literature maxim has been to innovate
and escape direct competition whenever rivalry escalates (Kim and Mauborgne, 1999). Firms
have been argued to pursue innovations in order to create uncontested market space or
barriers to competition through differentiation (Haveman, 1993; Dobrev and Kim, 2006; Jansen,
209
Van den Bosch and Volberda, 2006). Although competition is broadly agreed to be a key
stimulant of firm action (e.g. Chen, Su and Tsai, 2007) there is still little consensus on what
kind of action competition gives rise to.
The main objective of this paper is to explore how competitive intensity in an industry affects
the nature of the competitive actions of incumbents. This objective is divided into four distinct
parts. First, the existing knowledge of the implications of competition on firm behavior is
mapped. This is done in order to understand the mechanisms by which rivalry drives action.
Second, viewing competitive actions from an exploitation-exploration perspective the theory
development separates between actions designed to increase efficiency – labeled exploitation
actions – and actions employed to innovate and avoid competitive pressure – exploration
actions. Third, applying theory on organizational adaption and competition the research
addresses the differences in the competitive and performance implications of exploitation and
exploration actions. Drawing on the outlined theory and rational economic behavior, a causal
model of the effect of competitive intensity on both the exploitation and the exploration
actions of firms is put forth; formalized in three distinct hypotheses. Fourth, the model is
subsequently tested and verified using a unique sample of the largest 150 firms in the pulp and
paper industry. This is done through content analysis of newsfeed data, recording 12 790
initiated competitive actions over a period of 20 years.
The aim is to expand knowledge on how companies act in relation to their environment by
focusing on the apparent differences in the characteristics of responses. This potentially not
only enriches theory on competitive interaction, but also gives new insight adding to the
debate on organizational adaption as a consequence of hostile environments. Moreover, this
research attempts to answer recent calls for analyzing the effects of competitive actions on an
industry level (Ferrier, 2001; Chen et al., 2007), and to add much called for longitudinal
empirical input on antecedents of actions (e.g. Lewin et al., 1999). Methodologically, the study
intends to advance the use of content analysis as a creative approach to studying
organizational actions (Uotila et al., 2009) and to demonstrate best practice on analyzing
overdispersed count data (see Norton et al., 2004; Echambadi et al., 2006; Hoetker, 2007). The
full pattern of results suggests that current research on competition would be complimented by
adding the dimension of action nature – incorporating the applied exploitation and exploration
perspective.
The remainder of the chapter proceeds as follows. First, the theoretical background is
introduced by reviewing the two key concepts forming the theoretical base of this research –
210
namely competition and exploration vis-à-vis exploitation. The theoretical part is concluded by
forming hypothesis concerning the expected outcomes of competitive intensity. The empirical
part, in turn, is introduced in with a presentation of the sample industry, its characteristics and
suitability for valid analysis, and continues to present the applied methodology. Finally, the
results are presented followed by a discussion of the findings.
2 THEORETICAL BACKGROUND
2.1 Defining competitive intensity
Competition and competitor analysis has gained a central role in strategic management
literature in the past decades (e.g. Porter, 1985; Chen 1996). Within this research, the impact of
the environmental context – in particular the impact of the moves of competitors – on firm
performance and as a driver of firm actions has become widely accepted (Porter, 1980;
Castrogiovanni, 1991; McGahan, 2004). Below, the extant theory and research on competition is
summarized to understand the mechanisms of competition and its implications for firms and
firm actions.
As noted by Ferrier (2001) incumbents experience pressure by the sum of all competitive
actions in its market environment. Firms first discern what information they can from their
entire competitive environment and then respond, as firms that fail to do so are outperformed
(Chen et al., 2007). On an industry level the propensity to react is driven by the awareness of
the attack, the motivation to respond and the capability to do so (Smith et al., 1992). The
awareness of an action has been found to come from the amount of firms affected by that
action, often measured in the amount of actions an attacker takes, which on the industry plane
translates to the sum of rival action (Chen et al., 1992). Motivation, in turn, stems from the
threat that such actions give rise to, again commonly modeled as amount of and focus of
competitive actions. Hence, more actions create more awareness and motivation, while the
capability to contest remains unaffected. Ceteris paribus, increased rivalry, defined as the
aggregate of industry competitive actions (Young et al., 1996), should increase the competitive
tension experienced by a focal firm.
However, following arguments from industrial organization (IO) theory the amount of actions
taken in an industry may not be enough to capture the intensity of competitive pressure a focal
firm is under. Indeed, competitive pressure also depends on the degree of interdependence
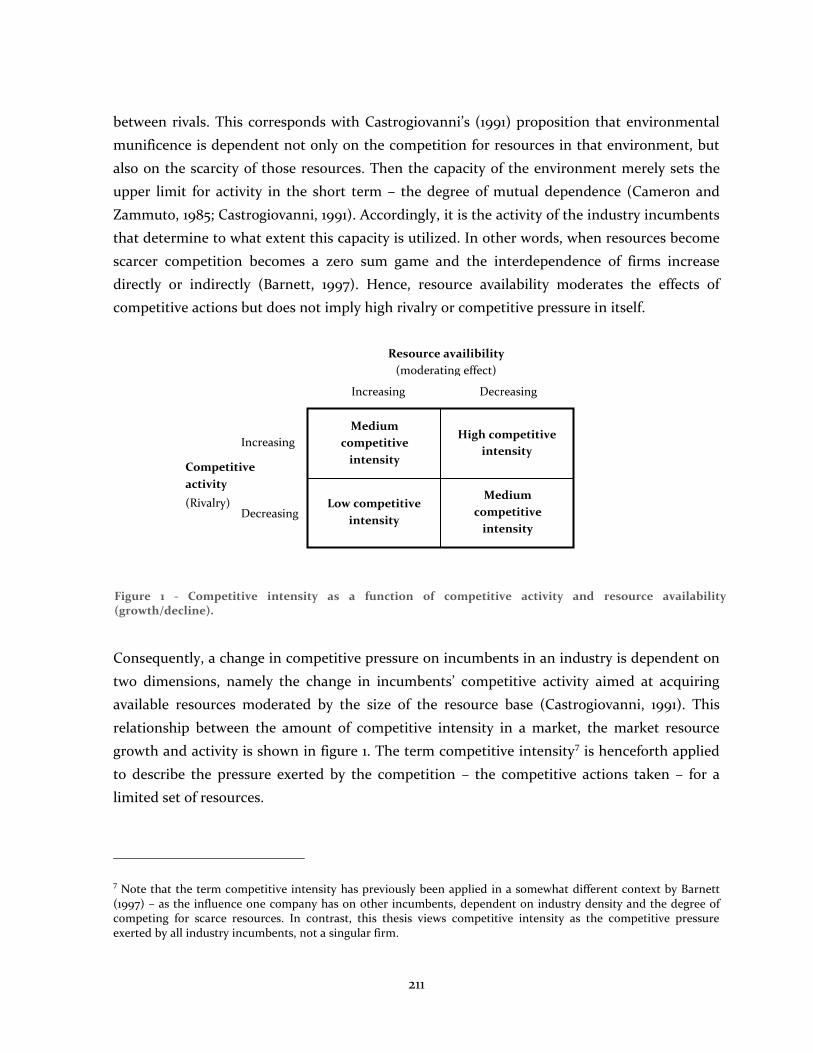
211
between rivals. This corresponds with Castrogiovanni’s (1991) proposition that environmental
munificence is dependent not only on the competition for resources in that environment, but
also on the scarcity of those resources. Then the capacity of the environment merely sets the
upper limit for activity in the short term – the degree of mutual dependence (Cameron and
Zammuto, 1985; Castrogiovanni, 1991). Accordingly, it is the activity of the industry incumbents
that determine to what extent this capacity is utilized. In other words, when resources become
scarcer competition becomes a zero sum game and the interdependence of firms increase
directly or indirectly (Barnett, 1997). Hence, resource availability moderates the effects of
competitive actions but does not imply high rivalry or competitive pressure in itself.
Consequently, a change in competitive pressure on incumbents in an industry is dependent on
two dimensions, namely the change in incumbents’ competitive activity aimed at acquiring
available resources moderated by the size of the resource base (Castrogiovanni, 1991). This
relationship between the amount of competitive intensity in a market, the market resource
growth and activity is shown in figure 1. The term competitive intensity7 is henceforth applied
to describe the pressure exerted by the competition – the competitive actions taken – for a
limited set of resources.
7 Note that the term competitive intensity has previously been applied in a somewhat different context by Barnett
(1997) – as the influence one company has on other incumbents, dependent on industry density and the degree of competing for scarce resources. In contrast, this thesis views competitive intensity as the competitive pressure exerted by all industry incumbents, not a singular firm.
High competitive
intensity
Medium
competitive
intensity
Medium
competitive
intensity
Low competitive
intensity
Increasing Decreasing
Increasing
Decreasing
Competitive
activity
(Rivalry)
Resource availibility
(moderating effect)
Figure 1 - Competitive intensity as a function of competitive activity and resource availability (growth/decline).
212
2.2 Implications of competitive intensity
Competition and resulting pressure has been posited to be the stimulating process causing
firms to act (Gresov et al., 1993; Barnett and Hansen, 1996), because it is the actions a firm takes
in relation to that of competitors that determines its success (Porter, 1980). In other words,
competitive intensity (i.e. the actions firms take and their degree of interlinkedness) induces
firm actions through a mechanism of threat to performance.
When the amount of moves and countermoves escalate all competitors in an industry might
suffer, as any potential above-normal earnings are eroded (Porter, 1980). This is the result when
the high competition for scarce resources drives up the costs of acquiring such resources until a
point where actions merely recoup initial investments (Chen and Hambrick, 1995). Empiric
studies have found that, when rivalry is high, above normal returns tend to be short lived and
the variation of such returns greater (D’Aveni, 1994; Wiggins and Ruefli, 2005). Ferrier (2001)
found that the longer periods of attack and the higher number of attack actions the lower focal
firm performance. Accordingly, the basic view on rivalry is that lower rivalry is good whereas
high rivalry is an unwanted state8 (Bain, 1956). The negative impact on performance of high
rivalry makes competitive intensity perhaps best viewed as a threat: “an environmental event
that has impeding or harmful consequences for the entity” (Staw, 1981: 502). Previous scholars
have argued that as competition exerts pressure of impeding losses to a firm, it is as threatening
as realized losses (Miller and Chen, 1994). In turn, Child even views competitive intensity
directly as a materialized threat, describing competitive intensity as “the degree of threat that
faces decision makers in the achievement of their goals from external competition, hostility or
indifference.” (1972: 4).
This threat from increased competitive intensity has been found induce firms to respond (Chen
et al., 1992; Gresov et al., 1993) and to increase the level of responses (Chen et al., 2007). Indeed,
research suggests that the longer the time lag before a focal firm responds to competitive
intensity the lower the returns (Smith et al., 1991; Miller and Chen, 1994) and/or the higher the
losses in market share (Chen and MacMillan, 1992; Ferrier et al., 1999). Moreover, findings
show that the greater the propensity to respond (Smith et al., 1991) and the greater the number
of responses in the face of increased competitive intensity the better the performance (Young
8 Scholars have also argued the opposite, that rivalry carries also beneficial effects through its impact on effectiveness
and industry evolution as a stimulant for progress and legitimacy (Porter, 1991; Hannan and Freeman, 1984). However, these arguments generally pertain to lower levels of competition or situations where effectiveness that rivalry has forced competitors to learn can be exploited in new less competitive domains (e.g. roots in a competitive home market when the industry is globalizing).
213
et al., 1996). Hence, a rival action is a threat which is minimized by swift and voluminous
counteraction. Firms are thus motivated to respond, which in turn increases industry rivalry
further having a detrimental effect on performance levels.
Even if incumbents have been suggested to respond there is ambiguity in how firms respond to
increased rivalry. Moreover, responding quickly and in great numbers is not always beneficial,
as found in research on competition, if the action taken is not optimal (Hopkins, 2003).
Further, the characteristics of a competitive response may have profound effects as recognized
by Young and colleagues: “some set…of competitive actions may yield more performance
benefits or evoke more rivalrous countermoves” (1996: 252). Then the chosen response becomes
pivotal when, as stated above, the greater the responses any action provokes, i.e. the more it
accelerates rivalry, the worse the performance outcomes (Miller and Chen, 1994).
2.3 The concept of exploitation and exploration and competition
Two separate organizational responses emerge from literature regarding the manner in which a
firm acts when under external competitive pressure. Kirzner contended that to stay ahead in
highly competitive markets firms must either “create new ways of doing things” or create “new
things to do” (1973: 20). The first option entails traditional competition-based strategy –
exploiting current knowledge in improving efficiency, costs and coverage (March, 1991;
Ghemawat and Ricart i Costa, 1993; Greve, 2007), in other words doing better what the firm
already does. The other less common option pertains to avoiding direct competition in existing
domains, i.e. doing new things, through exploring new less contended areas with innovations
and developing new capabilities (Porter, 1980; Ghemawat and Ricart i Costa, 1993; Jansen et al.,
2006). March (1991) captured this in his concepts of exploration and exploitation, defining the
exploitation of existing capabilities and the exploration of new opportunities as the central
learning mechanism by which organizations adapt to their environment9.
Exploitation actions. Exploiting processes have been translated into business activities such as
the incremental improvement of current capabilities, processes, and technologies, as well as
9 Though learning processes are endogenous to the firm and observed actions by definition are external to the
organizations they may, following arguments by Barnett and Hansen (1996), be best viewed as the visible extensions of firm’s internal learning processes. Organizational search is evoked from poor performance, potentially brought on by competitive intensity. Learning attempts are ultimately manifested in actions tested in the market, i.e. in competitive interaction, which in turn affects competitors experienced performance for one thing, and for the other dependent on if the outcome is satisfactory or unsatisfactory determines the focal firms need to carry on searching (exploiting) or broaden its search parameter (exploring).
214
rationalizing and reducing costs (Lewin et al., 1999; Anand et al., 2009). The action outcomes of
such competitive actions can be embedded in the organizations targets as specific goals (Lewin
et al., 1999). Investment in machinery, equipment as well as the processes with which these are
operating has been argued to be the rudimentary approach for maximizing return to current
knowledge in production intense industries (McGahan, 2004; Ghosal and Nair-Reichert, 2009).
Furthermore, process innovation has similar implications for productivity and efficiency
leading firms to improve on current ways of doing things (McGahan and Silverman, 2001).
Accordingly, competitive actions such as (1) investments in new machinery or equipment,
machinery rebuild, upgrade and modifications, as well as (2) similar actions at a larger scale,
namely investing in new mills and factories, and (3) process innovations can be seen as
exploitation actions.
Exploration actions. An innovation is defined as the development, production and launch of
new products or services as well as the communication thereof (Kim and Pennings, 2009).
Innovations have been contended to be the underlying force driving strategic and industrial
evolution through introducing variety and disrupting existing market paradigms, inasmuch as
being analogous to the definition of exploratory processes (Schumpeter, 1934; Porter, 1980;
March, 1991; Brown and Eisenhardt, 1997). Hence, the term exploration actions has previously
been attached to competitive actions such as (1) launching new innovations or (2) aiming at
developing (or successfully developing) new innovations and novel knowledge (Greve, 1998;
Koza and Lewin, 1998; Vermeulen and Barkema, 2001; Greve, 2007; Anand et al., 2009).
Competitive action research has examined product innovations mainly by, including the
introduction, unveiling and roll out of new products (Ferrier et al., 2002). However, increased
search and experimentation activities search, capture the total organizational focus on
exploration more than the mere successful launch of innovations, as the outcomes of
exploration activity is risky and unknown, and thus often leads to failed efforts (Katila and
Ahuja, 2002; He and Wong, 2004). In other words, observable product launches do not fully
represent innovative efforts. To address the issue, some empirical examination of exploration
search has encompassed intensifying and diversifying research and development investments
as well as increased innovation efforts (Koza and Lewin, 1998). Henceforth, exploitation action
and exploration actions will be applied in the meaning of competitive actions that are
exploitative and explorative respectively.
215
2.4 Characteristics of exploitation and exploration
Both processes in the twin concept have been argued to be essential for firm success. In the
words of March: long term survival is dependent on an organizations ability to “engage enough
in exploitation to ensure it’s the organizations current viability and enough in exploration to
ensure its future viability” (1991: 105). Hence, firms need to reach a balance between the right
degree of exploration and exploitation activity. Focusing solely, or excessively, on exploration
leads to “too many undeveloped ideas and too little distinctive competence” (March, 1990:105).
On the other hand, exploitation on the expense of exploration can ossify. The organizational
performance (and ultimately survival) in the long term is thus threatened, as the organization
continues to refine capabilities, resources and knowledge that are gradually becoming obsolete
or non-essential (Uotila et al., 2009). In the short run a focus on exploitation may not be
detrimental, on the contrary it might allow the firm to outcompete rivals and maximize returns
from current capabilities (March, 1991). However, excessive focus on exploitation reduces the
organizations ability to find new opportunities or adapt to environmental changes (Benner &
Tushman, 2002).
As stated by Teece, Pisano and Shuen (1997) a firm’s ability to compete over time may lie in its
ability both to integrate and build upon its current competences while at the same time
developing fundamentally new capabilities. However, these business activities compete for the
same scarce firm resources, for e.g. funds or managerial attention (Levinthal and March, 1993;
Uotila et al., 2009). Moreover, a balance has been argued as difficult as managers are biased for
exploitation (Lewin et al., 1999), both action types are self reinforcing (Holmqvist, 2004; Gupta
et al., 2006), and they require widely different organizational capabilities, routines and
mindsets (Nelson and Winter, 1982).
Moreover, exploitation actions capitalize on fairly certain and proximate revenue streams
(March, 1991; Lewin et al., 1999; Anand et al., 2009), while the performance outcomes related to
exploration activities are both distant and uncertain. The outcome of, for instance, capacity
increasing actions can often be exactly planned and their impacts on costs assessed, and they
are seen in the short term, as the returns from for e.g. increasing capacity are all but
simultaneous to that capacity coming effectively online (Ghosal and Nair-Reichert, 2009). In
contrast, the future returns of launched innovations, for example, are uncertain inasmuch as
resulting demand projections are unreliable (Anand et al., 2009; Griffin, 1997), and even more
so the outcome of investments in early R&D projects.
216
Exploitation is hence associated with incremental improvements and low variance of these
returns, while exploration in turn increases the variance of expected returns (March, 1991;
Lewin et al., 1999). Hence, exploitation is likely to maintain or at best increment the previous
level of performance, while the variation in performance associated with exploration means
that outcomes from exploration can be either high above or far below current returns.
2.5 Effects on exploitation and exploration on competitive intensity
When engaging in exploitation, firms act and respond in existing domains aiming to match and
neutralize any advantage gained by competitors (Schumpeter, 1934; Porter, 1980; Kim and
Mauborgne, 1999). Exploitation, as previously outlined, allows the firm to compete more cost
effectively, but it does not expand the market base for which it competes (Vermeulen and
Barkema, 2001; Anand et al., 2009). Hence, as available market resources remain unchanged
gains from exploitation come only at the expense of competitors. As not responding to
competitors’ incremental improvement actions poses a threat to firm performance there is an
incentive to respond in order not to be outcompeted in the short term (Ferrier, 2001; Chen et
al., 2007). Moreover, as exploitation actions solely targets existing domains, competitors are
likely to become very aware of any exploitation move (Miller and Chen, 1996a). Also, the
relative certainty and immediateness of the outcome of an exploitation action leads to
increased awareness as managers have been found to react more to close than to distant threats
(Hambrick and D’Aveni, 1988).
Innovation, and other exploration action, on the other hand, has been described as
sidestepping involvement in direct competition (Kim and Mabourgne, 1999, 2005), and as a
non-threatening move in general (Porter, 1980). Although to some extent rivalrous behavior,
exploration can create new strategic assets through expanding markets, or introducing new
technology and know-how; which may be beneficial for long term survival of the industry in
general (McGahan, 2004; Mentzel and Fornahl, 2009; Kim and Penning, 1999). Further, even if
markets remain unexpanded, the degree of differentiation in an industry, an outcome of
innovations, is argued to increase competitive barriers through resulting customer loyalty and
increased customer switching costs (Jansen et al., 2006). Successful differentiation acts as a
mobility barrier, shielding from competition on cost/price to the extent that it creates
customer switching costs allowing possible price premiums (Porter, 1980).
As exploratory activities are characterized by a high degree of uncertainty in outcomes as well
as mostly long term effects, they do not represent direct materialized competitive threats
217
(Anand et al., 2009). With any innovative effort there are doubts about their potential benefits
due to technical uncertainties as well as to whether there exists a sufficient market for the
products at a sufficient price (Kim and Pennings, 2009). Even when launched, innovative
products have been found to generate uncertainty in the market leaving firms doubtful if and
how to respond (Tushman and Anderson, 1986; D’Aveni, 1994). Faced with uncertainty
competitors might, instead of responding, employ a wait and see approach to if an innovations
is able to break commercially (Banbury and Mitchell, 1995; Kim and Pennings, 2009).
The possibility for a firm to contest the different actions also varies. Mainly, this is because of
the difference in the ease of the imitation of the action (Barney, 1991). Exploitation actions are
mostly imitable, as firms in the same industry poses similar resources, capabilities and routines
(Porter, 1985; Miller and Shamsie, 1996; Chen, 1996), and as exploitation action only involve the
extension of the current knowledge base (March, 1991). Hence, any exploitation action can be
responded to and they are thus unlikely to be the source of long term competitive advantage.
In contrast, exploratory actions are the outcome of experiential search generating novel
knowledge and capabilities beyond those currently held. The capability to respond to
exploration actions is thus limited as there is ambiguity both in the capabilities needed for the
actions and the process of generating such capabilities (Barney, 1991; Teece et al., 1997). In
other cases, competitors’ innovations are even protected by proprietary rights (Teece, 1986).
Hence, rivals may simply lack the capabilities to respond, thus withstanding retaliation. Not
surprisingly then, Caves and Ghemawat (1992) found that differences in differentiation played a
significant role in explaining intraindustry superior performance over the long term.
Table 1 above summarizes the outlined theoretical arguments regarding exploration and
exploitation of significance in a competitive context. The conclusion is that, exploitation
actions can, in the words of D’Aveni (1994), be seen as direct accelerators of competition while
exploration actions are unlikely to exert much pressure, and hence not affect competitive
intensity. Of paramount importance is also the difference in risk and proximity of returns
relating to exploration and exploitation, as well as the organizational tendency to favor
exploitation to exploration. Exploration is essentially riskier and has returns more far off in the
future than exploitative actions. Keeping this in mind we proceed to examine and theorize on
the different effects of competitive intensity on firm exploitation and exploration actions.
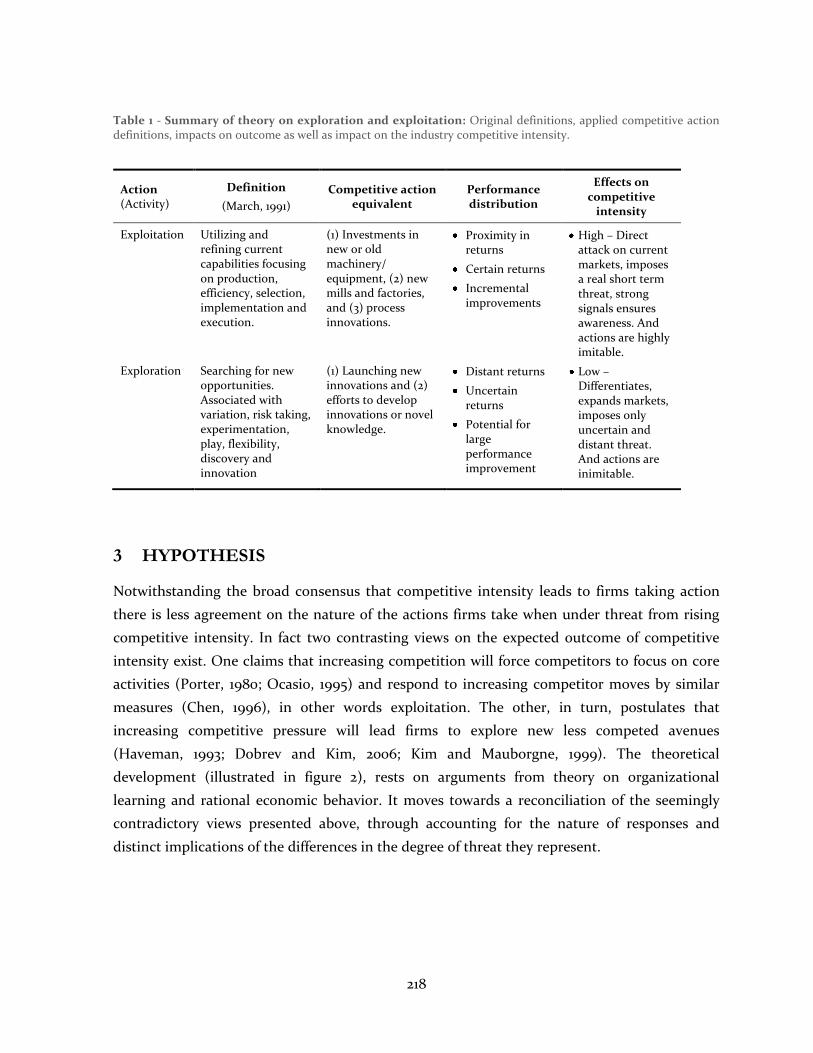
218
Table 1 - Summary of theory on exploration and exploitation: Original definitions, applied competitive action definitions, impacts on outcome as well as impact on the industry competitive intensity.
Action (Activity)
Definition
(March, 1991)
Competitive action equivalent
Performance distribution
Effects on competitive
intensity
Exploitation Utilizing and refining current capabilities focusing on production, efficiency, selection, implementation and execution.
(1) Investments in new or old machinery/ equipment, (2) new mills and factories, and (3) process innovations.
Proximity in returns
Certain returns
Incremental improvements
High – Direct attack on current markets, imposes a real short term threat, strong signals ensures awareness. And actions are highly imitable.
Exploration Searching for new opportunities. Associated with variation, risk taking, experimentation, play, flexibility, discovery and innovation
(1) Launching new innovations and (2) efforts to develop innovations or novel knowledge.
Distant returns
Uncertain returns
Potential for large performance improvement
Low – Differentiates, expands markets, imposes only uncertain and distant threat. And actions are inimitable.
3 HYPOTHESIS
Notwithstanding the broad consensus that competitive intensity leads to firms taking action
there is less agreement on the nature of the actions firms take when under threat from rising
competitive intensity. In fact two contrasting views on the expected outcome of competitive
intensity exist. One claims that increasing competition will force competitors to focus on core
activities (Porter, 1980; Ocasio, 1995) and respond to increasing competitor moves by similar
measures (Chen, 1996), in other words exploitation. The other, in turn, postulates that
increasing competitive pressure will lead firms to explore new less competed avenues
(Haveman, 1993; Dobrev and Kim, 2006; Kim and Mauborgne, 1999). The theoretical
development (illustrated in figure 2), rests on arguments from theory on organizational
learning and rational economic behavior. It moves towards a reconciliation of the seemingly
contradictory views presented above, through accounting for the nature of responses and
distinct implications of the differences in the degree of threat they represent.
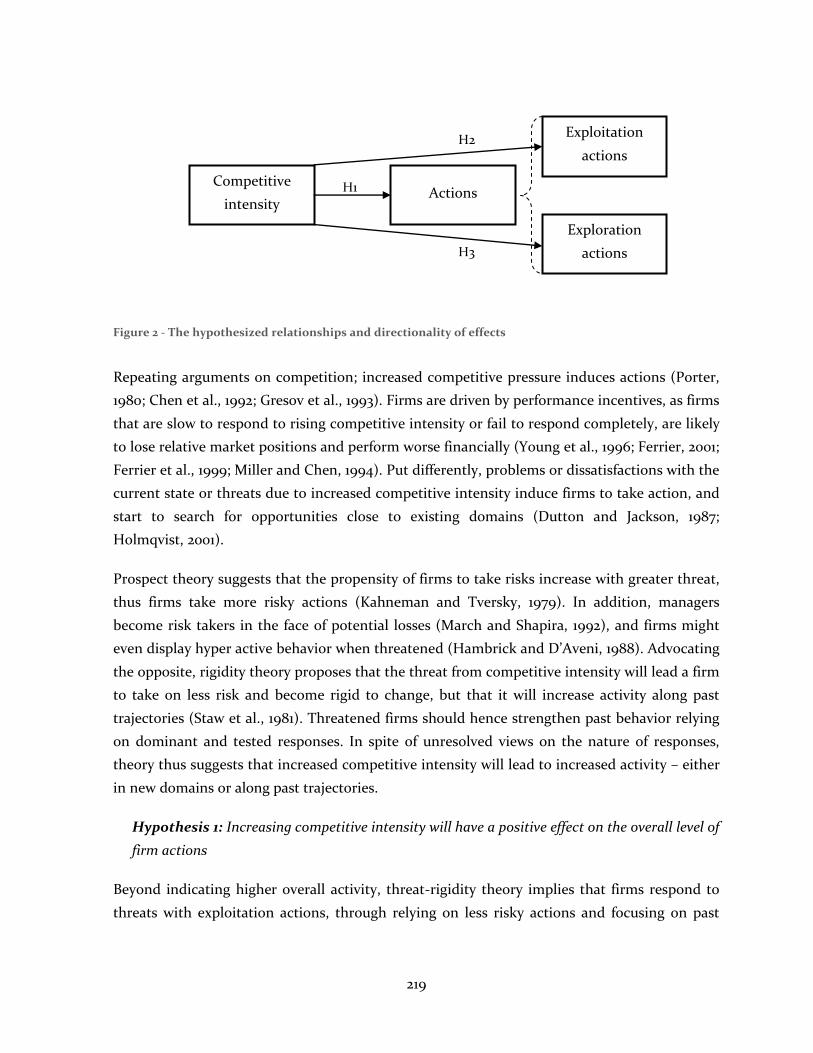
219
Repeating arguments on competition; increased competitive pressure induces actions (Porter,
1980; Chen et al., 1992; Gresov et al., 1993). Firms are driven by performance incentives, as firms
that are slow to respond to rising competitive intensity or fail to respond completely, are likely
to lose relative market positions and perform worse financially (Young et al., 1996; Ferrier, 2001;
Ferrier et al., 1999; Miller and Chen, 1994). Put differently, problems or dissatisfactions with the
current state or threats due to increased competitive intensity induce firms to take action, and
start to search for opportunities close to existing domains (Dutton and Jackson, 1987;
Holmqvist, 2001).
Prospect theory suggests that the propensity of firms to take risks increase with greater threat,
thus firms take more risky actions (Kahneman and Tversky, 1979). In addition, managers
become risk takers in the face of potential losses (March and Shapira, 1992), and firms might
even display hyper active behavior when threatened (Hambrick and D’Aveni, 1988). Advocating
the opposite, rigidity theory proposes that the threat from competitive intensity will lead a firm
to take on less risk and become rigid to change, but that it will increase activity along past
trajectories (Staw et al., 1981). Threatened firms should hence strengthen past behavior relying
on dominant and tested responses. In spite of unresolved views on the nature of responses,
theory thus suggests that increased competitive intensity will lead to increased activity – either
in new domains or along past trajectories.
Hypothesis 1: Increasing competitive intensity will have a positive effect on the overall level of
firm actions
Beyond indicating higher overall activity, threat-rigidity theory implies that firms respond to
threats with exploitation actions, through relying on less risky actions and focusing on past
H3
Competitive
intensity Actions
Exploitation
actions
Exploration
actions
H1
H2
Figure 2 - The hypothesized relationships and directionality of effects
220
strengths. According to theory on competition, increased competition and threat has likewise
been argued to lead to focus on core activities (Porter, 1980; Zammuto and Cameron, 1985;
Harrigan and Porter, 1983; Prahalad and Hamel, 1990), cost efficiency (Singh, 1986;
Castrogiovanni, 1991), short term competitiveness (Cameron, Kim and Whetten, 1987; Lumpkin
and Dess, 2001), incremental adaption (DiMaggio and Powell, 1983), risk aversion and
skepticism about noncore activities (Cameron, Kim and Whetten, 1987; Walsh, 1995). The
underpinning argument is that increased competitive intensity is a direct threat on the firm’s
resource domain and failing to become competitive in the short term has clear and immediate
consequences; leading to poor performance and even reducing slack resources that can be used
for exploration and long term success.
Exploitation is hence the likely first response to competitive threat as it is associated with
reliable and quick results (March, 1991), which are preferred by managers (Lewin et al., 1999;
Beckman, 2006). High competitive intensity will further divert managerial attention away from
exploring other opportunities and more towards competing effectively in chosen domains as
strategy becomes more like fire-fighting: dictated by the need to focus on immediate issues
(Miller and Chen, 1994; Nadkarni and Barr, 2008). Furthermore, managerial perception has also
been argued to be biased to cling to heuristics of past success in the face of a changed
environment (Lant, 1992) and Ocasio (1995) found that managers faced with threats were more
likely to act within their existing domain.
However, as competitive intensity increases, at some point exploitation actions will start to
become a rather unattractive response. The higher competitive intensity erodes competitive
advantage of imitable moves and shortens the sustainability of above normal returns (D’Aveni,
1994). The cost of undertaking exploitative actions will still be the same as in the low intense
environment. Then, at some extreme the cost of engaging in an action will outweigh the
potential benefit that can be gained, as competition is likely to nullify any gains in high rivalry
(D’Aveni, 1994). Given that expected payoff to an action is a strong predictor of competitive
response (Grimm and Smith, 1997), high competitive intensity thus reduces the profit incentive
underlying exploitation action. Consequently, firms will start to lessen the degree to which they
engage in direct competitive behavior, i.e. exploitation action. Indeed, firm tend to refrain from
further action once the threat of to hard retaliation becomes apparent (Anand et al., 2009;
Baum and Korn, 1999; Chen, 1996).
Moreover, exploitation actions result in incremental improvements and increased reliability in
the expected mean performance of the firm in comparison to rivals (March, 1991). However,
221
increased rivalry reduces the industry performance mean, thus when competition becomes
more intense, efforts that only lead to higher reliability of achieving the industry mean return
become less attractive. In sum, firms are likely to initially respond to increased competitive
intensity by increasing their exploitation actions. However, as competitive intensity increases
further, the marginal benefits of exploitation actions is eroded to a point where they no longer
offset their costs, potentially even having negative returns, and firms become likely to avoid
further exploitation action. Ergo,
Hypothesis 2 Increased competitive intensity will have an inverted curvilinear relationship
(inverted U-shape) with firm exploitation actions
Given low levels of competitive intensity firms can afford to focus less on being efficient short
term. As a result firms tend to allocate more resources to experiment with various ways of
operating and delivering value (Klepper, 1996). Accordingly, Schumpeter (1950) argued that
reduced rivalry actually promotes innovation. This he attributed to the fact that innovation
needs slack in the form of high cash flows as innovation investments are sizeable and their
returns uncertain. Firms hence need large cash buffers and low threat to their core business in
order to engage in exploration action. The propensity of firms to engage in exploration actions
may thus be higher given low competitive intensity.
When competitive intensity starts to increase, the tendency for firms to engage in exploration
actions can be argued to decrease for several reasons. First, as explicated earlier, increasing
competitive intensity shifts industry and firm focus towards short term survival, hence actions
enhancing efficiency, namely exploitation action. A firm cannot survive in the long run, if it
fails to survive in each of the short runs along the way. Second, attempting change through
exploration strategies is inherently risky and gains accrue only in the long term (Hannan and
Freeman, 1984; March, 1991). As managers are generally risk-averse (Singh, 1986; Levitt and
March, 1988), they tend to avoid introducing innovations as long as other competitive moves
still secure satisfactory performance levels. Owing to this, as well as the scarceness of firm
resources, and the difficulties described previously in pursuing exploitation and exploration
simultaneously, the suggested increase in exploitation with rising competitive intensity will
limit the amount of exploration firms engage in.
However, as competitive intensity increases further, the potential benefits from exploring
become increasingly attractive in comparison to exploitation actions. The returns to
exploitation become obsolete, when firms are trapped in endless circles of efficiency battles
(Levinthal and March, 1993; Kim and Mauborgne, 2005). Hence, exploitative action can no
222
longer be the source of long nor short term advantage and managers need to expand their
search into new less contended product/market areas (Bowman, 1982; Lewin et al., 1999; Uotila
et al., 2009). Indeed, the only way to escape decreasing margins might be to develop new
products or services (Kim and Mauborgne, 2005; Jansen et al., 2006). Furthermore, exploratory
actions are highly inimitable and can, contrary to exploitation actions, be effective in
competitive markets as they allow firms to differentiate from the rivals creating barriers to
competition. Hence, exploration can result in sustainable and above average returns even when
competition is high (D’Aveni, 1994; Lewin et al., 1999). Lastly, exploratory action having a low
effect on competitive intensity, contrary to exploitation, might not risk increasing already high
competitive intensity, which if increased would have grave consequences for industry returns.
In conclusion, exploration actions prosper in low competitive intensity but become crowded
out by exploitation as intensity escalates. However, exploration generates more sustainable
advantages than exploitation; hence, its returns become increasingly attractive as the
competitive intensity increases in an industry. Exploration, although containing higher risk,
generates in comparison higher expected returns as the returns to exploitation actions become
more short-lived. Thus, the probability of firms taking exploration action increases when
competitive intensity increases further. Ceteris paribus,
Hypothesis 3: Increased competitive intensity will have a curvilinear relationship (U-
shaped) with firm exploration actions
From the theory development it is evident that increasing competition has mirrored effects on
exploration and exploitation, which is attributable to their opposite performance distributions
and effects on competition. Modeling exploration and exploitation as inversely related to
competitive intensity satisfies partially the theorized constraints of exploitation and
exploration, i.e. the requirement of balance.
4 THE EMPIRICAL SETTING – THE PAPER INDUSTRY 1989-2009
4.1 Survey of the paper industry
The paper industry (often termed the pulp and paper industry) refers to organizations that
manufacture various paper and board products from pulp. The industry has traditionally
accounted for significant amounts of employment and capital investments on both sides of the
Atlantic (Ghosal and Nair-Reichert, 2009). In 2005, paper industry provided direct employment
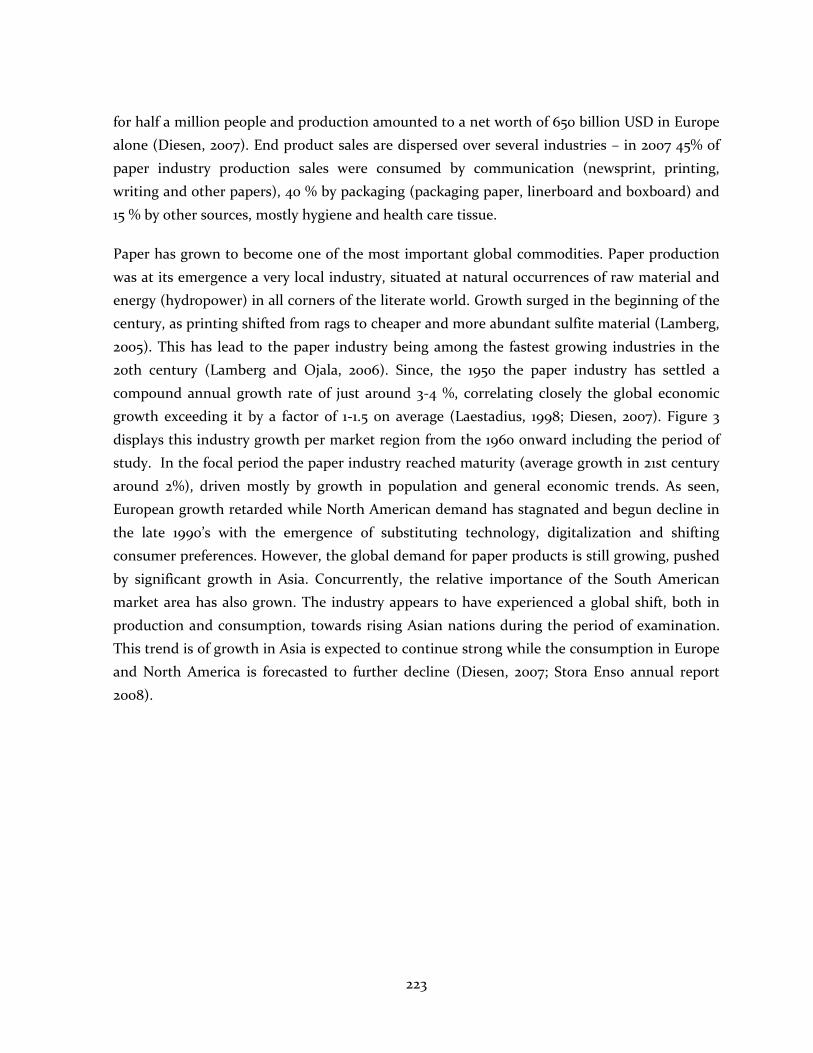
223
for half a million people and production amounted to a net worth of 650 billion USD in Europe
alone (Diesen, 2007). End product sales are dispersed over several industries – in 2007 45% of
paper industry production sales were consumed by communication (newsprint, printing,
writing and other papers), 40 % by packaging (packaging paper, linerboard and boxboard) and
15 % by other sources, mostly hygiene and health care tissue.
Paper has grown to become one of the most important global commodities. Paper production
was at its emergence a very local industry, situated at natural occurrences of raw material and
energy (hydropower) in all corners of the literate world. Growth surged in the beginning of the
century, as printing shifted from rags to cheaper and more abundant sulfite material (Lamberg,
2005). This has lead to the paper industry being among the fastest growing industries in the
20th century (Lamberg and Ojala, 2006). Since, the 1950 the paper industry has settled a
compound annual growth rate of just around 3-4 %, correlating closely the global economic
growth exceeding it by a factor of 1-1.5 on average (Laestadius, 1998; Diesen, 2007). Figure 3
displays this industry growth per market region from the 1960 onward including the period of
study. In the focal period the paper industry reached maturity (average growth in 21st century
around 2%), driven mostly by growth in population and general economic trends. As seen,
European growth retarded while North American demand has stagnated and begun decline in
the late 1990’s with the emergence of substituting technology, digitalization and shifting
consumer preferences. However, the global demand for paper products is still growing, pushed
by significant growth in Asia. Concurrently, the relative importance of the South American
market area has also grown. The industry appears to have experienced a global shift, both in
production and consumption, towards rising Asian nations during the period of examination.
This trend is of growth in Asia is expected to continue strong while the consumption in Europe
and North America is forecasted to further decline (Diesen, 2007; Stora Enso annual report
2008).
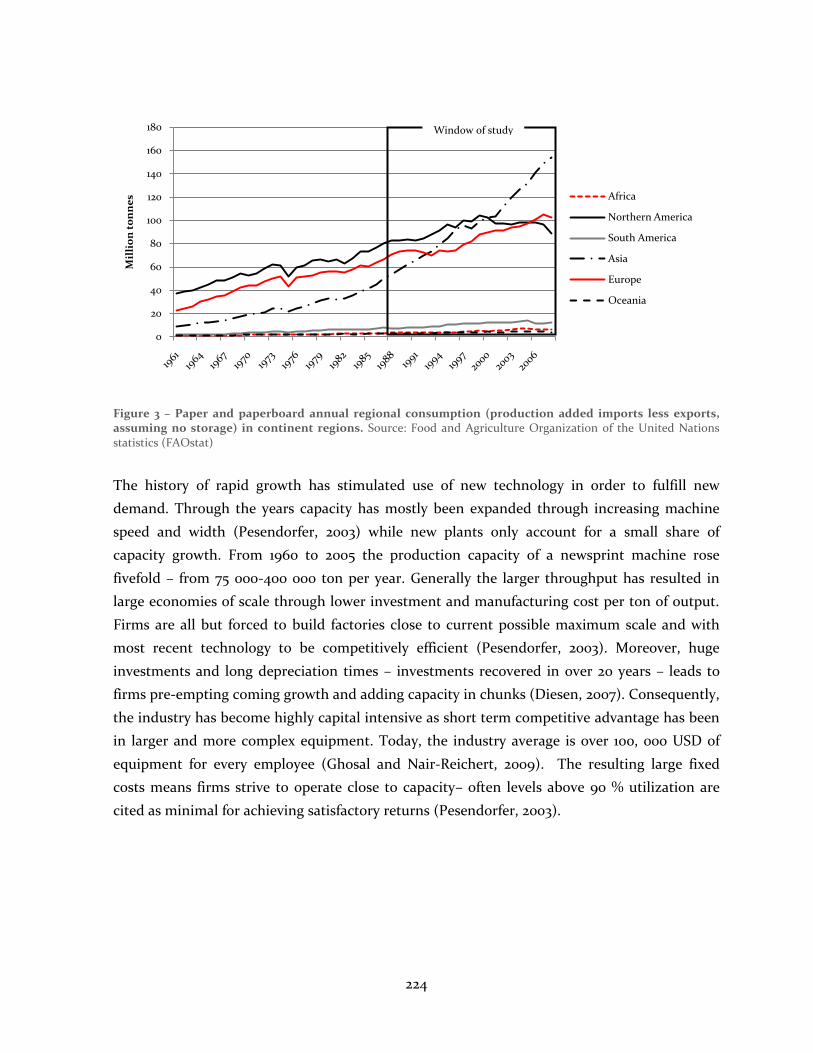
224
Figure 3 – Paper and paperboard annual regional consumption (production added imports less exports, assuming no storage) in continent regions. Source: Food and Agriculture Organization of the United Nations statistics (FAOstat)
The history of rapid growth has stimulated use of new technology in order to fulfill new
demand. Through the years capacity has mostly been expanded through increasing machine
speed and width (Pesendorfer, 2003) while new plants only account for a small share of
capacity growth. From 1960 to 2005 the production capacity of a newsprint machine rose
fivefold – from 75 000-400 000 ton per year. Generally the larger throughput has resulted in
large economies of scale through lower investment and manufacturing cost per ton of output.
Firms are all but forced to build factories close to current possible maximum scale and with
most recent technology to be competitively efficient (Pesendorfer, 2003). Moreover, huge
investments and long depreciation times – investments recovered in over 20 years – leads to
firms pre-empting coming growth and adding capacity in chunks (Diesen, 2007). Consequently,
the industry has become highly capital intensive as short term competitive advantage has been
in larger and more complex equipment. Today, the industry average is over 100, 000 USD of
equipment for every employee (Ghosal and Nair-Reichert, 2009). The resulting large fixed
costs means firms strive to operate close to capacity– often levels above 90 % utilization are
cited as minimal for achieving satisfactory returns (Pesendorfer, 2003).
0
20
40
60
80
100
120
140
160
180M
illi
on
to
nn
es Africa
Northern America
South America
Asia
Europe
Oceania
Window of study
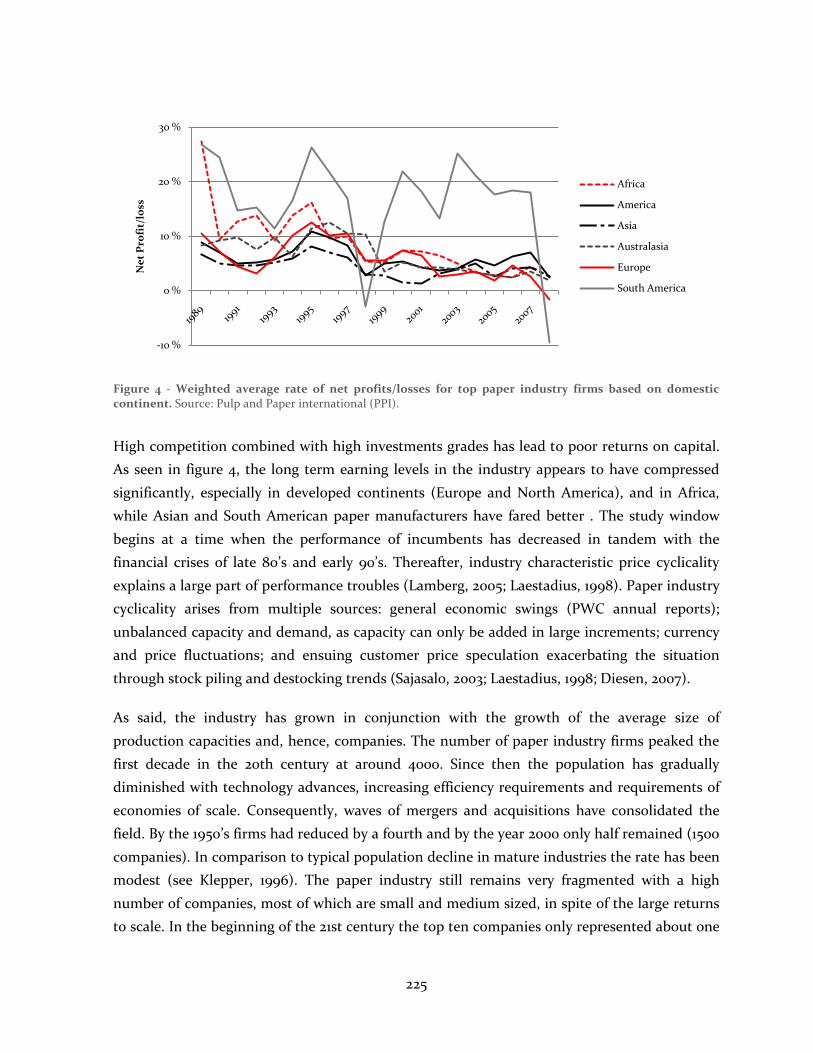
225
Figure 4 - Weighted average rate of net profits/losses for top paper industry firms based on domestic continent. Source: Pulp and Paper international (PPI).
High competition combined with high investments grades has lead to poor returns on capital.
As seen in figure 4, the long term earning levels in the industry appears to have compressed
significantly, especially in developed continents (Europe and North America), and in Africa,
while Asian and South American paper manufacturers have fared better . The study window
begins at a time when the performance of incumbents has decreased in tandem with the
financial crises of late 80’s and early 90’s. Thereafter, industry characteristic price cyclicality
explains a large part of performance troubles (Lamberg, 2005; Laestadius, 1998). Paper industry
cyclicality arises from multiple sources: general economic swings (PWC annual reports);
unbalanced capacity and demand, as capacity can only be added in large increments; currency
and price fluctuations; and ensuing customer price speculation exacerbating the situation
through stock piling and destocking trends (Sajasalo, 2003; Laestadius, 1998; Diesen, 2007).
As said, the industry has grown in conjunction with the growth of the average size of
production capacities and, hence, companies. The number of paper industry firms peaked the
first decade in the 20th century at around 4000. Since then the population has gradually
diminished with technology advances, increasing efficiency requirements and requirements of
economies of scale. Consequently, waves of mergers and acquisitions have consolidated the
field. By the 1950’s firms had reduced by a fourth and by the year 2000 only half remained (1500
companies). In comparison to typical population decline in mature industries the rate has been
modest (see Klepper, 1996). The paper industry still remains very fragmented with a high
number of companies, most of which are small and medium sized, in spite of the large returns
to scale. In the beginning of the 21st century the top ten companies only represented about one
-10 %
0 %
10 %
20 %
30 %N
et
Pro
fit/
loss
Africa
America
Asia
Australasia
Europe
South America
226
fourth of the top 1000 companies aggregated production. De facto, as a result of a rise in Asian
producers, the industry is no more concentrated today than in the 1950’s (Lamberg and Ojala,
2006).
Traditionally a globalization ratio in the paper industry has been the driven by centrality of
nearness to a raw material base and hydropower as well as strong regional protectionism. In
spite of new technology allowing recycled paper as material making new locations feasible, as
well as the opening up of markets, standards and the reduced costs for freights this still
remains the case (Ghosal and Nair-Reichert, 2009). Internationalization has been limited to
geographically close domains with few expansion attempts beyond continent boarders
(Sajasalo, 2003; Diesen, 2007). In 2000 only ten percent of companies had production facilities
abroad (Lamberg and Ojala, 2006). And, this percentage was substantially lower at the start of
the observation period (in 1974 it was around 2 %). More than local production, the trade flows
between regions is still marginal. Hence, companies are still largely local - of the ten largest
producers all operate at over 80% in domestic continental regions from 1989-2008 (Diesen,
2007).
In conclusion, the paper industry provides a suitable research site owing to its stable and
interlinked environment, high activity and regional separation. First, both the structure – low
levels of growth, commodity product, high costs of unused capacity, high capital intensity,
existence of scale economies, fragmentation – and the low performance under the focal period
of study, indicate a high mutual dependence between incumbents. Competitive actions and
reactions can thus be studied as industry incumbents are highly interlinked, i.e. they feel the
pressure of each others’ moves. Second, the time interval of 1989-2008 is further especially
fruitful as it represents time period of high activity of paper industry firms (Lamberg and Ojala,
2006). Third, the high regional separation offers a possibility to analyze an all but identical
industry setting over separate regional markets.
4.2 Competition in the paper industry
Traditionally competition within the paper industry has focused on efficient production,
namely exploitation, and technologically has evolved incrementally rather than by radical
shifts. Firms have employed a two-pronged strategy in exploiting their capabilities to the fullest
and reaching scale (1) investments in modernization, and (2) mergers and acquisitions (M&A)
actions.
227
Typically this has implied huge investments in production technology; mostly on larger and
more efficient machines in order to achieve scale economies and lower production costs
(Laestadius, 1998; Lamberg and Ojala, 2006). Giving evidence of the importance of such
exploitation action is the constant evolution of larger, faster and higher paper quality machines
(read less defects). Since the 1960 there existing processes have also been improved through
applying automation and control processes (Laestadius, 1998), and more recently the
introduction of information systems and energy conserving solutions, making processes more
efficient (Diesen, 2007). Exploitation of current capabilities in such modernizations and
incremental efficiency improvements are of paramount importance in the paper industry for
achieving cost gains compounding to short term competitive advantage (Pesendorfer, 2003).
For instance American firms that refrained from investment in the mid 1990’s forecasting a
drop in demand have become trapped as they have similarly fallen behind European companies
in efficiency and grade concentration (Ghosal and Nair-Reichert, 2009). Yet, Lamberg (2005)
contend that little long term advantage had come from efficiency enhancing actions in the
paper industry. Moreover, the high focus on production capabilities and scale has been argued
to lead to overcapacity, and hence, to be the source behind poor performance in the industry
(Diesen, 2007).
Although breakthrough innovations and exploratory action are not the mainstay way of
competing in the industry, firms have throughout the years brought new grades, materials and
products to the market (Ghosal and Nair-Reichert, 2009). For e.g., innovations such as the
introduction of sulfate pulp replacing sulfite pulp; the innovation of machine coated papers;
and thermo and mechanical pulp innovations in recyclable paper recovery have been radical
from a competition viewpoint (Diesen, 2007). Whereas the common bulk commodities have
competed on price set by demand and supply – not production costs - specialty products (new
grades, materials or products) in the paper industry have competed on quality and attributes
(Diesen, 2007). The erosion of price premiums for specialty products has also been slow, for e.g.
coated paper has gradually become a bulk product but this took decades (Diesen, 2007). More
recently exploratory action has been taken in the introduction of bio-energy products,
biotechnology products, plastic-fiber mixing materials and eucalyptus as higher quality
material (Laestadius, 1998; PWC annual industry reports).
In sum, the nature of the paper industry is well documented and there is a basic understanding
of the effects of industry actions, however how and when such actions are employed remain
unanswered, which in part creates the motivation for this study.
228
5 METHODOLOGY
5.1 Sample
The sampling of firms was conducted using the following three criteria: (1) the firm is from the
paper industry, (2) the firm was one of the 100-150 largest companies in the years 1989-2009, (3)
pulp and paper made up more than 70 % of the firm sales.
The sample was constructed of the largest 100 paper industry firms, measured by sales of paper
and pulp in dollars, between the years 1989-2008 (before the year 2001 this list included the 150
largest firms). Industry and period suitability is discussed above. The non-random sampling
was chosen for both efficiency and analysis reasons. First, utilizing large firm data allowed for
effective gathering of firm-year financial and production data otherwise difficult to reconstruct.
Other sampling techniques would have restricted sample size and limited the quality of the
data. Second, the chosen sample covers over 70 % of global paper and pulp sales which makes
for a significantly broad scope of the whole industry. Further, the sampling was convenient for
the analysis as larger firms contribute the material part of industry actions (Chen and Miller,
1994; Lamberg, 2005) and the long time period permits discerning individual firm effects.
Following Rumelt (1974) only firms with over 70% of their business coming from the paper
industry are considered representative of the industry and have been included. These firms are
theorized to be sufficiently responsive to within industry changes and similar in structures,
cognition, hence, behavior (Chen, 1996). This allows for credible assessment of the impact of
industry specific factors.
This resulted in a sample of 1608 observations from 152 firms. However, the sample panel is
highly unbalanced. Most firms are present in the initial years 1990-1996, but there is slow panel
attrition throughout the study period, mainly ascribable to merger and acquisition activity but
also to randomly occurring bankruptcies. Entries are also present, as new companies form or
grow, appearing among the 100 largest industry companies. A minor part of the balance pattern
is due to omitted cases because of missing data, which results in firms having shorter time
spans. Listwise deletion was used for missing values at the start or end of the observation
period. In turn, data gaps in the middle of available firm-years were interpolated to take full use
of available information and avoid selection bias (Little, 1992).
229
5.2 Sources and collection methods
The data used was compiled and consolidated from several secondary data sources. Apart from
the main sources detailed below; firm annual reports, general industrial databases (Hoovers)
and investor information was utilized to search for missing and erroneous data points, as well
as firm incorporation dates.
The firms list, including financial and production items, for each sample year was collected
from the Paper and Pulp International (PPI) journals annual list of top 100 companies by paper
and pulp sales. PPI is a professional journal covering all areas of the industry and has been
previously applied as a reliable source by strategic management scholars (e.g. Ojala et al., 2006;
Ghosal and Nair-Reichert, 2009). The sourced data included paper and pulp sales, earnings,
total sales, employees and production quantities. The list incorporated both public and private
companies, but excluded companies for which no data was public in the measured year.
FAOstat, a statistics service provided by the United Nations, which offers longitudinal data on
exports, imports and production quantities for countries and regions by several paper industry
product categories, was used to collect market growth rates across regions.
Firm actions were gathered through the PIRA (Packaging, Paper, Printing and Publishing,
Imaging and Nonwovens Abstracts) database, a joint venture updated by industry analyst
companies. The database stores abstracts and main information from all published items
related to the paper industry in 1000 journals, newspapers, books, market reports, conference
proceedings, standards, and technical reports. Coverage is international and extends from 1975
to present including over 600 000 articles. To avoid duplicates because of using multiple
sources the database incorporates an automatic filter. Industry experts have attached
descriptors, article codes, publishing years and involved firm names to each abstract. The
descriptors are one or two-word indicators of the content of the news item. Usually abstract
descriptors include geographic region, business and nature of the event (e.g. Asia, paperboard,
new product or company takeover). Previously, the coverage of one main publication has been
standard procedure for event coding in competitive dynamics research (Chen et al., 1992;
Ferrier et al., 1999). The broader coverage of the PIRA database and significant overlap in the
news items reported suggests that the PIRA database is sufficient for valid collection of firm
actions.
The data from each source was linked using firm specific codes connected to company names.
Company name changes and alternative name forms were checked, confirming and manually
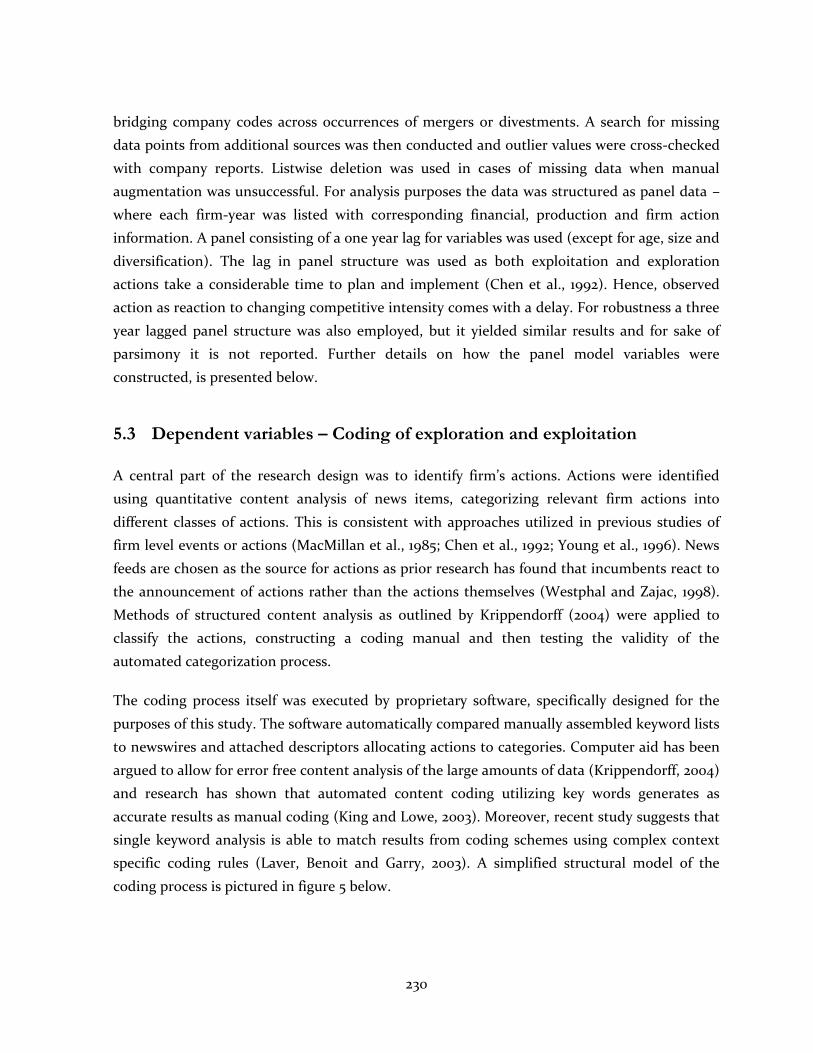
230
bridging company codes across occurrences of mergers or divestments. A search for missing
data points from additional sources was then conducted and outlier values were cross-checked
with company reports. Listwise deletion was used in cases of missing data when manual
augmentation was unsuccessful. For analysis purposes the data was structured as panel data –
where each firm-year was listed with corresponding financial, production and firm action
information. A panel consisting of a one year lag for variables was used (except for age, size and
diversification). The lag in panel structure was used as both exploitation and exploration
actions take a considerable time to plan and implement (Chen et al., 1992). Hence, observed
action as reaction to changing competitive intensity comes with a delay. For robustness a three
year lagged panel structure was also employed, but it yielded similar results and for sake of
parsimony it is not reported. Further details on how the panel model variables were
constructed, is presented below.
5.3 Dependent variables – Coding of exploration and exploitation
A central part of the research design was to identify firm’s actions. Actions were identified
using quantitative content analysis of news items, categorizing relevant firm actions into
different classes of actions. This is consistent with approaches utilized in previous studies of
firm level events or actions (MacMillan et al., 1985; Chen et al., 1992; Young et al., 1996). News
feeds are chosen as the source for actions as prior research has found that incumbents react to
the announcement of actions rather than the actions themselves (Westphal and Zajac, 1998).
Methods of structured content analysis as outlined by Krippendorff (2004) were applied to
classify the actions, constructing a coding manual and then testing the validity of the
automated categorization process.
The coding process itself was executed by proprietary software, specifically designed for the
purposes of this study. The software automatically compared manually assembled keyword lists
to newswires and attached descriptors allocating actions to categories. Computer aid has been
argued to allow for error free content analysis of the large amounts of data (Krippendorff, 2004)
and research has shown that automated content coding utilizing key words generates as
accurate results as manual coding (King and Lowe, 2003). Moreover, recent study suggests that
single keyword analysis is able to match results from coding schemes using complex context
specific coding rules (Laver, Benoit and Garry, 2003). A simplified structural model of the
coding process is pictured in figure 5 below.
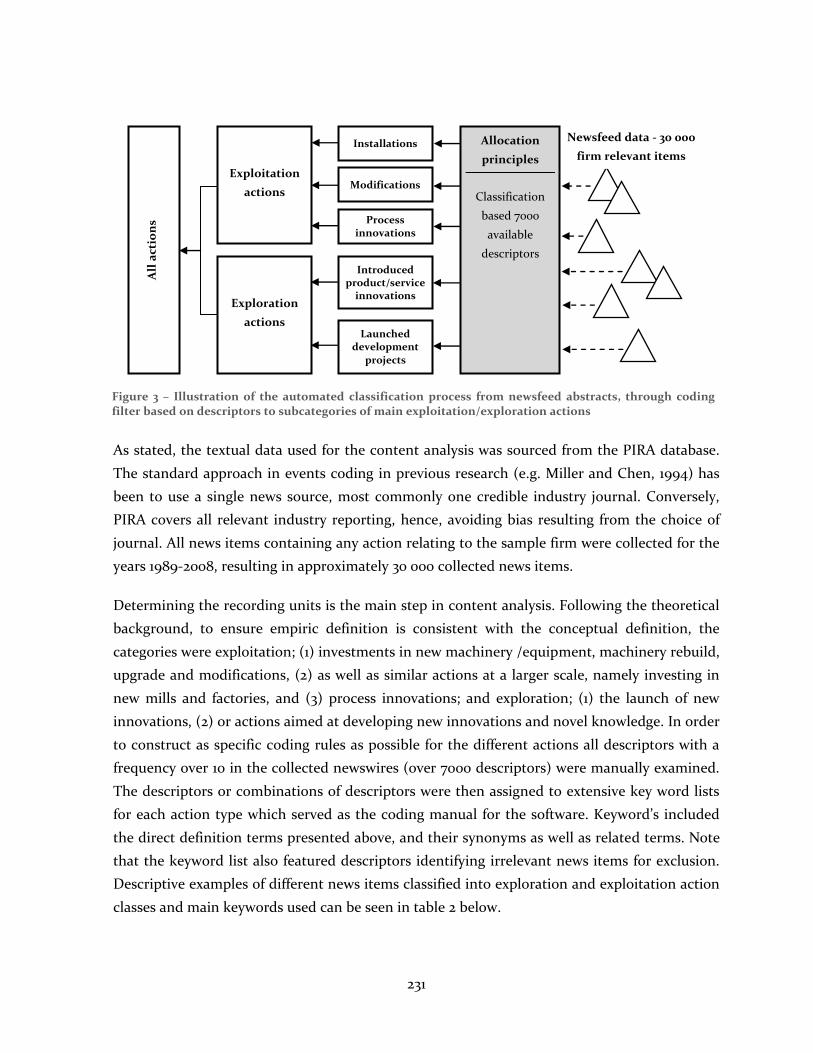
231
As stated, the textual data used for the content analysis was sourced from the PIRA database.
The standard approach in events coding in previous research (e.g. Miller and Chen, 1994) has
been to use a single news source, most commonly one credible industry journal. Conversely,
PIRA covers all relevant industry reporting, hence, avoiding bias resulting from the choice of
journal. All news items containing any action relating to the sample firm were collected for the
years 1989-2008, resulting in approximately 30 000 collected news items.
Determining the recording units is the main step in content analysis. Following the theoretical
background, to ensure empiric definition is consistent with the conceptual definition, the
categories were exploitation; (1) investments in new machinery /equipment, machinery rebuild,
upgrade and modifications, (2) as well as similar actions at a larger scale, namely investing in
new mills and factories, and (3) process innovations; and exploration; (1) the launch of new
innovations, (2) or actions aimed at developing new innovations and novel knowledge. In order
to construct as specific coding rules as possible for the different actions all descriptors with a
frequency over 10 in the collected newswires (over 7000 descriptors) were manually examined.
The descriptors or combinations of descriptors were then assigned to extensive key word lists
for each action type which served as the coding manual for the software. Keyword’s included
the direct definition terms presented above, and their synonyms as well as related terms. Note
that the keyword list also featured descriptors identifying irrelevant news items for exclusion.
Descriptive examples of different news items classified into exploration and exploitation action
classes and main keywords used can be seen in table 2 below.
All
act
ion
s
Exploitation
actions
Exploration
actions
Installations
Modifications
Process innovations
Introduced product/service
innovations
Launched development
projects
Allocation
principles
Classification
based 7000
available
descriptors
Newsfeed data - 30 000
firm relevant items
Figure 3 – Illustration of the automated classification process from newsfeed abstracts, through coding filter based on descriptors to subcategories of main exploitation/exploration actions
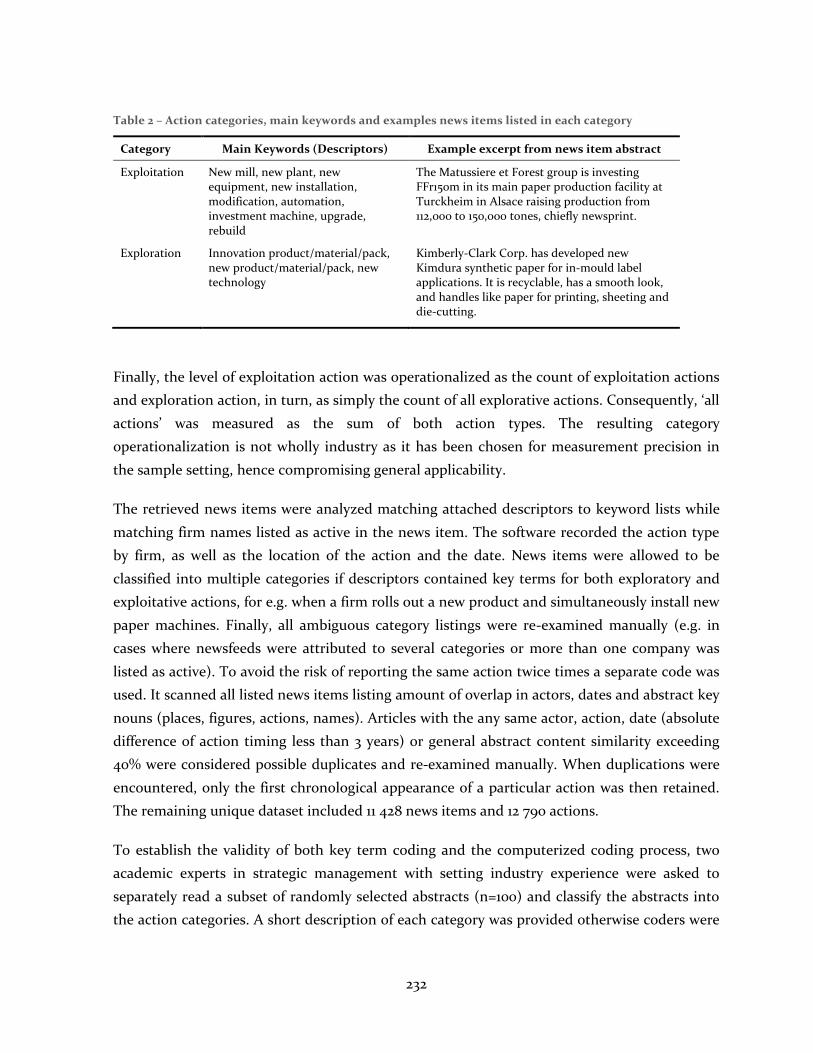
232
Table 2 – Action categories, main keywords and examples news items listed in each category
Category Main Keywords (Descriptors) Example excerpt from news item abstract
Exploitation New mill, new plant, new equipment, new installation, modification, automation, investment machine, upgrade, rebuild
The Matussiere et Forest group is investing FFr150m in its main paper production facility at Turckheim in Alsace raising production from 112,000 to 150,000 tones, chiefly newsprint.
Exploration Innovation product/material/pack, new product/material/pack, new technology
Kimberly-Clark Corp. has developed new Kimdura synthetic paper for in-mould label applications. It is recyclable, has a smooth look, and handles like paper for printing, sheeting and die-cutting.
Finally, the level of exploitation action was operationalized as the count of exploitation actions
and exploration action, in turn, as simply the count of all explorative actions. Consequently, ‘all
actions’ was measured as the sum of both action types. The resulting category
operationalization is not wholly industry as it has been chosen for measurement precision in
the sample setting, hence compromising general applicability.
The retrieved news items were analyzed matching attached descriptors to keyword lists while
matching firm names listed as active in the news item. The software recorded the action type
by firm, as well as the location of the action and the date. News items were allowed to be
classified into multiple categories if descriptors contained key terms for both exploratory and
exploitative actions, for e.g. when a firm rolls out a new product and simultaneously install new
paper machines. Finally, all ambiguous category listings were re-examined manually (e.g. in
cases where newsfeeds were attributed to several categories or more than one company was
listed as active). To avoid the risk of reporting the same action twice times a separate code was
used. It scanned all listed news items listing amount of overlap in actors, dates and abstract key
nouns (places, figures, actions, names). Articles with the any same actor, action, date (absolute
difference of action timing less than 3 years) or general abstract content similarity exceeding
40% were considered possible duplicates and re-examined manually. When duplications were
encountered, only the first chronological appearance of a particular action was then retained.
The remaining unique dataset included 11 428 news items and 12 790 actions.
To establish the validity of both key term coding and the computerized coding process, two
academic experts in strategic management with setting industry experience were asked to
separately read a subset of randomly selected abstracts (n=100) and classify the abstracts into
the action categories. A short description of each category was provided otherwise coders were
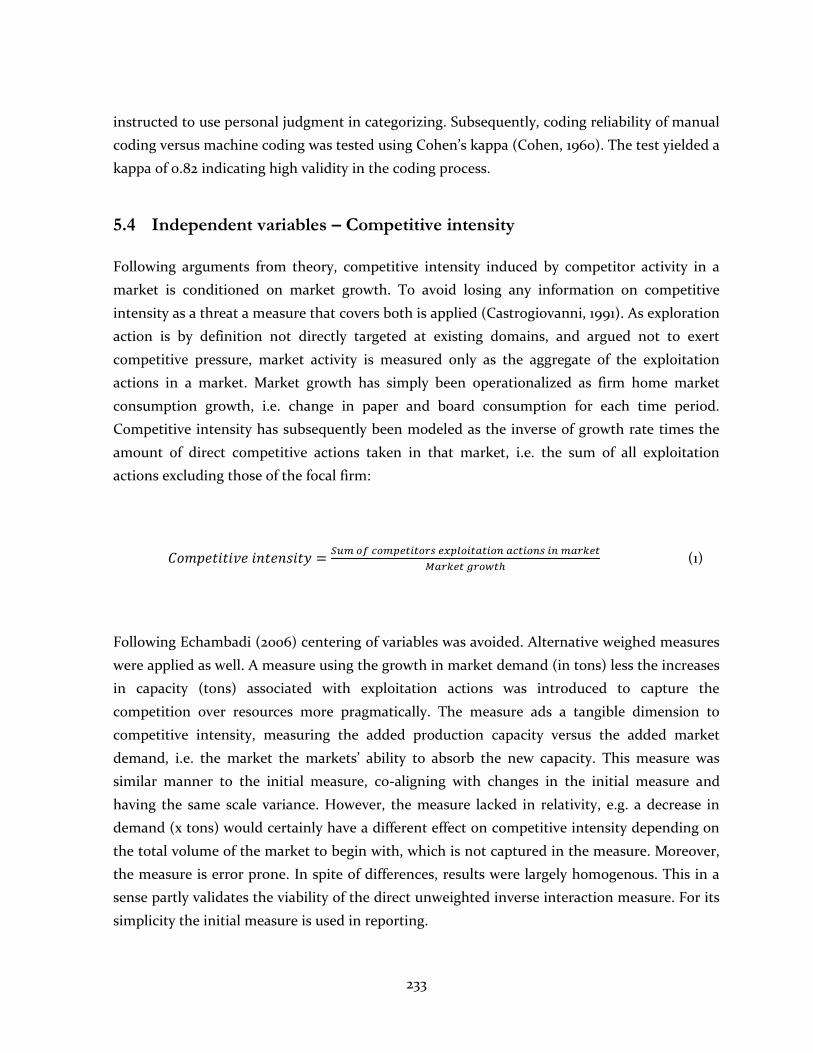
233
instructed to use personal judgment in categorizing. Subsequently, coding reliability of manual
coding versus machine coding was tested using Cohen’s kappa (Cohen, 1960). The test yielded a
kappa of 0.82 indicating high validity in the coding process.
5.4 Independent variables – Competitive intensity
Following arguments from theory, competitive intensity induced by competitor activity in a
market is conditioned on market growth. To avoid losing any information on competitive
intensity as a threat a measure that covers both is applied (Castrogiovanni, 1991). As exploration
action is by definition not directly targeted at existing domains, and argued not to exert
competitive pressure, market activity is measured only as the aggregate of the exploitation
actions in a market. Market growth has simply been operationalized as firm home market
consumption growth, i.e. change in paper and board consumption for each time period.
Competitive intensity has subsequently been modeled as the inverse of growth rate times the
amount of direct competitive actions taken in that market, i.e. the sum of all exploitation
actions excluding those of the focal firm:
(1)
Following Echambadi (2006) centering of variables was avoided. Alternative weighed measures
were applied as well. A measure using the growth in market demand (in tons) less the increases
in capacity (tons) associated with exploitation actions was introduced to capture the
competition over resources more pragmatically. The measure ads a tangible dimension to
competitive intensity, measuring the added production capacity versus the added market
demand, i.e. the market the markets’ ability to absorb the new capacity. This measure was
similar manner to the initial measure, co-aligning with changes in the initial measure and
having the same scale variance. However, the measure lacked in relativity, e.g. a decrease in
demand (x tons) would certainly have a different effect on competitive intensity depending on
the total volume of the market to begin with, which is not captured in the measure. Moreover,
the measure is error prone. In spite of differences, results were largely homogenous. This in a
sense partly validates the viability of the direct unweighted inverse interaction measure. For its
simplicity the initial measure is used in reporting.
234
To capture the curvilinear effects in the hypothesis a squared variant of the measure was
included. The competitive intensity variables have, as in similar research, been lagged as firm
actions require time to implement, due to planning, bureaucracy and general difficulties in
mounting the sufficient resources for response (Chen, 1996). An average of the competitive
intensity for the past three years was used as well as other lags (two, four etc.). The measures
yielded similar results as the lagged growth and are hence not reported.
5.5 Control variables
Several other factors have been identified to affect company actions (Lewin et al., 1999).
Accordingly, a baseline model to control for other hypothesized influencing effects is
developed. Adding sufficient control variables further justify the applicability of random effects
models, as firm heterogeneous effects are accounted for. Each control variable has been
included for at least one of the following reasons: (1) the variable has previously been found to
have a significant effect on company actions, (2) there is strong theoretical motivation
suggesting that the variable influences actions, or (3) the variable is strictly firm specific and
has potential in capturing firm specific effects. The educated reader may wish to skip to the
final list of included variables and their anticipated effects shown in table 3 at the end of this
sub-chapter.
First, firm size is controlled for as researchers have found that the proposed nature of response
(Anand et al., 2009), the propensity to act when faced with threats (Cyert and March, 1963;
Levinthal, 1991; Chen and Hambrick, 1995), and the overall activity of a firm (Haveman, 1993;
Lamberg, 2005) vary with organization size. Firm size is controlled by including the natural
logarithm of the number of employees in the model (cf. Ferrier et al., 1999; Uotila et al., 2009)
and by dividing the sample into a subset of large and small firms, the divider being the median
amount of employees. Employees were chosen rather than sales as the amount of employees
fluctuate less than sales and provide a more robust measure of company size. Including sales as
a control variable will also alleviate potential bias from missed data as firm size is expected to
be correlated with the missing data.
Second, as similar effects as those caused by size have been argued to exist for firm age as well a
measure of firm age is included (Nelson and Winter, 1982; Hannan and Freeman, 1984; Miller
and Chen, 1996a). The effect of firm age is controlled by including the measured of time passed
since the funding of the firm. Alternatively, the age was measured as the time passed since the
firm entered the paper industry for diversified conglomerates. Third, the threat of poor
235
performance is a main driver behind the theorized effects of the independent variable, hence
there is a need to control for a direct measure of performance, which is measured as the firm’s
profits at the previous time interval, t-1. Fourth, acknowledging concepts such as inertia
(Hannan and Freeman, 1984), strategic paths (Lamberg, 2009), and momentum (Miller and
Friesen, 1982) previously taken actions have been found to influence future actions
substantially. Previous actions are therefore included, as the firms’ actions at t-1, to control for
firm heterogeneity in the propensity for either action.
Fifth, mergers and acquisitions (M&A’s) or divestments can have similar effects as exploitation,
namely increasing efficiency and, hence, be motivated by achieving economies of scale or scope
(Ghosal and Nair-Reichert, 2009). M&A’s can also be knowledge sourcing, substituting partly
explorative activity (Anand et al., 2009), requires firm resources, constraining the ability to
engage in other action, and influences the level of competitive intensity (Pesendorfer, 1998).
Sixth, as argued earlier the greater the overlap of two firms businesses the greater the
competitive pressure that is felt from the rival’s actions. Though the sample includes only firms
with over 70% of sales from the paper industry, the degree of involvement can still affect the
way a company would react to the market and peer company actions. Involvement is modeled
through the rate of paper industry sales in relation to overall sales by a firm, which signals how
dependent the firm is on the examined industry. Seventh, although market growth acts as a
moderator to competitive intensity, as theorized earlier, it has been found to have effects in
isolation as well (e.g. Greve, 2007; Jansen et al., 2006). Hence, potential individual effects of
market growth are controlled by the including market growth at t-1.
Lastly, there are special market idiosyncrasies beyond mere growth and competitive activity
that can influence actions. For instance, regulatory and stakeholder requirement, governance
structures, capital market differences and other institutional exceptions can influence firm
actions (Lewin et al., 1999). As shown in the setting description (Section 4) firms are
dominantly dependent on their domestic continental markets. Firms’ main markets, i.e.
continental regions, are thus controlled. The home continent of each firm (except one to avoid
multicollinearity) was dummy-coded as either 1 or 0 and included in the model. The final
included continents were North America, Africa, Europe, South America, Asia and Australasia.
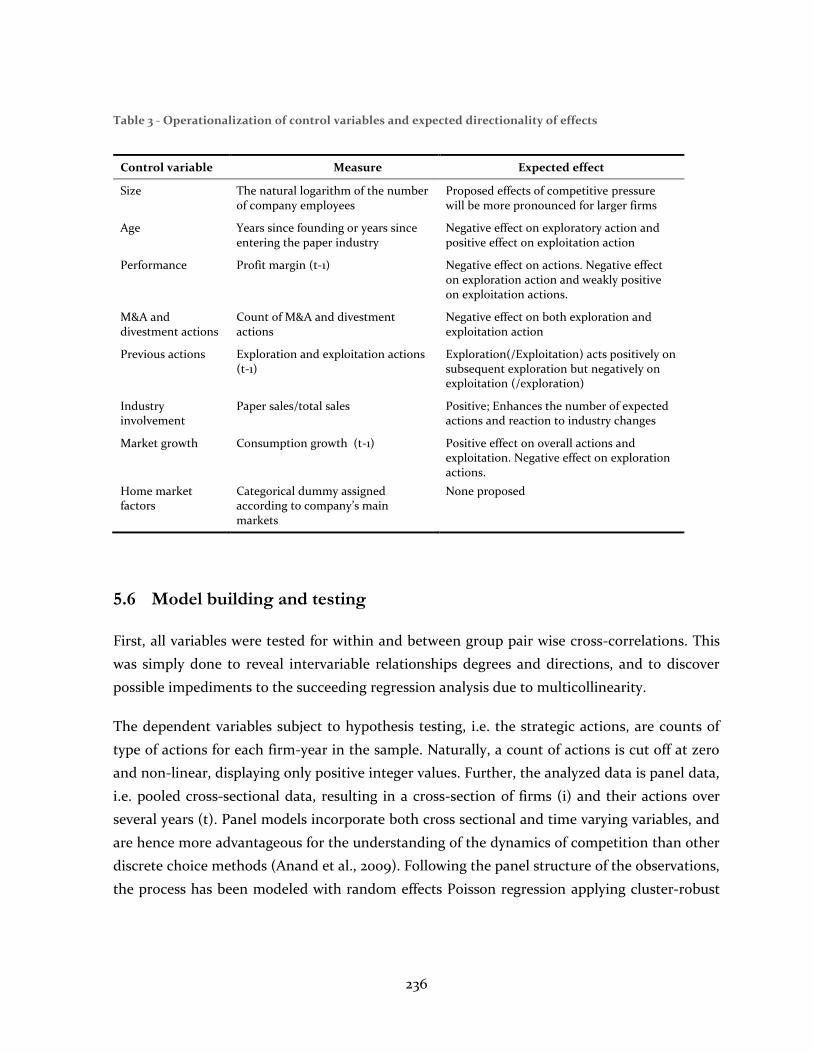
236
Table 3 - Operationalization of control variables and expected directionality of effects
Control variable Measure Expected effect
Size The natural logarithm of the number of company employees
Proposed effects of competitive pressure will be more pronounced for larger firms
Age Years since founding or years since entering the paper industry
Negative effect on exploratory action and positive effect on exploitation action
Performance Profit margin (t-1) Negative effect on actions. Negative effect on exploration action and weakly positive on exploitation actions.
M&A and divestment actions
Count of M&A and divestment actions
Negative effect on both exploration and exploitation action
Previous actions Exploration and exploitation actions (t-1)
Exploration(/Exploitation) acts positively on subsequent exploration but negatively on exploitation (/exploration)
Industry involvement
Paper sales/total sales Positive; Enhances the number of expected actions and reaction to industry changes
Market growth Consumption growth (t-1) Positive effect on overall actions and exploitation. Negative effect on exploration actions.
Home market factors
Categorical dummy assigned according to company’s main markets
None proposed
5.6 Model building and testing
First, all variables were tested for within and between group pair wise cross-correlations. This
was simply done to reveal intervariable relationships degrees and directions, and to discover
possible impediments to the succeeding regression analysis due to multicollinearity.
The dependent variables subject to hypothesis testing, i.e. the strategic actions, are counts of
type of actions for each firm-year in the sample. Naturally, a count of actions is cut off at zero
and non-linear, displaying only positive integer values. Further, the analyzed data is panel data,
i.e. pooled cross-sectional data, resulting in a cross-section of firms (i) and their actions over
several years (t). Panel models incorporate both cross sectional and time varying variables, and
are hence more advantageous for the understanding of the dynamics of competition than other
discrete choice methods (Anand et al., 2009). Following the panel structure of the observations,
the process has been modeled with random effects Poisson regression applying cluster-robust
237
estimators of standard errors. Poisson regression assumes that the dependent variable
observations arise from Poisson distribution, as below:
(2)
Normal Poisson regression requires the sample mean to equal the variance, however
dependents violated this assumption indicating overdispersion which can cause unobserved
heterogeneity. Due to this cluster robust estimators of the variance-covariance matrix was
used. Utilizing cluster-robust estimators with Poisson regression allows for computation of
Poisson regression while correcting for overdispersion. Furthermore, negative binomial
regression, which accommodates by default for overdispersion, was also applied. Poisson
regression is however used as the main model in this thesis as it allows for analysis of time
invariant factors. Moreover, as Poisson estimators rely on weaker distributional assumptions, in
correcting specifications of the mean, it has been found to be more robust to use Poisson
estimators with cluster-robust standard errors estimators than negative binomial regression
(Cameron and Trivedi, 2009). A random effects model was applied in order to compute the
effect of time-invariant factors (see equation 3 below).
(3)
The random effects model assumes that there are firm specific attributes that affect outcomes,
which are resultant from random variance, but that these effects are uncorrelated with
regressors (xit) and with the time (contrary to fixed effect models which assumes that αi
correlates with the regressors). The model thus assumes within-firm observational
independence when computing standard errors, thus allow drawing inferences about a broader
population than the sample. Further, the random effects model was chosen as when suitable it
gives better indication of standard errors and yields estimates of marginal effects for all
coefficients. The suitability of the random effects model and exogeneity of variables was tested
through an instrumental approach (Echambadi et al., 2006); running fixed effects regression on
models, and comparing the coefficients and significances with initial random effect results. For
reasons parsimony, only random effects models and full fixed effects models are reported in the
results section. Furthermore, unobserved heterogeneity was controlled by including the lagged
variable of actions both exploratory and exploitative, to capture unexplained firm propensity to
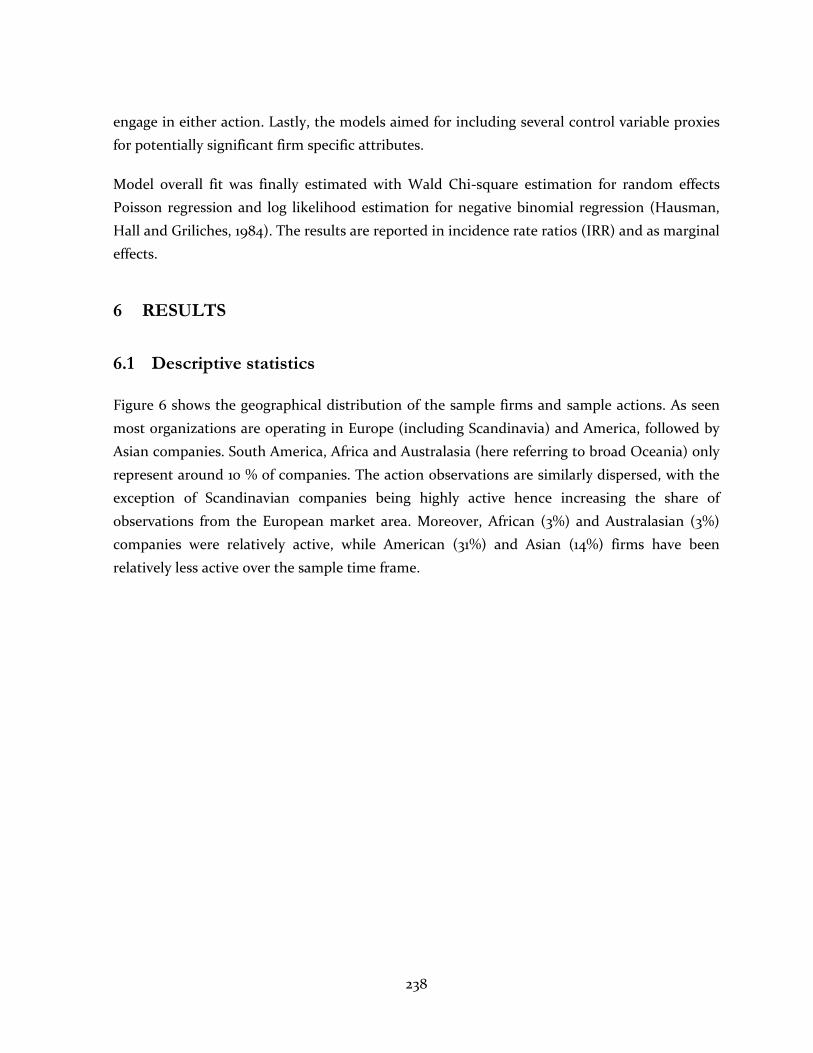
238
engage in either action. Lastly, the models aimed for including several control variable proxies
for potentially significant firm specific attributes.
Model overall fit was finally estimated with Wald Chi-square estimation for random effects
Poisson regression and log likelihood estimation for negative binomial regression (Hausman,
Hall and Griliches, 1984). The results are reported in incidence rate ratios (IRR) and as marginal
effects.
6 RESULTS
6.1 Descriptive statistics
Figure 6 shows the geographical distribution of the sample firms and sample actions. As seen
most organizations are operating in Europe (including Scandinavia) and America, followed by
Asian companies. South America, Africa and Australasia (here referring to broad Oceania) only
represent around 10 % of companies. The action observations are similarly dispersed, with the
exception of Scandinavian companies being highly active hence increasing the share of
observations from the European market area. Moreover, African (3%) and Australasian (3%)
companies were relatively active, while American (31%) and Asian (14%) firms have been
relatively less active over the sample time frame.
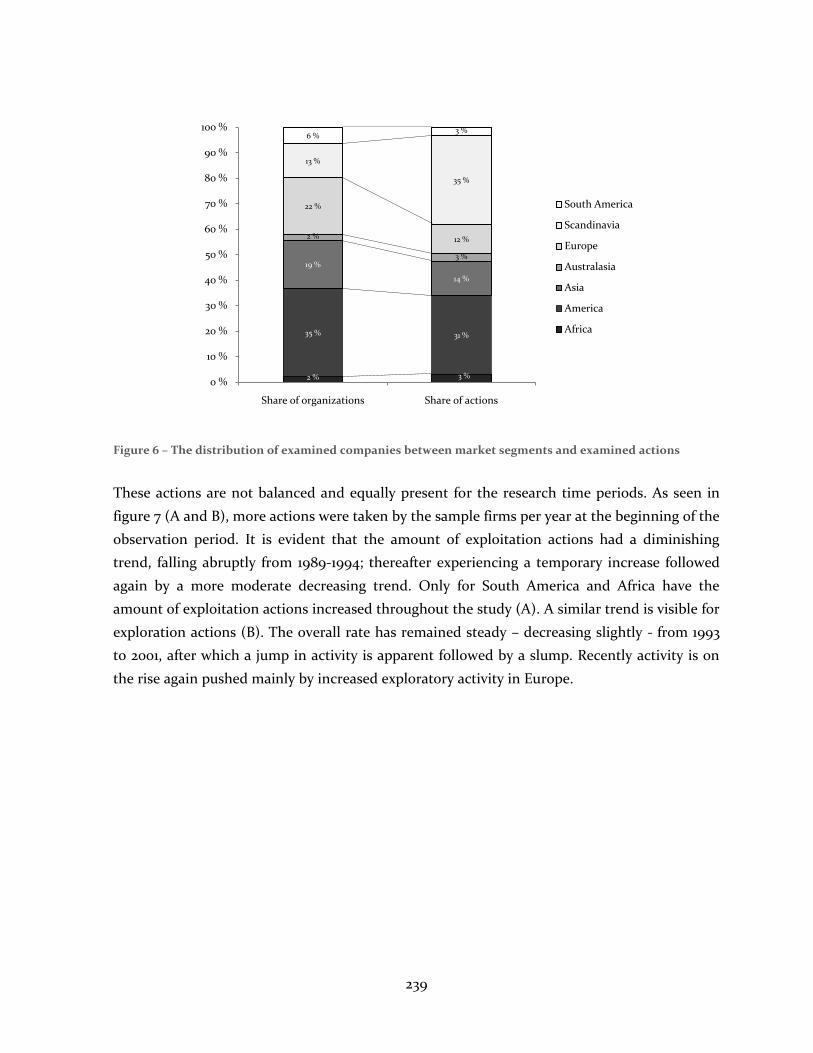
239
Figure 6 – The distribution of examined companies between market segments and examined actions
These actions are not balanced and equally present for the research time periods. As seen in
figure 7 (A and B), more actions were taken by the sample firms per year at the beginning of the
observation period. It is evident that the amount of exploitation actions had a diminishing
trend, falling abruptly from 1989-1994; thereafter experiencing a temporary increase followed
again by a more moderate decreasing trend. Only for South America and Africa have the
amount of exploitation actions increased throughout the study (A). A similar trend is visible for
exploration actions (B). The overall rate has remained steady – decreasing slightly - from 1993
to 2001, after which a jump in activity is apparent followed by a slump. Recently activity is on
the rise again pushed mainly by increased exploratory activity in Europe.
2 % 3 %
35 % 31 %
19 %
14 %
2 %
3 %
22 %
12 %
13 %
35 %
6 %3 %
0 %
10 %
20 %
30 %
40 %
50 %
60 %
70 %
80 %
90 %
100 %
Share of organizations Share of actions
South America
Scandinavia
Europe
Australasia
Asia
America
Africa
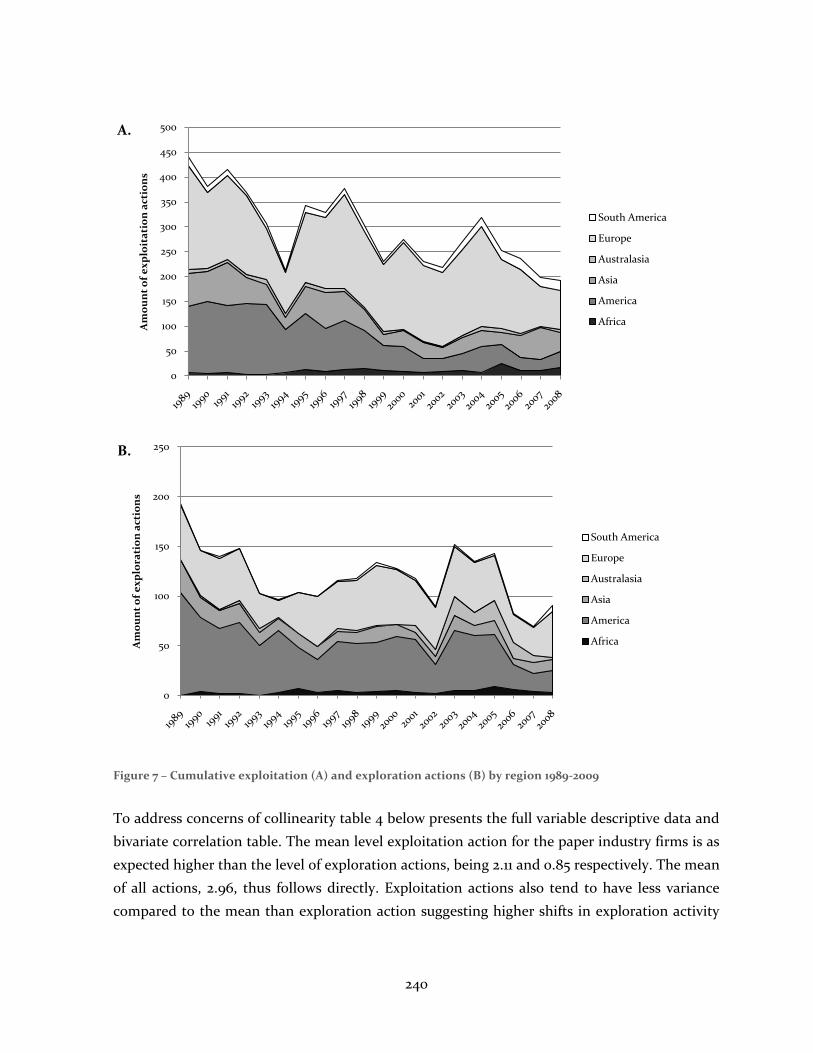
240
Figure 7 – Cumulative exploitation (A) and exploration actions (B) by region 1989-2009
To address concerns of collinearity table 4 below presents the full variable descriptive data and
bivariate correlation table. The mean level exploitation action for the paper industry firms is as
expected higher than the level of exploration actions, being 2.11 and 0.85 respectively. The mean
of all actions, 2.96, thus follows directly. Exploitation actions also tend to have less variance
compared to the mean than exploration action suggesting higher shifts in exploration activity
0
50
100
150
200
250
300
350
400
450
500
Am
ou
nt
of
ex
plo
ita
tio
n a
ctio
ns
South America
Europe
Australasia
Asia
America
Africa
0
50
100
150
200
250
Am
ou
nt
of
ex
plo
rati
on
act
ion
s
South America
Europe
Australasia
Asia
America
Africa
A.
B.
241
on average. In general, sample firms are old (mean of 75 years) and large (have around 4500
employees and 1.2 billion dollars in sales), earn a low 7 % profit margin, and are highly involved
in the industry. Moreover, within group variances are typically below between group variances.
Observe that the mean cumulative amount of exploitative activity in a market area is high with
high variance, while the growth variable shifts between low values and has lower variance. This
carries implications for the competitive intensity operationalization. In the sample setting the
competitive activity is far more important than growth as a component of the competitive
intensity measure (equation 1). Accordingly, competitive activity mean and variation have
similar values as for competitive intensity and the variables display a high correlation, to the
extent that they cannot as such be entered into the same regression models. Still, incorporating
both variables in the competitive intensity measure (as in equation 1) resulted in stronger
models than when using simply competitive activity (though statistical differences were small).
Sales and employees also correlate substantially and employees have thereby been left in the
model for reason explained earlier. Correlation from region control-dummies have also been
controlled in the fixed effects models. Otherwise correlations are not particularly significant
(compare to Katila and Ahuja, 2002; Stuart, 2000), suggesting low threat of multicollinearity
and variance inflation. Nevertheless, multicollinearity test models were run, however failing to
indicate multicollinearity and variance inflation to an extent that would cause concern.
Nonetheless, to control the threat of distortion from multicollinearity, models were ran with
the least correlating regressors first verifying that signs and effects did not change radically
upon adding new more correlated variables. The effect of the sizeable sample further mitigates
the loss of power associated with collinearity (Echambadi et al., 2006).
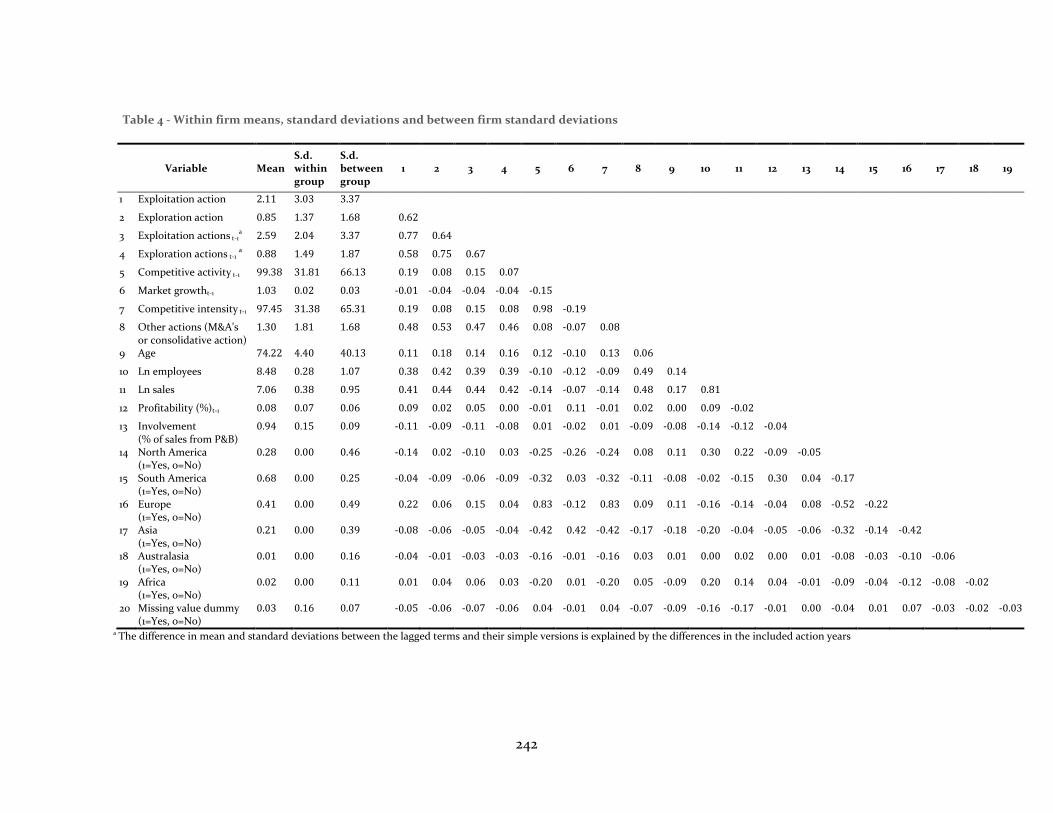
242
Table 4 - Within firm means, standard deviations and between firm standard deviations
Variable Mean S.d. within group
S.d. between group
1 2 3 4 5 6 7 8 9 10 11 12 13 14 15 16 17 18 19
1 Exploitation action 2.11 3.03 3.37
2 Exploration action 0.85 1.37 1.68 0.62
3 Exploitation actions t-1a 2.59 2.04 3.37 0.77 0.64
4 Exploration actions t-1 a 0.88 1.49 1.87 0.58 0.75 0.67
5 Competitive activity t-1 99.38 31.81 66.13 0.19 0.08 0.15 0.07
6 Market growtht-1 1.03 0.02 0.03 -0.01 -0.04 -0.04 -0.04 -0.15
7 Competitive intensity t-1 97.45 31.38 65.31 0.19 0.08 0.15 0.08 0.98 -0.19
8 Other actions (M&A's or consolidative action)
1.30 1.81 1.68 0.48 0.53 0.47 0.46 0.08 -0.07 0.08
9 Age 74.22 4.40 40.13 0.11 0.18 0.14 0.16 0.12 -0.10 0.13 0.06
10 Ln employees 8.48 0.28 1.07 0.38 0.42 0.39 0.39 -0.10 -0.12 -0.09 0.49 0.14
11 Ln sales 7.06 0.38 0.95 0.41 0.44 0.44 0.42 -0.14 -0.07 -0.14 0.48 0.17 0.81
12 Profitability (%)t-1 0.08 0.07 0.06 0.09 0.02 0.05 0.00 -0.01 0.11 -0.01 0.02 0.00 0.09 -0.02
13 Involvement (% of sales from P&B)
0.94 0.15 0.09 -0.11 -0.09 -0.11 -0.08 0.01 -0.02 0.01 -0.09 -0.08 -0.14 -0.12 -0.04
14 North America (1=Yes, 0=No)
0.28 0.00 0.46 -0.14 0.02 -0.10 0.03 -0.25 -0.26 -0.24 0.08 0.11 0.30 0.22 -0.09 -0.05
15 South America (1=Yes, 0=No)
0.68 0.00 0.25 -0.04 -0.09 -0.06 -0.09 -0.32 0.03 -0.32 -0.11 -0.08 -0.02 -0.15 0.30 0.04 -0.17
16 Europe (1=Yes, 0=No)
0.41 0.00 0.49 0.22 0.06 0.15 0.04 0.83 -0.12 0.83 0.09 0.11 -0.16 -0.14 -0.04 0.08 -0.52 -0.22
17 Asia (1=Yes, 0=No)
0.21 0.00 0.39 -0.08 -0.06 -0.05 -0.04 -0.42 0.42 -0.42 -0.17 -0.18 -0.20 -0.04 -0.05 -0.06 -0.32 -0.14 -0.42
18 Australasia (1=Yes, 0=No)
0.01 0.00 0.16 -0.04 -0.01 -0.03 -0.03 -0.16 -0.01 -0.16 0.03 0.01 0.00 0.02 0.00 0.01 -0.08 -0.03 -0.10 -0.06
19 Africa (1=Yes, 0=No)
0.02 0.00 0.11 0.01 0.04 0.06 0.03 -0.20 0.01 -0.20 0.05 -0.09 0.20 0.14 0.04 -0.01 -0.09 -0.04 -0.12 -0.08 -0.02
20 Missing value dummy (1=Yes, 0=No)
0.03 0.16 0.07 -0.05 -0.06 -0.07 -0.06 0.04 -0.01 0.04 -0.07 -0.09 -0.16 -0.17 -0.01 0.00 -0.04 0.01 0.07 -0.03 -0.02 -0.03
a The difference in mean and standard deviations between the lagged terms and their simple versions is explained by the differences in the included action years
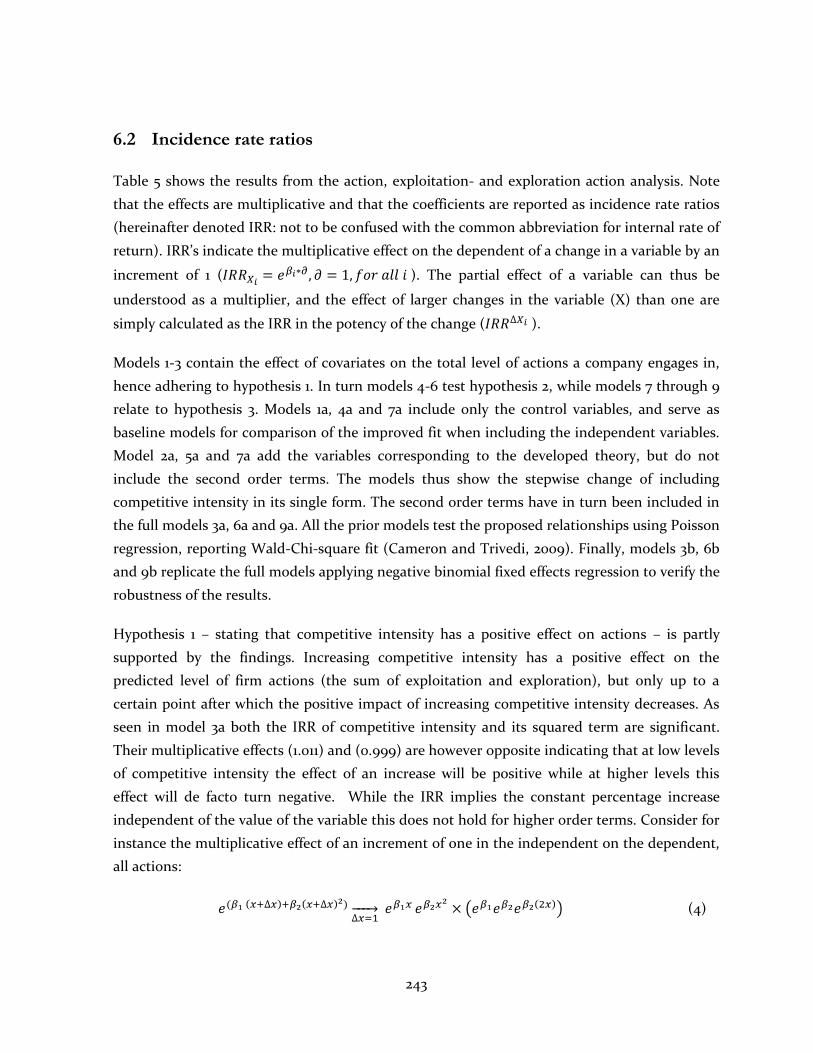
243
6.2 Incidence rate ratios
Table 5 shows the results from the action, exploitation- and exploration action analysis. Note
that the effects are multiplicative and that the coefficients are reported as incidence rate ratios
(hereinafter denoted IRR: not to be confused with the common abbreviation for internal rate of
return). IRR’s indicate the multiplicative effect on the dependent of a change in a variable by an
increment of 1 ( ). The partial effect of a variable can thus be
understood as a multiplier, and the effect of larger changes in the variable (X) than one are
simply calculated as the IRR in the potency of the change ( ).
Models 1-3 contain the effect of covariates on the total level of actions a company engages in,
hence adhering to hypothesis 1. In turn models 4-6 test hypothesis 2, while models 7 through 9
relate to hypothesis 3. Models 1a, 4a and 7a include only the control variables, and serve as
baseline models for comparison of the improved fit when including the independent variables.
Model 2a, 5a and 7a add the variables corresponding to the developed theory, but do not
include the second order terms. The models thus show the stepwise change of including
competitive intensity in its single form. The second order terms have in turn been included in
the full models 3a, 6a and 9a. All the prior models test the proposed relationships using Poisson
regression, reporting Wald-Chi-square fit (Cameron and Trivedi, 2009). Finally, models 3b, 6b
and 9b replicate the full models applying negative binomial fixed effects regression to verify the
robustness of the results.
Hypothesis 1 – stating that competitive intensity has a positive effect on actions – is partly
supported by the findings. Increasing competitive intensity has a positive effect on the
predicted level of firm actions (the sum of exploitation and exploration), but only up to a
certain point after which the positive impact of increasing competitive intensity decreases. As
seen in model 3a both the IRR of competitive intensity and its squared term are significant.
Their multiplicative effects (1.011) and (0.999) are however opposite indicating that at low levels
of competitive intensity the effect of an increase will be positive while at higher levels this
effect will de facto turn negative. While the IRR implies the constant percentage increase
independent of the value of the variable this does not hold for higher order terms. Consider for
instance the multiplicative effect of an increment of one in the independent on the dependent,
all actions:
(4)
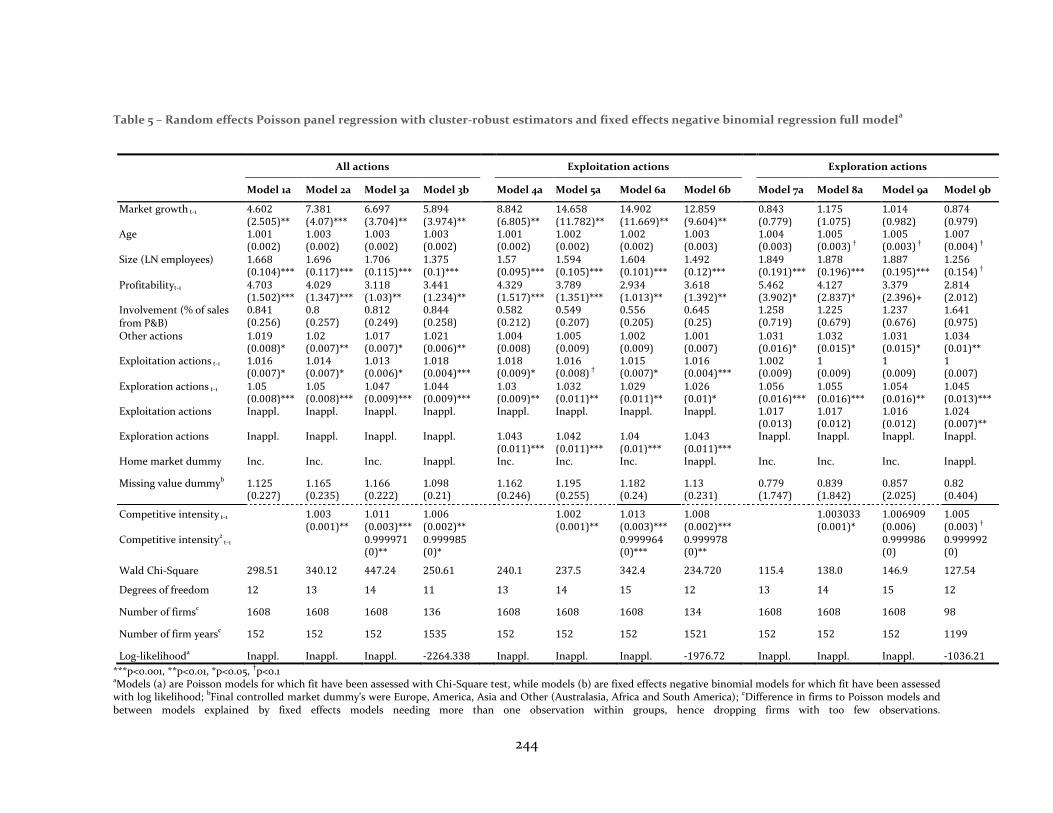
244
Table 5 – Random effects Poisson panel regression with cluster-robust estimators and fixed effects negative binomial regression full modela
All actions
Exploitation actions
Exploration actions
Model 1a Model 2a Model 3a Model 3b
Model 4a Model 5a Model 6a Model 6b
Model 7a Model 8a Model 9a Model 9b
Market growth t-1 4.602 (2.505)**
7.381 (4.07)***
6.697 (3.704)**
5.894 (3.974)**
8.842 (6.805)**
14.658 (11.782)**
14.902 (11.669)**
12.859 (9.604)**
0.843 (0.779)
1.175 (1.075)
1.014 (0.982)
0.874 (0.979)
Age 1.001 (0.002)
1.003 (0.002)
1.003 (0.002)
1.003 (0.002)
1.001 (0.002)
1.002 (0.002)
1.002 (0.002)
1.003 (0.003)
1.004 (0.003)
1.005 (0.003) †
1.005 (0.003) †
1.007 (0.004) †
Size (LN employees) 1.668 (0.104)***
1.696 (0.117)***
1.706 (0.115)***
1.375 (0.1)***
1.57 (0.095)***
1.594 (0.105)***
1.604 (0.101)***
1.492 (0.12)***
1.849 (0.191)***
1.878 (0.196)***
1.887 (0.195)***
1.256 (0.154) †
Profitabilityt-1 4.703 (1.502)***
4.029 (1.347)***
3.118 (1.03)**
3.441 (1.234)**
4.329 (1.517)***
3.789 (1.351)***
2.934 (1.013)**
3.618 (1.392)**
5.462 (3.902)*
4.127 (2.837)*
3.379 (2.396)+
2.814 (2.012)
Involvement (% of sales from P&B)
0.841 (0.256)
0.8 (0.257)
0.812 (0.249)
0.844 (0.258)
0.582 (0.212)
0.549 (0.207)
0.556 (0.205)
0.645 (0.25)
1.258 (0.719)
1.225 (0.679)
1.237 (0.676)
1.641 (0.975)
Other actions 1.019 (0.008)*
1.02 (0.007)**
1.017 (0.007)*
1.021 (0.006)**
1.004 (0.008)
1.005 (0.009)
1.002 (0.009)
1.001 (0.007)
1.031 (0.016)*
1.032 (0.015)*
1.031 (0.015)*
1.034 (0.01)**
Exploitation actions t-1 1.016 (0.007)*
1.014 (0.007)*
1.013 (0.006)*
1.018 (0.004)***
1.018 (0.009)*
1.016 (0.008) †
1.015 (0.007)*
1.016 (0.004)***
1.002 (0.009)
1 (0.009)
1 (0.009)
1 (0.007)
Exploration actions t-1 1.05 (0.008)***
1.05 (0.008)***
1.047 (0.009)***
1.044 (0.009)***
1.03 (0.009)**
1.032 (0.011)**
1.029 (0.011)**
1.026 (0.01)*
1.056 (0.016)***
1.055 (0.016)***
1.054 (0.016)**
1.045 (0.013)***
Exploitation actions Inappl. Inappl. Inappl. Inappl. Inappl. Inappl. Inappl. Inappl. 1.017 (0.013)
1.017 (0.012)
1.016 (0.012)
1.024 (0.007)**
Exploration actions Inappl. Inappl. Inappl. Inappl. 1.043 (0.011)***
1.042 (0.011)***
1.04 (0.01)***
1.043 (0.011)***
Inappl. Inappl. Inappl. Inappl.
Home market dummy Inc. Inc. Inc. Inappl. Inc. Inc. Inc. Inappl. Inc. Inc. Inc. Inappl.
Missing value dummyb 1.125 (0.227)
1.165 (0.235)
1.166 (0.222)
1.098 (0.21)
1.162 (0.246)
1.195 (0.255)
1.182 (0.24)
1.13 (0.231)
0.779 (1.747)
0.839 (1.842)
0.857 (2.025)
0.82 (0.404)
Competitive intensity t-1 1.003 (0.001)**
1.011 (0.003)***
1.006 (0.002)**
1.002 (0.001)**
1.013 (0.003)***
1.008 (0.002)***
1.003033 (0.001)*
1.006909 (0.006)
1.005 (0.003) †
Competitive intensity2 t-1 0.999971
(0)** 0.999985 (0)*
0.999964 (0)***
0.999978 (0)**
0.999986 (0)
0.999992 (0)
Wald Chi-Square 298.51 340.12 447.24 250.61 240.1 237.5 342.4 234.720 115.4 138.0 146.9 127.54
Degrees of freedom 12 13 14 11 13 14 15 12 13 14 15 12
Number of firmsc 1608 1608 1608 136 1608 1608 1608 134 1608 1608 1608 98
Number of firm yearsc 152 152 152 1535 152 152 152 1521 152 152 152 1199
Log-likelihooda Inappl. Inappl. Inappl. -2264.338 Inappl. Inappl. Inappl. -1976.72 Inappl. Inappl. Inappl. -1036.21
***p<0.001, **p<0.01, *p<0.05, †p<0.1 aModels (a) are Poisson models for which fit have been assessed with Chi-Square test, while models (b) are fixed effects negative binomial models for which fit have been assessed with log likelihood; bFinal controlled market dummy’s were Europe, America, Asia and Other (Australasia, Africa and South America); cDifference in firms to Poisson models and between models explained by fixed effects models needing more than one observation within groups, hence dropping firms with too few observations.
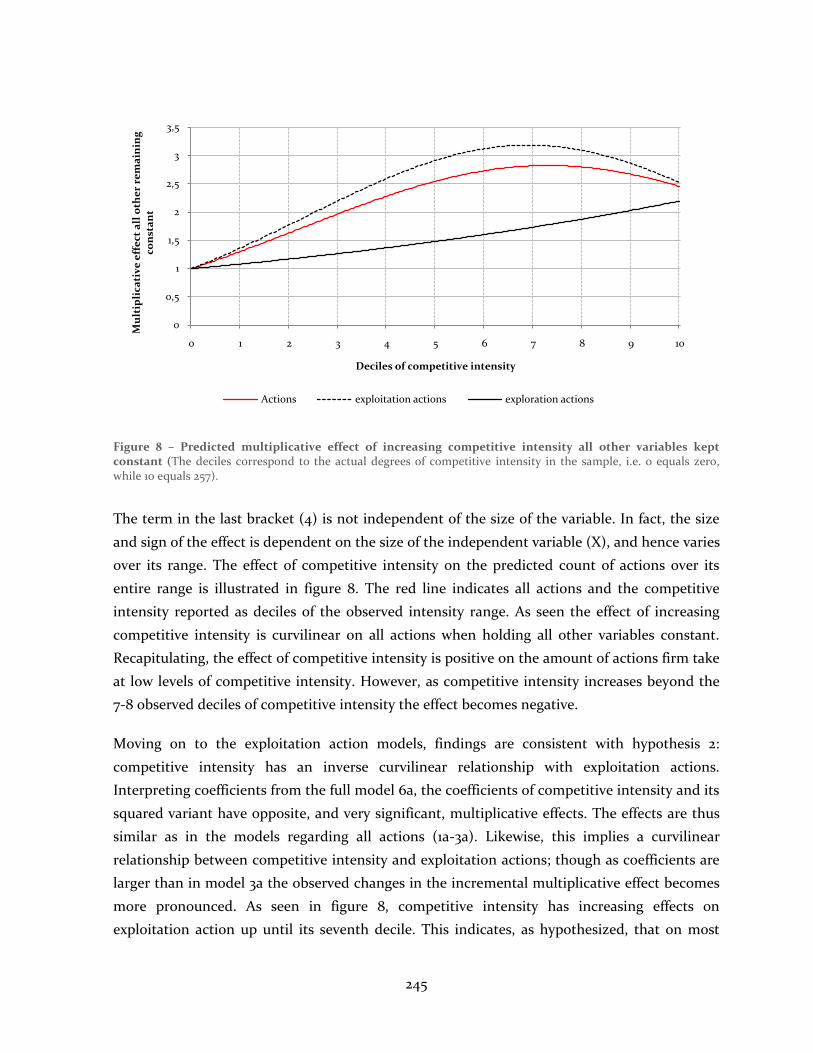
245
Figure 8 – Predicted multiplicative effect of increasing competitive intensity all other variables kept constant (The deciles correspond to the actual degrees of competitive intensity in the sample, i.e. 0 equals zero, while 10 equals 257).
The term in the last bracket (4) is not independent of the size of the variable. In fact, the size
and sign of the effect is dependent on the size of the independent variable (X), and hence varies
over its range. The effect of competitive intensity on the predicted count of actions over its
entire range is illustrated in figure 8. The red line indicates all actions and the competitive
intensity reported as deciles of the observed intensity range. As seen the effect of increasing
competitive intensity is curvilinear on all actions when holding all other variables constant.
Recapitulating, the effect of competitive intensity is positive on the amount of actions firm take
at low levels of competitive intensity. However, as competitive intensity increases beyond the
7-8 observed deciles of competitive intensity the effect becomes negative.
Moving on to the exploitation action models, findings are consistent with hypothesis 2:
competitive intensity has an inverse curvilinear relationship with exploitation actions.
Interpreting coefficients from the full model 6a, the coefficients of competitive intensity and its
squared variant have opposite, and very significant, multiplicative effects. The effects are thus
similar as in the models regarding all actions (1a-3a). Likewise, this implies a curvilinear
relationship between competitive intensity and exploitation actions; though as coefficients are
larger than in model 3a the observed changes in the incremental multiplicative effect becomes
more pronounced. As seen in figure 8, competitive intensity has increasing effects on
exploitation action up until its seventh decile. This indicates, as hypothesized, that on most
0
0,5
1
1,5
2
2,5
3
3,5
0 1 2 3 4 5 6 7 8 9 10
Mu
ltip
lica
tiv
e e
ffe
ct a
ll o
the
r re
ma
inin
g
con
sta
nt
Deciles of competitive intensity
Actions exploitation actions exploration actions
246
levels of competitive intensity the expected count of focal firm’s exploitation actions rises with
increasing intensity. However, for very high levels competitive intensity this no longer holds
and firms’ expected exploitation activity becomes a decreasing function of further increasing
intensity. Moreover, the economic significance of competitive intensity’s effect on exploitation
action is material. On low levels an increase of one standard deviation in competitive intensity
(equal to approximately 2 deciles in figure 8) implies an increase in expected exploitation
actions by approximately 80 %, whereas it in already high competition decreases the expected
actions by 20% (see figure 8).
Turning to the final hypothesis, tested in models 7 to 9 we observe the effect of competitive
intensity on exploration actions. Hypothesis 3 concerning the inverse relationship between
competitive intensity and the effect on firm engagement in exploration actions is in line with
findings, albeit not entirely to the theorized extent. Including a second order term in order to
explain the extent of exploration action proved unsuccessful, as seen in the difference of fit and
significances between model 8a and 9a. The second order effect of competitive intensity on
exploration actions is thus not found. The effects of competitive intensity on exploration
actions may then best be assessed from model 8a. As seen the coefficient for competitive
intensity is significant and positive. An increase by one standard deviation of competitive
intensity will increase the expected amount of exploration actions by a focal firm by 10%
(=1.00303331.81). The effect of competitive intensity on exploration action is then increasing –
the absolute effect will be greater depending on the degree of previous competitive intensity –
and curvilinear (exponential). However, the failure to find a significant second degree
relationship between competitive intensity and exploration action implies that the proposed
positive effect of low competitive intensity on exploration activity was not supported by the
findings. Figure 8 illustrates how the effect of increasing competitive intensity on exploration
actions grows exponentially.
Comparing these findings regarding competitive intensity’s effect on exploration actions to that
of exploitation actions, and the descriptive statistics, it suggests that the observed effect on all
actions is driven mostly by the large influence of exploitation actions. As exploitation actions
have a much higher presence across the observations than exploration actions, the effects of
exploitation actions in their sum, namely the all actions variable, is dominant. Hence, the
observed effect of competitive intensity on exploitation actions appears to also explain the
unexpected curvilinear relationship found between all actions and competitive intensity.
247
Models 3b, 6b and 9b further give evidence that the findings are not at all sensitive to the
estimator applied. Additionally, the models confirm that findings hold irrespective of whether
random or fixed effects are assumed. Differences in coefficients and significance are marginal at
most, having similar effect on proposed relationships, hence negating suspicions of distorting
effects of endogeneity. Finally, the inclusion of the two variables, competitive intensity and
competitive intensity squared, improved upon the baseline model in all preceding models.
The above analysis focuses on multiplicative effects and individual variable effects are assessed
through holding all other variables constant. However, this might not hold for any of the
observations. The other variables are in fact highly unlikely to remain constant in any of the
sample firms. Hence, although informative, the IRR can in this sense be misleading as its
premises can be violated for all observation. To assess the additive effect of variable changes
and whether the hypothesized relationships actually hold for the observed data it is preferable
to further assess the marginal effects of changes in the variables.
6.3 Marginal effects of competitive intensity
To increase the robustness of results, following Norton, Wang and Ai’s (2004) and Hoetker’s
(2007) best practices for the analysis of non-linear models, the average marginal effects (AME)
of model 1 through 9 are reported in table 6. These models show the effect an infinitely small
change in the independent variable has on the dependent variable on average across the
observed data points. Keep in mind that the calculated marginal effect at any point is
dependent on the values of the covariates at that point, and hence indicates the real observed
variation at the sample data points in contrast to the IRR ratios.
The resulting average effect of competitive intensity on all actions, exploitation actions and
exploration actions can be seen in model 3a, 6a and 8a (note that model 9 was inferior to model
8). On average the effect of an increment in competitive intensity has been positive for all
dependents; all actions, exploitation- and exploration actions. However, only for exploration
action is this average effect statistically significant, and even meaningful. The positive average
marginal effect of competitive intensity in model 8 corroborates previous findings, showing
that growing competitive intensity has increased the propensity of firms to engage in
exploration actions across observations. On average an infinitely small change in competitive
intensity has increased exploration actions by 0.002. As said, the average marginal effect of the
competitive intensity in models 3a and 6a which include a squared competitive intensity term
have little interpretive meaning and hence warrants further analysis.
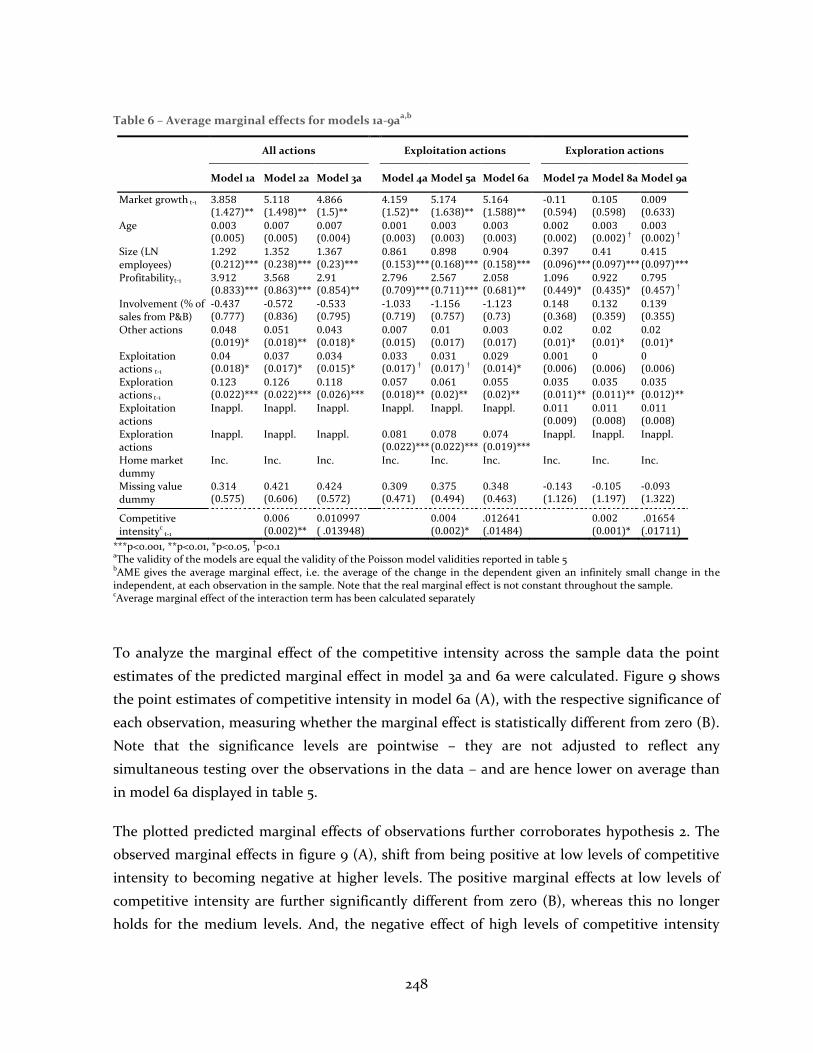
248
Table 6 – Average marginal effects for models 1a-9aa,b
All actions
Exploitation actions
Exploration actions
Model 1a Model 2a Model 3a
Model 4a Model 5a Model 6a
Model 7a Model 8a Model 9a
Market growth t-1 3.858 (1.427)**
5.118 (1.498)**
4.866 (1.5)**
4.159 (1.52)**
5.174 (1.638)**
5.164 (1.588)**
-0.11 (0.594)
0.105 (0.598)
0.009 (0.633)
Age 0.003 (0.005)
0.007 (0.005)
0.007 (0.004)
0.001 (0.003)
0.003 (0.003)
0.003 (0.003)
0.002 (0.002)
0.003 (0.002) †
0.003 (0.002) †
Size (LN employees)
1.292 (0.212)***
1.352 (0.238)***
1.367 (0.23)***
0.861 (0.153)***
0.898 (0.168)***
0.904 (0.158)***
0.397 (0.096)***
0.41 (0.097)***
0.415 (0.097)***
Profitabilityt-1 3.912 (0.833)***
3.568 (0.863)***
2.91 (0.854)**
2.796 (0.709)***
2.567 (0.711)***
2.058 (0.681)**
1.096 (0.449)*
0.922 (0.435)*
0.795 (0.457) †
Involvement (% of sales from P&B)
-0.437 (0.777)
-0.572 (0.836)
-0.533 (0.795)
-1.033 (0.719)
-1.156 (0.757)
-1.123 (0.73)
0.148 (0.368)
0.132 (0.359)
0.139 (0.355)
Other actions 0.048 (0.019)*
0.051 (0.018)**
0.043 (0.018)*
0.007 (0.015)
0.01 (0.017)
0.003 (0.017)
0.02 (0.01)*
0.02 (0.01)*
0.02 (0.01)*
Exploitation actions t-1
0.04 (0.018)*
0.037 (0.017)*
0.034 (0.015)*
0.033 (0.017) †
0.031 (0.017) †
0.029 (0.014)*
0.001 (0.006)
0 (0.006)
0 (0.006)
Exploration actions t-1
0.123 (0.022)***
0.126 (0.022)***
0.118 (0.026)***
0.057 (0.018)**
0.061 (0.02)**
0.055 (0.02)**
0.035 (0.011)**
0.035 (0.011)**
0.035 (0.012)**
Exploitation actions
Inappl. Inappl. Inappl. Inappl. Inappl. Inappl. 0.011 (0.009)
0.011 (0.008)
0.011 (0.008)
Exploration actions
Inappl. Inappl. Inappl. 0.081 (0.022)***
0.078 (0.022)***
0.074 (0.019)***
Inappl. Inappl. Inappl.
Home market dummy
Inc. Inc. Inc. Inc. Inc. Inc. Inc. Inc. Inc.
Missing value dummy
0.314 (0.575)
0.421 (0.606)
0.424 (0.572)
0.309 (0.471)
0.375 (0.494)
0.348 (0.463)
-0.143 (1.126)
-0.105 (1.197)
-0.093 (1.322)
Competitive intensityc
t-1 0.006
(0.002)** 0.010997 ( .013948)
0.004 (0.002)*
.012641 (.01484)
0.002 (0.001)*
.01654 (.01711)
***p<0.001, **p<0.01, *p<0.05, †p<0.1 aThe validity of the models are equal the validity of the Poisson model validities reported in table 5 bAME gives the average marginal effect, i.e. the average of the change in the dependent given an infinitely small change in the independent, at each observation in the sample. Note that the real marginal effect is not constant throughout the sample.
cAverage marginal effect of the interaction term has been calculated separately
To analyze the marginal effect of the competitive intensity across the sample data the point
estimates of the predicted marginal effect in model 3a and 6a were calculated. Figure 9 shows
the point estimates of competitive intensity in model 6a (A), with the respective significance of
each observation, measuring whether the marginal effect is statistically different from zero (B).
Note that the significance levels are pointwise – they are not adjusted to reflect any
simultaneous testing over the observations in the data – and are hence lower on average than
in model 6a displayed in table 5.
The plotted predicted marginal effects of observations further corroborates hypothesis 2. The
observed marginal effects in figure 9 (A), shift from being positive at low levels of competitive
intensity to becoming negative at higher levels. The positive marginal effects at low levels of
competitive intensity are further significantly different from zero (B), whereas this no longer
holds for the medium levels. And, the negative effect of high levels of competitive intensity
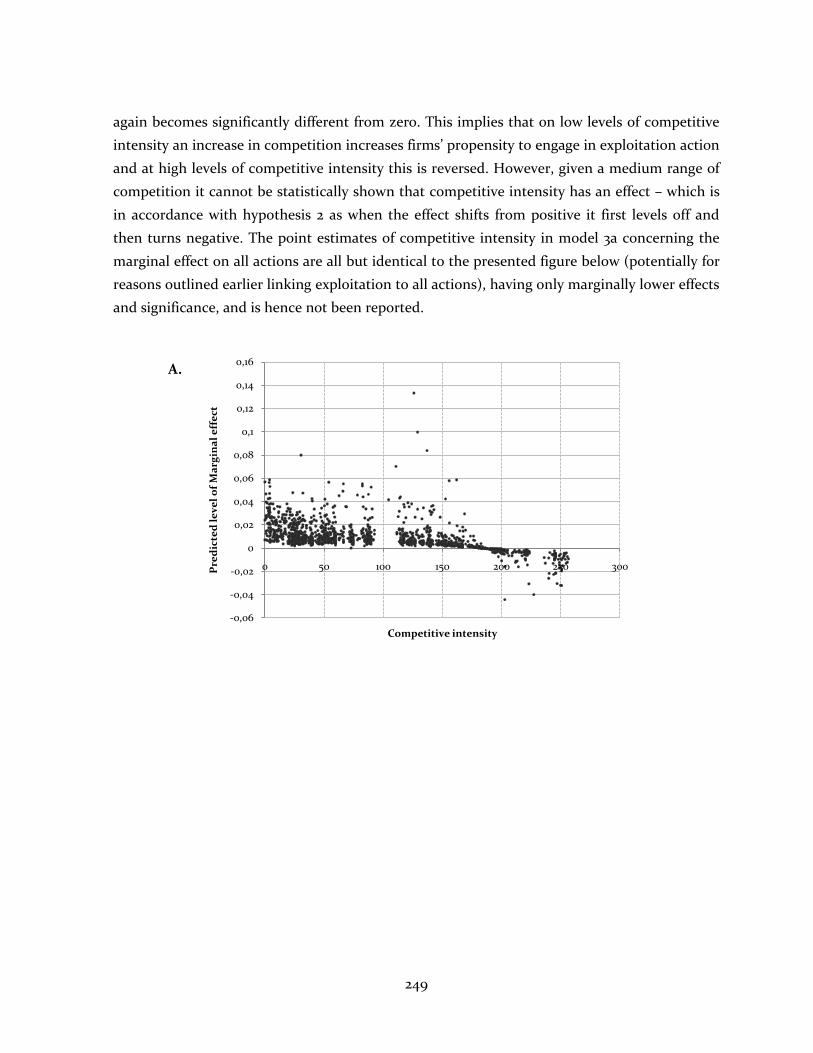
249
again becomes significantly different from zero. This implies that on low levels of competitive
intensity an increase in competition increases firms’ propensity to engage in exploitation action
and at high levels of competitive intensity this is reversed. However, given a medium range of
competition it cannot be statistically shown that competitive intensity has an effect – which is
in accordance with hypothesis 2 as when the effect shifts from positive it first levels off and
then turns negative. The point estimates of competitive intensity in model 3a concerning the
marginal effect on all actions are all but identical to the presented figure below (potentially for
reasons outlined earlier linking exploitation to all actions), having only marginally lower effects
and significance, and is hence not been reported.
-0,06
-0,04
-0,02
0
0,02
0,04
0,06
0,08
0,1
0,12
0,14
0,16
0 50 100 150 200 250 300Pre
dic
ted
le
ve
l o
f M
arg
ina
l e
ffe
ct
Competitive intensity
A.
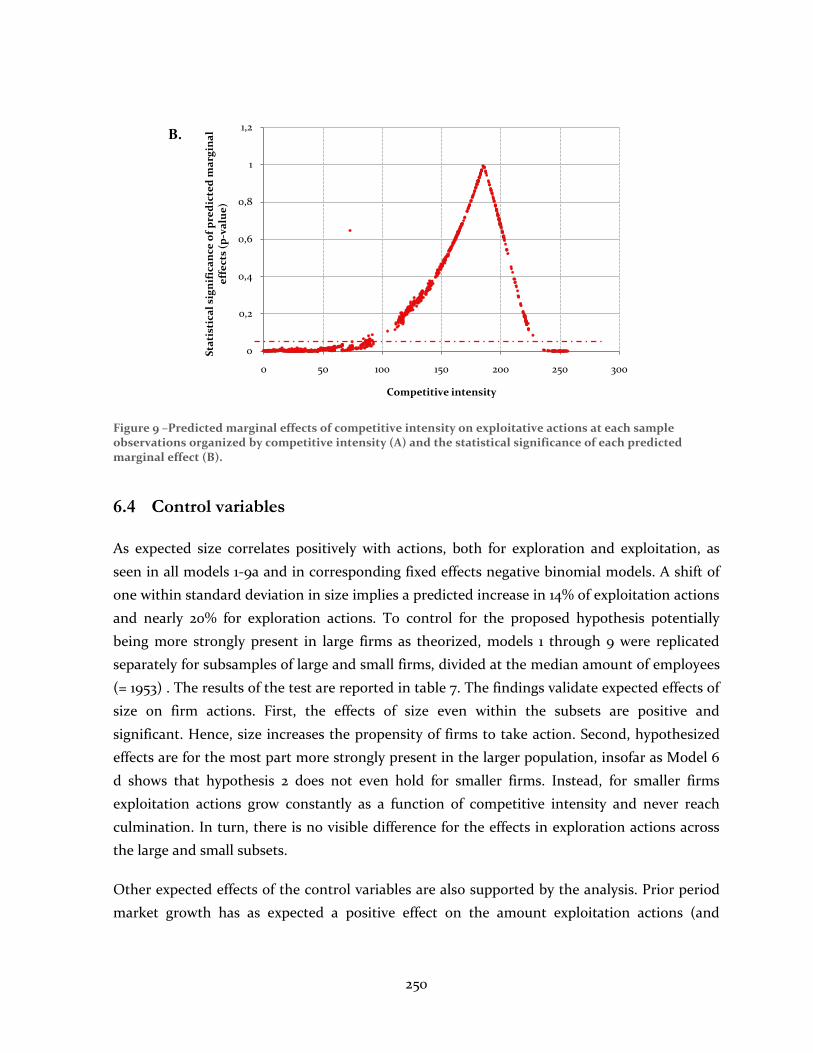
250
Figure 9 –Predicted marginal effects of competitive intensity on exploitative actions at each sample observations organized by competitive intensity (A) and the statistical significance of each predicted marginal effect (B).
6.4 Control variables
As expected size correlates positively with actions, both for exploration and exploitation, as
seen in all models 1-9a and in corresponding fixed effects negative binomial models. A shift of
one within standard deviation in size implies a predicted increase in 14% of exploitation actions
and nearly 20% for exploration actions. To control for the proposed hypothesis potentially
being more strongly present in large firms as theorized, models 1 through 9 were replicated
separately for subsamples of large and small firms, divided at the median amount of employees
(= 1953) . The results of the test are reported in table 7. The findings validate expected effects of
size on firm actions. First, the effects of size even within the subsets are positive and
significant. Hence, size increases the propensity of firms to take action. Second, hypothesized
effects are for the most part more strongly present in the larger population, insofar as Model 6
d shows that hypothesis 2 does not even hold for smaller firms. Instead, for smaller firms
exploitation actions grow constantly as a function of competitive intensity and never reach
culmination. In turn, there is no visible difference for the effects in exploration actions across
the large and small subsets.
Other expected effects of the control variables are also supported by the analysis. Prior period
market growth has as expected a positive effect on the amount exploitation actions (and
0
0,2
0,4
0,6
0,8
1
1,2
0 50 100 150 200 250 300
Sta
tist
ica
l si
gn
ific
an
ce o
f p
red
icte
d m
arg
ina
l e
ffe
cts
(p-v
alu
e)
Competitive intensity
B.
251
subsequently on all actions) in every model. For instance in model 6a (market growth IRR =
14.902), an increase in market growth by one standard deviation increases the expected count
of exploitation actions by approximately 5 %. However, the proposed opposite effect on
exploration activity is not found.
Firm age, though proposed to constrain exploratory actions, is found to have weak positive
effect on exploration, while no effect on exploitation actions is seen. Older firms thus take
more exploration action. In grave contrast to anticipations, previous profitability has a
unanimous positive relationship on actions, though with large variance for exploration actions.
The unexpected finding negates the theory that low performance induces exploitation and
exploration action directly. Actions may be driven more by the availability of resources
resulting from good past behavior. Or possibly, the effect of low performance threat on
behavior becomes visible only at very low levels of profitability, thus not testable with the
constructed models, and as such warrants further research. In turn, Industry involvement had
no significant impact, perhaps due to including only largely involved companies, in which case
the sampling criteria would be motivated.
Concerns relating to the effect of firm other actions and past action trajectories proved
significant. Unexpectedly, engaging in other actions such as M&A or divestments has a positive
but weak effect on exploration actions as well as on the sum of actions (see models 1-9 in tables
5 and 6). Hence, the suggested repressing effect that competition over internal resources has on
a firms’ ability to engage in exploitation and exploration is not observable. Conversely, active
firms in other actions were even more likely to engage in exploration actions simultaneously.
However, as the amount of other actions was scant over the researched sample, caution should
be taken in interpreting these findings.
In turn, prior exploitation action at (t-1) does show weak positive correlation with the extent of
firm exploitation at (t), while no discernible effect on exploration actions is apparent. Thereby,
results indicate path dependences in firm competitive behavior. The similar effect is evident
from past exploratory activity (t-1) in model 8a as well – having previously taken exploration
action strongly increases the predicted amount of exploration actions taken by a firm.
Further, as visible from model 6a, and somewhat unexpectedly, previous exploration actions at
(t-1) carry implications for current exploitation actions as there is a significant positive
relationship between prior exploration and exploitation (the reverse is also visible in the
negative binomial fixed effects models 8b, but note that it is not in the Poisson model and
hence not discussed here). Action patterns suggested by arguments regarding temporal shifts
252
between focusing on the development of new capabilities and shifting to exploiting these
capabilities post their competitive introduction are hence visible from the analysis. In turn,
evidence of the mutually exclusive effects of both types of actions is not found – not in model
6a nor in 8a (or in their corresponding fixed effect models). Hence, previously found crowding
out effects of exploitation actions on exploration actions and vice versa are not replicated in
this study. In fact, firms active in exploration actions are more likely to also engage in
exploitation action although the reverse link is not indicated. The finding may be attributable
to the low levels of exploration actions in the sample firms in the first place. As when
exploration is rarely practiced firms already highly active may have a higher probability of
engaging in at least sporadic exploration. Note that the economic impacts of prior actions
though small are still meaningful; a standard deviation in previous exploration increases
expected exploration actions by roughly 8 % and exploitation actions by 4 %.
Lastly, the included control dummy variables have limited impact on outcomes. First, of the
home market dummy controls only the North America dummy carries a statistically significant
impact, and then only on exploitation actions. The average marginal effect of being a North
American company decreases the amount of exploitation actions by 1.67 in model 6a (barely
statistically significant), whereas being European (nearly statistically significant) decreases the
expected action count on average by 0.93. Finally, supporting the viability of the interpolation
technique the interpolation dummy fails to reach significance in all constructed models.
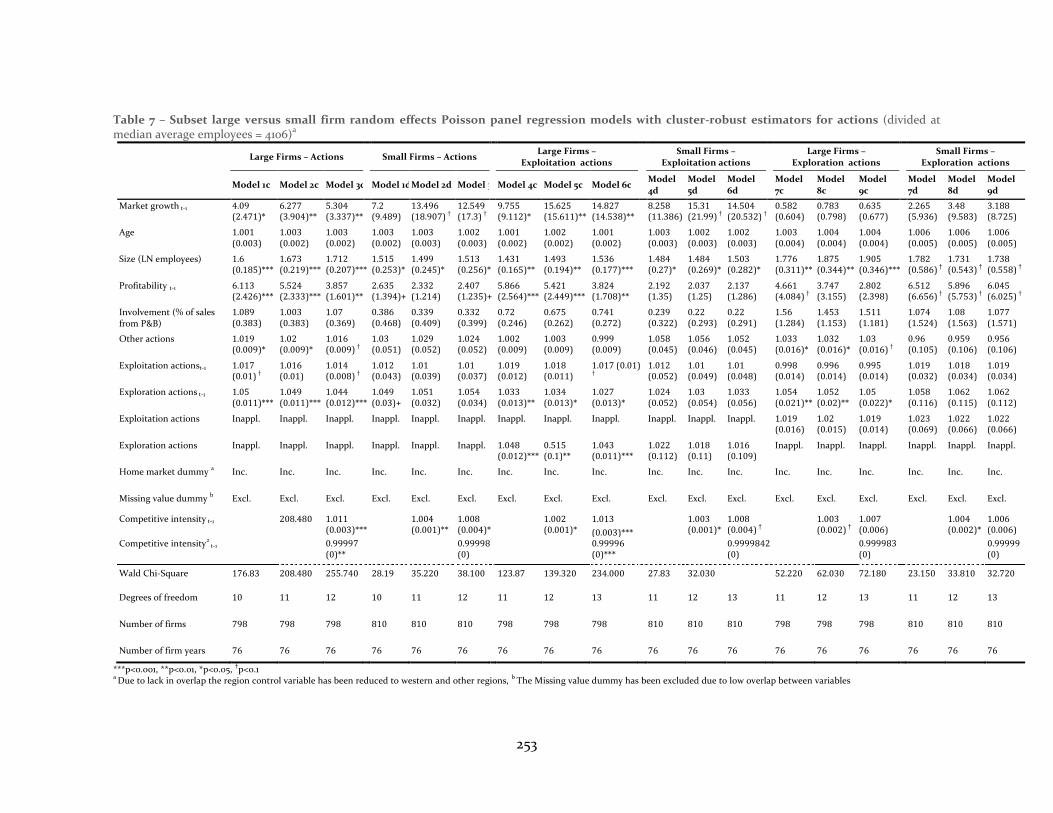
253
Table 7 – Subset large versus small firm random effects Poisson panel regression models with cluster-robust estimators for actions (divided at median average employees = 4106)
a
Large Firms – Actions
Small Firms – Actions
Large Firms –
Exploitation actions Small Firms –
Exploitation actions Large Firms –
Exploration actions Small Firms –
Exploration actions
Model 1c Model 2c Model 3c Model 1d Model 2d Model 3d Model 4c Model 5c Model 6c
Model 4d
Model 5d
Model 6d
Model 7c
Model 8c
Model 9c
Model 7d
Model 8d
Model 9d
Market growth t-1 4.09 (2.471)*
6.277 (3.904)**
5.304 (3.337)**
7.2 (9.489)
13.496 (18.907) †
12.549 (17.3) †
9.755 (9.112)*
15.625 (15.611)**
14.827 (14.538)**
8.258 (11.386)
15.31 (21.99) †
14.504 (20.532) †
0.582 (0.604)
0.783 (0.798)
0.635 (0.677)
2.265 (5.936)
3.48 (9.583)
3.188 (8.725)
Age 1.001 (0.003)
1.003 (0.002)
1.003 (0.002)
1.003 (0.002)
1.003 (0.003)
1.002 (0.003)
1.001 (0.002)
1.002 (0.002)
1.001 (0.002)
1.003 (0.003)
1.002 (0.003)
1.002 (0.003)
1.003 (0.004)
1.004 (0.004)
1.004 (0.004)
1.006 (0.005)
1.006 (0.005)
1.006 (0.005)
Size (LN employees) 1.6 (0.185)***
1.673 (0.219)***
1.712 (0.207)***
1.515 (0.253)*
1.499 (0.245)*
1.513 (0.256)*
1.431 (0.165)**
1.493 (0.194)**
1.536 (0.177)***
1.484 (0.27)*
1.484 (0.269)*
1.503 (0.282)*
1.776 (0.311)**
1.875 (0.344)**
1.905 (0.346)***
1.782 (0.586)
†
1.731 (0.543)
†
1.738 (0.558)
†
Profitability t-1 6.113 (2.426)***
5.524 (2.333)***
3.857 (1.601)**
2.635 (1.394)+
2.332 (1.214)
2.407 (1.235)+
5.866 (2.564)***
5.421 (2.449)***
3.824 (1.708)**
2.192 (1.35)
2.037 (1.25)
2.137 (1.286)
4.661 (4.084)
†
3.747 (3.155)
2.802 (2.398)
6.512 (6.656)
†
5.896 (5.753)
†
6.045 (6.025)
†
Involvement (% of sales from P&B)
1.089 (0.383)
1.003 (0.383)
1.07 (0.369)
0.386 (0.468)
0.339 (0.409)
0.332 (0.399)
0.72 (0.246)
0.675 (0.262)
0.741 (0.272)
0.239 (0.322)
0.22 (0.293)
0.22 (0.291)
1.56 (1.284)
1.453 (1.153)
1.511 (1.181)
1.074 (1.524)
1.08 (1.563)
1.077 (1.571)
Other actions 1.019 (0.009)*
1.02 (0.009)*
1.016 (0.009) †
1.03 (0.051)
1.029 (0.052)
1.024 (0.052)
1.002 (0.009)
1.003 (0.009)
0.999 (0.009)
1.058 (0.045)
1.056 (0.046)
1.052 (0.045)
1.033 (0.016)*
1.032 (0.016)*
1.03 (0.016) †
0.96 (0.105)
0.959 (0.106)
0.956 (0.106)
Exploitation actionst-1
1.017 (0.01) †
1.016 (0.01)
1.014 (0.008) †
1.012 (0.043)
1.01 (0.039)
1.01 (0.037)
1.019 (0.012)
1.018 (0.011)
1.017 (0.01)
† 1.012 (0.052)
1.01 (0.049)
1.01 (0.048)
0.998 (0.014)
0.996 (0.014)
0.995 (0.014)
1.019 (0.032)
1.018 (0.034)
1.019 (0.034)
Exploration actions t-1 1.05 (0.011)***
1.049 (0.011)***
1.044 (0.012)***
1.049 (0.03)+
1.051 (0.032)
1.054 (0.034)
1.033 (0.013)**
1.034 (0.013)*
1.027 (0.013)*
1.024 (0.052)
1.03 (0.054)
1.033 (0.056)
1.054 (0.021)**
1.052 (0.02)**
1.05 (0.022)*
1.058 (0.116)
1.062 (0.115)
1.062 (0.112)
Exploitation actions Inappl. Inappl. Inappl. Inappl. Inappl. Inappl. Inappl. Inappl. Inappl. Inappl. Inappl. Inappl. 1.019 (0.016)
1.02 (0.015)
1.019 (0.014)
1.023 (0.069)
1.022 (0.066)
1.022 (0.066)
Exploration actions Inappl. Inappl. Inappl. Inappl. Inappl. Inappl. 1.048 (0.012)***
0.515 (0.1)**
1.043 (0.011)***
1.022 (0.112)
1.018 (0.11)
1.016 (0.109)
Inappl. Inappl. Inappl. Inappl. Inappl. Inappl.
Home market dummy a Inc. Inc. Inc. Inc. Inc. Inc. Inc. Inc. Inc. Inc. Inc. Inc. Inc. Inc. Inc. Inc. Inc. Inc.
Missing value dummy b Excl. Excl. Excl. Excl. Excl. Excl. Excl. Excl. Excl. Excl. Excl. Excl. Excl. Excl. Excl. Excl. Excl. Excl.
Competitive intensity t-1 208.480 1.011 (0.003)***
1.004 (0.001)**
1.008 (0.004)*
1.002 (0.001)*
1.013
(0.003)***
1.003 (0.001)*
1.008 (0.004) †
1.003 (0.002) †
1.007 (0.006)
1.004 (0.002)*
1.006 (0.006)
Competitive intensity2 t-1 0.99997
(0)** 0.99998
(0) 0.99996
(0)*** 0.9999842
(0) 0.999983
(0) 0.99999
(0)
Wald Chi-Square 176.83 208.480 255.740 28.19 35.220 38.100 123.87 139.320 234.000 27.83 32.030 52.220 62.030 72.180 23.150 33.810 32.720
Degrees of freedom 10 11 12 10 11 12 11 12 13 11 12 13 11 12 13 11 12 13
Number of firms 798 798 798 810 810 810 798 798 798 810 810 810 798 798 798 810 810 810
Number of firm years 76 76 76 76 76 76 76 76 76 76 76 76 76 76 76 76 76 76
***p<0.001, **p<0.01, *p<0.05, †p<0.1 a Due to lack in overlap the region control variable has been reduced to western and other regions, b The Missing value dummy has been excluded due to low overlap between variables
254
7 DISCUSSION
7.1 Conclusions
The main objective of this research was to increase the understanding on how firms react to
competition. This study advanced and tested the notion that competitive intensity, a function
of firm competitive activity in a market moderated by market resource growth, influences the
nature of competitive actions taken by incumbents. Hence, the level of competitive intensity
alters a firms’ propensity to compete directly within established domains – taking exploitation
actions – and attempting to create barriers and avoid direct competition – taking exploration
action. Prior work has theorized that rivalry spurs reaction by industry incumbents (Gresov et
al., 1993), even to the extent that competition is ever accelerating (D’Aveni, 1994; Barnett and
Hansen, 1996), as companies failing to respond promptly to competitors actions are
outperformed, eventually resulting in the demise of the organization (Hannan and Freeman,
1977).
However, as increasing competitive intensity changes the expected performance outcomes of
different actions, it may change the very nature of actions taken by firms to sustain their
performance levels. Three hypotheses regarding the impact of competitive intensity on the
nature of firm competitive actions was put forth in this study. These hypotheses are
recapitulated alongside findings in table 8 below.
Table 8 – Summary of developed hypothesis and empirical tests
Hypothesis Results Empirical Findings
H1: Increasing competitive intensity will have a positive effect on the overall level of firm actions (Ch. 3.1)
Partial support The sum of actions rises only to a certain point after which actions start decreasing with increased competitive intensity (Increasing tendency for exploration does not outweigh decrease in exploitation).
H2: Increased competitive intensity will have an inverted curvilinear relationship (inverted U-shape) with firm exploitation actions (Ch. 3.2)
Yes (but not for smaller firms)
Competitive intensity has a positive impact on exploitation actions at low levels. The effect diminishes with increasing competition finally turning negative at high levels of competitive intensity.
H3: Increased competitive intensity will have a curvilinear relationship (U-shaped) with firm exploration actions (Ch. 3.3)
Partial support An increasing exponential relationship between competitive intensity and exploration actions is found. The hypothesized increasing effect of competitive intensity is then supported but positive effects of low competitive intensity cannot be found.
255
Increasing competitive intensity was argued to focus firm attention towards being competitive
in its existing domains over the short term, and hence increase the exploitation actions taken.
Owing to the decreasing returns attainable by taking exploitation actions in more competitive
markets, it was argued that intensifying competition would breed exploitation response by
incumbents up to a point where the returns to exploitation could only off-set the costs. At such
a point engaging in additional direct competitive measures would only risk accelerating
competition further, potentially diminishing returns even to earlier exploitation actions. For
instance, it is logical that firms refrain from competing on cost-efficiency by adding novel
equipment when there is an overhanging risk that rivals competitive responses will result in
lower prices, hence eroding profits from older less efficient production units. This proposed
pattern of exploitation actions as the level of competition increases (hypothesis 2) was strongly
corroborated by the results.
By the reversed logic firm exploration actions were argued to increase as function of
competitive intensity. The higher the intensity – the lower the returns from current activities
and further exploitation – the more attractive the exploration actions become. In turn, at low
levels of competition there is little pressure to be efficient and firms were thus argued to
engage in higher levels of exploration actions also at low competitive intensity. The findings
support only partial efficacy of the hypothesis. Increasing intensity did have an exponential
effect on exploration but theorized higher exploration in low competitive environments was
not found. The failure to find evidence of increasing exploration in low competitive
environments might be due to the absence of high growth periods in the sample. In hindsight,
arguments regarding increased exploration at low levels of competition, resting on the
argument that firms experiment with various ways to offer value to customers, might be
premature. It might only hold in the growth stage of industries where routines have not been
formalized in the population and low competition has not forced the emergence of dominant
designs (Brown and Eisenhardt, 1997).
Moreover, the observed increasing exploration actions did not outweigh the decrease in
exploitation actions, implying that, contrary to expectations (Hypothesis 1), the aggregate of
actions was not increasing for increasing competitive pressure over its entire spectrum. Instead,
all actions increased in a similar manner as exploitation, increasing at with growing intensity at
low levels of competition and decreasing with further increasing competition. The findings also
suggested differently pronounced effects for large and small firms to the extent that hypothesis
2 did not hold for the smaller firms.
256
Taken together the findings have significant implications for firms and managers – especially in
the pulp and paper industry setting. The highly significant economic impact of the competitive
intensity on all dependents suggests that the pressure exerted by competition plays a material
part in the dynamics governing firm behavior. Whereas prior research has mainly focused on
the pattern of actions – speed, variation, size (e.g. Smith et al., 1991; Ferrier, 2001) – largely
ignoring the nature of the actions taken; the results compliment research on competition by
suggesting a need to treat actions and responses, not as a homogenous, but to discern their
differential effects on competition and different expected returns. In doing so, this research
argued and found that the Schumpeterian action-response is not necessarily escalating for all
levels of competition (as explained above). Contrary to arguments from theory on
Hypercompetition (D’Aveni, 1994) and Red Queen competition (Barnett and Hansen, 1996) it is
likely that there comes a point were increased competition no longer generates more response.
De facto, the argument that beyond a threshold level, the propensity of firms to engage in
exploitation action will decrease is in line with classic arguments from theory on static
competition (Porter, 1980; Miller and Chen, 1994). Firms have been expected to refrain from
actions if the fear of retaliation is too great, in other words if subsequent responses will erode
the achieved benefits. While this mechanism has been used previously as an explanation to
why rivalry does not break out in industries or between pairs of close competitors (comparable
to single round games in game theory), this research shows that the same arguments hold for
sequential games on an industry level. Moreover, considering the observed decrease in
exploitation actions when competitive intensity increases and if firms can be considered
rational, findings put in question maxims such as: more active competitors’ fare better (e.g.
Smith et al., 1992). Rather than merely taking action, adding the dimension of the nature of
actions to competitive dynamics, introduces the need for taking the appropriate action.
The fact that these tendencies were observed to be more pronounced for larger firms in turn
corroborates arguments regarding the higher visibility and competitive impact of large firm’s
actions. Large firms, potentially accelerating competition by their actions, may be quicker to
refrain from making exploitation moves as such behavior in small firms was not found. The
observed dissimilar behavior of small firms is not entirely unexpected and ads to portrait of
small firms competing irregularly and by different means vis-à-vis their larger counterparts
(e.g. Chen and Hambrick, 1995).
Adding to evolutionary and organizational adaptation perspectives, the results indicate that
competition is a key force driving firm level exploration action, i.e. innovations and efforts to
257
innovate. As such the findings give evidence of an incremental view of evolution where firms
gradually increase their innovation efforts as the environment becomes more hostile, rather
than shifting through dichotomous states (see debate in Levin et al., 1999). Hence, the research
compliments insights on how industries evolve through patterns of intense competition and
innovation. Findings suggests that the threat of high competition in existing domains,
complimented by the diminished possibilities of earning satisfactory returns underpin the shift
towards more exploration in actions. The findings further echo arguments on the non-exclusive
effect of exploration on exploitation in loosely coupled units (Gupta et al., 2006), and
strengthens the already dominant view of firms paths – established routines and capabilities –
affecting the nature of firms future actions (Benner and Tushman, 2003; Nelson and Winter,
1982).
In conclusion, the results suggest that current research on competition would be
complimented largely by adding the dimension of action nature, and incorporating an
exploitation and exploration perspective. This study expands knowledge on how companies act
in relation to their environment. Findings not only enrich theory on competitive interaction,
but also give new insight to the debate on organizational adaption as a consequence of hostile
environments. Further, the study makes a methodological contribution as it advances the use
of content analysis as a creative approach to studying organizational actions (Uotila et al.,
2009), and demonstrates latest practice in analyzing overdispersed count data.
7.2 Managerial implications
The implication of this research for managers is manifold. First, understanding competitor’s
reactions is of paramount importance for managers (Coyne and Horne, 2009). The findings
forward the understanding of how competitors are likely to act given a competitive
environment and might as such help managers make more accurate scenarios predicting rival
activity. Knowing that the propensity of competitors to act within current domains (e.g. cutting
costs, improving processes and adding scale) increases when competition in the industry is less,
while the reverse holds for higher competition, should inform managers taking strategic and
competitive choices. For example, decision to engage in direct competitive behavior in
previously un-competitive environments should be made expecting increases in the amount of
direct exploitation actions of rivals to follow. Similarly, managers taking exploitation action in
already hostile settings should evaluate the outcomes expecting low increases in rival
retaliation. This might, depending on situation, significantly change anticipated outcomes,
258
which might otherwise be overly positive or negative if projections are based on either constant
or increasing likelihoods of rivalrous activity.
Second, if increased levels of competition foster more innovative behavior it suggests, in
similarity to arguments on the benefits of competition (Porter, 1991), that rivalry might increase
the competitiveness and renewal of firms. The implication for managers and policy makers
alike is that seeking or even inviting confrontation and competition, at least to a certain degree,
can be beneficial for overcoming barriers to innovation and change (e.g. short sightedness and
excessive emphasis on exploitation). The implication would thus be that instead of attempting
to create regulatory barriers to competition or implicit cooperation firms should attempt to
spur levels of competition. Over time, such induced exploratory activity has been argued to
accumulate to experience getting locked into routines, which as suggested by management
scholars should enhance exploratory behavior even further (Nelson and Winter, 1982).
Moreover, worries that intense competition focuses managerial attention exclusively on short
term competitiveness appears to be premature as findings suggest the opposite. Instead,
intense competition might force competitors to break patterns of exploiting current know-how
when their returns are eroded, and attempt to create new capabilities. From an industry
viewpoint then, increased competitive intensity may be needed for successful market renewal
in the long run and for sustaining viability in the face of competing substitute markets. Worries
that the industry is disappearing may thus be somewhat self-solving as the resulting higher
levels of competition will lead to higher explorations and hence higher chances of industry
rejuvenation. However, a caveat is in place; the findings imply that firms indeed increase their
exploration efforts but do not reveal anything on the success of taking such action.
7.3 Limitations
Several limitations applying to the conducted research merit discussion. First, the single
industry research design leaves doubts on the external validity of the findings. Without further
analysis caution should be applied in generalizing the results beyond similar settings. Indeed,
the paper industry entails several idiosyncrasies which might affect outcomes. First, the
structural contingencies – high fixed and exit costs, industry fragmentation, and commodity
nature of goods – might affect the rewards to and implications of exploitation or exploration
actions. The structural factors in the paper industry, implying a high interconnectedness
between firms, is fortuitous for research on competitive interaction, but also further suggests
that findings may perhaps not hold for alternate, less interconnected settings. These
259
weaknesses notwithstanding, the fundamental arguments developed should still be applicable
to other similar sectors.
Second, in spite of corrective measures the sample selection bias caused by the non-random
sample (Echambadi et al., 2006), may still skew findings towards large firms. The implication
for reliability should however be limited as the covariate of size was controlled in multiple ways
and its implications thoroughly debated. Nonetheless, the results indicate unpredicted
behavior in small firms.
Third, in the data gathering process a threat to validity arises from the construct measurement,
in this case the terms applied in identifying the actions (Echambadi et al., 2006). To minimize
this threat of poor construct measurement related bias, variables operationalization was rooted
in previous theoretical and empirical work, as described in the methodology section, and
applied direct measures (MacKenzie, 2003). Further, testing the categorization through having
experts assess and categorize the news items based on personal judgment, not coding schemes,
yielded highly similar results.
Fourth, there is a potential for systemic error in the recording of company actions in newsfeeds.
To limiting the threat the study gathered actions from a source combining in turn multiple
sources – including all the significant newspapers and journals covering the field. Following
previous competitive dynamics scholars (Ferrier, 1999; Miller and Chen, 1994), there is low
likelihood that actions go unnoticed by industry specialty press. Moreover, actions not noted
by press, which then go unobserved, have been argued to have (a) little significance and hence
no material implication for competition, and (b) be impossible to react to for competitors and
thus carry no implications for competition (Ferrier, 1999; Smith et al. 1992).
260
REFERENCES
ANAND, J., L. F. MESQUITA & R. S. VASSOLO. 2009. The dynamics of multimarket
competition in exploration and exploitation activities. Academy of Management Journal,
52, 802-821.
BAIN, S. J. 1956. Barriers to new competition. Cambridge, MA: Harvard University Press.
BANBURY, C. M. & W. MITCHELL. 1995. The effect of introducing important incremental
innovations on market share and business survival. Strategic Management Journal, 16,
161-182.
BARNETT, W. P. 1997. The dynamics of competitive intensity. Administrative Science
Quarterly, 42, :128-160.
BARNETT, W. P. & M. T. HANSEN. 1996. The Red Queen in organizational evolution. Strategic
Management Journal, 17, 139-157.
BARNEY, J. 1991. Firm resources and sustained competitive advantage. Journal of Management,
17, 99-120.
BAUM, J. A. C. & H. J. KORN. 1999. Dynamics of dyadic competitive interaction. Strategic
Management Journal, 20, 251-278.
BECKMAN, C. M. 2006. The influence of founding team company affiliations on firm behavior.
Academy of Management Journal, 49, 741-758.
BENNER, M. J. 2002. Process management and technological innovation: A longitudinal study
of the photography and paint industries. Administrative Science Quarterly, 47, 676-706.
BENNER, M. J. & M. L. TUSHMAN. 2003. Exploitation, exploration, and process management:
The productivity dilemma revisited. Academy of Management Review, 28, 238-256.
BOWMAN, E. H. 1982. Risk seeking by troubled firms. Sloan Management Review, 23, 33-42.
BROWN, S. L. & K. M. EISENHARDT. 1997. The art of continuous change: Linking complexity
theory and time-paced evolution in relentlessly shifting organizations. Administrative
Science Quarterly, 42, 1-34.
CAMERON, K. S., M. U. KIM & D. A. WHETTEN. 1987. Organizational effects of decline and
turbulence. Administrative Science Quarterly, 32, 222-240.
CAMERON, C. A. & P. TRIVEDI. 2009. Microeconometrics using stata. College station, TX:
Stata Press
CASTROGIOVANNI, G. J. 1991. Environmental munificence - a theoretical assessment.
Academy of Management Review, 16, 542-565.
CAVES, R. E. & P. GHEMAWAT. 1992. Identifying mobility barriers. Strategic Management
Journal, 13, 1-12.
CHEN, M. J. 1996. Competitor analysis and interfirm rivalry: Toward a theoretical integration.
Academy of Management Review, 21, 100-134.
CHEN, M. J. & D. C. HAMBRICK. 1995. Speed, stealth, and selective attack - how small firms
differ from large firms in competitive behavior. Academy of Management Journal, 38,
453-482.
261
CHEN, M. J. & I. C. MACMILLAN. 1992. Nonresponse and delayed-response to competitive
moves - the roles of competitor dependence and action irreversibility. Academy of
Management Journal, 35, 539-570.
CHEN, M. J., K. G. SMITH & C. M. GRIMM. 1992. Action characteristics as predictors of
competitive responses. Management Science, 38, 439-455.
CHEN, M. J., K. H. SU & W. P. TSAI. 2007. Competitive tension: The awareness-motivation-
capability perspective. Academy of Management Journal, 50, 101-118.
CHILD, J. 1972. Organizational structure, environment and performance - role of strategic
choice. Sociology-the Journal of the British Sociological Association, 6, 1-and.
COHEN, J. 1960. A coefficient of agreement for nominal scales. Educational and Psychological
Measurement, 20, 37-46.
COYNE, K. P. & J. HORN. 2009. Predicting Your Competitor's Reaction. Harvard Business
Review, 87, 90-+.
CYERT, R. & J. MARCH. 1963. A Behavioral Theory of the Firm. Englewood Cliffs, NJ: Prentice-
Hall.
D’AVENI, R. 1994. Hypercompetition: Managing the dynamics of strategic maneuvering. New
York, NY: Free Press.
DIESEN, M. 2007. Economics of pulp and paper industry. Paper making science and technology.
Jyväskylä, FI: Gummerus.
DIMAGGIO, P. J. & W. W. POWELL. 1983. The iron cage revisited - institutional isomorphism
and collective rationality in organizational fields. American Sociological Review, 48, 147-
160.
DOBREV, S. D. & T. Y. KIM. 2006. Positioning among organizations in a population: Moves
between market segments and the evolution of industry structure. Administrative
Science Quarterly, 51, 230-261.
DUTTON, J. E. & S. E. JACKSON. 1987. Categorizing strategic issues - links to organizational
action. Academy of Management Review, 12, 76-90.
ECHAMBADI, R., B. CAMPBELL & R. AGARWAL. 2006. Encouraging best practice in
quantitative management research: An incomplete list of opportunities. Journal of
Management Studies, 43, 1801-1820.
FERRIER, W. J., K. G. SMITH & C. M. GRIMM. 1999. The role of competitive action in market
share erosion and industry dethronement: A study of industry leaders and challengers.
Academy of Management Journal, 42, 372-388.
FERRIER, W. J. 2001. Navigating the competitive landscape: The drivers and consequences of
competitive aggressiveness. Academy of Management Journal, 44, 858-877.
FERRIER, W. J. & LEE, H. 2002. Strategic Aggressiveness, Variation, and Surprise: How the
Sequential Pattern of Competitive Rivalry Influences Stock Market Returns. Journal of
Managerial Issues, 14, 162-180
GHEMAWAT, P. & JERI COSTA. 1993. The organizational tension between static and dynamic
efficiency. Strategic Management Journal, 14, 59-73.
262
GHOSAL, V. & U. NAIR-REICHERT. 2009. Investments in modernization, innovation and gains
in productivity: Evidence from firms in the global paper industry. Research Policy, 38,
536-547.
GRESOV, C., H. A. HAVEMAN & T. A. OLIVA. 1993. Organizational design, inertia and the
dynamics of competitive response. Organization Science, 4, 181-208.
GREVE, H. R. 1998. Managerial cognition and the mimetic adoption of market positions: What
you see is what you do. Strategic Management Journal, 19, 967-988.
GREVE, H. R. 2007. Exploration and exploitation in product innovation. Industrial and
Corporate Change, 16, 945-975.
GRIFFIN, A. 1997. PDMA research on new product development practices: Updating trends and
benchmarking best practices. Journal of Product Innovation Management, 14, 429-458.
GUPTA, A. K., K. G. SMITH & C. E. SHALLEY. 2006. The interplay between exploration and
exploitation. Academy of Management Journal, 49, 693-706.
HAMBRICK, D. C. & R. A. D’AVENI. 1988. Large corporate failures as downward spirals.
Administrative Science Quarterly, 33, 1-23.
HANNAN, M. T. & J. FREEMAN. 1977. Population ecology of organizations. American Journal of
Sociology, 82, 929-964.
HANNAN, M. T. & J. FREEMAN. 1984. Structural inertia and organizational-change. American
Sociological Review, 49, 149-164.
HARRIGAN, K. R. & M. E. PORTER. 1983. End-game strategies for declining industries. Harvard
Business Review, 61, 111-120.
HAUSMAN, J., B. H. HALL & Z. GRILICHES. 1984. Econometric-models for count data with an
application to the patents r and d relationship. Econometrica, 52, 909-938.
HAVEMAN, H. A. 1993. Organizational size and change - diversification in the savings and loan
industry after deregulation. Administrative Science Quarterly, 38, 20-50.
HE, Z. L. & P. K. WONG. 2004. Exploration vs. exploitation: An empirical test of the
ambidexterity hypothesis. Organization Science, 15, 481-494.
HOETKER, G. 2007. The use of logit and probit models in strategic management research:
Critical issues. Strategic Management Journal, 28, 331-343
HOLMQVIST, M. 2004. Experiential learning processes of exploitation and exploration within
and between organizations: An empirical study of product development. Organization
Science, 15, 70-81.
HOPKINS, H. D. 2003. The response strategies of dominant US firms to Japanese challengers.
Journal of Management, 29, 5-25.
JANSEN, J. J. P., F. A. J. VAN DEN BOSCH & H. W. VOLBERDA. 2006. Exploratory innovation,
exploitative innovation, and performance: Effects of organizational antecedents and
environmental moderators. Management Science, 52, 1661-1674.
KAHNEMAN, D. & A. TVERSKY. 1979. Prospect theory - analysis of decision under risk.
Econometrica, 47, 263-291.
263
KATILA, R. & G. AHUJA. 2002. Something old, something new: A longitudinal study of search
behavior and new product introduction. Academy of Management Journal, 45, 1183-1194.
KIM, H. E. & J. M. PENNINGS. 2009. Innovation and Strategic Renewal in Mature Markets: A
Study of the Tennis Racket Industry. Organization Science, 20, 368-383.
KIM, W. C. & R. MAUBORGNE. 1999. Creating new market space. Harvard Business Review, 77,
183-+.
KIM, W. & R. MAUBORGNE. 2005. Blue Ocean Strategy. Boston, MA: Harvard Business School
Press.
KING, G. & W. LOWE. 2003. An automated information extraction tool for international
conflict data with performance as good as human coders: A rare events evaluation
design. International Organization, 57, 617-+.
KIRZNER, I. 1973. Competition and entrepreneurship. Chicago, IL: University of-Chicago Press.
KLEPPER, S. 1996. Entry, exit, growth, and innovation over the product life cycle. American
Economic Review, 86, 562-583.
KOZA, M. P. & A. Y. LEWIN. 1998. The co-evolution of strategic alliances. Organization Science,
9, 255-264.
KRIPPENDORFF, K. 1980 and 2004 (2nd ed.). Content Analysis. An Introduction to its
Methodology. London, UK: The Sage Commtext Series, Sage Publications Ltd.
LAESTADIUS, S. 1998. The relevance of science and technology indicators: the case of pulp and
paper. Research Policy, 27, 385-395.
LAMBERG, J. A. 2005. Strategic actions and path dependence: Profiles and archetypes of
competitive behavior in a global industry. Helsinki, FI: Helsinki University of
Technology.
LAMBERG, J. A., & J. OJALA. 2006. Evolution of competitive strategies in global forestry
industries: Introduction. In Lamberg et al. (Eds.): The evolution of competitive strategies
in global forestry industries: Comparative Perspectives, 1–30. Dordrecht, NE: Springer.
LAMBERG, J. A., H. TIKKANEN, T. NOKELAINEN & H. SUUR-INKEROINEN. 2009.
competitive dynamics, strategic consistency, and organizational survival. Strategic
Management Journal, 30, 45-60.
LANT, T. K. 1992. Aspiration level adaptation - an empirical exploration. Management Science,
38, 623-644.
LAVER, M., K. BENOIT & J. GARRY. 2003. Extracting policy positions from political texts using
words as data. American Political Science Review, 97, 311-331.
LEVINTHAL, D. A. 1991. Random-walks and organizational mortality. Administrative Science
Quarterly, 36, 397-420.
LEVINTHAL, D. A. & J. G. MARCH. 1993. The myopia of learning. Strategic Management
Journal, 14, 95-112.
LEVITT, B. & J. G. MARCH. 1988. Organizational learning. Annual Review of Sociology, 14:319-
340.
264
LEWIN, A. Y., C. P. LONG & T. N. CARROLL. 1999. The coevolution of new organizational
forms. Organization Science, 10, 535-550.
LITTLE, R. J. A. 1992. Regression with missing X’s – a review. Journal of the American Statistical
Association, 87, 1227-1237.
LUMPKIN, G. T. & G. G. DESS. 2001. Linking two dimensions of entrepreneurial orientation to
firm performance: The moderating role of environment and industry life cycle. Journal
of Business Venturing, 16, 429-+.
MACMILLAN, I., M. L. MCCAFFERY & G. VANWIJK. 1985. Competitors responses to easily
imitated new products - exploring commercial banking product introductions. Strategic
Management Journal, 6, 75-86.
MARCH, J. G. 1991. Exploration and exploitation in organizational learning. Organization
Science, 2, 71–87.
MARCH, J. G. & Z. SHAPIRA. 1992. Variable risk preferences and the focus of attention.
Psychological Review, 99, 172-183.
MCGAHAN, A. M. & B. S. SILVERMAN. 2001. How does innovative activity change as industries
mature? International Journal of Industrial Organization, 19, 1141-1160.
MCGAHAN, A. M. 2004. How industries change. Harvard Business Review, 82, 86-+.
MILLER, D. & M. J. CHEN. 1994. Sources and consequences of competitive inertia - a study of
the united-states airline industry. Administrative Science Quarterly, 39, 1-23.
MILLER, D. & M. J. CHEN. 1996a. Nonconformity in competitive repertoires: A sociological
view of markets. Social Forces, 74, 1209-1234.
MILLER, D. & M. J. CHEN. 1996b. The simplicity of competitive repertoires: an empirical
analysis. Strategic Management Journal, 17, 419-439.
MILLER, D. & P. H. FRIESEN. 1982. Innovation in conservative and entrepreneurial firms - 2
models of strategic momentum. Strategic Management Journal, 3, 1-25.
NADKARNI, S. & P. S. BARR. 2008. Environmental context, managerial cognition, and strategic
action: an integrated view. Strategic Management Journal, 29, 1395-1427.
NELSON, R. R. & S. G. WINTER. 1982. The Schumpeterian tradeoff revisited. American
Economic Review, 72, 114-132.
NORTON, E. C., WANG, H. & AI, C. 2004. Computing interaction effects and standard errors in
logit and probit models. Stata Journal, 4, 154-167
OCASIO, W. 1995. The enactment of economic adversity - a reconciliation of theories of failure-
induced change and threat-rigidity. In Research in Organizational Behavior: an Annual
Series of Analytical Essays and Critical Reviews, 17.
OJALA, J., LAMBERG, J.-A., A. AHOLA & A. MELANDER. 2006. The Ephemera of success:
Strategy, structure and performance in the forest industries. In Lamberg et al. (Eds.):
The evolution of competitive strategies in global forestry industries: Comparative
Perspectives, 1–30. Dordrecht, NE: Springer.
PESENDORFER, M. 2003. Horizontal mergers in the paper industry. Rand Journal of
Economics, 34, 495-515.
265
PETERAF, M. A. 1993. The cornerstones of competitive advantage - a resource-based view.
Strategic Management Journal, 14, 179-191.
PORTER, M. E. 1980. Competitive Strategy: Techniques for analyzing Industries and
Competitors. New York, NY: Free Press.
PORTER, M. E. 1985. Competitive advantage: Creating and sustaining superior performance.
New York, NY: Free Press.
PORTER, M. E. 1991. Towards a dynamic theory of strategy. Strategic Management Journal, 12,
95-117.
PRAHALAD, C. K. & G. HAMEL. 1990. The core competence of the organization. Harvard
Business Review, 68, 79-91.
RUMELT, R. P. 1974. Strategy, Structlure and Economic Performance. Boston, MA: Harvard
University Press.
SAJASALO, P. 2003. Strategies in transition. The Internationalization of the Finnish Forest
Industry Companies. Jyväskylä, FI: University of Jyväskylä.
SCHUMPETER, J. 1934. The theory of economic development. Cambridge, MA: Harvard
University Press.
SCHUMPETER, J. 1950. Capitalism, socialism, and democracy. New York, NY: Harper and Row.
SILVERMAN, B. S. & J. A. C. BAUM. 2002. Alliance-based competitive dynamics. Academy of
Management Journal, 45, 791-806.
SINGH, J. V. 1986. Performance, slack, and risk-taking in organizational decision-making.
Academy of Management Journal, 29, 562-585.
SMITH, K. G., C. M. GRIMM, M. J. GANNON & M. J. CHEN. 1991. organizational information-
processing, competitive responses, and performance in the united-states domestic
airline industry. Academy of Management Journal, 34, 60-85.
SMITH, K. G., C. M. GRIMM, S. WALLY & G. YOUNG. 1997. Strategic groups and rivalrous firm
behavior: Towards a reconciliation. Strategic Management Journal, 18, 149-157.
STAW, B. M., L. E. SANDELANDS & J. E. DUTTON. 1981. Threat-rigidity effects in
organizational-behavior - a multilevel analysis. Administrative Science Quarterly, 26,
501-524.
STUART, T. E. & J. M. PODOLNY. 1996. Local search and the evolution of technological
capabilities. Strategic Management Journal, 17, 21-38.
TEECE, D. J. 1986. Profiting from technological innovation - implications for integration,
collaboration, licensing and public-policy. Research Policy, 15, 285-305.
TEECE, D. J., G. PISANO & A. SHUEN. 1997. Dynamic capabilities and strategic management.
Strategic Management Journal, 18, 509-533.
TRANFIELD, D., D. DENYER & P. SMART. 2003. Towards a methodology for developing
evidence-informed management knowledge by means of systematic review. Brittish
journal of management, 14, 207-22
266
UOTILA, J., M. MAULA, T. KEIL & S. A. ZAHRA. 2009. Exploration, exploitation, and financial
performance: analysis of s&p 500 corporations. Strategic Management Journal, 30, 221-
231.
UTTERBACK, J. M. & F. F. SUAREZ. 1993. Innovation, competition, and industry structure.
Research Policy, 22, 1-21.
VAN DE VEN, A. H. & P. E. JOHNSON. 2006. Knowledge for theory and practice. Academy of
Management Review, 31, 802-821.
VENKATRAMAN, N. 1989. Strategic orientation of business enterprises - the construct,
dimensionality, and measurement. Management Science, 35, 942-962.
VERMEULEN, F. & H. BARKEMA. 2001. Learning through acquisitions. Academy of
Management Journal, 44, 457-476.
WALSH, J. P. 1995. Managerial and organizational cognition - notes from a trip down memory
lane. Organization Science, 6, 280-321.
WESTPHAL, J. D. & E. J. ZAJAC. 1998. The symbolic management of stockholders: Corporate
governance reforms and shareholder reactions. Administrative Science Quarterly, 43,
127-153.
WHETTEN, D. A. 1989. What constitutes a theoretical contribution. Academy of Management
Review, 14, 490-495.
WIGGINS, R. R. & T. W. RUEFLI. 2005. Schumpeter's ghost: Is hypercompetition making the
best of times shorter? Strategic Management Journal, 26, 887-911.
YOUNG, G., K. G. SMITH & C. M. GRIMM. 1996. "Austrian'' and industrial organization
perspectives on firm-level competitive activity and performance. Organization Science,
7, 243-254.
ZAMMUTO, R. & CAMERON, S. 1985. Environmental decline and organizational response. In
Research in Organizational Behavior: an Annual Series of Analytical Essays and Critical
Reviews, 7.
267
CHAPTER 8
SUCCESS STRATEGIES IN DECLINING INDUSTRIES: A CASE SURVEY
ANTTI SIHVONEN
Aalto University Helsinki School of Economics [email protected]
1 INTRODUCTION
The state of decline has become more prevalent in our western societies due to the present
global recession. The Oxford English Dictionary provides the following two related definitions
of the word decline:
verb: become smaller, weaker, or less in quality or quantity
noun: a gradual and continuous loss of strength, numbers, or value.
In short, decline, as a word, has two meanings. First, decline implies diminishing of an entity.
Second, decline implies gradualism and continuity. Therefore, decline in itself implies explicitly
weakening or loss, but it also implicitly implies preservation. Thus, the word itself has a
dualistic meaning. This idea of duality plays a central role in this research.
1.1 Research area and problem
Industries are not static but evolve over time and this evolution may lead to growth but also to
decline of an industry (Klepper 1996; Jonavick and McDonald 1994; Gort and Klepper 1982;
Ghemawat and Nalebuff 1985; 1990). As scholars have an implicit bias towards studying growth,
268
the decline of industries has received less attention, and our knowledge of the declining
industries is still imperfect (Cameron and Zammuto 1983; Whetten 1980). This opens up a
fertile ground for new research, on which this research focuses on.
This research concentrates on declining industries as the context of operations for
organizations. Declining industry, for the purposes of this research, can be defined as a
deteriorating environment that leads to diminished opportunities for organization operating in it
(Ghemawat and Nalebuff 1985; 1990;Whetten 1980; Zammuto and Cameron 1985, p. 226). The
definition of a declining industries explicitly states that the environment deteriorates, it also
implicitly states that it offers continuity and possibilities for organizations, as otherwise
industries would not decline but only seize to exist. Therefore, success in this research will be
defined in relation to environment, meaning that the organizations which are able to stay in
business while others exit are successful. This is congruent with the population ecology
perspective of success, where success can be defined as selection, where survival equals success
as the organization continues to exist while other seize to do so (Aldrich 2008, p. 29; Hannan
and Freeman 1977). Therefore, deriving from the notions, the research problem of this research
problem, the explanandum, can be defined as:
Why some organizations succeed in declining industries, while others do not?
After establishing the explanandum, the question to be explained, basis for the explanans, the
answer to the question, has to be established.
The success of organizations is explained in this research with the concept of strategy. The
reason for choosing strategy as the explanans is that on the level of organization as a whole, the
direction, and the execution of this direction is guided by strategy (Porter 1985, p. 1; Prahalad
and Hamel 1994). Strategy, for the purposes of this research, is defined as a pattern in a stream of
decisions made by an organization (Mintzberg 1978; Mintzberg and Waters 1982; 1985; Miles
and Snow 2007, p. 7). This means that organizations exhibit patterns of behavior that can be
labeled as the strategy of an organization, as they guide the organization to a direction.
Therefore, the reasons for success in declining industries will be explained by the patterns of
decisions, labeled strategy, that organizations use to steer their selves in this context.
269
Widely used way of classifying strategy of an organization is the Miles and Snow typology,
which is built around archetypes of strategies (Hambrick 1983; Miles et al. 1978; Miles and Snow
2003; Zahra and Pearce 1990). This research adopts this typology, as it has been identified to be
a comprehensive way of classifying strategy of an organization (Zahra and Pearce 1990; Segev
1989).
1.2 Research gap
This thesis seeks to contribute to two central theoretical discourses where research gaps exist;
these are the strategic choice discourse and the population ecology discourse (Aldrich 1979;
Hannan and Freeman 1977; Child 1972; 1997; Miles et al. 1978). By choosing these two
perspectives, it is possible to analyze success from both the level of single organization and the
population (Zammuto 1988). A closer description of the interaction of population ecology and
strategic choice perspective can be found from the theoretical synthesis.
Firstly, this research aims to produce an empirical investigation of success strategies in
declining industries that aggregates conclusions from a large case material. As organizations
experience different types of decline, a more fine-grained approach is needed to describe the
conditions of decline (Cameron 1983; Zammuto 1983). Therefore, this research utilizes a
typology of decline by Zammuto and Cameron (1985) to identify and describe different decline
conditions. This research aims at identifying what kind of strategies lead to success in each of
these decline conditions.
Secondly, this research extends the research on the Miles and Snow typology, which has been
studied in other parts of the industry life cycle but not the decline phase (Hambrick 1983; Zahra
and Pearce 1990; Zajac and Shortell 1989). These studies together verify that all the strategy
types are present in industries that are in other stages of the life cycle, and that performance
differences exist between the strategy types. Extending the typology into the last stage of the
industry life cycle can bring new insight of the success of these strategies, and how these
strategies behave in adverse environments, and in relation to other stages of the life cycle.
270
1.3 Research questions
The research problem is operationalized through the use of three research questions. These
questions are formulated so that they expand the research problem into three distinct
questions that can be answered within the scope of this research.
The first research question aims at opening the array of success strategies in declining
industries, establishing the strategy types that can succeed in declining industries. The
different strategy types are represented by the strategic archetypes of the Miles and Snow
typology (Hambrick 1983; Miles et al. 1978; Miles and Snow 2003; Zahra and Pearce 1990). This
logic leads to presenting the first research question:
1. What strategy types are successful in declining industries?
The second research question is built on the success strategies identified by the first question.
As decline types are diverse, the second question aims at defining what kind of strategies
succeed in which decline conditions. This would establish fit between strategy types and the
decline conditions (Prescott 1986; Venkatraman and Camillus 1984; Venkatraman and Prescott
1990; Zammuto and Cameron 1985). This logic leads to presenting the second research
question:
2. Which strategy types succeed in which types of decline?
The third research question aims extending the second question. After establishing the success
of different strategy types in different decline conditions, the third question aims at producing
higher order conclusion of the success strategies. This leads to presenting the third research
question:
3. How is the strategy typology, as a whole, aligned to the decline conditions?
This would yield findings at the level both typologies as whole and how these two typologies
are aligned to each other when success is used as a constant variable. As the function of a good
research is not only to record occurrences in the past but also to produce theories predicting
271
the future, the function of the third question is to open this path for the research (Eisenhardt
1989; Eisenhardt and Graebner 2007).
These three research question guide the research and its direction. By answering the three
research questions, an answer for the research problem can be generated, and the purpose of
this research can be reached.
1.4 Previous research
This subsection will briefly discuss the previous research concerning declining industries to
produce a concise overview of research in this field. Previous research in declining industries
has focused on three different streams of research that are strategic management, population
ecology and exit behavior of organizations from the declining industry (Ghemawat and
Nalebuff 1985;1990; Harrigan 1980a; 1980b; Harrigan and Porter 1985; Zammuto and Cameron
1985; )
Strategic management research on declining industries culminates around the works of
Harrigan. These articles focus on environmental attractiveness and structural factors and
relative competitive strength of the organization. Deriving from these works, Harrigan
developed strategic options for organization for organization operating in declining industries.
These included strategies such as harvest the industry, exit quickly, shrink selectively or focus
on a niche. Although being managerially relevant, these studies lack grounding on explicit
types of decline and suggestions on what kind of responses are effective in these contexts.
(Harrigan 1980a; 1980b; Harrigan and Porter 1985) These ideas initially sparked the interest for
choosing the approach for this research.
Population ecology research on declining industries has focused greatly around the work of
Zammuto and Cameron. Their research culminated around the generation of a typology of
different decline conditions. This typology was intended to depicting why organizations face
different types of decline and why there is variation in the prescriptions on how to respond to
decline. (Cameron 1983; Cameron and Zammuto 1983; Zammuto 1983; Zammuto and Cameron
1985) This typology was also adopted in this research to depict different types of decline.
272
Discourse on exit behavior crystallizes around the reasoning of why organization and which of
them exit from a declining industry when demand begins to shrink (Ghemawat and Nalebuff
1985;1990; Reynolds1988). The discourse focuses on unveiling the underlying reasoning for exit
behavior of organizations. As this study concentrates on success in declining industries, the
discourse of exit behavior is complimentary to the current research, but these two still have
different focus.
2 THEORETICAL APPROACH TO THE PHENOMENON
This section presents the main theoretical approaches used in this research and builds the
theoretical framework. First, industry life cycles are introduced. The decline stage of the
industry life cycle and different decline conditions are emphasized. The concept of strategy is
presented as well as the strategy typology of Miles and Snow (2003) is presented. In the
following theoretical discussion I will draw from these approaches to formulate a theoretical
framework.
2.1 Industry life cycles
Industry life cycles can be defined as the way in which evolution occurs in industries, particularly
those that are technologically progressive (Klepper 1996; 1997; Jonavick and MacDonald 1994;
Gort and Klepper 1982; Utterback and Abernathy 1975). The theory of Industry life cycles is
based on product life cycle concept (Abernathy and Clark 1985; Utterback and Abernathy 1975).
This concept was first introduced in the marketing literature but from where it has been
adapted to industry evolution literature as it has been shown to capture the way how industries
evolve (Klepper 1997).
Depending on the approach, industry life cycle has three or four stages. Authors such as
Williamson (1975, p. 215) recognize only three stages in the life cycle, and in so doing leave the
decline stage only as an afterthought. Instead this research adopts the four stage view of
industry life cycles separating the decline as a distinct stage in the life cycle. In the following
four paragraphs these stages will be described in detail.
273
In the introduction stage market volumes are low, uncertainty of the industry is high, product
designs are evolving and are possibly primitive, and production technology is still developing
(Agarval and Bayus 2004; Filson 2002; Klepper 1996; 1997; Jonavick and MacDonald 1994).
Many firms enter the industry in this stage and a variation of different versions of the product
is offered to the customers (Klepper 1996; 1997). Therefore, introduction is a stage where empty
space in the market is abundant and the actual product is not yet clearly defined.
In the growth stage output of the industry is high, the design of the offering starts to stabilize
and find its final form and specialized production equipment suited for the industry starts to
overtake the old equipment (Filson 2002; Klepper 1996; 1997; Jonavick and MacDonald 1994;
Utterback and Abernathy 1975). Therefore growth stage marks an initial stabilization of the
industry, in other words the product design and the method of producing are beginning to
become unified and standardized.
Maturity stage is the third stage in the life cycle as it marks the final stabilization of the
industry. Mature industry is marked by slow growth in output, further decline in the entry of
new organizations in the industry, stabilization of the market shares between the actors in the
market. This results in a shift in emphasis from innovation to increasing manufacturing
efficiency and enhancing marketing and management activities. (Klepper 1996; 1997; Jonavick
and MacDonald 1994; Utterback and Abernathy 1975)
The last stage of the life cycle is the decline stage, which is the focus of this research. The
decline stage of the life cycle has received little attention in the industry life cycle literature as
can be seen from the research made by Quinn and Cameron (1983). The definition of the
decline stage is built around the concept of niche. Niche can be defined as an environmental
location populated by a number of organizations (Zammuto 1983; Zammuto and Cameron 1985,
p. 226). The decline stage can be defined as a condition where the niche cannot support the
amount of activities, thus diminishing the carrying capacity of the niche (Cameron and
Zammuto 1983; Zammuto and Cameron 1985, p. 228). Obvious determinant of decline is
shrinking demand, resulting in capacity reductions among the organizations and pressure to
exit the industry (Ghemawat and Nalebuff 1985). Other possible determinants include changes
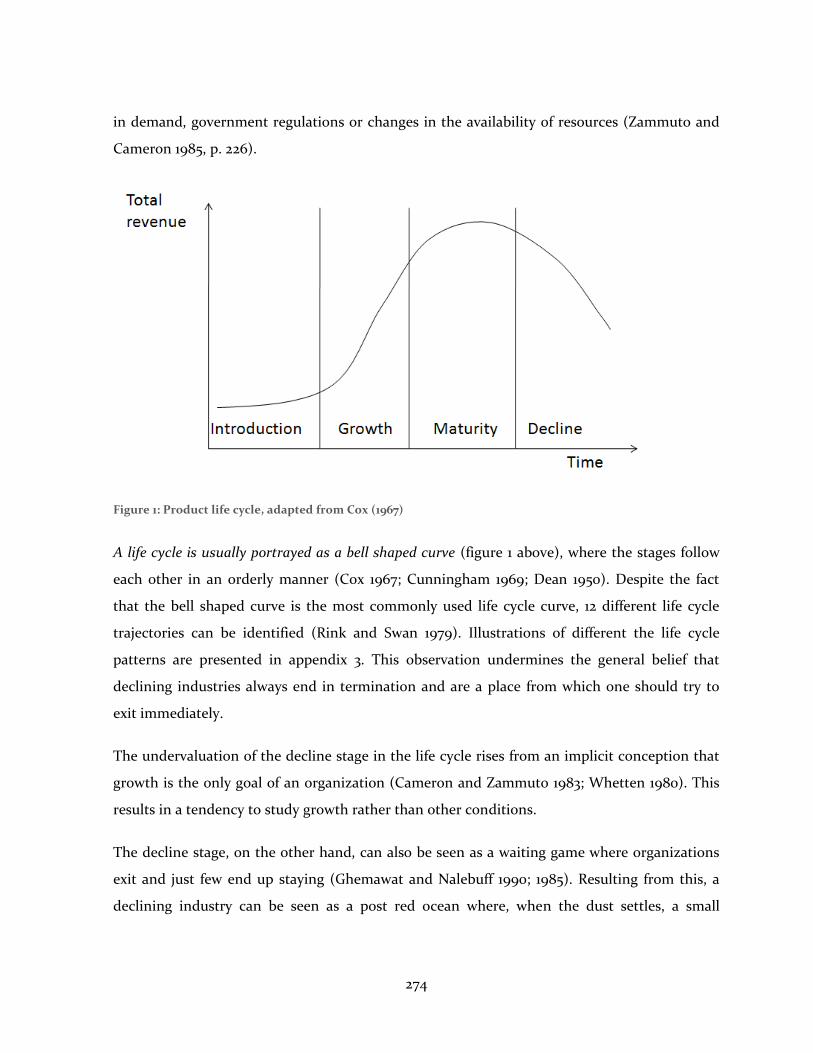
274
in demand, government regulations or changes in the availability of resources (Zammuto and
Cameron 1985, p. 226).
Figure 1: Product life cycle, adapted from Cox (1967)
A life cycle is usually portrayed as a bell shaped curve (figure 1 above), where the stages follow
each other in an orderly manner (Cox 1967; Cunningham 1969; Dean 1950). Despite the fact
that the bell shaped curve is the most commonly used life cycle curve, 12 different life cycle
trajectories can be identified (Rink and Swan 1979). Illustrations of different the life cycle
patterns are presented in appendix 3. This observation undermines the general belief that
declining industries always end in termination and are a place from which one should try to
exit immediately.
The undervaluation of the decline stage in the life cycle rises from an implicit conception that
growth is the only goal of an organization (Cameron and Zammuto 1983; Whetten 1980). This
results in a tendency to study growth rather than other conditions.
The decline stage, on the other hand, can also be seen as a waiting game where organizations
exit and just few end up staying (Ghemawat and Nalebuff 1990; 1985). Resulting from this, a
declining industry can be seen as a post red ocean where, when the dust settles, a small
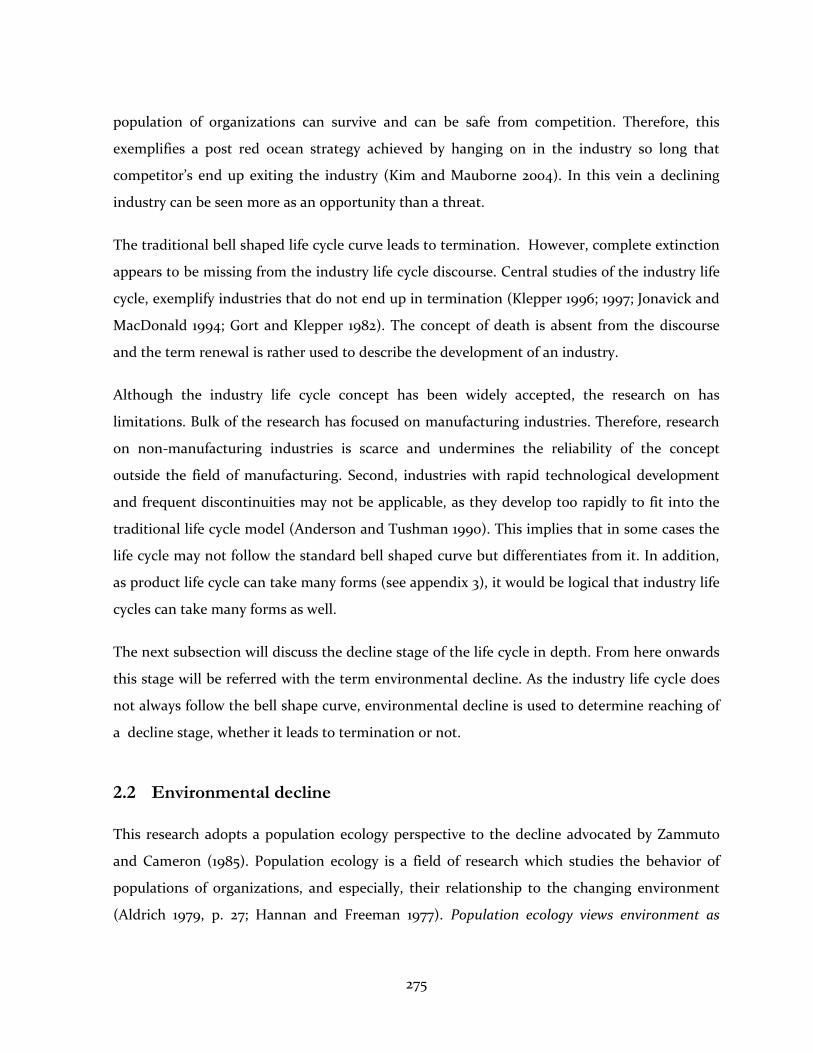
275
population of organizations can survive and can be safe from competition. Therefore, this
exemplifies a post red ocean strategy achieved by hanging on in the industry so long that
competitor’s end up exiting the industry (Kim and Mauborne 2004). In this vein a declining
industry can be seen more as an opportunity than a threat.
The traditional bell shaped life cycle curve leads to termination. However, complete extinction
appears to be missing from the industry life cycle discourse. Central studies of the industry life
cycle, exemplify industries that do not end up in termination (Klepper 1996; 1997; Jonavick and
MacDonald 1994; Gort and Klepper 1982). The concept of death is absent from the discourse
and the term renewal is rather used to describe the development of an industry.
Although the industry life cycle concept has been widely accepted, the research on has
limitations. Bulk of the research has focused on manufacturing industries. Therefore, research
on non-manufacturing industries is scarce and undermines the reliability of the concept
outside the field of manufacturing. Second, industries with rapid technological development
and frequent discontinuities may not be applicable, as they develop too rapidly to fit into the
traditional life cycle model (Anderson and Tushman 1990). This implies that in some cases the
life cycle may not follow the standard bell shaped curve but differentiates from it. In addition,
as product life cycle can take many forms (see appendix 3), it would be logical that industry life
cycles can take many forms as well.
The next subsection will discuss the decline stage of the life cycle in depth. From here onwards
this stage will be referred with the term environmental decline. As the industry life cycle does
not always follow the bell shape curve, environmental decline is used to determine reaching of
a decline stage, whether it leads to termination or not.
2.2 Environmental decline
This research adopts a population ecology perspective to the decline advocated by Zammuto
and Cameron (1985). Population ecology is a field of research which studies the behavior of
populations of organizations, and especially, their relationship to the changing environment
(Aldrich 1979, p. 27; Hannan and Freeman 1977). Population ecology views environment as
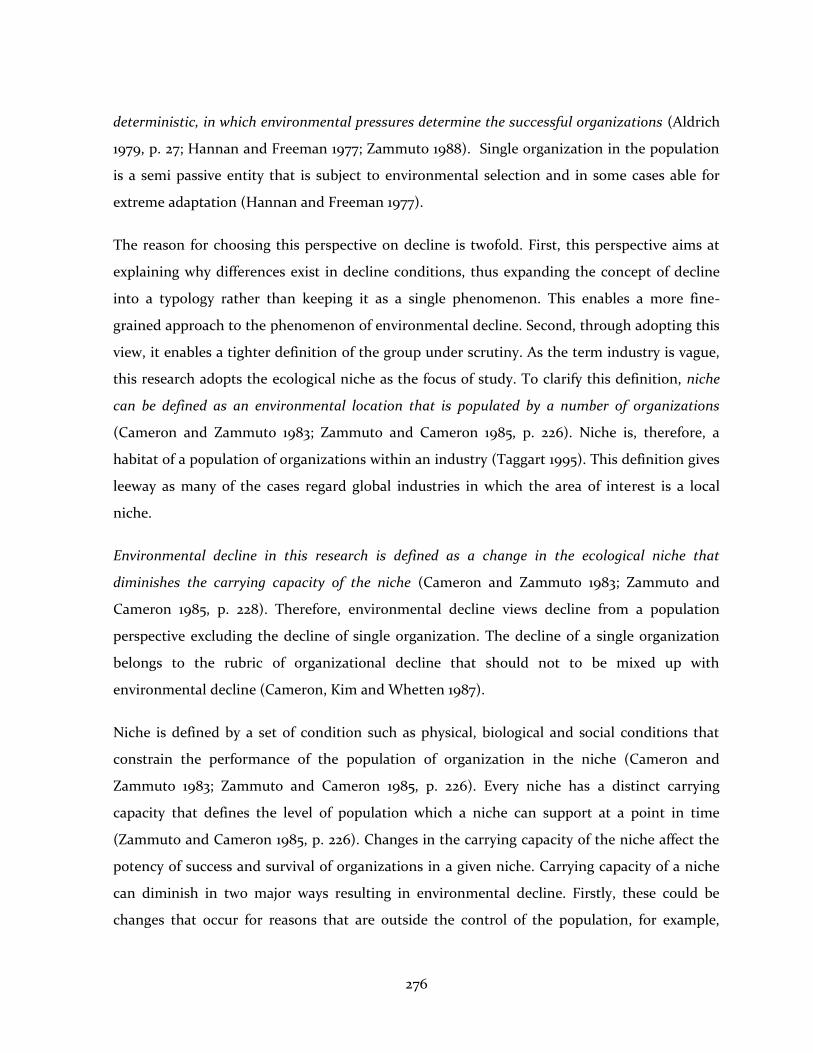
276
deterministic, in which environmental pressures determine the successful organizations (Aldrich
1979, p. 27; Hannan and Freeman 1977; Zammuto 1988). Single organization in the population
is a semi passive entity that is subject to environmental selection and in some cases able for
extreme adaptation (Hannan and Freeman 1977).
The reason for choosing this perspective on decline is twofold. First, this perspective aims at
explaining why differences exist in decline conditions, thus expanding the concept of decline
into a typology rather than keeping it as a single phenomenon. This enables a more fine-
grained approach to the phenomenon of environmental decline. Second, through adopting this
view, it enables a tighter definition of the group under scrutiny. As the term industry is vague,
this research adopts the ecological niche as the focus of study. To clarify this definition, niche
can be defined as an environmental location that is populated by a number of organizations
(Cameron and Zammuto 1983; Zammuto and Cameron 1985, p. 226). Niche is, therefore, a
habitat of a population of organizations within an industry (Taggart 1995). This definition gives
leeway as many of the cases regard global industries in which the area of interest is a local
niche.
Environmental decline in this research is defined as a change in the ecological niche that
diminishes the carrying capacity of the niche (Cameron and Zammuto 1983; Zammuto and
Cameron 1985, p. 228). Therefore, environmental decline views decline from a population
perspective excluding the decline of single organization. The decline of a single organization
belongs to the rubric of organizational decline that should not to be mixed up with
environmental decline (Cameron, Kim and Whetten 1987).
Niche is defined by a set of condition such as physical, biological and social conditions that
constrain the performance of the population of organization in the niche (Cameron and
Zammuto 1983; Zammuto and Cameron 1985, p. 226). Every niche has a distinct carrying
capacity that defines the level of population which a niche can support at a point in time
(Zammuto and Cameron 1985, p. 226). Changes in the carrying capacity of the niche affect the
potency of success and survival of organizations in a given niche. Carrying capacity of a niche
can diminish in two major ways resulting in environmental decline. Firstly, these could be
changes that occur for reasons that are outside the control of the population, for example,
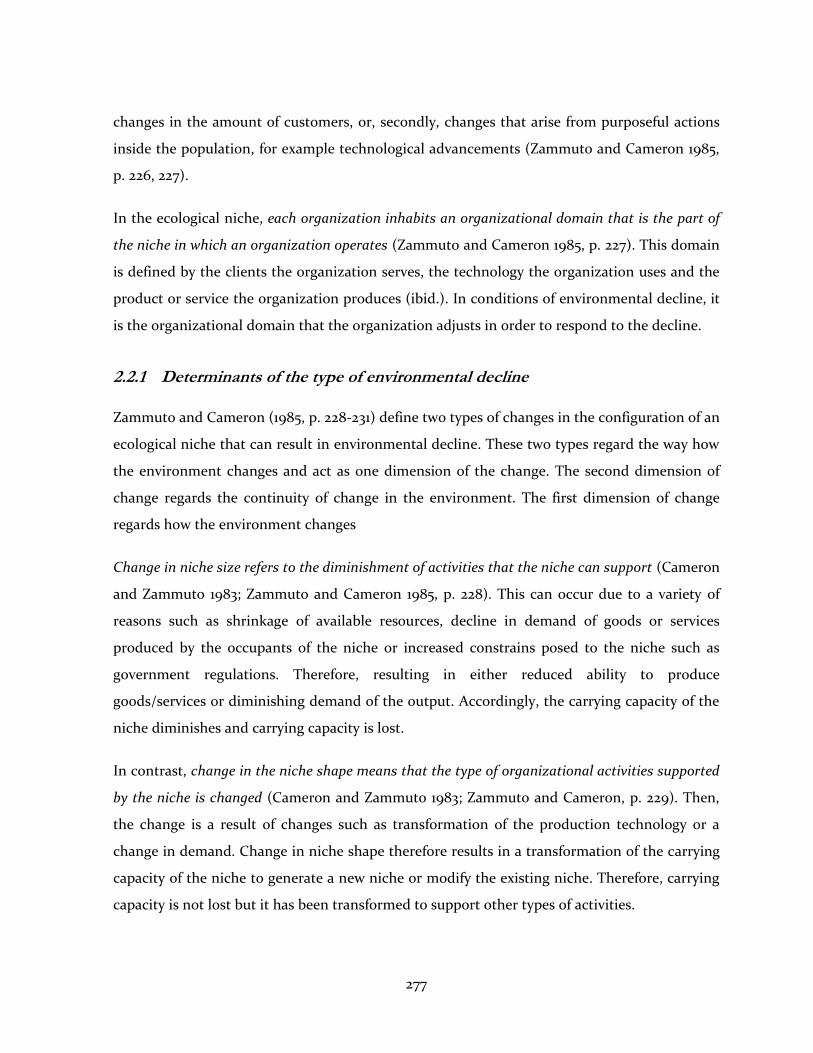
277
changes in the amount of customers, or, secondly, changes that arise from purposeful actions
inside the population, for example technological advancements (Zammuto and Cameron 1985,
p. 226, 227).
In the ecological niche, each organization inhabits an organizational domain that is the part of
the niche in which an organization operates (Zammuto and Cameron 1985, p. 227). This domain
is defined by the clients the organization serves, the technology the organization uses and the
product or service the organization produces (ibid.). In conditions of environmental decline, it
is the organizational domain that the organization adjusts in order to respond to the decline.
2.2.1 Determinants of the type of environmental decline
Zammuto and Cameron (1985, p. 228-231) define two types of changes in the configuration of an
ecological niche that can result in environmental decline. These two types regard the way how
the environment changes and act as one dimension of the change. The second dimension of
change regards the continuity of change in the environment. The first dimension of change
regards how the environment changes
Change in niche size refers to the diminishment of activities that the niche can support (Cameron
and Zammuto 1983; Zammuto and Cameron 1985, p. 228). This can occur due to a variety of
reasons such as shrinkage of available resources, decline in demand of goods or services
produced by the occupants of the niche or increased constrains posed to the niche such as
government regulations. Therefore, resulting in either reduced ability to produce
goods/services or diminishing demand of the output. Accordingly, the carrying capacity of the
niche diminishes and carrying capacity is lost.
In contrast, change in the niche shape means that the type of organizational activities supported
by the niche is changed (Cameron and Zammuto 1983; Zammuto and Cameron, p. 229). Then,
the change is a result of changes such as transformation of the production technology or a
change in demand. Change in niche shape therefore results in a transformation of the carrying
capacity of the niche to generate a new niche or modify the existing niche. Therefore, carrying
capacity is not lost but it has been transformed to support other types of activities.
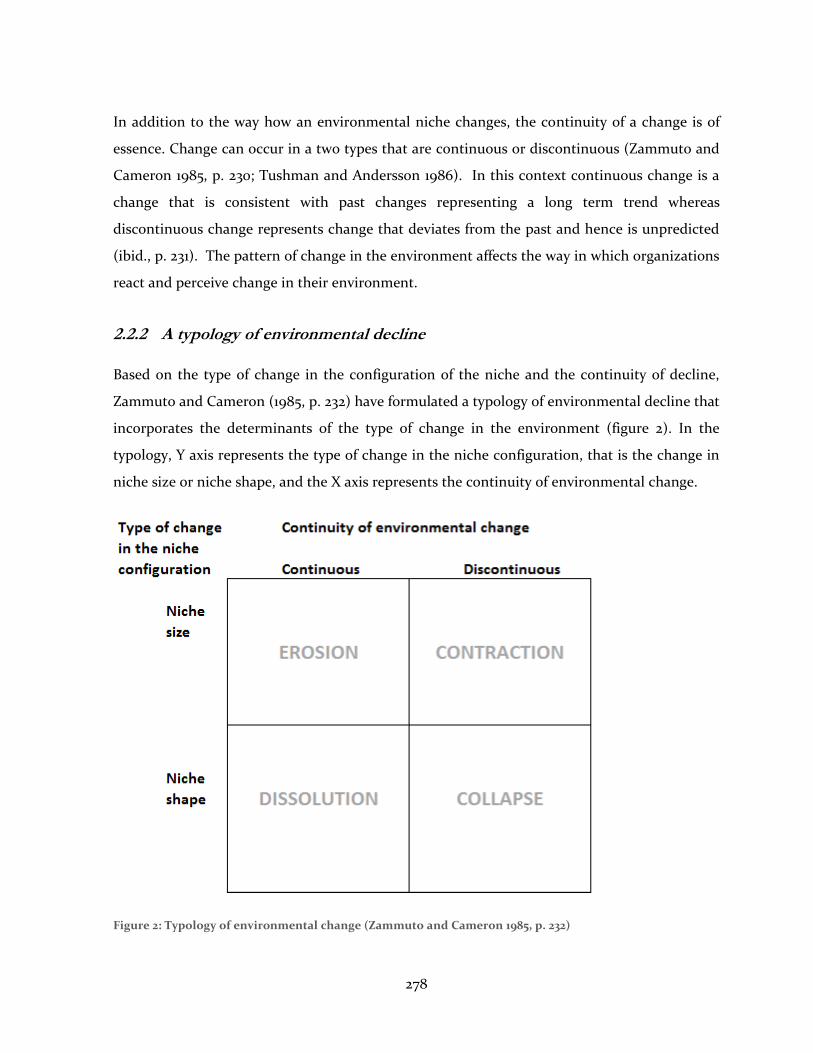
278
In addition to the way how an environmental niche changes, the continuity of a change is of
essence. Change can occur in a two types that are continuous or discontinuous (Zammuto and
Cameron 1985, p. 230; Tushman and Andersson 1986). In this context continuous change is a
change that is consistent with past changes representing a long term trend whereas
discontinuous change represents change that deviates from the past and hence is unpredicted
(ibid., p. 231). The pattern of change in the environment affects the way in which organizations
react and perceive change in their environment.
2.2.2 A typology of environmental decline
Based on the type of change in the configuration of the niche and the continuity of decline,
Zammuto and Cameron (1985, p. 232) have formulated a typology of environmental decline that
incorporates the determinants of the type of change in the environment (figure 2). In the
typology, Y axis represents the type of change in the niche configuration, that is the change in
niche size or niche shape, and the X axis represents the continuity of environmental change.
Figure 2: Typology of environmental change (Zammuto and Cameron 1985, p. 232)
279
The typology introduces four different types of environmental changes. These types of
environmental change are erosion, contraction, dissolution and collapse. These conditions of
environmental change are discussed in detail in the following paragraphs.
Erosion is a condition of decline in which the niche size gradually decreases decreasing the
carrying capacity of the niche (Cameron and Zammuto 1983; Zammuto and Cameron 1985, p.
231). In this condition, the carrying capacity of the niche steadily decreases hindering the ability
of organizations in the niche to survive. In practice, erosion is a slow, steady and predictable
decline of the environment of a population of organizations. It does not cause an immediate
threat for the survival of organizations and gives time to consider alternatives (Cameron and
Zammuto 1983).
Contraction is a decline condition in which the size of the niche suddenly decreases decreasing the
carrying capacity of the niche (Cameron and Zammuto 1983; Zammuto and Cameron 1985, p.
231). This type of decline suddenly decreases the carrying capacity of the niche that cannot be
predicted by the organization before the change in the environment actually occurs. This
generates a rapid shock in the niche placing the survival of an organization under jeopardy
(Cameron and Zammuto 1983).
Dissolution represents a decline condition where a niche gradually transforms into another as the
shape of the niche changes and the carrying capacity transforms (Cameron and Zammuto 1983;
Zammuto and Cameron 1985, p. 231). This type of change represents a type of decline where the
niche evolves into another due to changes such as technological change or change in demand.
This makes the old way of operating progressively less acceptable in the environment
(Cameron and Zammuto 1983). Therefore, the niche goes through a steady evolution where the
demand, resources or other factor transforms the niche, not necessarily resulting in lost
carrying capacity.
Collapse is a decline condition in which the change in niche shape is so rapid that the existing
niche is more or less wiped out and replaced by a new niche that is able to respond to the changes
in the carrying capacity of the niche (Cameron and Zammuto 1983; Zammuto and Cameron
1985, p. 232). This represents a dramatic and rapid abolishment of the old niche that is replaced
280
by a new niche. In practice, collapse is a sudden and dramatic change in the type of activities
the niche supports which can result from changes such as rapid technological change or change
in legislation. Despite this, the carrying capacity is not lost, but transformed rapidly due to
changes in demand, resources, legislation or any other similar reason.
The value of the typology lies in its ability to explain why there are different conditions of
decline between populations, why different types of organizations in a population do well when
others do not and what types of strategies are likely to be productive in different conditions of
decline (Zammuto and Cameron 1985, p. 232, 233). For the purposes of this research, the
typology enables the condition of decline to be broken down into distinct decline conditions.
This enables a more fine-grained analysis of the success strategies in declining industries.
2.3 Strategy as a concept and its relationship to environment
In this section, strategy as a concept will be discussed. This section will begin by defining
strategy for the purposes of this research. Strategic choice perspective is introduced where the
strategy, structure process view of Miles and Snow (2003) is chosen for closer examination.
Last, the concept of strategy environment coalignment is discussed.
Strategy is a term used far and wide and it has multitude of different definitions. For this
research, strategy is defined as a pattern in a stream of decisions made by and organization
(Mitzberg 1978; Mintzberg and Waters 1982; 1985; Miles and Snow 2003, p. 7). This perspective
enables strategy to be inferred from the behavior of the organization, where one can associate
strategy with intent and structure with action (Miles and Snow 2003, p. 7). Therefore, the
strategy of the organization manifests from the stream of choices it makes, in this research in
particularly regarding adjustments to environmental changes.
2.3.1 Strategic choice perspective
Strategic choice perspective was originally introduced as a corrective view to counter the view
that organizations are designed and structured by their operational contingencies, moreover it
states that leading groups in organizations have an active role and power to influence the
281
structures of the organization (Child 1972; 1997). The strategic choice perspective views leading
groups within organizations as empowered to steer the organization to different directions and
in this vein organization is not a victim of its environment but an actor that that is able to
make choices at least partly regardless of the environment (ibid.). In this sense, strategic
choices made by the organization are reflections of its top management and their perceptions
(Hambrick and Mason 1984; Miles et al. 1978).
Key issue in the strategic choice perspective is the relationship between organization and the
environment (Child 1997). On the contrary to environmental deterministic views such as
population ecology, strategic choice perspective draws attention to the various possibilities
enabling choice on part of the organizational actors and arguing that organizations act to create
their environment (ibid., Miles and Snow 2003, p. 5). Thus, the relation with environment is not
a constraining but rather an interactive (Child 1997). This is due to the notion that
organizational decision-makers have to respond to environmental feedback, which result in
new action choices through learning and, hence, making the role of environmental both a
constraint and also enabler of choice (ibid.). Although, population ecology and strategic choice
perspectives can be regarded as competing perspectives, their relationship will be discussed in
the theoretical synthesis.
Strategic choice is especially visible in the study of U.S. firms and hospitals by Miles and Snow.
In this research they developed a typology of policies organizations adopt to adapt to changes
in their environment (Miles et al. 1978; Miles and Snow 2003; Child 1997). The next two
subsections will present the Miles and Snow strategy typology and the underlying logic.
2.3.2 Organizational strategy, structure and process
Organizational adaptation to environmental change is a highly complex phenomenon. Miles,
Snow, Meyer and Coleman (1978) separate three aspects that are of essence in adapting to
changes in environment. These are strategy, that is the way an organization defines its product-
market domain, and construct mechanisms consisting of organizational structures and
processes (Miles et al. 1978). Through modifying the mechanisms organizations pursue these
strategies. Miles and Snow (2003, p. 21) argue that organizations adapt to their environment
282
through adaptive cycles where managers have to give attention and decide on three types of
problems that define the way how the organization adapts. These problems are the
entrepreneurial problem, the engineering problem and the administrative problem (ibid.; Miles
et al. 1978). In the following paragraphs these problems will be described in detail.
Entrepreneurial problem refers to deciding the product-market domain in which the organization
operates. The manner in which organizations solve this problem manifests when organizations
commit resources to achieving objectives that are set to the product-market domain.
This means that organizations project an image that defines the market in which the
organization aims at operating in. In addition, it also defines the organizations orientation
towards the market which can be for example orientation towards innovation or efficiency. The
entrepreneurial problem is most visible in organizations that are new or rapidly growing. (Miles
et al. 1978; Miles and Snow 2003, p. 21)
Engineering problem refers to the management’s solution and operationalization of the
entrepreneurial problem. Solving this problem involves selecting appropriate technology for
producing the chosen product or service while ensuring simultaneously the proper functioning
of the production system. Solving the engineering problem formulates a manifestation of the
solution to the entrepreneurial problem identified earlier as it is guided by it. (Miles et al. 1978
Miles and Snow 2003, p. 22)
Administrative problem refers to reduction of uncertainty in the organizational systems. This
involves a balancing act between rationalization and stability of the organizational structures
versus uncertainty and instability generated by evolution of the organization through
innovation. Therefore, the way how administrative problem is solved, largely contributes to the
stance and organization takes on structural stability and innovativeness. (Miles et al. 1978;
Miles and Snow 2003, p. 23)
Despite the complexity of organizational adaptation, organizations exhibit patterns in the way
they move through the adaptive cycle and solve the three interrelated problems (Miles et al.
1978). These patterns of adaptation in solving their entrepreneurial, engineering and
administrative problems represent the strategies organizations employ. Hence, the way an
283
organization moves through the adaptive cycle defines the organizations strategy. These
patterns are reflections of the strategic choices the organizations top management makes
(Hambrick and Mason 1984; Miles et al. 1978).
By adopting this view, strategy of an organization can be inferred from the structures, processes
and decisions of an organization. This enables one to define an organizations strategy from the
way it adjusts to its environment by examining its pattern of adjustment. Therefore, strategies
can be categorized on the basis of how the organization adjusts to environmental changes.
2.3.3 Miles and Snow strategy typology
Four types of strategies can be identified on the basis of the way an organization moves
through the adaptive cycle. These strategy types are named defender, prospector, analyzer and
reactor (Miles et al. 1978; Miles and Snow 2003, p. 29). They will be defined more closely in the
following paragraphs.
Defenders are strategy types that strive to generate a protected domain in the market that they
can defend and hold (Miles et al. 1978; Miles and Snow 2003, p. 29; Snow and Hrebiniak 1980).
Defenders actively prevent competition from entering their territory by for example using
competitive pricing and superior quality products. Top managers of these organizations
concentrate on the domain the organization dominates and seldom search for new
opportunities outside their own domain (Miles and Snow 2003, p. 29; Snow and Hrebiniak
1980). Thus they focus on a small organizational domain that seldom goes through changes. As
a conclusion, defenders aim at defending their domain in all possible ways.
Defenders define their entrepreneurial problems in terms of sealing off a portion of the market
to create a stable organizational domain. This problem can be solved in a number of ways, such
as occupying a narrow and a stable domain, aggressively defending the domain with for
example competitive prices and excellent service, ignoring developments of the market and
emphasis on cautious and incremental growth. (Miles et al. 1978) All these exemplify a way of
reacting which is focused around current operations and efficiency.
284
Defenders define their engineering problem as how to produce and distribute goods as
effectively as possible to dominate the domain in which they operate. Defenders tend to solve
this problem by focusing on cost efficient technologies, single technological core and
continuous improvement in technology to remain as efficient as possible. (Miles et al. 1978)
Furthermore, this represents a coherent solution to the entrepreneurial problem identified
earlier as these choices lead to focus and efficiency.
Defenders define their administrative problem in finding ways to maintain a control over the
organization to ensure efficiency of the operations. Defenders solve this problem by having
financial and production experts as the leaders of the dominant coalition whose tenure is long,
intensive cost focused planning, functional structure with a high degree of formalization,
centralized control of the organization. (Miles et al. 1978) These represent coherent ways of
responding to the administrative problem as they enhance stability and efficiency of the
organization.
Solutions to all these three problems have costs as well as benefits. First, it is difficult to
displace a defender from its position in the niche, but if a major change in the market would
occur a defenders’ survival could be threatened. As defenders solve their entrepreneurial
problem through technological efficiency they are not able to respond to substantial
technological changes. In addition, their administrative system is well suited for maintaining
stability whereas it lacks a capability to locate new market opportunities and respond to new
products introduced to the market. (Miles et al. 1978) While at the same time the
characteristics of this type have benefits, they also have downsides that need to be dealt with.
Prospectors are almost polar opposites of the defenders as they strive to find and exploit new
product and market opportunities (Miles et al. 1978; Miles and Snow 2003, p. 29; Snow and
Hrebiniak 1980). Prospectors actively seek for new markets and opportunities while keeping
low levels of attachment to their current technological core, and therefore aim at generating
competitive advantage by being first to exploit new opportunities. Top managers of these
organizations emphasize effectiveness as they focus on product research and development,
market research and basic engineering (Snow and Hrebiniak 1980). Prospectors focus on large,
285
constantly developing domains where they can utilize their capabilities to follow and create
change in a dynamic environment (Miles et al. 1978).
Prospectors define their entrepreneurial problem as locating new markets and exploit new
product opportunities. They tend to solve the problem by occupying a broad and continuously
developing domain, constantly monitoring the market for new opportunities, creating change
in the industry where they operate and growing through product and market developments
that can occur in spurts. (Miles et al. 1978) These represent a vivid organization that constantly
defines itself through the opportunities it manages to seize while keeping eyes open for new
opportunities to be seized.
Prospectors define their engineering problem as how to avoid long-term attachment to a single
technology that would constrain it. They solve this problem by focusing on flexible,
prototypical technologies, utilizing multiple technologies simultaneously and having low levels
of routinization. (Miles et al. 1978) This enables prospectors to be minimally attached to a
single technology and hence able to move quickly to adapt new technologies that present
opportunities to be on the cutting edge.
As prospectors focus on seeking new opportunities, they define their administrative problem as
how to facilitate and coordinate the diverse operations that they run simultaneously. They tend
to solve this problem by having marketing as well as research and development personnel as
the leading members of the dominant coalition that is large, diverse and transitory. They tend
to have comprehensive planning that is problem oriented, which is complemented by a product
structure with low degree of formalization and decentralized control. In order to accommodate
this, they have complex coordination mechanisms and performance measurement against
closest competitors. (Miles et al. 1978) All these choices steer the organization towards
proactive stance to its environment and new opportunity generation.
All these problems together inflict some benefits to prospectors but also incur some costs. The
organization is quite well protected against changing environments due to its capabilities while
it runs on a risk of low profitability as it is not able to focus on single technology that it could
exploit for sustained amounts of time. Technologically, the organization can respond very
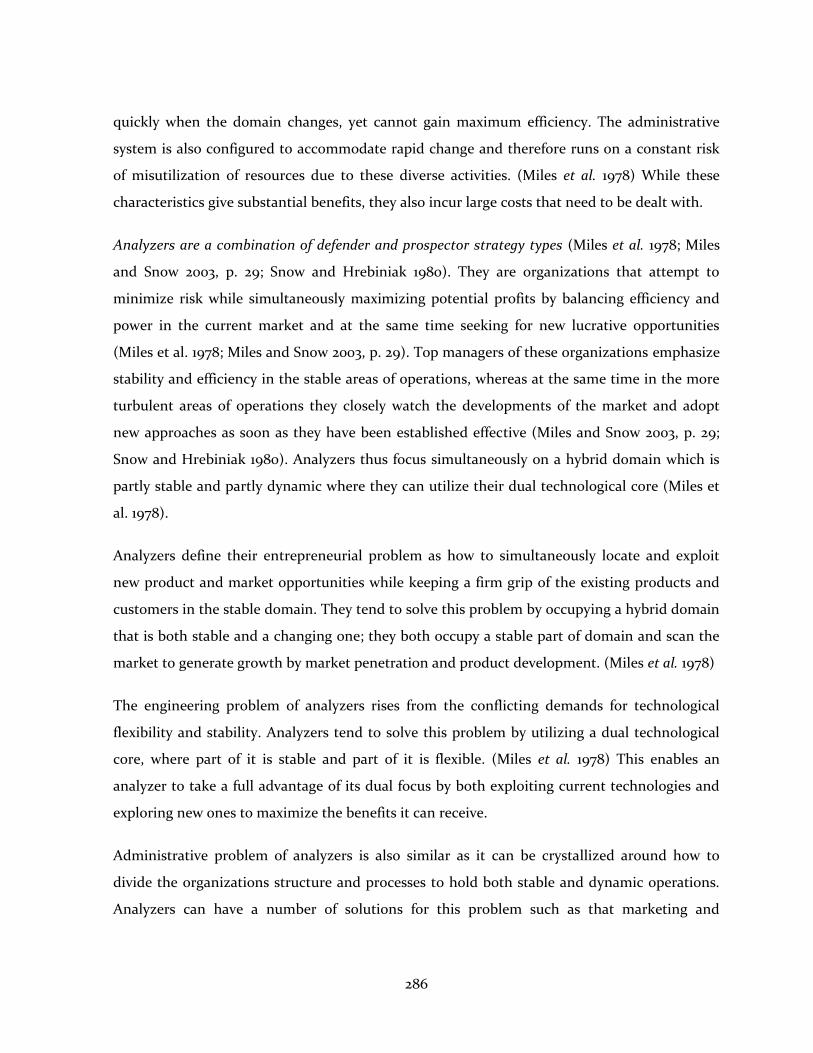
286
quickly when the domain changes, yet cannot gain maximum efficiency. The administrative
system is also configured to accommodate rapid change and therefore runs on a constant risk
of misutilization of resources due to these diverse activities. (Miles et al. 1978) While these
characteristics give substantial benefits, they also incur large costs that need to be dealt with.
Analyzers are a combination of defender and prospector strategy types (Miles et al. 1978; Miles
and Snow 2003, p. 29; Snow and Hrebiniak 1980). They are organizations that attempt to
minimize risk while simultaneously maximizing potential profits by balancing efficiency and
power in the current market and at the same time seeking for new lucrative opportunities
(Miles et al. 1978; Miles and Snow 2003, p. 29). Top managers of these organizations emphasize
stability and efficiency in the stable areas of operations, whereas at the same time in the more
turbulent areas of operations they closely watch the developments of the market and adopt
new approaches as soon as they have been established effective (Miles and Snow 2003, p. 29;
Snow and Hrebiniak 1980). Analyzers thus focus simultaneously on a hybrid domain which is
partly stable and partly dynamic where they can utilize their dual technological core (Miles et
al. 1978).
Analyzers define their entrepreneurial problem as how to simultaneously locate and exploit
new product and market opportunities while keeping a firm grip of the existing products and
customers in the stable domain. They tend to solve this problem by occupying a hybrid domain
that is both stable and a changing one; they both occupy a stable part of domain and scan the
market to generate growth by market penetration and product development. (Miles et al. 1978)
The engineering problem of analyzers rises from the conflicting demands for technological
flexibility and stability. Analyzers tend to solve this problem by utilizing a dual technological
core, where part of it is stable and part of it is flexible. (Miles et al. 1978) This enables an
analyzer to take a full advantage of its dual focus by both exploiting current technologies and
exploring new ones to maximize the benefits it can receive.
Administrative problem of analyzers is also similar as it can be crystallized around how to
divide the organizations structure and processes to hold both stable and dynamic operations.
Analyzers can have a number of solutions for this problem such as that marketing and
287
engineering form the most influential members of the dominant coalition. In addition,
intensive planning occurs between marketing and production regarding the stable portion of
the domain, whereas the new markets are planned among marketing, engineering and product
managers. These organizations can also have loose matrix structures that have moderate
centralized control and complex coordination mechanisms to hold together the different areas
of operations. To complement these, performance appraisal can be based both on efficiency
and effectiveness. (Miles et al. 1978) These all exemplify how analyzers strive to keep their dual
operations running simultaneously and as efficiently as possible.
These characteristics give analyzers benefits but incur also costs. While the analyzers are able
to incur low levels of investment in research and development and have an ability to imitate
successful products that minimizes their risk; they require a well balanced domain to ensure
flexibility and stability simultaneously. The dual core that analyzers leverage to serve stable and
changing operations can never assume full efficiency or effectiveness as it constantly drifts
between these two. The administrative system of analyzers is ideally suited for the dual
operations required by the technical and entrepreneurial problems bit it runs on a constant risk
of losing the balance that may be difficult to restore. (Miles et al. 1978) Therefore, while
analyzer can combine the two extreme strategy types, they run on a constant risk of falling out
of balance and losing efficiency and effectiveness. Still, this strategy type exemplified an
organization that both lives in the present by exploiting current opportunities but also explores
new opportunities can be used in the future.
Reactors are organizations that exhibit inconsistent and unstable strategies (Miles et al. 1978;
Miles and Snow 2003, p. 29; Snow and Hrebiniak 1980). Reactors lack the consistent response
mechanism and proactive stance towards their environment that the other three hold. This
result from their adaptive cycles, which is inconsistent and inappropriate. Top managers of
these organizations are generally unable or unwilling to develop the competencies required to
assume a stable strategic form. Due to their reactive relationship to environment and inability
to respond accordingly, they tend to perform worse than all the other three strategy types that
exhibit a consistent strategy (Miles et al. 1978). Due to these reasons organizations cannot
continue to behave like reactor indefinitely and will either move to a consistent strategy or
seize to exist.
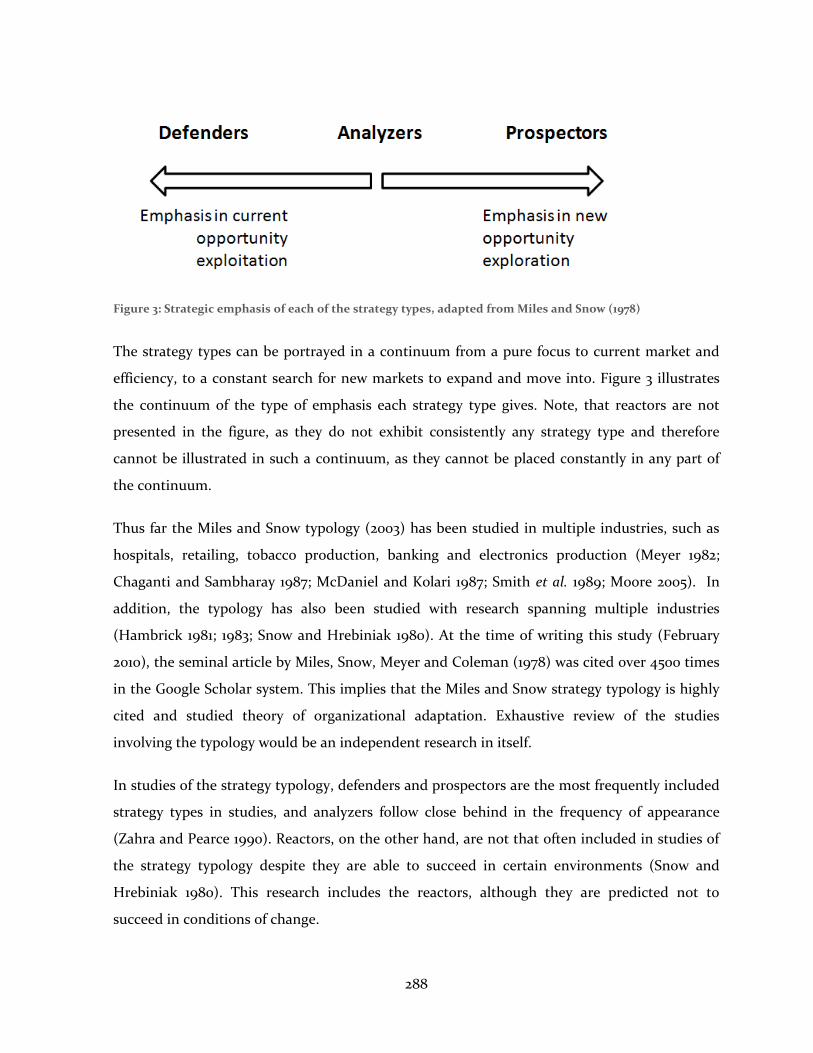
288
Figure 3: Strategic emphasis of each of the strategy types, adapted from Miles and Snow (1978)
The strategy types can be portrayed in a continuum from a pure focus to current market and
efficiency, to a constant search for new markets to expand and move into. Figure 3 illustrates
the continuum of the type of emphasis each strategy type gives. Note, that reactors are not
presented in the figure, as they do not exhibit consistently any strategy type and therefore
cannot be illustrated in such a continuum, as they cannot be placed constantly in any part of
the continuum.
Thus far the Miles and Snow typology (2003) has been studied in multiple industries, such as
hospitals, retailing, tobacco production, banking and electronics production (Meyer 1982;
Chaganti and Sambharay 1987; McDaniel and Kolari 1987; Smith et al. 1989; Moore 2005). In
addition, the typology has also been studied with research spanning multiple industries
(Hambrick 1981; 1983; Snow and Hrebiniak 1980). At the time of writing this study (February
2010), the seminal article by Miles, Snow, Meyer and Coleman (1978) was cited over 4500 times
in the Google Scholar system. This implies that the Miles and Snow strategy typology is highly
cited and studied theory of organizational adaptation. Exhaustive review of the studies
involving the typology would be an independent research in itself.
In studies of the strategy typology, defenders and prospectors are the most frequently included
strategy types in studies, and analyzers follow close behind in the frequency of appearance
(Zahra and Pearce 1990). Reactors, on the other hand, are not that often included in studies of
the strategy typology despite they are able to succeed in certain environments (Snow and
Hrebiniak 1980). This research includes the reactors, although they are predicted not to
succeed in conditions of change.
289
Although being widely accepted, the typology has received critique. First, self-typing, as the
method of group extraction, is widely used to identify different strategy types (Snow and
Hambrick 1980; Snow and Hrebiniak 1980; Zahra and Pearce 1990). This means that the
managers of organizations are used to characterize the strategy of their organization (ibid.).
This method has received wide critiques as the managers exhibit a tendency to intentionally
avoid identifying their organization as a reactor, and view their organization as unique and
therefore not directly fitting to the typology (Conant et al. 1990; Snow and Hambrick 1980;
Zahra and Pearce 1990). Despite this, this approach has also its proponents (James and Hatten
1995; Shortell and Zajac 1990). This research uses classification by investigator as the method of
group extraction and therefore avoids being drawn into this debate.
Second, research on the typology suffers from overemphasis of between-group differences
(Zahra and Pearce 1990). This implies that within group differences have been largely ignored
(ibid.). Therefore, the unique differences within strategy types could give valuable insight into
why performance differences exist within the strategy types. This research deals with the
matter by analyzing within and between group differences to gain deeper understanding of the
performance of each of the strategy types in decline conditions.
By adopting the strategy typology, strategy types of organization can be extracted from their
actions. Therefore, an organization can be assigned a strategy type based on how it adapts to
environmental changes. Second, the typology introduces broad strategy types under which the
research data can be distributed. This allows the generation of groups of data that have similar
features.
To conclude, each of the strategy types, except reactors, exhibit strengths and weaknesses that
can lead them to succeed in an environment. The way how each of the strategy types succeeds
appears to be largely related to the environment in which the organization operates, as each
type portrays characteristics suitable to different environments.
290
2.4 Strategy and environment coalignment
Strategic choices do not occur in a vacuum. Rather, organizations adapt to their environments
to achieve coalignment. This alignment of external environment and organizations structures
and processes is of great importance
Correct alignment of the strategy of organization and the environment has a positive impact on
the performance of an organization (Prescott 1986; Venkatraman and Camillus 1984;
Venkatraman and Prescott 1990). Therefore, the correct alignment of strategy to the declining
environment is of essence as competition intensifies and the carrying capacity of the niche
starts to reduce. Despite the fact that organizational ecology and strategic choice perspectives
have been identified as competing perspectives they can be aligned so that they are not
mutually excluding and can be operationalized simultaneously (Hrebiniak and Joyce 1985;
Zammuto 1988)
This research takes a reductionist view on the strategy and environment coalignment. “The
reductionist perspective of a coalignment is based on a central assumption that the
coalignment between two constructs (such as environment and strategy) can be understood in
terms of pairwise coalignment among the individual dimensions that represent the two
constructs” (Venkatraman and Prescott 1990). The coalignment of environment and strategy is
therefore viewed as matching the strategic choices to environmental categories that result in
success.
As the research produces snapshots of organization strategies in the decline conditions,
dynamic interaction of the strategy and environment is left outside of the scope of this
research. This is certainly a limitation of this research but it is congruent with the method of
matching strategic choices to decline conditions.
The research framework presented in the next subsection is built on the ideal profiles of
strategy types that match the environmental condition where success as an outcome is used as
a constant variable. Theoretical postulations are built upon the descriptions of environment
where each of the Miles and Snow strategy type is perceived to be the most efficient (Miles et
291
al. 1978). This notion is supported by Zammuto (1988), who argues that some strategies are
more successful in different decline conditions than others.
2.5 Theoretical synthesis and research framework
In this chapter, two different theoretical discourses have been introduced. The aim of this
discussion has been to introduce declining industries as a context of operations and strategy as
the way how organizations react to changes in their environment.
First, industry life cycles were presented and emphasis was given to an environmental decline
and the typology of decline conditions (Cameron and Zammuto 1983; Zammuto and Cameron
1985). This typology of decline conditions forms the context of this research.
Second, strategy as concept was introduced and strategic choice perspective as a strand of
strategy research was presented. From the strategic choice perspective, the classic strategy
typology of Miles and Snow was chosen to represent different strategy types that organizations
can employ (Miles and Snow 1978; 2003).
Strategy and environment coalignment was discussed to bridge the concept of strategy with
environment. The concept of strategy-environment coalignment was brought up as a
moderator of success of organizations (Prescott 1986; Venkatraman and Camillus 1984;
Venkatraman and Prescott 1990; Zammuto 1988). As mentioned earlier, for the purposes of this
research, a reductionist perspective is adapted to portray the strategy-environment interaction.
Furthermore, this is also congruent with the methodology chosen for this research.
Organizational ecology and strategic choice perspectives have been identified as competing
perspectives. This debate culminates on the question, “is organizational life determined by
intractable environmental constrains or is it actively created through strategic managerial
choices” (Astley and Van De Ven 1983). Despite this, these two perspectives can operate
simultaneously (Hrebiniak and Joyce 1985; Zammuto 1988). This rises from the level of analysis
that is used (Astley and Van De Ven 1983). Population ecology examines populations of
organization from the level of niche that defines the bounds of a population. Individual
organizations generally choose only to inhabit only a part of the niche, establishing a sub space
292
in the niche labeled organizational domain (Hannan and Freeman 1977; Zammuto 1988). The
concept of domain is accepted in both of the discourses (Hannan and Freeman 1977; Miles and
Snow 1978). It is the domain of activities that a single organization can alter to align itself to its
niche. Therefore, a single organization has the capability to alter its domain within the niche,
while simultaneously the population of the niche is subject to environmental selection (Astley
and Van De Ven 1983; Hannan and Freeman 1977; Zammuto 1988). Despite this, the
organizations are constrained by the perceptions of their management regarding possible
choices (Miles et al. 1978; Hambrick and Mason 1978). Correct strategy-environment
coalignment leads to selection and retention (Aldrich 1979, p. 27; Venkatraman and Camillus
1984; Venkatraman and Prescott 199). In this vein, some strategic choices are more successful in
different environmental conditions than others, while organizations still are able to choose
their response to environmental changes (Zammuto 1988). Although, the choices of
organizations are limited to those which the managers believe will allow effective operation,
meaning that choice is constrained by the backgrounds of the managers (Hambrick and Mason
1984; Miles et al. 1978).
Building on aforementioned arguments, this research utilizes the typology of decline
conditions identified by Zammuto and Cameron (1985) as the context, where organizations
make different strategic choices represented by the typology of strategies identified by Miles
and Snow (2003). As the goal of this research is to recognize successful strategies, the objective
of the empirical part is to find different strategies that result in success in different conditions
of environmental decline and result in strategy-environment coalignment (Prescott 1986;
Venkatraman and Camillus 1984; Venkatraman and Prescott 1990).
The Miles and Snow strategy types have quite explicit definitions of which environments they
fit the best and drawing from there, how they would fit to the different decline conditions
(Miles et al. 1978; Zammuto 1988). Therefore, it is possible to postulate that each of the strategy
types would succeed in a certain environment. Each strategy type is assigned to only one
decline condition, as the emphasis of each of the types best fits to only one decline condition
based on theory. The figure 4 below portrays the theoretical framework built upon the ideal
characteristics of different strategy types and conditions of environmental decline. The following
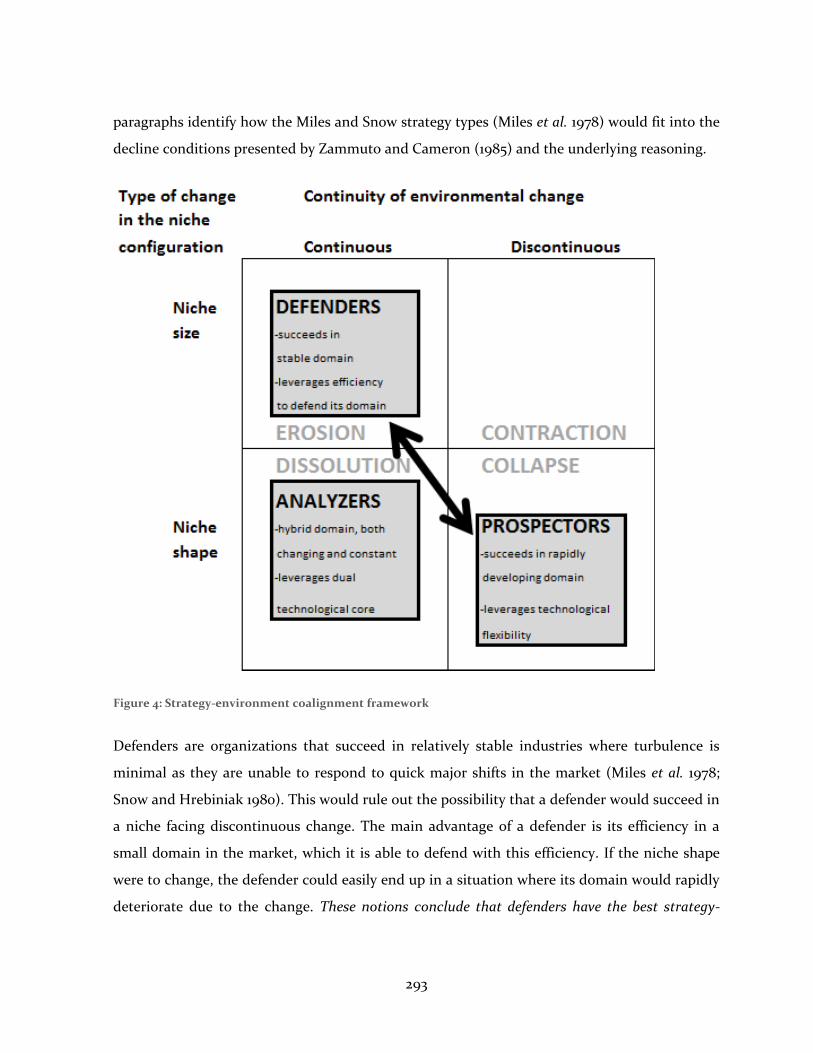
293
paragraphs identify how the Miles and Snow strategy types (Miles et al. 1978) would fit into the
decline conditions presented by Zammuto and Cameron (1985) and the underlying reasoning.
Figure 4: Strategy-environment coalignment framework
Defenders are organizations that succeed in relatively stable industries where turbulence is
minimal as they are unable to respond to quick major shifts in the market (Miles et al. 1978;
Snow and Hrebiniak 1980). This would rule out the possibility that a defender would succeed in
a niche facing discontinuous change. The main advantage of a defender is its efficiency in a
small domain in the market, which it is able to defend with this efficiency. If the niche shape
were to change, the defender could easily end up in a situation where its domain would rapidly
deteriorate due to the change. These notions conclude that defenders have the best strategy-
294
environment coalignment with the decline condition of erosion as they would be able leverage
their capability for efficiency in a steadily dimishing environment (Zammuto 1988).
Prospectors are organizations that succeed in dynamic environments as they are able to
respond quickly to the changes in the surrounding environment and also act as the initiator of
change in their environment (Miles et al. 1978; Snow and Hrebiniak 1980). The main advantage
of a prospector is its ability to find and exploit new product and market opportunities before
the competitors can do so (Miles et al. 1978). This would imply that prospectors succeed in
environments where the niche shape changes. On the other hand, prospectors are unable to
succeed in more stable environments as their orientation towards innovation undermines their
efficiency (ibid.). This, on the other hand, would rule out the possibility to succeed in
continuously changing environments. These notions conclude that prospector have the best
strategy-environment coalignment with the decline condition of collapse as they would be able to
leverage their capability to create change and respond to it in a rapidly changing niche (Zammuto
1988). The rapid and discontinuous change would also shield the prospectors from analyzers
that would be able to overpower prospectors with their ability to leverage both the ability to
move to new developing markets and be efficient.
Analyzers are a combination of defender and prospector strategies, they are organizations that
try to minimize risk but at the same time maximize opportunity for profit (Miles et al. 1978;
Snow and Hrebiniak 1980). The main advantage of an analyzer is its ability to keep firm grip of
the current market but at the same time follow developments in the market to be able to be an
early entrant into new markets (Miles et al. 1978).This would imply that analyzers would
succeed in niches where the niche shape changes, as they would be able to follow the first
movers into the new developing niche. As analyzers’ adaptive approach is a balanced one, they
do not fit into rapidly changing markets, but rather into markets that evolve at a moderate pace
in which they can follow the prospectors and enter new markets without incurring the
prospector’s extensive research expenses (ibid.). This would imply that analyzers fit best to
conditions of continuous changes as they would be able to capitalize on their ability for
efficient but also the ability to be an early entrant to new niches. These notions conclude that
analyzers have the best fit with the decline condition of dissolution as they would be able to
295
leverage their ability to exploit current niche opportunities, while simultaneously following the
development of new niches in the industry.
Reactors are organizations that do not exhibit proactive approach to the changes in the
environment (Miles et al. 1978; Miles and Hrebiniak 1980). Their reactions to the changes in the
environment are inconsistent and unstable. As Miles et al. (1978) state, when faced with a
change a reactor will either assume a consistent strategy or perish, they should not be present
in declining industries.
These descriptions of how the strategy types would align with environment according to theory
formulate the theoretical framework of this research. Following from this, the empirical part of
this research aims at uncovering the behavior of the strategy types in declining industries and
relates these findings to the research framework by enhancing it. Furthermore, these findings
are also compares to previous studies of the Miles and Snow typology to reveal similarities and
differences.
3 METHODOLOGY
This section presents the method use in conducting the empirical research of this thesis. This
section presents the case survey method and its position in the category case study methods. It
also uncovers the method used to generate data and the methods used to analyze it. In
addition, the reliability and validity of the data are discussed.
3.1 Case study research
A case study as a research strategy can be defined as an empirical inquiry that investigates a
phenomenon within its context, where the boundaries between the phenomena and the context
are not clearly evident (Yin 2003, p. 13). Case studies have been proven to be an excellent
method of generating and testing theories in the field of strategy (Gibbert et al.2008). When
considering this research in the light of case as a research strategy, the goal is to investigate a
phenomenon that cannot be separated from its context as it is the context that largely defines
296
the research. Therefore, this research complies with the guiding idea behind case study as a
research strategy.
Case studies can have multiple different aims. Case studies can aim at illuminating a decision, a
set of decisions, individuals, organizations, processes, programs, neighborhoods, institutions or
events and the underlying reasoning behind them (Yin 2003, p. 12). The aim of this research
complies with aims of a case study method as the aim is to illustrate choices by organizations
which lead to success in the context of declining industries.
Case study research in the field of strategy has shifter to rely substantially on positivistic research
tradition as the criteria used to assess the rigor of field research are drawn from this tradition
(Eisenhardt 1989; Gibbert et al. 2007; Yin 2003). These criteria are construct validity, internal
validity, external validity and reliability and they will be discussed in the detail in the reliability
and validity subsection. It appears that despite being declared dead by many contemporary
philosophers of science, the positivistic tradition still holds strong as it is deeply rooted in our
western thinking (Kincheloe and Tobin 2009). This research also has a positivistic undertow, as
the research first builds a theoretical framework which is then empirically tested and corrected;
this resembles the use of scientific method (Behling 1980; Kincheloe and Tobin 2009). Secondly
the research uses a reductionistic perspective of the studied phenomena that also rises from the
positivistic tradition (ibid.).
3.1.1 Case survey method
Case survey method was first used and introduced as a research approach by Yin and Yates in
1974 in their research on decentralization and urban services. From there onwards the method
has been refined by authors such as Larsson (1993) and Lucas (1974). As such, the research
method has never broken into mainstream and has remained only as a small strand in the case
study methodology.
The essence of a case survey methodology is the use of existing case studies as data from which
tendencies are aggregated through a survey (Lucas 1974; Larsson 1993; Yin and Heald 1975). The
method aims at balancing qualitative and quantitative research approaches, as the data consists
297
of case studies exploring phenomena in their real-life context which represents the qualitative
approach, of which tendencies are drawn with the use of a survey which represents the
quantitative approach. This research approach therefore aims at combining these two
approaches to get the best out of both research strategies.
Using case studies as the data stems well with the research setting as case studies seek to study
phenomena in their context, in this research declining industries, and the research approach
emphasize this importance. Case studies hence give a good access to the reasoning behind
success in declining industries.
Producing generalizations out of a case study is difficult due to the nature of case study as a
research strategy (Stake 1995, p. 7). The fundamental idea behind a case study is to produce in-
depth insight of an entity or a limited number of entities that at best yield tendencies but not
generalizable patterns (Stake 1995, p. 7). Instead, case survey can produce patterns between
case studies that give rough indications of the studied phenomenon.
As the amount of cases diminished substantially from the initial sample to the final sample, the
case survey method was applied in a way that it would accommodate both qualitative and
quantitative analysis.
3.2 Constructing the survey
The survey form was generated on the basis of the decline conditions of Zammuto and
Cameron (1985) and the strategy types of Miles and Snow (2003). The goal of the survey was to
enable the plotting of different strategy types into the different decline conditions.
As this research takes a reductionist perspective to the strategy-environment coalignment, the
survey was broken down into three parts. The first part regarded background information and
had the case number, so that the answers could be tracked back to specific cases and also
identification of the organizations product-market i.e. product or service market and served
market i.e. B2B market or B2C market.
298
The second part of the survey regarded environmental decline types identified by Zammuto
and Cameron (1985). As the decline types in essence form a matrix, the identification of
decline type was broken down into two questions, one regarding the type of decline i.e. change
in niche size or change in niche shape and the second question regarding the continuity of
decline from continuous to discontinuous. These formulate the two dimensions of the matrix
where type of decline forms the Y axis and continuity the X axis.
Position in the matrix was measured with a 7 point semantic differential scale where end points
were associated with bipolar labels (Malhotra and Birks 2007, p. 350; Collis and Hussey 2003, p
184). These labels were change in niche shape and change in niche size for Y axis, and
continuous and discontinuous for X axis. This allows obtaining numerical values from
qualitative data (Collis and Hussey 2003, p. 184). Therefore, the decline condition of the case
could be defined.
The third part of the survey regarded the strategy type of organization in the Miles and Snow
(2003) strategy typology. This was measured with a nominal scale as the use of nominal scale
enables the responses to be classified to categories which are not comparable with each other
but rather equal options. This part of the survey was adapted from Snow and Hrebiniak (1980)
as they had already conducted survey research with a nominal scale of the strategy types.
The number of questions used in the survey was relatively modest. The reason for this is that
the person who created and answered the survey was the same i.e. the author. Hence, no
additional insight should be possible to be generated with additional questions as consistency
should exist between answers.
A complete survey form can be found from the appendix 2. This form has all the three parts of
the survey and is an exact duplicate of the form used to conduct the research.
3.3 Collecting the research data
The data collection and analysis follows loosely the case survey research process advocated by
Larsson (1993) and Bullock (1986). As the research has been done by only one person, many of
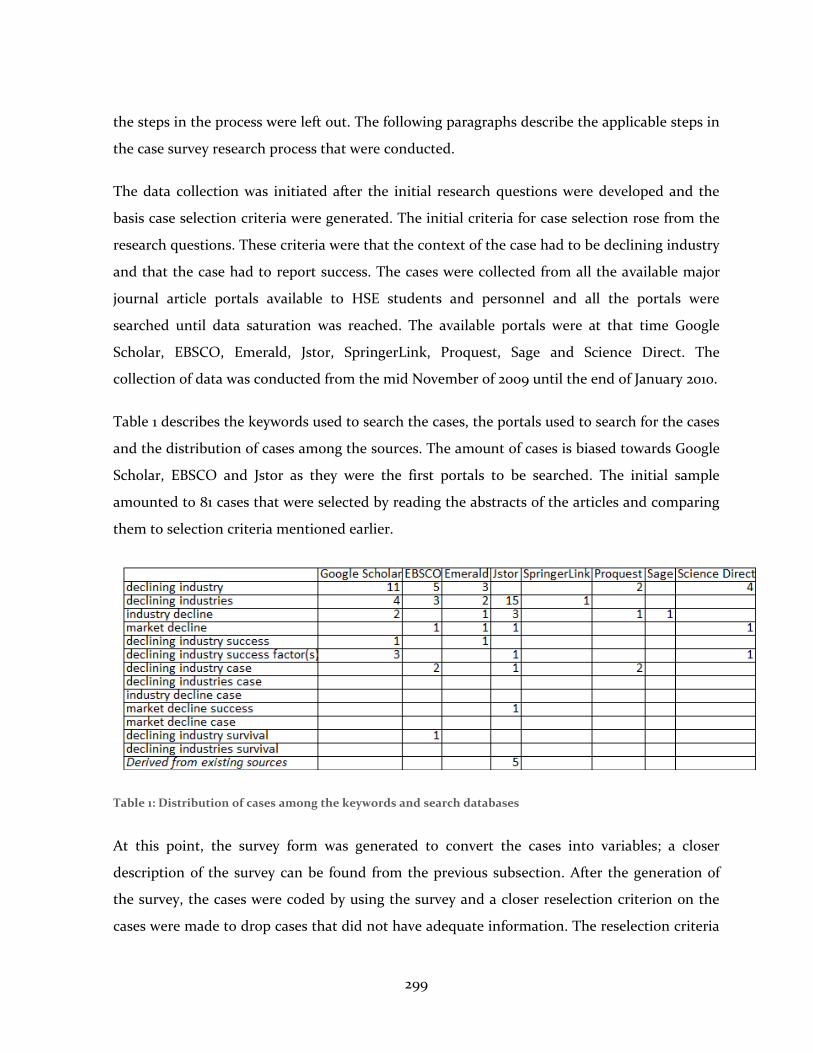
299
the steps in the process were left out. The following paragraphs describe the applicable steps in
the case survey research process that were conducted.
The data collection was initiated after the initial research questions were developed and the
basis case selection criteria were generated. The initial criteria for case selection rose from the
research questions. These criteria were that the context of the case had to be declining industry
and that the case had to report success. The cases were collected from all the available major
journal article portals available to HSE students and personnel and all the portals were
searched until data saturation was reached. The available portals were at that time Google
Scholar, EBSCO, Emerald, Jstor, SpringerLink, Proquest, Sage and Science Direct. The
collection of data was conducted from the mid November of 2009 until the end of January 2010.
Table 1 describes the keywords used to search the cases, the portals used to search for the cases
and the distribution of cases among the sources. The amount of cases is biased towards Google
Scholar, EBSCO and Jstor as they were the first portals to be searched. The initial sample
amounted to 81 cases that were selected by reading the abstracts of the articles and comparing
them to selection criteria mentioned earlier.
Table 1: Distribution of cases among the keywords and search databases
At this point, the survey form was generated to convert the cases into variables; a closer
description of the survey can be found from the previous subsection. After the generation of
the survey, the cases were coded by using the survey and a closer reselection criterion on the
cases were made to drop cases that did not have adequate information. The reselection criteria
300
included that the case had to be a case study as many journal articles initially chosen were not
applicable as case studies. Second, the case study had to have a clear description of the
declining industry so that the type of decline could be assessed. Third, the case study had to
include adequate information to indicate which strategy type performs in the decline
condition, and also the case had to have a description of the performance outcome, as many
cases only dealt with strategy but not performance. In addition, at this point, the non-academic
case studies were dropped to increase the reliability of the case studies.
The reselection and coding shrunk the amount of cases to a third of the original case mass leaving
27 cases with adequate description to generate a completed survey form (see appendix 1 for closer
identification of cases). The tight selection criteria were used to ensure quality of the cases
accepted for the research. This is exemplified by the fact that the only journals from which
multiple studies were accepted were Strategic Management Journal (6 cases) and Long Range
Planning (3 cases).
3.4 Methods of analysis
The research data was analyzed on three levels. First, the groups of case studies that employed
a certain strategy and a decline condition were analyzed to find similarities and differences
between case studies. This was used to draw syntheses of the behavior of strategy types in
different decline conditions. Second, each strategy type was analyzed by comparing the groups
of cases in each of the decline conditions to draw conclusion on the level of a strategy type.
Therefore, synthesis of the behavior of each of the strategy types could be established on the
level of strategy type. Third, the strategy types were compared together to formulate
conclusions of the behavior of the strategy typology in the decline conditions. This resulted in
the higher order outcomes of this research.
The analysis of the data was done in three stages combining multiple methods of analysis. The
data was analyzed by conducting pattern matching and cross case synthesis (Yin 2003, p. 116,
133). These two analysis strategies were used because of two main reasons. First, pattern
matching functions well in this research because the empirical research aims at testing the
research framework presented in the theoretical synthesis, resulting in pattern matching.
301
Second, as the data consists of multiple case studies cross case synthesis can be used to analyze
similarities and differences between cases. The next paragraphs describe in more detail the
process of analyzing the case studies.
After the initial data set was gathered, the first phase of analysis was conducted. This consisted
of reading through all the case studies. By doing so, the cases that did not fit the reselection
criteria were excluded from the survey. After reselecting the case studies that were included in
the final data set, the case studies were coded by using the survey. By doing so, each cases was
assigned a strategy type the organization employed and a decline condition in which the
organization operated.
After the case studies were coded using the survey, the second phase of analysis was conducted.
The case studies were divided into three groups according to the strategy type employed by the
organization. Each of the three groups was analyzed separately. In each of the groups, the
analysis started by plotting the case studies into the decline conditions. By doing so, the
pattern of distribution of the case studies could be compared to the theoretical framework.
After doing so, case studies in each of the decline condition were analyzed to form a cross case
synthesis of the characteristics of each strategy type in each of the decline conditions. These
findings of within strategy type differences were then analyzed to achieve an overall
understanding of the strategy type in declining conditions and the reasons for success.
After each of the strategy types were individually analyzed, the last phase of analysis was
conducted to compare strategy types with each other. This enables comparing each of the
strategy types with each other and define how each of the types function in the decline
conditions. Therefore, higher level conclusions can be drawn of the success strategies in
different decline conditions.
The goal of utilizing such analysis strategy is for two reasons. First, the behavior of the strategy
typology as a whole in different decline conditions case be established. This leads into
answering the research questions. Second, in order to explain deviation within a strategy type
and increase validity, within type analysis is conducted. This enables a more fine-grained
analysis of the strategy types.
302
3.5 Reliability and validity
Yin (2003, p. 34) describes four tests to evaluate the quality of any empirical social research.
These four design tests are construct validity, internal validity, external validity and reliability.
This subsection aims at applying all of these to this study to give a clear picture of the reliability
and validity of this research.
The purpose of construct validity is to “establish correct operational measures for the concepts
being studied” (Yin 2003, p. 34). Two distinct concepts were chosen to act as the foci of this
research and the phenomenon was researched through these lenses. To increase construct
validity the survey was built around the decline conditions identified by Zammuto and
Cameron (1985) and the way of identifying strategy types were adapted from a survey
conducted by Snow and Hrebiniak (1980) of which the other is an original author of the
typology. The within group analyses were conducted on the basis of the strategy employed and
which decline condition the organization inhabited.
This research utilizes existing case studies as the research data of which all are published in
academic journals. A chain of evidence was established as each of the cases can be followed
from the combination of words used to find the case and the source, through the analysis and
into the findings. This process has been meticulously documented. The only aspect that
undermines the construct validity is the key informants were not used to review the results.
This is a procedure also suggested by Larsson (1993) and hence is left as a shortcoming when
regarding construct validity.
Internal validity established a causal relationship where certain conditions are shown to lead to
another (Gibbert et al 2007; Yin 2003, p. 34). This research uses cross case synthesis and pattern
matching to enhance internal validity by aggregating findings across cases. This is possible
because the data consists of multiple different case studies. The cases are analyzed both
quantitatively and qualitatively.
External validity refers to the generalizability of the findings beyond the immediate case study
(Gibbert et al. 2007; Yin 2003, p. 34). As Eisenhardt (1989) argues, cross-case analysis of four to
303
ten cases can act as a basis for analytical generalization and as this research has in total 27 cases
the amount of data is adequate to produce analytical generalization.
Reliability of the research refers to possibility of repeating the case study with the same results
(Yin 2003, p. 34). The process of conducting the case survey followed loosely the procedure of
conducting case survey research identified by Larsson (1993) and the application of these steps
have been explained in the methodology section. Despite this fact, the reliability of this
research has been compromised in a sense that the research was conducted by a single person.
This is against the suggestions of Larsson (1993) as he notes that case survey research should be
done by a research team to eliminate possible bias and that people coding the cases and
building the theory should be different to minimize bias. This unfortunately was not possible
when conducting this research and hence remains a big shortcoming of this research.
4 FINDINGS
This section gives a general description of the data generated for this research. After this, a
closer description of each strategy type and their fit to different decline conditions are made.
The analysis of each strategy type is divided into part describing their distribution in the
decline environments and a part describing the similarities and differences among the strategy
type.
4.1 General description of the data
The survey yielded a total of 27 cases. In two occasions two cases were used to construct one
case entity. This leaves a total of individual 25 cases for this research. The case studies were
equally distributed among journals. The only academic journal from which multiple case
studies were accepted were Strategic Management Journal, with 6 cases, and Long Range
Planning, with 3 cases. A closer identification of the cases included in the sample of this
research can be found from the appendix 1.
The distribution of cases according to the product-market is heavily skewed towards products
as 19 of the cases regarded a product market when compared to only 6 cases from the service
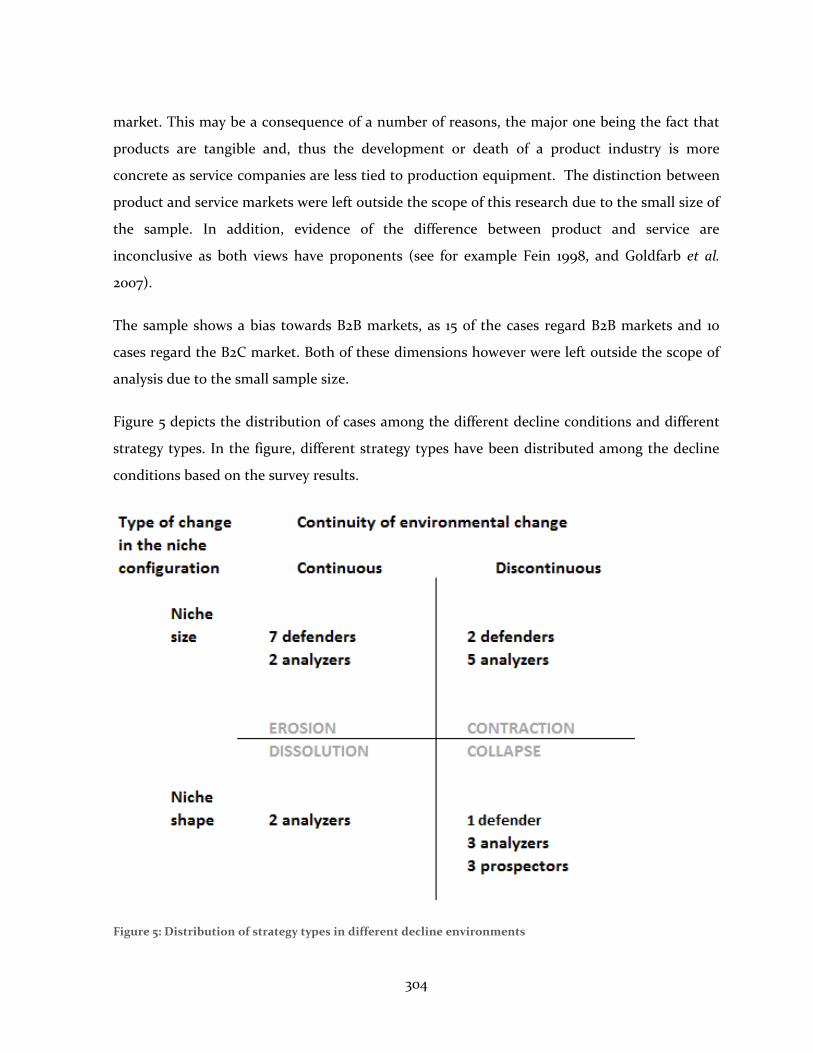
304
market. This may be a consequence of a number of reasons, the major one being the fact that
products are tangible and, thus the development or death of a product industry is more
concrete as service companies are less tied to production equipment. The distinction between
product and service markets were left outside the scope of this research due to the small size of
the sample. In addition, evidence of the difference between product and service are
inconclusive as both views have proponents (see for example Fein 1998, and Goldfarb et al.
2007).
The sample shows a bias towards B2B markets, as 15 of the cases regard B2B markets and 10
cases regard the B2C market. Both of these dimensions however were left outside the scope of
analysis due to the small sample size.
Figure 5 depicts the distribution of cases among the different decline conditions and different
strategy types. In the figure, different strategy types have been distributed among the decline
conditions based on the survey results.
Figure 5: Distribution of strategy types in different decline environments
305
Decline in the environment was broken down into two components, the type of change and the
continuity of change. The type of change was skewed towards change in the niche size, as 16
out of the 25 cases had a decline in the size of the niche. This can be, at least to some extent,
explained by the fact that declining industries are perceived as those in which the niche size
decreases, rather than those where the niche shape changes. This might be because changes in
niche shape are perceived more often as evolution or development of the industry. As a result,
the way how the data was collected may not have been supportive towards cases where the
change occurs in the niche shape rather than the niche size.
The continuity of change was quite evenly distributed in the sample as continuous decline was
experience in 11 cases and discontinuous decline in 14 cases. This indicates that the sample
represented quite evenly the different types of continuity in a niche.
All the four decline conditions were represented in the sample. Among these, erosion and
collapse were well represented as they represented 16 out of 25 cases. Dissolution and
contraction, on the other hand, were not as solidly represented as cases in which change
occurred due to changes in niche shape were only 9 cases.
Three of the four strategy types were represented in this sample. Out of these three, defenders
and analyzer were foremost present, as the sample included 12 analyzers and 10 defenders. The
sample indicated only three prospectors and not a single reactor. In all the case studies, the
successful case company held a clear direction and therefore no reactors were found from the
data set.
To conclude the general description of the data, it is evident that the amount of data may not
be applicable for sole statistical analysis. Although, for the purposes of doing meta-analysis,
which involves quantitative as well as qualitative analysis, the sample size is adequate.
4.2 Strategy types in different decline conditions
The 25 cases included in this study are discussed here separately according to the strategy type
employed. This analysis is split into an analysis of the strategy types and the conditions where
they appear in the sample. This is followed by a within group analysis of differences in order to
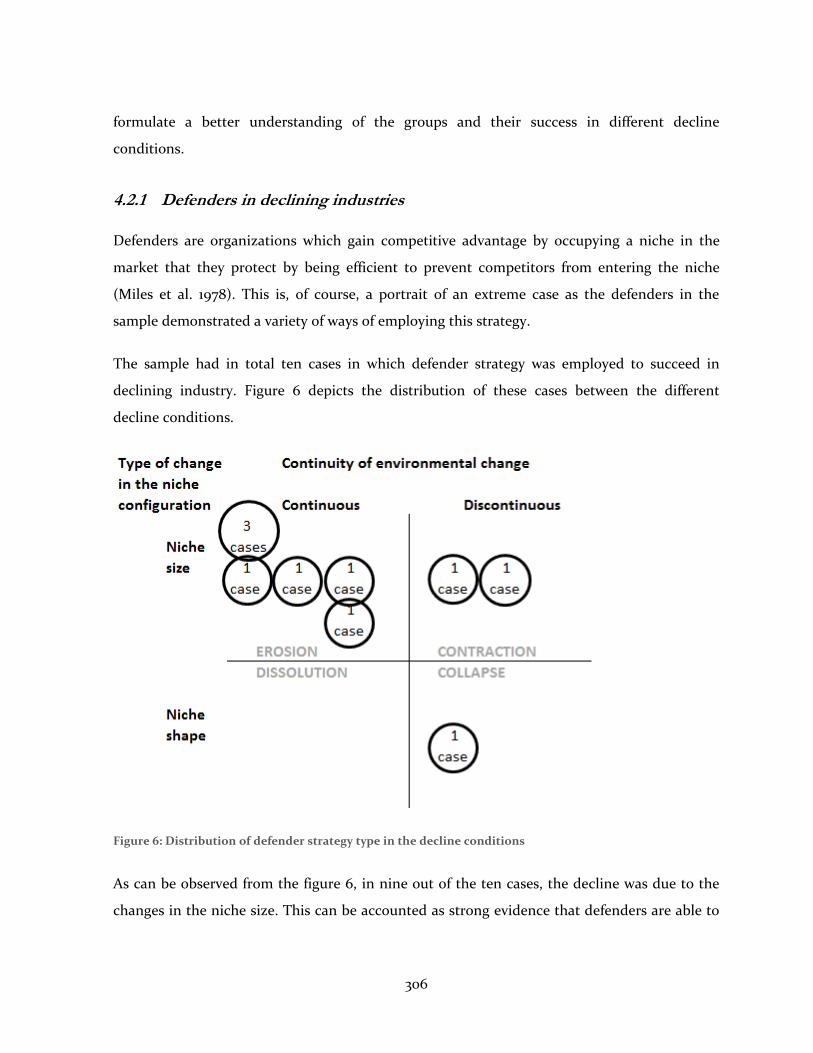
306
formulate a better understanding of the groups and their success in different decline
conditions.
4.2.1 Defenders in declining industries
Defenders are organizations which gain competitive advantage by occupying a niche in the
market that they protect by being efficient to prevent competitors from entering the niche
(Miles et al. 1978). This is, of course, a portrait of an extreme case as the defenders in the
sample demonstrated a variety of ways of employing this strategy.
The sample had in total ten cases in which defender strategy was employed to succeed in
declining industry. Figure 6 depicts the distribution of these cases between the different
decline conditions.
Figure 6: Distribution of defender strategy type in the decline conditions
As can be observed from the figure 6, in nine out of the ten cases, the decline was due to the
changes in the niche size. This can be accounted as strong evidence that defenders are able to
307
succeed in conditions in which change is due to the change in the niche size. Change in niche
size results in an intensified competition and thus the exit of some of the organizations
(Ghemawat and Nalebuff 1985, 1990). As defenders are organizations that define their
entrepreneurial, engineering and administrative problems around securing a domain in the
market by defending it with efficiency, they fit well in conditions where total carrying capacity
of the niche decreases (Miles et al. 1978). In this sense, the distribution of cases appears to favor
the decline in size of the niche rather than change in niche shape. This is congruent with the
notion of Miles et al. (1978) that defenders exhibit tendency to succeed in stable environments.
The figure also depicts that seven of the cases exemplify continuous decline, while three
experience discontinuous decline. This emphasis of cases on the side of continuous decline is
also posited by Miles et al. (1978) as defenders have a tendency to succeed better in stable
environments and, furthermore, that the primary risk of defenders is that they are unable to
respond to major changes in the market environment. In this sense the distribution of cases
regarding the continuity of change is congruent with the notion of Miles et al. (1978) that
defenders exhibit tendency to succeed in stable environments.
As the total number of cases is low, within group comparisons give additional depth to the
analysis. For these purposes, the cases will be divided into three distinct groups based on the
decline condition in which the strategy is employed.
The seven cases that are positioned in the erosion quadrant share similar features. All of the
cases, except one case, depict a rather successful adaptation to the decline of the niche. The
only case, in which success is not as straightforward, is a case of Jesuits in the USA and the
declining church membership. This case describes how the Jesuits of U.S. provinces were able
to sustain their operations by removing overlapping operations and, thus, increasing efficiency
despite losing members. Among the rest of the cases, success had been attained through
economies of scale, high quality offering, cost cutting and evading diversification. These all
represent the choices defenders have. When looking at the cases, they portray a pattern in
which diversification is either not possible or it would lead to decreased performance.
Therefore, it appears that in these cases, focus and efficiency has been the most lucrative
option.
308
The three cases that fall outside the erosion quadrant exemplify cases where success has not
been as explicit but rather success in relation to environment from which others have or are
exiting. The two cases that portray contraction of the industry, which is discontinuous change
in niche size, are quite similar. First of the cases portrays how British steel casting industry
changed through a series of declines in orders and government subsidies for exit. Organizations
that stayed in the industry were the ones that were not diversified. They were able to survive
and succeed as population density decreased when diversified organizations exited. The second
case concentrates on the Israeli electronics industry where decline was caused by local
recession diminishing the local demand, while at the same time the global demand was also
experiencing decline. The successful Israeli organizations defended their domain and wait that
more space would be generated to the niche. In both of the cases the only option left for the
companies in the niche was to defend their own domain and hope that space would be
generated to the niche so that the companies could continue their operations more
successfully.
The one case in the collapse environment in which niche shape changes discontinuously the
market has traditionally been volatile. The case regards international fur industry
concentrating on the Greek niche of Kastoria and Siatista. In this case, the collapse of the niche
results from changing preferences from fur to other kind of materials, as well as shifting
carrying capacity of the niche to low cost countries in Asia. For the moment, the Greek niche
has been able to survive by increasing efficiency. Despite this, the future of the niche is left
open as efficiency might not lead to success in the future due to low cost competition from
Asian countries. This could lead the Greek niche to be driven out of the market.
In contrasting the three cases outside the erosion environment to the cases in the erosion
quadrant, a significant difference seems to emerge. It appears that defenders are more fit to the
environment of erosion than other decline conditions, as they appear to perform better in
conditions of erosion. This statement is supported by two details that arise from the data. First,
more than two thirds of the cases are in one quadrant.
Second, when the cases were compared to each other, cases in the erosion environment tended
to portray more of a success when compared to the cases in other decline conditions.
309
Organizations in the erosion environment were able to continue or increase their operations by
increasing efficiency and focus on their domain, whereas organization in other environments
did not have other choices available than to defend the domain that they occupy and wait for
more space to be generated into the niche.
Together these finding support the notion of Miles et al. (1978) that defenders succeed in
environments where change is moderate, enabling defenders to fully utilize their capability to
be efficient. Therefore, it is evident that defenders can be successful in declining industries, and in
particular have a tendency to succeed if the decline is gradual so that they have the opportunity to
leverage their efficiency to generate success when competition intensifies (Zammuto 1988).
4.2.2 Prospectors in declining industries
Prospectors are practically polar opposites of defenders as they gain their competitive
advantage by finding and exploiting new markets (Miles et al. 1978). This is of course an ideal
profile of a prospector but generally they can be defined as companies that are innovators in
product and market development.
The sample had three prospectors. For this reason, nothing conclusive of the strategy type
cannot be said, as their number falls under the minimum amount of cases suggested by
Eisenhardt (1989) for drawing analytic generalizations. Despite this, the three cases will be
examined to achieve an understanding of how the prospectors behave in declining
environments. Figure 7 depicts the distribution of the prospectors in the decline conditions.
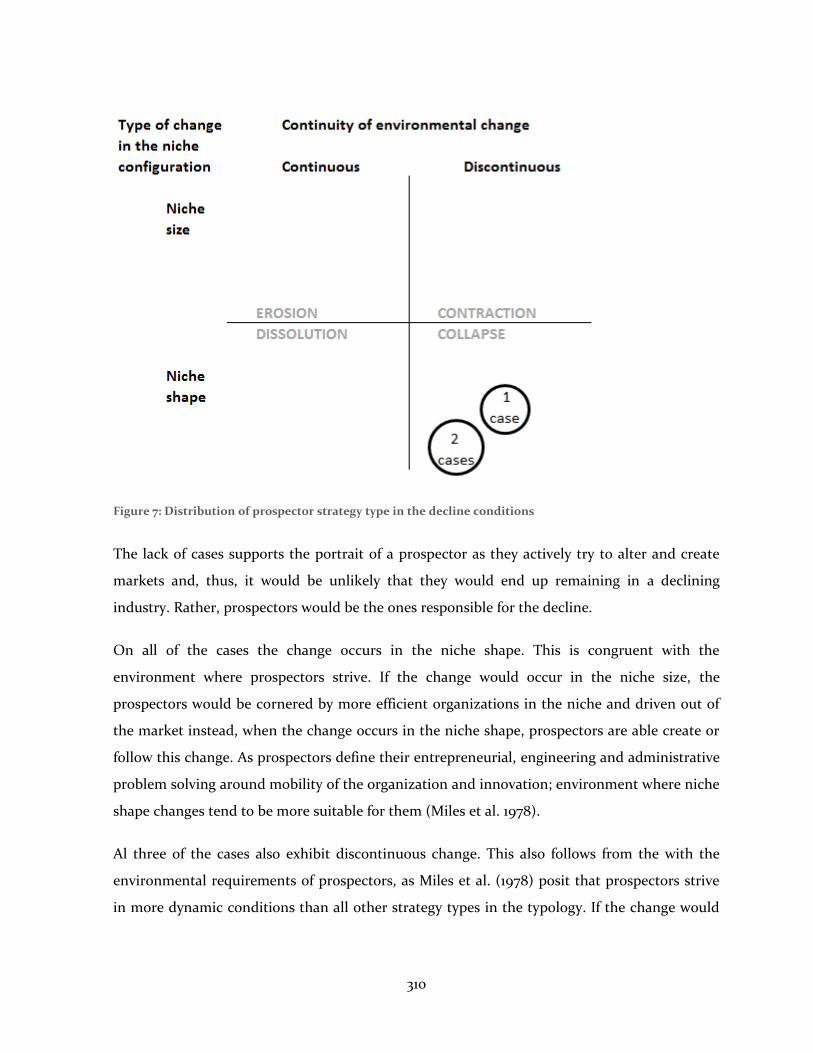
310
Figure 7: Distribution of prospector strategy type in the decline conditions
The lack of cases supports the portrait of a prospector as they actively try to alter and create
markets and, thus, it would be unlikely that they would end up remaining in a declining
industry. Rather, prospectors would be the ones responsible for the decline.
On all of the cases the change occurs in the niche shape. This is congruent with the
environment where prospectors strive. If the change would occur in the niche size, the
prospectors would be cornered by more efficient organizations in the niche and driven out of
the market instead, when the change occurs in the niche shape, prospectors are able create or
follow this change. As prospectors define their entrepreneurial, engineering and administrative
problem solving around mobility of the organization and innovation; environment where niche
shape changes tend to be more suitable for them (Miles et al. 1978).
Al three of the cases also exhibit discontinuous change. This also follows from the with the
environmental requirements of prospectors, as Miles et al. (1978) posit that prospectors strive
in more dynamic conditions than all other strategy types in the typology. If the change would
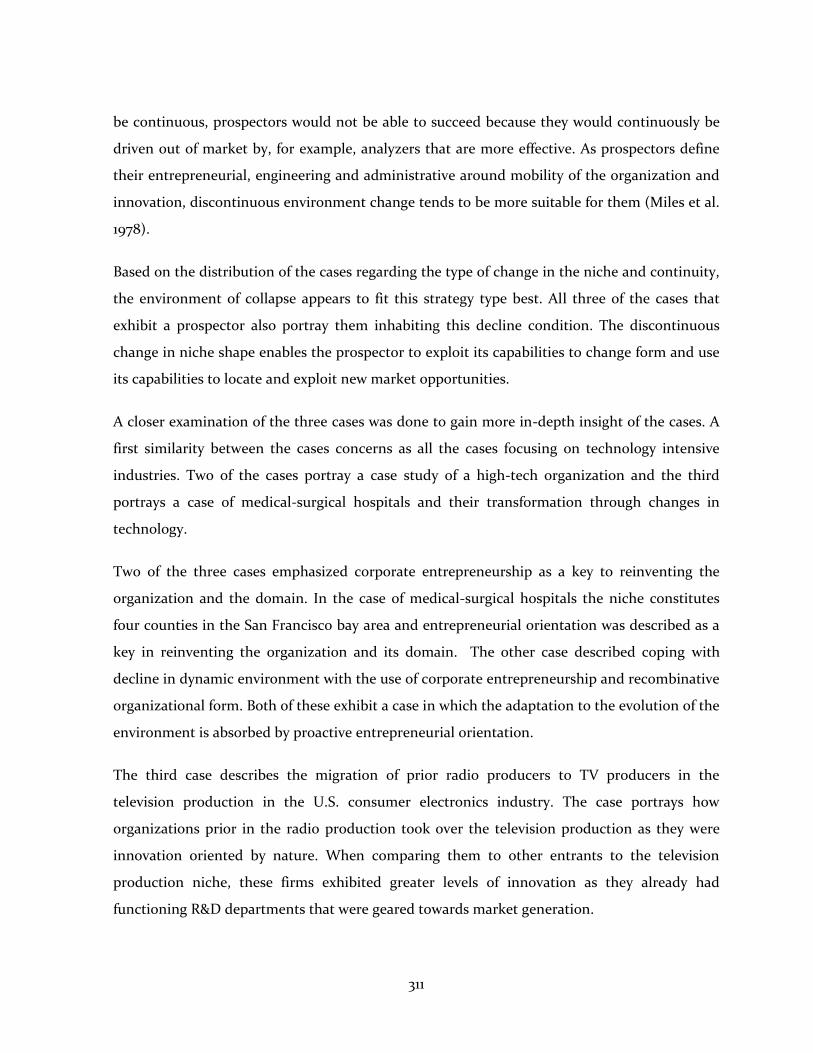
311
be continuous, prospectors would not be able to succeed because they would continuously be
driven out of market by, for example, analyzers that are more effective. As prospectors define
their entrepreneurial, engineering and administrative around mobility of the organization and
innovation, discontinuous environment change tends to be more suitable for them (Miles et al.
1978).
Based on the distribution of the cases regarding the type of change in the niche and continuity,
the environment of collapse appears to fit this strategy type best. All three of the cases that
exhibit a prospector also portray them inhabiting this decline condition. The discontinuous
change in niche shape enables the prospector to exploit its capabilities to change form and use
its capabilities to locate and exploit new market opportunities.
A closer examination of the three cases was done to gain more in-depth insight of the cases. A
first similarity between the cases concerns as all the cases focusing on technology intensive
industries. Two of the cases portray a case study of a high-tech organization and the third
portrays a case of medical-surgical hospitals and their transformation through changes in
technology.
Two of the three cases emphasized corporate entrepreneurship as a key to reinventing the
organization and the domain. In the case of medical-surgical hospitals the niche constitutes
four counties in the San Francisco bay area and entrepreneurial orientation was described as a
key in reinventing the organization and its domain. The other case described coping with
decline in dynamic environment with the use of corporate entrepreneurship and recombinative
organizational form. Both of these exhibit a case in which the adaptation to the evolution of the
environment is absorbed by proactive entrepreneurial orientation.
The third case describes the migration of prior radio producers to TV producers in the
television production in the U.S. consumer electronics industry. The case portrays how
organizations prior in the radio production took over the television production as they were
innovation oriented by nature. When comparing them to other entrants to the television
production niche, these firms exhibited greater levels of innovation as they already had
functioning R&D departments that were geared towards market generation.
312
Even though all these case studies of prospectors fall under the decline condition of collapse,
all the case organizations seemed to do financially well as the market did not disappear but was
rather replaced by a new one. Two of the cases portray exceptional financial performance as
one of them focuses on top performing Fortune 500 high-tech organization and the other case
regarded prior radio producers that had greater market shares and longer survival rates than
other organizations in the industry.
The three prospector cases exemplify two types of prospectors. The prior radio producers
emphasize product innovation while the medical-surgical hospitals as well as the case
regarding recombinative origination form gain competitive advantage through reconfiguring
the form of the organization.
Although generalizations from such a small number of cases cannot be made, the prospector
cases have similarities that are congruent with the archetype of a prospector described by Miles
et al. (1978). All the cases reside in the collapse environment which is congruent with the notions
that prospector inhabit dynamic environments in which they can utilize their ability to locate and
exploit new market opportunities (Miles and Snow 2003; Zammuto 1988). One reason for the
lack of prospectors in the sample is that in the extreme case prospectors should not even be
found from declining industries as they should be the ones generating the change through
inventing new niches.
4.2.3 Analyzers in declining industries
Analyzers are organizations that are combinations of defenders and prospectors. These
organizations aim at maximizing opportunities for profit while at the same time minimizing
risks (Miles et al. 1978). The sample had in total 12 analyzers. The figure 8 depicts the
distribution of these cases between the different decline conditions.
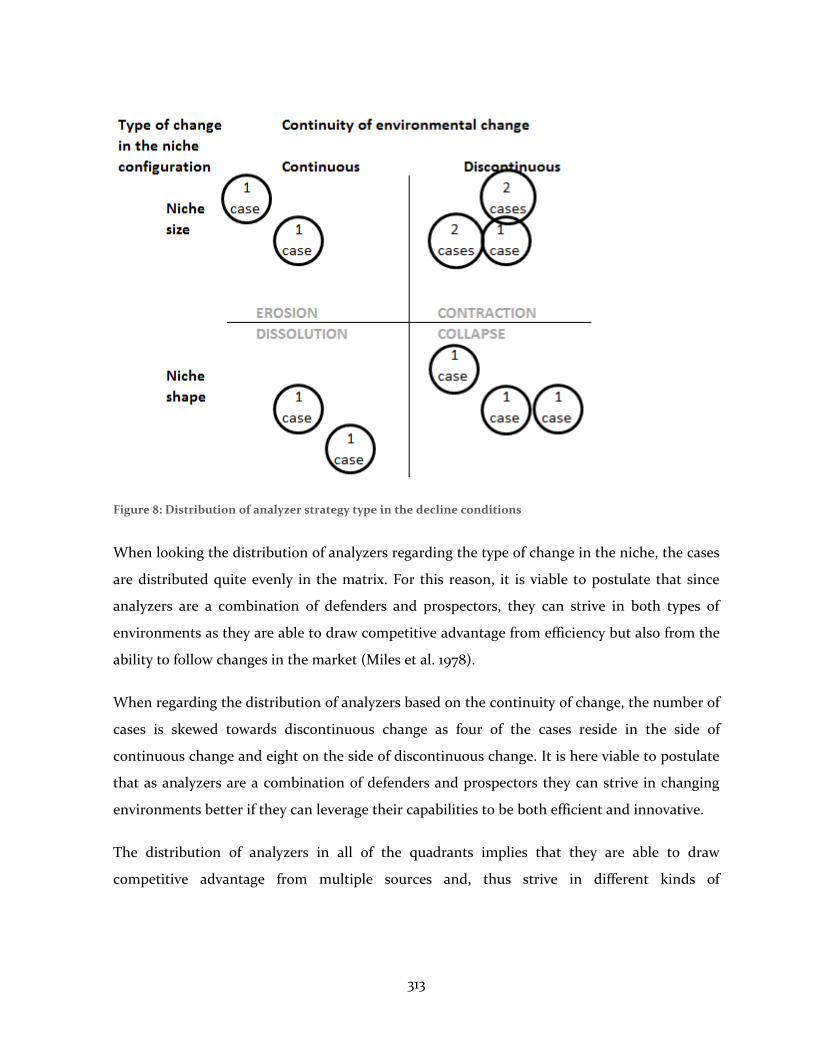
313
Figure 8: Distribution of analyzer strategy type in the decline conditions
When looking the distribution of analyzers regarding the type of change in the niche, the cases
are distributed quite evenly in the matrix. For this reason, it is viable to postulate that since
analyzers are a combination of defenders and prospectors, they can strive in both types of
environments as they are able to draw competitive advantage from efficiency but also from the
ability to follow changes in the market (Miles et al. 1978).
When regarding the distribution of analyzers based on the continuity of change, the number of
cases is skewed towards discontinuous change as four of the cases reside in the side of
continuous change and eight on the side of discontinuous change. It is here viable to postulate
that as analyzers are a combination of defenders and prospectors they can strive in changing
environments better if they can leverage their capabilities to be both efficient and innovative.
The distribution of analyzers in all of the quadrants implies that they are able to draw
competitive advantage from multiple sources and, thus strive in different kinds of
314
environments. Although it appears that they exhibit a tendency to operate in conditions of
discontinuous change.
A closer examination of the cases was made where the cases are distributed into groups based
on the quadrant where the case resides. The within group analysis can shed light into the
reason behind the success of analyzers in all of the decline conditions and how the competitive
advantage is created in each of the decline conditions.
The two cases in the erosion quadrant portray success in steadily declining industries. The first
case regards the decline of MBA programs in North America concentrating on Canada and
specifically the domain of University of Toronto. In this case success is attained by leveraging
existing knowledge in similar niches such as in executive MBA programs and non-degree
executive programs to stabilize the financial situation of the organization. In doing so, the
university is at the same time able to maintain their core operations of MBA programs by
supplementing them with other programs to enhance cash flow. The second case regards the
US tobacco industry from 1950-1979 concentrating on the most successful organizations. The
industry itself is in steady decline but the successful organizations defend their core operations
by forming lobbying groups to protect their core business, expanding their product lines to
cover multiple niches and to penetrate foreign niches as well. These operations are
supplemented by diversifications to other segments of consumer goods where they can leverage
their existing capabilities.
These two cases share similar features in two ways. First, the organizations diversify to related
niches in order to stabilize their operations and spread risk. Second, in both of the cases the
organizations leverage their core competencies to related niches where they seek stability. It
appears that when facing erosion, analyzers have a tendency to diversify to related niches to
stabilize their operations and to generate an exit plan in case one should be needed in the
future.
The five cases in the contraction quadrant portray success in niches where the niche size
decreases discontinuously. First of all, three of the cases are positioned in or in close proximity
of the defense industry. The two other cases represent the Japanese aluminum industry and
315
U.S. collectibles industry, concentrating on baseball card niche. All the cases share common
traits such as they all portray how the organizations spread risk by diversifying. All the cases in
or in proximity to defense industry share a pattern of leveraging core competencies to diversify
either within the industry or to industries in close proximity. In the case of baseball cards, risk
is spread by leveraging core competencies by issuing new brands to cover more niches and
spreading the release of products throughout the year. The last case concerns Japanese
aluminum smelting niche in the aluminum industry where risk is shared by group formation
and loss sharing among the organization occupying multiple niches. All the organizations have
activities related to the aluminum smelting niche which indicates that despite the aluminum
smelting niche is declining the corporations wish to control large parts of the value chain.
The five cases are similar in two ways. First, all the organizations diversify to decrease risk,
either within the industry or beyond the industry. Secondly, in four of the five cases the
organizations diversify by leveraging their core competencies. It appears that when facing
contraction, analyzers have a tendency to diversify to related fields to stabilize their operations.
Two cases among the analyzers inhabit the dissolution quadrant in which the niche shape
changes continuously. The first case is a historical analysis of the British cotton production
where foreign competition resulted in a steady change of the niche, as foreign competitors
changed the type of activities the niche sustained. In this niche, the organizations that
performed best were the ones that were vertically integrated, had diverse product range and
multiple plants. These organizations were successful due to their ability to modernize
equipment, increase product differentiation and do mergers and acquisitions within the
industry. The second case regard the niche of single sex boarding schools in which demand of
customers is transforming from boarding schools to day schools and hence the niche shape
changes; this is only case where the type of change was explicitly stated according the typology
of Zammuto and Cameron (1985). In this case the focal organization diversified to day
schooling and hence followed the change in niche shape while keeping its core business which
attracted foreign students.
Both of these cases exemplify organizations that are able to follow changes in the environment
by diversifying according to the needs of the new developing niche. Also, in both of the cases,
316
the organizations diversify by leveraging their core competencies. It appears that when facing
dissolution, analyzers have a tendency to diversify to the newly emerging niche to continue
their operations successfully.
Three cases among the analyzers inhabit the collapse quadrant in which the niche shape
changes discontinuously. The first case regards U.S. hardwood lumber and component
manufacturers’ niche in the U.S. lumber industry and, in particular, how Chinese imports have
displaced U.S. furniture manufacturers. Despite the collapse of their niche in the furniture
industry, these companies have been able to shift their focus to manufacturing flooring,
kitchen cabinets and exporting the goods they used to sell to domestic manufacturers
generating new niches. This case study illustrates ways in which the companies were able to
steer their operations to diversify to related niches when their primary niche collapsed.
The second case regards U.S. railroads and how, in particular, formerly regulated industry was
deregulated and as a result new niches in the industry were generated. In this case those
organizations that managed to change their strategy so that it was aligned with the new
environment outperformed others. In this case the emphasis on innovation was the most
profitable strategy.
The third case handles the change of New Zealand footwear manufacturing from a protected
niche into a competitive one that was invaded by foreign organizations. The successful
companies entered retailing in order to diversify their operations and gain vertical integration,
but at the same time production capabilities were enhanced and organizations started to
export their goods to penetrate foreign niches.
All the three case exemplify organizations that are able to follow changes in the environment
by diversifying according to the needs of the new developing market. These three cases
exemplify organizations that are able to align their strategy to the rapid change of the
environment and survive by changing form.
The analyzers in different decline conditions exemplify a few similarities and differences when
within group characteristics are analyzed. First, a difference exists in how diversification is used
between the two different types of change. In all of the cases in which niche shape changed, the
317
companies used diversification to minimize risk. In cases demonstrating niche shape changes,
diversification was used to move to new niche that was developing. This indicates that
depending on the type of change in the environment, analyzers can leverage their capability to
diversify in two different ways.
Second, in nine of the twelve cases diversification was carried out within the changing industry.
This indicated that while analyzers are able to diversify their operations, they seldom diversify
outside the industry where they operate. In addition, in two of the remaining cases the
organizations diversified by leveraging their current capabilities in a similar industry. This
indicates that while analyzers are able to diversify, they are constrained by the choices they
have made in the past. This is consistent with the argument of Miles et al. (1978) that
organizations are limited to the choices that top management view effective, which in this case
hold substantial lock in to the declining environment as the organization able to succeed in it.
To conclude the analysis, it appears that analyzers in declining industries are able to inhabit all
the decline conditions by leveraging their ability to both focus and diversify at the same time.
These cases exemplify the strategy type of analyzer as the organizations in the sample try to
minimize risk while maximizing opportunity for profit. Although, in this sample, this stance is
dualistic as the organizations which niche size decreases use diversification to minimize risk
while organizations whose niche shape is under transformation use diversification to maximize
the opportunity for profit. In addition, these cases exemplify how analyzers solve their primary
risk of not being able to move quickly due to their dualistic focus in both exploration and
exploitation. In the sample, the organizations have solved this problem by diversifying within
the same industry or leveraging their current capabilities in a similar industry.
4.2.4 Reactors in declining industries
Reactors are organizations that do not exhibit a proactive stance towards their environment
and do not have a clear strategic direction (Miles et al. 1978). Reactors can exist only in
protected environments where no change occurs. When faced with changing environments
reactors either have to move towards a consistent strategy or perish (Miles et al. 1978).
318
The sample features no reactors. Although this is in accordance with suggestions of Miles and
Snow (2003) as declining industries are not very welcoming, although it would be a non
sequitur argument to conclude anything on the basis that it is not proven directly by the data.
Therefore, although the lack of reactors does not prove their inability to succeed in declining
industries, is this argument supported by the typology.
5 DISCUSSION
This aim of this section is to discuss the findings presented earlier. Aim of this section is also to
draw together the findings that can be contrasted against the theoretical framework presented
earlier. In addition, these findings are contrasted to existing studies of the strategy typology to
uncover similarities and differences between the functioning of the typology in declining
industries and other contexts.
5.1 Miles and Snow strategy types in declining environments
In total, 25 cases were used to analyze the strategies organizations use in order to succeed in
declining industries. The figure 5 depicted the distribution of cases among these decline
conditions. This figure supplemented with the within group analyses, opens the field successful
strategic choices in different decline environments to an analysis of the fit of different strategy
types to different decline conditions. Through this analysis, these findings can then be
contrasted to the indications that were presented in the theoretical framework of the fit of
different strategies to different decline conditions.
Defenders were represented in three of the four decline conditions identified by Zammuto and
Cameron (1985), although seven of these cases resided in the condition of erosion that
suggested their fit to this type of decline. The within group analysis revealed, defenders in the
condition of erosion were the only ones that exemplified true success. This indicates that
defenders demonstrate a tendency to fit with the decline condition of erosion, as in the decline
condition where defenders were most prominent to succeed according to the data.
319
Therefore these findings are congruent with the postulations made in the theoretical
framework. As it was postulated that because defenders require an environment where major
shifts do not occur, the decline condition of erosion would fit them best.
Prospectors were represented in only one of the decline conditions identified by Zammuto and
Cameron (1985). All of the cases resided in the condition of collapse which indicated the fit
between this strategy type and the environment. The within group analysis revealed that
organizations in this decline condition exemplify success. This indicates that prospectors
demonstrate a tendency to fit with decline condition of collapse, as that is the only decline
condition where prospectors were found in the data. Despite all the cases were in the condition
of collapse, the small number of cases undermines these findings.
These findings are congruent with the postulations made in the theoretical framework. As it
was therefore assumed that because prospectors’ main advantage lies in their capability to
create change as well as rapidly respond to change, they would require an environment where
change is rapid.
Analyzers were represented in all of the decline conditions identified by Zammuto and
Cameron (1985). The within group analysis uncovered the reasoning behind this. It appears
that they are able to leverage diversification for two purposes. When niche size changes they
diversify to stabilize the operations of the organizations and when the niche shape changes
they diversify to expand to the new niche that is taking shape. This indicates that analyzers
demonstrate a tendency to align their selves to all the decline conditions by being able to
leverage different aspects of their hybrid domain in different environments.
These findings contradict the postulations made in the theoretical framework as it was
assumed there that analyzers are able to succeed only under the condition of dissolution in
which they can leverage their hybrid domain. Instead, according to the data, they are able to
inhabit all the decline conditions as they are able to shift balance according to the
environment.
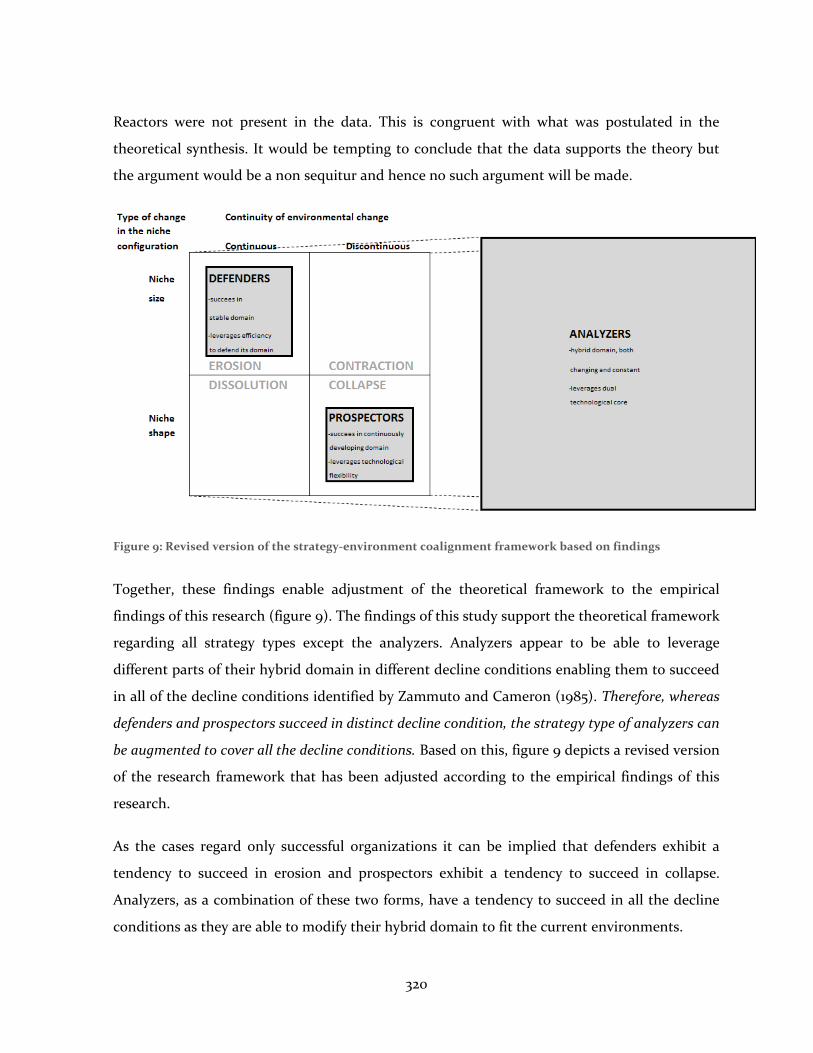
320
Reactors were not present in the data. This is congruent with what was postulated in the
theoretical synthesis. It would be tempting to conclude that the data supports the theory but
the argument would be a non sequitur and hence no such argument will be made.
Figure 9: Revised version of the strategy-environment coalignment framework based on findings
Together, these findings enable adjustment of the theoretical framework to the empirical
findings of this research (figure 9). The findings of this study support the theoretical framework
regarding all strategy types except the analyzers. Analyzers appear to be able to leverage
different parts of their hybrid domain in different decline conditions enabling them to succeed
in all of the decline conditions identified by Zammuto and Cameron (1985). Therefore, whereas
defenders and prospectors succeed in distinct decline condition, the strategy type of analyzers can
be augmented to cover all the decline conditions. Based on this, figure 9 depicts a revised version
of the research framework that has been adjusted according to the empirical findings of this
research.
As the cases regard only successful organizations it can be implied that defenders exhibit a
tendency to succeed in erosion and prospectors exhibit a tendency to succeed in collapse.
Analyzers, as a combination of these two forms, have a tendency to succeed in all the decline
conditions as they are able to modify their hybrid domain to fit the current environments.
321
It must be emphasized, that the strategy types of defenders and analyzers were emphasized as
they together represented 22 out of the 25 cases. This indicates that successful organizations
operating in declining industries exhibit ties to the niche that cannot be easily broken even
when the niche declines. This is natural for defenders as they aim to seal and protect a domain
in the market and with their largest risk of inability to respond to major changes in the market,
which is also well exemplified by the data (Miles et al. 1978). Analyzers, on the other hand, have
the ability to diversify as they are a combination form of defenders and prospectors (Miles et al.
1978). Despite this, the analyzers in the sample were not generally able to diversify beyond the
industries they operate in. This indicates that both of the strategy types exhibit path
dependency, which at least to some extent can be explained by the notion that all the cases
were successful so dramatic changes, were not necessary, as following the old path maintained
their success.
On the other hand, the amount of defenders and analyzers may be overemphasized because of
the nature of the two other strategy types. Prospectors, according to their ideal definition,
should not even be present in the sample as they strive to create and exploit new market
opportunities. This is maintained by the data, as the three cases that did not exemplify strategy
type of an analyzer or defender were labeled as prospectors as they inhabited the environment
type of collapse. In addition, reactors were not present in the sample as reactors either perish
or assume a consistent strategy when they are faced with a changing environment (Miles et al.
(1978).
The emphasis of analyzers and defenders can also be due to way how data was collected. As
prospectors inhabit environments where change is rapid, the change in niche can rather be
called evolution than decline which helps to explain the low number of prospectors in the
sample.
5.2 Comparing existing literature to the empirical finding of this study
Snow and Hrebiniak (1980) in their research of strategy, distinctive competences and
organizational performance argue that as different types of organizational strategies exist
simultaneously in the same industrial environment, the effects of natural selection is hindered.
322
This research contradicts these findings as distinct types of strategies appear to be successful in
different decline conditions. This implies that although variation exists as Snow and Hambrick
(1980) state, selection and retention follow a distinct path (Aldrick 1979, p. 27).
This research, as well as the one done by Snow and Hrebiniak (1980), share an important
common feature. Analyzers in both of the studies exemplify various sources of competitive
advantage depending on the context. This research, therefore, both contradicts and supports
the suggestions of Snow and Hrebiniak (1980).
In Hambrick’s 1987 research of the Miles and Snow typology, he studied defenders and
prospectors in innovative and non-innovative growing and mature industries. In his study, the
prospectors outperformed defenders only in innovative industries. This is supported by current
findings, as prospectors were present only in the condition which was rapidly changing.
Hambrick (1983) also suggested that in general the superior strategy was neither of the extreme
types but rather the middle type of analyzer. This is supported in the light of this research as
the analyzers appear to be able to leverage their hybrid domain differently in different decline
conditions, enabling them to succeed in all of the four different decline conditions.
In the context of this research, contradictory evidence has been presented of whether
organizational adaptation is managerially or environmentally derived. This is congruent with
Hrebiniak and Joyce (1985) arguing that classifying change solely to either of these categories is
misleading. In this research, a clear distinction exists among the two types of change.
Successful organizations in niches in which the niche size changes do not try to alter the
trajectory of decline but rather take it as granted and either hold their position in the niche or
diversify to related industries, therefore enhancing the pattern of decline. On the other hand,
successful organizations that operate in niches where the niche shape changes, aim at both
changing the industry and following such change, enhancing the pattern of niche shape
change. In light of these findings, choice is both a cause and a consequence of the
environmental condition in which the organizations operate as successful organizations drive
the niches to certain directions. This is consistent with the suggestions by Hrebiniak and Joyce
323
(1985), who postulate that choice is both a cause and a consequence of environmental
influences that organizations face.
Originally, a central premise of the typology was that the choice of defender, analyzer and
prospector strategy type can lead to effective performance, when the types are properly
implemented (Zahra and Pearce 1990; Miles et al. 1978). This has received both supportive and
contradictory findings (Hambrick 1983; Zajac and Shortell 1989; Smith et al. 1989; Zahra and
Pearce 1990). In the light of this research, analyzers appear to be able to succeed in all decline
conditions when the strategy type is properly implemented, supporting this premise. Defenders
and prospectors do not appear in all of the decline conditions and therefore contradict this
premise. Therefore, this study contradicts the aforementioned premise, as two of the three
strategy types were not able to succeed in all of the decline conditions.
It appears that while some of the findings are unique, the findings exhibit a tendency to be
similar to those presented in earlier studies regarding the strategy typology. This implies that
while declining industries differentiate from other industries, as their carrying capacity
decreases, correct alignment of strategy and environment leads organization to success, despite
the hostile nature of the environment.
6 CONCLUSIONS
This research started out with a broad research question of the kinds of strategies that lead
organization to success in declining industries. This problem was broken down into three
distinct research questions which will be examined here one by one to formulate a conclusion
for this research.
The first question regarded the array of strategies that are successful in declining industries.
The Miles and Snow (2003) strategy typology was used to exemplify different strategy types that
organizations can assume.
It appears that when an organization has a proactive stance towards its environment it holds a
change of succeeding in a declining industry. This is exemplified by the fact that all strategy
types except reactors were able to succeed in declining industries. This is also supported by
324
Miles et al. (1978) as they note that reactors are the only strategy type that is reactive towards
its environment and that when it faces changing environments it will either perish or assume
consistent form of strategy.
Now, it has been established that three strategy types can succeed in declining industries, it is
possible to make conclusions of the second research question. The second research question
regards the positioning of success strategies in declining industries. To portray different decline
conditions the typology of decline conditions by Zammuto and Cameron (1985) was used. It
appears that different strategy types have different kinds of tendencies to succeed in different
decline conditions. Defenders have a tendency to succeed in decline conditions where the
decline is continuous and where the niche size diminishes. This is also supported by Miles et al.
(1978) who postulate similar behavior for defenders.
Prospectors exemplify a tendency to succeed in decline conditions where the niche shape
changes discontinuously as they are able to follow changes in the niche and also create such
change. This is consistent with the suggestions of Miles et al. (1978) as they state that the prime
capability of prospectors is finding and exploiting new market opportunities.
Analyzers exemplify a tendency to succeed in all of the decline conditions, as they are able to
leverage their hybrid domain differently in different decline conditions. In decline conditions
where the niche size decreases, they diversify to enhance stability of their business. When faced
with situations in which the niche shape changes they tend to diversify to the new emerging
niche to accomplish congruence with the new emerging niche. These results are congruent
with Snow and Hrebiniak (1980) as their research implied that analyzers exemplify various
sources of competitive advantage. It is also congruent with the notions of Hambrick (1983) who
reached an outcome that analyzers in general are the most successful for of strategy.
As the three successful strategy types have been positioned to the field of decline conditions, it
is possible to proceed into making conclusions regarding the third and final research question.
The third question regarded how the strategy types as a whole are aligned to the decline
condition.
325
A pattern emerges among the three successful strategy types. The extreme strategy types inhabit
decline conditions that are at the two opposite ends of the spectrum. Defenders succeed in
decline conditions in which the decline occurs steadily and the niche size decreases.
Prospectors, on the other hand, succeed in the opposite decline conditions as they succeed
when niche shape changes discontinuously. Behaviors of both of these types are congruent
with the suggestions of Miles et al. (1978) regarding the environments where the different
strategy types succeed. Analyzers, strategy type that is a combination of the two extreme types,
can succeed in all the different decline conditions as they are able to leverage their hybrid
domain differently in different decline conditions. Therefore, depending on the decline
condition, analyzer can succeed in different ways.
To conclude, the research was able to address all the research questions and yield outcomes
that signify the different sources of competitive advantage in different decline conditions and
among the different strategy types. In addition, patterns emerged among the different strategy
types in different decline conditions. As such, it can now be concluded that research yielded
successful process with distinct outcomes.
6.1 Theoretical implications
This research has extended the application of Miles and Snow typology to declining industries
that were classified by the typology of decline conditions by Zammuto and Cameron (1985).
Theoretically the research has produced a few implications to the study of the Miles and Snow
(2003) typology.
First, the research has yielded similar outcomes as those suggested by Snow and Hrebiniak
(1980) and Hambrick (1983), as analyzers appear to be a superior type of strategy as they can
leverage their hybrid domain differently according to the decline condition. This research is
also congruent with Hambrick (1983) as the research implies that innovators prosper only in
rapidly evolving industries. On the basis of these outcomes, the behavior of different strategy
types in declining industries are similar to other industries. Therefore, while the context of
declining industries differs from other context due to its hostile nature, the successful
strategies do not deviate from other contexts.
326
Second, a central premise of the typology is that defender, analyzer and prospector strategy
types can lead to effective performance, when the types are properly implemented (Zahra and
Pearce 1990; Miles et al. 1978). This has received both supportive and contradictory evidence
(Hambrick 1983; Zajac and Shortell 1989; Smith et al. 1989; Zahra and Pearce 1990). This study
partially contradicts this premise, as only analyzers were able to succeed in all the decline
conditions, whereas defenders and prospectors were able to succeed only in certain decline
conditions.
This research also strengthens the argument of Hrebiniak and Joyce (1985), who argue that
choice is both a cause and a consequence of environmental influence. This research suggests
that the type of decline is both caused by the successful strategic choices and a consequence of
these choices. Therefore, successful strategies drive the niche to either a direction of
formulation of a new niche or the death of the current niche.
6.2 Managerial implications
The first and most relieving managerial implication is that it is possible to succeed in declining
industries. For most of managers even the thought of operating in such environment is scary.
Hence, hopefully this research can raise hope and illuminate the possibilities for success in
declining industries. As Ghemawatt and Nalebuff (1990) have stated, more than 10% of the
United States manufacturing output in 1977 was generated by a declining industry. Hence
declining industries should rather be seen as an opportunity where one can succeed if the
organizations strategy is configured in a correct manner.
What is managerially important in this research is that different strategy types succeed in
different kinds of decline conditions. This implies that managers leading organizations
operating in declining industries should do two kinds of things. First, they should try to
establish the kind of decline the organization is facing, and, secondly, reconfiguring strategy to
comply with the requirements of the environment to achieve strategic fit. This however is not
as easy as it may sound, as Miles et al. (1978) have also stated that breaking the pattern of
behavior is very hard as managers tend to respond similarly to changes.
327
Despite the positive outcomes of this research, this research reported only success and hence
does not tell anything about the failure rate in such industries. Therefore the success in these
kinds of environments is in no way guaranteed. Success, even with a correct strategy, cannot be
guaranteed in any way.
To conclude, although this research has presented possibility of success in declining industries,
these findings should be taken with a precaution as declining industries are environments
where by definition the market is diminishing. Despite this, the declining industries should not
be feared as they represent a substantial portion of for example manufacturing industries.
Hence, when faced with such conditions the organizations should ensure fit between the
strategy of the organization and the declining industry and continue operations accordingly.
6.3 Limitations and suggestions for further research
This research has three prime limitations that have to be stated explicitly. First, the
methodology used to conduct this research is primarily aimed to be done by a research team.
This is due to two reasons. First, to increase reliability of coding the persons coding the cases
and those designing the theory should be separated to minimize coding bias. Secondly, the
coding should be done by multiple raters to increase reliability of the coding. These problems
however were not possible to be solved in the context of this research and are major limitations
of this study. Therefore it would be beneficial to redo the research with a research team to
minimize coding bias and increase the reliability of the results.
Second, the sample size in this research was low as research in declining industries is not case
intensive area. In addition, many cases did not have adequate information to complete the
survey. This undermines the reliability of the findings of this research. Increasing the size of the
sample would increase the reliability of the results. Prospectors were few among the sample
and by increasing the sample size; a deeper understanding of their behavior in declining
industries could be gained. This might also be partly due to the fact that conditions of changing
niche shapes might not be considered conditions of decline but of evolution and change.
328
Size of the organization relative to the niche was left outside of the scope of this research as it
was not possible to accommodate it into the research. This leaves a gap in the research as size
affects the power of organizations to steer the niche in which they operate in. By filling this gap
a consensus could be reached of how much the choice of strategy affects success and how much
the size of the organization affects this.
As this research has regarded only success strategies in declining industries, it would be
interesting to contrast the success and failure rates of different strategy types in declining
industries. This would yield insight into what kind of risk is involved in different strategic
choices. By doing so, one could calculate the success/failure rates of different strategy types and
indicate whether certain strategic types have more risk than others.
The research was designed to produce only a snapshot. Therefore, it would be essential to gain
more knowledge of the ability of organizations to change their strategy type when faced with
decline and therefore succeed in the environment. This would provide crucial information of
how the dynamics of strategic choice and environmental selection function in the declining
industries.
329
REFERENCES
Abernathy, William J. and Kim B. Clark (1975), “Innovation: Mapping the winds of creative
destruction.” Research Policy, 14, pp. 3-22.
Agarval, Rajhsree and Barry L. Bayus (2004), “Creating and surviving in new industries.”
Advances in strategic management, 21, pp. 107-130.
Aldrich, Howard (1979), Organizations and Environments. Stanford, Stanford University Press
Anderson, Philip and Michael L. Tushman (1990), “Technological Discontinuities and
Dominant Designs: A Cyclical Model of Technological Change.” Administrative Science
Quarterly, 35, pp. 604-633.
Astley, W. Graham and Andrew H. Van De Ven (1983), “Central Perspectives and Debates in
Organization Theory.” Administrative Science Quarterly, 28 (2), pp. 245-273.
Behling, Orlando (1980), “The Case for the Natural Science Model For Research in
Organizational Behavior And Organization Theory.” Academy of Management Review, 5
(4), pp. 483-490.
Bullock, R. J. (1986), “A Meta-Analysis Method for OD Case Studies.” Group & Organization
Studies, 11 (1-2), pp. 33-48.
Cameron, Kim S. (1983), “Strategic responses to conditions of decline: Higher education and the
private sector.” Journal of Higher Education, 54, pp. 359-380.
Cameron, Kim S., Myung U Kim and David A. Whetten (1987),”Organizational Effects of
Decline and Turbulence.” Administrative Science Quarterly, 32, pp. 222-240.
Cameron, Kim S. and Raymond Zammuto (1983), “Matching Managerial Strategies to
Conditions of Decline.” Human Resource Management, 22 (4), pp. 359-375.
Chaganti, Rajeswararao and Rakesh Sambharay (1987), “Strategic Orientation and
Characteristics of Upper Management.” Strategic Management Journal, 8 (4), pp. 393-
401.
Child, John (1972), “Organizational structure, environment and performance: The role of
strategic choice” Sociology, 6, pp. 1-22.
Child, John (1997), “Strategic Choice in the Analysis of Action, Structure, Organizations and
Environment: Retrospect and Prospect.” Organization Studies, 18 (1), pp. 43-76.
Collis, Jill and Roger Hussey (2003), Business Research: A practical guide for undergraduate and
postgraduate students. New York, Palgrave MacMillan.
Conant, Jeffrey S., Michael P. Mokwa and P. Rajan Varadarajan (1990), “Strategic types,
Distinctive Marketing Competencies and Organizational Performance: A Multiple
Measures-Based Study” Strategic Management Journal, 11 (5), pp. 365-383.
330
Cox, William E. Jr. (1967), “Product Life Cycles as Marketing Models.” The Journal of Business,
40 (4), pp. 375-384.
Cunningham, M. T. (1969), “The application of product life cycles to corporate strategy: some
research findings.” European Journal of Marketing, 3 (1), pp. 32-44.
Dean, Joel (1950), “Pricing Policies for New Products.” Harvard Business Review, 28 (6), pp. 45-
53.
Eisenhardt, Kathleen M. (1989), “Building Theories from Case Study Research.” Academy of
Management Review, 14 (4), pp. 532-550.
Eisenhardt, Kathleen M. and Melissa E. Graebner (2007),”Theory building from cases:
Opportunities and challenged.” Academy of Management Journal, 50 (1), pp. 25-32.
Fein, Adam J. (1998), “Understanding evolutionary processes in non-manufacturing industries:
Empirical insight from the shakeout in pharmaceutical wholesaling.” Journal of
Evolutionary Economics, 8 (3), pp. 231-270.
Filson, Darren (2002), “Product and process innovations in the life cycle of an industry.” Journal
of Economic Behavior & Organization, 49, pp. 97-112.
Ghemawat, Pankaj and Barry Nalebuff (1985),”Exit.” Rand Journal of Economics, 16 (2), pp. 184-
194.
Ghemawat, Pankaj and Barry Nalebuff (1990),”The Devolution of Declining Industries.” The
Quarterly Journal of Economics, 105 (1), 167-186.
Gibbert, Michael, Winfried Ruigrok and Barbara Wicki (2008), “What passes as a rigorous case
study?” Strategic Management Journal¸ 29 (13), pp. 1465-1474.
Goldfarb, Brent, David Kirsch and David A. Miller (2007), “Was there too little entry during the
Dot Com Era?” Journal of Financial Economics, 86, pp. 100-144.
Gort, Michael and Steven Klepper (1982), “Time path in the Diffusion of Product Innovations.”
The Economic Journal, 92 (367), pp. 630-653.
Hambrick, Donald C. (1983), “Some Tests of the Effectiveness and Functional Attributes of
Miles and Snow’s Strategic Types.” Academy of Management Journal, 26 (1), pp. 5-26.
Hambrick, Donald C. and Phyllis A. Mason (1984), “Upper Echelons: The Organization as a
Reflection of Its Top Managers.” The Academy of Management Review, 9 (2), pp. 193-206.
Hannan, Michael T. and John Freeman (1977), “The Population Ecology of Organizations.”
American Journal of Sociology, 82 (5), 929-964.
Harrigan, Kathryn Rudie (1980a), “Strategy Formulation in Declining Industries.” Academy of
Manageent Review, 5 (4), pp. 599-604.
Harrigan, Kathryn Rudie (1980b), “Strategies for declining industries.” Journal of Business
Strategy, 1 (2), pp. 20-34.
331
Harrigan, Kathryn Rudie and Michael Porter (1983), “End-game strategies for declining
industries.” Harvard Business Review, 61 (4), pp. 111-120.
Hrebiniak, Lawrence G. and William F. Joyce (1985), “Organizational Adaptation: Strategic
Choice and Environmental Determinism.” Administrative Science Quarterly, 30 (3), pp.
336-349.
James, William L. and Kenneth J. Hatten (1995), “Further Evidence on the Validity of the Self
Typing Paragraph Approach: Miles and Snow Strategic Archetypes in Banking.”
Strategic Management Journal, 16 (2), pp. 161-168.
Jonavic, Boyan and Glenn M. MacDonald (1994), “The Life Cycle of a Competitive Industry.”
Journal of Political Economy, 102 (21), pp. 322-347.
Kim, W. Chan and Renée Mauborgne (2005),”Blue ocean strategy.” Harvard Business Review, 82
(10), pp. 76-84.
Kincheloe, Joel L. and Kenneth Tobin (2009), “The much exaggerated death of positivism.”
Cultural Studies of Science Education, 4 (5), pp. 513-528.
Klepper, Steven (1996),”Entry, Exit, Growt, and Innovation over the Product Life Cycle.” The
American Economic Review, 86 (3), pp.562-583.
Klepper, Steven (1997),”Industry Life Cycles.” Industrial and Corporate Change, 6 (1), pp. 145-181.
Larsson, Rikard (1993), “Case Survey Methodology: Quantitative Analysis of Patterns across
Case Studies.” Academy of Management Journal, 36 (6), pp. 1515-1546.
Lucas, Willian A. (1974), “The case survey method: aggregating case experience.” Santa Monica,
The Rand Corporation
Malhotra, Naresh K. and David F. Birks (2007), Marketing Resaerch: An Applied Approach,
Essex: Pearson Education Limited.
McDaniel, Stephen W. and James W. Kolari (1987), “Marketing Strategy Implications of the
Miles and Snow Strategic Typology.” Journal of Marketing, 51 (4), pp. 19-30.
Meyer, Alan D. (1982), “Adapting to environmental jolts” Administrative Science Quarterly, 27
(4), pp. 515-537.
Miles, Raymond E., Charles C. Snow, Alan D. Meyer and Henry J. Coleman Jr. (1978),
“Organizational Strategy, Structure and Process.” Academy of Management Review, 3
(3), pp. 546-562.
Miles, Raymond E. and Charles C. Snow (2003), Organizational, Strategy, Structure and Process,
Stanford: Stanford University Press.
Mintzberg, Henry (1978),”Patterns in strategy formulation.” Management Science, 24 (9), pp.
934-948.
332
Mintzberg, Henry and James A. Waters (1982), “Tracking Strategy in an Entrepreneurial Firm.”
Academy of Management Journal, 25 (3), pp. 465-499.
Mintzberg, Henry and James A. Waters (1982), “Of Strategies, Deliberate and Emergent.”
Strategic Management Journal, 6 (3), 257-272.
Moore, Marguerita (2005), “Towards a confirmatory model of retail strategy types: an empirical
test of miles and snow” Journal of Business Research, 58, pp.696-704.
Prahalad, C. K. and Gary Hamel (1994), “Strategy as a Field of Study: Why Search for a New
Paradigm?” Strategic Management Journal, 15 (Summer), 5-16.
Prescott, John E. (1986), “Environments as moderators of relationship between strategy and
performance.” Academy of Management Journal, 29 (2), pp. 329-346.
Porter, Michael E. (1985), Competitive Advantage: Creating and Sustaining Superior
Performance. New York: The Free Press.
Quinn, Robert E. and Kim Cameron (1983), “Organizational Life Cycles and Shifting Criteria of
Effectiveness: Some Preliminary Evidence.” Management Science, 29 (1), pp. 33-51.
Reynold, Stanley S. (1988), “Plant Closing and Exit Behaviour in Declining Industries”
Economica, 55 (220), pp. 493-503.
Segev, Eli (1989), “A Systematic Comparative Analysis and Synthesis of Two Business-Level
Strategy Typologies.” Strategic Management Journal, 10 (5), pp. 487-505.
Shortell, Stephen M. and Edward J. Zajac (1990), “Perceptual and Archival Measures of Miles
and Snow’s Strategic Types: A Comprehensive Assessment of Reliability and Validity.”
The Academy of Management Journal, 33 (4), pp. 817-832.
Smith, Ken G., James P. Guthrie and Ming-Jer Chen (1989), “Strategy, Size and Performance”
Organization Studies, 10 (1), pp. 63-81.
Snow, Charles C. and Donald C. Hambrick (1980), “Measuring Organizational Strategies: Some
Theoretical and Methodological problems.” The Academy of Management Review, 5 (4),
pp. 527-538.
Snow, Charles C. and Lawrence G. Hrebiniak (1980), “Strategy, Discinctive Competence, and
Organizational Performance.” Administrative Science Quarterly, 25 (2), pp. 317-336.
Soanes, Catherine and Sara Hawker (2005), Compact Oxford English Dictionary of Current
English, Oxford: Oxford University Press.
Stake, Robert E. (1995), The Art of Case Study Research. Thousand Oaks: Sage Publications.
Taggart, J. H. (1995), “Strategy Formulation in Declining Industries: A Biology Paradigm.”
Journal of Marketing Management, 11 (4), pp. 295-314.
Tushman, Michael L. and Philip Anderson (1986), “Technological Discontinuities and
Organizational Environments.“ Administrative Science Quarterly, 31 (3), pp. 439-465.
333
Utterback, James M. and William J. Abernathy (1975), “A Dynamic Model of Process and
Product Innovation.” The International Journal of Management Science, 3 (6), pp. 639-
656.
Venkatraman, N. and John C. Camillus (1984), “Exploring the Concept of “Fit” in Strategic
Management.” Academy of Management Review, 9 (3), pp. 513-525.
Venkatraman, N. and John E. Prescott (1990), “Environment-Strategy Coalignment: An
Empirical Test of Its Performance Implications.” Strategic Management Journal, 11 (1),
pp. 1-23.
Whetten, David A. (1980), “Organizational Decline: A Neglected Topic in Organizational
Science.” The Academy of Managemet Review, 5 (4), 577-588.
Williamson, Oliver E. (1975), Markets and hierarchies: Analysis and Antitrust Implications. New
York: The Free Press.
Yin, Robert K. (2003), Case study research: Design and Methods. Thousand Oaks: Sage
Publications.
Yin, Robert K. and Karen A. Heald (1975), “Using Case Survey Method To Analyze Policy
Studies.” Administrative Science Quarterly, 20 (3), pp. 371-381.
Yin, Robert K. and Douglas Yates (1974), “Street-Level Governments: Assessing
Decentralization and Urban services (An Evaluation of Policy Related Research).”
report, National Science Foundation, Washington.
Zahra, Shaker A. and John A. Pearce (1990), “Research Evidence On The Miles-Snow Typology.”
Journal of Management, 16 (4), pp. 751-768.
Zajac, Edward J. and Stephen M. Shortell (1989), “Changing Generic Strategies: Likehood,
Direction, and Performance Implications” Strategic Management Journal, 10 (5), pp. 413-
430.
Zammuto, Raymond F. (1983), ”Growth, stability, and decline in American college and
university enrollment.” Educational Administration Quarterly, 19, pp. 83-99.
Zammuto, Raymond (1988), “Organizational adaptation: Some implications of organizational
ecology for strategic choice.” Journal of Management Studies, 25 (2), pp. 105-120.
Zammuto, Raymond D., Kim S. Cameron (1985), “Environmental decline and organizational
response” in Research in Organizational Behavior, Vol. 7, L. L. Cummings and Barry M.
Staw, eds. Greenwich, JAI PRESS INC, 223-262.
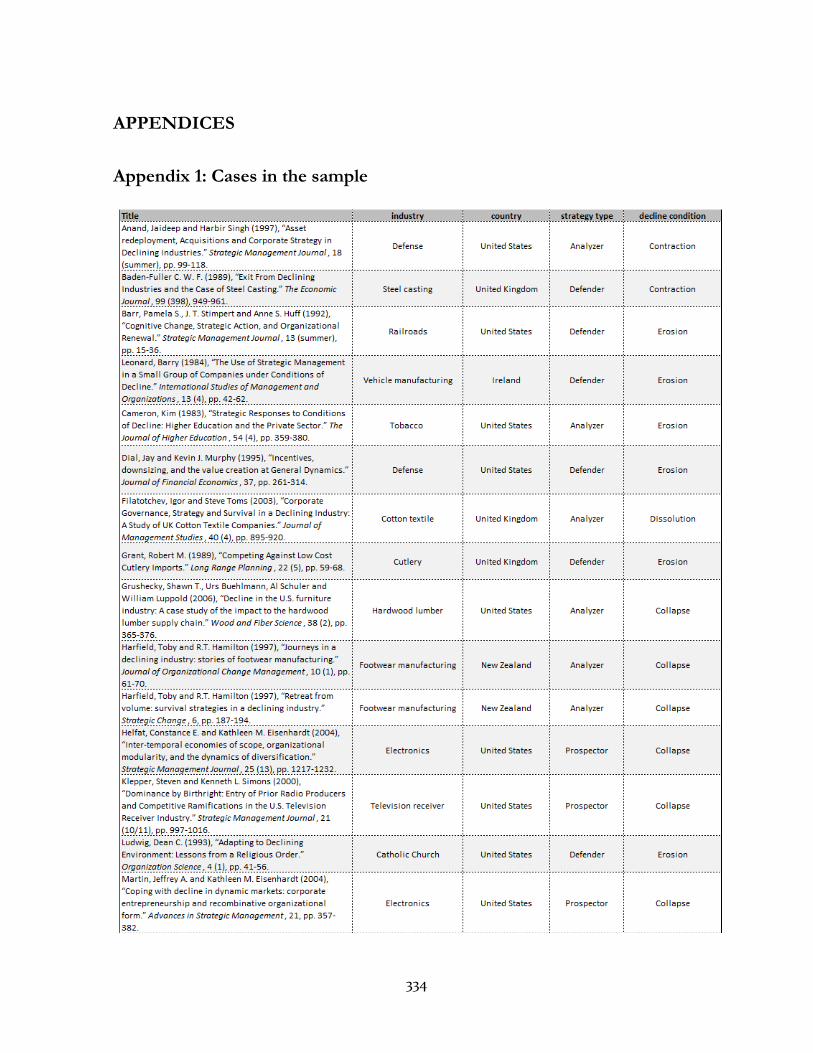
334
APPENDICES
Appendix 1: Cases in the sample
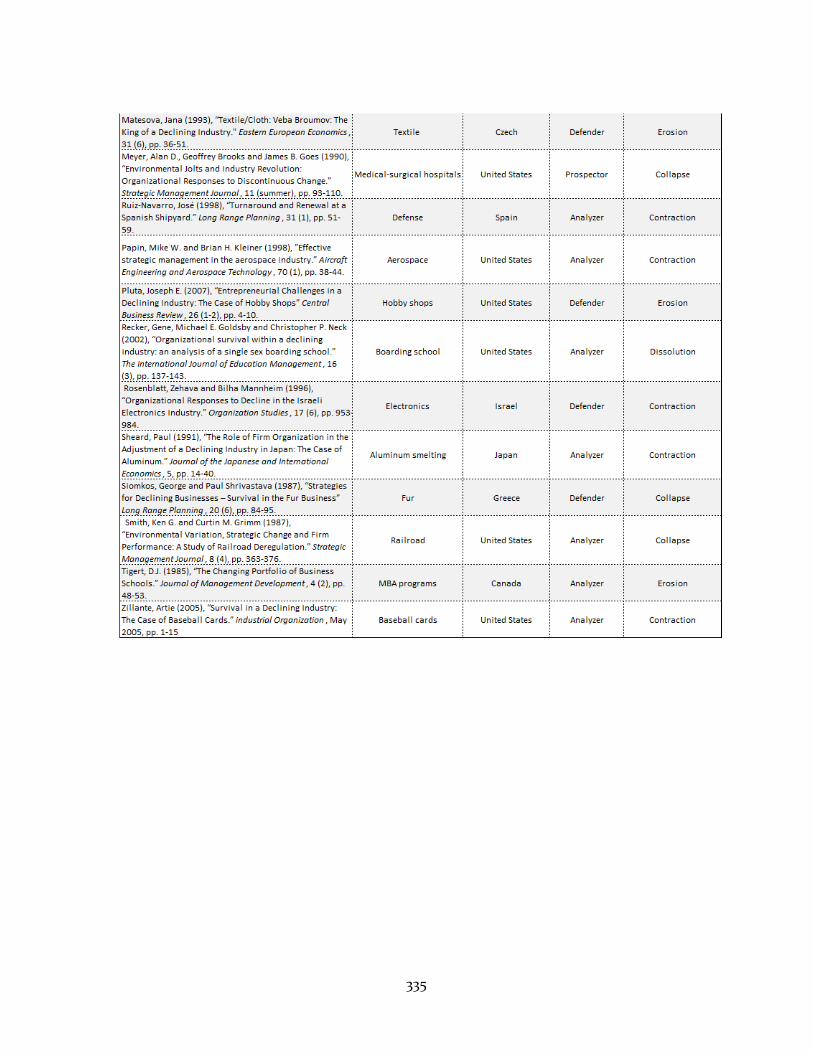
335
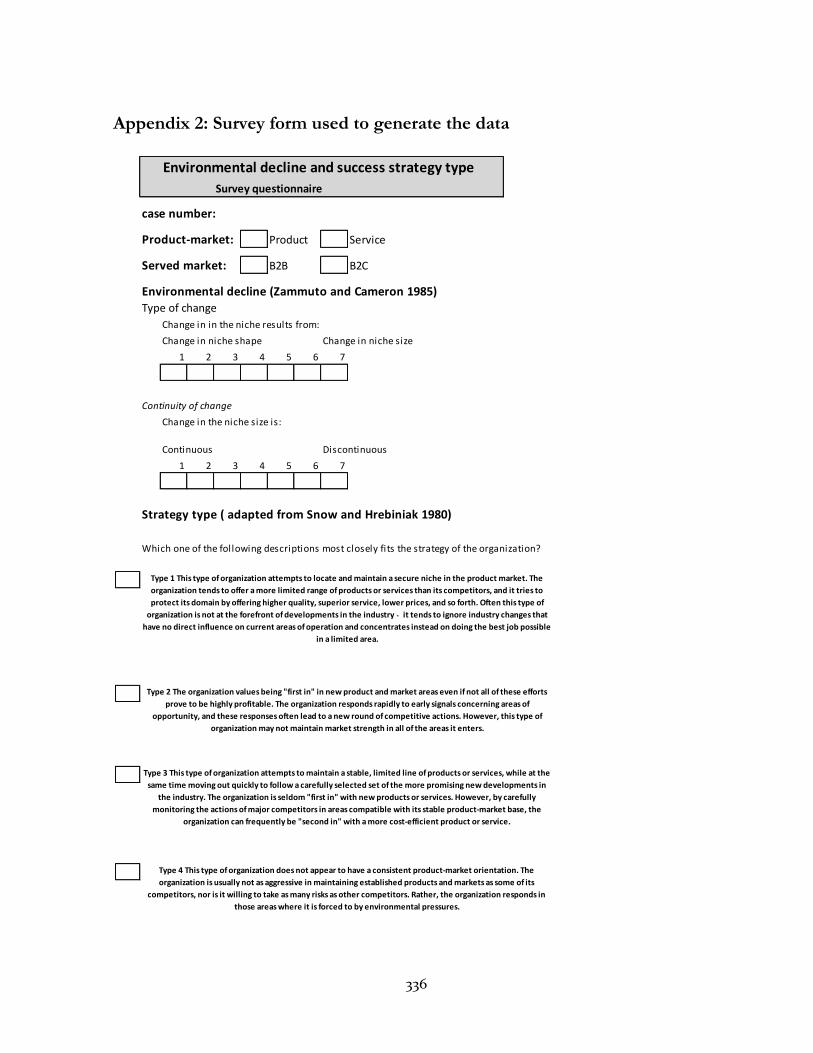
336
Appendix 2: Survey form used to generate the data
Environmental decline and success strategy type
Survey questionnaire
case number:
Product-market: Product Service
Served market: B2B B2C
Environmental decline (Zammuto and Cameron 1985)Type of change
Change in in the niche results from:
Change in niche shape Change in niche size
1 2 3 4 5 6 7
Continuity of change
Change in the niche size is:
Continuous Discontinuous
1 2 3 4 5 6 7
Strategy type ( adapted from Snow and Hrebiniak 1980)
Which one of the following descriptions most closely fits the strategy of the organization?
Type 1 This type of organization attempts to locate and maintain a secure niche in the product market. The
organization tends to offer a more limited range of products or services than its competitors, and it tries to
protect its domain by offering higher quality, superior service, lower prices, and so forth. Often this type of
organization is not at the forefront of developments in the industry - it tends to ignore industry changes that
have no direct influence on current areas of operation and concentrates instead on doing the best job possible
in a limited area.
Type 2 The organization values being "first in" in new product and market areas even if not all of these efforts
prove to be highly profitable. The organization responds rapidly to early signals concerning areas of
opportunity, and these responses often lead to a new round of competitive actions. However, this type of
organization may not maintain market strength in all of the areas it enters.
Type 3 This type of organization attempts to maintain a stable, limited line of products or services, while at the
same time moving out quickly to follow a carefully selected set of the more promising new developments in
the industry. The organization is seldom "first in" with new products or services. However, by carefully
monitoring the actions of major competitors in areas compatible with its stable product-market base, the
organization can frequently be "second in" with a more cost-efficient product or service.
Type 4 This type of organization does not appear to have a consistent product-market orientation. The
organization is usually not as aggressive in maintaining established products and markets as some of its
competitors, nor is it willing to take as many risks as other competitors. Rather, the organization responds in
those areas where it is forced to by environmental pressures.
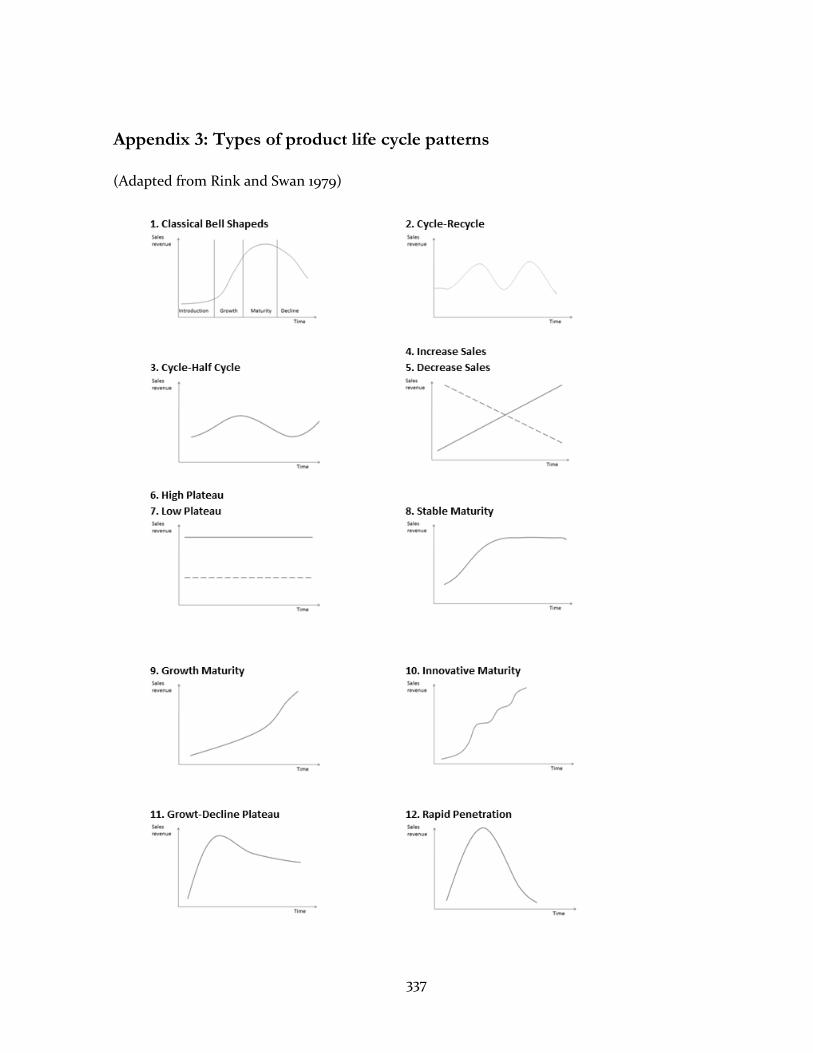
337
Appendix 3: Types of product life cycle patterns
(Adapted from Rink and Swan 1979)