Embed Size (px)
Citation preview

© 2015 Experian Information Solutions, Inc. All rights reserved. Experian and the marks used herein are service marks or registered trademarks of Experian Information Solutions, Inc.
Other product and company names mentioned herein are the trademarks of their respective owners. No part of this copyrighted work may be reproduced, modified, or distributed in
any form or manner without the prior written permission of Experian. Experian Public.
Unlocking the power of commercial bureau and regional economic data in forecasting loan performance

© 2015 Experian Information Solutions, Inc. All rights reserved. Experian Public. 2
Cris deRitis Moody’s Analytics
Dan Meder Experian
Introducing:
@ExperianVision | #vision2015
Follow us on Twitter:

3 © 2015 Experian Information Solutions, Inc. All rights reserved. Experian Public.
Small business as growth engine
Capital adequacy requirements and small business lending
Correlating macro economic factors and small business performance
Best practices in loss forecasting and stress testing
Summary
Agenda

Data
© 2015 Experian Information Solutions, Inc. All rights reserved. Experian Public. 4
Firms with less than
100 employees make up
98% of all businesses
in the U.S.

5 © 2015 Experian Information Solutions, Inc. All rights reserved. Experian Public.
Growth Firms with less than
100 employees
showed substantial
employment growth
in H1 2014

Insights
6 © 2015 Experian Information Solutions, Inc. All rights reserved. Experian Public.
Over 50% of Small
and Medium Enterprise
(SME) lending
is conducted by
banks with assets
over $1 billion

© 2015 Experian Information Solutions, Inc. All rights reserved. Experian Public. 7
Capital adequacy
requirements and
small business
lending

8 © 2015 Experian Information Solutions, Inc. All rights reserved. Experian Public.
WHAT IS REQUIRED? The aim of the annual reviews is to ensure that
large financial institutions have robust,
forward-looking capital planning processes
that account for their unique risks, and to help
ensure that they have sufficient capital to
continue operations throughout times of
economic and financial stress.
– Federal Reserve Board

9 © 2015 Experian Information Solutions, Inc. All rights reserved. Experian Public.
Economic
Instability in the
economic environment
calls for controlled
growth that balances
portfolio growth with risk
Technology
Potential for shifts in
regulatory, industry,
market and business
dynamics are
demanding more agile
and flexible technology
to minimize business
disruptions and support
real-time decisioning
Regulatory
Increased regulatory
requirements demand
sound development,
implementation and use
of credit models, a
stronger focus on risk
governance and
rigorous management of
liquidity and capital
Social
The Consumer
Protection Bureau
(CFPB) is mandating
more education,
transparency and
inclusive lending
practices to ensure
equal access to credit
and to protect
consumers from unfair
lending practices
Moving beyond the burden of compliance to uncover opportunity

© 2015 Experian Information Solutions, Inc. All rights reserved. Experian Public. 10
Correlating macro
economic factors
and small business
performance
© 2015 Experian Information Solutions, Inc. All rights reserved. Experian Public.
Analytics
11
Best practice combines
business performance
and macroeconomic
factors in determining
capital adequacy
12 © 2015 Experian Information Solutions, Inc. All rights reserved. Experian Public.
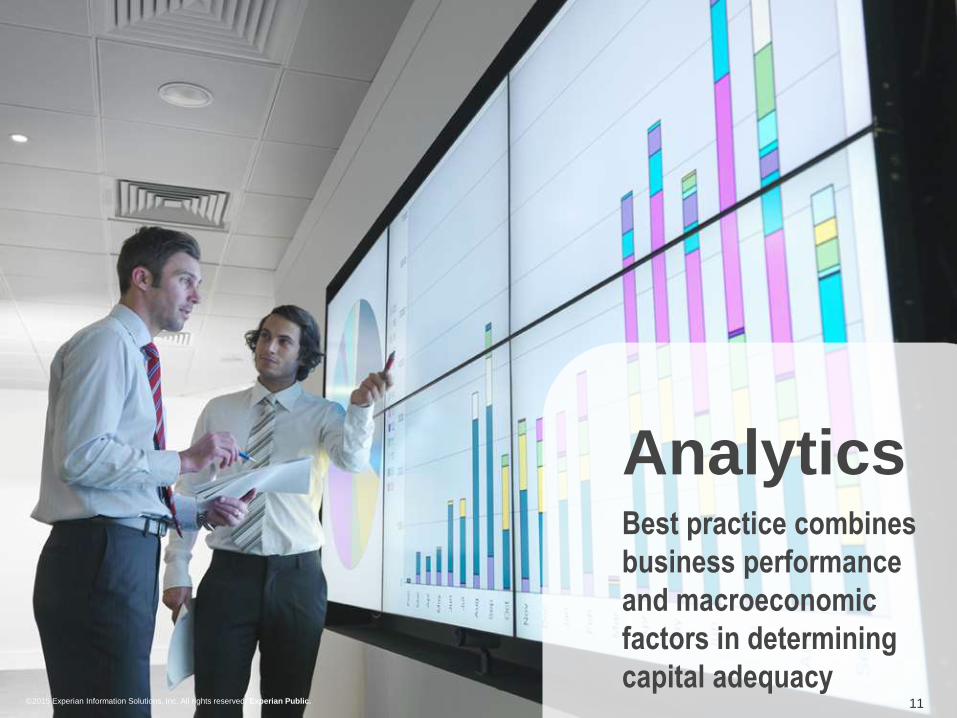
Macro economic factors influence on small business performance
Small business
performance
Economic growth
Employment Personal income
Consumer price index

13 © 2015 Experian Information Solutions, Inc. All rights reserved. Experian Public.
Payment and risk performance
► Region
► Industry
Economic
► Employment
► Personal income
► Retail sales
► Gross domestic product
► Personal consumption expenditures
► Industrial production
The combined power of economic and performance data
14 © 2015 Experian Information Solutions, Inc. All rights reserved. Experian Public.
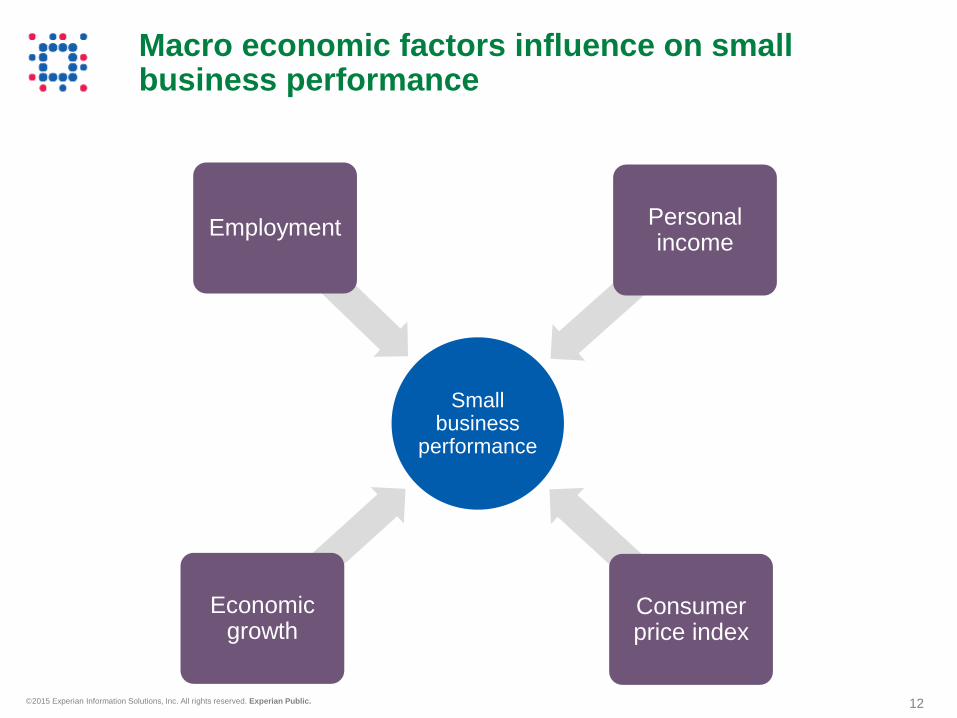
Macro economic factors can affect different types of businesses in different ways
► Example: unemployment impact on retail performance
Correlating macro economic factors with the unique characteristics of your portfolio can increase predictiveness
► Geographic
► Business size
► Industry
Identifying higher risk segments of the portfolio will likely result in better identification of true reserves
Obtaining a well-rounded view of your portfolio

15 © 2015 Experian Information Solutions, Inc. All rights reserved. Experian Public.
How payment performance can vary by region…
Percent of balances past due (firms with fewer than 100 workers)
Sources: Experian, Moody’s Analytics
0.80 to 5.43
11.57 to 29.50
5.44 to 11.56

16 © 2015 Experian Information Solutions, Inc. All rights reserved. Experian Public.
…and by industry
Best performing industries by delinquency percent
Source: Business Information Map
1%
2%
3%
4%
5%
6%
7%
Q1 2013 Q2 2013 Q4 2013 Q1 2014 Q2 2014 Q3 2014 Q4 2014
Public Services Utilities
Health Services Education Services
Hospitality
0%
5%
10%
15%
20%
Q1 2013 Q2 2013 Q4 2013 Q1 2014 Q2 2014 Q3 2014 Q4 2014
Business Services Real EstateTransportation FinanceConstruction
Worst performing industries by delinquency percent

© 2015 Experian Information Solutions, Inc. All rights reserved. Experian Public. 17
Best practices in
loss forecasting
and stress testing

18 © 2015 Experian Information Solutions, Inc. All rights reserved. Experian Public.
SEEING THE FUTURE
Prediction is very difficult,
especially if it's about
the future.
– Niels Bohr
19 © 2015 Experian Information Solutions, Inc. All rights reserved. Experian Public.
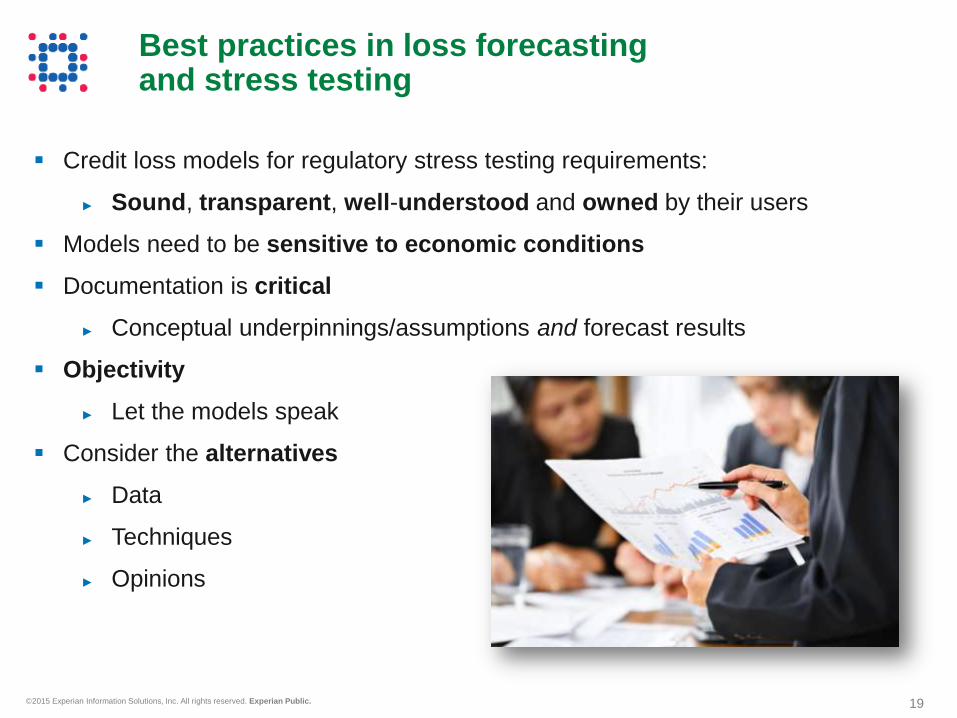
Credit loss models for regulatory stress testing requirements:
► Sound, transparent, well-understood and owned by their users
Models need to be sensitive to economic conditions
Documentation is critical
► Conceptual underpinnings/assumptions and forecast results
Objectivity
► Let the models speak
Consider the alternatives
► Data
► Techniques
► Opinions
Best practices in loss forecasting and stress testing

20 © 2015 Experian Information Solutions, Inc. All rights reserved. Experian Public.
MOONSTRUCK
MOMENT There are three kinds of pipe. There's what you
have, which is garbage - and you can see where
that's gotten you. There's bronze, which is pretty
good, unless something goes wrong. And
something always goes wrong. Then, there's
copper, which is the only pipe I use. It costs
money. It costs money because it saves money.
— Cosmo Castorini
21 © 2015 Experian Information Solutions, Inc. All rights reserved. Experian Public.
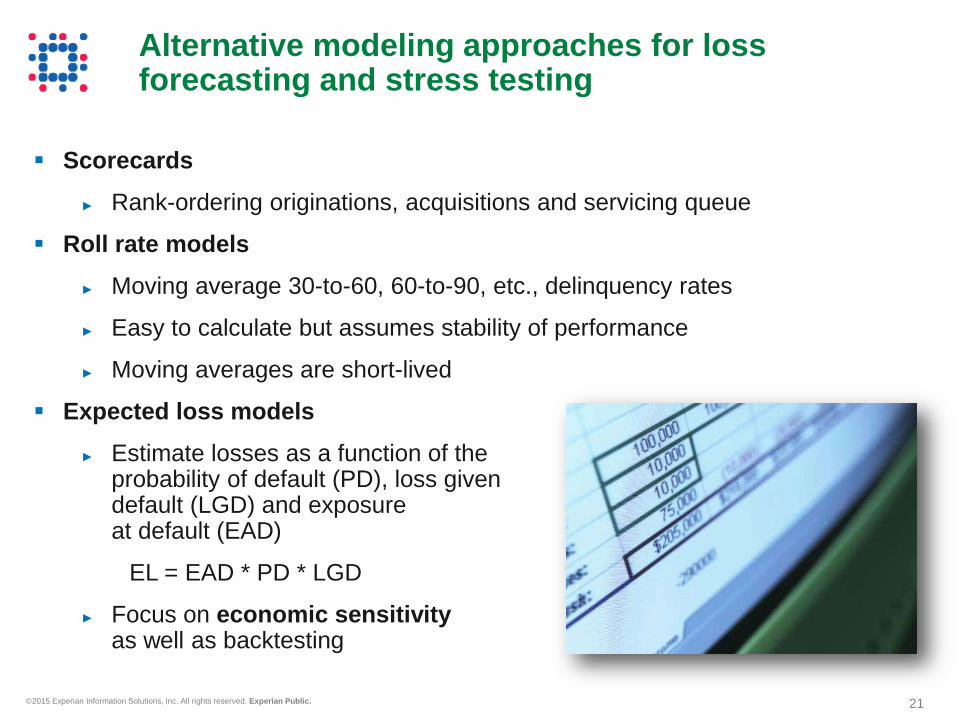
Scorecards
► Rank-ordering originations, acquisitions and servicing queue
Roll rate models
► Moving average 30-to-60, 60-to-90, etc., delinquency rates
► Easy to calculate but assumes stability of performance
► Moving averages are short-lived
Expected loss models
► Estimate losses as a function of the probability of default (PD), loss given default (LGD) and exposure at default (EAD)
EL = EAD * PD * LGD
► Focus on economic sensitivity as well as backtesting
Alternative modeling approaches for loss forecasting and stress testing

22 © 2015 Experian Information Solutions, Inc. All rights reserved. Experian Public.
The complex life of a loan
O months delinquent
1 month delinquent
2 months delinquent
3 months delinquent
4 months delinquent
Charge-off (Gross $)
Recovery (=1-LGD)
Net Loss $
Originations/ Sales
Prepayment
Receivable Income
• Interest Income
• Fees
• Collection Expenses

23 © 2015 Experian Information Solutions, Inc. All rights reserved. Experian Public.
Micro approach: Loan/account level models
► Incorporate borrower and loan level detail (Big Data)
► Longer processing and simulation times
► May be less sensitive to broader economic trends and feedback effects
● Attenuation bias
Macro approach: Cohort level models
► Collapse borrower and loan level information to cohorts
► Shorter processing and simulation times
► Better suited to aggregate economic data
Multiple approaches are ideal
Expected loss model strengths and weaknesses

24 © 2015 Experian Information Solutions, Inc. All rights reserved. Experian Public.
Microeconomic model used to forecast account or loan level performance
Competing risk framework is common
Estimate discrete-time hazard
X has account-specific and time-varying economic factors
Aggregate economic information is correlated with individuals but may introduce noise
► Metro-level unemployment rate is an imprecise approximation of individual-level unemployment probability
Expected loss models Micro approach

25 © 2015 Experian Information Solutions, Inc. All rights reserved. Experian Public.
Macroeconomic model used to forecast macro-level performance like portfolio loss
► Capture broader trends, interdependencies and cycles
Portfolio losses especially stress losses are macro-dependent
Credit performance by regional geography may offer better match with regional economic data
► Higher correlation = lower noise
► Greater precision = Less excess capital
Expected loss models Macro approach

26 © 2015 Experian Information Solutions, Inc. All rights reserved. Experian Public.
Fed favors an aggregated approach for small business loans
Fed favors an aggregated approach for small business loans due to limited data
The other retail lending product portfolios include the small business loan portfolio, the other consumer loan portfolio, the student loan portfolio, the corporate credit card portfolio, and international retail portfolios. Due to data limitations and the relative small size of these portfolios, loan level models of default are not feasible.
Comprehensive Capital Analysis and Review 2012: Methodology for Stress Scenario Projections March 12, 2012

27 © 2015 Experian Information Solutions, Inc. All rights reserved. Experian Public.
Cohort loss models
Segment portfolio by product, geography, risk segment and vintage
Compute default rates each reporting month by cohort
Estimate PD = f(credit quality, age/maturation, the economy)
Leverage panel data and regional heterogeneity
Economic data is consistent with outcome providing appropriate sensitivity for stress testing:
► Default rate in Philadelphia directly related to unemployment rate in Philadelphia
Expected loss models Macro approach
Age V2011Q1 V2011Q2 V2011Q3 V2011Q4 V2012Q1
1 0.0% 0.0% 0.0% 0.2% 0.0%
2 0.5% 0.1% 1.0% 0.5% 0.3%
3 1.0% 0.1% 1.5% 1.0% 1.0%
4 1.5% 0.4% 1.7% 2.0% 2.4%

28 © 2015 Experian Information Solutions, Inc. All rights reserved. Experian Public.
Fed provides national scenarios
2015Q1 Severely Adverse Scenario for Unemployment Rate

29 © 2015 Experian Information Solutions, Inc. All rights reserved. Experian Public.
Local economics matter… Idiosyncratic scenarios stress geographic and industry concentrations
2015Q1 Severely Adverse Scenario

30 © 2015 Experian Information Solutions, Inc. All rights reserved. Experian Public.
Champion/challenger models give a broader view
► Over-reliance on single model technologies during US recession
► Leverage strengths of multiple approaches
► Fully transparent, back-tested and documented econometric loss forecasting models customized to specific portfolios
Benchmarking
► Experian industry data exist across multiple segments
► Industry data can fill in portfolio data deficiencies for modeling
► For small portfolios, no choice BUT an industry model
Supporting forecasts with external data

© 2015 Experian Information Solutions, Inc. All rights reserved. Experian Public. 31
Some final
thoughts…

32 © 2015 Experian Information Solutions, Inc. All rights reserved. Experian Public.
If you don’t have a loss forecast policy for your small business portfolio… get one
If you do, strongly consider what we’ve discussed today
But either way, we’re here to help. Come talk to us!
Some final thoughts…
© 2015 Experian Information Solutions, Inc. All rights reserved. Experian Public. 33
For additional information,
please contact:
@ExperianVision | #vision2015
Follow us on Twitter:

34 © 2015 Experian Information Solutions, Inc. All rights reserved. Experian Public.
Share your thoughts about Vision 2015!
Please take the time now to give us your feedback about this session. You can complete the survey in the mobile app or request a paper survey.
Select the breakout
session you attended
Select the Survey
button and complete 1 2

© 2015 Experian Information Solutions, Inc. All rights reserved. Experian Public.