Embed Size (px)
Citation preview
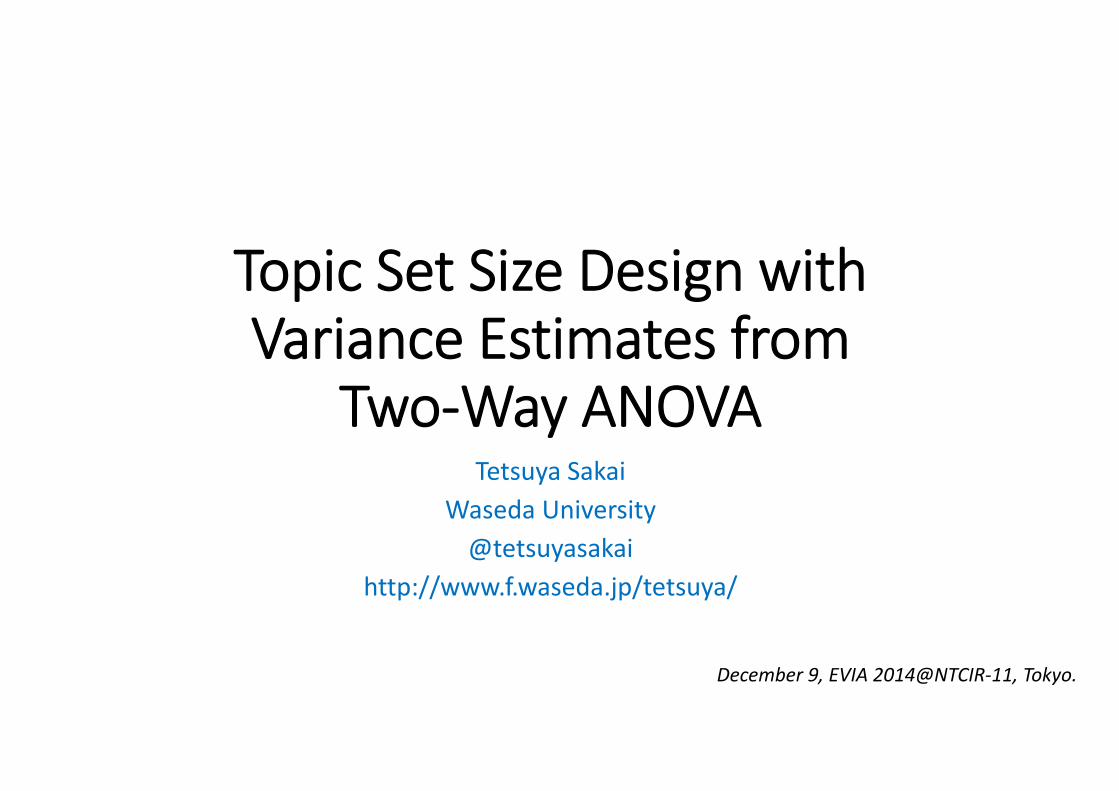
Topic Set Size Design with Variance Estimates from
Two‐Way ANOVATetsuya Sakai
Waseda University@tetsuyasakai
http://www.f.waseda.jp/tetsuya/
December 9, EVIA 2014@NTCIR‐11, Tokyo.
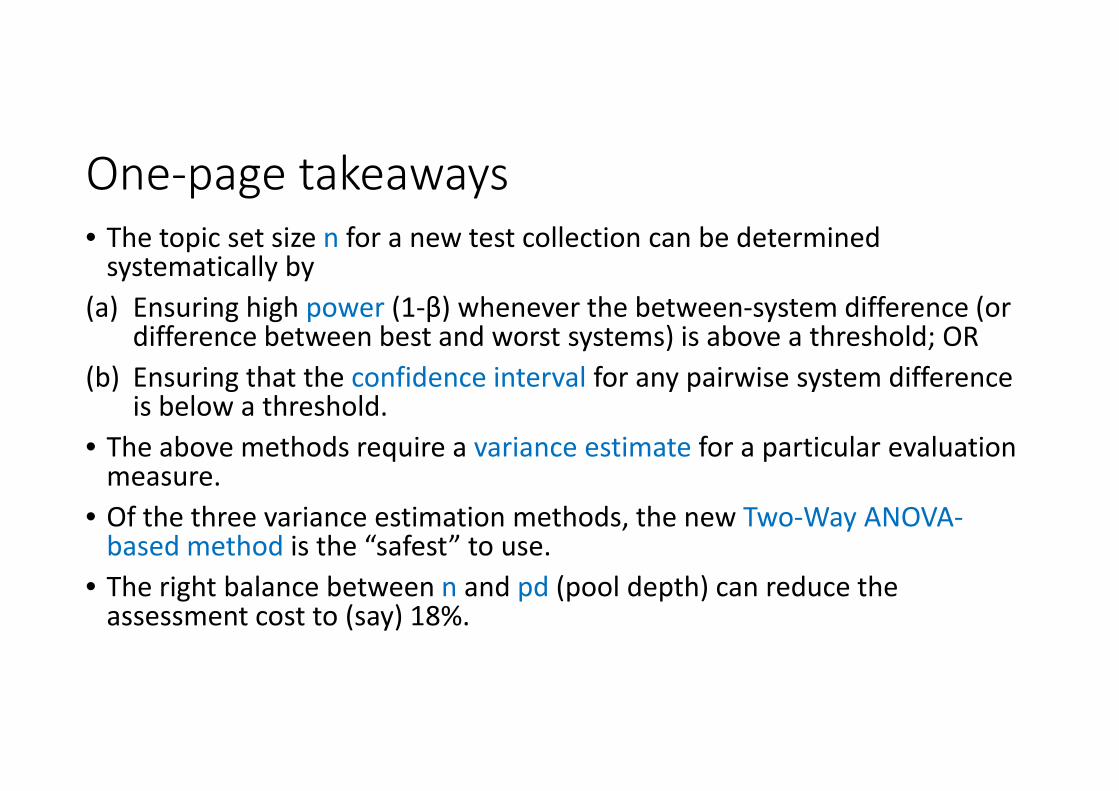
One‐page takeaways• The topic set size n for a new test collection can be determined systematically by
(a) Ensuring high power (1‐β) whenever the between‐system difference (or difference between best and worst systems) is above a threshold; OR
(b) Ensuring that the confidence interval for any pairwise system difference is below a threshold.
• The above methods require a variance estimate for a particular evaluation measure.
• Of the three variance estimation methods, the new Two‐Way ANOVA‐based method is the “safest” to use.
• The right balance between n and pd (pool depth) can reduce the assessment cost to (say) 18%.
TALK OUTLINE
1. How test collections have been constructed2. How test collections should be constructed3. Obtaining system variance estimates4. Topic set size design results5. Conclusions and future work
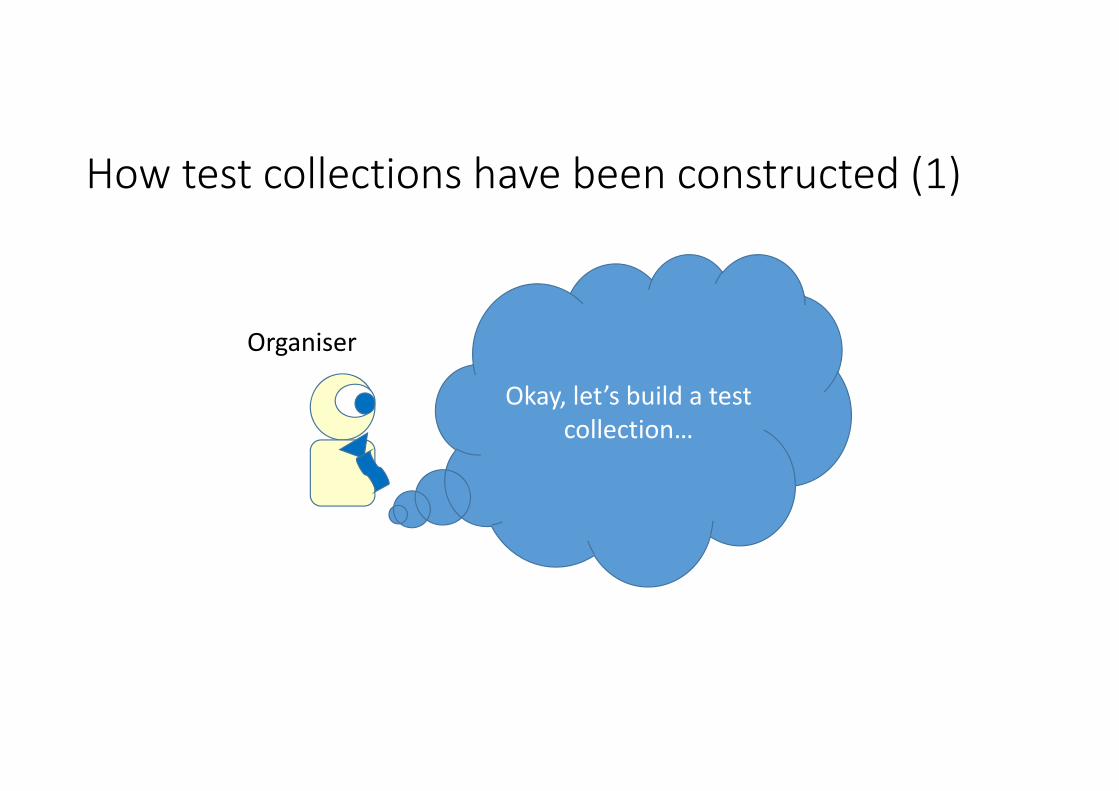
How test collections have been constructed (1)
Okay, let’s build a test collection…
Organiser
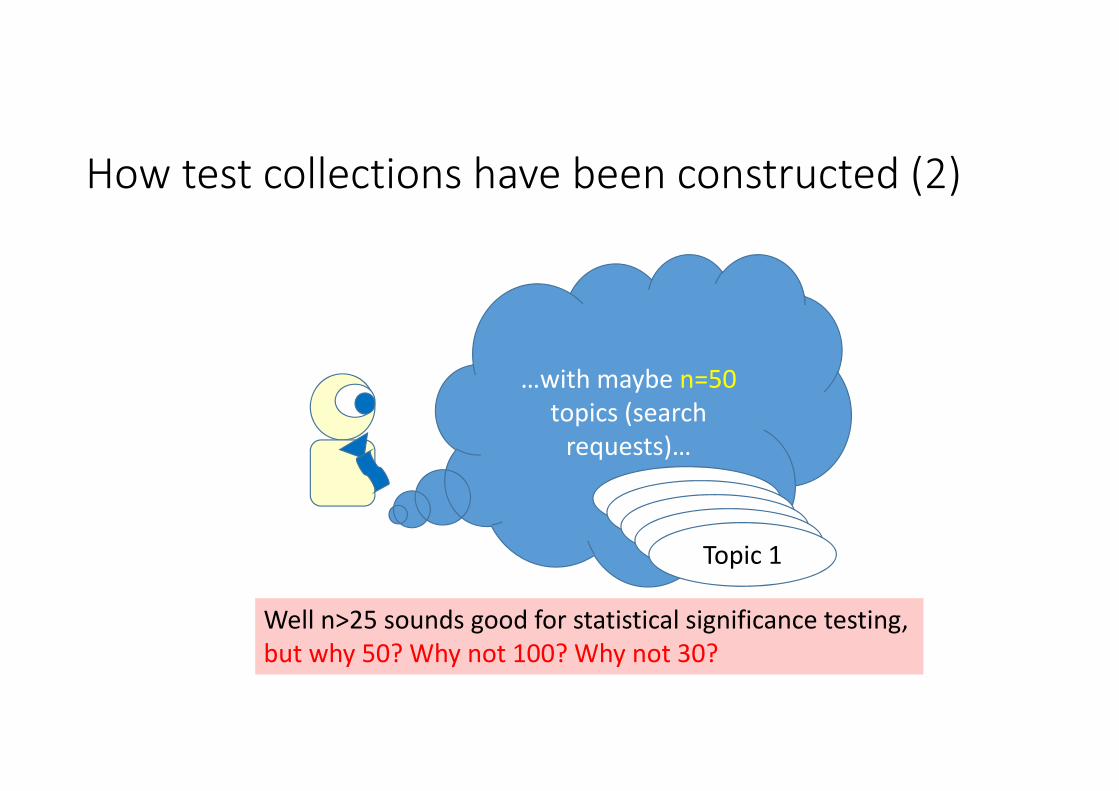
How test collections have been constructed (2)
…with maybe n=50topics (search requests)…
Well n>25 sounds good for statistical significance testing, but why 50? Why not 100? Why not 30?
TopicTopicTopicTopicTopic 1
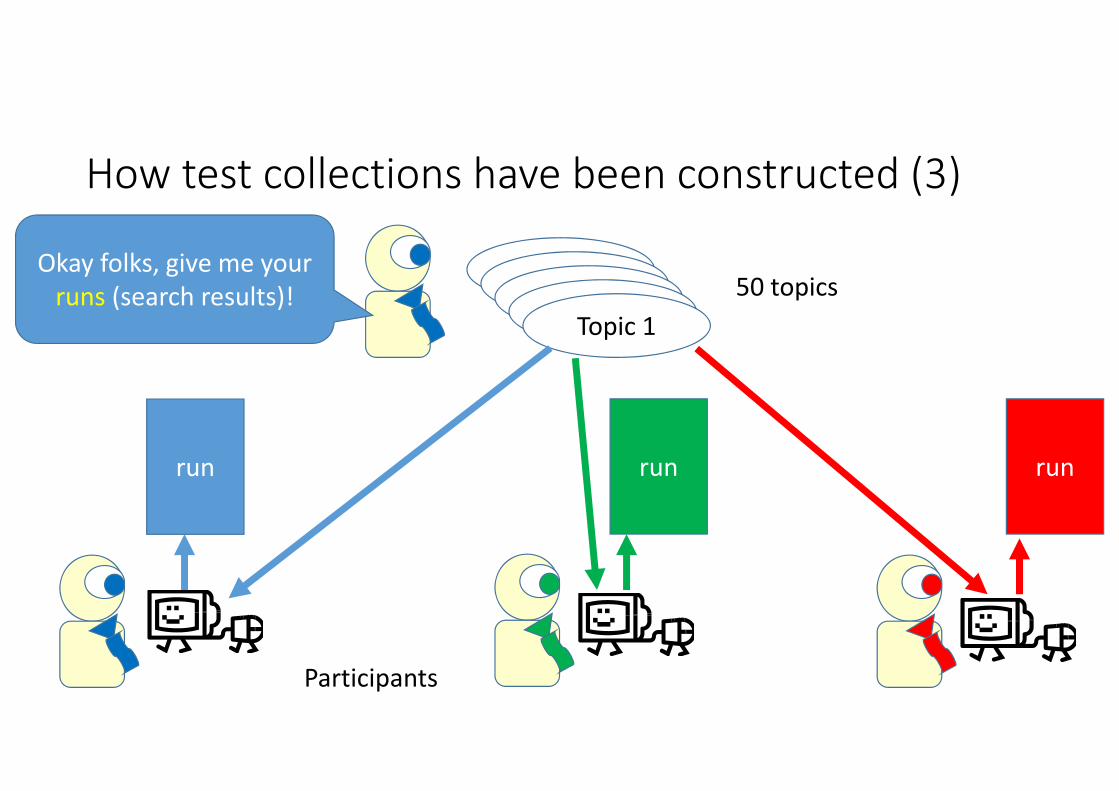
How test collections have been constructed (3)
TopicTopicTopicTopicTopic 1
50 topicsOkay folks, give me your runs (search results)!
run run run
Participants
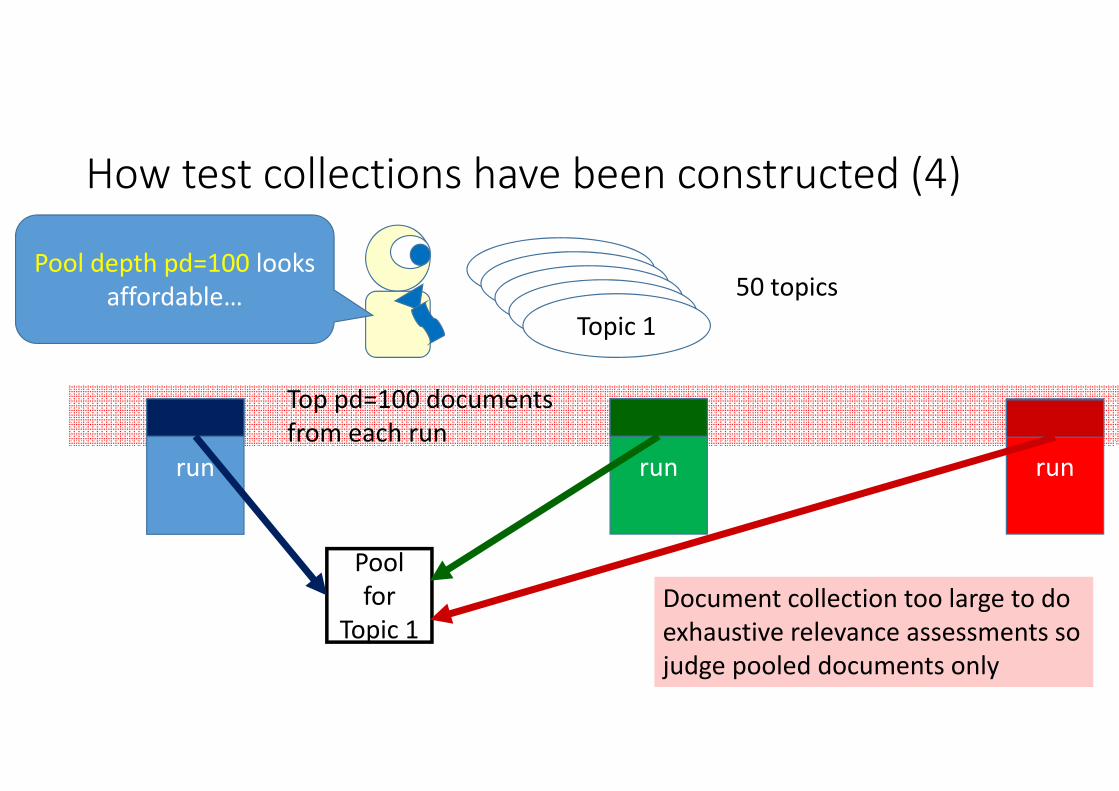
How test collections have been constructed (4)
TopicTopicTopicTopicTopic 1
50 topicsPool depth pd=100 looks
affordable…
run run run
Top pd=100 documentsfrom each run
Pool for
Topic 1Document collection too large to doexhaustive relevance assessments sojudge pooled documents only
How test collections have been constructed (5)
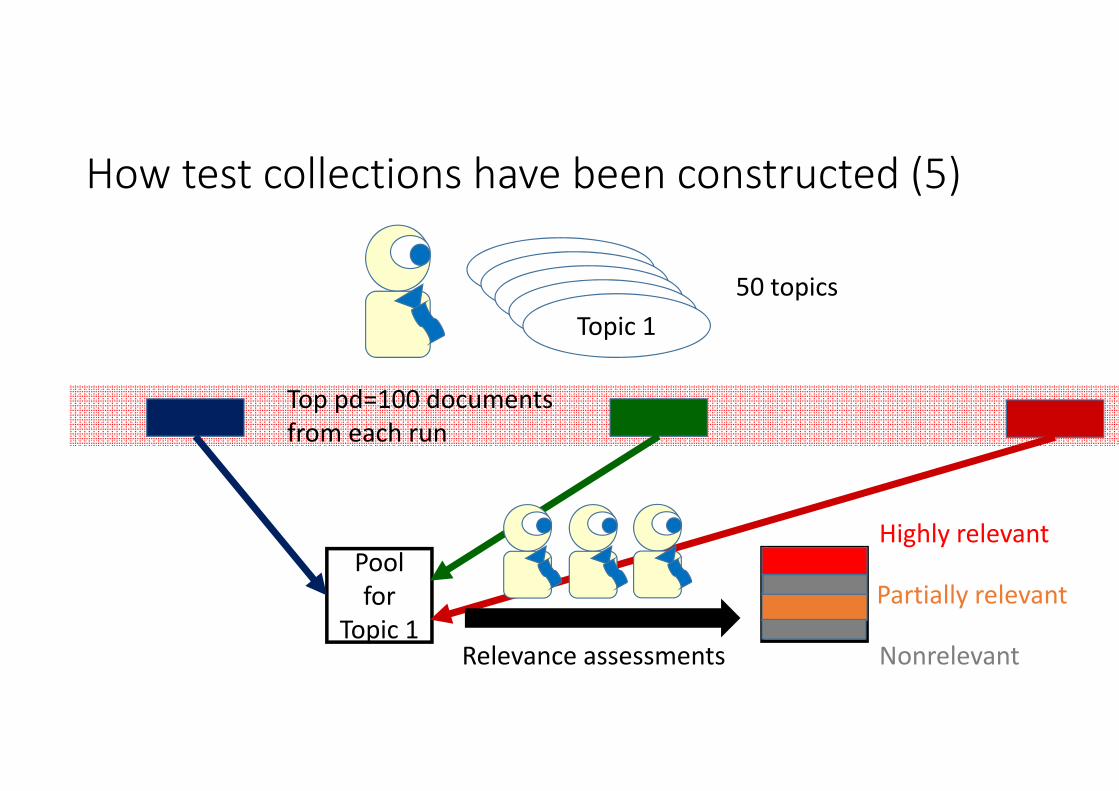
TopicTopicTopicTopicTopic 1
50 topics
Top pd=100 documentsfrom each run
Pool for
Topic 1Relevance assessments
Highly relevant
Partially relevant
Nonrelevant
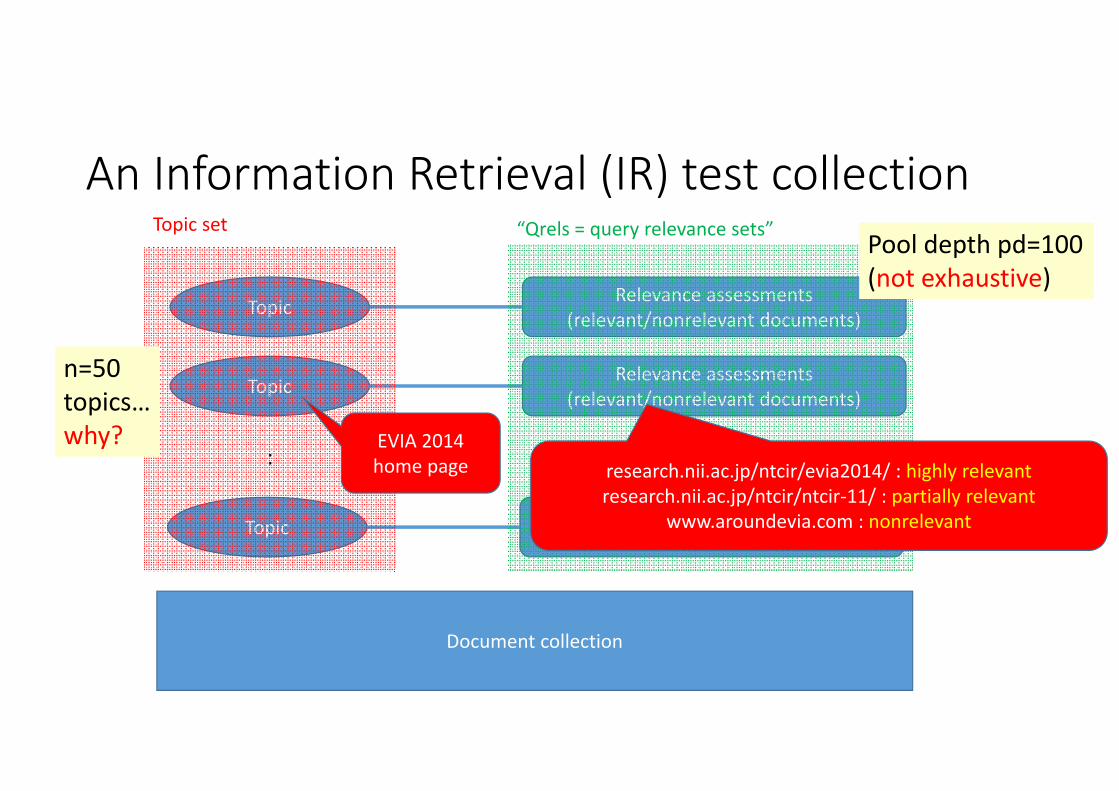
An Information Retrieval (IR) test collection
Topic Relevance assessments(relevant/nonrelevant documents)
Document collection
Topic Relevance assessments(relevant/nonrelevant documents)
Topic Relevance assessments(relevant/nonrelevant documents)
: :
Topic set “Qrels = query relevance sets”
EVIA 2014 home page research.nii.ac.jp/ntcir/evia2014/ : highly relevant
research.nii.ac.jp/ntcir/ntcir‐11/ : partially relevantwww.aroundevia.com : nonrelevant
n=50topics…why?
Pool depth pd=100(not exhaustive)
TALK OUTLINE
1. How test collections have been constructed2. How test collections should be constructed3. Obtaining system variance estimates4. Topic set size design results5. Conclusions and future work
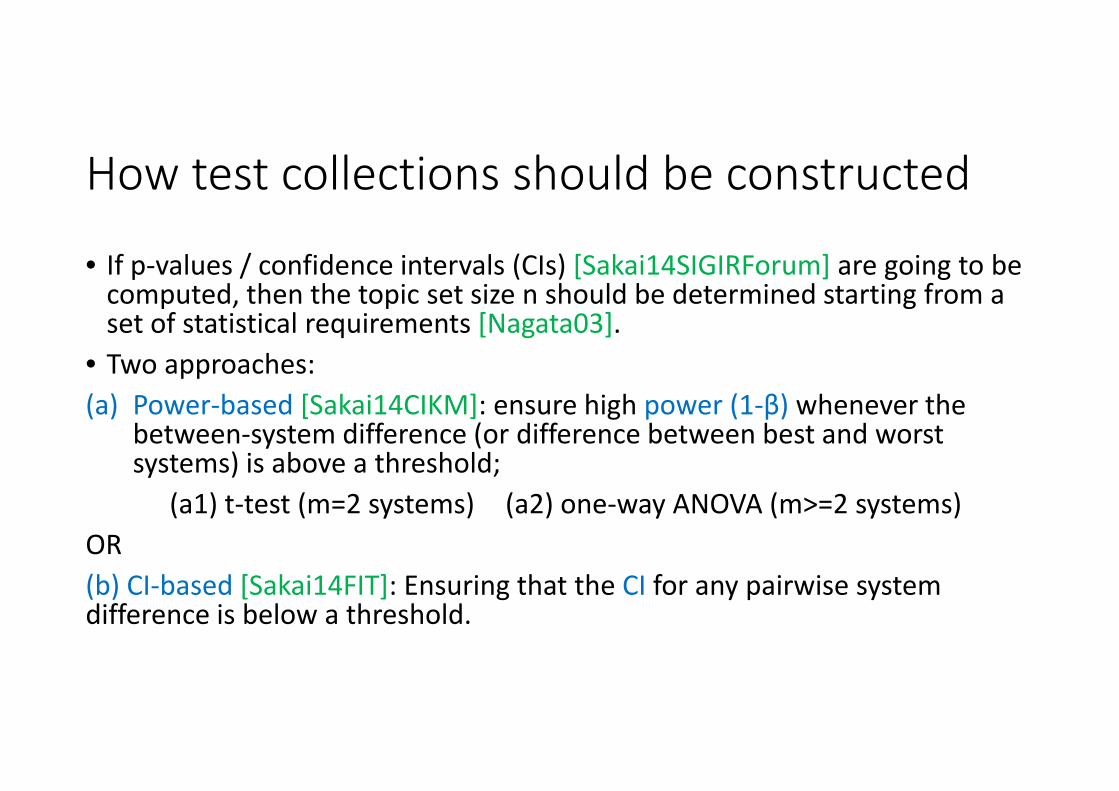
How test collections should be constructed
• If p‐values / confidence intervals (CIs) [Sakai14SIGIRForum] are going to be computed, then the topic set size n should be determined starting from a set of statistical requirements [Nagata03].
• Two approaches:(a) Power‐based [Sakai14CIKM]: ensure high power (1‐β) whenever the
between‐system difference (or difference between best and worst systems) is above a threshold;
(a1) t‐test (m=2 systems) (a2) one‐way ANOVA (m>=2 systems)OR(b) CI‐based [Sakai14FIT]: Ensuring that the CI for any pairwise system difference is below a threshold.
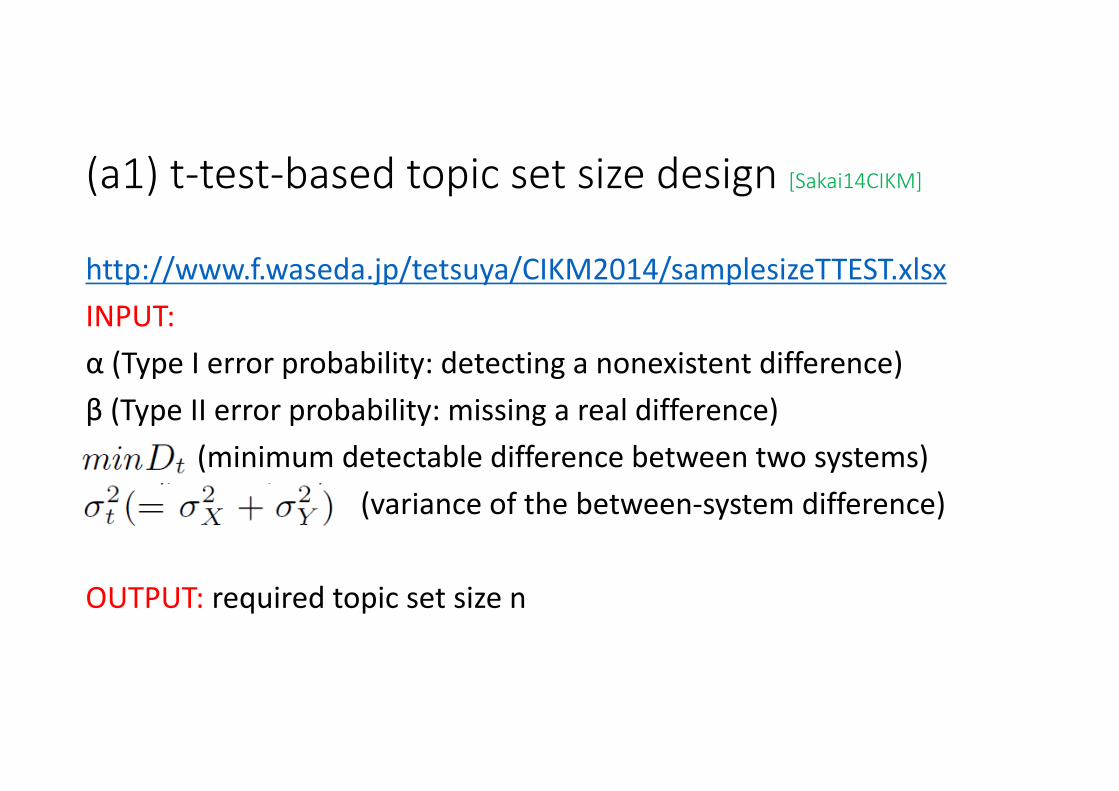
(a1) t‐test‐based topic set size design [Sakai14CIKM]
http://www.f.waseda.jp/tetsuya/CIKM2014/samplesizeTTEST.xlsxINPUT:α (Type I error probability: detecting a nonexistent difference)β (Type II error probability: missing a real difference)
(minimum detectable difference between two systems)(variance of the between‐system difference)
OUTPUT: required topic set size n
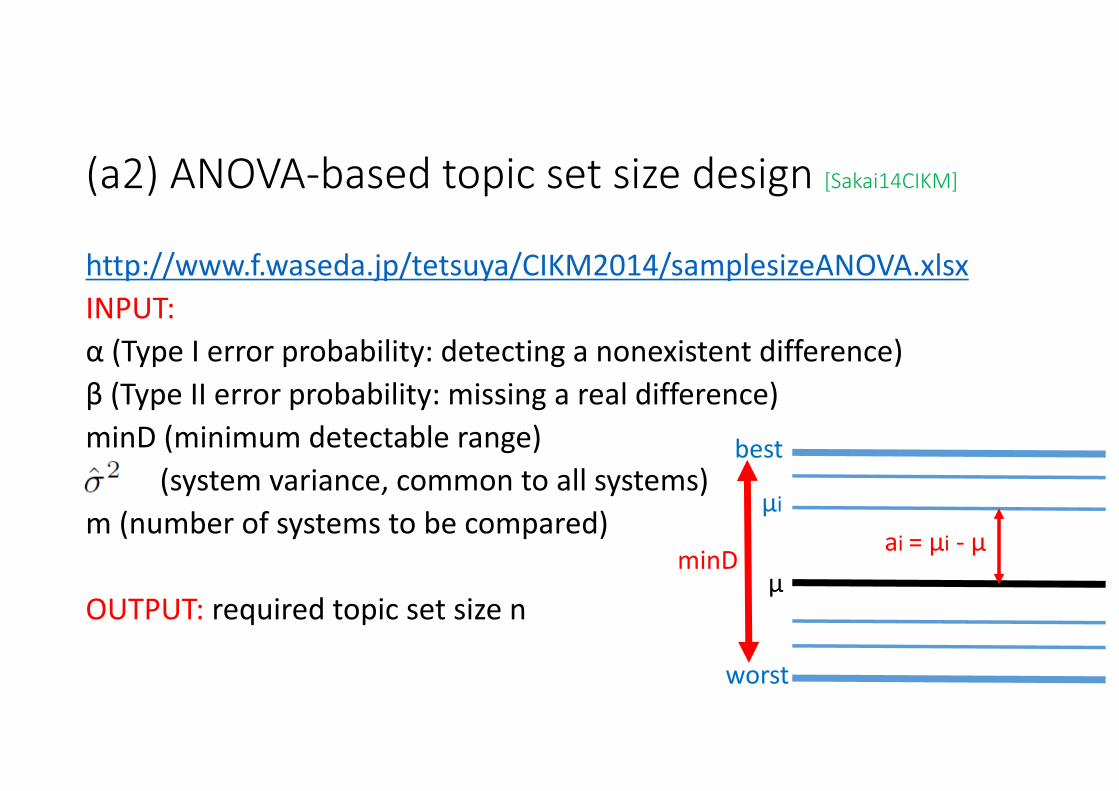
(a2) ANOVA‐based topic set size design [Sakai14CIKM]
http://www.f.waseda.jp/tetsuya/CIKM2014/samplesizeANOVA.xlsxINPUT:α (Type I error probability: detecting a nonexistent difference)β (Type II error probability: missing a real difference)minD (minimum detectable range)
(system variance, common to all systems)m (number of systems to be compared)
OUTPUT: required topic set size nμ
best
worst
μi
minDai = μi ‐ μ
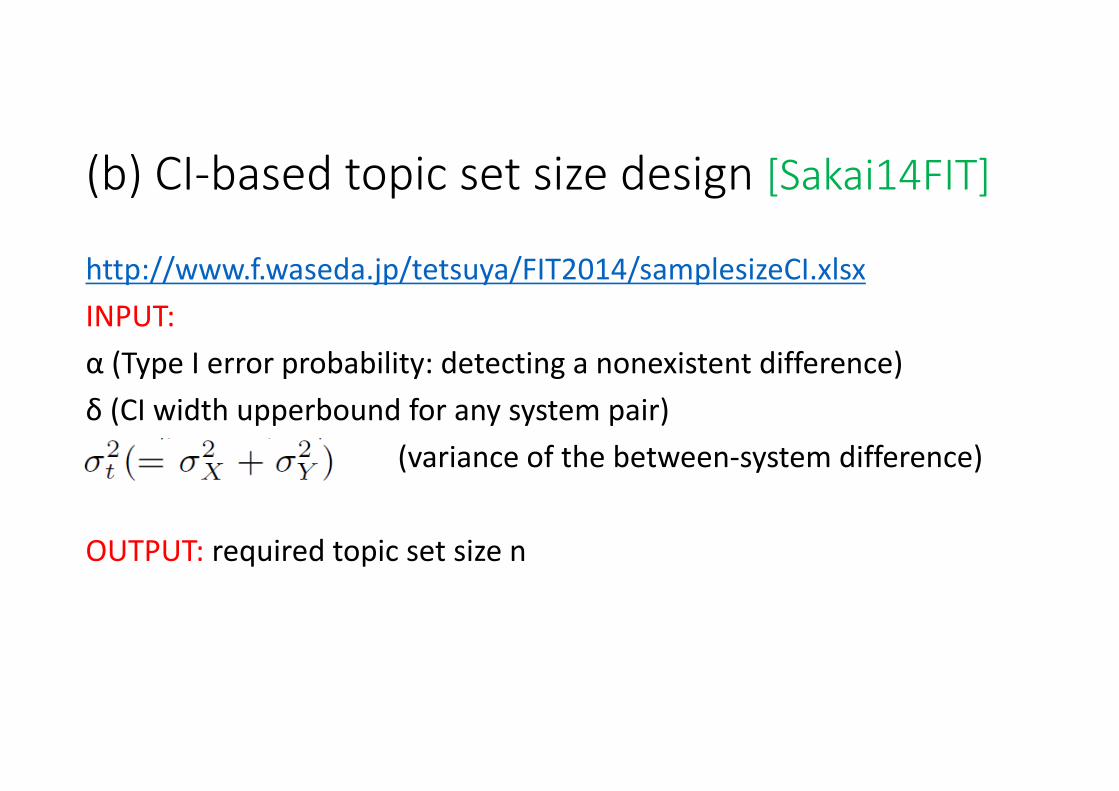
(b) CI‐based topic set size design [Sakai14FIT]
http://www.f.waseda.jp/tetsuya/FIT2014/samplesizeCI.xlsxINPUT:α (Type I error probability: detecting a nonexistent difference)δ (CI width upperbound for any system pair)
(variance of the between‐system difference)
OUTPUT: required topic set size n
TALK OUTLINE
1. How test collections have been constructed2. How test collections should be constructed3. Obtaining system variance estimates4. Topic set size design results5. Conclusions and future work
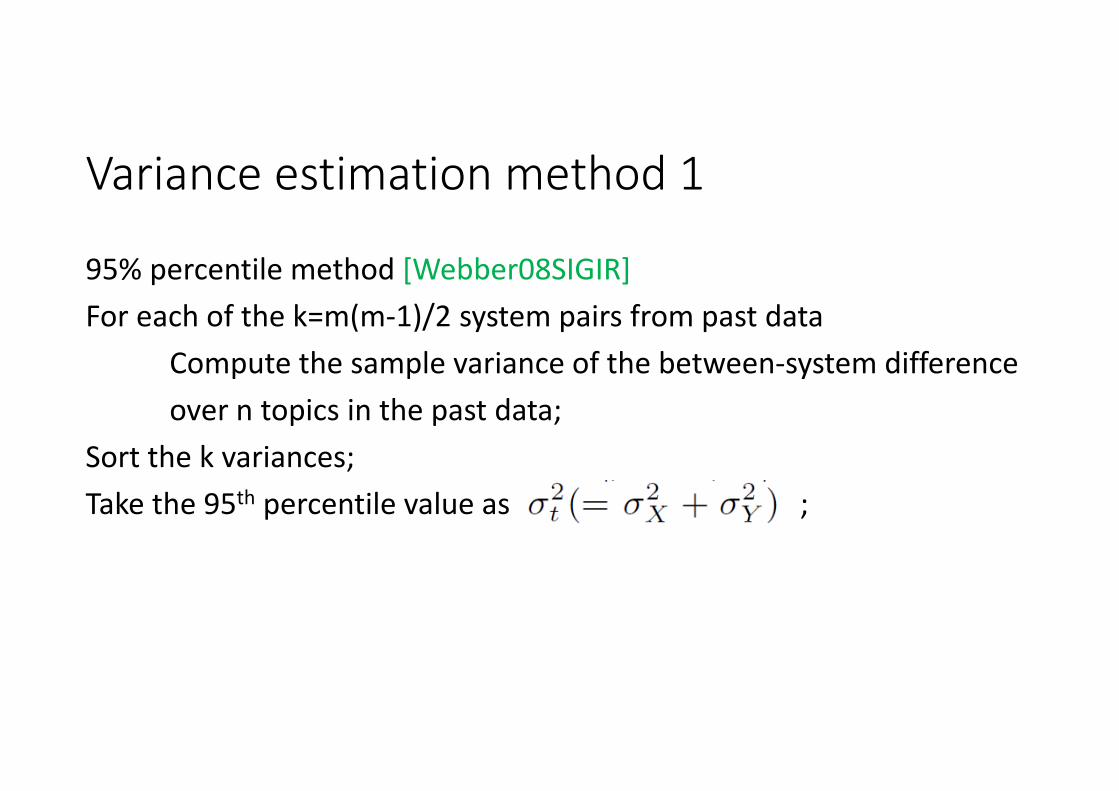
Variance estimation method 1
95% percentile method [Webber08SIGIR]For each of the k=m(m‐1)/2 system pairs from past data
Compute the sample variance of the between‐system differenceover n topics in the past data;
Sort the k variances;Take the 95th percentile value as ;
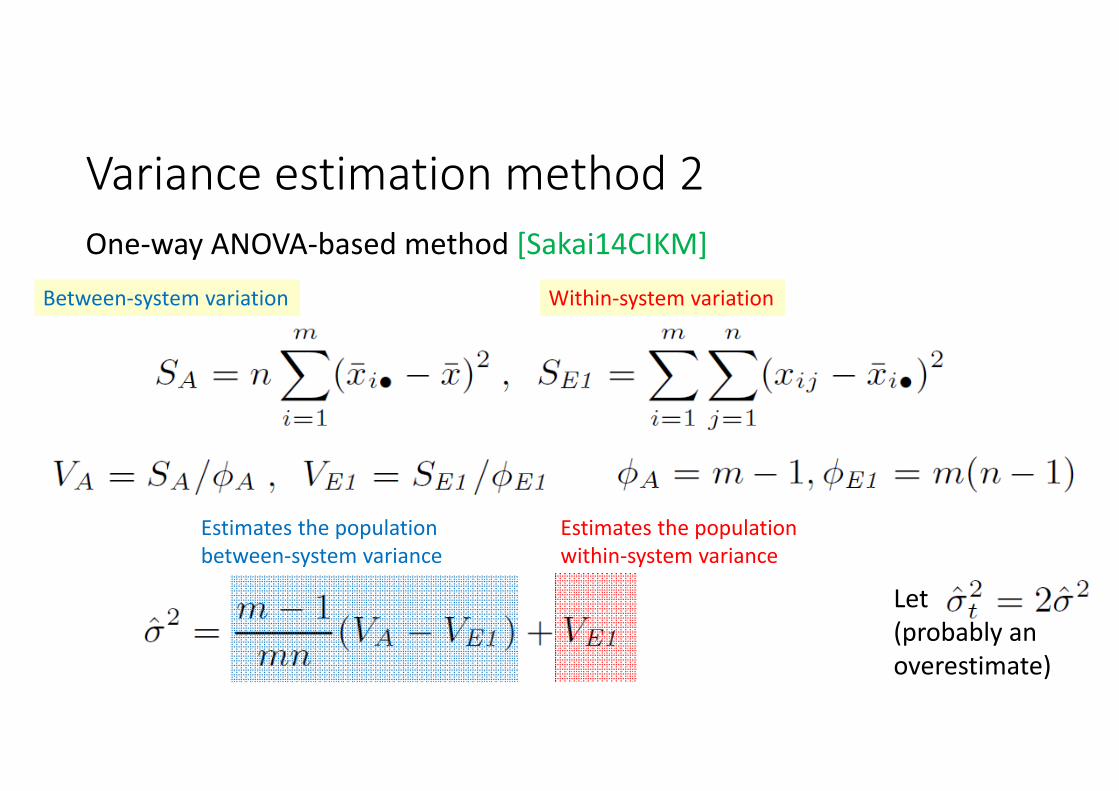
Variance estimation method 2One‐way ANOVA‐based method [Sakai14CIKM]
Between‐system variation Within‐system variation
Estimates the population between‐system variance
Estimates the population within‐system variance
Let(probably anoverestimate)
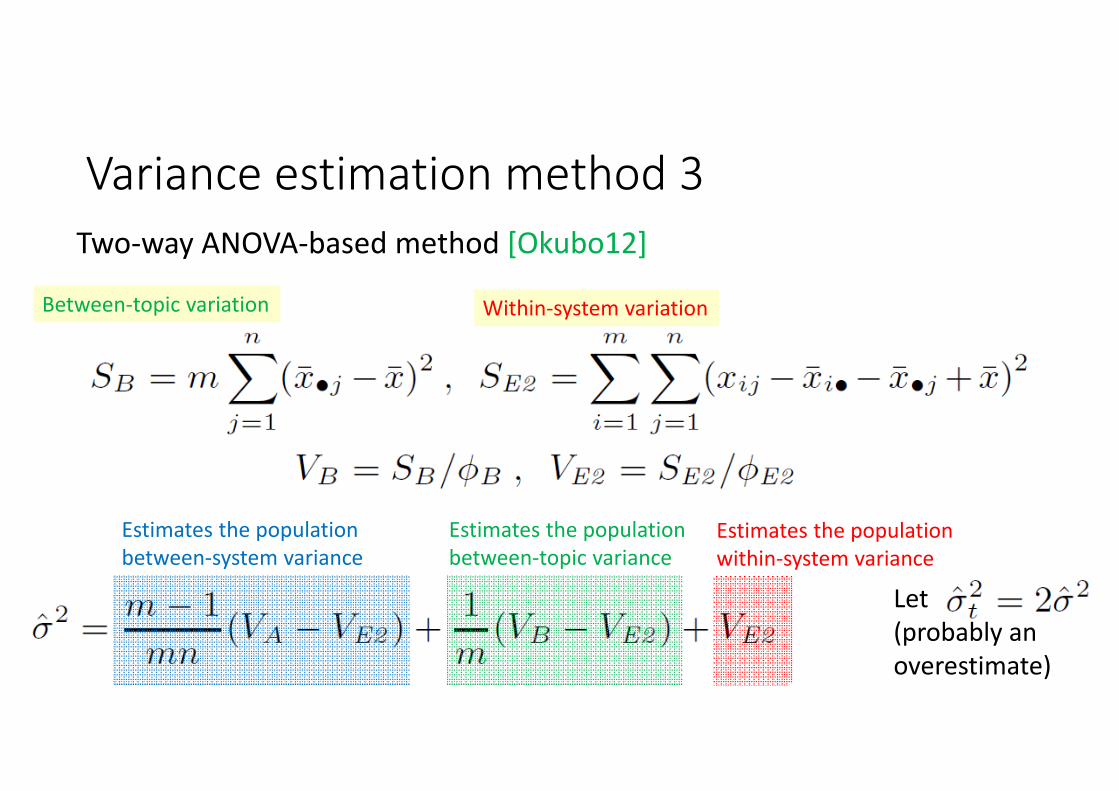
Variance estimation method 3Two‐way ANOVA‐based method [Okubo12]
Between‐topic variation Within‐system variation
Estimates the population between‐system variance
Estimates the population between‐topic variance
Estimates the population within‐system variance
Let(probably anoverestimate)
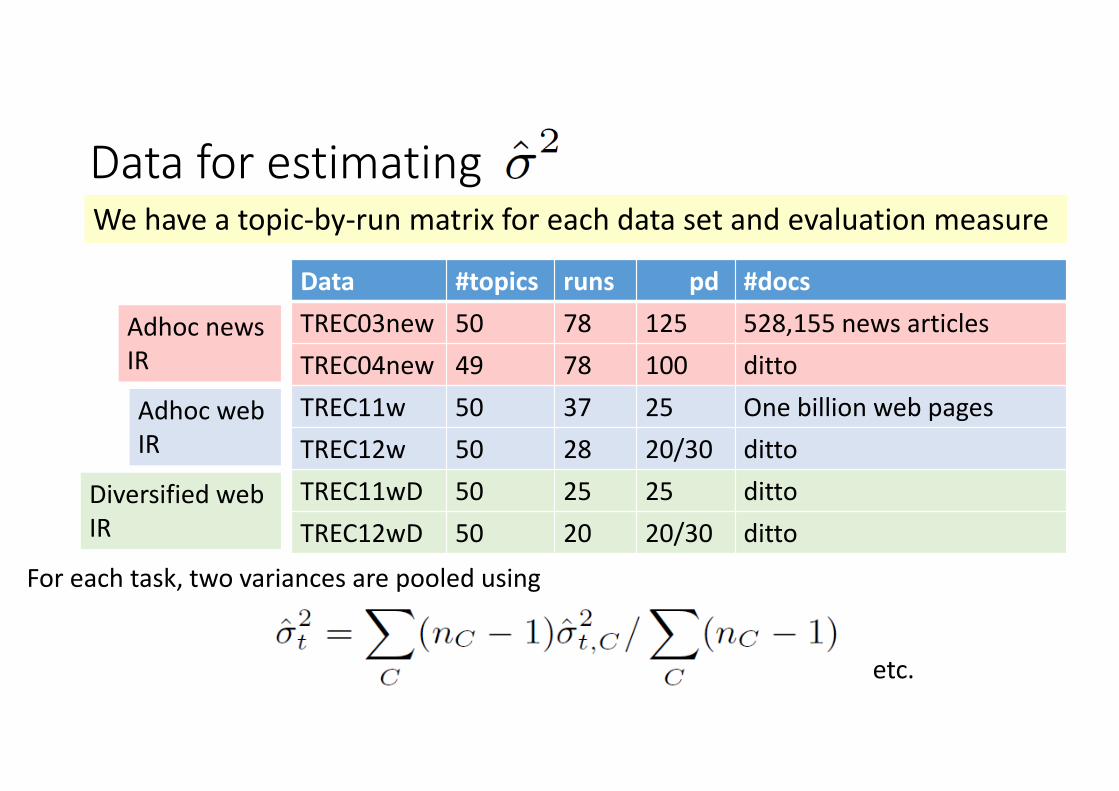
Data for estimating
Data #topics runs pd #docsTREC03new 50 78 125 528,155 news articlesTREC04new 49 78 100 dittoTREC11w 50 37 25 One billion web pagesTREC12w 50 28 20/30 dittoTREC11wD 50 25 25 dittoTREC12wD 50 20 20/30 ditto
Adhoc news IR
Adhoc web IR
Diversified web IR
We have a topic‐by‐run matrix for each data set and evaluation measure
For each task, two variances are pooled using
etc.
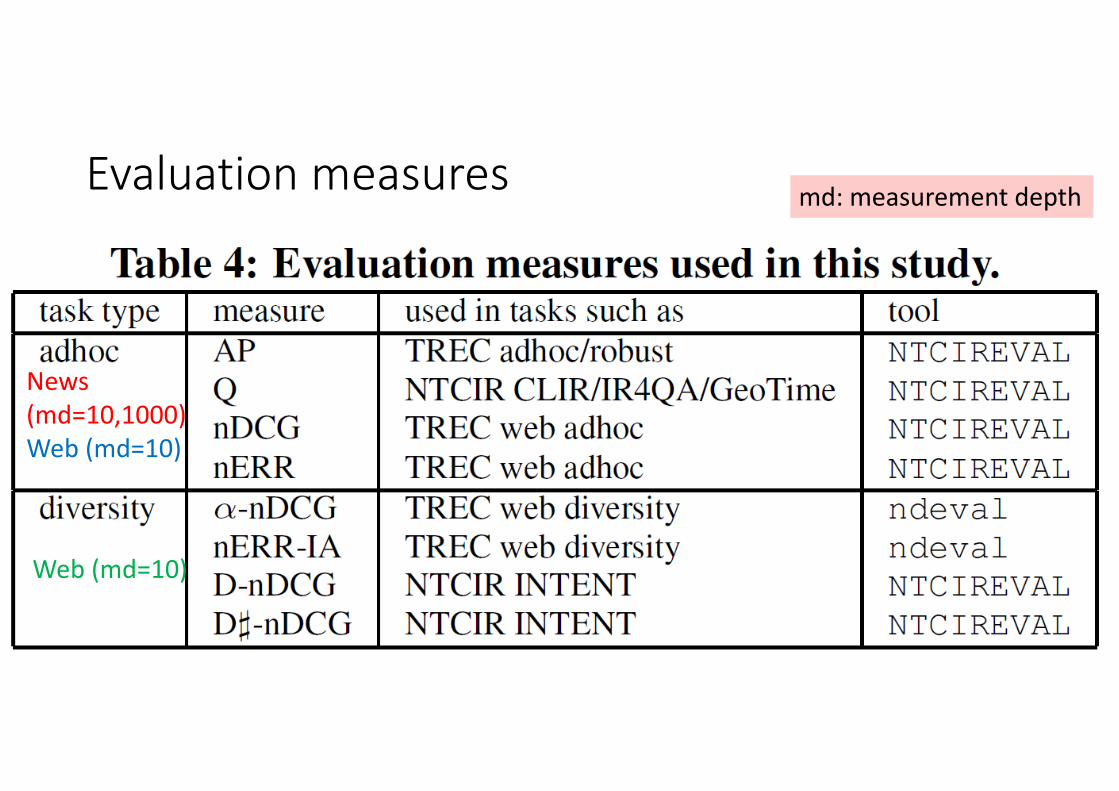
Evaluation measures
News(md=10,1000)Web (md=10)
Web (md=10)
md: measurement depth
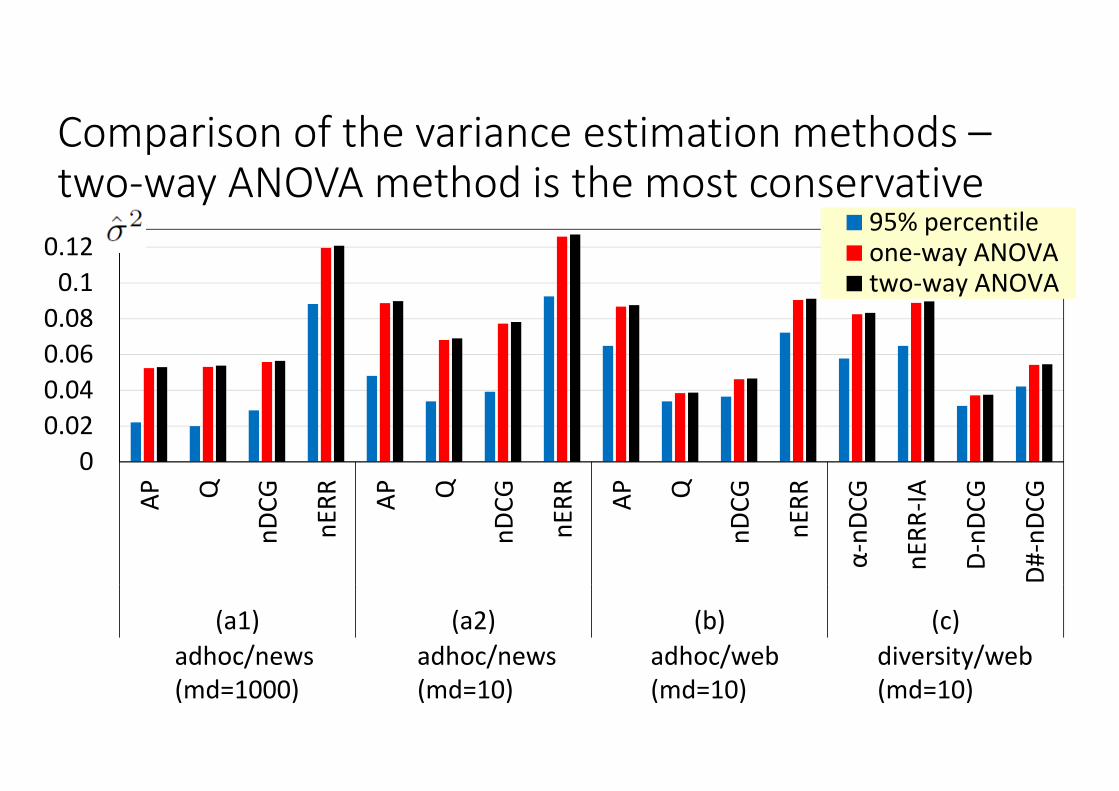
Comparison of the variance estimation methods –two‐way ANOVA method is the most conservative
00.020.040.060.080.10.12
AP Q
nDCG
nERR AP Q
nDCG
nERR AP Q
nDCG
nERR
α‐nD
CG
nERR
‐IA
D‐nD
CG
D#‐nDC
G
(a1) (a2) (b) (c)
95% percentileone‐way ANOVAtwo‐way ANOVA
adhoc/news(md=1000)
adhoc/news(md=10)
adhoc/web(md=10)
diversity/web(md=10)

Variances obtained with the two‐way ANOVA‐based method
nERR for adhocquite unstable
nERR‐IA and α‐nDCGfor diversity quite unstable
TALK OUTLINE
1. How test collections have been constructed2. How test collections should be constructed3. Obtaining system variance estimates4. Topic set size design results5. Conclusions and future work
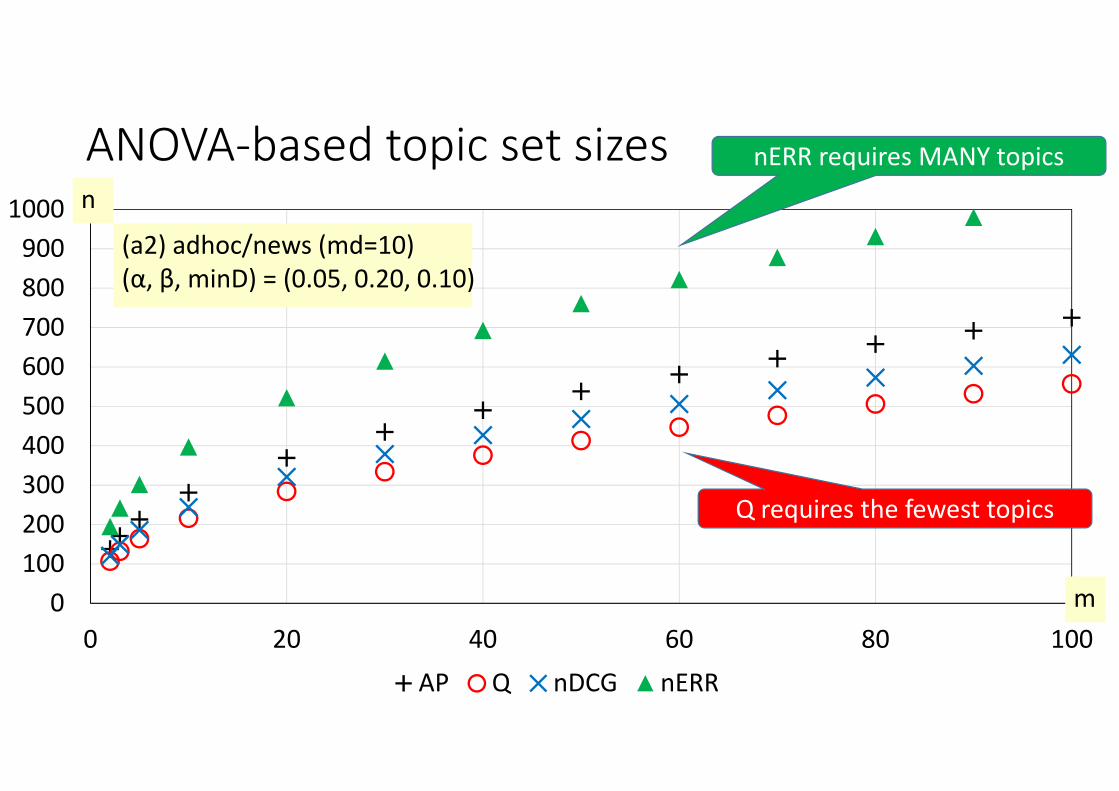
0100200300400500600700800900
1000
0 20 40 60 80 100AP Q nDCG nERR
(a2) adhoc/news (md=10)(α, β, minD) = (0.05, 0.20, 0.10)
n
m
ANOVA‐based topic set sizes nERR requires MANY topics
Q requires the fewest topics
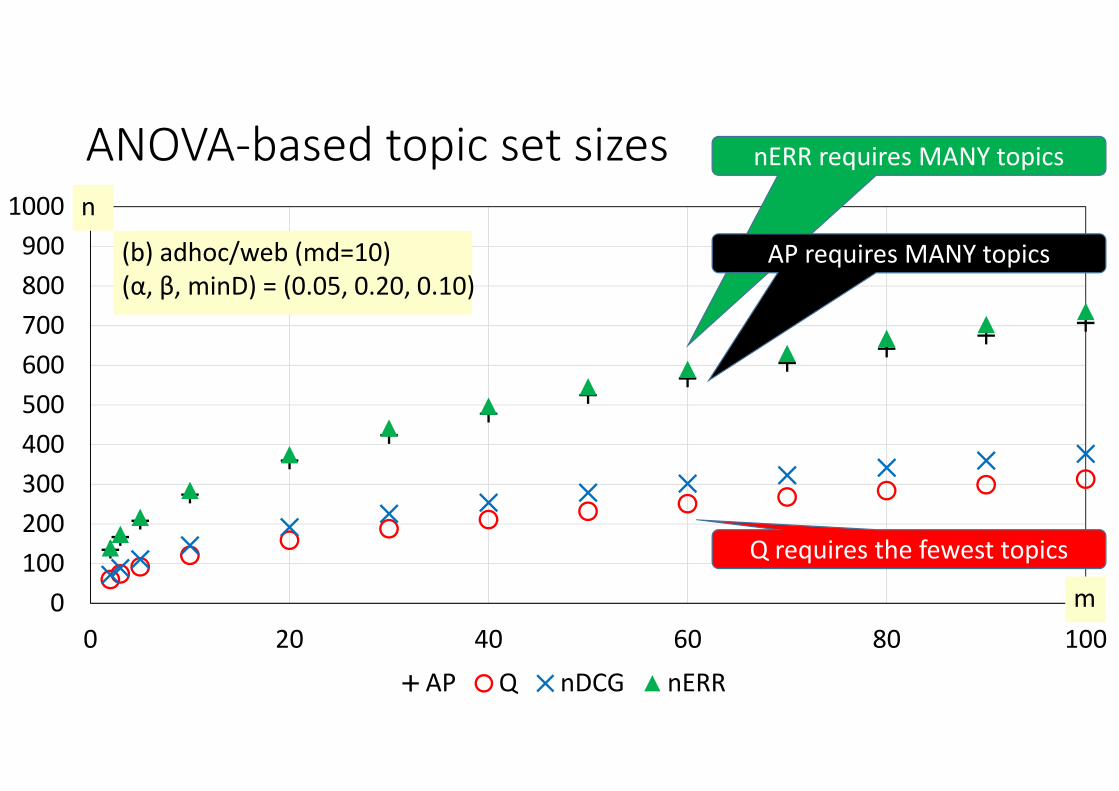
0100200300400500600700800900
1000
0 20 40 60 80 100AP Q nDCG nERR
n
m
(b) adhoc/web (md=10)(α, β, minD) = (0.05, 0.20, 0.10)
ANOVA‐based topic set sizes nERR requires MANY topics
Q requires the fewest topics
AP requires MANY topics
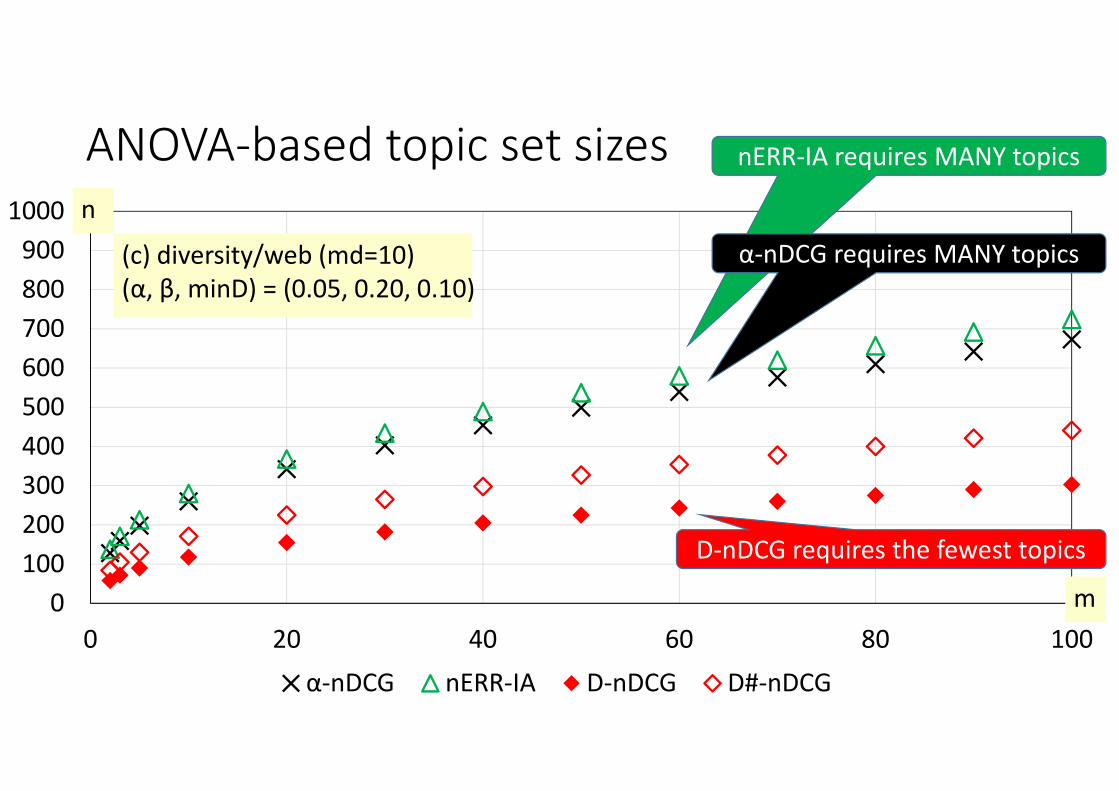
0100200300400500600700800900
1000
0 20 40 60 80 100α‐nDCG nERR‐IA D‐nDCG D#‐nDCG
n
m
(c) diversity/web (md=10)(α, β, minD) = (0.05, 0.20, 0.10)
ANOVA‐based topic set sizes nERR‐IA requires MANY topics
α‐nDCG requires MANY topics
D‐nDCG requires the fewest topics
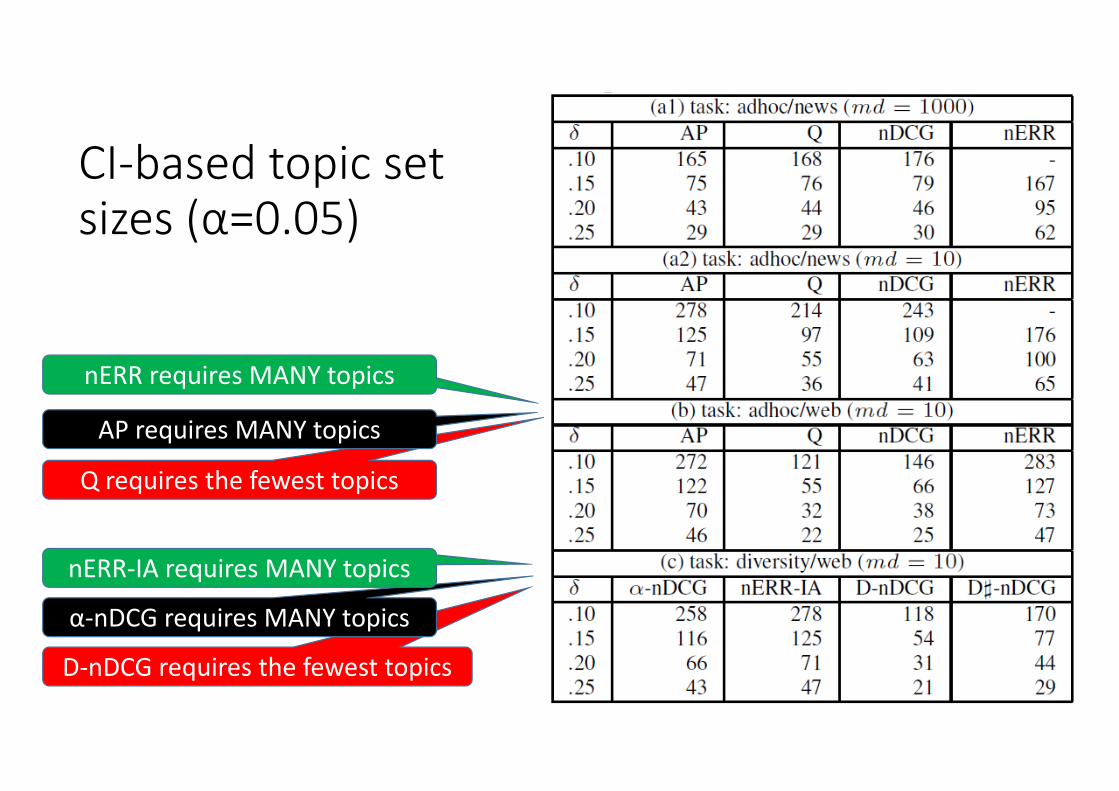
CI‐based topic set sizes (α=0.05)
D‐nDCG requires the fewest topics
α‐nDCG requires MANY topics
nERR‐IA requires MANY topics
Q requires the fewest topics
AP requires MANY topics
nERR requires MANY topics
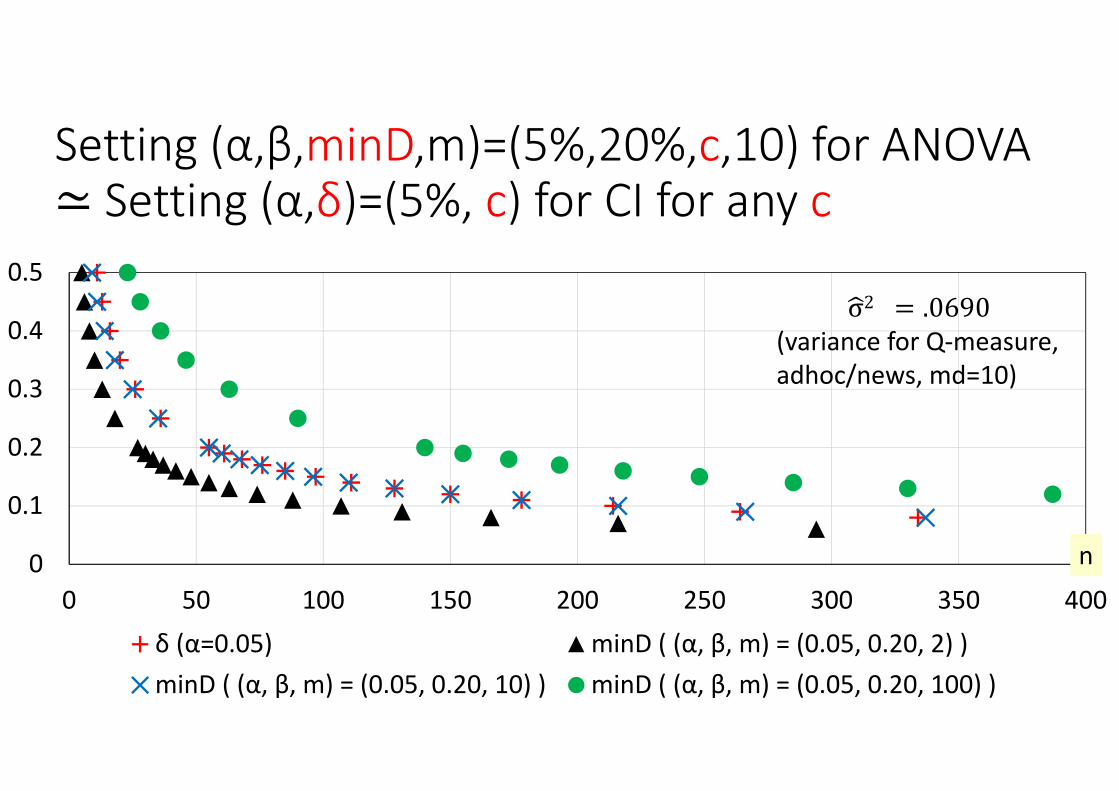
0
0.1
0.2
0.3
0.4
0.5
0 50 100 150 200 250 300 350 400δ (α=0.05) minD ( (α, β, m) = (0.05, 0.20, 2) )minD ( (α, β, m) = (0.05, 0.20, 10) ) minD ( (α, β, m) = (0.05, 0.20, 100) )
n
σ2 .0690(variance for Q‐measure,adhoc/news, md=10)
Setting (α,β,minD,m)=(5%,20%,c,10) for ANOVA Setting (α,δ)=(5%, c) for CI for any c
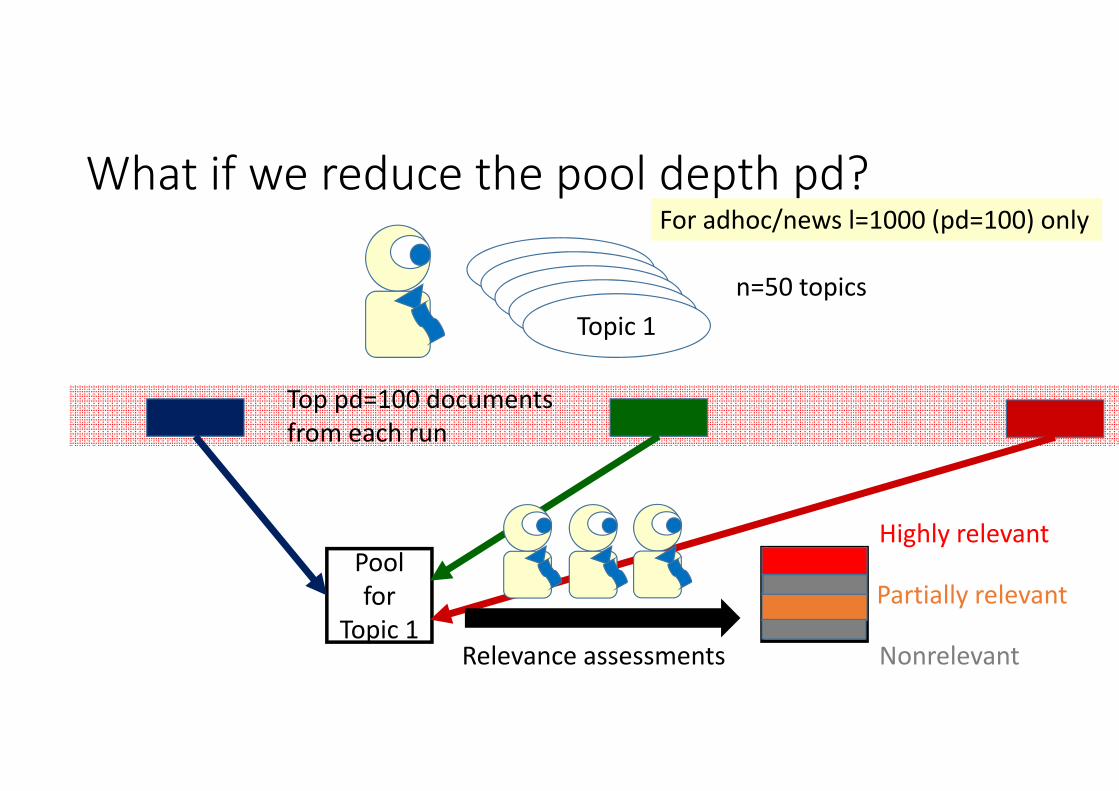
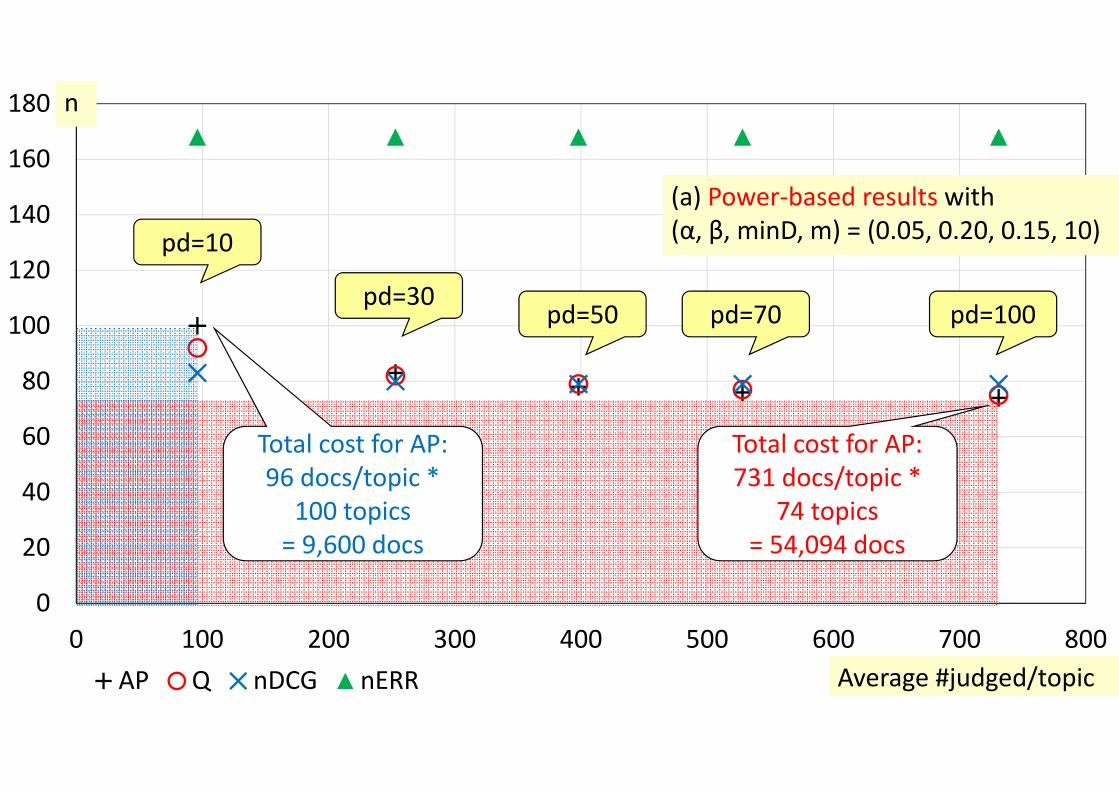
What if we reduce the pool depth pd?
TopicTopicTopicTopicTopic 1
n=50 topics
Top pd=100 documentsfrom each run
Pool for
Topic 1Relevance assessments
Highly relevant
Partially relevant
Nonrelevant
For adhoc/news l=1000 (pd=100) only
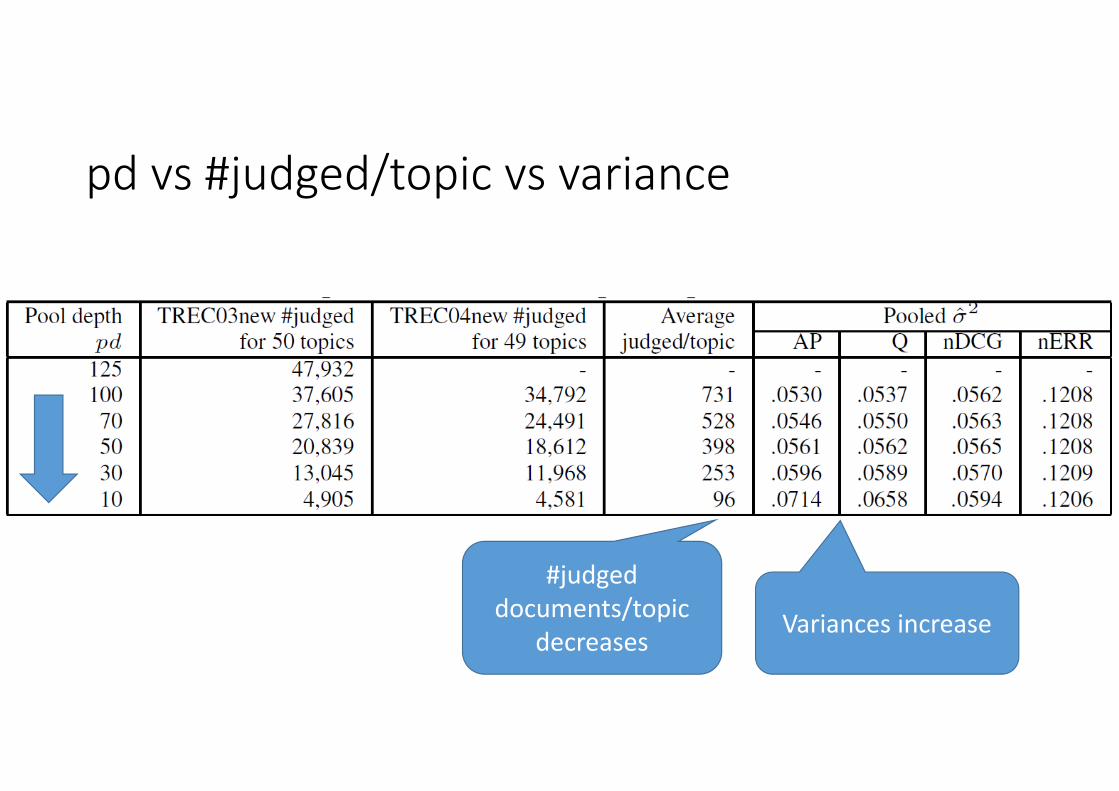
pd vs #judged/topic vs variance
#judged documents/topic
decreasesVariances increase
0
20
40
60
80
100
120
140
160
180
0 100 200 300 400 500 600 700 800AP Q nDCG nERR
(a) Power‐based results with(α, β, minD, m) = (0.05, 0.20, 0.15, 10)
pd=100pd=70pd=50pd=30
pd=10
n
Average #judged/topic
Total cost for AP:96 docs/topic *
100 topics = 9,600 docs
Total cost for AP:731 docs/topic *
74 topics = 54,094 docs
0
20
40
60
80
100
120
140
160
180
0 100 200 300 400 500 600 700 800AP Q nDCG nERR
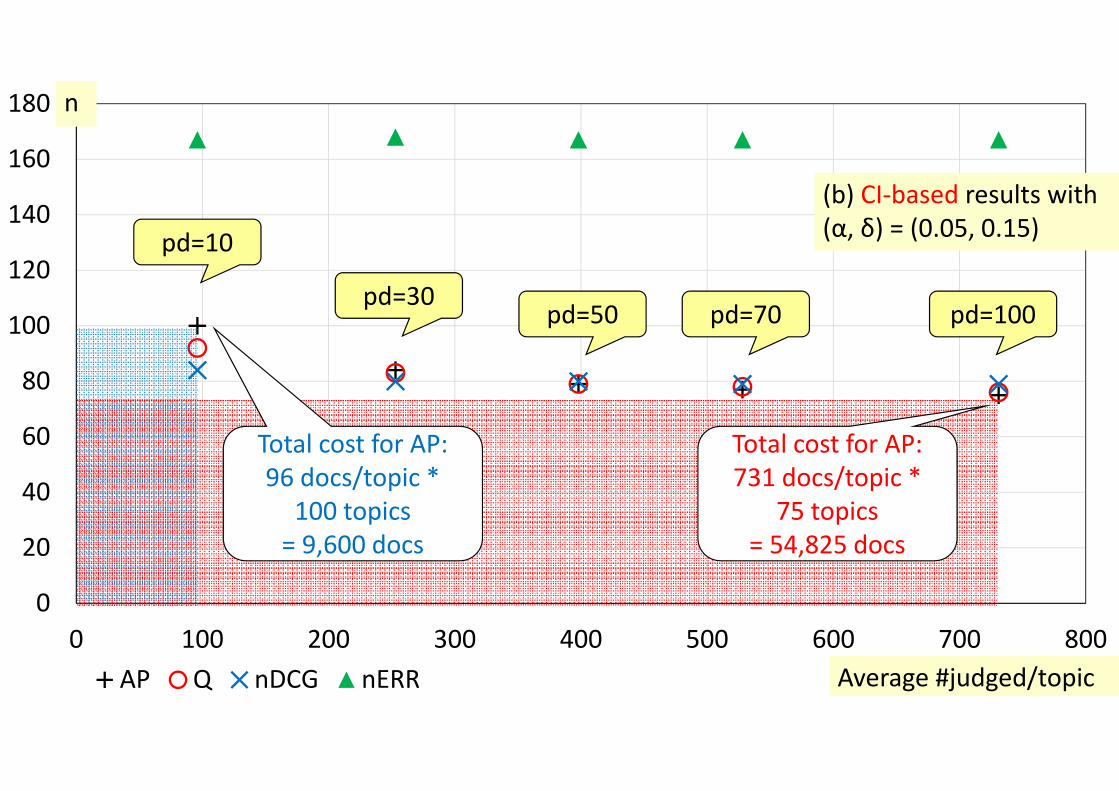
Total cost for AP:96 docs/topic *
100 topics = 9,600 docs
Total cost for AP:731 docs/topic *
75 topics = 54,825 docs
(b) CI‐based results with (α, δ) = (0.05, 0.15)
n
Average #judged/topic
pd=100pd=70pd=50pd=30
pd=10
TALK OUTLINE
1. How test collections have been constructed2. How test collections should be constructed3. Obtaining system variance estimates4. Topic set size design results5. Conclusions and future work

One‐page takeaways• The topic set size n for a new test collection can be determined systematically by
(a) Ensuring high power (1‐β) whenever the between‐system difference (or difference between best and worst systems) is above a threshold; OR
(b) Ensuring that the confidence interval for any pairwise system difference is below a threshold.
• The above methods require a variance estimate for a particular evaluation measure.
• Of the three variance estimation methods, the new Two‐Way ANOVA‐based method is the “safest” to use.
• The right balance between n and pd (pool depth) can reduce the assessment cost to (say) 18%.
Future work
• Apply score standardization [Webber08SIGIR] to the topic‐by‐run matrices first
• Investigate the effect of run spread in past data on estimating • Collect topic‐by‐run matrices from NTCIR task organisers to recommend the right number of topics n for their new test collection (or force them to use my topic set size design tools!)
• Investigate the relationship between topic set size design with reusability. From a set of statistically equivalent designs, choose the least costly one with “tolerable” reusability.
REFERENCES[Nagata03] Nagata, Y.: How to Design the Sample Size (in Japanese). Asakura Shoten, 2003.[Okubo12] Okubo, M. and Okada, K. Psychological Statistics to Tell Your Story: Effect Size, CondenceInterval (in Japanese). Keiso Shobo, 2012.[Sakai14SIGIRForum] Statistical Reform in Information Retrieval?, Sakai, T., SIGIR Forum, 48(1), pp.3‐12, 2014.http://sigir.org/files/forum/2014J/2014J_sigirforum_Article_TetsuyaSakai.pdf[Sakai14FIT] Designing Test Collections That Provide Tight Confidence Intervals, Sakai, T., Forum on Information Technology 2014, RD‐003, 2014. http://www.slideshare.net/TetsuyaSakai/fit2014[Sakai14CIKM] Designing Test Collections for Comparing Many Systems, Sakai, T., Proceedings of ACM CIKM 2014, 2014. http://www.f.waseda.jp/tetsuya/CIKM2014/ir0030‐sakai.pdf
[Webber08SIGIR] Webber, W., Moffat, A. and Zobel, J.: Score Standardization for Inter‐Collection Comparison of Retrieval Systems, ACM SIGIR 2008, pp.51‐58, 2008.[Webber08CIKM] Webber, W., Moffat, A. and Zobel, J.: Statistical power in Retrieval Experimentation. ACM CIKM 2008, pp.571–580, 2008.