Embed Size (px)
Citation preview

ERCC Transcripts Provide Confidence to the
Performance of Agilent One-Color and Two-Color
Microarray Experiments
Anne Bergstrom Lucas
Senior Research Scientist
July 10th 2014

Overview
- Quick review of ERCC Phases
- Agilent microarray probe generation and assay overview
- Questions regarding the dilution of the ERCC transcript pools
- Probe/ERCC performance in Phase III (latin-square proof-of-concept)
- Probe/ERCC performance in Phase IV (functional testing)
- Probe/ERCC performance in Phase V (external validation)
- Conclusions
7/10/2014
ERCC 2.0 Workshop
2

Number of ERCC clones
177 144
106 97 96
The Five Phases of ERCC Control Testing
BMC Genomics 2005, 6:150
7/10/2014
ERCC 2.0 Workshop
3

ERCC Control Transcripts Test Entire Assay
Spike-in controls for Validation
External, Exogenous
Sequences that do not
naturally appear in sample
Synthetic
Known [RNA]
traceable to SI
Known Sequence
traceable to reference
library RM
Track “whole-system” technical
performance
RNA
Isolation
Target
Preparation
optional mRNA
Amplification
Hybridization
Array
Content
Hybridized
Target
Detection
Expression
Measures
Biostatistical
Analysis
Spike-ins
to track
whole-
process
7/10/2014
ERCC 2.0 Workshop
4

ERCC transcripts were uploaded into the Agilent eArray program:
• Ran probe selection program using two different modes:
- “Best Probe”
- “Best Distribution”
Combined the lists from each mode to give ten probes that span each control sequence up to >1000 bases from the 3’ end
- Two copies of each of the ten probes were ported into the 8x15K microarray format
- The rest of the space was filled with human biological genes from the catalog array
Used eArray Program for ERCC Microarray Probe Design
AAAAAAAA
7/10/2014
ERCC 2.0 Workshop
5

Amp and Labeling Experimental Setup
Used Agilent’s Low Input Linear RNA Amplification Kit (LILAK) for Phases II
and III and the Agilent Low Input QuickAmp Kit for Phase IV
Background RNA was Ambion Human Liver Reference and the LIQA reactions
had an input of 10 ng total RNA per reaction for Phase IV
All labeling reactions were performed in triplicate and hybridized as
amp/labeling technical replicates
The Cy3 amp and labeling reactions are doing double duty as One-Color
targets and Two-Color targets
7/10/2014
ERCC 2.0 Workshop
6
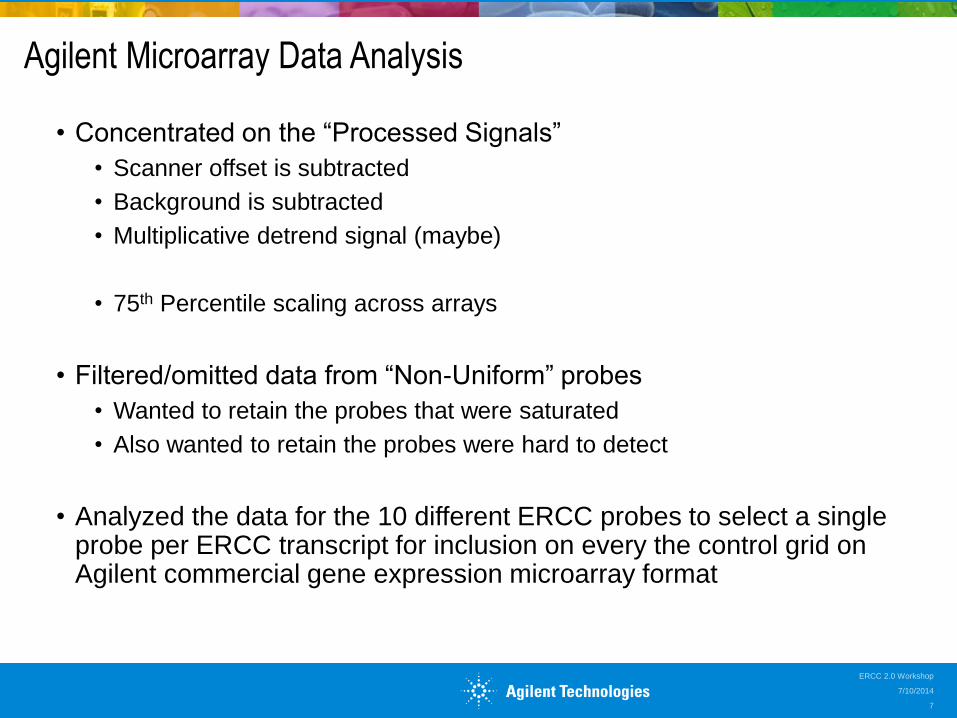
Agilent Microarray Data Analysis
• Concentrated on the “Processed Signals”
• Scanner offset is subtracted
• Background is subtracted
• Multiplicative detrend signal (maybe)
• 75th Percentile scaling across arrays
• Filtered/omitted data from “Non-Uniform” probes
• Wanted to retain the probes that were saturated
• Also wanted to retain the probes were hard to detect
• Analyzed the data for the 10 different ERCC probes to select a single probe per ERCC transcript for inclusion on every the control grid on Agilent commercial gene expression microarray format
7/10/2014
ERCC 2.0 Workshop
7

ERCC Performance in Phase III
7/10/2014
ERCC 2.0 Workshop
8

Suggested Concentrations of Pools for Modified Latin Square Experiments (Dilution 1) in ERCC Phase III
Note that concentrations are based on ratios of
the mass of the spike-in RNA transcript to the
mass of background total RNA (based on the
assumptions of an average transcript length of
1000 bases, etc.)
7/10/2014
ERCC 2.0 Workshop
9

Further Suggested Dilutions for Expanded Range Experiments for Modified Latin Square Experiments (Dilution 1) in ERCC Phase III
Suggested
Dilution 2 is 1:2
Suggested
Dilution 3 is 1:4
Suggested
Dilution 4 is 1:40
7/10/2014
ERCC 2.0 Workshop
10
We wanted (and needed) higher dilutions for the Agilent microarray platform!

Comparing Phase III ERCC Spike-In Dilutions to the Agilent Spike-In Control Dilutions (mass of ERC per mass of total RNA)
1:12,500
1:37,500
1:125,000
1:375,000
1:1,250,000
1:3,750,000
1:12,500,000
1:125,000,000
1:1,250,000,000
1:12,500,000,000
1:1,000
1:5,000
1:25,000
1:125,000
1:10,000,000
1:50,000,000
1:250,000,000
1:1,250,000,000
1:100,000
1:500,000
1:2,500,000
1:12,500,000
Suggested
Dilutions
100-Fold
Dilutions that
hit Agilent’s
“Sweet Spot”
10,000-Fold
Dilutions that
test the limits of
diluting the
ERCC Spike-Ins
7/10/2014
ERCC 2.0 Workshop
11
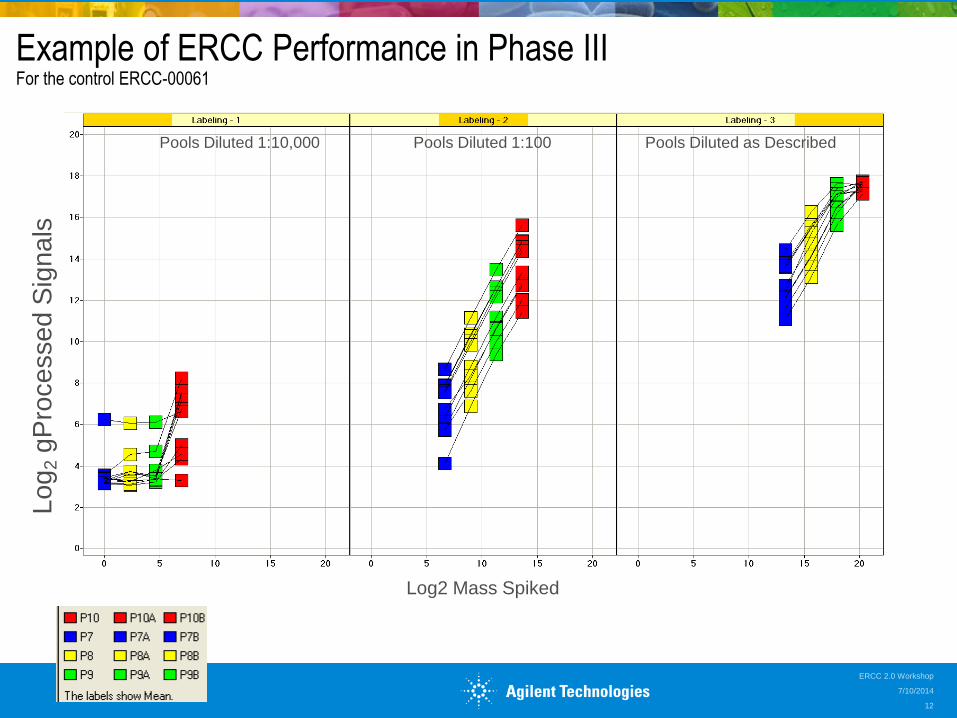
Example of ERCC Performance in Phase III For the control ERCC-00061
Lo
g2 g
Pro
ce
sse
d S
ign
als
Log2 Mass Spiked
Pools Diluted 1:10,000 Pools Diluted 1:100 Pools Diluted as Described
7/10/2014
ERCC 2.0 Workshop
12

Can Combine 1-C Data to Test Full Dynamic Range For the control ERCC-00061
Log2 Mass Spiked
Log
2 g
Pro
cessed S
ignals
7/10/2014
ERCC 2.0 Workshop
13

Microarray Data Indicated Some ERCCs Didn’t Dilute As Expected… ERCC-00073 Was Added to Pool 9 at Wrong Concentration?
Lo
g2 g
Pro
ce
sse
d S
ign
als
Log2 Mass Spiked
7/10/2014
ERCC 2.0 Workshop
14

Does Distance From 3’ End Make a Difference in Probe Performance? Distance to the 3’ end of the ERCC on the X-axis Versus Log2 gProcessed Signals (Or Log10 Ratios) on the Y-axis
Lo
g2 g
Pro
ce
sse
d S
ign
als
Distance (nt) to 3’ End of ERC 7/10/2014
ERCC 2.0 Workshop
15

Example ERCC Probes That Gave Expected 1-Color Array Signals For the control ERCC-00028
Pool 10
Pool 9
Pool 8
Pool 7
Liver Control
Lo
g2 g
Pro
ce
sse
d S
ign
als
Distance (nt) to 3’ End of ERC
7/10/2014
ERCC 2.0 Workshop
16
Signals between pools for a given probe
differ 5-fold as expected from the dilutions
Don’t want to select a probe that gives
significant signal in the control sample
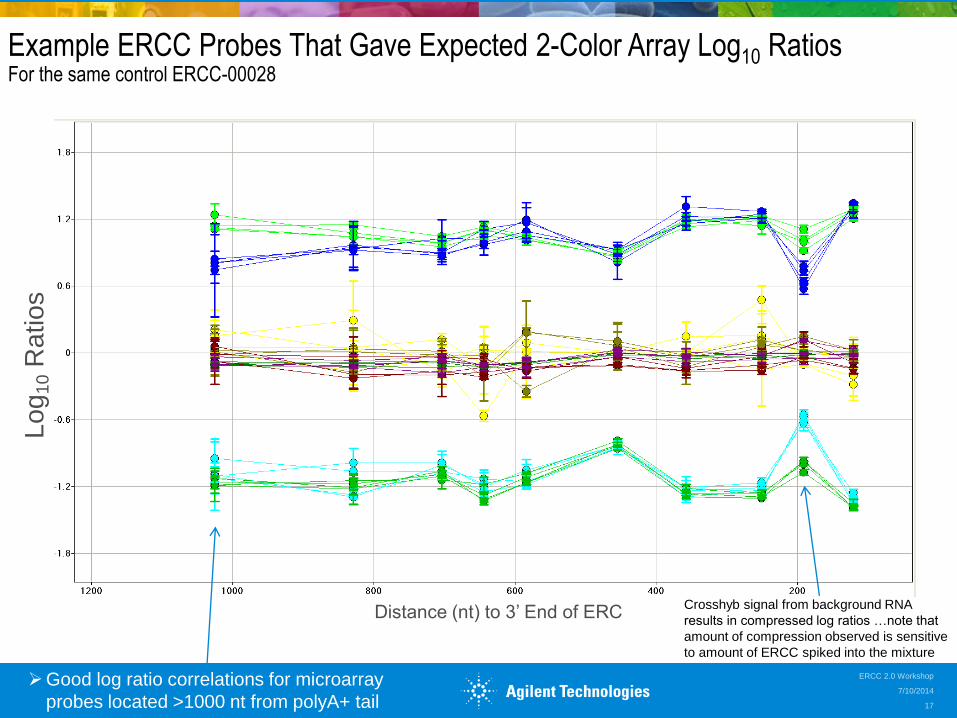
Example ERCC Probes That Gave Expected 2-Color Array Log10 Ratios For the same control ERCC-00028
Lo
g1
0 R
atio
s
Distance (nt) to 3’ End of ERC
7/10/2014
ERCC 2.0 Workshop
17
Crosshyb signal from background RNA
results in compressed log ratios …note that
amount of compression observed is sensitive
to amount of ERCC spiked into the mixture
Good log ratio correlations for microarray
probes located >1000 nt from polyA+ tail

ERCC Performance in Phase IV
7/10/2014
ERCC 2.0 Workshop
18

Construction of the ERCC Phase IV Pools
Each of the 97 ERCC RNA transcripts were diluted to make up 5 different pools
(Pool A through Pool E)
Fewer ERCC spike-in controls were placed at the top end of the dynamic range so
the sample prep reagents would not be swamped by the ERCC spike-in controls
7/10/2014
ERCC 2.0 Workshop
19

Mixing Sub-Pools at Different Concentrations to Obtain Mixtures 1 to 4
Sub-Pools A thru D were present
at one of 4 concentrations in
each final pool: 40%, 25%,
15%, and 10%
Sub-Pool E was held at a constant
concentration of 10% across all
of the final pools
Comparing ratios across the final
pools test ratios from 1x, 1.5x,
1.6x, 1.7x, 2.5x, 2.7x, and 4x
7/10/2014
ERCC 2.0 Workshop
20

Agilent Phase IV One-Color “Gummy Worm” Plots
Lower limit of detection
Saturation
7/10/2014
ERCC 2.0 Workshop
21

Agilent Phase IV One-Color Plots Plus “Gummy” Slope Values
Many of the ERCC
controls have
slopes at or
near 1
7/10/2014
ERCC 2.0 Workshop
22

Making “Gummy Worm” Plots with Agilent 2-Color Data
Can you use the
average of the
green and red
signals from the
2-color “self-self”
arrays?
Yes!
7/10/2014
ERCC 2.0 Workshop
23

How Do Observed Ratios Compare to Signal Intensities? Example: Mix 1 vs. Mix 2
Log2
Ratio
0.68
0.74
0.58
-2.0
0.0 10%
40%
10%
15%
25%
Log2 Signals are on the X-axis
Log2 Ratios are on the Y-Axis
7/10/2014
ERCC 2.0 Workshop
24

Agilent One-Color Observed Log Ratio Versus Signal Data Across All Six Possible Mixture Combinations
In general the Agilent
One-Color Microarray
platform does a great job
of measuring ratios that
are very close to the
expected ratios across a
wide dynamic range!
7/10/2014
ERCC 2.0 Workshop
25

Agilent One-Color vs. Two-Color Performance
Difference in
saturation levels
likely due to
differences in
the amount of
labeled target
loaded per color
channel
(2x higher for
Agilent One-Color)
One-Color Two-Color
7/10/2014
ERCC 2.0 Workshop
26

ERCC Performance in Phase V
7/10/2014
ERCC 2.0 Workshop
27
Example of Agilent Performance in ERCC Phase V Experiments
The Allen Institute for Brain Science has built a “Human Brain Atlas”
which includes gene expression, histological, and MRI data from
several individual post-mortem brains
In phase 1 of this project this project they sectioned the human brains
into ~1,000 parts and analyzed gene expression in each of the 1,000
different areas on Agilent One-Color 8x60K microarrays
The Allen Institute used 20 of the ERCC controls transcripts in a
“barcode” fashion to keep track of samples from a 96-well plate format
The Allen Institute had a control specific for each row and each column of
the 96-well plate to create a specific two ERCC control “barcode” for
each of the 96 possible row-column positions in the plate
7/10/2014
ERCC 2.0 Workshop
28

Phase V “Barcoding” Experiment Illustrated
1 2 3 4 5 6 7 8 9 10 11 12
A
B
C
D
E
F
G
H
7/10/2014
ERCC 2.0 Workshop
29

Conclusions
We were able to successfully design 60-mer probes corresponding to each of the
ERCC transcripts and demonstrate robust measurements with IVT labeling
Every Agilent gene expression microarray control grid contains probes to the each
of the 96 ERCC transcripts (replicated 10x on the 8x60K platform)
Agilent and other measurement platforms were sensitive enough to detect
anomalies in the construction of the ERCC test pools
ERCC transcripts diluted in range of 220 demonstrate that microarrays are capable
of detecting gene expression differences spanning over 5 orders of magnitude
The ERCC transcripts help to explore the differences between the one-color and
two-color microarray data
Agilent customers such as the Allen Brain Institute have successfully used the
ERCC controls for sample tracking in their microarray experiments
7/10/2014
ERCC 2.0 Workshop
30

Thank You!
Agilent:
• Paul Wolber
• Marc Visitacion
• Gary Lin
ERCC 1.0 Phase IV Core Team:
• Marc Salit
• Scott Pine
• Jean Lozach
• Tim Myers
• Sarah Jacob-Helber
• Jenny McDaniel
• Sarah Munro
7/10/2014
ERCC 2.0 Workshop
31

Stay Tuned Tomorrow…
Joel Myerson (Agilent) Talk Friday
“Efficient Chemical Synthesis of Long and Modified RNA Oligonucleotides”
7/10/2014
ERCC 2.0 Workshop
32

Back-Up
7/10/2014
ERCC 2.0 Workshop
33

Visual Effects of ERCC Spike-In Concentrations
Cy5 Pool 10 + Cy3 Pool 8 Liver Control (no ERCs)
Cy5 Pool 10 + Cy3 Pool 10 Cy5 Pool 8 + Cy3 Pool 10
7/10/2014
ERCC 2.0 Workshop
34