Embed Size (px)
Citation preview

POSTERSCOPE MEDIA DIGEST
January 2015

Economic Review Q3 2014
Advertising Review (IPA Bellwether Q3 2014)
Thought Piece
Mobile Insights
Insight Tools - Crimson Hexagon
Insight Tools - Touchpoints 5
Media Owner Research
JCDecaux - JCDecaux Research proves the impact of combining DOOH screen media and Experiential
JCDecaux Airport- Airport advertising transfers prestigious and high value perceptions onto brands
Admedia- Student socialising
Verifone - Verifone launch on-screen survey panel to generate category and brand insights on taxi passengers
Clearchannel - Clear Channel use insight tools and interaction data to start a conversation on the power of Adshel
Exterion Media - Exterion Media’s All Eyes on London 2 identifies valuable audiences residing in London’s Urban Villages Primesight - Primesight conference highlights the changing landscape of retail in the UK
Outdoor Plus- Research demonstrates how DOOH is a must have media for brands
4
5-6
7-11
12
13
14-17
18
18
19-20
21
22
23
24
25
26
Contents
7
12
18
Quarterly Changes in GDP 2009 - 2014
4
GDP Growth
Q2 Q3
1
0.5
0
-0.5
-1
-1.5
-2
%
2014
OOH categories with strong yoy growth in 2014 Q1-Q3 vs 2013 Q1-Q3
5
OOH Commercial
TV
Laptop/Desktop For Any Internet Activity
Mobile Phone For
Any Internet Activity
Watching Catch-Up
TV (iplayer, 4oD etc.)
Tablet For Any Internet
Activity Press (Any)
Totals 100 94 85 78 50 35 35
Monday 89 70 56 56 20 17 12
Tuesday 89 70 57 56 19 17 14
Wednesday 90 70 58 55 19 18 14
Thursday 89 69 58 55 19 18 15
Friday 90 69 54 54 18 16 13
Saturday 88 72 46 53 19 16 9
Sunday 81 75 48 55 21 16 11
89 70 56 56
89 70 57 56
89 69 58 55
90 70 58 55
90 69 54 54
88 72 46 53
81 75 48 5514
Time of Day Analysis (Indexed Volume of Tweets in past 30 days)
0 10 20 30 40 50 60 70 80 90
100
3am
4am
5am
6am
7am
8am
9am
10am
11am
12 noon 1pm
2pm
3pm
4pm
5pm
6pm
7pm
8pm
9pm
10pm
11pm
12 midnight
1am
2am
Coffee Pub/Bar Breakfast
13

POSTERSCOPE MEDIA DIGEST - 2014 4
Economic Review Q3 2014
Source: Office for National Statistics
UK GDP up 3.0% in Q3 2014 compared to previous year
The UK’s economy has grown 0.7% in Q3 compared to Q2 this year, according to the Office for National Statistics (ONS), whilst UK GDP was 3.0% higher in the third quarter compared with a year earlier. This is the seventh successive quarter of output growth and the longest sustained run of quarterly growth since the onset of the economic downturn in 2008.
Revised ONS figures also show the UK economy surpassed its pre-recession peak in the third quarter of 2013 which previously was thought to have been achieved in the second quarter of 2014. The ONS now estimates that GDP was 2.7% higher than its pre-crisis peak by the end of the second quarter this year.Growth in the third quarter of the year was boosted by a 0.7% rise in output from the services industry. The contribution from construction was revised up sharply to show 0.8% growth compared with a previous estimate of zero growth.
Latest figures from the Bank of England forecast that the UK’s economy will grow by 3.5% in 2014, but predict a slower growth of 2.9% in 2015. This is due to stagnation in the Eurozone which remains a concern and slowing growth in China. Interest rates are also likely to remain at historic lows of 0.5% until after the election in May next year and inflation may fall below 1%.
Globally, the International monetary fund (IMF) predicts growth of 3.3% this year and 3.8% in 2015. Europe is still experiencing a “multispeed recovery”, with the UK’s growth being amongst the highest. The IMF has also sharply upgraded its outlook for the US this year, by 0.5% to 2.2%, saying the weakness at the beginning of the year was due to “mostly temporary” factors.
Quarterly Changes in UK GDP 2009 - 2014GDP Growth
Q2 Q3
1
0.5
0
-0.5
-1
-1.5
-2
%
2014

POSTERSCOPE MEDIA DIGEST - 2014 5
Advertising ReviewOOH’s growth continues, up 1.7% YTD (Q1-Q3 2014) & features heavily in Cannes awards entries With regards to OOH, there has been a solid performance YTD (Q1-Q3) in 2014 with a 1.7% increase. OOH expenditure of £258.5m (Q2) and £257.6m (Q3) represents the fourth and fifth largest revenue quarters ever reported for OOH in the UK. Digital revenue YTD 2014 of £188.3m, is up 26% YoY and also accounted for 26% of the total.
Looking at category spend within OOH, growth for Food, Travel & Transport and Media have all been particularly strong. Advertising spend within the property sector achieved by far the largest category growth YoY, mirroring the housing market boom experienced over the last year.
OOH categories with strong yoy growth in 2014 Q1-Q3 vs 2013 Q1-Q3
Aside from advertising revenue, another way of demonstrating the continued strength of OOH is by analysing awards entries. In the 2014 Cannes Awards, OOH featured in 9 in 10 (92%) of the shortlisted entries. This was second only to social media and is an increase from 75% in 2013. This is further proof that OOH is an essential part of effective and industry recognised campaigns.
Source: Warc
Source: Nielson Ad Dynamics
OOH used in 9 in 10 shortlisted Cannes Award Entries in 2014

POSTERSCOPE MEDIA DIGEST - 2014 6
IPA Bellwether Q3 2014
Source: IPA Bellwether Q3 2014
Marketing budgets were revised up for the eighth consecutive quarterAccording to the results, budgets reached their third highest level in the survey’s history and a net balance of 12.6% of companies registered an increase in budgets during the quarter.A net balance of 38.6% of companies said they had grown more optimistic about financial prospects compared with 3 months ago and confidence in the wider financial industry remained high.As the Q3 survey marks the mid-point of the 2014/15 financial year, the results suggest that full-year marketing budgets are due to be higher than initially estimated with marketing executives at their most upbeat for seven years. Over a quarter (26%) of companies also recorded uplift in marketing budgets, relative to the 2013/14 accounting period.
Paul Bainsfair, IPA director general, commented: “Two years of continuous investment in marketing budgets, coupled with sustained confidence, has enabled the industry to innovate and diversify, and crucially to drive business growth. It is good to see companies adapting to the complex media landscape and capitalising on the positive economic climate.”
Adspend growth of 7% is predicted in 2014 with data showing an increasingly positive UK business climate as companies invest more in brand building and expanding sales. However, this growth will likely cause higher interest rates resulting in the Bellwether to predict lower adspend growth of 3.8% in 2015.
Internet advertising budgets make the sharpest upward revisions, up 14.5%, with main media advertising following at 9.2%. Main media advertising was the joint-third highest in Bellwether history.
Of marketing budgets reaching their third highest level since the survey began in 2000, Chris Williamson, chief economist at Markit, and author of the Bellwether report, said: “This represents a remarkably positive picture of companies gaining confidence about the economic outlook as the year has proceeded, ploughing more money into budgets that had already been set higher at the start of the year. At this rate, 2014 is panning out to be the best year for growth of marketing spend in the survey’s 15-year history.”
Marketing budgets and business confidence
-50
-40
-30
-20
-10
0
10
20
Budget revisions, % net balance
2000 2001 2002 2003 2004 2005 2006 2007 2008 2009 2010 2011 2012 2013 2014
Financial p rospects for your com panyTotal m arketing budget rev isions
-75
-50
-25
0
25
50
Financial prospects, % net balance Both series shown on the left are derived from the Bellwether survey panel of 300 marketing executives: Financial prospects:“Taking all things into consideration, do you feel more or less optimistic about the financial prospects for your company than you did three months ago?”
Marketing budgets:“In the last three months, has your total marketing budget for the current financial year been revised up or down, or is it unchanged?”

POSTERSCOPE MEDIA DIGEST - 2014 7
Thought Piece Applying Behavioural Economics to Planning OOHUnderstanding human behaviour is vital to the marketing & communication industry as knowing how and why consumers make decisions allows us to effectively persuade them to purchase. However our understanding of the human decision-making process initially assumes a very logical and explicit process. This usually takes a linear approach to decision making with the assumption that messages are consciously processed and always logical. Behavioural Economics aims to counter this approach by applying psychology to explain economic decision making. The following article details the key principles of Behavioural Economics which emerged from research and development commissioned by the IPA and Posterscope’s view on how they can potentially be applied from an OOH media perspective. This is increasingly relevant as the OOH industry moves towards real time and immersive brand experiences become more prevalent.
1. ChunkingChunking refers to the principle of breaking things down into manageable, easy parts. People respond more positively to a task or situation that is presented in easy-to-understand steps. Presenting a task in one big block can cause confusion and have adverse effects. In addition to this, Chunking can also mean bringing different parts together into more intuitive chunks.
Examples of Chunking in everyday life include health services that use it to decrease the attrition rates of people taking medication, especially antibiotics. Days and weeks are set out on the packet breaking a 28 day treatment into 4 easy weeks. Similarly, compliance is higher when completing complicated forms, such as pension forms, if people know where they are and feel each section is achievable. As a result all online forms should have a save option and clear navigation to show how far through the process an applicant is. Chunking has also been successfully applied to encourage people to use public transport. Instead of telling people that they should stop using their car altogether, the alternative approach encouraged consumers to take the bus for only 1 day a week. This resulted in 230,000 incremental bus journeys, an uplift of 6%. (Source: Greener Journeys, IPA Behavioural Economics: Let’s Get Practical)
The principle of chunking can be applied to how different environments in OOH are planned.The OOH space is vast and varied, and at Posterscope our OCS research identifies how consumers’ behaviour and mindset vary in different OOH environments. Even within an environment e.g. an airport, consumers’ mindset varies greatly in the different locations and chunking into departures, arrivals etc. helps plan more effectively ensuring the right messaging at precisely the right time.

POSTERSCOPE MEDIA DIGEST - 2014 8
2. The Power of NowThe Power of Now is about our desire for instant gratification; responsive digital interaction, dispensing coupons and the smiley face you receive from the screen on the side of the road for driving under the speed limit (for example) all provide an instant reward or response for an action carried out.Behavioural Economics shows consumers engage more with immediate outcomes than they do with delayed outcomes. This has been used to explain why some people find it difficult to lose weight and stick with a diet. The perceived benefit you receive from eating right now far outweighs the delayed long-term benefits of weight loss. It also explains why many products, with long term benefits at their heart, are better promoted when some immediate component is added.
3. Scarcity ValueScarcity Value is about perception of supply. People react to scarcity and are more willing to act if they know that chance won’t be around for long. This theory is frequently applied in marketing when communicating sales promotions. Terminology such as ‘Special Edition’, ‘Limited Edition’ and ‘This Weekend Only’ are all used to create a sense of scarcity for the consumer. The effect is also seen in relation to the percentage of savings gained by someone. For example, people will put in more effort travelling to take advantage of a £100 item for £50 offer as it represents a 50% discount, opposed to a £200 item for £150 item, representing a 25% discount only, even though the actual saving of £50 is the same.
OOH offers advertisers a great opportunity to instantly reward people. Experiential events, for example, provide many different ways of giving consumers instant gratification for participating in or watching the event. Or, for example, poster sites which have the ability to issue vouchers via dispensing 6 sheets or NFC/QR technology.
The ability to update content using digital OOH screens in real time presents an ideal opportunity to realise the scarcity value to full effect. For example, seeing live updates of the most popular items and how quickly they are selling, on a digital screen, will encourage people to engage and react.
Similarly, a countdown clock can be used to inform how long is left to buy a ticket for the EuroMillions rollover in a store close to the screen’s location. This ability, along with the growing importance of m-commerce, means DOOH is in a prime position to influence sales.

POSTERSCOPE MEDIA DIGEST - 2014 9
4. Goal DilutionThe folk wisdom of being a jack of all trades and the master of none aptly epitomises the principle of Goal Dilution. When multiple goals are pursued they are less effectively achieved than when they are pursued individually. Consumers also tend to have a preference for clear singular expertise compared to unclear multiple skills. A single-minded proposition is much more effective when assessing options and making decisions than when multiple proposals are presented.This principle can be seen in technology where people tend to still prefer products that focus on one thing and do it very well. A great example of this is the success of apps on mobile devices versus browsers. Apps focus on one thing and this specialism makes them feel far more effective. The same is true when pairing technology such as TV/DVD players, there is a perception those two products combined cannot have as high a quality as the stand-alone products.
5. Loss AversionLoss Aversion is described as our tendency to ascribe a disproportionally higher value to an item owned compared to one being offered, even with reference to what they have originally paid for it. As consumers we tend to focus more on what we will lose than what we will gain. Loss aversion can also been seen with reference to payment in time as people see a product as more valuable once they have invested their time into it. Examples of this include software and service trials such as Spotify and Netflix and weekend test drives with car manufacturers.
The principle of Goal Dilution can be applied to the effective creation of OOH creative. In some OOH environments dwell time is short, so the creative needs to be simple and communicate the single-minded proposition clearly. If advertisers have multiple messages then it is advised to use more than one creative to promote each message separately. Consistency between the different executions helps build overall brand awareness.
There are many potential applications to implement Loss Aversion principles when planning OOH campaigns. OOH can engage consumers by displaying their user-generated content on digital screens for the world to see, making them feel like they have ownership of it. Experiential events can also create a more personal sense of engagement and feeling of brand ownership. These activities can lead to increased brand equity amongst those engaged individuals.

POSTERSCOPE MEDIA DIGEST - 2014 10
6. Price PerceptionThe price of something does not necessarily represent its value. In theory, price should be a consequence of the value people attach to it. We should be willing to pay what we think something is worth. In practice, this causality runs backwards. The price that is demanded for something makes us value it.Take for example pain relief, people are prepared to pay more for a branded product than a cheaper one believing that it is more effective in relieving pain despite the products having exactly the same chemical properties. The increase in price, along with branding, also creates a type of placebo effect. This mental construct of the brand results in perceived physiological differences and more value.
OOH is well positioned to take advantage of this by helping brands to increase ‘premium’ brand perceptions. This is achieved by advertising in locations which consumers perceive demand a high cost premium. For example, of all the OOH environments, airports and premium digital screens are seen by consumers as commanding the highest prices, and this high perceived value of the inventory influences the perceived premium positioning of the brands using it to advertise.
7. Choice ArchitectureNick Charter, a member of the IPA Behavioural Economics Think Tank and Professor of Behavioural Science at Warwick Business school, has said “We have no absolute idea how much we value any object, service or experience, even with excellent information. All we have is comparison between similar things”.Choice Architecture is a phrase coined by Thaler & Sunstein in Nudge, and relates to the claim that choices can be designed to make certain outcomes more (or less) likely. For example, they talk about how making fruit more prominent in canteens increases consumption by making it more available than less-healthy substitutes. We are aware that it is hard to make a decision in absolute terms and our decisions are almost always influenced by comparisons available to us as mentioned above. Research in the industry has also shown that even for big, expensive purchases, people do not like to put in a lot of effort and prefer companies that offer a simple process to aid decision-making.
Choice Architecture can also be applied to OOH.OOH can help to make decision-making as simple as possible for consumers, through meeting their needs at the right place with prompts to purchase in proximity to store. Furthermore, DOOH allows us to push messaging at the right time as well as in the right place, for example, promoting breakfast products during the morning, or the suggestion of a great place to eat nearby for lunch, or similarly the perfect drink for when the temperature climbs.

POSTERSCOPE MEDIA DIGEST - 2014 11
8. Social Proof Although not one of the stipulated principles in the IPA’s Behavioural Economics, Social Proof also plays a role in understanding and influencing human behaviour. Social proof is a term used to describe how our decisions can be influenced by those around us. Items that are deemed popular by others tend to enjoy a ‘snowball effect’ in popularity.User five star ratings are a great example of this as consumers use them as a valid measure of quality. Not surprisingly, the preference for a product or brand is stronger if the 5 star ratings were created by people in your social group or people with similar interests and beliefs as you.
OOH advertising benefits massively from ‘Social Proof’. The fact that it is located and viewed in a social space in itself generates confidence and trust in the messages and brands that use it.
OOH is also viewed by similar people in a similar mindset for example, people travelling to a sporting event or commuters on the way to work.
DOOH is in a prime position to take advantage of Social Proof to influence decisions. DOOH allows dynamic, real time updates to be incorporated within the creative messaging allowing advertisers to display consumer comments and/or ratings or images relating to their products or campaigns.
Conclusion In summary, the above are examples of broad areas of enquiry from Behavioural Economics, the wisdom of which should be applied by brands, and every planning discipline. And, as demonstrated, OOH is particularly well positioned to deliver the principles of Behavioural Economics.

POSTERSCOPE MEDIA DIGEST - 2014 12
Mobile InsightsResearch for Lenovo proves the value of optimising OOH campaigns using mData Throughout the last year, Posterscope, through its partnership with EE, has been utilising mData to combine mobile behaviour with traditional OOH planning inputs to the benefit of many Posterscope clients. Each mobile dataset used provided unique location based insights on different behavioural segments.
For Lenovo, the increased influence that mobile plays in online shopping was recognised. Particularly smartphones’ role in the path to purchase for technology items through online research, price comparisons and product reviews, often when out of home. Lenovo’s OOH strategy, as a result, involved the optimisation of poster sites - isolating those not only in close proximity to stores, but also those within virtual geographic ‘tech’ hotspots where we knew the target audience were actively viewing technology reviews, and shopping for technology products on their mobiles.
In order to measure the efficacy of utilising this additional layer of geographical data, campaign research was commissioned using a robust sample of 1,500 respondents. Test and control research measured whether those who had been exposed to the OOH campaign were more likely to be aware of, consider and purchase Lenovo products. A sub-category of respondents who lived in the pre-determined mData hotspots were subsequently analysed to measure the effect of using mData to optimise campaigns.
The results demonstrated that the test group, (those living in the OOH regions), saw increases in awareness, brand perceptions, consideration and actions taken. But most profound was the fact that this OOH effect was tripled in the EE mData hotspots when looking at these key metrics. The data showed:
• Unprompted awareness increased by 200%• Purchase consideration increased by 200%• Online searches increased by 150%
Chris Gobby, Head of mData at EE, said: “At EE we strive to help businesses make better decisions from big data with the results speaking for themselves in our work with Posterscope. We’re excited to be a part of this, and future, groundbreaking applications of EE mobile data in out of home advertising and look forward to generating further unique products with Posterscope in the outdoor advertising space.”
POSTERSCOPE MEDIA DIGEST - 2014 13
0 10 20 30 40 50 60 70 80 90
100
3am
4am
5am
6am
7am
8am
9am
10am
11am
12 noon 1pm
2pm
3pm
4pm
5pm
6pm
7pm
8pm
9pm
10pm
11pm
12 midnight
1am
2am
Coffee Pub/Bar Breakfast
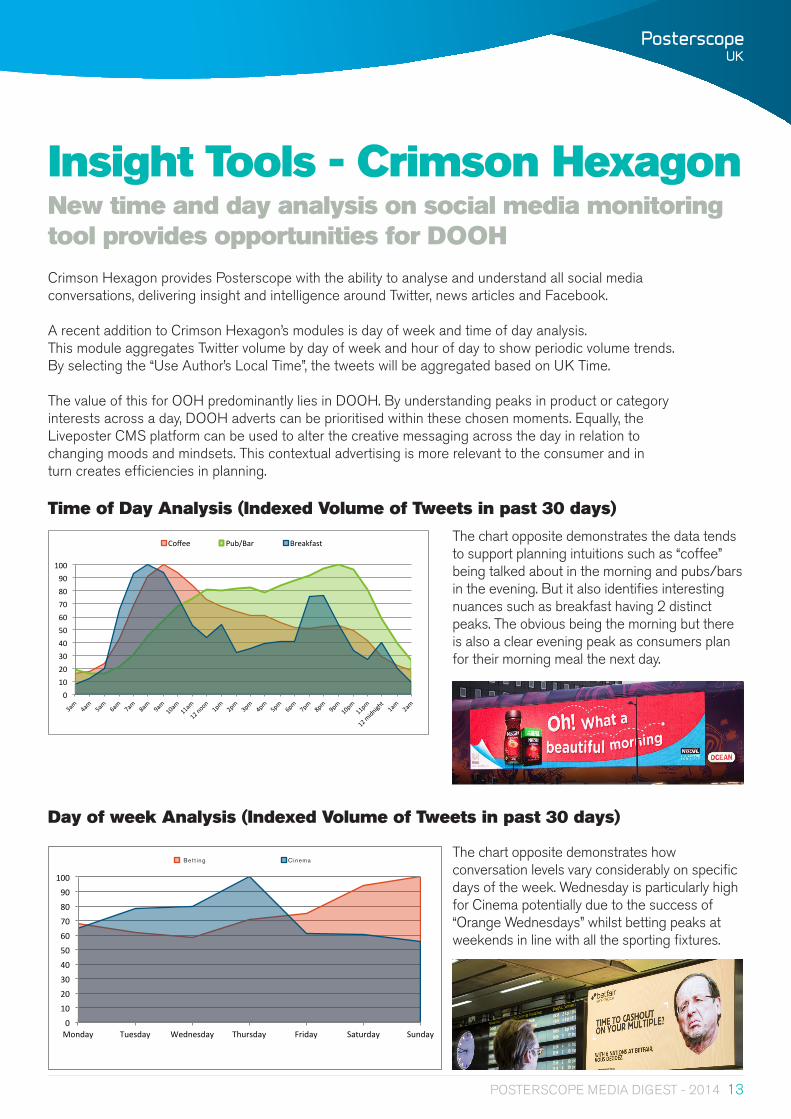
Crimson Hexagon provides Posterscope with the ability to analyse and understand all social media conversations, delivering insight and intelligence around Twitter, news articles and Facebook.
A recent addition to Crimson Hexagon’s modules is day of week and time of day analysis. This module aggregates Twitter volume by day of week and hour of day to show periodic volume trends. By selecting the “Use Author’s Local Time”, the tweets will be aggregated based on UK Time.
The value of this for OOH predominantly lies in DOOH. By understanding peaks in product or category interests across a day, DOOH adverts can be prioritised within these chosen moments. Equally, the Liveposter CMS platform can be used to alter the creative messaging across the day in relation to changing moods and mindsets. This contextual advertising is more relevant to the consumer and in turn creates efficiencies in planning.
Time of Day Analysis (Indexed Volume of Tweets in past 30 days)
The chart opposite demonstrates the data tends to support planning intuitions such as “coffee” being talked about in the morning and pubs/bars in the evening. But it also identifies interesting nuances such as breakfast having 2 distinct peaks. The obvious being the morning but there is also a clear evening peak as consumers plan for their morning meal the next day.
The chart opposite demonstrates how conversation levels vary considerably on specific days of the week. Wednesday is particularly high for Cinema potentially due to the success of “Orange Wednesdays” whilst betting peaks at weekends in line with all the sporting fixtures.
Insight Tools - Crimson Hexagon New time and day analysis on social media monitoring tool provides opportunities for DOOH
Day of week Analysis (Indexed Volume of Tweets in past 30 days)
0
10
20
30
40
50
60
70
80
90
100
Monday Tuesday Wednesday Thursday Friday Saturday Sunday
Be>ng Breakfast CinemaBett ing

POSTERSCOPE MEDIA DIGEST - 2014 14
The IPA launched TouchPoints 5 in Q2 2014, 2 years since the previous study. It shows there have been staggering changes in media over the last 2 years, particularly around smartphone and tablet usage. Posterscope has analysed this new data to identify how OOH, in particular DOOH, can complement usage of other screen media.
Media Coverage by Day of Week amongst 16-34 year olds
When looking at overall reach for 16-34 year olds across the average week, OOH (100%) generated the highest coverage closely followed by Commercial TV (94%). Internet usage for this audience across both laptop/desktop (85%) and mobile phones (78%) is also extremely high whilst VOD (50%) and Tablet Internet usage (35%) still generated large numbers.
Analysis by day of week demonstrated that OOH coverage was remarkably consistent with the sole exception of Sundays, as was TV with a slight increase at weekends. VOD and Internet activity on tablets and smartphones was also constant throughout the week, but the most noticeable difference is the reduced internet activity on laptops/desktops at the weekend when most 16-34 year olds are not working.
Insight Tools - Touchpoints 5Launch of new Touchpoints survey shows how OOH complements consumers’ usage of screen media
OOH Commercial
TV
Laptop/Desktop For Any Internet Activity
Mobile Phone For
Any Internet Activity
Watching Catch-Up
TV (iplayer, 4oD etc.)
Tablet For Any Internet
Activity Press (Any)
Totals 100 94 85 78 50 35 35
Monday 89 70 56 56 20 17 12
Tuesday 89 70 57 56 19 17 14
Wednesday 90 70 58 55 19 18 14
Thursday 89 69 58 55 19 18 15
Friday 90 69 54 54 18 16 13
Saturday 88 72 46 53 19 16 9
Sunday 81 75 48 55 21 16 11
89 70 56 56
89 70 57 56
89 69 58 55
90 70 58 55
90 69 54 54
88 72 46 53
81 75 48 55

POSTERSCOPE MEDIA DIGEST - 2014 15
Internet use on smartphones complements OOH - Both generate high levels of coverage early morning and then occur continuously throughout the day
A strong relationship exists between OOH and 16-34 year olds online activity across smartphones. Of those who spent time OOH on an average weekday, 50% have done so by 9am (cumulative reach on chart). Similarly of those using the internet on their smartphones, 50% have done this by 10.30am. From a brands’ perspective, this means that advertising on these channels has the opportunity to generate high coverage early within the day, giving consumers more time and chance to act on it.
It is also noticeable that OOH exposure and smartphone internet usage continues to occur throughout the day meaning that at any time a consumer views an OOH advert they have the opportunity to respond to it by going online on their smartphone. OOH also peaks from 5-6pm during the evening commute which coincides with the peak of online smartphone during this commute and also in the evening.
Online activity on laptops/desktops peaks directly after OOH commuter periods
Laptop/desktop online activity closely complements OOH exposure as demonstrated in the chart below. OOH exposure peaks during the morning commute and directly after this desktop/laptop internet usage, presumably at work, occurs. Such internet activity continues at a high level, with a slight lunchtime lull, until the evening commute begins at 4pm then it drops considerably. As the evening commute recedes then laptop/desktop usage, presumably at home, peaks again in the evening.
As seen in the chart above, consumers therefore have the option to respond to OOH advertising immediately by going online on their smartphones, or can access it on a larger screen if preferred both at work during the day or at home in the evening.

POSTERSCOPE MEDIA DIGEST - 2014 16
Online activity on tablets peaks in the evening and as a screen media, has more in common with TV and VOD than smartphones
The most interesting insight from the latest IPA touchpoints survey is 16-34 year olds tablet usage. Tablet use is often described synonymously with smartphone usage, being combined and described together as “Mobile”. However, the pattern of tablet internet usage appears far more similar to what we see with Commercial TV and VOD than to smartphones. There is minimal preference for any day of the week, but a clear peak during the evening.
In fact, as the chart below demonstrates, almost half (40%) of 16-34 year olds do not go online on their tablets on an average weekday until after 4.30pm. Therefore OOH advertising in the evening commute is perfectly placed to reach these consumers just before their tablet usage starts in the evening.
The chart below demonstrates just how similar the time of day for internet usage on tablets is to that of viewing both commercial TV and VOD. All three screen media only reach the 50% level of consumers well into the afternoon (Commercial TV 4pm, VOD 6pm and Online Tablet 2pm) and viewing/online usage all peak between 8pm - 9.30pm. Dual screening will clearly be occurring during these timeframes.

POSTERSCOPE MEDIA DIGEST - 2014 17
OOH’s convergent role in influencing e-commerce, m-commerce and in store sales
Earlier this year, IBM also released an interesting report ‘UK Online Retail Christmas Shopping Trends 2013.’ This report analysed device usage and demonstrated how online retail traffic and sales data support the findings above during the Christmas period. Online retail sales tended to peak on weekdays, especially Mondays, when consumers are using their desktops/laptops to make purchases. Conversely, Saturdays saw the lowest online sales. Mobile traffic and sales bucked this trend peaking on Saturdays. This is where consumers are predominately out of home purchasing in physical stores, often using their smartphones to search for local information, researching, and comparing products, in turn influencing their in-store choices.
‘Mobile First’ is a strategy a lot of businesses are starting to take more seriously. Remarkably, half of Dixons retail web traffic now comes from smartphones or tablets. With m-commerce sales expected to be worth £12bn and mobile influenced store sales to be worth £41bn by 2017 (Source: Deloitte), having a robust understanding of smartphone and tablet use while out of home is fundamental to future retail growth.
A recent Google survey on consumers’ local search behaviour across devices supports the TouchPoints analysis above. It also found that when consumers carry out local searches for products and services, computer/tablet use is heavily skewed to home and work use. This compares to smartphones which are used far more when on the go in multiple OOH environments, including in store.
% of consumers who search for local information at:
COMPUTER/TABLET
SMARTPHONE
53%
76%
51%
16%
41%
15%
33%
24%
33%
12%
25%
18%
20%
11%
Home On the go(car, bus etc.)
In-store Workplace Restaurant/ Bar
Hotel/ Motel
Airport

POSTERSCOPE MEDIA DIGEST - 2014 18
JCDecaux launched Waterloo Motion in 2014 and have run several campaigns combining Experiential within the station and the DOOH screen. Two such campaigns were for Center Parcs and Lurpak. Both campaigns used the screen to deliver content either directly broadcast from the Experiential activity or linking to wider messages of the campaign.
This activity was researched using a combination of face to face interviews as well as mobile diaries. The research demonstrated that across key metrics such as brand knowledge, recommendation, consideration and advertising perceptions, all metrics significantly increased when consumers were exposed to both the experiential activity and DOOH screen.
For more information please contact Chris Felton at [email protected]
Media Owner Research
JCDecaux Research proves the impact of combining DOOH screen media and Experiential
Lurpak Center Parcs
Control (Waterloo before experiential)
Test (Waterloo during experiential)
Control (Victoria Station)
Test (Waterloo Station)
CONSIDERATION
Consider buying Lurpak in the future Consider going to Center Parcs in the future
44% 52% 45% 59%
RECOMMENDATION
Might mention Lurpak’s recent advertising Likely to talk about / recommend Center Parcs or its advertising
24% 67% 59% 72%
BRAND KNOWLEDGE
Aware Lurpak launched 4 new products Aware of Woburn Forest Opening
27% 51% 13% 19%
ADVERTISING PERCEPTIONS
Lurpak has great Advertising Center Parcs
(Average 7 advertising statements)
40% 50% 56% 80%

POSTERSCOPE MEDIA DIGEST - 2014 19
JCDecaux Airport devised a creative research project to identify which mediums transfer premium perceptions onto brands. four fictitious brands were created across four product categories (alcohol, fragrance, hotel, technology), two of which were products available to purchase at airports (fragrance and alcohol). In total eight media environments were compared. A nationally representative sample of 500 adults per environment was interviewed and asked what their perceived value of the specific product advertised using a six point scale.
Fictional perfume brand L’Amour
Airport advertising transfers prestigious and high value perceptions onto brands

POSTERSCOPE MEDIA DIGEST - 2014 20
The results truly demonstrated the long held belief that the medium in which a brand is viewed can significantly enhance consumers’ perceptions towards it and this is illustrated using the results of two of the brands above. The research proved that irrespective of the product or service category, when advertising is viewed in the Airport environment the brand will be perceived as being of higher value. Airport media conveys a cosmopolitan feel and international status onto brands giving them this prestigious appeal.
Interestingly amongst key target audiences such as Londoners in the hotel example above, all the included OOH environments as well as airports tended to transfer higher values onto brands. Buses and obviously the Underground are key London OOH mediums, so it is not surprising these mediums performed significantly better amongst London respondents. Surprisingly from the results was the lower value assigned to brands when viewed on TV. TV is without doubt an extremely effective medium and features highly when consumers are asked to recall advertising. However, we hypothesise that the best explanation is the mass market nature of TV which may not necessarily lend itself to brands being considered as prestigious or exclusive which is a key determining factor of a higher brand price.
For more information please contact Lucy Shaw at [email protected]
Perfume: Value across the 8 environments
Hotel: Value across the 8 environments
£31.84 £30.44 £30.02 £29.40
£28.48 £27.81 £27.14
£24.87
£0.00
£5.00
£10.00
£15.00
£20.00
£25.00
£30.00
£35.00
AIRPORT TUBE NEWSPAPER MAGAZINES BUS TV TAXI ONLINE
ALL ADULTS
£188.46
£172.36 £168.17
£160.49 £157.15 £156.16
£152.55 £152.55
£120.00
£130.00
£140.00
£150.00
£160.00
£170.00
£180.00
£190.00
£200.00
AIRPORT NEWSPAPER TUBE MAGAZINES TAXI BUS TV ONLINE
LONDON ADULTS

POSTERSCOPE MEDIA DIGEST - 2014 21
Admedia interviewed 500 students using their online student panel throughout the last year in order to gain a cultural understanding of the UK Pub Culture and what it means to students. The 500 students were made up of ‘Opinion Leaders’ and ‘Trend Setters’ throughout the UK.
Students and Pubs
• Students are 254% more likely than average to be a ‘heavy’ pub/bar user with 61% going to the pub/bar once a week or more
• 59% said pub visits are usually spontaneous
• 6 in 10 agree “Going to the pub is important for me” • Going to the pub is a student’s favourite hobby
Drinking isn’t the priority when it comes to the pub experience
• 59% of students state their favourite thing about pubs and bars is the “Great Conversation”.
• With 9 in 10 brand discussions taking place face to face, pubs are an ideal location for such conversations to take place in a relaxed and positive environment.
• Pubs are the No.1 destination for students watching sports (Ipsos Mori 40% Sky Sports viewing occurs OOH)
• 56% watch sports in pubs, at least once a fortnight
• 60% of students prefer spending a night out at a non-student union venue
What days are popular nights out?
• As with the working population, Fridays (45%) and Saturdays (55%) are the most popular nights out
• However Mondays (30%) are also popular as opposed to Thursdays (only 15%) which are more common nights out amongst those employed
• 36% students spend most of their weekly money on leisure activities at pubs, clubs or bars
For more information please contact Louise Fisher at [email protected]
Student Socialising - An insight into student socialising in pubs and bars
Watching TV
Reading books/magazines
Playing games on my console/online
Going to the cinema
Going to the gym/sports club
Going shopping
Going out to eat
Going to thepub/club/bar
Q: What do you enjoy doing most in your spare time?Source: Admedia Student Panel, 2013
2%
2%
6%
10%
12%
13%
17%
38%
Students favourite thingsabout bars/pubs
59%‘Great conversation’
11%‘Drinking’
16%‘Meeting new people’
8%‘It’s a neutral space,there is no pressure
42%‘The community feeling
-I prefer it to online communities’
42%‘Relaxing space and
environment’
Q. What is your favourite thing about spending time in a pub/bar? (please tick as many that apply)Source: Admedia Student Panel, 2014
28%
23%
15%
44%
55%
10%
30%
The most popular days and times to go out
Q: What nights of the week do you normally go out on? (tick all that apply)
Source: Admedia Student Panel, 2014
Monda y Tuesda y
We
dn
es
da
y T
hu
rsday d
Friay
Saturd
ay S
un
da
y

POSTERSCOPE MEDIA DIGEST - 2014 22
Verifone launch on screen survey panel to generate category and brand insights on taxi passengers
Verifone has been using their screens to ask passengers their opinions on a range of subjects.
• Accessed by arm rest controls• On screen “Tell us what you think” microsite• Multiple choice format, 4 answers to choose from• Up to 6 different subject questions per survey• Average 100 – 300 respondents per survey
A few highlights from the surveys demonstrate that, across a range of categories, Taxi screen advertising is popular amongst passengers
43% would like to see adverts / reviews of cars on taxi screens
61% would like to see luxury fashion brands advertised on taxi screens
66% would like to see the latest film trailers advertised on taxi screens
Verifone has also launched some GPS research (TaxiGPS) which generates data to help plan and track taxi campaigns
A few key topline statistics from TaxiGPS are highlighted below but for more detailed information please contact Daemon Brown at [email protected]
Campaign seen at Oxford Circus
every...
Based on fleet of 300 superside taxisSource: VeriFone TaxiGPSTM 2014
10mins
Taxis pass through Howland St, Charlotte St,
Mortimer St. & Great Titchfield St.
Based on fleet of 300 superside taxisSource: VeriFone TaxiGPSTM 2014
100daily
Impacts delivered over 12 months
by 120 livery taxi campaign
Based on fleet of 120 livery taxisSource: VeriFone TaxiGPSTM 2014
588million
Time spent in Central London by taxis
Based on fleet of 120 livery taxisSource: VeriFone TaxiGPSTM 2014
92%
Time spent on non-arterial outdoor cold spot routesBased on fleet of 300 superside taxisSource: VeriFone TaxiGPSTM 2014
42%
MW campaign 4 week ad exposure per monthBased on fleet of 300 superside taxisSource: VeriFone TaxiGPSTM 2014
60k hours

POSTERSCOPE MEDIA DIGEST - 2014 23
Route data supports the fact that a 2-week national Adshel campaign can reach 74% of the UK adult population – i.e. 37 million people
Touchpoints data suggests that adults who have seen posters at bus shelters/on the high street in the last week are
• 12% more likely to be a Conversation Catalyst* than average adult
• 2 in 3 (69%) have frequently given suggestions/ advice/ ideas to others about products or categories
TGI data supports this insight demonstrating they are 29% more likely to be Word of Mouth Champions*
Over 25,000 panels are now NFC/QR code enabled in the UK across high streets, bars and shopping malls
• All head on/contra panels in conurbations and towns over 100k population are now tagged nationwide
• 320k consumer interactions since launch in 2013• 23% growth of interactions in Q2 2014 compared
to Q1 2014
Clear Channel launched their ‘start a conversation’ initiative in August 2014 using a variety of industry and proprietary interaction data to demonstrating the power of Adshel in talking to the majority of the GB population.
*The Conversation Catalyst™ segment is defined as people with a large social network who regularly give recommendations in multiple product categories.* Word of Mouth Champions talk to many different people, give a large amount of information and are very likely to convince other people
Clear Channel use insight tools and interaction data to start a conversation on the power of Adshel
Increases in interaction numbers demonstrate consumers’ desire to further engage with brands and keep the conversation going
For more information please contact Lynne Jarrett at [email protected]

POSTERSCOPE MEDIA DIGEST - 2014 24
In June 2014 Exterion Media launched All Eyes on London 2. This followed All Eyes on London which demonstrated the importance of London workers and their concentration within the central London boroughs (Zone 1). Tools such as the London worker planning tool have allowed media planners to focus on this key urban commuting audience. All Eyes on London 2 shifted the focus to London’s urban villages where these workers live. It provides audience insight into key consumer segments and the areas in which they reside.
Generation Next – Acton, Crystal Palace, Holloway, Leytonstone• Young, urban and hip – these neighbourhoods are on the cusp of being the next big thing. • Younger audience with 34% being aged 20-34• 60% earn over £40k, spending their money on fashion and going out• Mosaic groups of ‘Crash Pad professionals’, ‘Bright Young things’, ‘Global Fusion’
Urban Gentry – Brixton, Kensal Rise, Stoke Newington, Stratford• Fully gentrified by a younger audience looking to settle down - 42% aged 25-44 • High street of upmarket chain restaurants and independently owned spaces and retail stores• Young & sociable heavy OOH audience spending money on holidays, entertainment, good quality food and stylish homeware• The inhabitants are twice as likely as the national average to have an income of £70k+ • Attractive Mosaic groups of ‘Urban Cool’, ‘Bright Young things’, ‘Convivial Homeowners’
Well Healed – Blackheath, Hampstead, Richmond, Wimbledon• Collectively represent the most valuable audience types in London with 85% ABC1• Well established areas with old and new money - An older audience with 56% aged 35+• Inhabitants are 8 times more likely to earn £150,000+ a year than the national average• Attractive Mosaic groups of ‘Voices of Authority’, ‘Global Power Brokers’, ‘Serious Money’
For more information please contact Nicola Barrett at [email protected]
All Eyes on London 2 explored 12 different urban villages within the capital.
Three key consumer segments who typify the residents of these urban villages were identified, each with a unique appeal to advertisers.
1. Generation Next2. Urban Gentry3. Well Healed
Exterion Media’s All Eyes on London 2 identifies valuable audiences residing in London’s Urban Villages

POSTERSCOPE MEDIA DIGEST - 2014 25
Primesight conference highlights the changing landscape of retail in the UK
In June 2014 Primesight ran a conference with Mediatel on Retail. The conference content highlighted how the retail landscape is changing but emphasised how retail is still at the heart of society’s way of life where the economy, consumption, lifestyle and technology all converge. Below is a summary of some key topline statistics from Primesight’s presentation at the conference.
The Economy• 20% GDP contributed by Retail Sales (British Retail
Consortium)• 30% tax contributed by Retail Sales (UKTI/BRC)• 3 million employed in the UK Retail Industry (Retail
Week 2014)
Lifestyle• 189 average number of shopping trips undertaken
each year which equates to 18.5 days shopping time (UK Government)
• It takes 2hrs 26 minutes for us to get bored on a shopping trip (Daily Mail)
Consumption • £9 in £10 spent on Retail is still spent in
physical stores (ONS)• The rise of the convenience shopper with 400
convenience stores being opened in 2014 (Retail Week Report)
• 25% of consumers expect to purchase more food from convenience stores in the future (Retail Week Report)
Technology• 20% increase in online sales in the last year • 100 Regent Street stores already installed with
iBeacons (Crown Estates / Telegraph)• 33% Smartphone Owners admit to showrooming
(TNS Mobile Life)• 93% of those who ever use mobiles to research
products go on to make a purchase (Google Mobile Path to Purchase)
• By 2016 Connected Retail will Influence 44% of Retail Sales (Guardian)
For more information please contact Lisa West at [email protected]

POSTERSCOPE MEDIA DIGEST - 2014 26
Research demonstrates how DOOH is a must have media for brandsRecent research amongst 100 CEOs/CMOs interviewed by Censuswide in July 2014 demonstrated
that TV and digital OOH are considered the top two ‘must have media’ in London for driving brand fame.
This is a very positive story for DOOH which is now top of mind amongst senior brand leaders largely through delivering premium and innovative campaigns made possible by significant media owner investment. Considering DOOH’s staggering growth from £100 million in 2010 to £214 million in 2013 (OMC), this ‘must have media’ position shouldn’t really come as a surprise. DOOH also shows no sign of slowing with 26% growth 2014 YTD (Q1-Q3) compared to the same period in 2013.
Amongst the 100 CEOs/CMOs interviewed, visibility and impact (76%) were perceived as the greatest benefits of DOOH. 57% also stated the ability to reach a large audience and target both existing and new customers has a major benefit and demonstrates how DOOH is clearly now thought of as a broadcast reach medium. 65% of the CEOs/CMOs interviewed also stated the ability to target specific audiences at different times of day was a key advantage of DOOH. Posterscope’s own consumer survey, OCS, which interviews almost 6,800 respondents, demonstrates that consumers agree with this. Almost 50% of Londoners state they are more likely to remember brands that use relevant digital OOH messaging.
But, as an industry, we must not forget that the success of DOOH has been built on the foundation of traditional OOH, and standard billboards were actually rated as the next “must have” channel behind DOOH and TV by CEOs/CMOs. Traditional OOH has long been regarded and proven as the top medium alongside TV at generating brand fame and effects. The IPA recently released learnings from their substantial databank demonstrating that TV and OOH are the two mediums that generate the highest brand effects uplift. Consumers themselves also rate TV and OOH as the two most noticeable mediums, which is again supported by OCS data.
Similarly, a few years ago the OMC’s analysis of Millward Brown brand typologies demonstrated that brands who invest more than average into OOH formed the Classics, Olympians or Little Tigers in their respective categories. Such brands also scored higher than average against a range of personality metrics associated with fame such as being ‘Trustworthy’, ‘In control’, ‘Wise’ and ‘Desirable’. What we find most encouraging is that both advertisers and consumers are aligned in their opinions that OOH and in particular DOOH is the right place for brands to be. For more information please contact Suzanne Hodgins at Outdoor Plus on [email protected] or Victoria Morgan at Seven Dials on [email protected]

2nd floor, The Qube, 90 Whitfied Street, London, W1T 4EZ
www.posterscope.com
www.pioneeringooh.comfacebook.com/PosterscopeWWtwitter.com/Posterscope