Embed Size (px)
Citation preview

Evaluation of urinary proteome and its correlation with kidney function in
patients with Diabetic Nephropathy and with renal biopsies in
non diabetic renal diseases.
Ravi kumar M
Prof. K.V. Dakshinamurty

• Chronic kidney disease is a devastating disease with clinical economic and ethical dimensionsand is emerging as a major public health problem globally.
• The incidence of chronic kidney diseases (CKD) and end-stage renal diseases (ESRD) are growingat an alarming rate.
• The most common causes of CKD are diabetic nephropathy (DN), hypertension andglomerulonephritis.
• Type 2 diabetes mellitus (T2DM) is an alarming healthcare concern worldwide. T2DM is mostcommon cause of CKD in India.
• India has the largest number of diabetic patients in the world, estimated to be ∼40.9 million inthe year 2007 and expected to increase to ∼69.9 million by the year 2025.
• This is due to an increase in the prevalence of DM, genetic factors, life style modifications and anincrease in the life span of patients with diabetes
• T2DM is responsible for 30-40% of all ESRD cases.
• Currently it is impossible to predict which and when diabetic patients will develop nephropathy.
• Early detection of kidney injury followed by adequate therapy might prevent the progression ofdisease.
Introduction

• Glomerular diseases (GD) such as MCD, MGN and FSGS are associated with proteinuria that is causedby increased glomerular permeability.
• Diagnosis of the type of GD requires a invasive renal biopsy.
• Although each renal disease that leads to proteinuria has specific pathogenic mechanisms (eg.immunologic, metabolic, plasma factors).
• The identification of specific biomarkers in urine would greatly improve the diagnostic potential and alsodirect the clinical management.
•
• Sometimes Urine has been described as a “fluid biopsy” of the kidney. Changes in kidney function can bedetected in the urinary proteome non-invasively.
• The great accessibility of urine makes this fluid an ideal target for the search of disease specific markers
• The pathological changes in human organs, which could be found in serum, may also be reflected anddetected in urine proteome.
• As a component of body fluid proteome, urine proteome is composed of the proteins filtered fromblood within the glomerulus, as well as the proteins secreted from the kidneys.
• There are many parameters to evaluate the renal damage such as serum creatinine, urea, uric acid, butin many instances there is no pathological change until damage is already advanced.
• Clinical analysis of proteins in urine generally is based on measurement of total protein concentration and albumin, where a lot of other proteins found in urine are neglected using these methods.
• 24hr urine total protein estimation can not detect or estimate individual proteins.
Introduction

• Urinary proteomics is increasingly being used to discover potential biomarkers noninvasively.
• Urinary biomarkers detecting kidney injury might allow identification of patients who would benefit from further evaluation.
• With the development of proteomic techniques, urinary proteome analysis provides a fast, non-invasive diagnostic tool for patients with renal diseases.
• The advent of highly sensitive proteomic technologies can identify urinary proteins associated with development of kidney diseases well before any clinically identifiable alteration.
• Orbitrap mass spectrometer has a high resolving power and identifies proteins with more accuracy
• In this sense, we applied proteomic technologies for an un-biased examination of urine to detect novel biomarkers that could play a critical role in disease diagnostics, treatment monitoring and prognosis.
• Such data would eventually even make renal biopsy superfluous.
Introduction

Sample collection
Proteins extraction
Proteomic analysis
Bioinformatics analysis
Proteomic discovery
Less number of sample size
DiscoveryDetect multiple biomarker candidates
Biomarker discovery
Validation phase Discovery phase
More number of sample size
validation
Functional study
Diagnostics andtherapeutics use
Confirmation of biomarker panels in test patient populations
Identification
The Biomarker Discovery Process Introduction

Aim and objectives
Identification and characterization of proteins excreted in the urine of diabeticnephropathy, non-diabetic glomerular diseases and renal tubular acidosis by usingSDS- PAGE, LC/MS/MS approach using LTQ-Orbitrap mass spectrometer.
Comparing urinary protein patterns in patients with kidney disease (Type 2Diabetes with nephropathy, Glomerular diseases and RTA) and with controls.
To prove urine is a well suited body fluid for proteomic analysis to identifypredictive biomarkers.
To identify newer urinary biomarkers for CKD.
To identify urinary protein patterns in CKD as diagnostic and prognostic markers

• PATIENT SELECTION:-• The patients in this study were recruited from the OPD and wards of Dept. of
Nephrology, NIMS. Prior to the study, subjects were given an information sheetcontaining details about the project. Informed written consent was taken from them.
• Ethical approval was obtained from the Institutional Review Board, NIMS.
• Inclusion Criteria: History of proteinuria (150mg/24hr or albumin positive by dipstick) Type II diabetes with and without nephropathy Non-diabetic Glomerular disorders Renal tubular acidosis Willing to sign Informed consent form
• Exclusion Criteria: Type I diabetes History of hematuria Pregnancy Breast feeding or lactating Any malignancy Liver disease Viral hepatitis
Methodology

• CONTROL SELECTION:-
• The controls in this study were recruited from the outpatients of Dept. of Nephrology, NIMS.
• The controls were healthy individuals in the same population sampled at the same time. Control subjects were matched for confounding factors (age, sex and socio economic status, etc.).
• Written informed consent was taken from them.
Methodology

Controls
Diabetic CKD Non- Diabetic CKD
Tubular Diseases
Chronic Kidney Disease (CKD)
Patient group information
Type 2 Diabetes Mellitus
1. DM with Normoalbuminuria2. DM with Microalbuminuria3. DM with Macroalbuminuria
1. Healthy Individuals
1. Minimal change disease (MCD)2. Membranous glomerulonephritis (MGN)3. focal segmental glomerulosclerosis (FSGS)4. Lupus nephritis (LN)
1. Renal tubular acidosis
Methodology

Experimental Work flow
Methodology
Protein identification
(Sequest & Mascot)
Morning second voided urine sample
Centrifuge for 10min at 10,000g and filtered
Protein concentration by Spin column (3Kda) & Protein estimation by Bradford assay
LC-MS/MS (Orbitrap)
Samples from each group were pooled,depleted by Hu-6 (Agilent) affinity column and desalted
In gel Tryptic digestion
Bioinformatic Analysis
•Chromatogram : 90min linear gradient•Maximum Missed Cleavage Sites: 2•Precursor Mass Tolerance: 10 ppm•Fragment Mass Tolerance: 0.8 Da•Dynamic Modification: Mithionine Oxidation/ +15.995 Da (M)•Static Modification: Cysteine Carbamidomethyl/ +57.021 Da (C)
Protein separation by 1D SDS-PAGE

• For all the proteomic experiments, 100ml of morning second voided urine samples were collected .
• 1ml (0.5g/dl) sodium azide was added to the urine to prevent bacterial growth.
• centrifuged at 1000g for 10min to remove cell debris and casts and filtered the supernatant through whatman filter paper No.1.
• The supernatant was stored at -800 C until further processing to prevent protein degradation.
Urine sample collection
Methodology

• Urinary protein concentration and salt removal by cutoff columns:-
• Urinary proteins concentration and salts removal was done by Millipore 3KDa cutoff column.
• centrifuged at 4,000 rpm. at 40C. The final concentrate was washed twice with milli-Q water to remove excess salts present in urine.
• Final protein concentration was estimated by the Bradford method.
• Depletion of high abundant proteins:-
• Pooled urine protein samples were depleted of six major abundant plasma proteins (albumin, IgG, IgA, antitrypsin, transferrin, and haptoglobin) using the Agilent multiple affinity removal (MARS) column.
• Urinary proteins (4 mg) equilibrated in Agilent buffer A was processed using an Agilent immunoaffinity column (4.6 X 100-mm) attached to HPLC.
• Appropriate flows through fractions were collected and Flow Through concentrated using 5,000 kDa cutoff filters . Protein concentration was determined using the Bradford protein assay.
Urine sample preparation
Methodology

• Urinary protein samples were loaded into a gel. Electrophoresis was performed at constant voltage of 100.
• Gel was stained with Coomassie blue and digitized using Vesadocgel scanner.
• The urinary proteins were fractionated on 11 cm, 4-20% gradient gels.
• Protein in-gel tryptic digestion:-• The bands in the gels were sliced manually, Bands de-stained with
50% ACN/50%25mM NH4HCO3.
• The gel bands immersed in 20uLof trypsin solution. The digestion was done at 370C for 20 hr.
Urinary proteins separation by SDS-PAGE
Methodology

• Nanoflow electrospray ionization and tandem mass spectrometric analysis of peptide samples were carried out using LTQ-Orbitrap Velos.
• Each peptide fraction was further separated on a Bio Basic C18 nanocapillary column using a 90 min linear gradient .
• Low-resolution CID-MS/MS. • Resolution in the Orbitrap system was set to r= 60,000. • The resulting fragment ions were scanned out in the low-pressure ion trap at the “normal scan
rate” (33,333 amu/s).• Ion selection threshold was 500 counts for MS/MS, and the maximum allowed ion accumulation
times were 500 ms for full scans and 25 ms for CID-MS/MS measurements.• Each fraction was run in duplicate resulting in generation of raw files from all the nine groups and
searched against protein database.
• Protein identification:-• The raw files were analyzed using Proteome Discoverer.• SEQUEST search algorithm was employed and searched against the human IPI database. • Search parameters include: 2 missed cleavage allowed; oxidation of methionine was set as a
dynamic modification while carbamidomethylation of cysteine as static modification. • Precursor and fragment mass tolerance were set to 10 ppm and 0.8 Da, respectively. • The peptide and protein identifications were obtained using high peptide confidence and top one
peptide rank filters. • The FDR was calculated by enabling the peptide sequence analysis using a decoy database. High
confidence peptide identifications were obtained by setting a target FDR threshold of 1% at the peptide level (95% confidence).
LC-MS/MS analysis:-
Methodology

Patient selectionSex (n) Age
(mean±SD)DURATION OF DIABETES (years) (mean±SD)
Control subjects (10)M(4)/F(6)
50.7±8.80
Study group 1 (NA)(DM-normoalbuminuria) (10)M(5)/F(5)
52.8±11.03 8.3±7.48
Study group 2 (MIA)(DM-microalbuminuria) (10)M(5)/F(5)
51.6±12.12 9±6.56
Study group 3 (MAA)(DN-macroalbuminuria) (15)M(11)/F(4)
51.73±7.50 13.6±5.90
Results
Diabetic groups
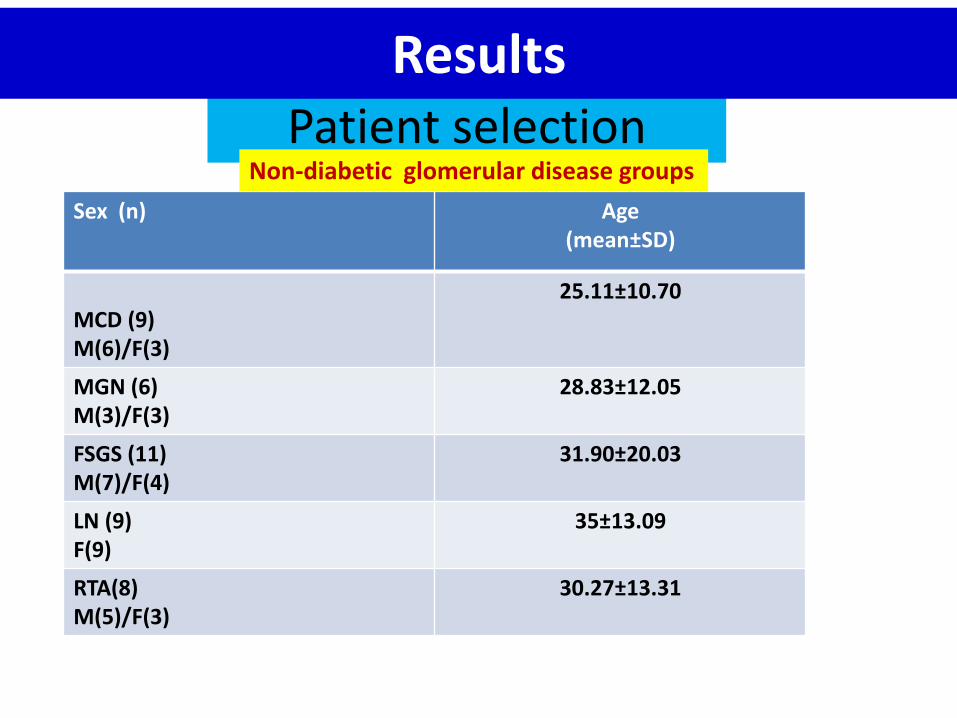
Patient selection
Sex (n) Age (mean±SD)
MCD (9)M(6)/F(3)
25.11±10.70
MGN (6)M(3)/F(3)
28.83±12.05
FSGS (11)M(7)/F(4)
31.90±20.03
LN (9)F(9)
35±13.09
RTA(8)M(5)/F(3)
30.27±13.31
Non-diabetic glomerular disease groups
Results

STUDY GROUPS BMI (mean±SD)
WHR (mean±SD)
SY S BP (mean±SD)
DIA BP (mean±SD)
Healthy Individuals 22.94±2.73 0.93±0.01 116±5 77.77±4.40
Study group 1 (NA)
26.34±3.94 0.96±0.02 130±16.99 81±5.67
Study group 2 (MIA)
28.04±4.96 0.95±0.04 134±10.74 85±5.27
Study group 3 (MAA) 22.49±3.18 0.94±0.04 144±14.04 87.33±7.03
Anthropometric measurements & Vital signs
Results
Diabetic groups

STUDY GROUPS
BMI (mean±SD) WHR (mean±SD) SY S BP (mean±SD)
DIA BP (mean±SD)
MCD 21.27±4.01 0.94±0.01 118.8±6.0 80±5
MGN 22.90±7.90 0.94±0.03 118.33±7.52 78.33±4.08
FSGS 22.69±5.01 0.89±0.07 134.54±19.6 84.54±8.20
LN 26.56±5.86 0.98±0.02 127.7±18.55 81.11±12.69
RTA 24.6±6.80 0.94±0.06 120.24±12.2 80.61±6.25
Anthropometric measurements & Vital signs
Results
Non-diabetic glomerular disease groups

STUDY GROUPS FPG
(mg/dl)HBA1C
S.CRT(mg/dl)
P.TP(g/dl)
P.ALB(g/dl)
24HR(g/day)
U.ALB(mg/dl)
T.CHL(mg/dl)
TGL(mg/dl)
HDL(mg/dl)
LDL(mg/dl)
VLDL(mg/dl)
CONTROL
90.88±5.96
5.59±0.31
0.89±0.20
7.86±0.71
3.98±0.48
0.10±0.02
11.8±7.64
146.1±23.4
100.7±20.5
45.2±7.6
80.9±24.8
20±4.18
NA146.3±24.9
7.89±1.5
1.04±0.2
7.48±0.40
4.48±1.03
0.11±0.4
10.67±7.34
158.3±32
159.5±99
39.4±4
87.6±23.1
31.7±19.6
MIA114.2±23.4
10.2±1.55
1.23±0.96
7.06±0.6
3.7±0.5
0.49±0.21
83.4±30.21
177.7±37.7
159.9±75.2
46.1±11.9
99.7±35.02
31.9±15.02
MAA191.13±82.46
11.00±2.3
5.50±2.53
5.49±0.84
2.78±0.64
3.37±1.43
918.0±443.4
195.7±79
134.9±68.7
40.7±12
118.3±57.4
27±13.7
LABORATORY INVESTIGATIONS (mean±SD)
Results
Diabetic groups

STUDY GROUPS FPG
(mg/dl)S.CRT(mg/dl)
S.TP(g/dl)
S.ALB(g/dl)
24Hr.U.TP(g/day)
T.CHL(mg/dl)
TGL(mg/dl)
HDL-C(mg/dl)
LDL-C(mg/dl)
VLDL-C(mg/dl)
MCD 95.66±10.1
1.01±0.5
5.23±1.1
2.7±0.86
3.6±1.77
337.5±181.0
396.3±246.05
54.3±10.44
162.7±29.24
62±6.9
MGN91.7±9.8
0.95±0.2
4.81±1.2
2.4±0.84
3.9±2.6
260.3±63.3
222.8±91.04
46.3±10.15
169.3±44.1
44.7±18.1
FSGS 96.54±17.13
1.66±0.75
5.97±1.3
2.58±0.95
2.50±1.04
306.5±118.8
263.8±99.0
47.3±8.7
204.1±125.2
67.77±41.8
LN101±28.4
1.5±1.4
5.9±0.95
3.02±0.73
1.2±1.1
233.9±89.5
234.3±101.8
53.1±12.59
133.9±79.4
46.9±20.4
RTA 92.3±12.8
1.2±0.6
6.92±1.6
3.56±0.56
0.15±0.09
280.5±50.4
145.6±25.4
50.23±11.2
85.8±11.5
16.8±2.3
LABORATORY INVESTIGATIONS (mean±SD)
Results
Non-diabetic glomerular disease groups

SDS-PAGE separation of urinary proteins before and after depletion
Results

S.no Disease Total number of proteins
Unique proteins
1 Control group 274 69
2 DM group 505 169
3 MIA group 468 129
4 MAA group 320 132
6 MCD group 307 43
8 MGN group 825 462
5 FSGS group 457 101
7 LN group 546 126
9 RTA group 546 141
Urinary Proteome identified by LC-MS/MS (Orbitrap)
Results

Cellular and Functional Classification of DN-urinary proteins
Results

Comparison of diabetic groups urinary proteins
Results

84 315Control(274)
DM(505)
190100 294
Control(274)
MIA(468)174
172 218 MAA(320)
102Control(274)
Comparison of Diabetic groups with Controls
Results

Comparison of intra Diabetic groups
Results

Comparison of DN unique proteins with GD Proteins
66 1223Non-diabetic CKD(1289)
DN unique proteins(132) 66
Eg; Neutrophil defensin 1 (apoptosis)Metallothionein-1X (copper ion binding)Coactosin-like protein (defense response & actin binding )Apolipoprotein C-II (cholesterol efflux)Isoform 2 of Pericentrin (calmodulin binding)
Results

Non diabetic glomerular disease groups
Functional classification of the identified glomerular diseases urinary proteins
Results

Comparison of glomerular diseases urinary proteins
Results

Comparison of glomerular disease groups with Control group
Results

FSGS(457)
MCD(307)
LN(546)
MGN(825)
72
Comparison between intra-glomerular diseases
Results
Comparison of intra glomerular diseases unique proteins control
proteome
Control Groupproteins
Intra GD unique proteins
GD unique proteins
MCD 271 43 40
MGN 271 462 453
FSGS 271 101 99
LN 271 126 113

Renal Tubular Acidosis (RTA)group
Functional classification of RTA group urinary proteome and comparison with control group
A B
C
Results

Comparison of RTA proteome with Control and glomerular disease groups
1289546
271
Results

Venn diagram comparing of urinary proteome studies on DN
P V Rao et al. 2007 (2DIGE (LC-
MS/MS)approach)
Elisa et al. 2008 (2DE- ESI-Q-TOFMS/MS approach)
20
7
13 14
320
5462
Our study (SDS-PAGE;LC-MS/MS (Orbitrap)
Discussion
Protein identifications from the current study were compared to two other studies (P V Rao et al. 2007 and Elisa et al. 2008) that were carried out using high-resolution mass spectrometers. A total of 273 proteins were unique to this study, whereas 21 proteins were unique to P V Rao et al. and 14 were unique to Elisa et al.

Identified proteins with known functions on DNProtein known functions on DN
Hemopexin(HPX )
Higher levels were observed in type 2 diabetes (Campenhout et al). HPX activated after certain proinflammatory conditions leading to proteinuria and glomerular alterations by altering glomerular filtration barrier (Bakker et al).
VDBP VDBP deficiency inhibits the insulin secretary response (Baier et al). suggesting its possible role in the immunopathogenesis and progression of the DN (Rao et al). In DN, urinary excretion of VDBP may be due to glomerular hyperfiltration.
Zinc-α2-glycoprotein (ZAG)
One of the most abundant urinary protein in DN (Rao, Elisa , Kumar & Sanju et al.). stimulates lipid degradation in adipocytes. urinary ZAG might be related to the pathogenesis in glomerular basement membrane of DN.
α2-HS-glycoprotein
Acts as potent circulating inhibitor of calcium phosphorus precipitation. Deficiencies contributes to vascular calcification in DN (RAJNISH et al). may offer potential for future therapeutic approaches .
alpha 1-AT &alpha 2-MG
glomerular walls deposition was observed in DN patients.
Discussion

Protein known functions on DN
Glutathioneperoxidase
Lower levels was observed in early stage nephropathy . Lower levels maybe due to oxidative stress occurs at an early stage of nephropathy.
Factor H Could inhibit the over-expression of extracellular matrix in mesangialcells induced by high glucose, which showed the renal protectivefunctions .
Apolipoprotein A-IV
In T2DM increased levels were found mainly related tohypertriglyceridemia and a lesser extent to HDL cholesterol level (Vergeset al). Increased concentrations of apoA-IV in CKD suggest a metabolicrole of antiatherogenic property.
Gelsolin Regulates insulin secretion and also has an role in β-cell survival andcould be a major player in the development of type 2 diabetes (Yermen etal).Gelsolin maintains an organized actin cytoskeleton of podocyte. Reducesthe formation of malondialdehyde adducts, maintain a normaldistribution of nephrin in the glomeruli and provides protection at theonset of proteinuria and plays an important renoprotective role innephritis (Liu et al).
Discussion

Protein known functions on DN
Kininogens (KKS) In the kidney, components of the KKS regulate glomerularhemodynamics and tubular function. The suppressed Kininogenswithin podocytes under diabetic condition was associated withpodocyte apoptosis (Kwak at al).
Inter-α-trypsininhibitor heavychain H1 (ITIH1)
Inhibits calcium oxalate crystallization, also plays a role in stabilizinghyaluronan in the renal interstitial matrix (Evan et al). ITIH1 does nothave a direct role on DN but it has an anti-proteolytic activities andplay an anti-inflammatory role.
Vitronectin In diabetic patients with NA and MIA, plasma concentrations ofvitronectin were significantly higher than those of control subjectsand in diabetic patients with CRF were significantly lower than thosewith normal renal function (Morioka at al).Decreased because of its accumulation in sclerotic glomeruli
Extracellularmatrix proteins(ECM)
Hyperglycemia stimulate extracellular matrix protein synthesis bothin mesangial and endothelial cells. DN is characterized by excessiveaccumulation of extracellular matrix proteins in the kidney (Ha etal). ROS play a central role in the extracellular matrix synthesis anddegradation in the glomeruli and tubulointerstitium leading to renaldiseases .
Discussion

Protein known functions on DN
Myoglobin Glycation-induced modification of myoglobin induces increasedformation of free radicals. Free myoglobin in circulation, if becomesglycated, may pose a serious threat by eliciting oxidative stress (Roy atal).
Junctionaladhesionmolecule-A(JAM-A)
Hyperglycemia down regulates JAM-A and increases glomerularendothelial permeability. JAM-A may regulate albumin extravasationat the glomeruli and play a role in the initiation of DN. (Hara et al).It may be a useful marker of the development of the disease.
Angiotensin The high-glucose in diabetes increases Ang II production by renal cells,which stimulates TGF- 1 secretion, leading to increased synthesis anddecreased degradation of matrix proteins, thus producing matrixaccumulation.
C-reactiveprotein (CRP)
CRP is associated with nephropathy and GBM thickening, suggesting arole for inflammation in the pathogenesis of diabetic glomerulopathy(Vestra et al).
Discussion

• Ghiggeri et al (1987) confirmed that albumin was a major determinant ofurinary excretion in MCD.
• In 1999 Cutler et al. performed 2-DE analysis and identified two LMWrange proteins; α2u-globulin and glial fibrillary acidic protein and highermolecular weight range proteins were albumin, transferrin, and vitaminD-binding protein.
• Except glial fibrillary acidic protein, all the remaining proteins wereidentified in our study.
• More than 40 unique proteins were reported for MCD.
Minimal change disease (MCD)
Comparison with Published data on urinary proteome of non-diabetic Glomerular diseases:
Discussion

• Branten et al. in 2004 have done a validation study on β2-Microglobulin andIgG by using ELISA. β2-Microglobulin was identified and IgG was completelydepleted in our study.
• In 2007, Ngai et al. performed urinary proteome profile of a rat model using2-DIGE and MALDI-TOF-MS. Albumin, α1AT, preprohaptoglobin, liver-regeneration-related protein, transthyretin, E-cadherin, MPP7, tropomyosin,kallikrein, and α-2 globulin were identified. Among these proteins serumalbumin, α -1-AT, transthyretin, E-cadherin, kallikrein, and α-2 globulin werealso identified in our study.
• In MGN we could generate highest proteome data (825 proteins), of whichmore than 600 proteins were uniquely identified in our study.
Membranous glomerulonephritis (MGN)
Discussion

• Musante et al. in 2002 identified fibulin, apo J, vitronectin, albumin, fibrinogen,and mannan-binding lectin-associated serine protease. Except apo J all remainingproteins were identified in our study.
• In 2004 Thongboonkerd et al. has reported growth hormone, immunoglobulinlight and heavy chains were specific to FSGS. Except GH, remainingimmunoglobulin light and heavy chains were identified in our study.
• Shui et al. in 2006 observed that fibronectin (FN) in blood acts as an initiator ofFSGS in mouse model. serum and urine FN could serve as useful biomarkers formonitoring the progression of FSGS. This protein was also identified in our study.
• Same group in 2007 , has done functional studies on osteopontin (OPN) on Balb/cmice model. They concluded that, the detection of OPN either in glomeruli or inurine could be helpful in prognosis of FSGS. We identified this protein also in ourstudy.
Focal segmental glomerulosclerosis (FSGS)
Discussion
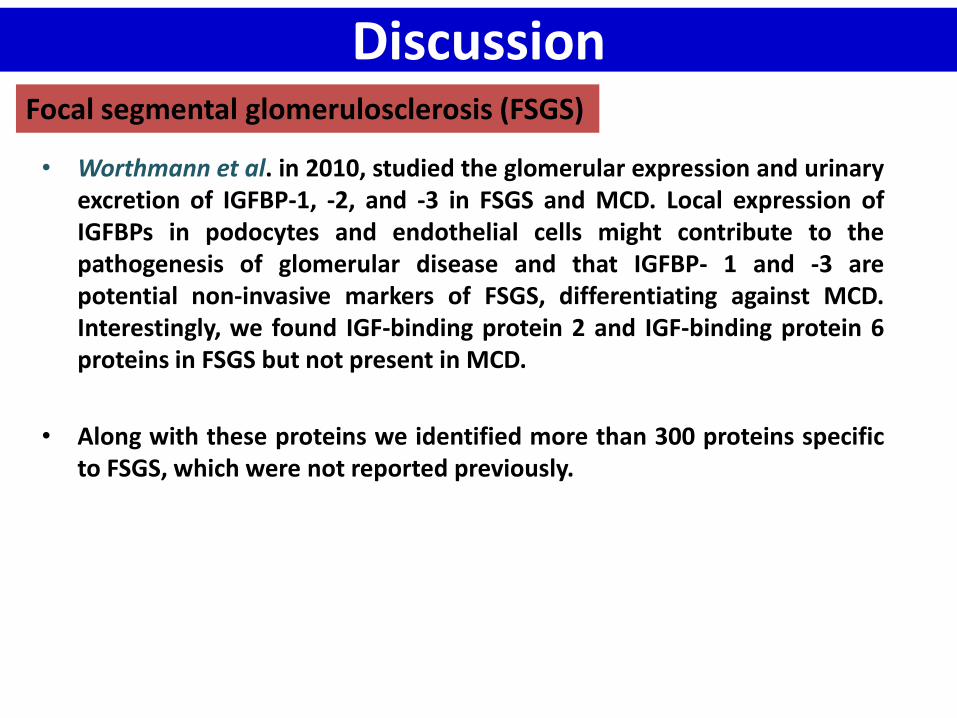
• Worthmann et al. in 2010, studied the glomerular expression and urinaryexcretion of IGFBP-1, -2, and -3 in FSGS and MCD. Local expression ofIGFBPs in podocytes and endothelial cells might contribute to thepathogenesis of glomerular disease and that IGFBP- 1 and -3 arepotential non-invasive markers of FSGS, differentiating against MCD.Interestingly, we found IGF-binding protein 2 and IGF-binding protein 6proteins in FSGS but not present in MCD.
• Along with these proteins we identified more than 300 proteins specificto FSGS, which were not reported previously.
DiscussionFocal segmental glomerulosclerosis (FSGS)

• Oates et al. in 2005 performed 2-DE fallowed by MALDI. identified; α-1 acidglycoprotein, zinc α-2 glycoprotein, IgG κ light chain and α-1 microglobulin. In ourstudy, except IgG κ light chain, all remaining proteins were present.
• In 2007, Rovin et al. applied SELDI-TOF MS to urinary proteome of LN. They foundadiponectin and adipocyte-derived cytokine, was present in the urine. We haveidentified adiponectin but not adipocyte-derived cytokine.
• Zhang et al. in 2008 identified hepcidin, α1-AT and albumin fragments by usingSELDI-TOF MS in urine samples LN patients. Except hepcidin remaining two proteinswere identified in our study.
• Suzuki et al. in 2009 identified lipocalin-type prostaglandin-D synthetase, α1-acid-glycoprotein, Tf, Cp, and albumin fragments by using SELDI approach. Three proteins(α1-acid-glycoprotein, ceruloplasmin and albumin) were identified in our study.
• Even for LN, more than 300 proteins were uniquely identified to our study.
Lupus Nephritis (LN)
No proteomic studies on RTA
Discussion

• Identifying biomarkers for various glomerular diseases is becoming one of the mostvaluable and productive subfields in proteomic studies of kidney diseases.
• Mischak et al. (2004 ) have identified urinary proteome patterns with CE-MS forglomerular diseases. They compared urine samples from patients with MCD, FSGS,MGN and healthy controls to identify peptide expression patterns. The classificationaccuracy was 71.4% for MCD and FSGS and 92.9% for MGN.
• Chalmers et al. (2005) used CE-MS to classify MCD, MGN, FSGS, IgA nephropathyand DN by using urinary peptidome patterns. Some of the candidate biomarkerswere identified by FT-ICR-MS as albumin fragments.
• Varghese et al. (2007) profiled the urinary proteome of FSGS, LN, MGN and DN by 2-DE coupled with MALDI-TOF-MS. Identified Orosomucoid, Tf, α-1 microglobulin, zinc α-2 glycoprotein, α-1 AT, complement factor B, Hp, transthyretin, RBP, albumin, and hemopexin proteins commonly. But no single spot that could differentiate all four diseases.
• David et al. in 2010 identified 634 peptides by using CE-MS in urine of CKD patients. He also found most of the proteins commonly present in all the CKDs.
• We could distinguish each GD by identifying novel (unique) proteins for each group.
Distinguishing between different glomerular diseases
Discussion

Protein known functions on MCD
α1-Acid glycoprotein
A minimal change nephrosis was induced in rats by intraperitonealinjection of puromycin aminonucleoside. When human α1-acid glycoprotein was injected at 600 mg/kg intravenously on experimental days 6, 7, 8, and 9 into rats, urine protein output decreased significantly, and the number of podocytic foot processes increased significantly (Muchitsch et al). Its therapeutic role on nephrosis is characterized by a loss of sialic acid and a loss of negative charge, thereby leading to a loss of permselectivity.
Identified proteins known functions on glomerular diseases
Discussion

Protein known functions on MGN
Enolase Renal expression of α-enolase was increased in MGN glomeruli.Podocyte α-enolase may be considered the fourth auto-antigen ofidiopathic MGN in humans (Bruschi et al). α-enolase may beimplicated in the pathogenesis of human MGN.
Vacuolarprotein
The appearance of epithelial vacuolation coincides with an increasedfiltration of protein in IMGN (Toth et al). It may be an importanthistological marker when diagnosing the level of severity ofglomerular lesions.
β-2-microglobulin
Renal outcome of urinary β2m is more related to the presence andthe extent of tubulointerstitial injury than to glomerular pathology(Amanda et al). Uβ2m reflects the severity of tubulointerstitial injuryand helps early stage diagnosis.
Fatty acid-bindingprotein (FABP)
Urinary FABP’s are increased in patients with iMGN. It Found inproximal and distal tubuls. The urinary excretion of FABP may berelevant to tubular stress and injury (Julia et al). FABP could thereforebe an early sign of tubular stress and its urine excretion may increasebefore other markers do.
Discussion

Protein known functions on FSGS
Angiopoietin Overexpression of Angiopoietin in rats; induced nephrotic rangeproteinuria, loss of GBM charge and foot process effacement (Lionel etal).
ApolipoproteinE
apoE regulates growth as well as survival of mesangial cells.(Guangping et al).apoE was dysregulated in FSGS characterized by high levels in serum
and urine and absence in glomeruli (Bruschi et al).
β2-glycoproteinI
β2GPI complexes, generated by oxidative stress, might be a novel riskfactor and a diagnostic marker for the development of CKD (Kasaharaet al). β2GPI may also play an important role in the development ofdyslipidemias associated with the progression of CKD.
Fatty acid-binding protein1
In FSGS urinary FABP1 increased significantly and gradually along withthe progression of interstitial injury (Noiri et al). Urinary FABP1correlated with tubulointerstitial injury of fibrotic are and macrophageinfiltration. These observations support that the urinary FABP1 may bea good indicator to reflect tubulointerstitial injury in FSGS.
Discussion

Protein known functions on FSGS
Fibronectin(FN)
FN in blood acts as an initiator of the development of FSGS in mousemodel after leaking from the blood to the basement membrane andmesangial area. FN can bind to various ECM proteins and cell receptors(Shui et ak.). Urine FN proteins could serve as useful biomarkers formonitoring the progression of FSGS.
α-actinin-4 Mutant α-actinin-4 binds filamentous actin more strongly than wild-type . Regulation of the actin cytoskeleton of glomerular podocytesmay be altered in FSGS patients (Kaplan et al). α-actinin-4 also plays animportant role in coupling actin nucleation to assembly at cadherin-based cell-cell adhesive contacts (Vivian et al).
Osteopontin(OPN)
The FSGS model showed an increased expression of OPN in earlyglomerular epithelial hyperplasia lesion and correlated with theincreases of glomerular sclerosis and urine OPN protein levels (Shui etal). Urinary OPN may acts as an injury marker for FSGS.
Type-IVcollagen
IHC revealed accumulation of type IV collagen in the sclerotic matrix ofFSGS (Razzaque et al).
Discussion

Protein known functions on LN
Histones Histone H2A, H1 + H3, H4 positively stained only with LN, but not withNon-SLE renal biopsies (Akashi et al). These results suggest thathistones may play an important role in diagnosis and induction of LN.
Prostaglandin-H2 D-isomerase(PGDS)
PGDS has been reported to have a strong correlation levels with theseverity of LN in mice . A urinary proteomic study also revealed that,PGDS present in active LN compared to non-LN glomerular diseases andhealthy controls (Somparn et al).
superoxidedismutase(SOD)
LN was associated with higher glomerular SOD (Wang et al).Urinary SOD correlates well with GN score and renal disease activityindices, performing better than 24-hour proteinuria and BUN (Wu et al).
Adiponectin Adiponectin can modulate inflammation, induce MCP-1 production andplays an essential role in remodeling the tubulointerstitium.Adiponectin levels in urine found higher in LN, compared to healthy andrenal disease controls and patients with active or inactive nonrenal SLE(Rovin et al).It can acts as a prognostic and diagnostic marker for LN.
Discussion

Protein known functions on LN
Growth Factor Overexpression of IGF-I and IGFBP-2 were observed in LN glomeruli ofmouse kidney (Suzuki et al). Urinary LMW proteins of GF may be usedas biomarkers for LN.
Ceruloplasmin(CP)
Cp plays a critical physiological role in controlling the rate of ironefflux from cells with mobilizable iron in LN kidney (Suzuki et al).Urinary Cp concentrations differ only with LN activity rather thanextrarenal diseases.
Annexins Elevated expression of Annexin-A1 and Annexin-A2 observed in LNpatients. Annexin-A1 mediated the anti-inflammatory actions ofglucocorticoids in many experimental models (Ayoub et al, ) and Ao etal. found that Annexin-A2 was more prevalent in SLE patients.
Discussion

Protein known functions on CKDs
α2-Macroglobulin(α2M)
Deposition of α2M in glomerular diseases indicates that α2M mayplay an active role in the modulation of local inflammatory reactionand tissue repair (Yang et al). Urinary excretion of α2M, may be apotential prognostic and diagnostic marker in proteinuricglomerulopathies.
Topoisomerases
Topoisomerase I & II were strongly expressed in RPGN and LN,whereas MCD and MGN showed low levels in both glomerular andtubular compartments.There was also a positive correlation with serum creatinine levels andan inverse association with proteinuria and NS (Lilija et al).Assessment of topoisomerases may help in diagnosis.Because of their low nephrotoxicity, topoisomerase inhibitors mightprove to be useful therapeutic agents in the treatment of renaldiseases.
Uromodulin In CKD uromodulin enter the renal interstitium either by basolateralsecretion or urinary back-leakage in damaged tubuli and stimulatescells of the immune system and thereby causes inflammation andprogression of disease (Lhotta et al).
Discussion

Protein known functions on CKDs
Aminopeptidase N (APN)
APN is located in renal microvillar membrane.Damage of tubules in primary glomerulonephritis, LN, and DN isaccompanied by a release of APN. Urinary APN was found significantlyelevated in glomerulonephritis patients (Birgit et al). APN might be ofdiagnostic value for the detection of early stage of disease.
Angiotensinogen (AGT)
Urinary AGT levels were enhanced in CKD patients compared withcontrol subjects. Urinary AGT levels were positively correlated withUAlb/UCre, excretion of sodium, UPro/UCre and S.creatinine andcorrelated negatively with eGFR (Hiroyuki et al).Urinary AGT was associated with declined kidney function andincreased albuminuria (Katherine et al.)
Cubilin Cubulin is located within the epithelium of kidney, plays a role innormal proximal tubule endocytic reabsorption of filtered albumin.Megalin/ cubilin-mediated endocytosis by proximal tubule cells ofincreased quantities of filtered proteins in glomerular diseases appearsto evoke cell stress responses resulting in increased inflammatorycytokines leading to tubulointerstitial inflammation and fibrosis(Nakhoul et al).Cubilin may acts as marker for tubular injury in CKDs.
Discussion

Protein known functions on tubular diseases
Uteroglobin The highest values were observed in proximal tubulopathies (Ascensiónet al). It seems to be more sensitive than other tubular markers due toits very low concentration in the tubular fluid, as illustrated by itsabsence from the urine in many of the healthy individuals.
Galectins When galactins introduced to a mice, resulted in significantpreservation of tubules and reduced interstitial fibrosis, with decreasedmyofibroblast activation and collagen I expression (Dang et al).
Endoglin Interstitial expression of endoglin is associated with increasedrenal damage.There was also a positive correlation between mesangial cell stainingfor endoglin and interstitial endoglin expression (Roy et al).Endoglins may contribute to renal scarring by increased binding of TGF-β which would be marker for the initial tubular damage.
Discussion

Protein known functions on tubular diseases
AnnexinA1(ANXA1)
ANXA1 has potent anti-inflammatory effects and protects against ischemia/reperfusion injury. ANXA1 treatment reduced Tacrolimus induced tubular dilatation and macrophage infiltration (Araujo et al). Since ANXA1 is having a protecting effect of tubular injury, its urinary estimation may help in treatment monitoring.
cofilin 1 Cofilin is a ubiquitous actin-binding protein required for the reorganization of actin filaments.Cofilin 1 have been demonstrated to be involved in metabolic alkalosis, polyuria, and renal tubular injury (Thongboonkerd et al).
lipocalins Lipocalin are involved in inflammation and detoxification processes. Increased Urinary neutrophil gelatinase associated lipocalin (uNGAL) was observed in Patients with acute tubular necrosis (ATN) (Claudia et al). uNGAL levels may be useful in the diagnosis of ATN. When using this kidney biomarker, UTI should be ruled out because, in UTI uNGAL levels may increase in urine.
Discussion

Protein known functions on tubular diseases
Osteopontin Tubular osteopontin expression has been shown to be elevated in avariety of animal models of tubulointerstitial renal disease (Eddy et al).Osteopontin levels were closely correlated with the degree oftubulointerstitial injury (Pichler et al).Urinary Osteopontin may acts as markers of early phase tubulardamage.
Vimentin In normal rats , it is expressed in glomeruli and renal vasculature, butnot in tubular cells (Grone et al).Renal tubular injury was documented as more vimentin-positivetubules (Nangaku et al).Vimentin could perhaps be regarded as an indicator of the regeneratingand proliferating activity of tubular lesions (Gröne et al).Vimentin may be marker of tubular epithelial cell regeneration afterinjury and marker of tubular injury.
Discussion

• Proteomic analysis of urine with Orbitrap (LC-MS/MS) is a fast and sensitiveapproach for identification of proteins.
• We identified ≥ 300 proteins in each group using SDS-PAGE; LC-MS/MS (Orbitrap)approach
• More than 100 proteins were found to be unique to each group of disease.
• The urinary proteome differentiates healthy individuals from diabetes and DN.
• It also distinguishes patients with DN from patients with non diabetic glomerulardiseases.
• Also distinguishes GDs form tubular diseases.
Summery

• Some of the proteins representing specific group may lead to better understanding ofdisease pathophysiology.
• Urine is the best source for indentifying disease specific markers, because of its non-invasive way of collection.
• Proteins, we have identified were not only having role in early diagnosis but also havea role in disease pathophysiology and therapeutics.
• In our study, urinary proteomics enabled identification of new biomarkers for earlydetection of CKD with promising clinical value.
• Further validation of this proteins, may provide useful and potential biomarkers forCKD that could be applied as powerful tool in clinical diagnostics, treatmentmonitoring and prognosis.
• Urinary biomarkers can’t immediately replace renal biopsy, which remains the goldstandard for the diagnosis of glomerular diseases. However, urinary biomarkers offermany opportunities for being used as the complementary diagnostic or prognostictool, when renal biopsy is limited or contraindicated.
Summery

Diagnostic Assay Implementation
Design and implement biomarker based clinical assay
IdentificationPurify and identify biomarkers
ValidationSelect biomarker with highest predictive value
DiscoveryDetect multiple candidates
Study DesignDefine the clinical question,
Sample and workflow
The Biomarker Discovery Process
Summery

Disease threshold
Time
Molecular changes
Biochemicalchanges
Clinical symptoms
Dis
eas
e p
rogr
ess
ion
Molecular based diagnosis always better for early diagnosis
Summery
Limitations of the study
• Could not validate the identified markers.
• At this stage we cannot say that those proteins can be used as diagnostic markers unless these proteins are further validated on large scale sample size to confirm the biomarkers
• Quantitation was not done for the novel molecules.

Future directions • The proteins we identified can be checked in different stages of diseases
(eg. Lupus nephritis class I, II, III etc.).
• The presence and disappearance of a particular protein following treatment may be used for response rate and prognosis of the disease.
• Our urinary proteomic studies has given the roadmap for several further investigations on our identified proteins; like validation, functional studies, in which some proteins may be useful early detection biomarkers, some proteins may have role in disease pathogenesis and therapeutic interventions.
• Characterization and validation of biomarkers are needed to make use into clinical practice.

Supporting informationMS-MS m/z spectra

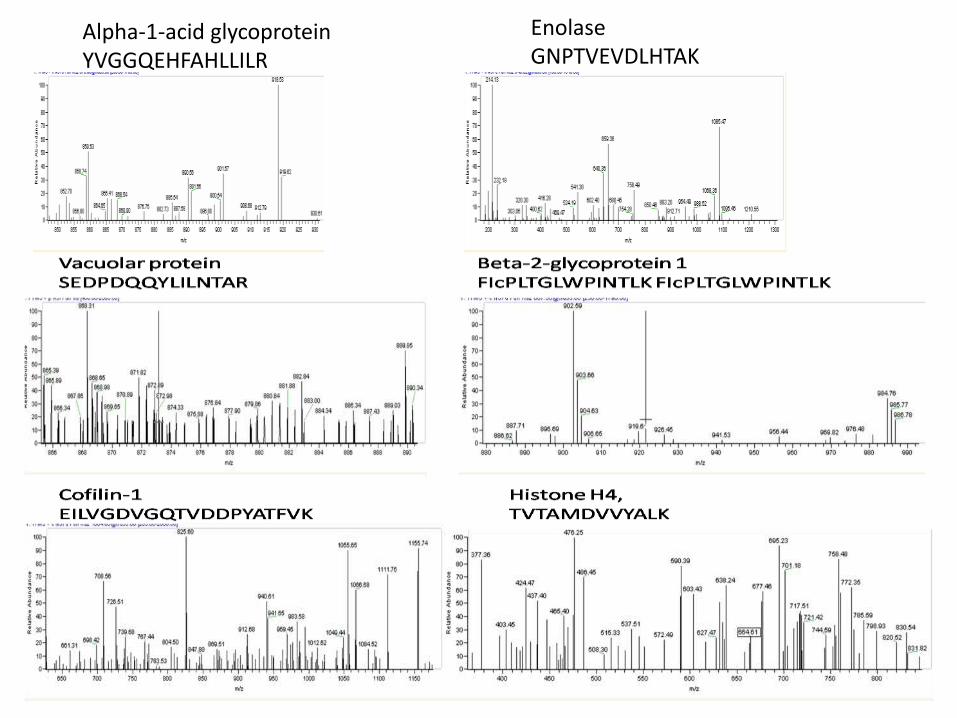
Alpha-1-acid glycoprotein YVGGQEHFAHLLILR
EnolaseGNPTVEVDLHTAK

peptide distribution sample in duplicate runs
Controls run 1_1 Controls run 1_2Controls run 2_1 Controls run 2_2
Controls run 3_1 Controls run 3_2 Controls run 4_1 Controls run 4_2

Controls run 5_1 Controls run 5_2
Controls run 7_1 Controls run 7_2
Controls run 6_1 Controls run 6_2
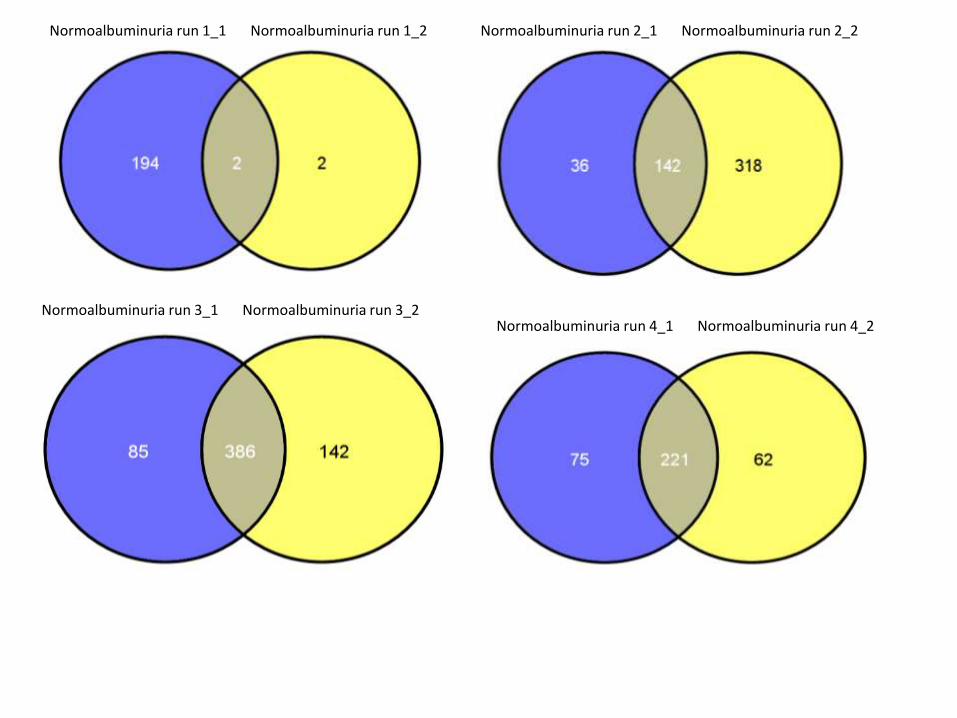
Normoalbuminuria run 1_1 Normoalbuminuria run 1_2 Normoalbuminuria run 2_1 Normoalbuminuria run 2_2
Normoalbuminuria run 3_1 Normoalbuminuria run 3_2Normoalbuminuria run 4_1 Normoalbuminuria run 4_2

Normoalbuminuria run 5_1 Normoalbuminuria run 5_2
Microalbuminuria run 1_1 Microalbuminuria run 1_2 Microalbuminuria run 2_1 Microalbuminuria run 2_2

Macroalbuminuria run 1_1 Macroalbuminuria run 1_2 Macroalbuminuria run 2_1 Macroalbuminuria run 2_2

Accession Description ΣCoverage Σ# ProteinsΣ# Unique Peptides
Σ# Peptides Σ# PSMs Max. Score # AAs MW [kDa] calc. pI
IPI00001429 Protocadherin beta-4 1.51 1 1 1 1 2.47 795 87.2 5.20
IPI00002188 Brefeldin A-inhibited guanine nucleotide-exchange protein 1
0.76 1 1 1 1 2.30 1849 208.6 5.85
IPI00003919 Isoform 1 of Glutaminyl-peptide cyclotransferase
11.08 4 3 3 9 11.65 361 40.9 6.61
IPI00004500 NEDD4-binding protein 3 3.49 1 1 1 1 2.98 544 60.4 8.10
IPI00005721 Neutrophil defensin 1 32.98 2 1 1 5 12.60 94 10.2 6.99
IPI00007800 Angiopoietin-related protein 2
9.74 2 3 3 3 5.88 493 57.1 7.53
IPI00007983 Isoform 3 of PDZ and LIM domain protein 2
8.47 1 1 1 1 2.86 366 39.2 8.90
IPI00008753 Metallothionein-1X 19.67 6 1 1 1 3.20 61 6.1 7.96
IPI00009823 Carboxypeptidase A1 12.65 5 4 4 9 13.78 419 47.1 5.76
IPI00009901 Nuclear transport factor 2 33.86 1 2 2 4 12.67 127 14.5 5.38
IPI00010105 Eukaryotic translation initiation factor 6
13.06 3 2 2 3 6.10 245 26.6 4.68
IPI00010156 Mitogen-activated protein kinase 4
6.47 1 1 1 1 2.85 587 65.9 5.45
IPI00010182 Isoform 1 of Acyl-CoA-binding protein
18.39 7 1 1 1 2.55 87 10.0 6.57
IPI00010675 Trefoil factor 2 21.71 1 2 2 4 7.97 129 14.3 5.81
IPI00011685 Collagen alpha-1(X) chain 4.71 1 1 1 1 2.60 680 66.1 9.67
IPI00012587 Phosphatidylinositol-3,4,5-trisphosphate 3-phosphatase and dual-specificity protein phosphatase PTEN
9.43 1 1 1 2 3.36 403 47.1 6.37
IPI00012760 Leptin 7.78 1 1 1 1 3.80 167 18.6 6.37
IPI00013303 Limbic system-associated membrane protein
4.73 2 1 1 2 3.99 338 37.4 6.98
Partial list of DN unique proteins, compared with C, DM, MA, GD
Supplementary data

Partial list of Unique proteins for MCD
Accession Description ΣCoverageΣ#
ProteinsΣ# Unique Peptides
Σ# Peptides Σ# PSMs Max. Score # AAs MW [kDa] calc. pI
IPI00553177.1 Isoform 1 of Alpha-1-antitrypsin 56.22 4 20 20 657 295.59 418 46.7 5.59
IPI00643525.1 Uncharacterized protein 17.37 11 19 19 72 49.93 1744 192.6 7.08
IPI00964635.1 31 kDa protein 24.64 7 4 4 6 10.25 276 30.8 4.81
IPI00746033.1 47 kDa protein 16.95 3 4 4 7 15.64 419 47.1 7.46
IPI00917825.2 cDNA FLJ38812 fis, clone LIVER2006469, highly similar to PLASMA SERINE PROTEASE INHIBITOR
15.36 2 4 4 6 9.51 332 37.6 9.23
IPI00969537.1 ACTA2 protein (Fragment) 10.30 12 1 3 12 9.71 330 36.8 5.35
IPI00796636.1 Hemoglobin (Fragment) 45.71 9 3 3 9 12.48 105 11.5 6.37
IPI00966427.1 Uncharacterized protein 30.52 6 3 3 6 9.08 154 17.1 7.49
IPI00641244.1 11 kDa protein 21.65 3 1 2 3 5.85 97 10.7 8.72
IPI00030385.5 cDNA FLJ13813 fis, clone THYRO1000358, moderately similar to SELENIUM-BINDING LIVER PROTEIN
10.64 9 2 2 4 6.52 235 25.9 6.68
IPI00291560.4 Isoform 1 of Arginase-1 9.32 2 2 2 5 7.44 322 34.7 7.21
IPI00554556.1 Isoform C of Protein CutA 26.28 4 2 2 2 3.23 156 16.8 5.21
IPI00888712.3 Putative beta-actin-like protein 3 9.07 26 1 2 14 11.85 375 42.0 6.33
IPI00022542.1 Rho-associated protein kinase 1 1.62 3 1 2 2 2.65 1354 158.1 5.90
IPI00784332.4 Tubulin alpha-3C/D chain 10.74 20 2 2 3 6.47 326 35.9 6.11
IPI00789173.1 Uncharacterized protein 17.52 3 2 2 8 5.31 137 14.8 5.54
IPI00645646.1 17 kDa protein 7.59 6 1 1 6 3.55 158 17.3 9.74
IPI00879148.1 18 kDa protein 8.33 4 1 1 2 3.73 168 18.4 7.99
IPI00947319.1 28 kDa protein 6.37 6 1 1 3 6.10 251 27.6 7.90
IPI00793097.1 8 kDa protein 23.88 2 1 1 1 2.46 67 7.8 6.52
IPI00004901.5 cDNA FLJ20242 fis, clone COLF6369 8.02 5 1 1 2 4.02 162 17.8 7.43
IPI00384791.1 cDNA FLJ38599 fis, clone HEART2003432, weakly similar to ENDOGLUCANASE Z
2.73 1 1 1 2 2.71 660 73.9 5.08
IPI00514248.3 cDNA FLJ53673, highly similar to Palmitoyl-protein thioesterase 1
5.60 3 1 1 1 2.77 232 26.0 6.54
IPI00967010.1 cDNA FLJ58367, weakly similar to LIM domain only protein 7
1.68 1 1 1 1 2.75 833 94.1 6.87
IPI00893729.1 Ferritin (Fragment) 14.85 2 1 1 2 4.55 101 11.2 8.78
IPI00377087.4 Gelsolin 6.91 6 1 1 4 7.04 188 20.8 4.84
IPI00640129.2 Heat shock protein 90kDa alpha (Cytosolic), class B member 1
9.09 9 1 1 2 2.64 154 18.0 6.02
IPI00217330.2 Isoform 2 of Oligoribonuclease, mitochondrial (Fragment)
3.52 2 1 1 1 2.37 199 23.2 6.09
IPI00000769.2 Kinesin-like protein KIF22 1.50 1 1 1 1 2.87 665 73.2 9.45
IPI00003944.1 Lipoamide acyltransferase component of branched-chain alpha-keto acid dehydrogenase complex, mitochondrial
2.90 1 1 1 1 2.50 482 53.5 8.51
IPI00927864.2 Malate dehydrogenase 6.93 3 1 1 4 3.69 231 24.6 7.99
IPI00302329.1 Myosin-8 0.83 1 1 1 1 2.87 1937 222.6 5.74
IPI00556271.1 NHL repeat-containing protein 3 isoform b 4.29 2 1 1 3 3.52 280 31.0 6.79

Partial list of Unique proteins for MGNAccession Description ΣCoverage Σ# Proteins Σ# Unique Peptides Σ# Peptides Σ# PSMs Max. Score # AAs MW [kDa] calc. pI
IPI00843765.1 Isoform 3 of Spectrin alpha chain, brain 15.91 5 29 29 69 72.61 2452 282.1 5.34
IPI00005614.6 Isoform Long of Spectrin beta chain, brain 1
11.80 3 19 21 59 54.12 2364 274.4 5.57
IPI00006482.1 Isoform Long of Sodium/potassium-transporting ATPase subunit alpha-1
21.90 9 9 17 66 59.85 1023 112.8 5.49
IPI00657691.2 Isoform 5 of Dynamin-1 20.68 18 15 15 67 58.51 851 95.8 6.76
IPI00302840.2 Sodium/potassium-transporting ATPase subunit alpha-3
21.72 10 6 15 78 72.01 1013 111.7 5.38
IPI00013683.2 Tubulin beta-3 chain 48.89 5 7 15 208 139.04 450 50.4 4.93
IPI00909140.7 cDNA FLJ56903, highly similar to Tubulin beta-7 chain
43.75 9 1 14 193 122.63 464 52.0 4.92
IPI00084828.1 Isoform 1 of Syntaxin-binding protein 1 26.77 3 14 14 48 42.77 594 67.5 6.96
IPI00007752.1 Tubulin beta-2C chain 43.60 13 1 14 251 179.97 445 49.8 4.89
IPI00640401.1 ATPase, Na+/K+ transporting, alpha 2 (+) polypeptide
18.93 9 2 13 44 45.16 1009 110.8 5.59
IPI00939595.1 Isoform 2 of Heat shock cognate 71 kDa protein
37.32 26 11 13 48 49.84 493 53.5 5.86
IPI00936987.1 cDNA FLJ58682, highly similar to Vesicle-fusing ATPase
15.29 2 11 11 28 30.72 739 82.0 6.81
IPI00784295.2 Isoform 1 of Heat shock protein HSP 90-alpha
17.21 11 6 11 44 42.01 732 84.6 5.02
IPI00790702.1 Beta adaptin subunit 16.25 8 6 10 35 39.70 880 98.1 5.24
IPI00386271.4 Calcium-binding mitochondrial carrier protein Aralar1
19.17 6 10 10 21 24.85 678 74.7 8.38
IPI00647102.4 cDNA FLJ42590 fis, clone BRACE3009708, highly similar to Sodium/potassium-transporting ATPase alpha-2chain
16.63 6 1 10 37 36.87 920 101.2 5.63
IPI00382844.1 Aconitase (Fragment) 17.00 2 4 9 29 28.38 600 65.3 7.84
IPI00257508.4 Dihydropyrimidinase-related protein 2 21.85 4 7 9 52 44.78 572 62.3 6.38
IPI00218207.2 Isoform 2 of Spectrin beta chain, brain 2 4.95 3 7 9 16 19.24 2365 268.1 6.11
IPI00220667.3 Isoform 4 of Hexokinase-1 11.49 10 9 9 33 36.66 905 101.0 6.96
IPI00953417.1 cDNA FLJ53012, highly similar to Tubulin beta-7 chain
57.20 1 0 8 98 71.24 243 27.4 4.49
IPI00456969.1 Cytoplasmic dynein 1 heavy chain 1 2.13 1 8 8 14 16.17 4646 532.1 6.40
IPI00251507.2 Isoform IB of Synapsin-1 16.44 2 7 8 38 37.68 669 70.0 9.88
IPI00010154.3 Rab GDP dissociation inhibitor alpha 25.73 5 4 8 35 23.00 447 50.6 5.14
IPI00657774.1 Syntaxin 1B alternative isoform deltaTM 38.63 2 8 8 22 22.88 277 31.8 5.24
IPI00853283.3 54 kDa protein 20.34 3 6 7 20 22.42 472 53.6 5.05
IPI00011932.8 Heat shock 70 kDa protein 12A 13.33 4 7 7 21 16.83 675 74.9 6.77
IPI00179415.4 Isoform 1 of Serine/threonine-protein phosphatase 2B catalytic subunit alpha isoform
16.51 13 5 7 8 13.24 521 58.7 5.86
IPI00719600.5 Isoform 2 of Cytoplasmic FMR1-interacting protein 2
6.62 9 7 7 19 15.54 1253 145.6 7.05
IPI00215715.5 Isoform A of Calcium/calmodulin-dependent protein kinase type II subunit alpha
19.87 12 4 7 38 37.04 478 54.1 7.08
IPI00220281.3 Isoform Alpha-1 of Guanine nucleotide-binding protein G(o) subunit alpha
25.14 21 5 7 46 30.94 354 40.0 5.53
IPI00909560.1 Pyruvate kinase 17.22 13 7 7 30 38.63 511 55.9 7.50
IPI00216319.3 14-3-3 protein eta 29.67 7 4 6 25 29.45 246 28.2 4.84

Accession Description ΣCoverage Σ# ProteinsΣ# Unique Peptides
Σ# Peptides Σ# PSMs Max. Score # AAs MW [kDa] calc. pI
IPI00008529 60S acidic ribosomal protein P2 10.43 1 1 1 1 2.96 115 11.7 4.54
IPI00884926 alpha-1-acid glycoprotein 1 precursor
58.21 2 7 11 946 705.01 201 23.5 5.11
IPI00004957 Angiopoietin-related protein 3 2.39 1 1 1 1 3.10 460 53.6 6.70
IPI00922421 Aspartate aminotransferase 9.29 2 2 2 2 6.99 366 41.0 7.18
IPI00298828 Beta-2-glycoprotein 1 37.39 2 8 8 39 41.88 345 38.3 7.97
IPI00004101 Betaine--homocysteine S-methyltransferase 1
3.69 1 1 1 2 3.22 406 45.0 7.03
IPI00647823 Cartilage glycoprotein-39 7.24 2 1 1 2 2.56 152 16.8 6.38
IPI00925214 Caspase 12 7.58 1 1 1 2 2.48 277 31.0 5.74
IPI00643860 CC2D1A protein 3.57 3 1 1 1 2.72 532 55.6 5.87
IPI00910463 cDNA FLJ50286, highly similar to Retinal dehydrogenase 1
2.82 2 1 1 1 2.76 390 42.6 5.80
IPI00909914 cDNA FLJ50884, highly similar to Beta-hexosaminidase alpha chain
5.34 3 1 1 1 3.21 356 40.9 4.96
IPI00909841 cDNA FLJ51435, moderately similar to Cofilin-1
27.68 3 2 2 4 13.22 112 12.5 6.60
IPI00909103 cDNA FLJ51462, highly similar to TGF-beta receptor type-2
2.77 3 1 1 2 3.18 542 61.4 5.40
IPI00796411 cDNA FLJ51665, highly similar to Homo sapiens plasma glutamate carboxypeptidase (PGCP), mRNA
7.16 4 2 2 3 7.96 391 43.0 6.29
IPI00964365 cDNA FLJ52002, highly similar to Annexin A5
9.82 4 1 1 3 9.02 163 18.2 5.06
IPI00910779 cDNA FLJ52141, highly similar to 14-3-3 protein gamma
11.59 5 1 2 7 8.29 207 23.5 4.82
IPI00910519 cDNA FLJ52341, highly similar to Homo sapiens sarcoglycan, epsilon (SGCE), mRNA
5.30 7 1 1 1 2.53 396 45.0 6.13
IPI00909711 cDNA FLJ53006, highly similar to Vinculin
6.42 3 1 1 1 4.52 327 36.2 6.44
IPI00908770 cDNA FLJ53063, highly similar to Tubulin beta-7 chain
6.94 18 2 2 4 5.81 317 35.9 4.93
IPI00922361 cDNA FLJ53078, highly similar to Splicing factor, arginine/serine-rich 1
11.19 1 1 1 1 2.68 143 16.2 11.09
IPI00911039 cDNA FLJ54408, highly similar to Heat shock 70 kDa protein 1
3.75 12 2 2 3 5.16 586 63.9 5.55
IPI00645500 cDNA FLJ55526, highly similar to Complement C2
14.38 13 2 8 16 18.24 723 80.1 7.46
IPI00797452 cDNA FLJ55805, highly similar to Keratin, type II cytoskeletal 4
21.10 7 4 8 148 124.08 474 51.7 6.81
Partial list of Unique proteins for FSGS
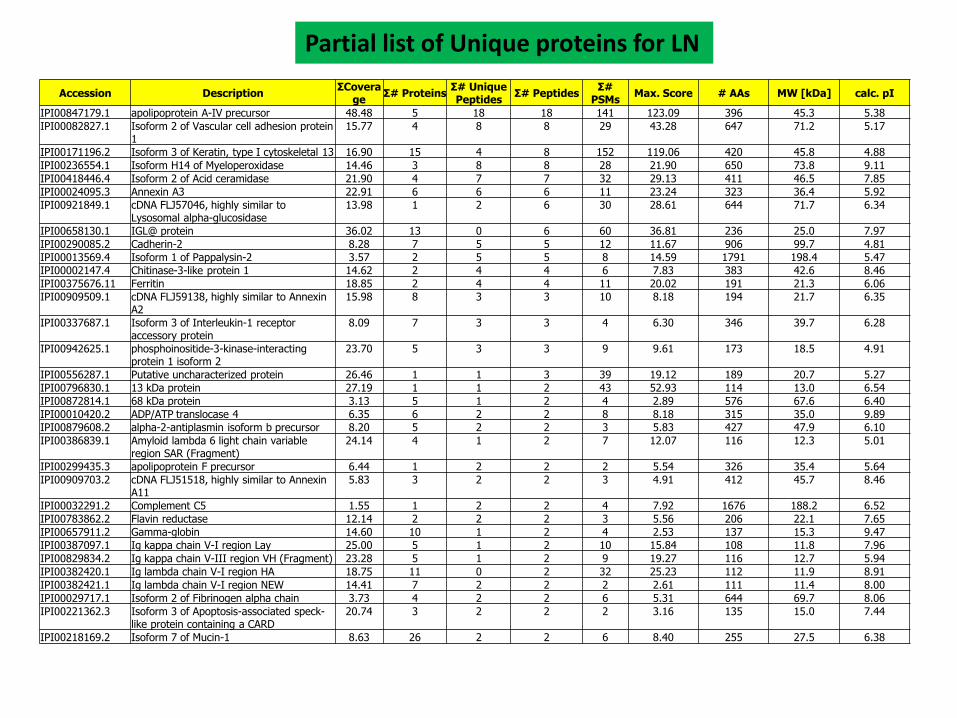
Partial list of Unique proteins for LN
Accession DescriptionΣCovera
geΣ# Proteins
Σ# Unique Peptides
Σ# PeptidesΣ#
PSMsMax. Score # AAs MW [kDa] calc. pI
IPI00847179.1 apolipoprotein A-IV precursor 48.48 5 18 18 141 123.09 396 45.3 5.38
IPI00082827.1 Isoform 2 of Vascular cell adhesion protein 1
15.77 4 8 8 29 43.28 647 71.2 5.17
IPI00171196.2 Isoform 3 of Keratin, type I cytoskeletal 13 16.90 15 4 8 152 119.06 420 45.8 4.88
IPI00236554.1 Isoform H14 of Myeloperoxidase 14.46 3 8 8 28 21.90 650 73.8 9.11
IPI00418446.4 Isoform 2 of Acid ceramidase 21.90 4 7 7 32 29.13 411 46.5 7.85
IPI00024095.3 Annexin A3 22.91 6 6 6 11 23.24 323 36.4 5.92
IPI00921849.1 cDNA FLJ57046, highly similar to Lysosomal alpha-glucosidase
13.98 1 2 6 30 28.61 644 71.7 6.34
IPI00658130.1 IGL@ protein 36.02 13 0 6 60 36.81 236 25.0 7.97
IPI00290085.2 Cadherin-2 8.28 7 5 5 12 11.67 906 99.7 4.81
IPI00013569.4 Isoform 1 of Pappalysin-2 3.57 2 5 5 8 14.59 1791 198.4 5.47
IPI00002147.4 Chitinase-3-like protein 1 14.62 2 4 4 6 7.83 383 42.6 8.46
IPI00375676.11 Ferritin 18.85 2 4 4 11 20.02 191 21.3 6.06
IPI00909509.1 cDNA FLJ59138, highly similar to Annexin A2
15.98 8 3 3 10 8.18 194 21.7 6.35
IPI00337687.1 Isoform 3 of Interleukin-1 receptor accessory protein
8.09 7 3 3 4 6.30 346 39.7 6.28
IPI00942625.1 phosphoinositide-3-kinase-interacting protein 1 isoform 2
23.70 5 3 3 9 9.61 173 18.5 4.91
IPI00556287.1 Putative uncharacterized protein 26.46 1 1 3 39 19.12 189 20.7 5.27
IPI00796830.1 13 kDa protein 27.19 1 1 2 43 52.93 114 13.0 6.54
IPI00872814.1 68 kDa protein 3.13 5 1 2 4 2.89 576 67.6 6.40
IPI00010420.2 ADP/ATP translocase 4 6.35 6 2 2 8 8.18 315 35.0 9.89
IPI00879608.2 alpha-2-antiplasmin isoform b precursor 8.20 5 2 2 3 5.83 427 47.9 6.10
IPI00386839.1 Amyloid lambda 6 light chain variable region SAR (Fragment)
24.14 4 1 2 7 12.07 116 12.3 5.01
IPI00299435.3 apolipoprotein F precursor 6.44 1 2 2 2 5.54 326 35.4 5.64
IPI00909703.2 cDNA FLJ51518, highly similar to Annexin A11
5.83 3 2 2 3 4.91 412 45.7 8.46
IPI00032291.2 Complement C5 1.55 1 2 2 4 7.92 1676 188.2 6.52
IPI00783862.2 Flavin reductase 12.14 2 2 2 3 5.56 206 22.1 7.65
IPI00657911.2 Gamma-globin 14.60 10 1 2 4 2.53 137 15.3 9.47
IPI00387097.1 Ig kappa chain V-I region Lay 25.00 5 1 2 10 15.84 108 11.8 7.96
IPI00829834.2 Ig kappa chain V-III region VH (Fragment) 23.28 5 1 2 9 19.27 116 12.7 5.94
IPI00382420.1 Ig lambda chain V-I region HA 18.75 11 0 2 32 25.23 112 11.9 8.91
IPI00382421.1 Ig lambda chain V-I region NEW 14.41 7 2 2 2 2.61 111 11.4 8.00
IPI00029717.1 Isoform 2 of Fibrinogen alpha chain 3.73 4 2 2 6 5.31 644 69.7 8.06
IPI00221362.3 Isoform 3 of Apoptosis-associated speck-like protein containing a CARD
20.74 3 2 2 2 3.16 135 15.0 7.44
IPI00218169.2 Isoform 7 of Mucin-1 8.63 26 2 2 6 8.40 255 27.5 6.38

Accession Description ΣCoverage Σ# ProteinsΣ#
Unique Peptides
Σ# Peptides Σ# PSMs Max. Score # AAs MW [kDa] calc. pI
IPI00556459.1 Serine/cysteine proteinase inhibitor clade G member 1 splice variant 2 (Fragment)
29.73 3 8 8 94 234.41 333 37.3 8.00
IPI00290857.3 Keratin, type II cytoskeletal 3 9.24 5 1 8 88 52.67 628 64.4 6.48
IPI00798387.1 Uncharacterized protein 17.55 10 1 7 98 113.82 433 47.9 4.84
IPI00909283.1 cDNA FLJ58514, highly similar to Cadherin-11
16.05 4 7 7 34 95.71 779 85.5 4.83
IPI00873598.2 Uncharacterized protein 10.55 13 1 6 216 241.89 455 49.1 4.79
IPI00302944.3 Isoform 4 of Collagen alpha-1(XII) chain 2.48 5 5 5 23 38.22 2987 324.4 5.50
IPI00017704.3 Coactosin-like protein 28.17 1 4 4 9 17.15 142 15.9 5.67
IPI00910870.1 cDNA FLJ59163, highly similar to Heat shock cognate 71 kDa protein
25.24 22 2 4 13 16.33 210 23.1 8.50
IPI00307466.2 Isoform 2 of Serpin B3 14.50 3 4 4 9 16.10 338 38.5 6.74
IPI00218201.2 Isoform 2 of Macrophage colony-stimulating factor 1
13.47 4 4 4 20 27.17 438 47.9 4.91
IPI00218528.1 Isoform 1 of Plakophilin-1 8.13 3 4 4 11 19.87 726 80.4 8.97
IPI00969451.1 Tenascin XB 3.30 19 4 4 7 14.75 2149 233.2 5.12
IPI00072918.2 322 kDa protein 1.98 9 4 4 21 16.83 2976 322.0 6.90
IPI00219025.3 Glutaredoxin-1 31.13 1 3 3 12 24.05 106 11.8 8.09
IPI00940393.1 Elongation factor 1-alpha 10.89 8 3 3 16 16.33 395 42.6 9.01
IPI00431749.2 Isoform 2 of Keratin, type II cytoskeletal 80 8.77 6 2 3 43 34.77 422 47.2 5.30
IPI00965611.1 cDNA FLJ52396, highly similar to SPARC-like protein 1
8.53 5 3 3 6 9.66 539 61.7 4.84
IPI00300052.2 Keratin, type II cuticular Hb4 6.17 3 1 3 5 4.70 600 64.8 7.56
IPI00296537.4 Isoform C of Fibulin-1 6.30 8 3 3 4 12.94 683 74.4 5.24
IPI00027509.5 Matrix metalloproteinase-9 5.94 2 3 3 4 12.64 707 78.4 6.06
IPI00247063.3 Neprilysin 5.07 1 3 3 9 25.72 750 85.5 5.73
IPI00010863.5 Copper transport protein ATOX1 13.24 1 2 2 3 5.47 68 7.4 7.24
IPI00827773.1 Cold agglutinin FS-1 L-chain (Fragment) 19.47 13 2 2 17 19.16 113 12.4 8.48
IPI00792875.1 Uncharacterized protein 21.71 3 2 2 6 14.43 129 14.3 5.57
IPI00969452.1 Anthrax toxin receptor 1, isoform CRA_a 17.52 8 2 2 3 5.63 137 15.4 6.16
IPI00791498.1 17 kDa protein 14.81 2 2 2 2 2.67 162 16.8 9.32
IPI00947198.1 Uncharacterized protein 12.66 2 2 2 3 5.80 158 17.9 5.57
IPI00947111.1 Uncharacterized protein 10.04 7 2 2 5 16.11 249 28.0 7.97
IPI00910055.1 cDNA FLJ54604, highly similar to Betaine--homocysteine S-methyltransferase
7.40 2 2 2 2 3.21 365 40.5 6.93
IPI00910734.2 cDNA FLJ53641, highly similar to Intercellular adhesion molecule 1
7.43 4 2 2 2 5.17 444 48.1 8.16
IPI00099883.4 Isoform 1 of G-protein coupled receptor family C group 5 member C
6.35 5 2 2 2 5.15 441 48.2 8.43
IPI00296141.4 Dipeptidyl peptidase 2 4.47 2 2 2 4 6.90 492 54.3 6.32
IPI00293748.3 Isoform 1 of Multiple inositol polyphosphate phosphatase 1
6.16 3 1 2 2 2.51 487 55.0 7.81
Partial list of Unique proteins for RTA

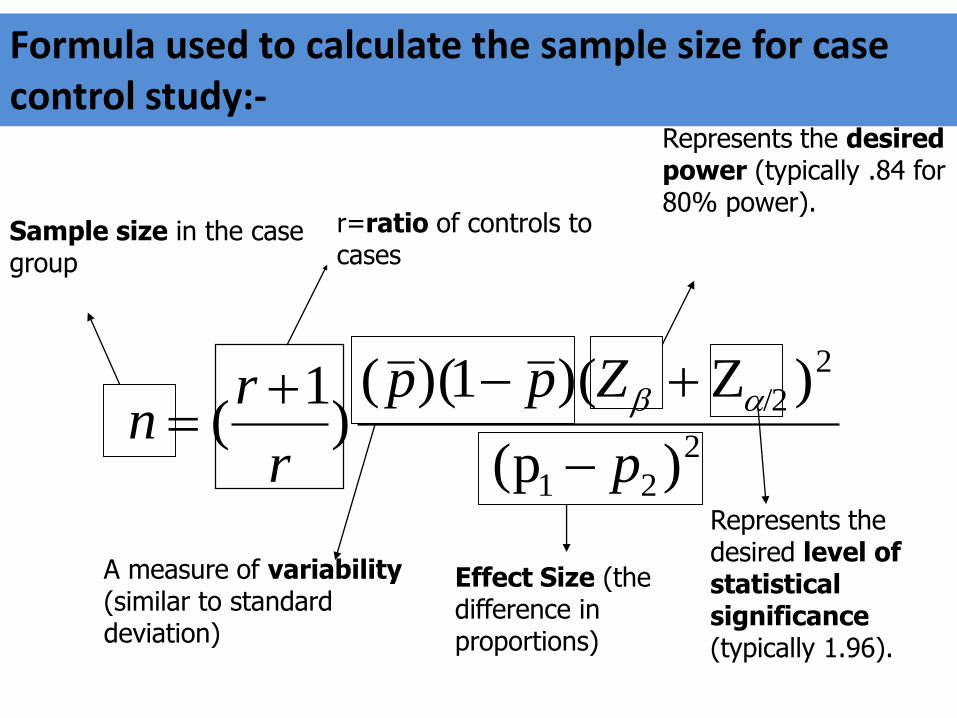
• The sample size was calculated based on case-control study by using Odds ratio calculation.
• Parameters that were used as inputs for this study were:(Design of case -control study):-
• Identified a group of individuals with the disease (cases)
• Selected a group of individuals without the disease (controls)
• Determined the proportion of cases who were exposed and those that were not exposed
• Then done the same for control (exposed versus non-exposed)
sample size calculation:-
2
21
2
/2
)(p
)Z)(1)(()
1(
p
Zpp
r
rn
Sample size in the case group
Represents the desired power (typically .84 for 80% power).
Represents the desired level of statistical significance(typically 1.96).
A measure of variability(similar to standard deviation)
Effect Size (the difference in proportions)
r=ratio of controls to cases
Formula used to calculate the sample size for case control study:-

• For 80% power zB = 0.84
• For 0.05 significance leve zα = 1.96
• r = 1 (equal number of cases and controls)
• The proportion exposed in the control group is 40%
• To get proportion of cases exposed
1)1(exp
exp
exp
ORp
ORpp
controls
controls
case

Acknowledgements
• I would like thank my supervisor Prof. K.V. Dakshinamurty for the untiringhelp and support in any situation right from difficulties in executing theproject to availing facilities. He has been a perfect mentor in true sense ofwords. He encouraged and challenged me throughout my academic programthat helped in developing my own scientific ideas.
• I would like thank my co-supervisor Prof. P.V. Rao for his excellent guidancein clinical proteomics, diabetes research. I am grateful for his cooperation insample collection and for discussions in designing the study. I am grateful forhis suggestions especially while dealing with proteomics and clinical data, inspite of his busy schedules.
• I would like thank my co-supervisor Prof. Aruna k. Prayaga, for her excellentguidance in renal biopsies and other pathological aspects of my project.
• I would like thank my co-supervisor Prof. K.S.S. Sai Baba for his help inbiochemical aspects of the project. I am grateful for his excellent guidancethroughout my work.

• Prof.Dr. K.V.Dakshinamurty
• Prof.Dr. P.V.Rao
• Prof.Dr. Aruna k. Prayaga
• Prof.Dr. Malati Tangirala
• Prof.Dr. K.S.S. Saibaba
• Asso. Prof.Dr. Vijay kumarkutala
AcknowledgementsDoctoral committee members Department of Nephrology
• Dr. Taduri Gangadar
• Dr.Rapur Ram
• Dr. Guditi Swarnalatha
• Dr. Uttara das
• Dr. Madav Desai
• Dr. Y. Rakesh
• Dr. Vasa Ramesh
• Dr. BH Santhosh pai
• Dr. Shyam sundar
• Dr.Gajjala Divakar naidu
• Dr. Sriram
• Mr. Kalyan
• Mr. Sudhakar
• Mr. Srinivas
• Nursing staff of Department of Nephrology &
• Academic and Administration staff of NIMS.

Thank you


Amino Acid Masses
Amino acid Mass(avg) Amino acid Mass(avg)
G 57.0520 D 115.0886
A 71.0788 Q 128.1308
S 87.0782 K 128.1742
P 97.1167 E 129.1155
V 99.1326 M 131.1986
T 101.1051 H 137.1412
C 103.1448 F 147.1766
I 113.1595 R 156.1876
L 113.1595 Y 163.1760
N 114.1039 W 186.2133