Embed Size (px)
Citation preview
Proteomics & Bioinformatics Part I
David Wishart
University of Alberta
What is Proteomics?
• Proteomics - A newly emerging field of life science research that uses High Throughput (HT) technologies to display, identify and/or characterize all the proteins in a given cell, tissue or organism (i.e. the proteome).
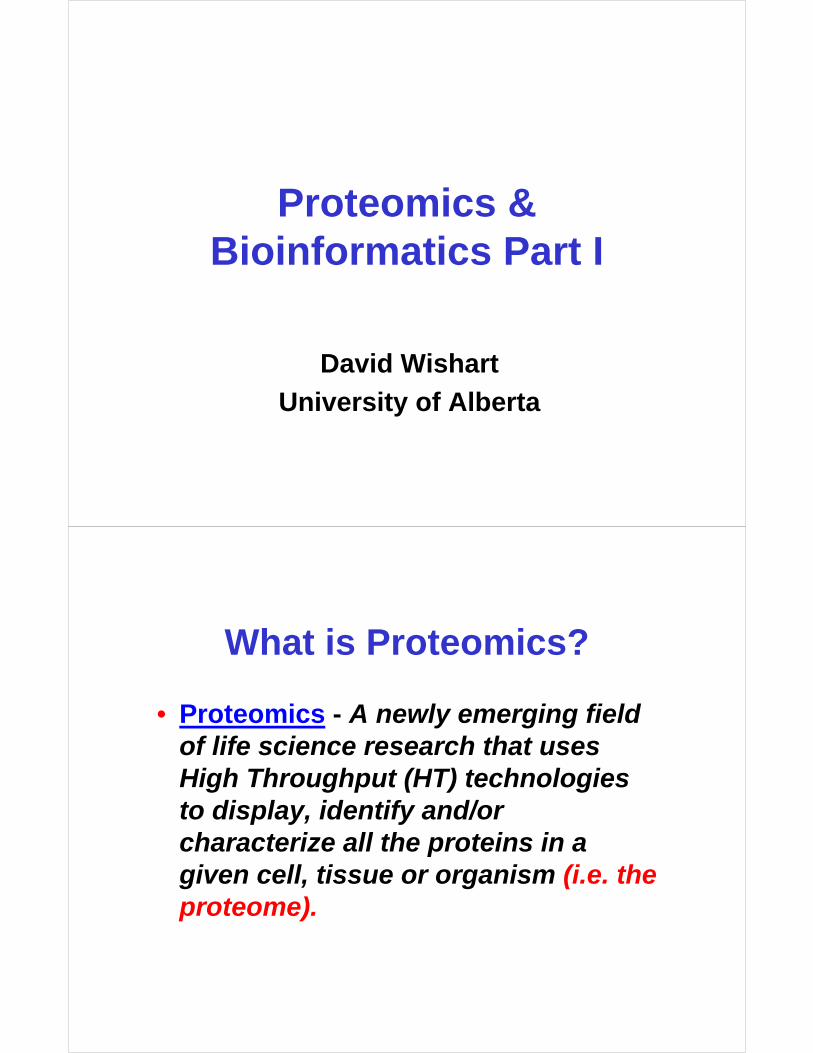
Proteomics & Bioinformatics
1990 1995 2000 2005 2010 2015 2020
Genomics
Proteomics
Bioinformatics
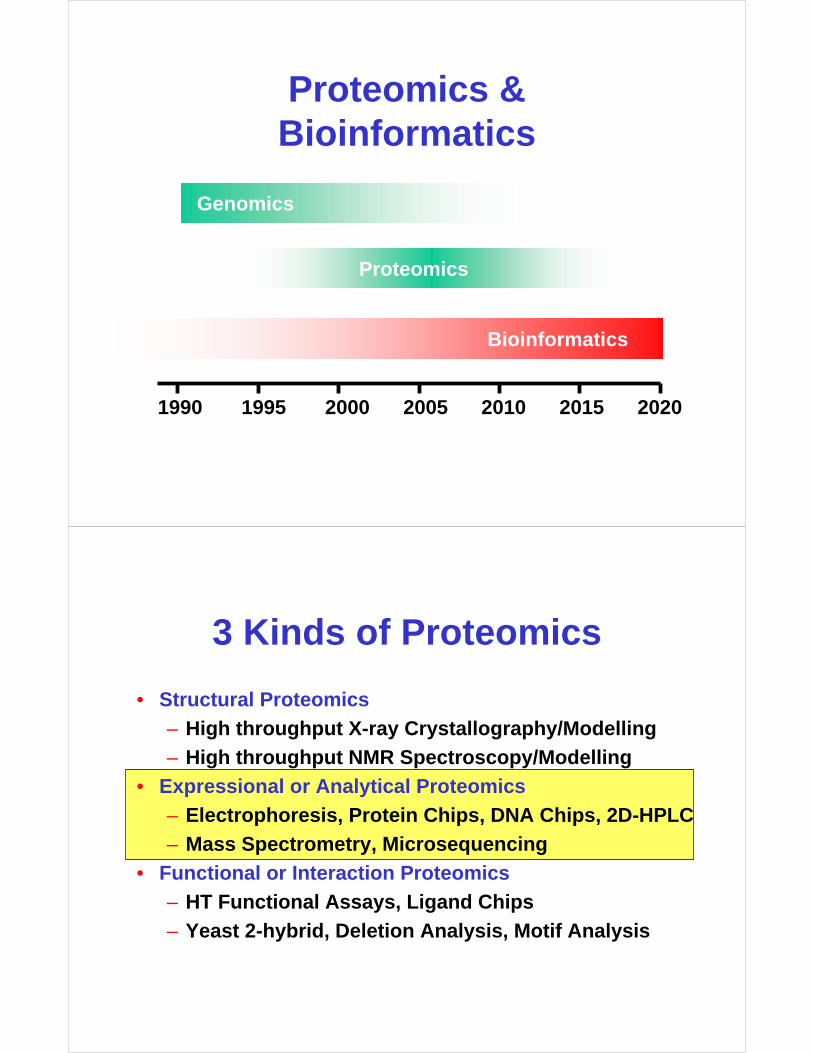
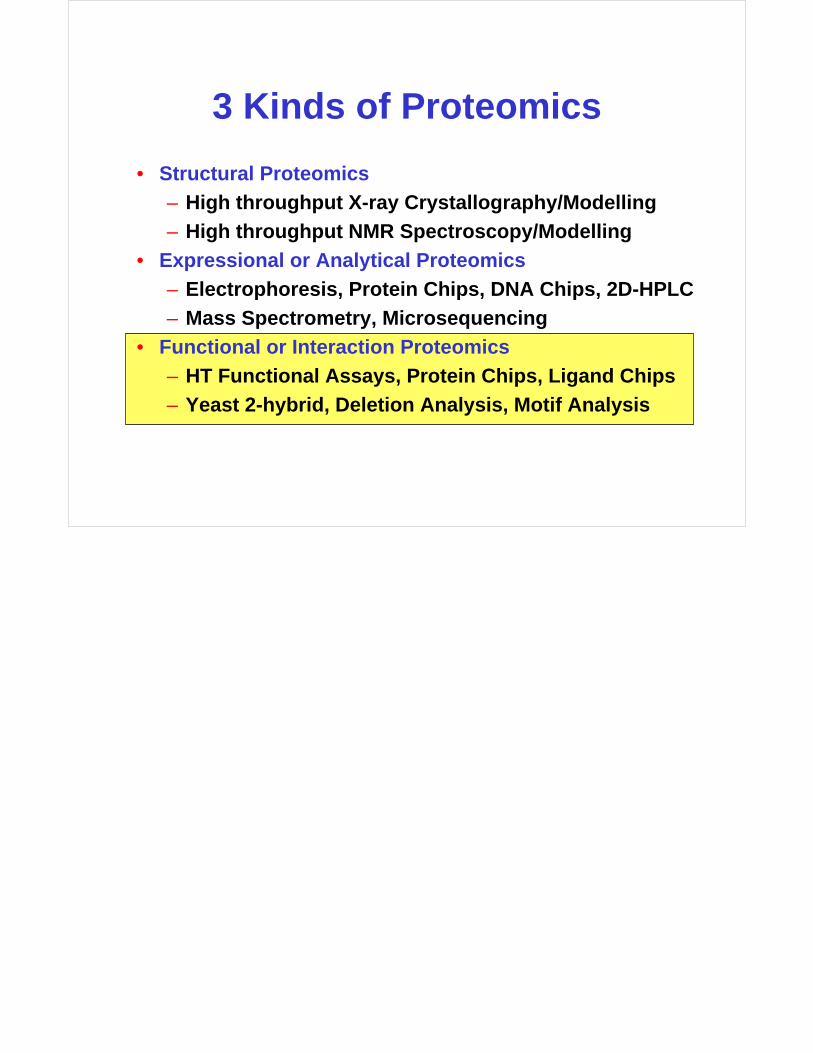
3 Kinds of Proteomics
• Structural Proteomics
– High throughput X-ray Crystallography/Modelling
– High throughput NMR Spectroscopy/Modelling
• Expressional or Analytical Proteomics
– Electrophoresis, Protein Chips, DNA Chips, 2D-HPLC
– Mass Spectrometry, Microsequencing
• Functional or Interaction Proteomics
– HT Functional Assays, Ligand Chips
– Yeast 2-hybrid, Deletion Analysis, Motif Analysis
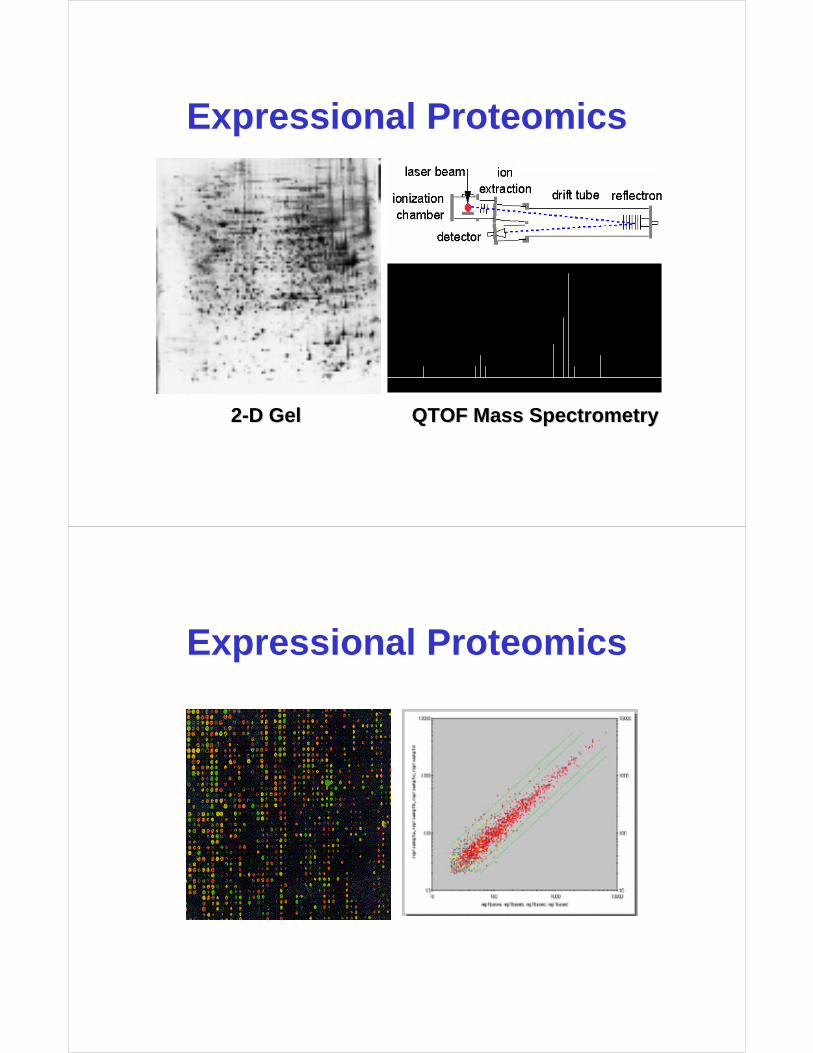
Expressional Proteomics
22--D Gel D Gel QTOF Mass SpectrometryQTOF Mass Spectrometry
Expressional Proteomics
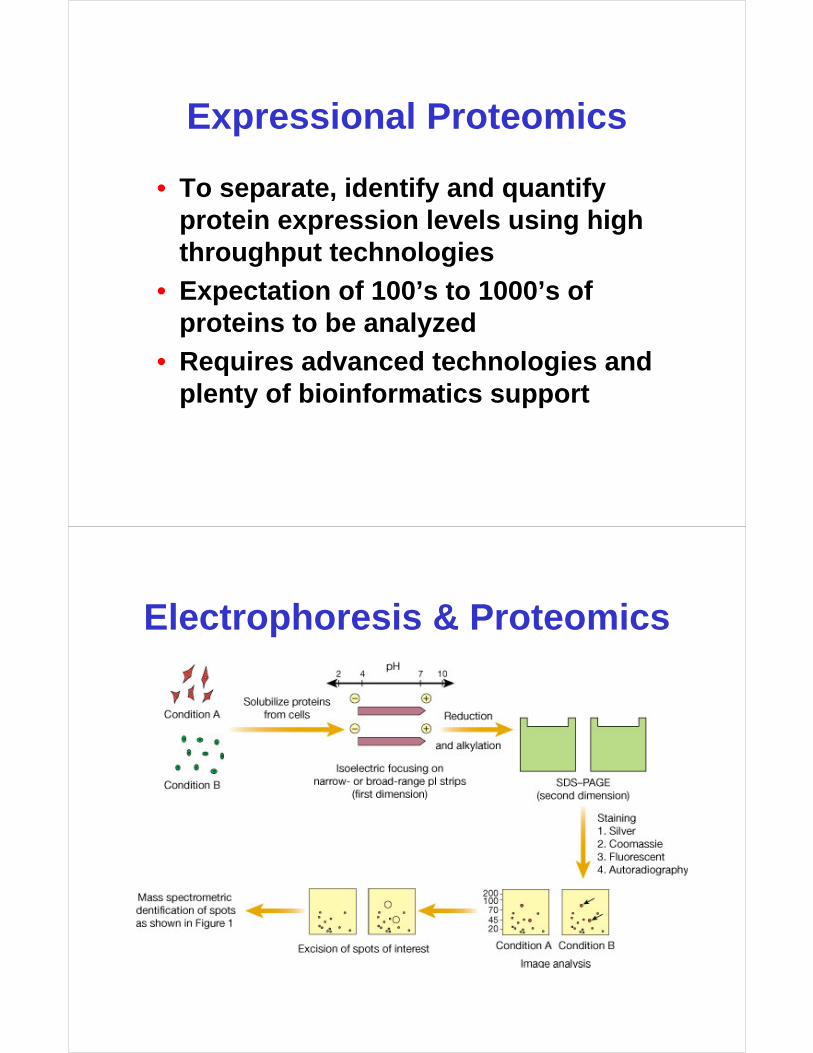
Expressional Proteomics
• To separate, identify and quantify protein expression levels using high throughput technologies
• Expectation of 100’s to 1000’s of proteins to be analyzed
• Requires advanced technologies and plenty of bioinformatics support
Electrophoresis & Proteomics
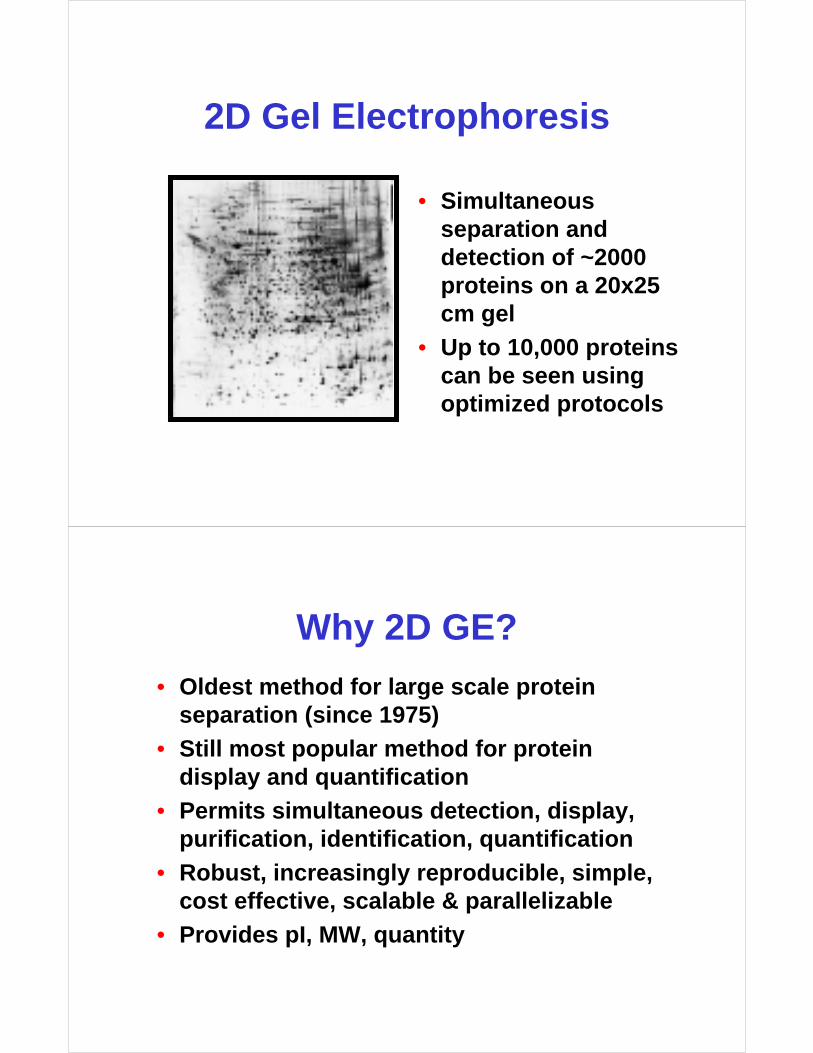
2D Gel Electrophoresis
• Simultaneous separation and detection of ~2000 proteins on a 20x25 cm gel
• Up to 10,000 proteins can be seen using optimized protocols
Why 2D GE?
• Oldest method for large scale protein separation (since 1975)
• Still most popular method for protein display and quantification
• Permits simultaneous detection, display, purification, identification, quantification
• Robust, increasingly reproducible, simple, cost effective, scalable & parallelizable
• Provides pI, MW, quantity
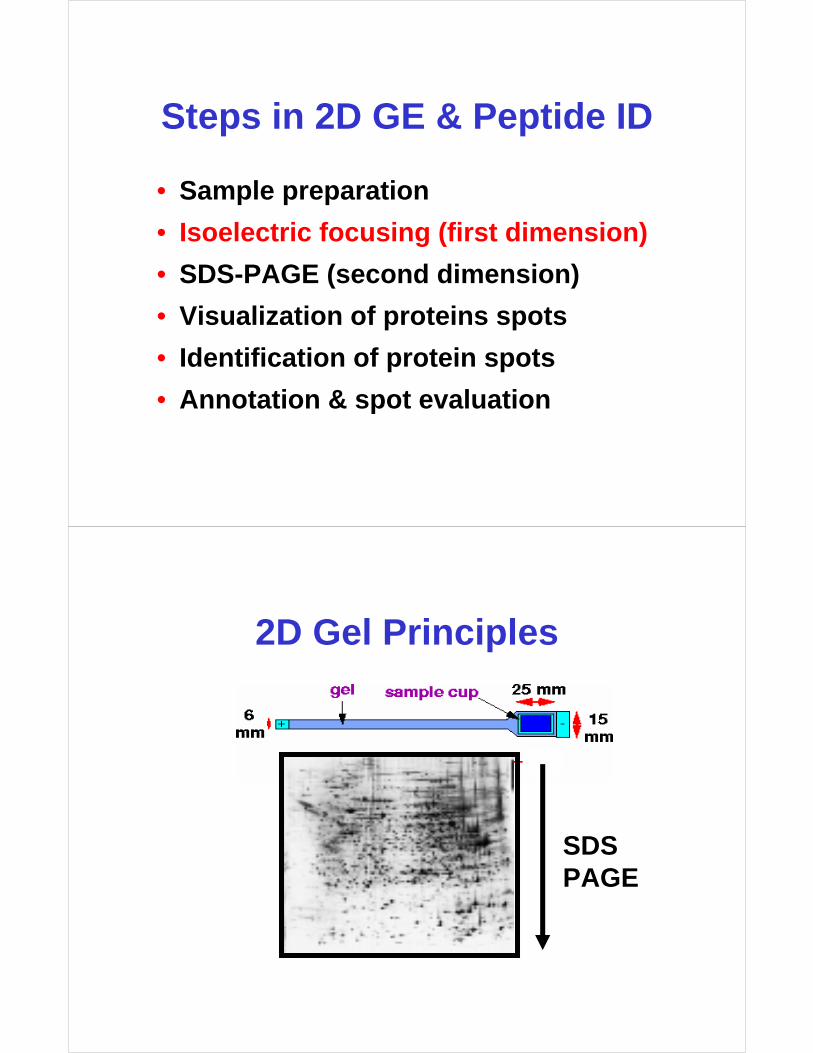
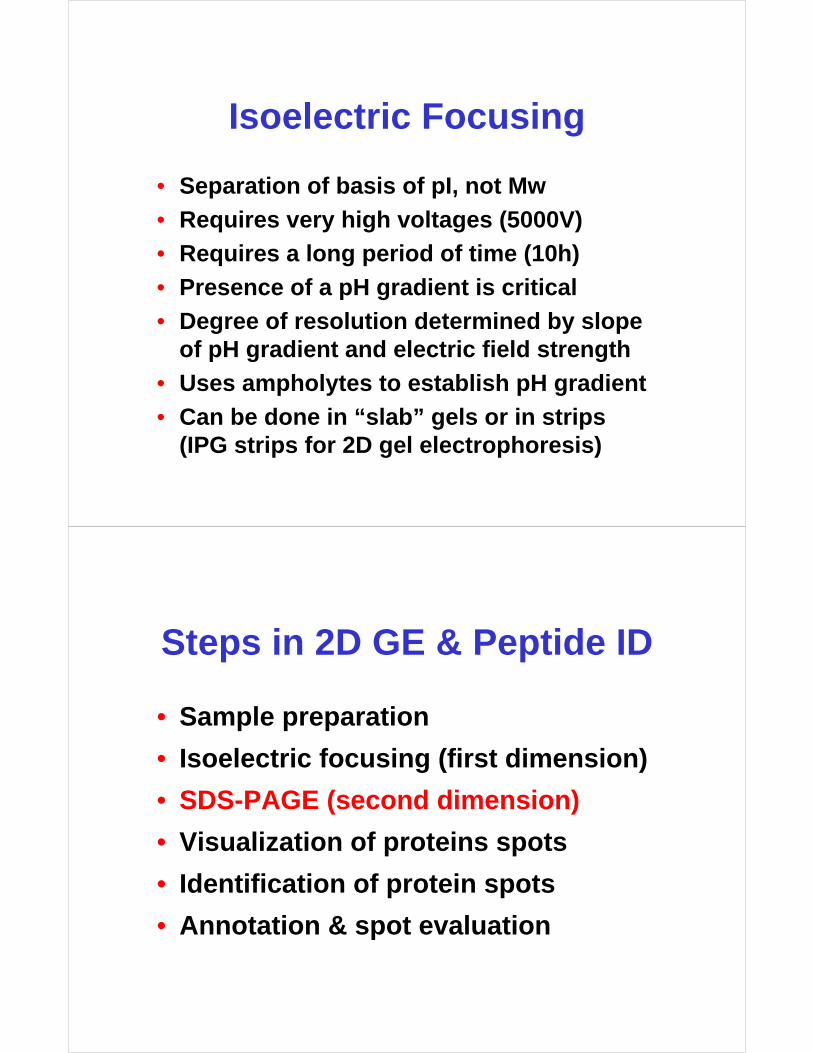
Steps in 2D GE & Peptide ID
• Sample preparation
• Isoelectric focusing (first dimension)
• SDS-PAGE (second dimension)
• Visualization of proteins spots
• Identification of protein spots
• Annotation & spot evaluation
2D Gel Principles
SDSPAGE
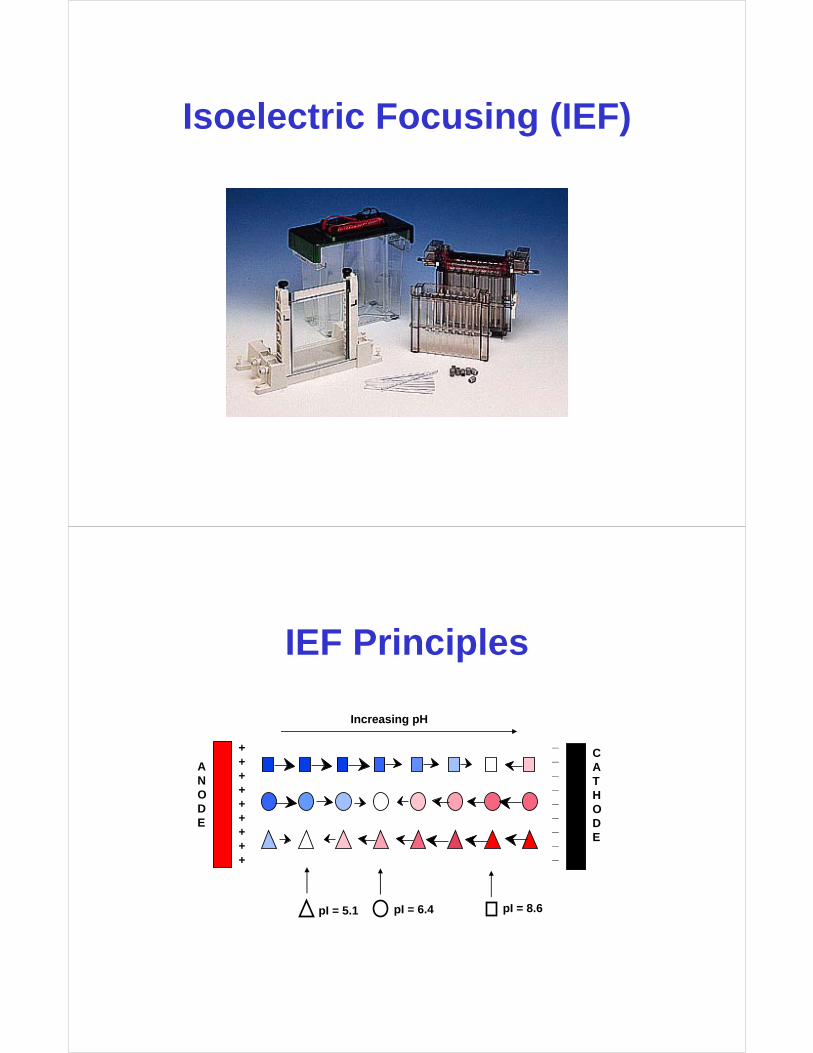
Isoelectric Focusing (IEF)
IEF Principles
ANODE
+++++++++
_________
CATHODE
Increasing pH
pI = 8.6pI = 6.4pI = 5.1
Isoelectric Focusing
• Separation of basis of pI, not Mw
• Requires very high voltages (5000V)
• Requires a long period of time (10h)
• Presence of a pH gradient is critical
• Degree of resolution determined by slope of pH gradient and electric field strength
• Uses ampholytes to establish pH gradient
• Can be done in “slab” gels or in strips (IPG strips for 2D gel electrophoresis)
Steps in 2D GE & Peptide ID
• Sample preparation
• Isoelectric focusing (first dimension)
• SDS-PAGE (second dimension)
• Visualization of proteins spots
• Identification of protein spots
• Annotation & spot evaluation
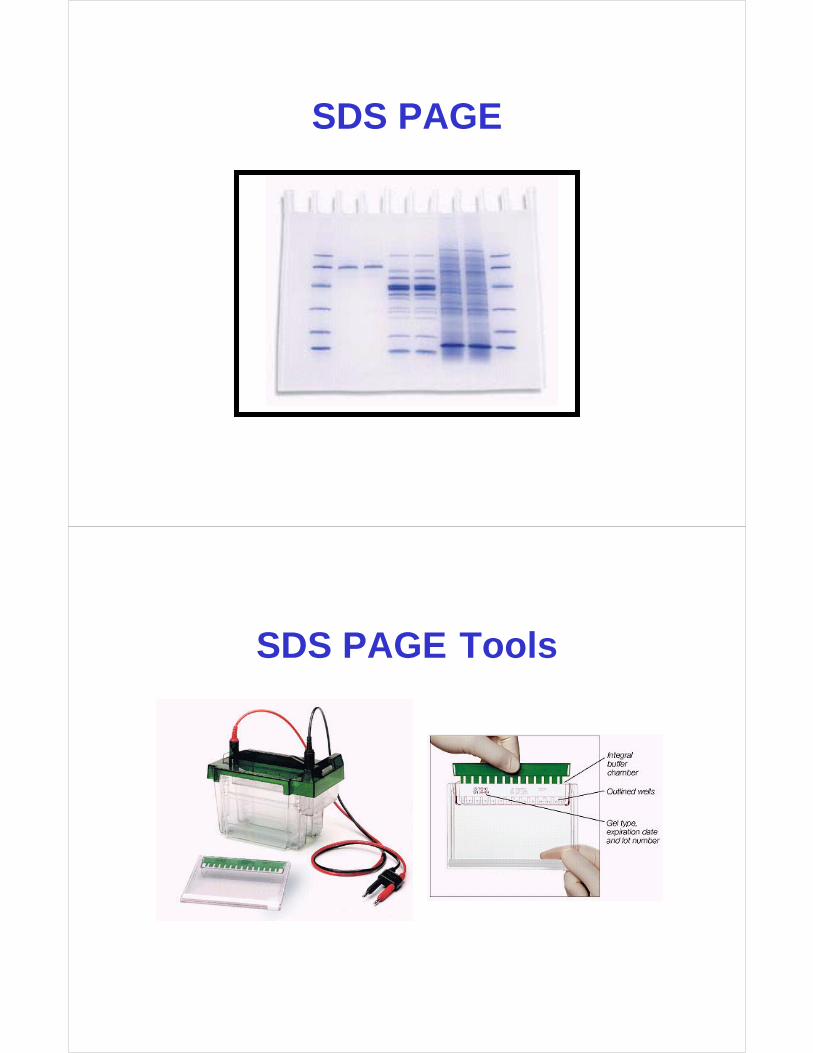
SDS PAGE
SDS PAGE Tools
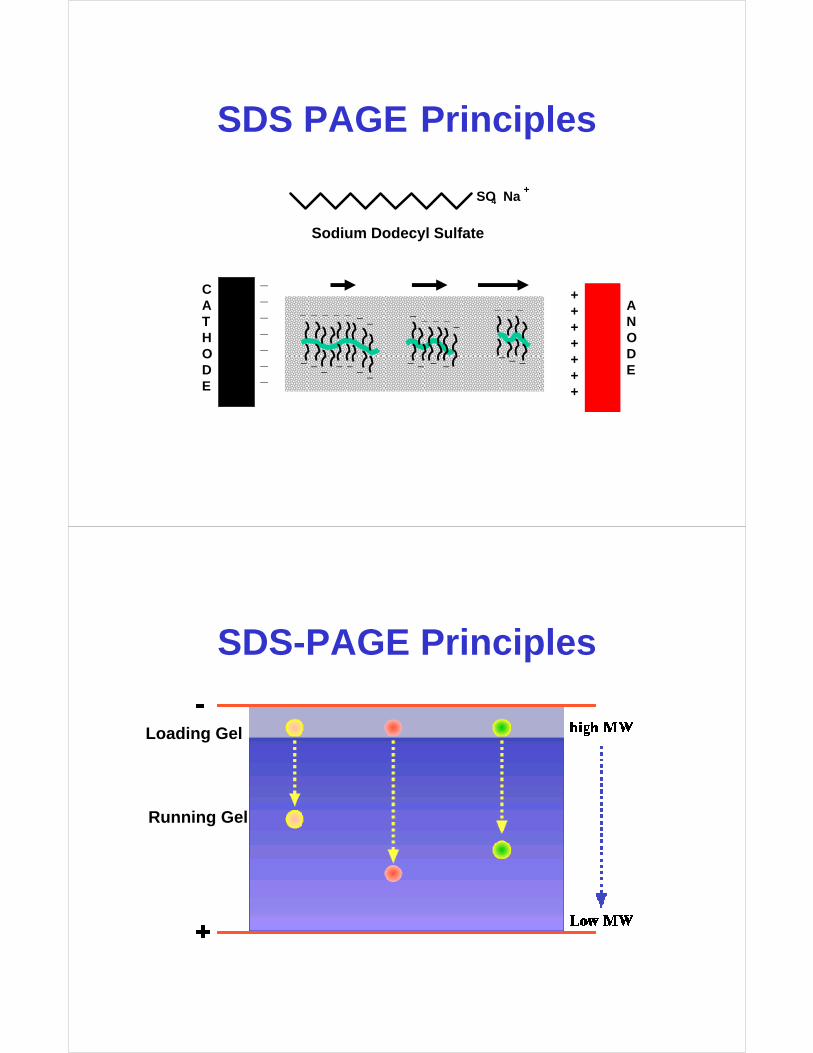
SDS PAGE Principles
SO Na4+
Sodium Dodecyl Sulfate
CATHODE
ANODE
_______
+++++++
_ _ _ _ _
_ _ _ _ _ __
_
_ __ _
_ _ _ _
_ _ _
_ _ _ _ _
SDS-PAGE Principles
Loading Gel
Running Gel
SDS-PAGE
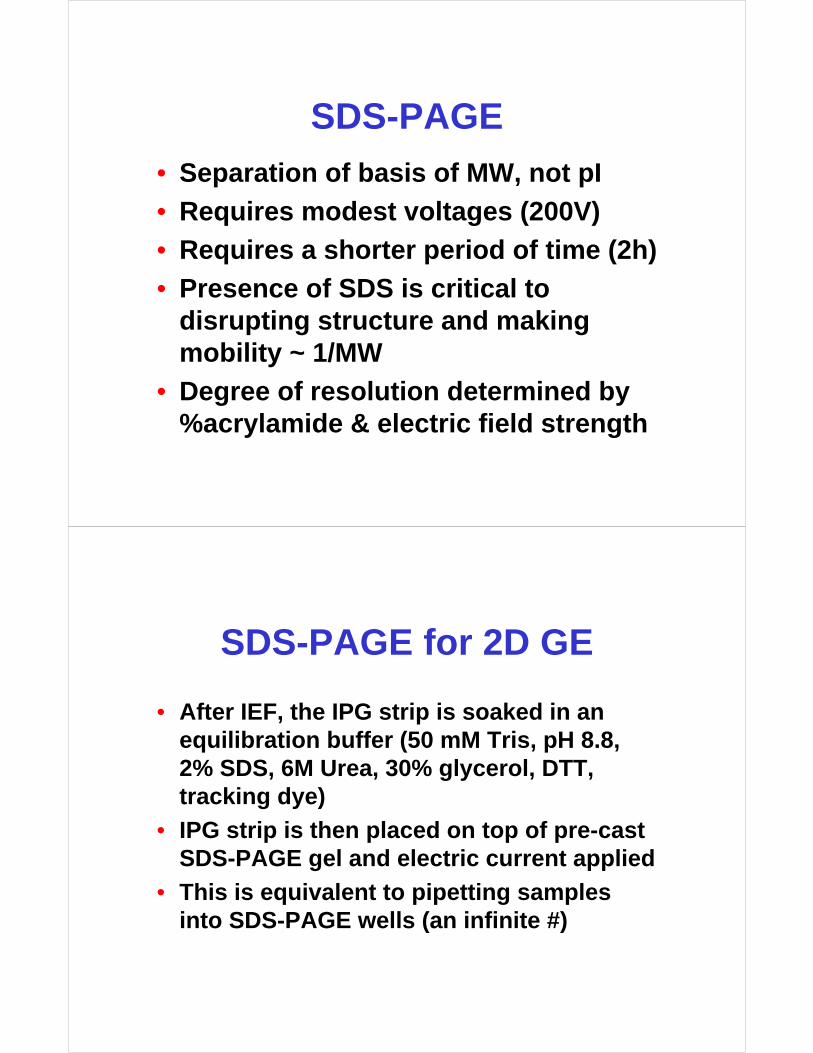
• Separation of basis of MW, not pI
• Requires modest voltages (200V)
• Requires a shorter period of time (2h)
• Presence of SDS is critical to disrupting structure and making mobility ~ 1/MW
• Degree of resolution determined by %acrylamide & electric field strength
SDS-PAGE for 2D GE
• After IEF, the IPG strip is soaked in an equilibration buffer (50 mM Tris, pH 8.8, 2% SDS, 6M Urea, 30% glycerol, DTT, tracking dye)
• IPG strip is then placed on top of pre-cast SDS-PAGE gel and electric current applied
• This is equivalent to pipetting samples into SDS-PAGE wells (an infinite #)
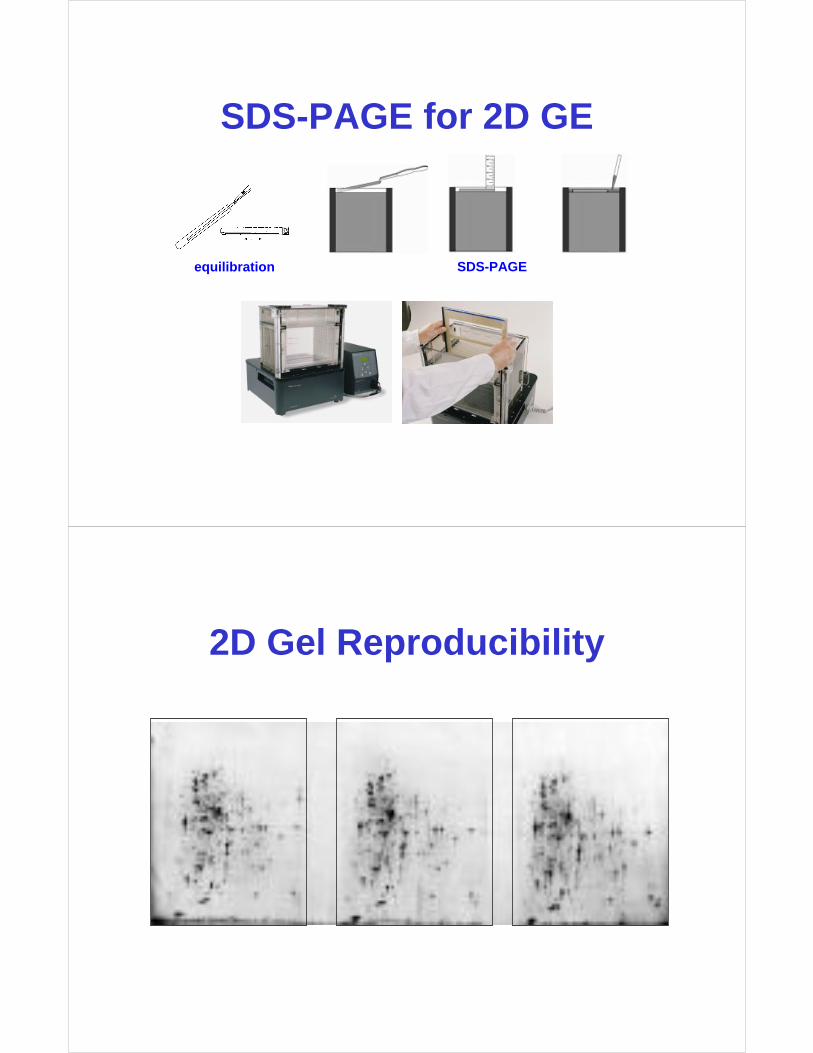
SDS-PAGE for 2D GE
equilibration SDS-PAGE
2D Gel Reproducibility
Advantages and Disadvantages of 2D GE
• Provides a hard-copy record of separation
• Allows facile quantitation
• Separation of up to 9000 different proteins
• Highly reproducible
• Gives info on Mw, pI and post-trans modifications
• Inexpensive
• Limited pI range (4-8)
• Proteins >150 kD not seen in 2D gels
• Difficult to see membrane proteins (>30% of all proteins)
• Only detects high abundance proteins (top 30% typically)
• Time consuming
Protein Detection
CH N C N CH
NC HH C
CH SOO S
C H C H2
2 2
2
22
3 33
55
55
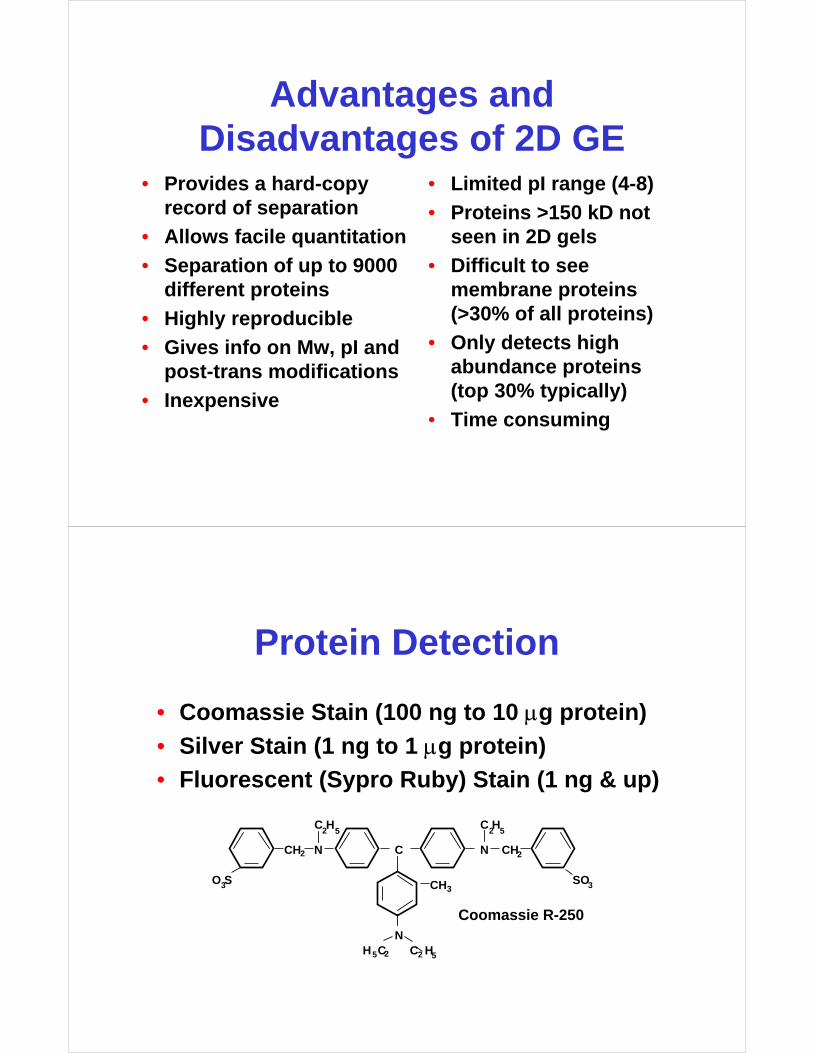
Coomassie R-250
• Coomassie Stain (100 ng to 10 µg protein)
• Silver Stain (1 ng to 1 µg protein)
• Fluorescent (Sypro Ruby) Stain (1 ng & up)
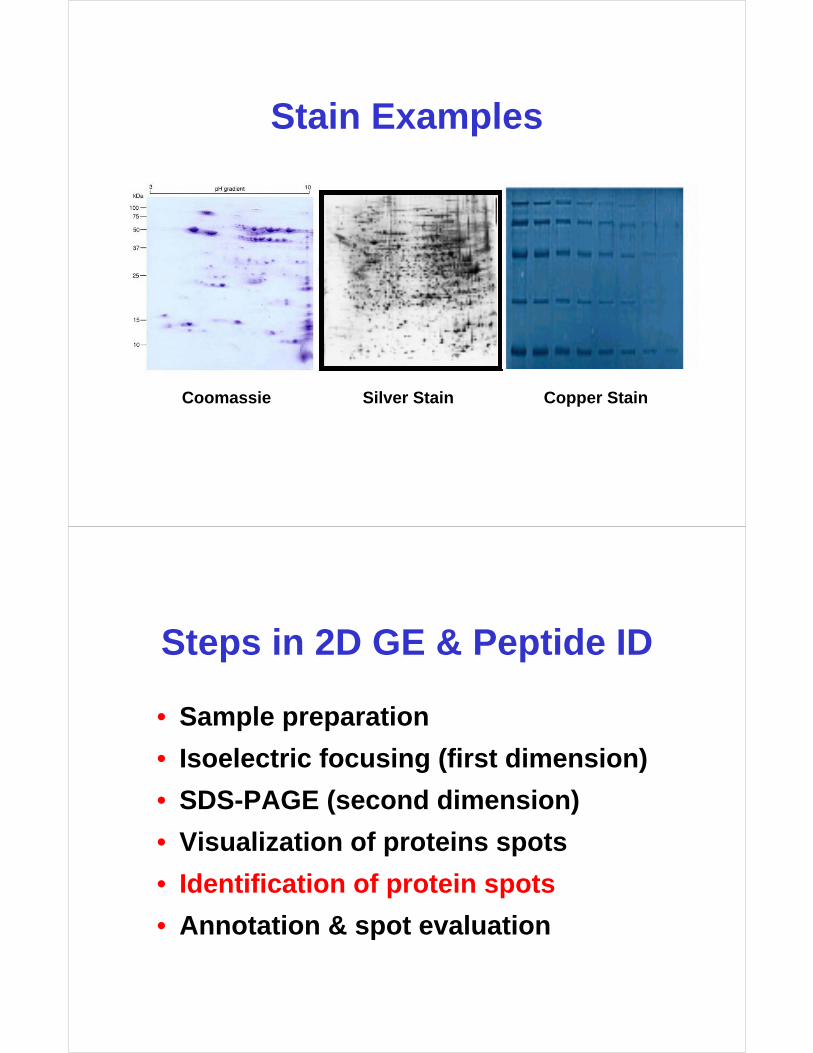
Stain Examples
Coomassie Silver Stain Copper Stain
Steps in 2D GE & Peptide ID
• Sample preparation
• Isoelectric focusing (first dimension)
• SDS-PAGE (second dimension)
• Visualization of proteins spots
• Identification of protein spots
• Annotation & spot evaluation
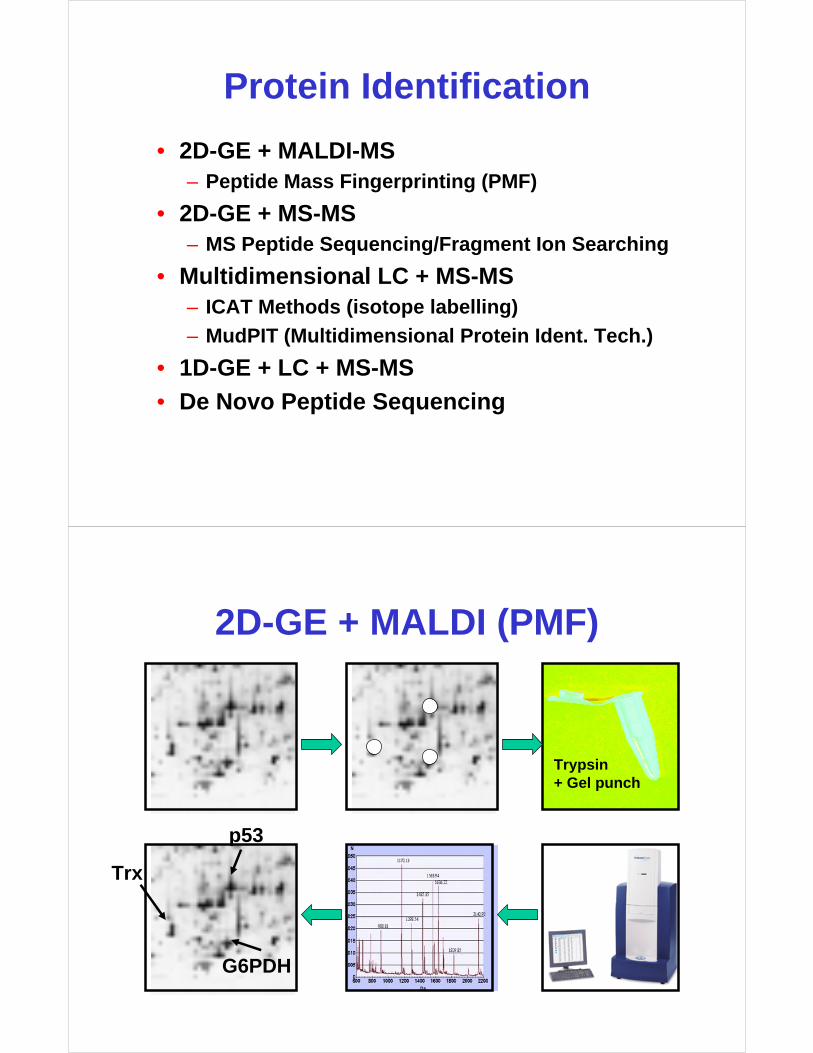
Protein Identification
• 2D-GE + MALDI-MS– Peptide Mass Fingerprinting (PMF)
• 2D-GE + MS-MS– MS Peptide Sequencing/Fragment Ion Searching
• Multidimensional LC + MS-MS– ICAT Methods (isotope labelling)
– MudPIT (Multidimensional Protein Ident. Tech.)
• 1D-GE + LC + MS-MS
• De Novo Peptide Sequencing
2D-GE + MALDI (PMF)
Trx
p53
G6PDH
Trypsin+ Gel punch
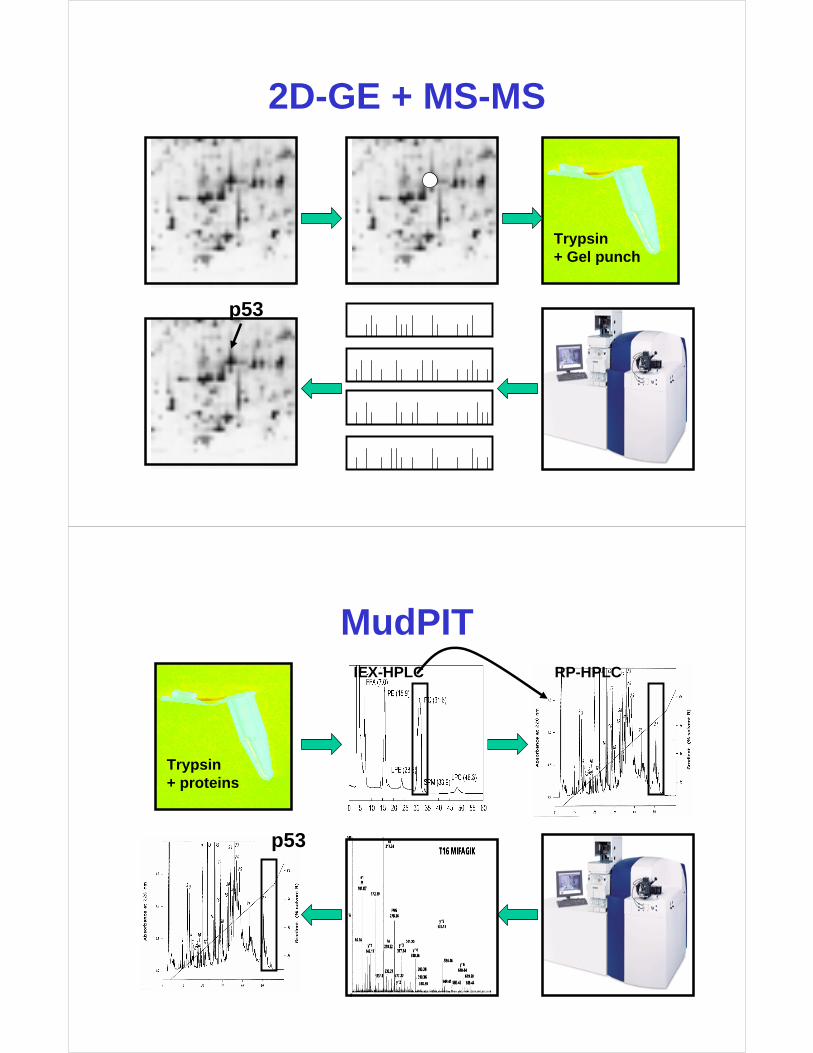
2D-GE + MS-MS
p53
Trypsin+ Gel punch
MudPIT
Trypsin+ proteins
p53
IEX-HPLC RP-HPLC
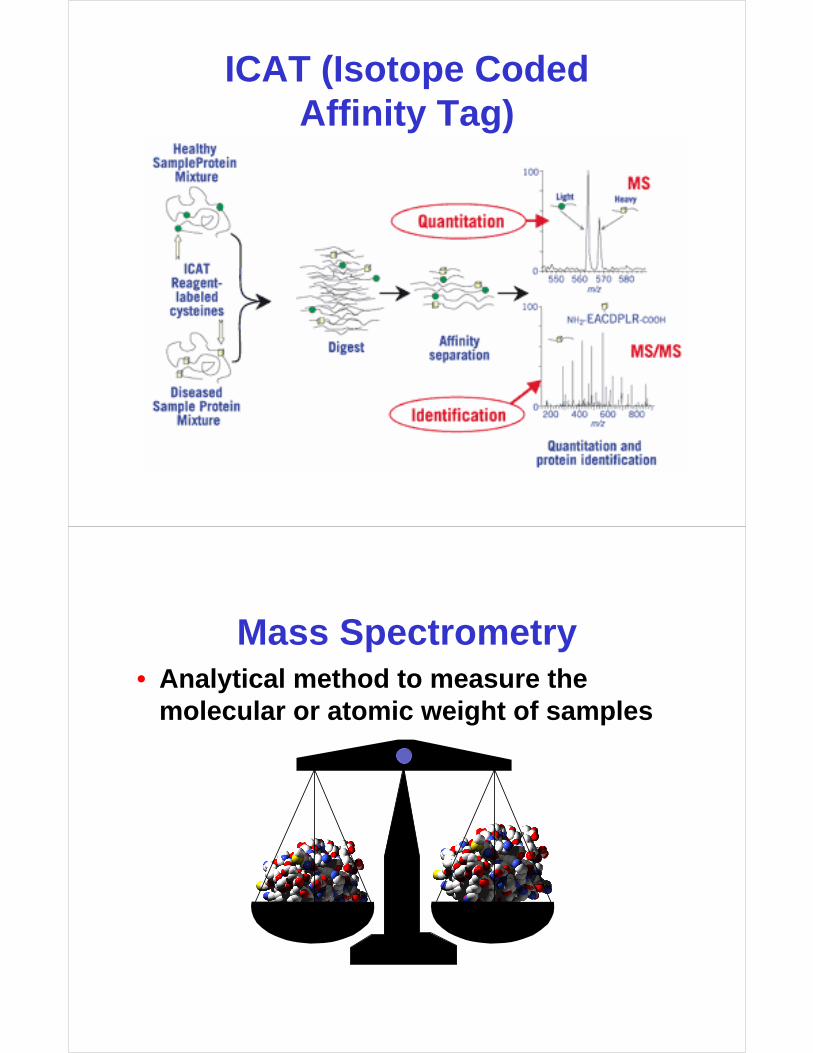
ICAT (Isotope Coded Affinity Tag)
Mass Spectrometry• Analytical method to measure the
molecular or atomic weight of samples
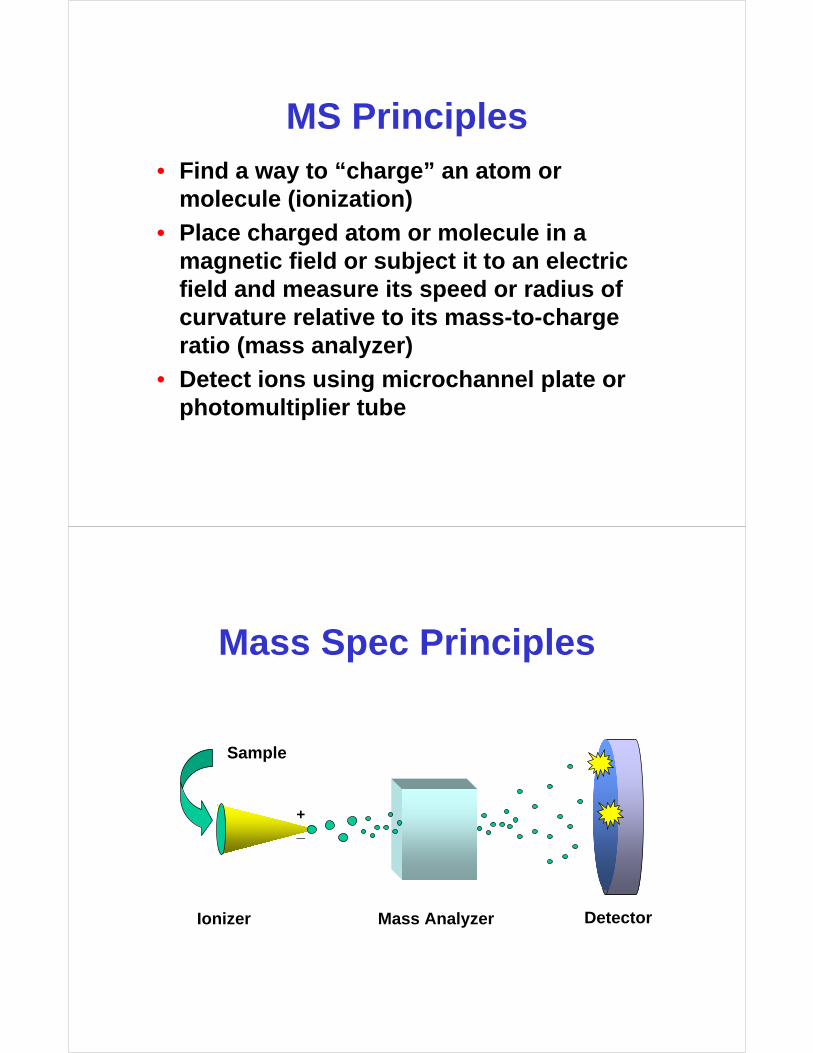
MS Principles• Find a way to “charge” an atom or
molecule (ionization)
• Place charged atom or molecule in a magnetic field or subject it to an electric field and measure its speed or radius of curvature relative to its mass-to-charge ratio (mass analyzer)
• Detect ions using microchannel plate or photomultiplier tube
Mass Spec Principles
Ionizer
Sample
+_
Mass Analyzer Detector
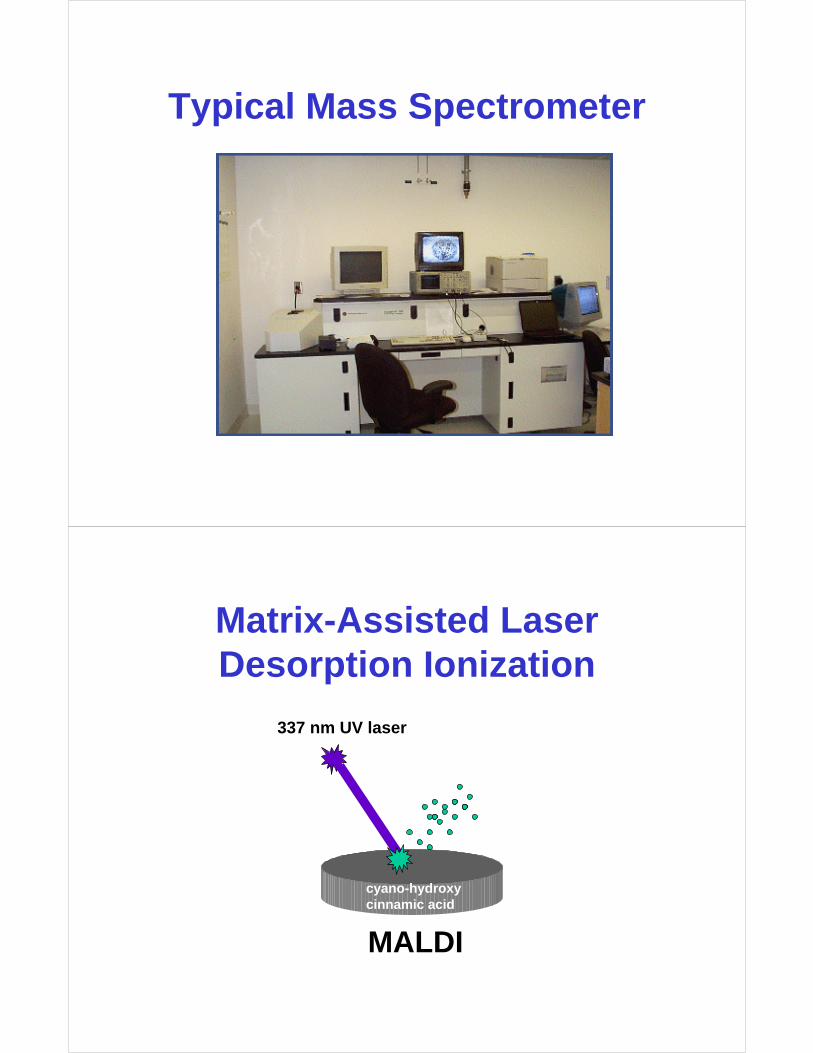
Typical Mass Spectrometer
Matrix-Assisted Laser Desorption Ionization
337 nm UV laser
MALDI
cyano-hydroxycinnamic acid
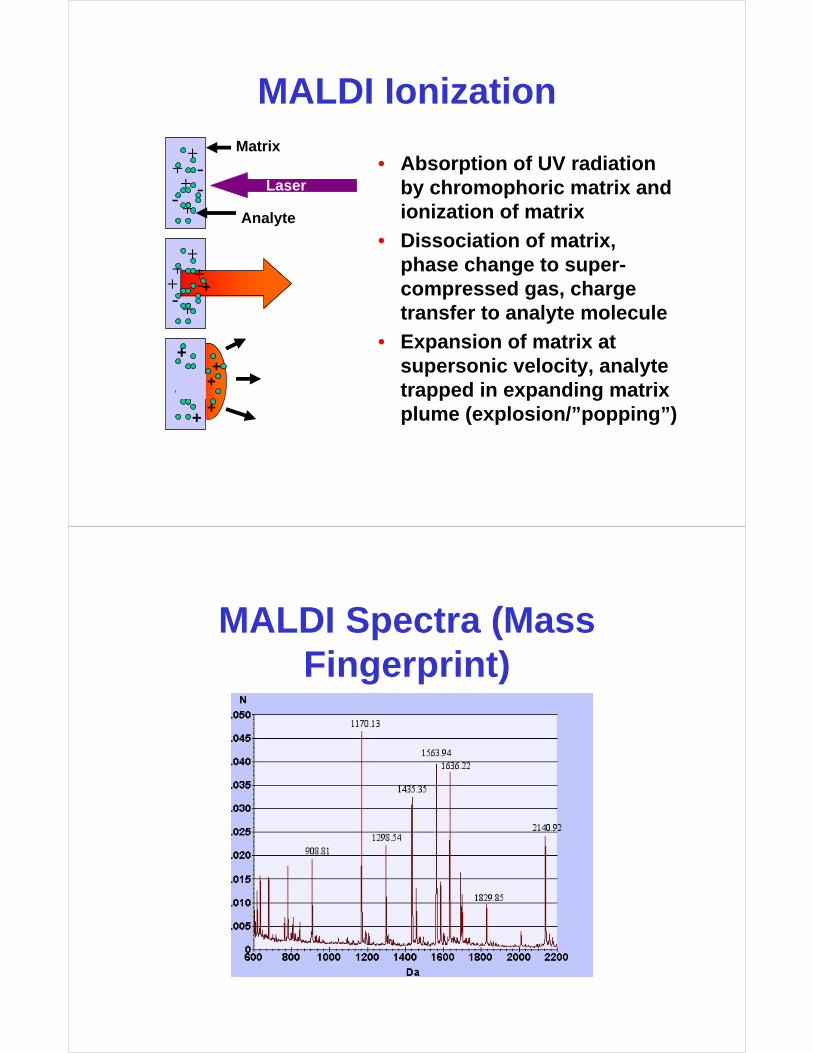
MALDI Ionization
++
+
+
-
--
++
+
+
-
---+ +
Analyte
Matrix
Laser
+
++
• Absorption of UV radiation by chromophoric matrix and ionization of matrix
• Dissociation of matrix, phase change to super-compressed gas, charge transfer to analyte molecule
• Expansion of matrix at supersonic velocity, analytetrapped in expanding matrix plume (explosion/”popping”)
+
+
+
MALDI Spectra (Mass Fingerprint)
Tumor
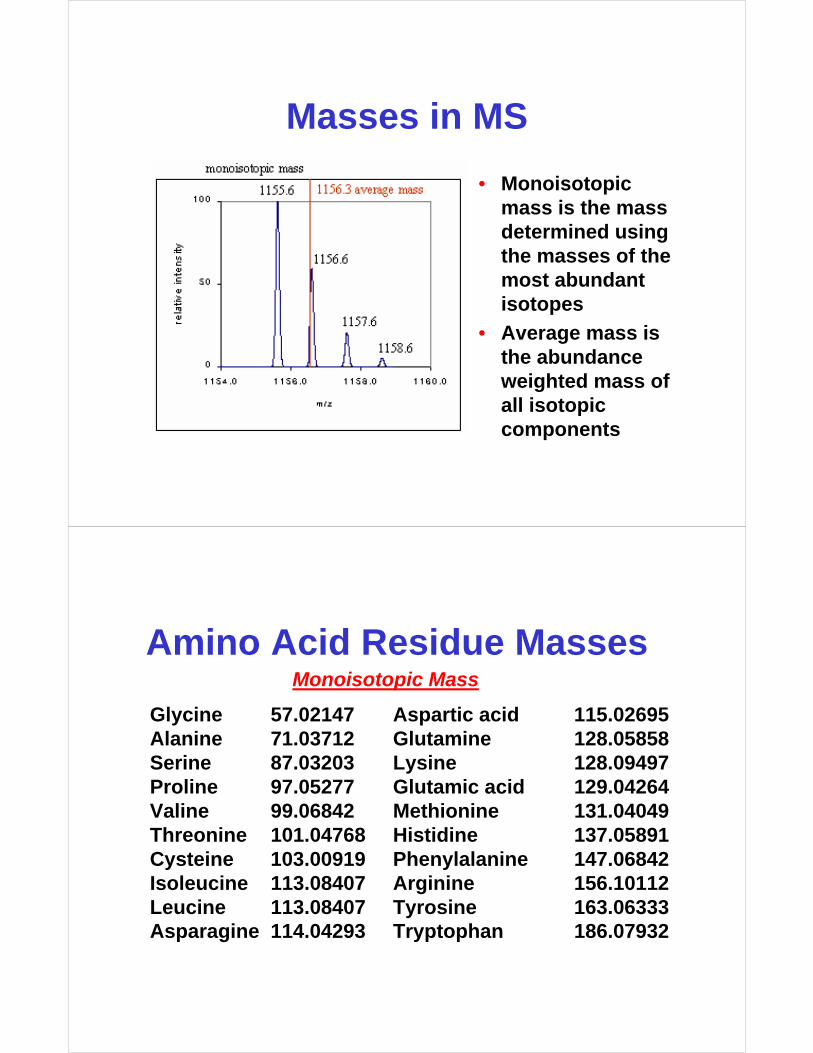
Masses in MS
• Monoisotopicmass is the mass determined using the masses of the most abundant isotopes
• Average mass is the abundance weighted mass of all isotopic components
Amino Acid Residue Masses
Glycine 57.02147Alanine 71.03712Serine 87.03203Proline 97.05277Valine 99.06842Threonine 101.04768Cysteine 103.00919Isoleucine 113.08407Leucine 113.08407Asparagine 114.04293
Aspartic acid 115.02695Glutamine 128.05858Lysine 128.09497Glutamic acid 129.04264Methionine 131.04049Histidine 137.05891Phenylalanine 147.06842Arginine 156.10112Tyrosine 163.06333Tryptophan 186.07932
Monoisotopic Mass
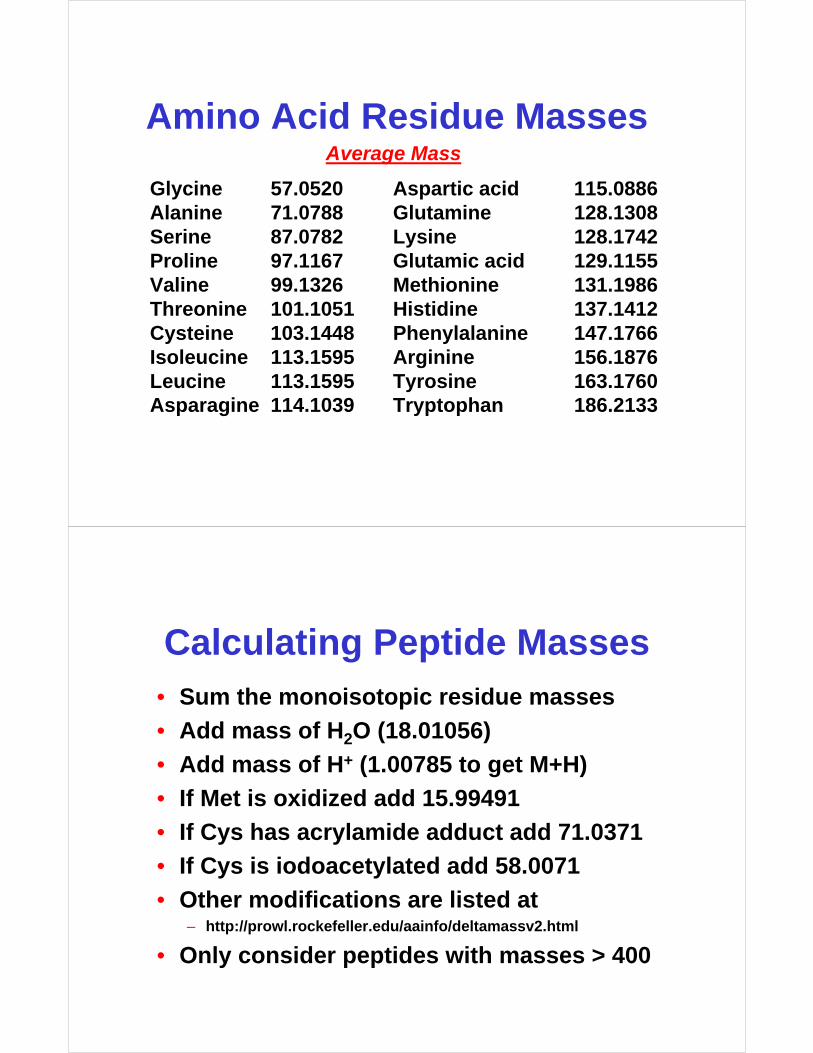
Amino Acid Residue Masses
Glycine 57.0520Alanine 71.0788Serine 87.0782Proline 97.1167Valine 99.1326Threonine 101.1051Cysteine 103.1448Isoleucine 113.1595Leucine 113.1595Asparagine 114.1039
Aspartic acid 115.0886Glutamine 128.1308Lysine 128.1742Glutamic acid 129.1155Methionine 131.1986Histidine 137.1412Phenylalanine 147.1766Arginine 156.1876Tyrosine 163.1760Tryptophan 186.2133
Average Mass
Calculating Peptide Masses• Sum the monoisotopic residue masses
• Add mass of H2O (18.01056)
• Add mass of H+ (1.00785 to get M+H)
• If Met is oxidized add 15.99491
• If Cys has acrylamide adduct add 71.0371
• If Cys is iodoacetylated add 58.0071
• Other modifications are listed at– http://prowl.rockefeller.edu/aainfo/deltamassv2.html
• Only consider peptides with masses > 400
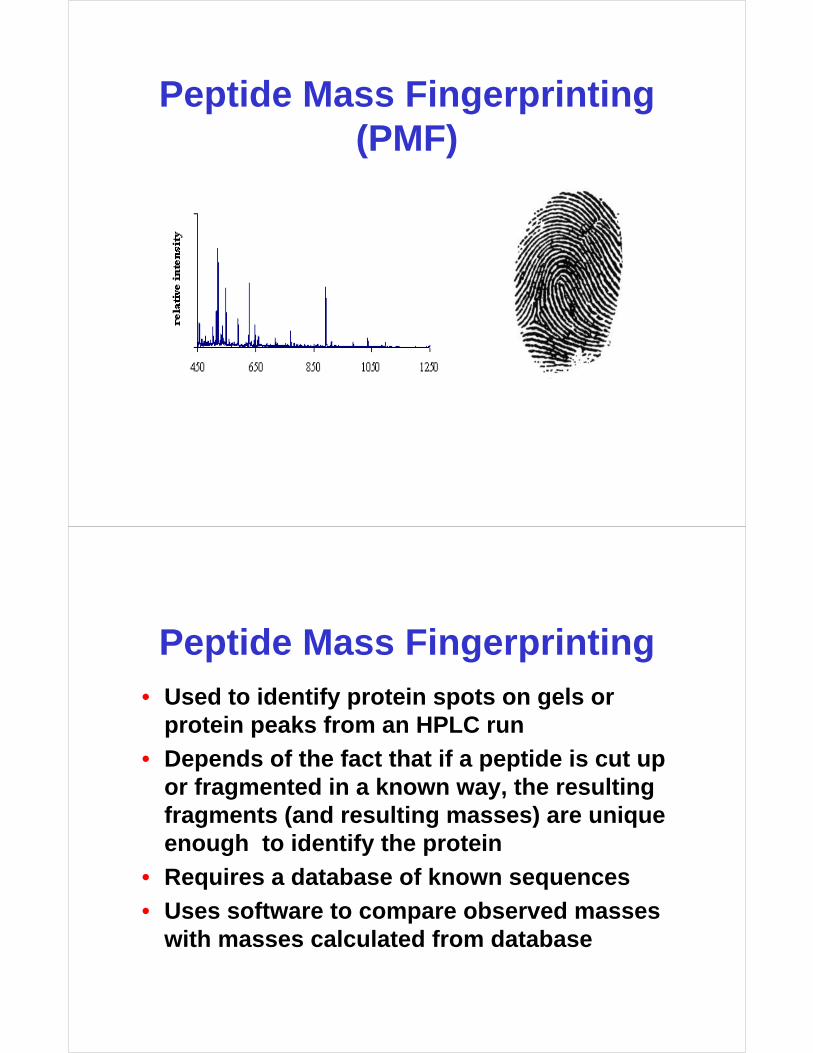
Peptide Mass Fingerprinting (PMF)
Peptide Mass Fingerprinting• Used to identify protein spots on gels or
protein peaks from an HPLC run
• Depends of the fact that if a peptide is cut up or fragmented in a known way, the resulting fragments (and resulting masses) are unique enough to identify the protein
• Requires a database of known sequences
• Uses software to compare observed masses with masses calculated from database
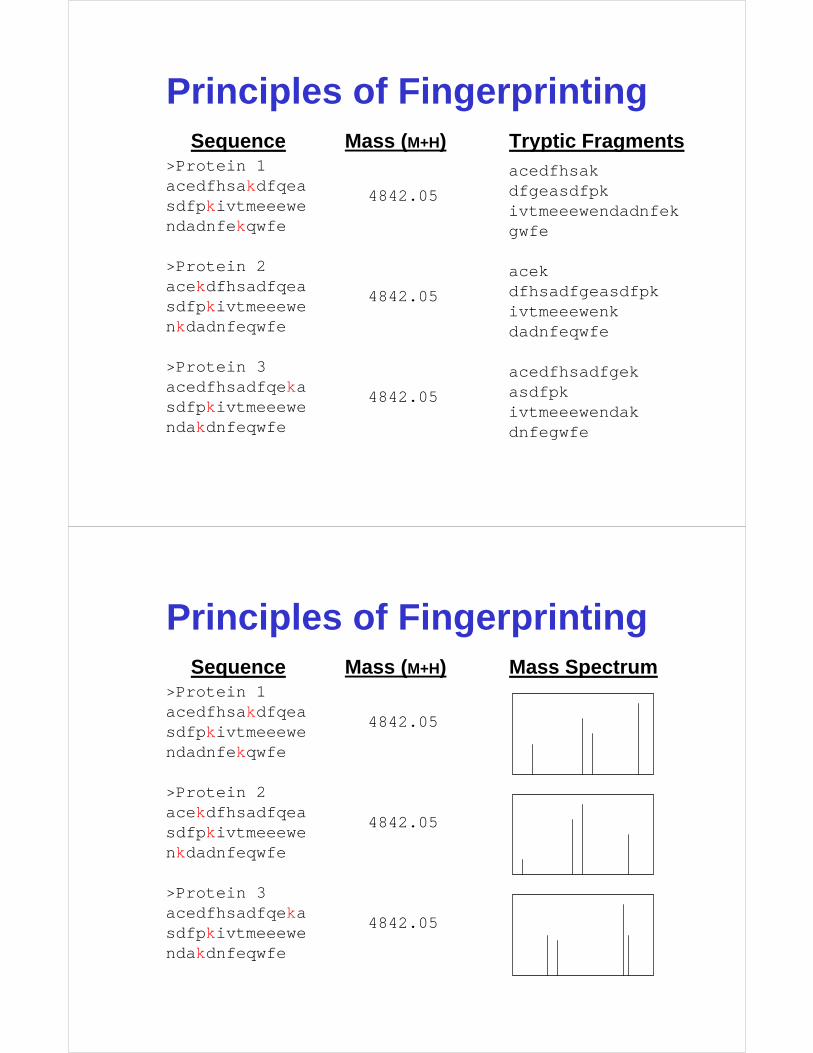
Principles of Fingerprinting
>Protein 1acedfhsakdfqeasdfpkivtmeeewendadnfekqwfe
>Protein 2acekdfhsadfqeasdfpkivtmeeewenkdadnfeqwfe
>Protein 3acedfhsadfqekasdfpkivtmeeewendakdnfeqwfe
Sequence Mass (M+H) Tryptic Fragments
4842.05
4842.05
4842.05
acedfhsakdfgeasdfpkivtmeeewendadnfekgwfe
acekdfhsadfgeasdfpkivtmeeewenkdadnfeqwfe
acedfhsadfgekasdfpkivtmeeewendakdnfegwfe
Principles of Fingerprinting
>Protein 1acedfhsakdfqeasdfpkivtmeeewendadnfekqwfe
>Protein 2acekdfhsadfqeasdfpkivtmeeewenkdadnfeqwfe
>Protein 3acedfhsadfqekasdfpkivtmeeewendakdnfeqwfe
Sequence Mass (M+H) Mass Spectrum
4842.05
4842.05
4842.05
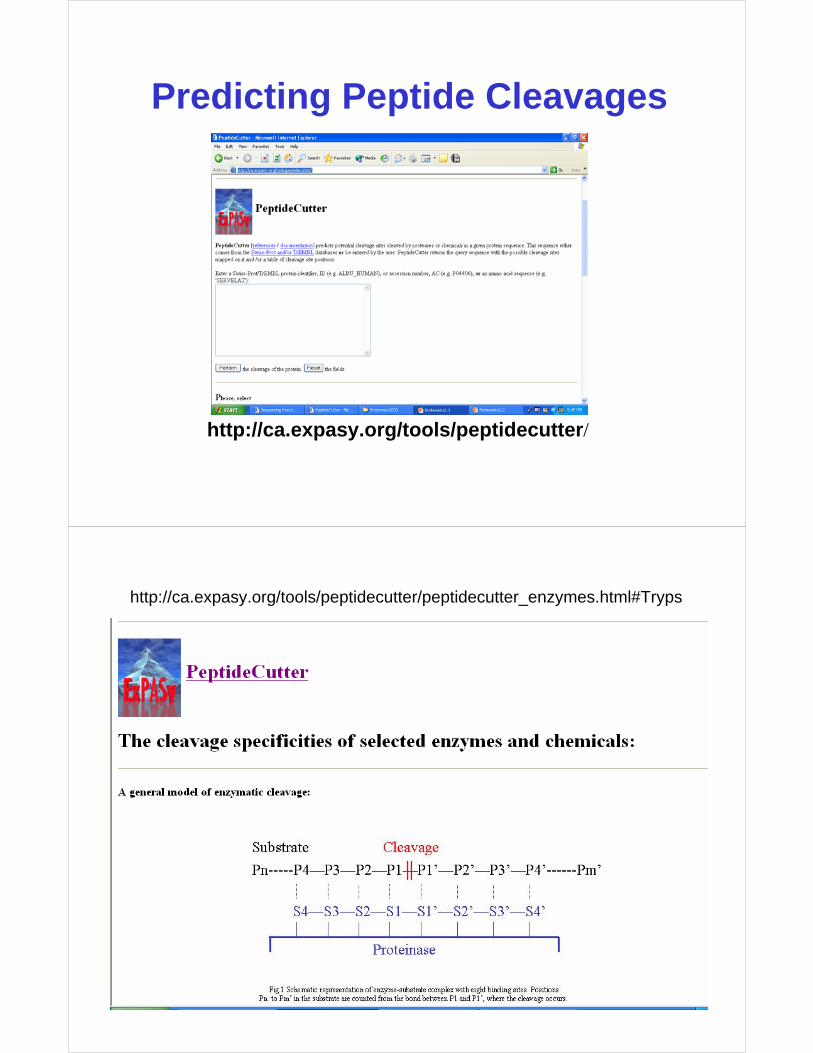
Predicting Peptide Cleavages
http://ca.expasy.org/tools/peptidecutter/
http://ca.expasy.org/tools/peptidecutter/peptidecutter_enzymes.html#Tryps
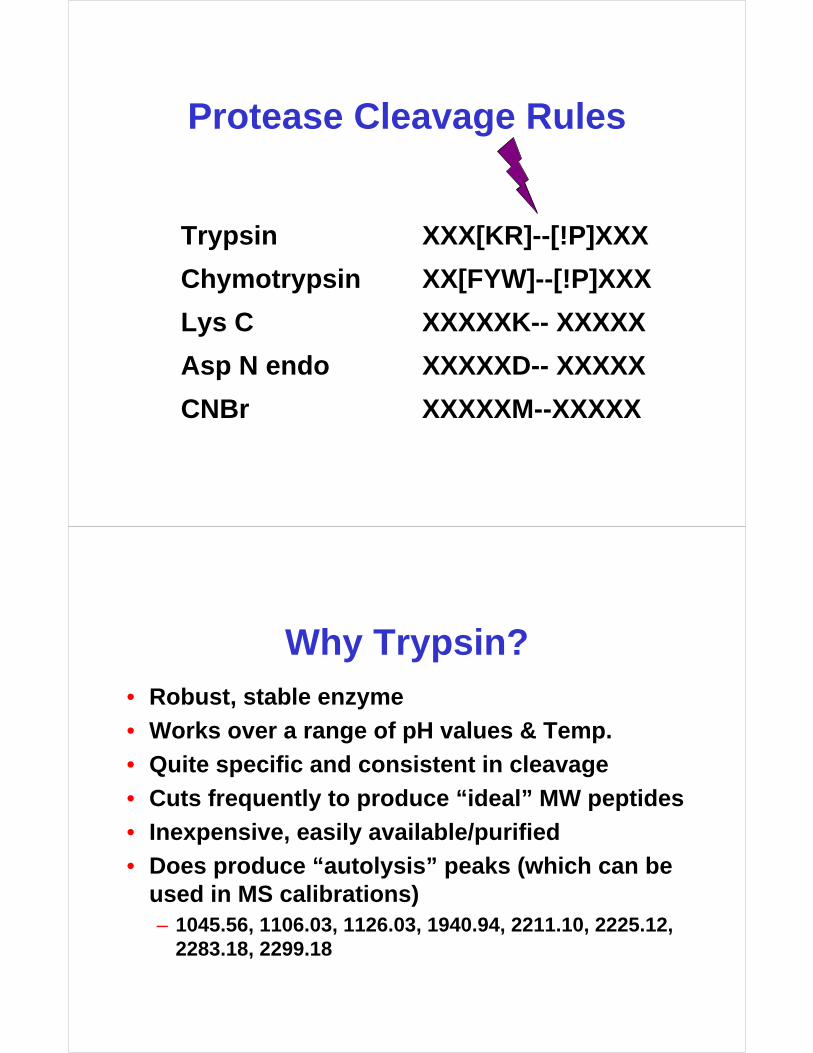
Protease Cleavage Rules
Trypsin XXX[KR]--[!P]XXX
Chymotrypsin XX[FYW]--[!P]XXX
Lys C XXXXXK-- XXXXX
Asp N endo XXXXXD-- XXXXX
CNBr XXXXXM--XXXXX
Why Trypsin?• Robust, stable enzyme
• Works over a range of pH values & Temp.
• Quite specific and consistent in cleavage
• Cuts frequently to produce “ideal” MW peptides
• Inexpensive, easily available/purified
• Does produce “autolysis” peaks (which can be used in MS calibrations)– 1045.56, 1106.03, 1126.03, 1940.94, 2211.10, 2225.12,
2283.18, 2299.18
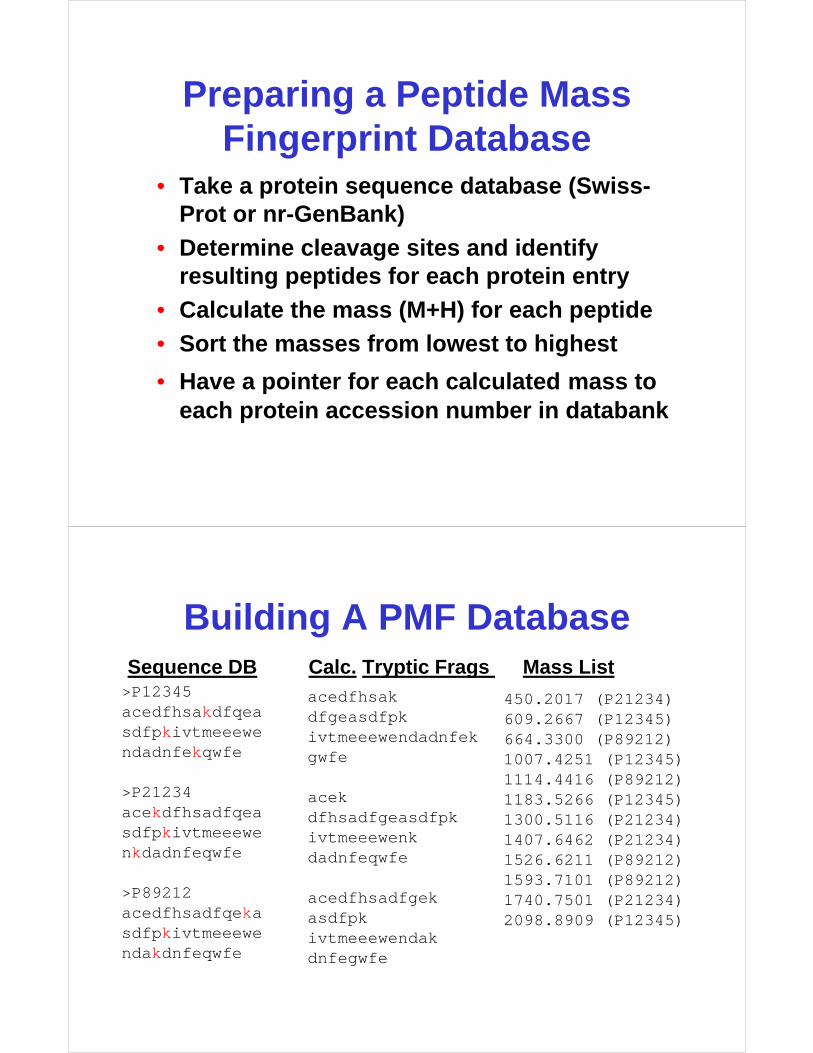
Preparing a Peptide Mass Fingerprint Database
• Take a protein sequence database (Swiss-Prot or nr-GenBank)
• Determine cleavage sites and identify resulting peptides for each protein entry
• Calculate the mass (M+H) for each peptide
• Sort the masses from lowest to highest
• Have a pointer for each calculated mass to each protein accession number in databank
Building A PMF Database
>P12345acedfhsakdfqeasdfpkivtmeeewendadnfekqwfe
>P21234acekdfhsadfqeasdfpkivtmeeewenkdadnfeqwfe
>P89212acedfhsadfqekasdfpkivtmeeewendakdnfeqwfe
Sequence DB Calc. Tryptic Frags Mass Listacedfhsakdfgeasdfpkivtmeeewendadnfekgwfe
acekdfhsadfgeasdfpkivtmeeewenkdadnfeqwfe
acedfhsadfgekasdfpkivtmeeewendakdnfegwfe
450.2017 (P21234) 609.2667 (P12345) 664.3300 (P89212) 1007.4251 (P12345)1114.4416 (P89212)1183.5266 (P12345)1300.5116 (P21234) 1407.6462 (P21234)1526.6211 (P89212)1593.7101 (P89212) 1740.7501 (P21234) 2098.8909 (P12345)
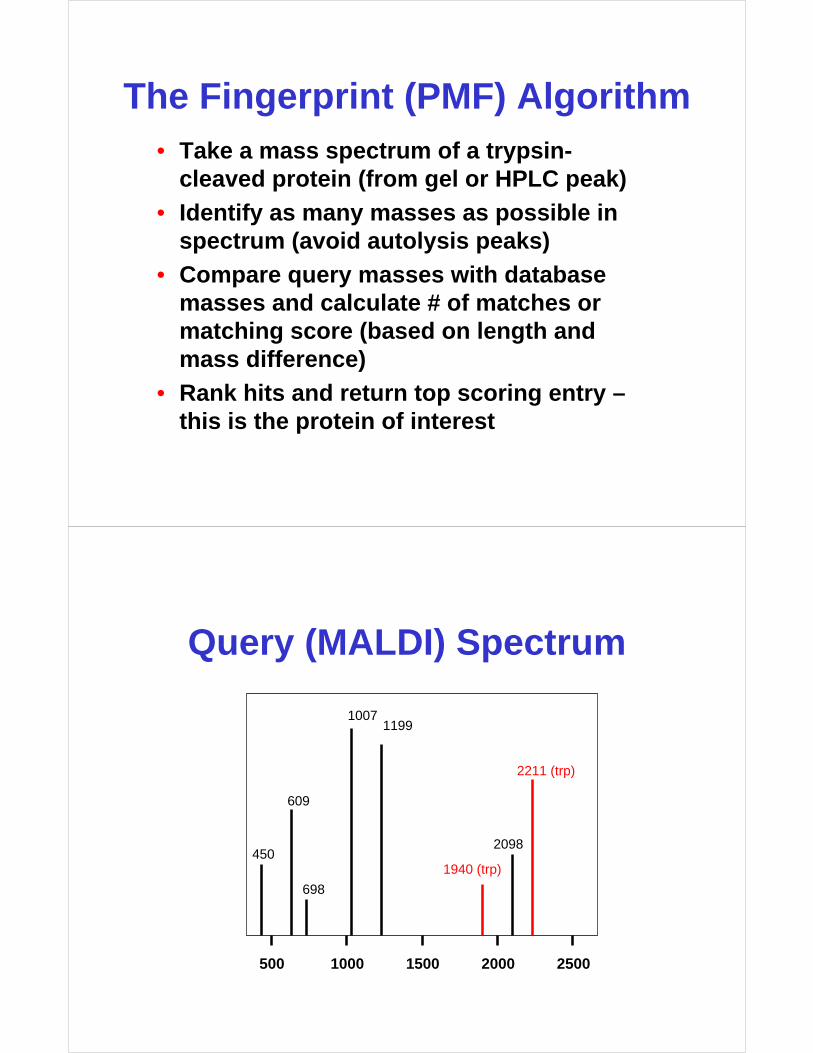
The Fingerprint (PMF) Algorithm• Take a mass spectrum of a trypsin-
cleaved protein (from gel or HPLC peak)
• Identify as many masses as possible in spectrum (avoid autolysis peaks)
• Compare query masses with database masses and calculate # of matches or matching score (based on length and mass difference)
• Rank hits and return top scoring entry –this is the protein of interest
Query (MALDI) Spectrum
500 1000 1500 2000 2500
698
2098
11991007
609
450
2211 (trp)
1940 (trp)
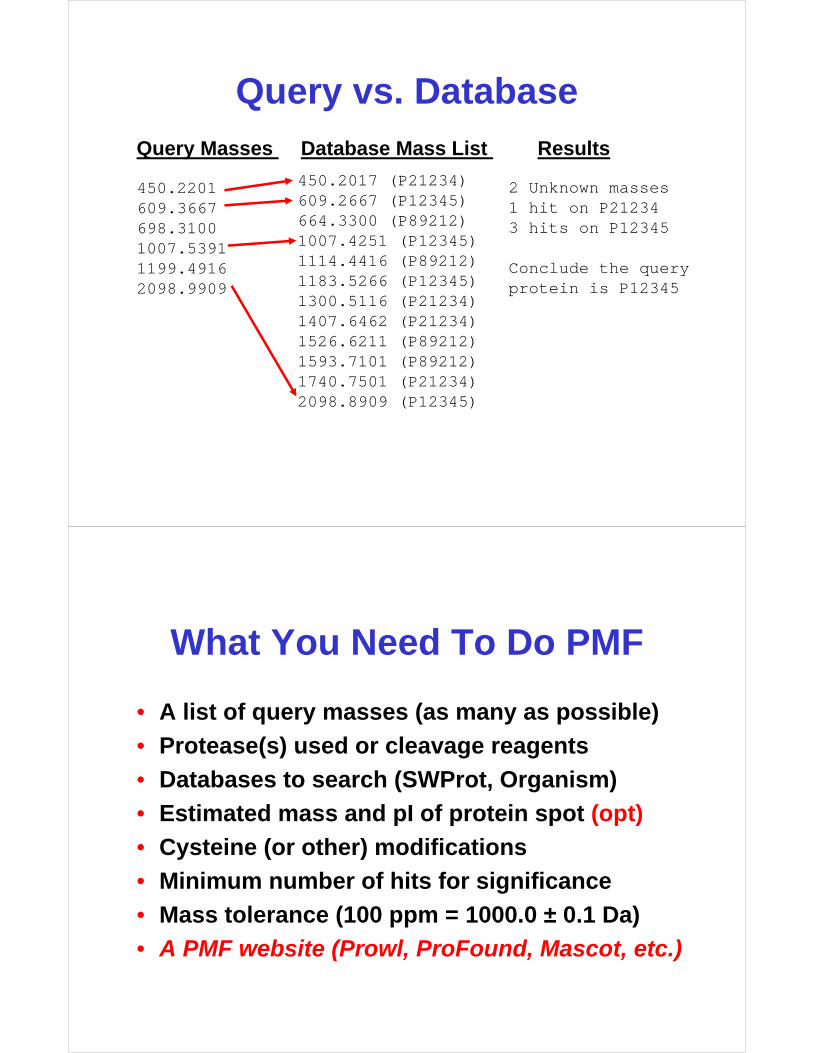
Query vs. Database
Query Masses Database Mass List Results
450.2017 (P21234) 609.2667 (P12345) 664.3300 (P89212) 1007.4251 (P12345)1114.4416 (P89212)1183.5266 (P12345)1300.5116 (P21234) 1407.6462 (P21234)1526.6211 (P89212)1593.7101 (P89212) 1740.7501 (P21234) 2098.8909 (P12345)
450.2201609.3667698.31001007.53911199.49162098.9909
2 Unknown masses1 hit on P212343 hits on P12345
Conclude the queryprotein is P12345
What You Need To Do PMF
• A list of query masses (as many as possible)
• Protease(s) used or cleavage reagents
• Databases to search (SWProt, Organism)
• Estimated mass and pI of protein spot (opt)
• Cysteine (or other) modifications
• Minimum number of hits for significance
• Mass tolerance (100 ppm = 1000.0 ± 0.1 Da)
• A PMF website (Prowl, ProFound, Mascot, etc.)
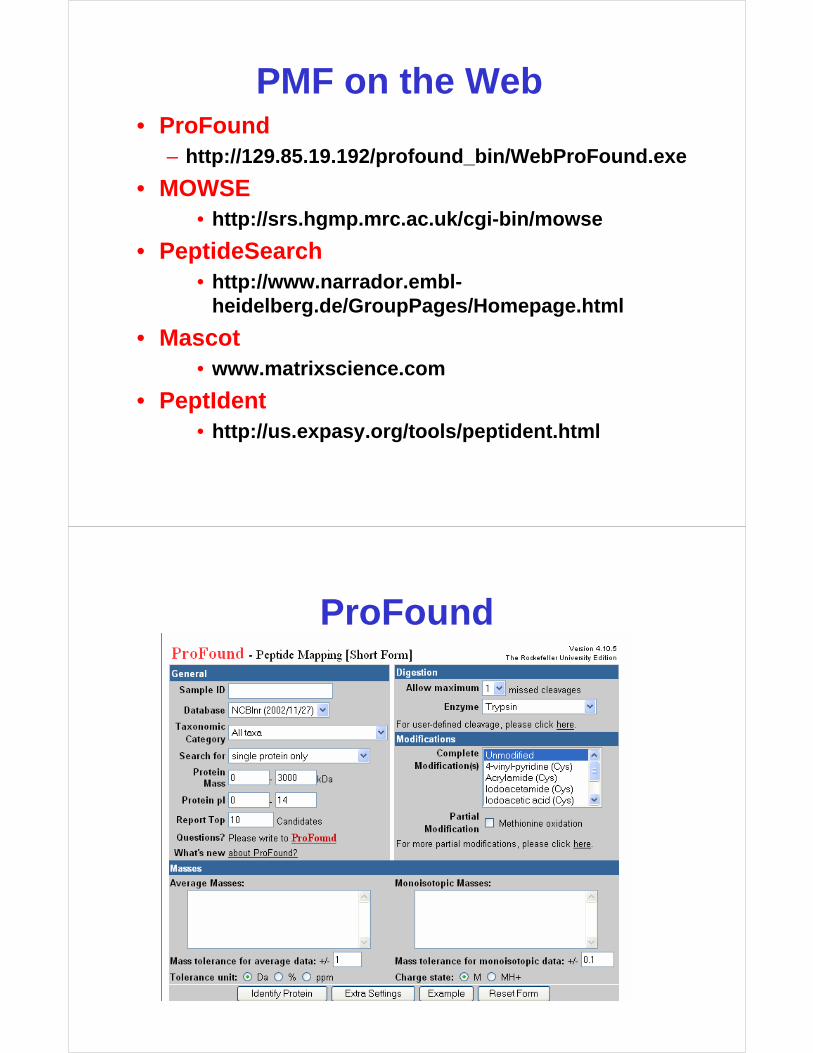
PMF on the Web• ProFound
– http://129.85.19.192/profound_bin/WebProFound.exe
• MOWSE• http://srs.hgmp.mrc.ac.uk/cgi-bin/mowse
• PeptideSearch• http://www.narrador.embl-
heidelberg.de/GroupPages/Homepage.html
• Mascot• www.matrixscience.com
• PeptIdent• http://us.expasy.org/tools/peptident.html
ProFound
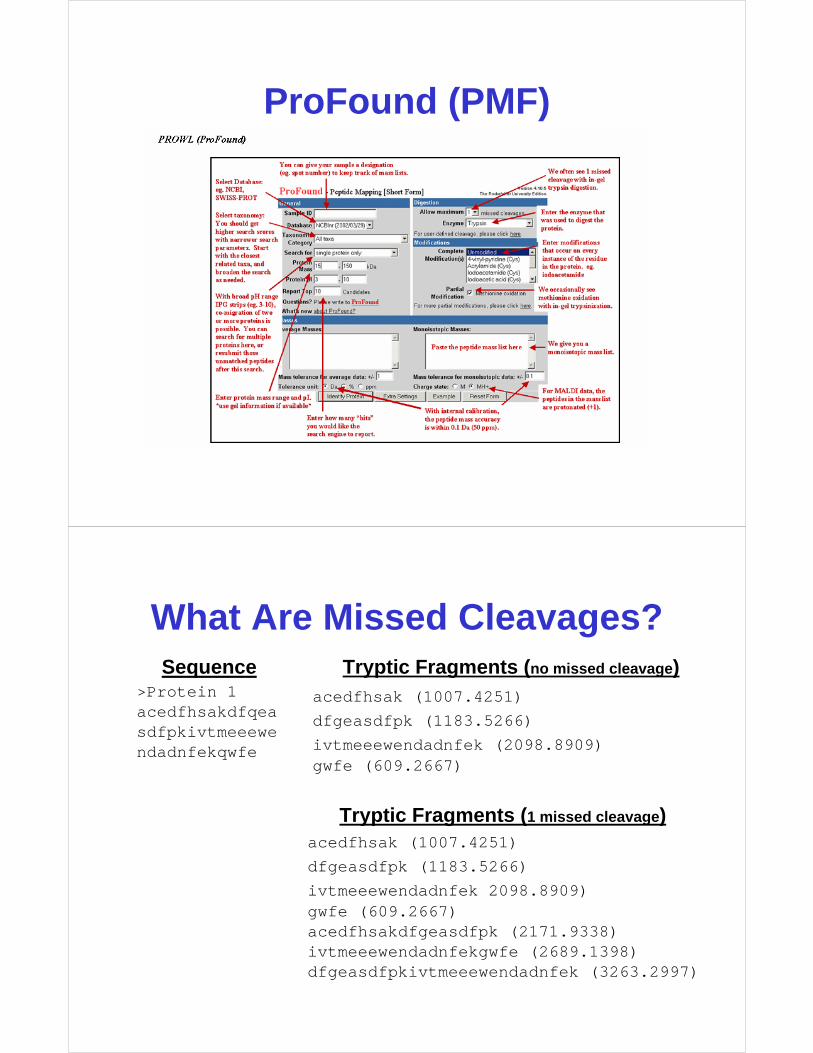
ProFound (PMF)
What Are Missed Cleavages?
>Protein 1acedfhsakdfqeasdfpkivtmeeewendadnfekqwfe
Sequence Tryptic Fragments (no missed cleavage)acedfhsak (1007.4251)
dfgeasdfpk (1183.5266)
ivtmeeewendadnfek (2098.8909)gwfe (609.2667)
Tryptic Fragments (1 missed cleavage)acedfhsak (1007.4251)
dfgeasdfpk (1183.5266)
ivtmeeewendadnfek 2098.8909)gwfe (609.2667)acedfhsakdfgeasdfpk (2171.9338)ivtmeeewendadnfekgwfe (2689.1398)dfgeasdfpkivtmeeewendadnfek (3263.2997)
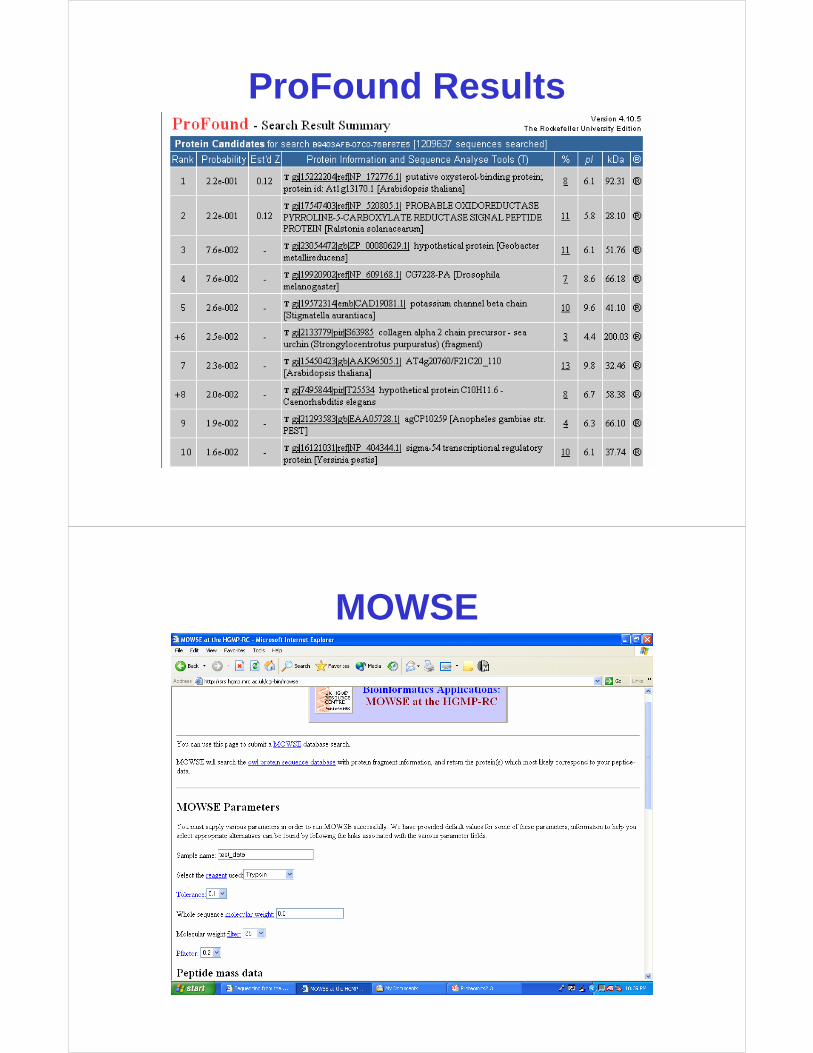
ProFound Results
MOWSE
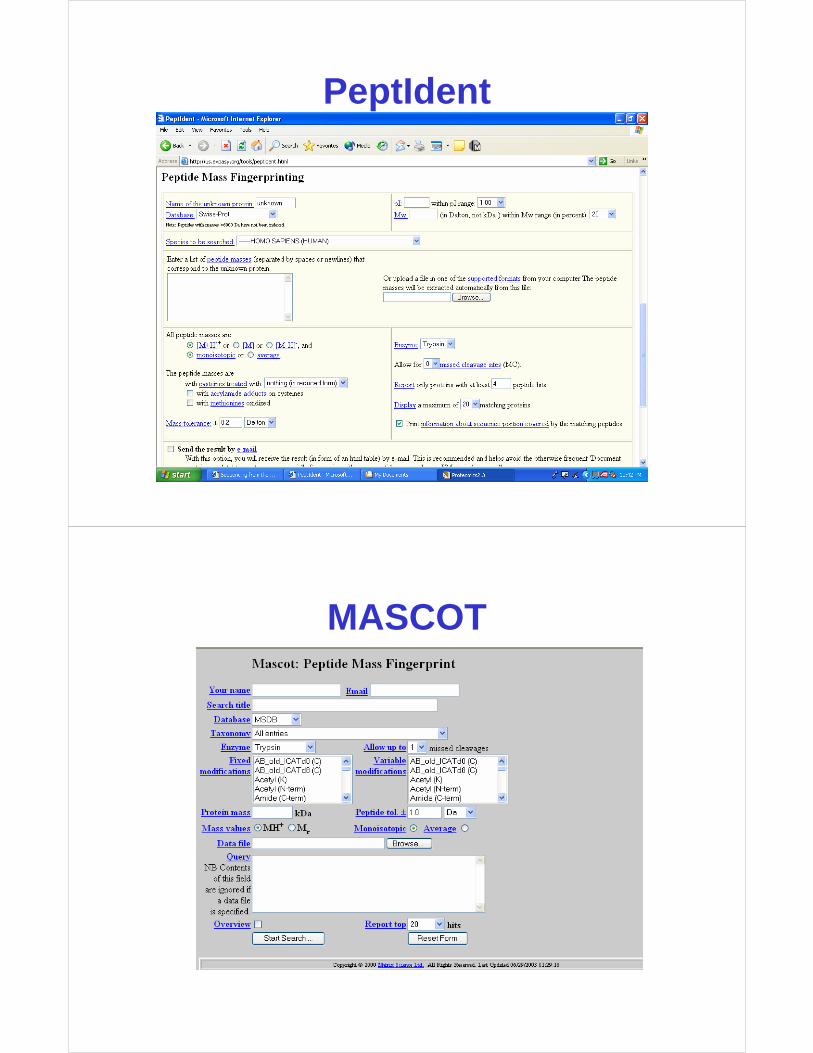
PeptIdent
MASCOT
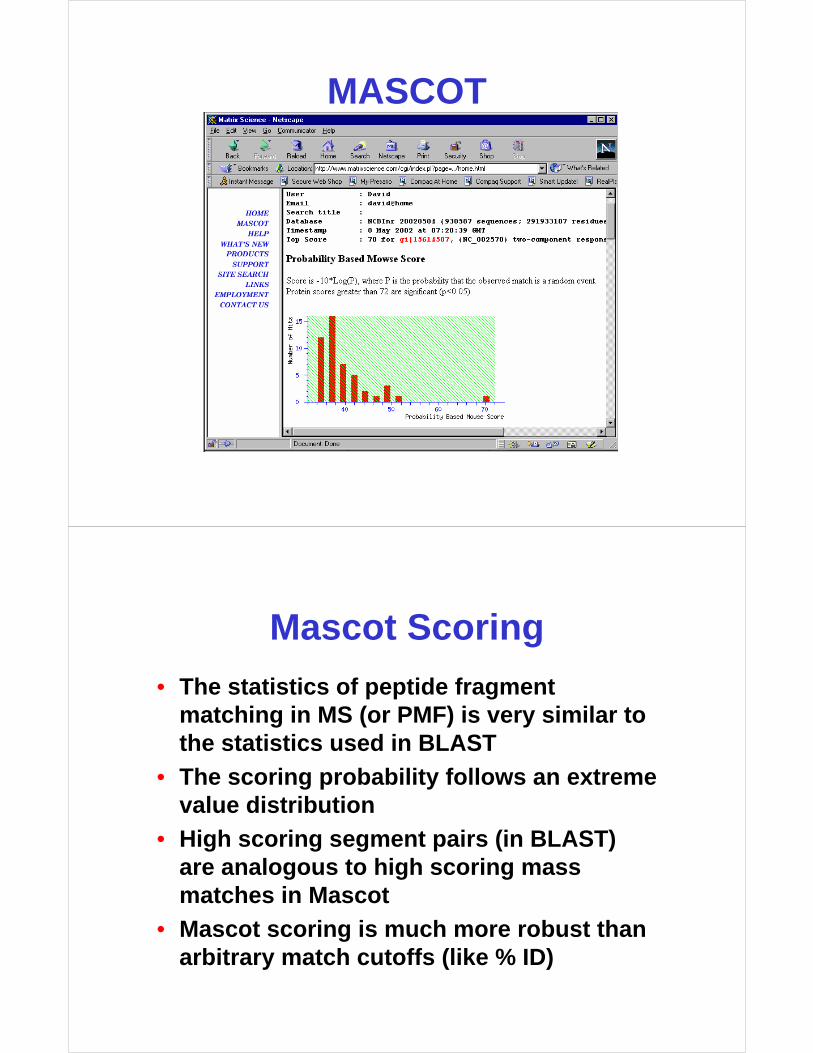
MASCOT
Mascot Scoring
• The statistics of peptide fragment matching in MS (or PMF) is very similar to the statistics used in BLAST
• The scoring probability follows an extreme value distribution
• High scoring segment pairs (in BLAST) are analogous to high scoring mass matches in Mascot
• Mascot scoring is much more robust than arbitrary match cutoffs (like % ID)
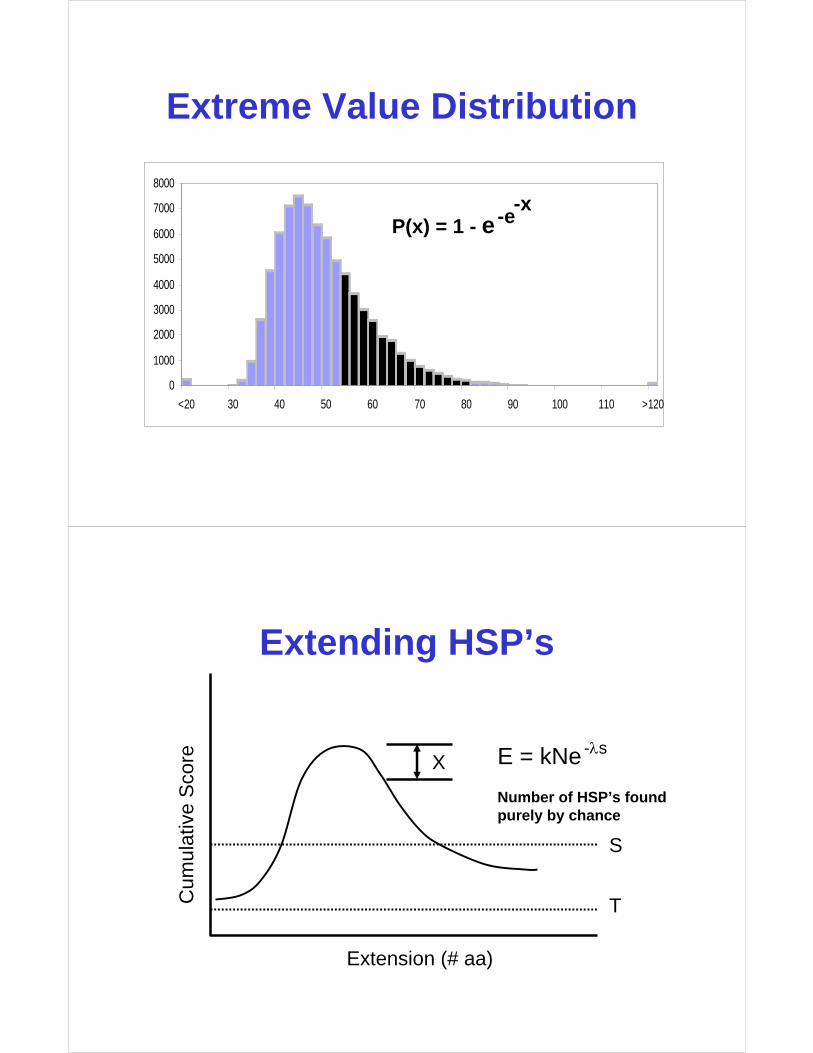
Extreme Value Distribution
0
1000
2000
3000
4000
5000
6000
7000
8000
<20 30 40 50 60 70 80 90 100 110 >120
P(x) = 1 - e -e-x
Extending HSP’s
Extension (# aa)
Cum
ulat
ive
Sco
re E = kNe
Number of HSP’s foundpurely by chance
-λsX
T
S
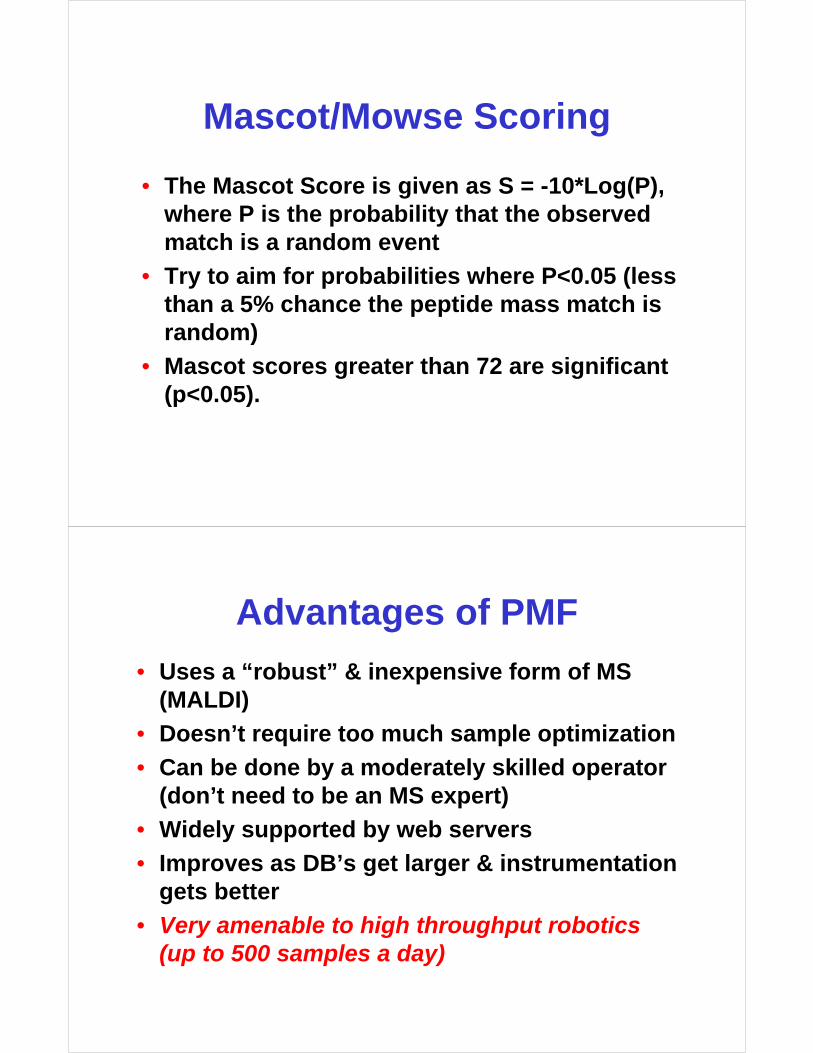
Mascot/Mowse Scoring
• The Mascot Score is given as S = -10*Log(P), where P is the probability that the observed match is a random event
• Try to aim for probabilities where P<0.05 (less than a 5% chance the peptide mass match is random)
• Mascot scores greater than 72 are significant (p<0.05).
Advantages of PMF
• Uses a “robust” & inexpensive form of MS (MALDI)
• Doesn’t require too much sample optimization
• Can be done by a moderately skilled operator (don’t need to be an MS expert)
• Widely supported by web servers
• Improves as DB’s get larger & instrumentation gets better
• Very amenable to high throughput robotics (up to 500 samples a day)
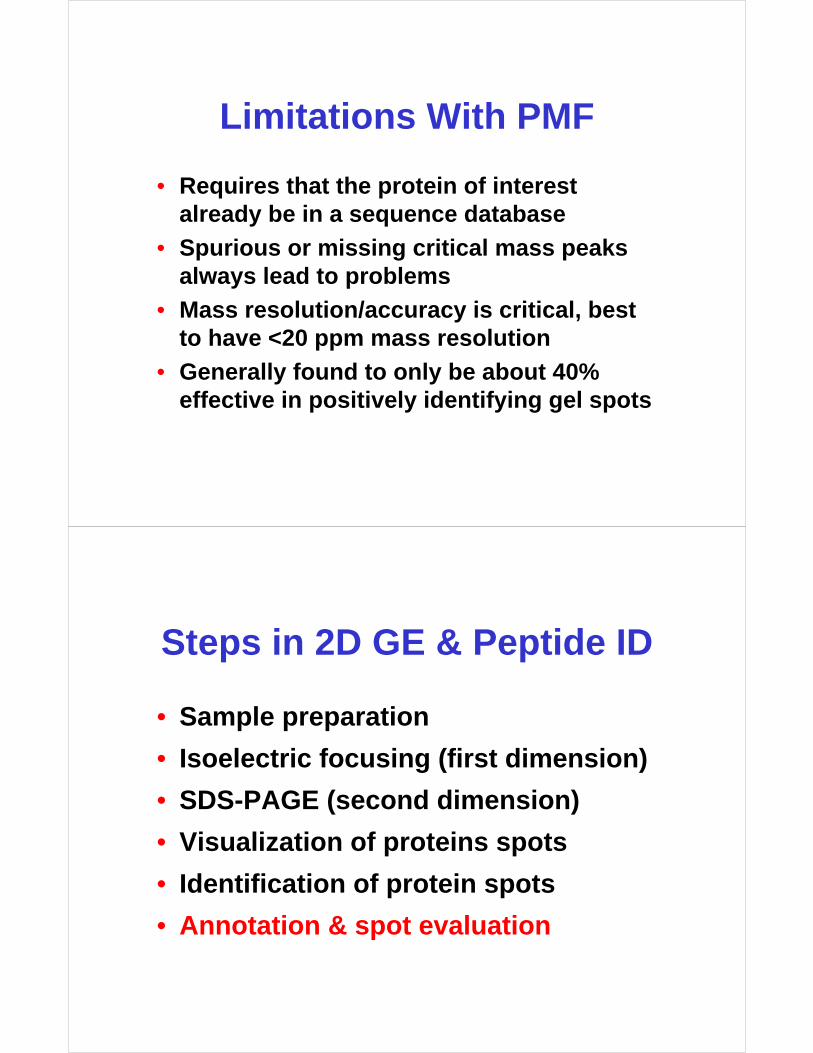
Limitations With PMF
• Requires that the protein of interest already be in a sequence database
• Spurious or missing critical mass peaks always lead to problems
• Mass resolution/accuracy is critical, best to have <20 ppm mass resolution
• Generally found to only be about 40% effective in positively identifying gel spots
Steps in 2D GE & Peptide ID
• Sample preparation
• Isoelectric focusing (first dimension)
• SDS-PAGE (second dimension)
• Visualization of proteins spots
• Identification of protein spots
• Annotation & spot evaluation
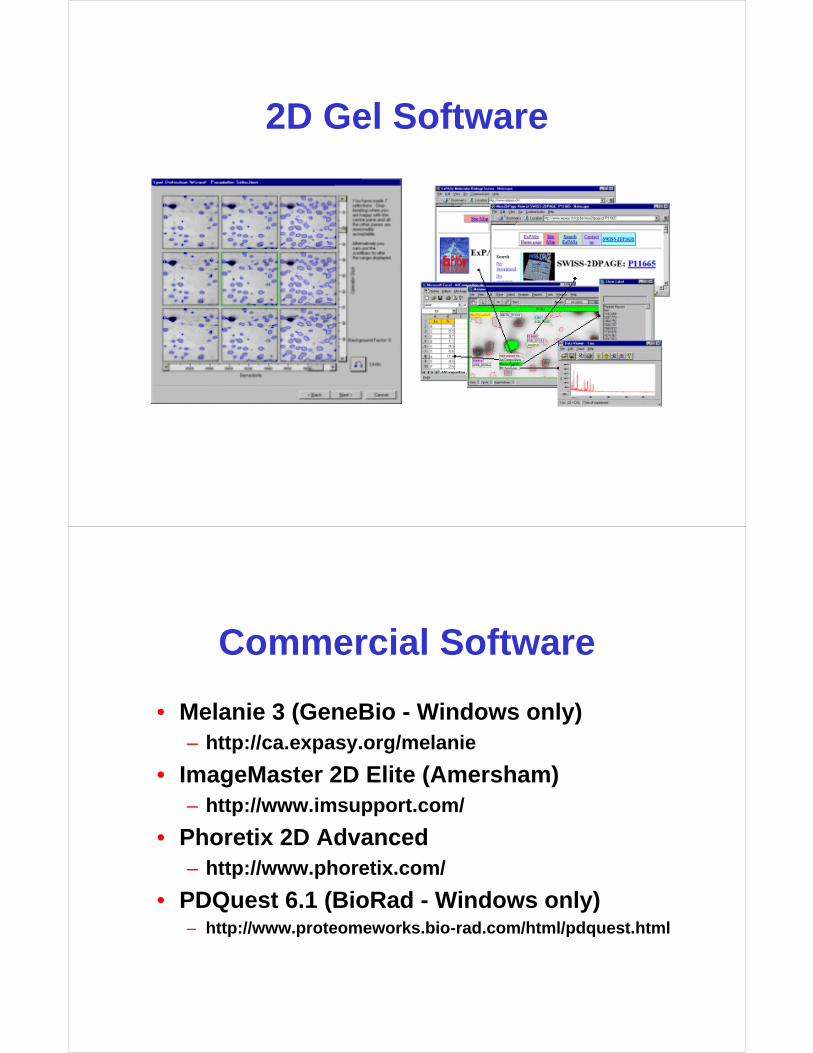
2D Gel Software
Commercial Software
• Melanie 3 (GeneBio - Windows only)– http://ca.expasy.org/melanie
• ImageMaster 2D Elite (Amersham)– http://www.imsupport.com/
• Phoretix 2D Advanced– http://www.phoretix.com/
• PDQuest 6.1 (BioRad - Windows only)– http://www.proteomeworks.bio-rad.com/html/pdquest.html
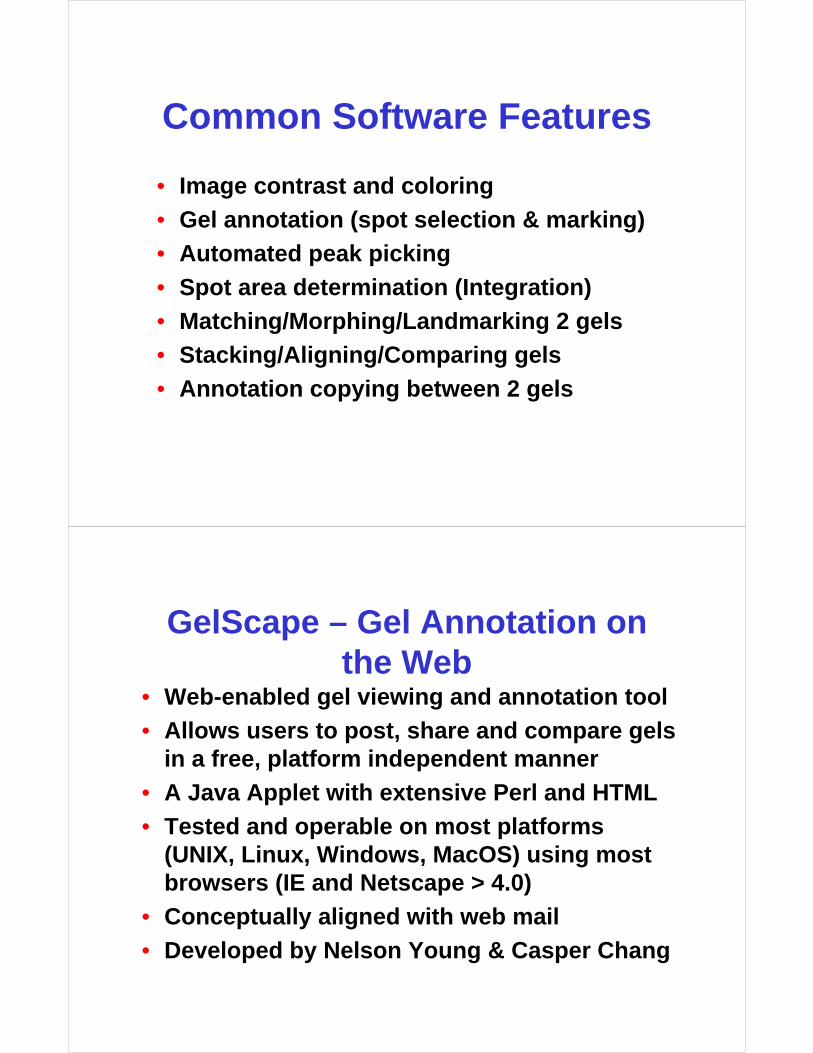
Common Software Features
• Image contrast and coloring
• Gel annotation (spot selection & marking)
• Automated peak picking
• Spot area determination (Integration)
• Matching/Morphing/Landmarking 2 gels
• Stacking/Aligning/Comparing gels
• Annotation copying between 2 gels
GelScape – Gel Annotation on the Web
• Web-enabled gel viewing and annotation tool
• Allows users to post, share and compare gels in a free, platform independent manner
• A Java Applet with extensive Perl and HTML
• Tested and operable on most platforms (UNIX, Linux, Windows, MacOS) using most browsers (IE and Netscape > 4.0)
• Conceptually aligned with web mail
• Developed by Nelson Young & Casper Chang
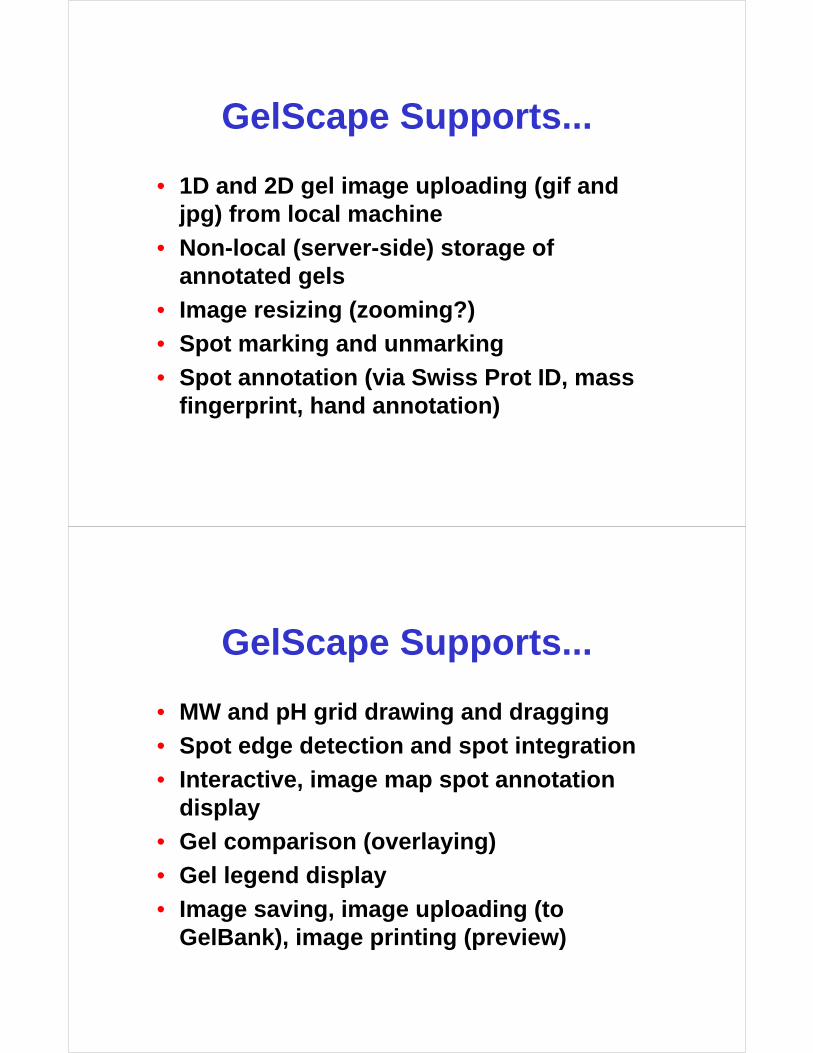
GelScape Supports...
• 1D and 2D gel image uploading (gif and jpg) from local machine
• Non-local (server-side) storage of annotated gels
• Image resizing (zooming?)
• Spot marking and unmarking
• Spot annotation (via Swiss Prot ID, mass fingerprint, hand annotation)
GelScape Supports...
• MW and pH grid drawing and dragging
• Spot edge detection and spot integration
• Interactive, image map spot annotation display
• Gel comparison (overlaying)
• Gel legend display
• Image saving, image uploading (to GelBank), image printing (preview)
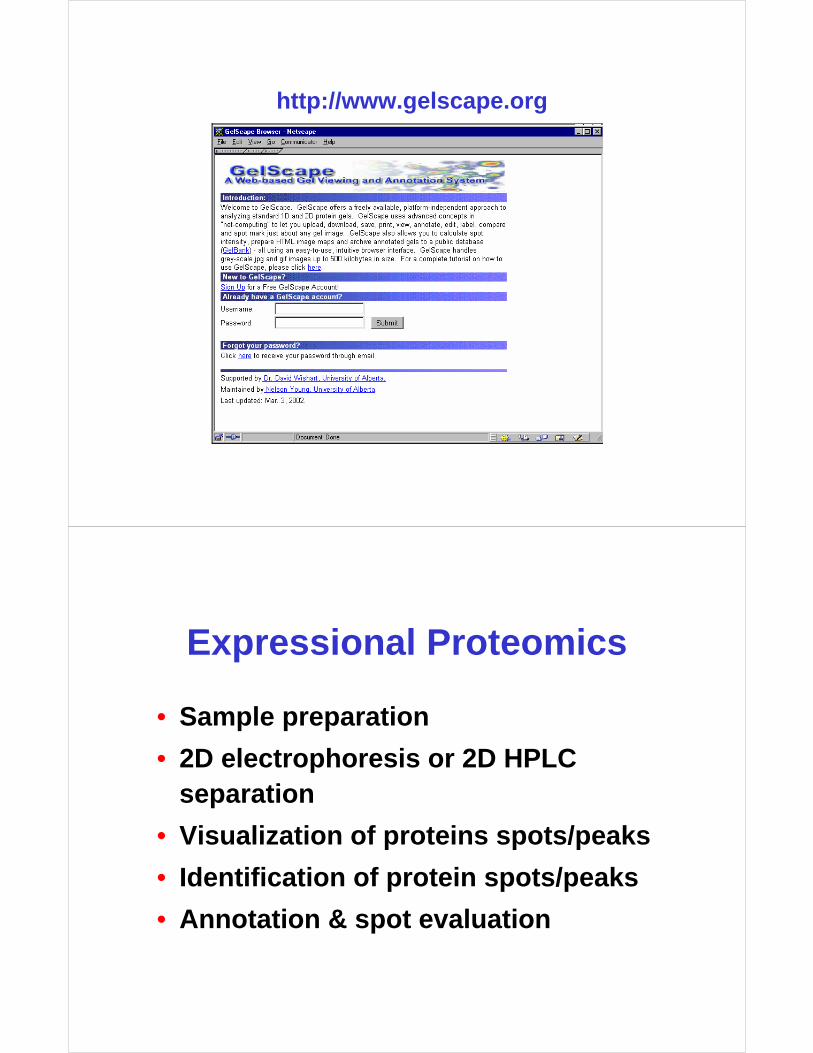
http://www.gelscape.org
Expressional Proteomics
• Sample preparation
• 2D electrophoresis or 2D HPLC separation
• Visualization of proteins spots/peaks
• Identification of protein spots/peaks
• Annotation & spot evaluation
3 Kinds of Proteomics
• Structural Proteomics
– High throughput X-ray Crystallography/Modelling
– High throughput NMR Spectroscopy/Modelling
• Expressional or Analytical Proteomics
– Electrophoresis, Protein Chips, DNA Chips, 2D-HPLC
– Mass Spectrometry, Microsequencing
• Functional or Interaction Proteomics
– HT Functional Assays, Protein Chips, Ligand Chips
– Yeast 2-hybrid, Deletion Analysis, Motif Analysis