Embed Size (px)
Citation preview
The Economic Power of Water
Charles Iceland, Aqueduct Director
June 3, 2015
AQUEDUCTTM
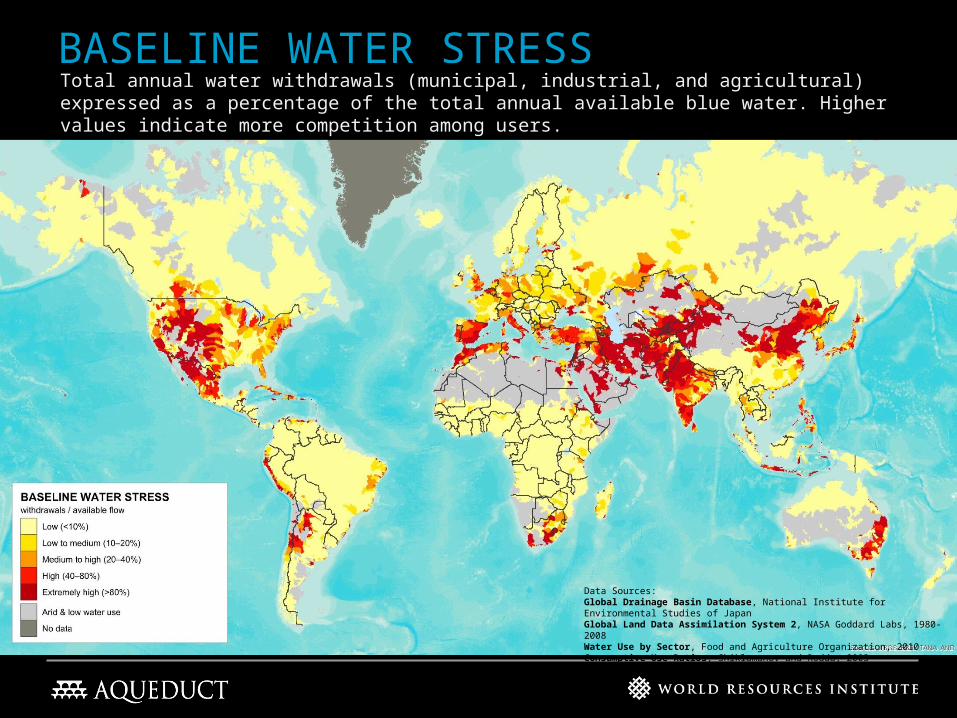
BASELINE WATER STRESSTotal annual water withdrawals (municipal, industrial, and agricultural) expressed as a percentage of the total annual available blue water. Higher values indicate more competition among users.
Data Sources:Global Drainage Basin Database, National Institute for Environmental Studies of JapanGlobal Land Data Assimilation System 2, NASA Goddard Labs, 1980-2008Water Use by Sector, Food and Agriculture Organization, 2010Consumptive Use Ratios, Shiklamanov and Rodda, 2003
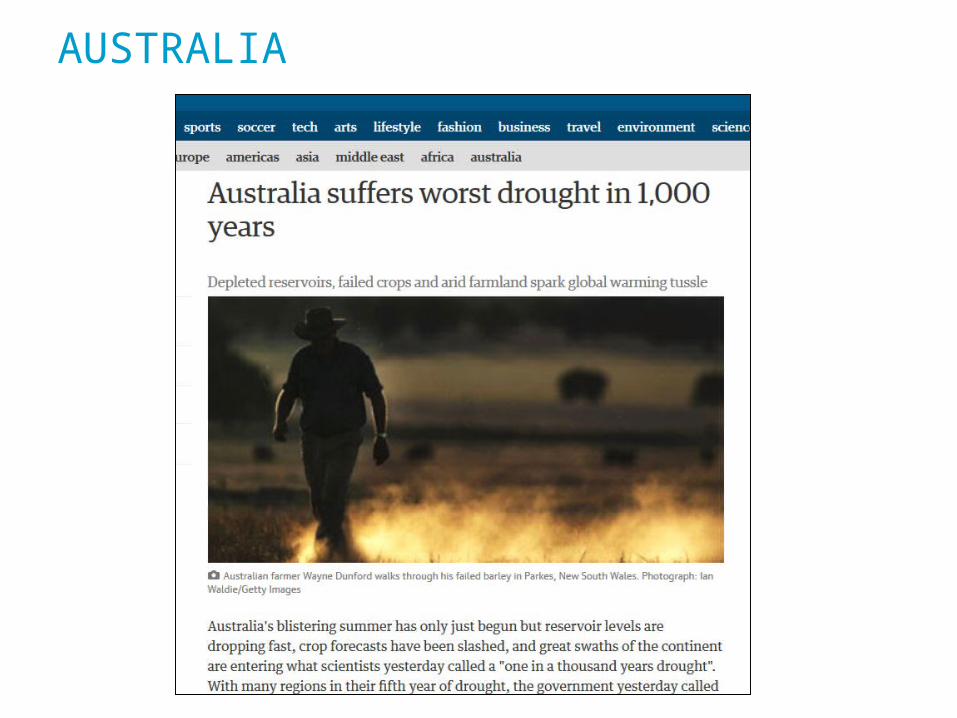
AUSTRALIA

SPAIN
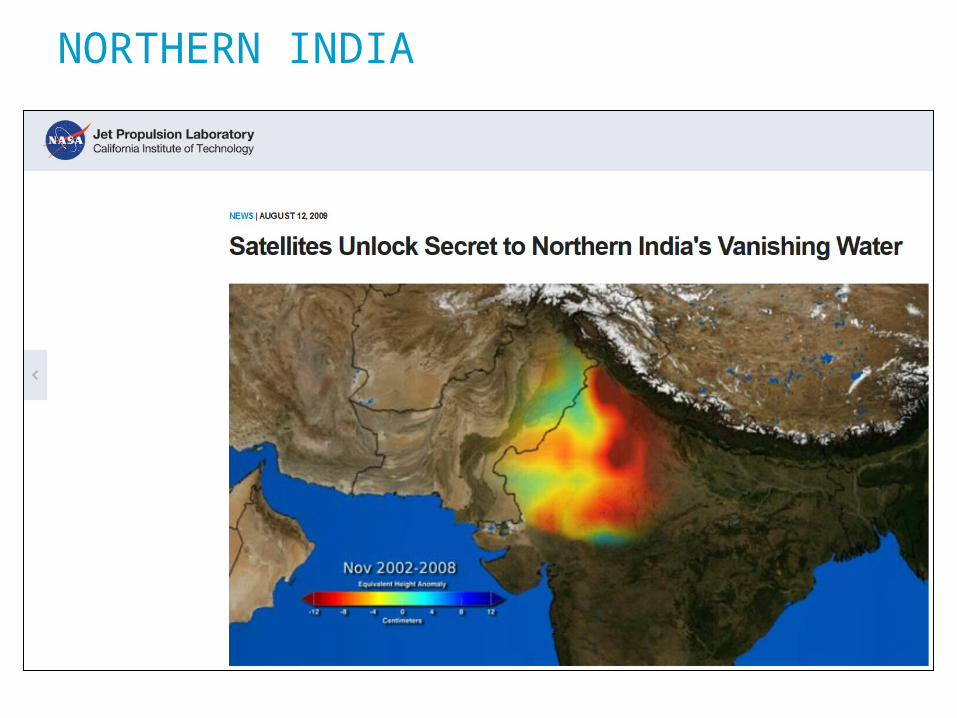
NORTHERN INDIA
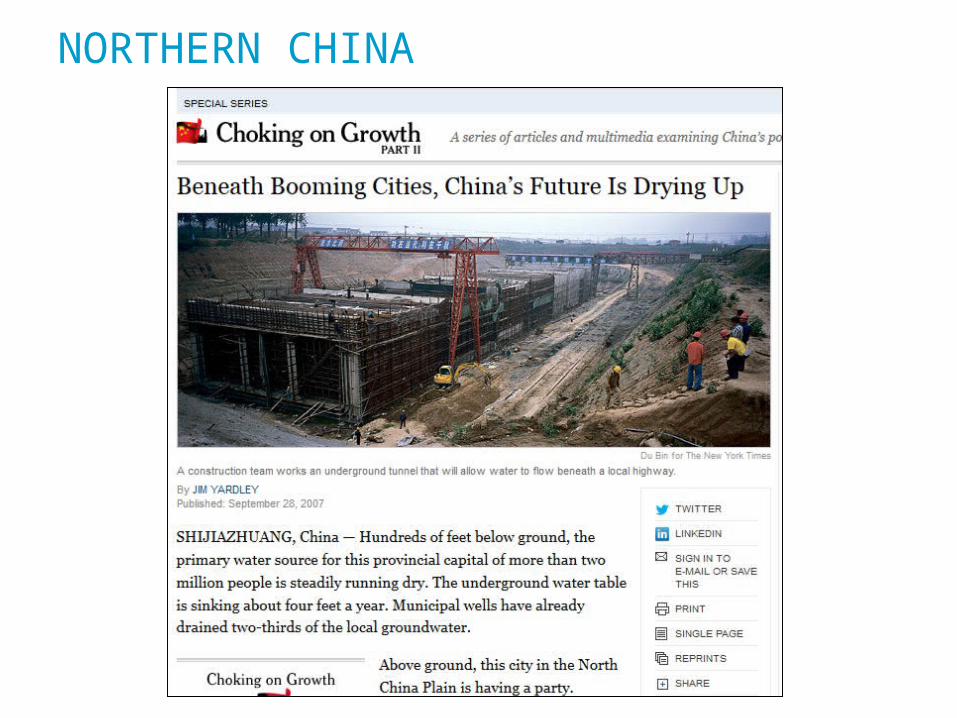
NORTHERN CHINA

SYRIA, IRAQ, IRAN & TURKEY
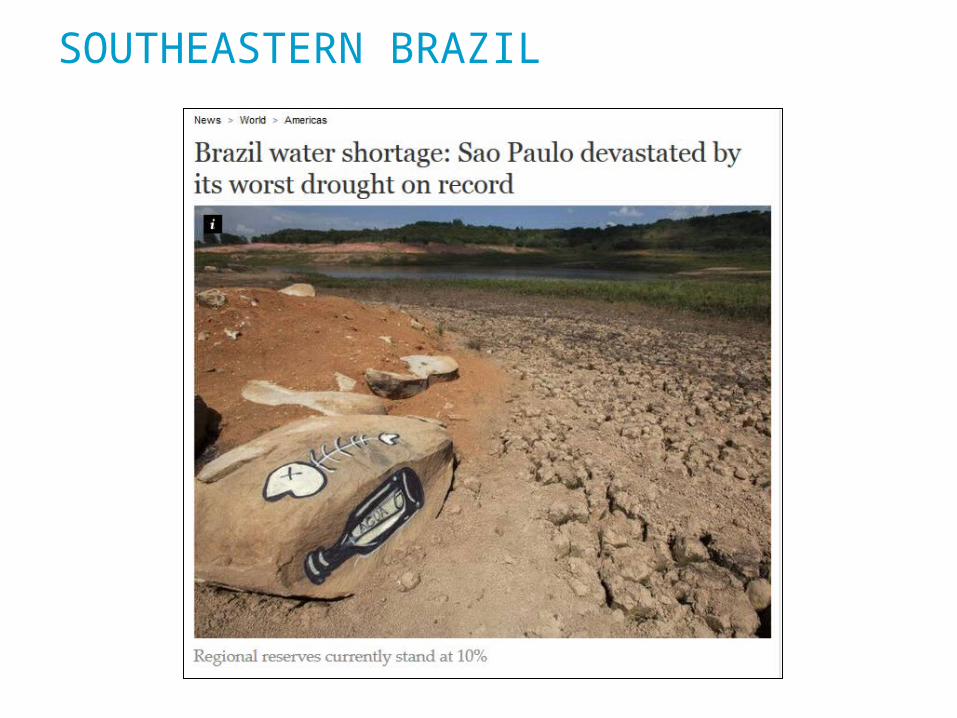
SOUTHEASTERN BRAZIL
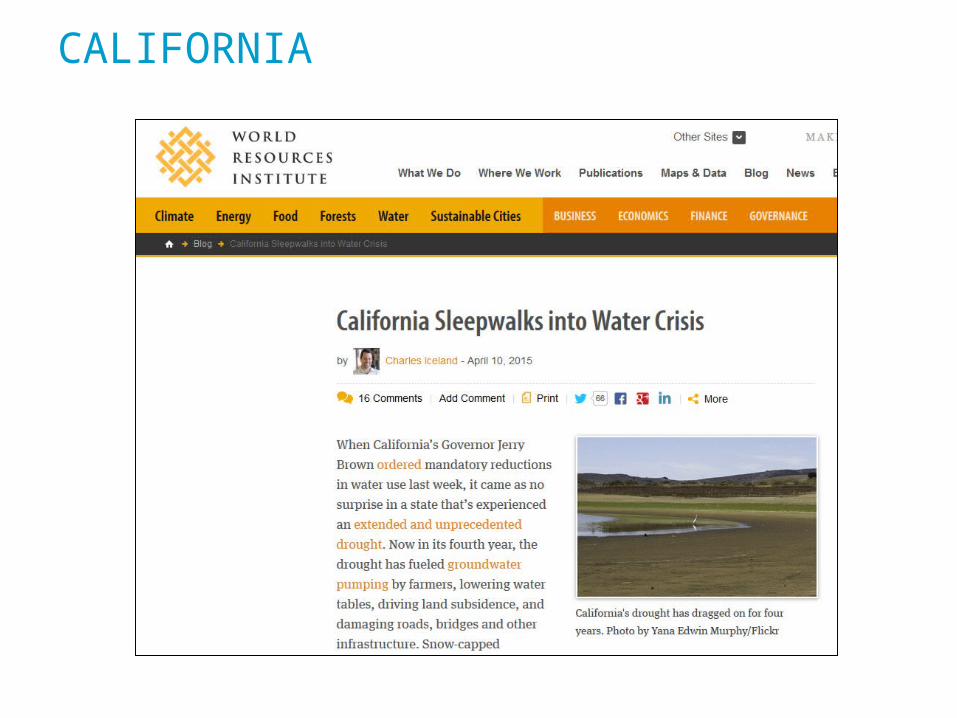
CALIFORNIA

WATER STRESS (RCP85/SSP3) 2020
relative change (2020 / 2005)
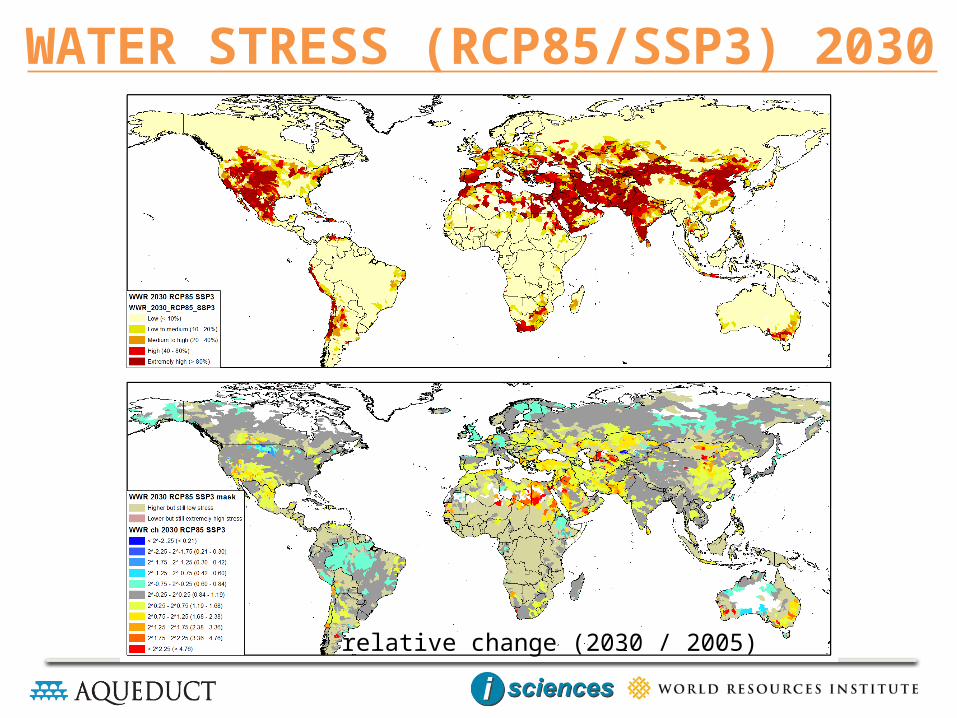
WATER STRESS (RCP85/SSP3) 2030
relative change (2030 / 2005)

WATER STRESS (RCP85/SSP3) 2040
relative change (2040 / 2005)

RELATIVE CHANGE IN SUPPLY & DEMAND
relative change in demand (2040/2005)
relative change in supply (2040/2005)

GROUNDWATER STRESSRatio of groundwater withdrawal relative to recharge rate; values above one indicate where unsustainable groundwater consumption could affect groundwater availability and groundwater-dependent ecosystems.
Data Sources:Water Balance of Global Aquifers Revealed by Groundwater Footprint, Gleeson, T., Wada, Y., Bierkens, M.F.P., and van Beek, L.P.H., 1958-2000