Embed Size (px)
Citation preview

lable at ScienceDirect
Journal of Environmental Management 90 (2009) 3185–3196
Contents lists avai
Journal of Environmental Management
journal homepage: www.elsevier .com/locate/ jenvman
Review
China’s water scarcity
Yong Jiang*
Department of Agricultural, Food, and Resource Economics, Michigan State University, 85 Agriculture Hall, East Lansing, MI 48824, USA
a r t i c l e i n f o
Article history:Received 6 May 2008Received in revised form9 March 2009Accepted 16 April 2009Available online 17 June 2009
Keywords:Water resourcesScarcityPollutionChinaManagement
* Tel.: þ1 517 353 2981; fax: þ1 517 432 1800.E-mail address: [email protected]
0301-4797/$ – see front matter � 2009 Elsevier Ltd.doi:10.1016/j.jenvman.2009.04.016
a b s t r a c t
China has been facing increasingly severe water scarcity, especially in the northern part of the country.China’s water scarcity is characterized by insufficient local water resources as well as reduced waterquality due to increasing pollution, both of which have caused serious impacts on society and theenvironment. Three factors contribute to China’s water scarcity: uneven spatial distribution of waterresources; rapid economic development and urbanization with a large and growing population; and poorwater resource management. While it is nearly impossible to adjust the first two factors, improvingwater resource management represents a cost-effective option that can alleviate China’s vulnerability tothe issue. Improving water resource management is a long-term task requiring a holistic approach withconstant effort. Water right institutions, market-based approaches, and capacity building should be thegovernment’s top priority to address the water scarcity issue.
� 2009 Elsevier Ltd. All rights reserved.
1. Introduction
China has been facing increasingly severe water scarcity. Withinsufficient water resources to meet rising water consumption,over-withdrawal of both surface water and groundwater hasoccurred in many areas of northern and eastern China. Over-exploiting water resources has led to serious environmentalconsequences, such as ground subsidence, salinity intrusion, andecosystem deterioration (Liu and Yu, 2001; Han, 2003; Fosteret al., 2004; Liu and Xia, 2004; Fan et al., 2006; Cai and Ringler,2007; Xia et al., 2007). Meanwhile, poor water quality caused bypollution further exacerbates the lack of water availability inwater-scarce areas (SEPA, 1991–2007; Zhu et al., 2001; Liu andDiamond, 2005; Li, 2006; CAS, 2007; WB, 2007a). Water short-ages and poor water quality are interacting with each other andthreatening China’s food security, economic development, andquality of life.
The Chinese government is aware of the water scarcityproblem and started reforming its water resource management inthe late 1990s. Yet the problems of water shortages and degradedwater quality are still severe. The complexity of China’s waterscarcity issue and its emerging serious effects on society and theenvironment raise many important questions. Is the water
All rights reserved.
problem well understood? What has caused China’s water scar-city? How could the Chinese government target its efforts tomore effectively improve water resource management andto better address water resource issues? China is motivated toaddress the water problem as part of its policy initiativeto promote ‘‘scientific development’’ consistent with a healthyenvironment (SC, 2006; MWR, 2007b). Water resource manage-ment is a top priority in the government’s policy agenda (SC,2006). As China struggles to develop effective approaches toalleviate water shortages, a clear understanding of the waterscarcity issue is critically important.
China’s water resource issues have attracted extensiveworldwide attention and have been covered by major mediaoutlets such as the New York Times and the Economist (Wong,2007; Yardley, 2007; Economist, 2009). China’s water shortage isof global concern because China and the rest of the world areincreasingly connected, both economically and environmentally(Liu and Diamond, 2005). The water shortage could havea worldwide impact if China’s ability to produce sufficient food tofeed a large and growing population is restricted (Brown andHalweil, 1998; Tso, 2004; Cai and Ringler, 2007). Addressing theissue will benefit global sustainable development, especially sincewater scarcity is threatening China’s economic development andits sustainability.
This paper is intended to provide an overview and synthesis ofChina’s water scarcity by assembling updated, publically availabledata. It attempts to develop an understanding of existing waterresource issues that are critical to China’s sustainable development.
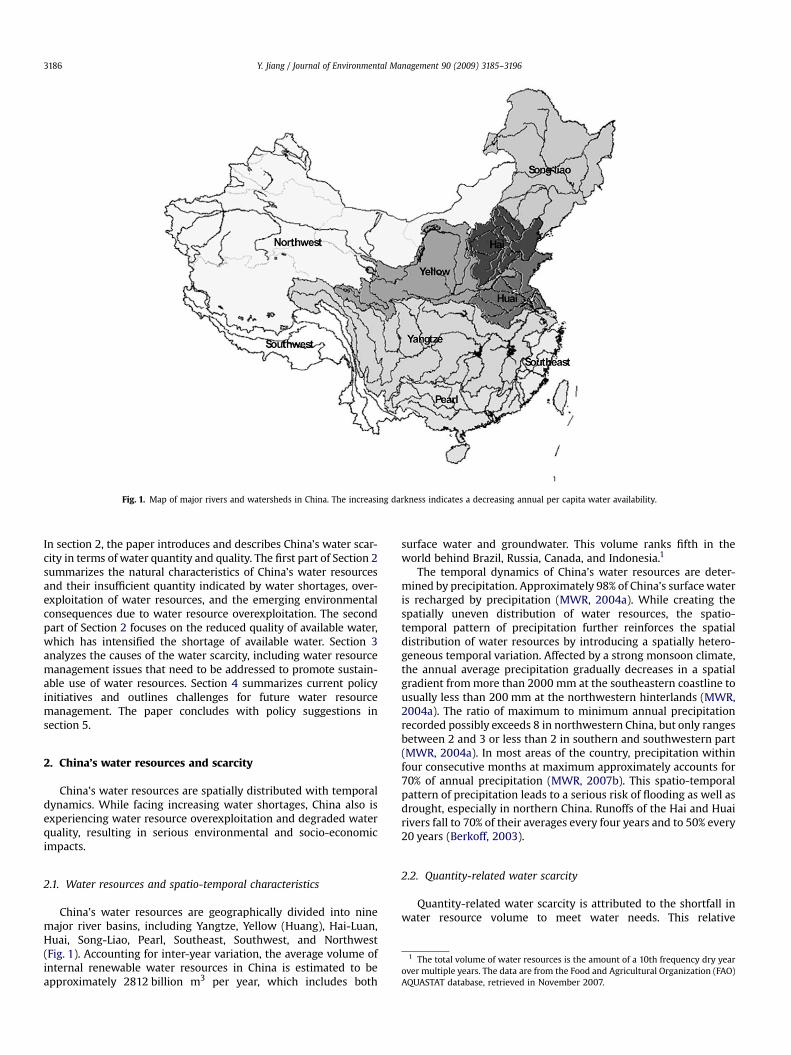
Fig. 1. Map of major rivers and watersheds in China. The increasing darkness indicates a decreasing annual per capita water availability.
Y. Jiang / Journal of Environmental Management 90 (2009) 3185–31963186
In section 2, the paper introduces and describes China’s water scar-city in terms of water quantity and quality. The first part of Section 2summarizes the natural characteristics of China’s water resourcesand their insufficient quantity indicated by water shortages, over-exploitation of water resources, and the emerging environmentalconsequences due to water resource overexploitation. The secondpart of Section 2 focuses on the reduced quality of available water,which has intensified the shortage of available water. Section 3analyzes the causes of the water scarcity, including water resourcemanagement issues that need to be addressed to promote sustain-able use of water resources. Section 4 summarizes current policyinitiatives and outlines challenges for future water resourcemanagement. The paper concludes with policy suggestions insection 5.
2. China’s water resources and scarcity
China’s water resources are spatially distributed with temporaldynamics. While facing increasing water shortages, China also isexperiencing water resource overexploitation and degraded waterquality, resulting in serious environmental and socio-economicimpacts.
1 The total volume of water resources is the amount of a 10th frequency dry yearover multiple years. The data are from the Food and Agricultural Organization (FAO)AQUASTAT database, retrieved in November 2007.
2.1. Water resources and spatio-temporal characteristics
China’s water resources are geographically divided into ninemajor river basins, including Yangtze, Yellow (Huang), Hai-Luan,Huai, Song-Liao, Pearl, Southeast, Southwest, and Northwest(Fig. 1). Accounting for inter-year variation, the average volume ofinternal renewable water resources in China is estimated to beapproximately 2812 billion m3 per year, which includes both
surface water and groundwater. This volume ranks fifth in theworld behind Brazil, Russia, Canada, and Indonesia.1
The temporal dynamics of China’s water resources are deter-mined by precipitation. Approximately 98% of China’s surface wateris recharged by precipitation (MWR, 2004a). While creating thespatially uneven distribution of water resources, the spatio-temporal pattern of precipitation further reinforces the spatialdistribution of water resources by introducing a spatially hetero-geneous temporal variation. Affected by a strong monsoon climate,the annual average precipitation gradually decreases in a spatialgradient from more than 2000 mm at the southeastern coastline tousually less than 200 mm at the northwestern hinterlands (MWR,2004a). The ratio of maximum to minimum annual precipitationrecorded possibly exceeds 8 in northwestern China, but only rangesbetween 2 and 3 or less than 2 in southern and southwestern part(MWR, 2004a). In most areas of the country, precipitation withinfour consecutive months at maximum approximately accounts for70% of annual precipitation (MWR, 2007b). This spatio-temporalpattern of precipitation leads to a serious risk of flooding as well asdrought, especially in northern China. Runoffs of the Hai and Huairivers fall to 70% of their averages every four years and to 50% every20 years (Berkoff, 2003).
2.2. Quantity-related water scarcity
Quantity-related water scarcity is attributed to the shortfall inwater resource volume to meet water needs. This relative
Y. Jiang / Journal of Environmental Management 90 (2009) 3185–3196 3187
quantitative insufficiency of water resources is indicated by watershortages, water resource overexploitation, and the effect of waterresource overexploitation on the environment.
2.2.1. Water shortagesSince the 1980s, China has been facing water shortages of
increasing magnitude and frequency for urban industry, domesticconsumption, and irrigated agriculture (WB, 2002). In normal wateryears, among 662 cities, 300 will have insufficient water suppliesand 110 will experience severe water shortages; 30 out of 32metropolitan areas with populations of more than 1 million peoplestruggle to meet water demands (Li, 2006). At current water supplylevels, the total water shortage is estimated to be 30–40 billion m3
per year and is even larger in dry years (MWR, 2007b). By 2050,China’s total water deficit could reach 400 billion m3 (roughly 80% ofthe current annual capacity of approximately 500 billion m3) (Tso,2004). During 2001–2005, water shortages caused industrial lossesof 1.62% of China’s annual GDP (MWR, 2007b). Unless measures aretaken to reduce demand and augment supply, the total watershortage for the Yellow-Hai-Huai area in northern China was pro-jected to be 56.5 billion m3 by 2050 (WB, 2002).
2.2.2. Water resource use and overexploitationNorth China has experienced heavy demand for water, and
groundwater is an important source for water supply in this area.As demonstrated by Table 1, in 2006, North China got 63.3% of itswater supply from surface water and 36.3% from groundwater. Thisaccounted for 36.9% of surface water resources and 36.3% ofgroundwater resources. The average rate of water resource useranged from 31.0% to 91.7% for basins in the north compared to ratesof 1.7–19.5% in the south. In particular, the use rate of waterresources in the Hai River basin reached to 91.7%. Although thescientific standard is case-specific on the percentage of waterresources that should be reserved for environmental purposes,some studies indicate that 30–40% of stream flows is a reasonablerate to maintain a healthy aquatic ecosystem (See Smakhtin et al.,2004; Tso, 2004). The up to 90% rate of water resource use in NorthChina could increase the risk of negative environmental effects.
2.2.3. Reduced instream flow and degraded aquatic ecosystemsExcessive water resource division reduces instream flows in
many rivers and has caused negative impacts on aquatic
Table 1China’s water supply in 2006 and renewable water resources.a
Region Water supply (%), 109 m3 Water resource userate,%
Surface Aquifer Totalb Surface Aquifer Total
North 166.4 (63.3) 92.6 (35.7) 259.0 (100) 36.9 36.3 48.3Song-Liao 32.7 (54.6) 27.2 (45.4) 59.8 (100) 19.8 43.5 31.0Hai 13.4 (34.7) 25.2 (65.3) 38.6 (100) 46.5 95.1 91.7Huang 25.6 (65.2) 13.7 (34.8) 39.3 (100) 38.8 33.7 52.8Huai 42.0 (71.1) 17.1 (28.9) 59.1 (100) 56.7 43.5 61.5Northwest 52.7 (84.9) 9.4 (15.1) 62.1 (100) 45.3 10.8 47.6
South 304.3 (95.6) 14.0 (4.4) 318.3 (100) 13.5 2.4 14.0Yangtz 179.7 (95.6) 8.3 (4.4) 187.9 (100) 18.9 3.3 19.5Pearl 83.2 (95.1) 4.3 (4.9) 87.5 (100) 17.8 3.8 18.6Southeast 31.5 (96.6) 1.1 (3.4) 32.6 (100) 12.3 1.8 12.6Southwest 9.9 (96.5) 0.4 (3.5) 10.2 (100) 1.7 0.2 1.7
National 470.7 (81.5) 106.6 (18.5) 577.2 (100) 17.4 12.9 20.5
a Water supply data are from MWR (2007a) for year 2006. Data on average annualrenewable water resources are from UNESCAP (1997).
b Total water supply does not include supply from other sources. Surface waterand groundwater are interrelated, and therefore, the total amount of waterresources may be smaller than the sum of surface water and groundwater.
ecosystems. In the Hai River basin, 40%dabout 4000 kmdof watercourses dried up and 194 natural lakes and depressions with a totalarea of 6.67 km2 disappeared (Wang et al., 2000). The dischargefrom the river to the ocean dwindled from an annual average of24 billion m3 in the 1950s to 1 billion m3 in 2001 (Xia et al., 2007).The aquatic ecosystem has deteriorated and many estuarine speciesare now extinct (Xia et al., 2004). In the Yellow River, global ENSOevents have caused a 51% decrease in river discharge to the seasince the 1950s and diverting water for human use further reducesstream flows and sediment discharge with more frequent flowcutoffs downstream for longer durations (Wang et al., 2006a; Fanet al., 2006). In particular, the lower reach of the Yellow River hadno flow for 226 consecutive days from February 7 to December 23,1997; the length of the main channel with no flow was 700 kmfrom the downstream, a distance accounting for 90% of the rivercourse in the lower reach (Liu and Xia, 2004; Fan et al., 2006; Wangand Jin, 2006). The Yellow River Delta is becoming more fragile andsusceptible to natural hazards (Deng and Jin, 2000; Lin et al., 2001;Huang and Fan, 2004; Fan et al., 2006; Wang et al., 2006a).
2.2.4. Groundwater depletionA large volume of literature has recorded increasing ground-
water depletion in North China over the last two decades (e.g.,Chen, 1985; Liu and Wei, 1989; Lou, 1998; Wu et al., 1998; Chen andXia, 1999; Liu and Yu, 2001; Xia and Chen, 2001). Since thebeginning of the 1980s, regions that overexploit groundwater haveincreased from 56 to 164 and the total area subject to groundwateroverexploitation has increased from 87,000 km2 to 180,000 km2
(MWR, 2007b). Seventy percent (or 90,000 km2) of the North ChinaPlain has been affected by groundwater overextraction (Liu and Yu,2001). In the western part of the 3-H basin, the groundwater tablehas been declining at an accelerating rate, increasing from 3–4 m inthe 1950s to more than 20 m in the 1980s and to about 30 m in the1990s (Liu and Xia, 2004). In the Hai River basin, groundwaterwithdrawal has exceeded the recharge rate, causing an averagerecharge deficit of 40–90 mm per year, which is equivalent toa continuous water table decline of 0.5 m per year (Foster et al.,2004). Most rural areas on the piedmont plain stretching onto thealluvial flood plain on the North China Plain have experiencedwater table declines of more than 20 m for shallow groundwaterand more than 40 m for deep aquifers since 1960 (Foster et al.,2004). Greater declines have also been observed in many urbancenters. In Beijing, groundwater tables have dropped by 100–300 m(WB, 2001).
2.2.5. Seawater intrusion and ground subsidenceSeawater intrusion and ground subsidence are common in many
areas where groundwater is overexploited (Han, 2003). In coastalregions, falling groundwater tables can break the balance at theinterface between freshwater and seawater and induce subsurfacemigration of seawater toward land. Seawater intrusion hasoccurred in 72 locations in Hebei, Shandong, and Liaoning prov-inces, covering a total area of 142 km2 in 1992 (WB, 2001). Fallinggroundwater tables also have caused ground subsidences innorthern and eastern China. Cities such as Beijing, Tianjin, andShanghai have been subject to ground subsidences of up to severalmeters (Shalizi, 2006). In addition, groundwater overexploitationhas led to aquifer salinization, which is even more significant thanseawater intrusion in some areas (Foster et al., 2004).
2.3. Quality-related water scarcity
Quality-related water scarcity is caused by poor water qualitythat does not support any economic use of water rather thaninsufficient quantity. China has been experiencing water quality
0.44
0.18
0.48
0.39 0.390.44
0.63
0.380.42
0.7 0.71
0.620.580.59
0.6
0
0.1
0.2
0.3
0.4
0.5
0.6
0.7
0.8
0.9
1
1991 1993 1995 1997 1999 2001 2003 2005 2007
Pro
po
rtio
n o
f M
on
ito
red
W
ater
Sectio
ns w
ith
P
oo
r W
ater Q
uality
(G
rad
es IV
, V
, o
r V
+)
Year
Fig. 2. Trend of proportion of monitored water sections with poor water quality inChina. Data source: SEPA (1991–2007).
0.3
0.2
0.32
0.290.24
0.280.32
0.250.21
0.25
0.23
0.48
0.28
0.28
0.24
0.24
00.10.20.30.40.50.60.70.80.9
1
1997
1999
1991
1993
1995
2001
2003
2005
2007
Pro
po
rtio
n o
f M
on
ito
red
W
ater
Sectio
ns w
ith
P
oo
r W
ater Q
uality
(G
rad
es IV
, V
, o
r V
+)
Pro
po
rtio
n o
f M
on
ito
red
W
ater
Sectio
ns w
ith
P
oo
r W
ater Q
uality
(G
rad
es IV
, V
, o
r V
+)
Pro
po
rtio
n o
f M
on
ito
red
W
ater
Sectio
ns w
ith
P
oo
r W
ater Q
uality
(G
rad
es IV
, V
, o
r V
+)
Year
The Yangtze River Basin
0.67
0.7
0.690.66
0.6
0.65
0.67
0.710.63
0.29
0.88
0.77
0.77
0.64
0.66
0.5
00.10.20.30.40.50.60.70.80.9
1
1991
1993
1995
1997
1999
2001
2003
2005
2007
Year
The Yellow River Basin
0.65
0.67 0.66
0.44
0.51
0.51
0.82
0.72
0.8
0.740.78
0.84
0.81
0.80.83
0.74
00.10.20.30.40.50.60.70.80.9
1
1991
1993
1995
1997
1999
2001
2003
2005
2007
Year
The Huai River Basin
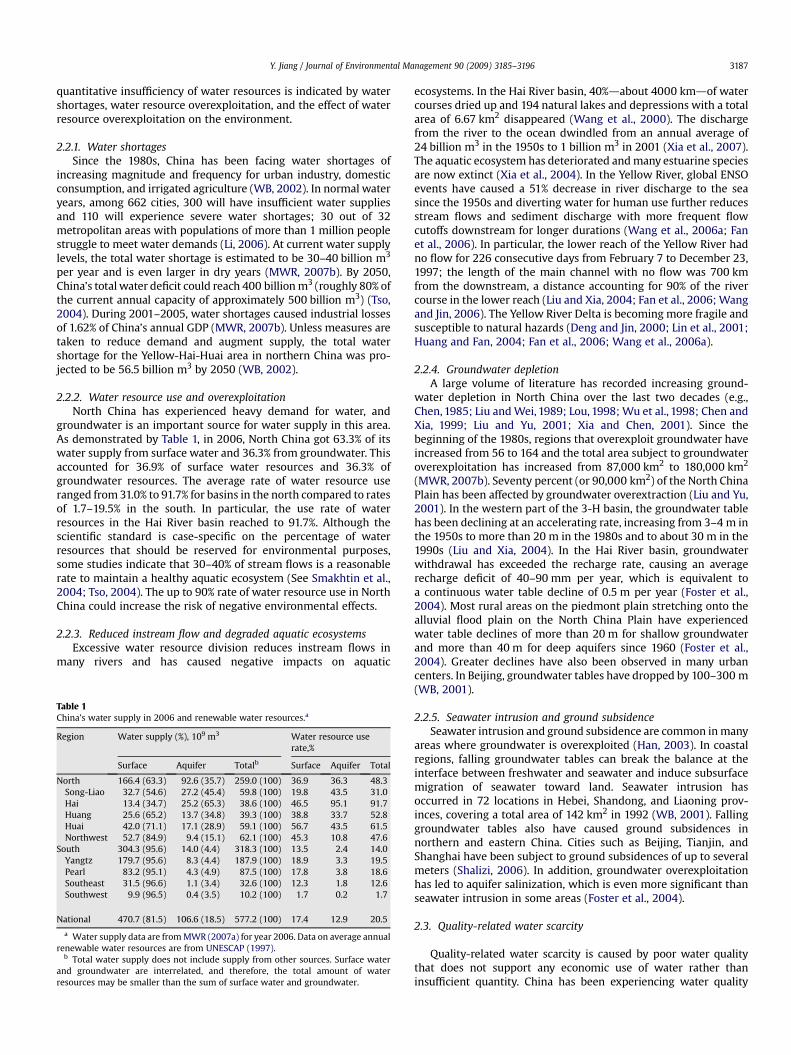
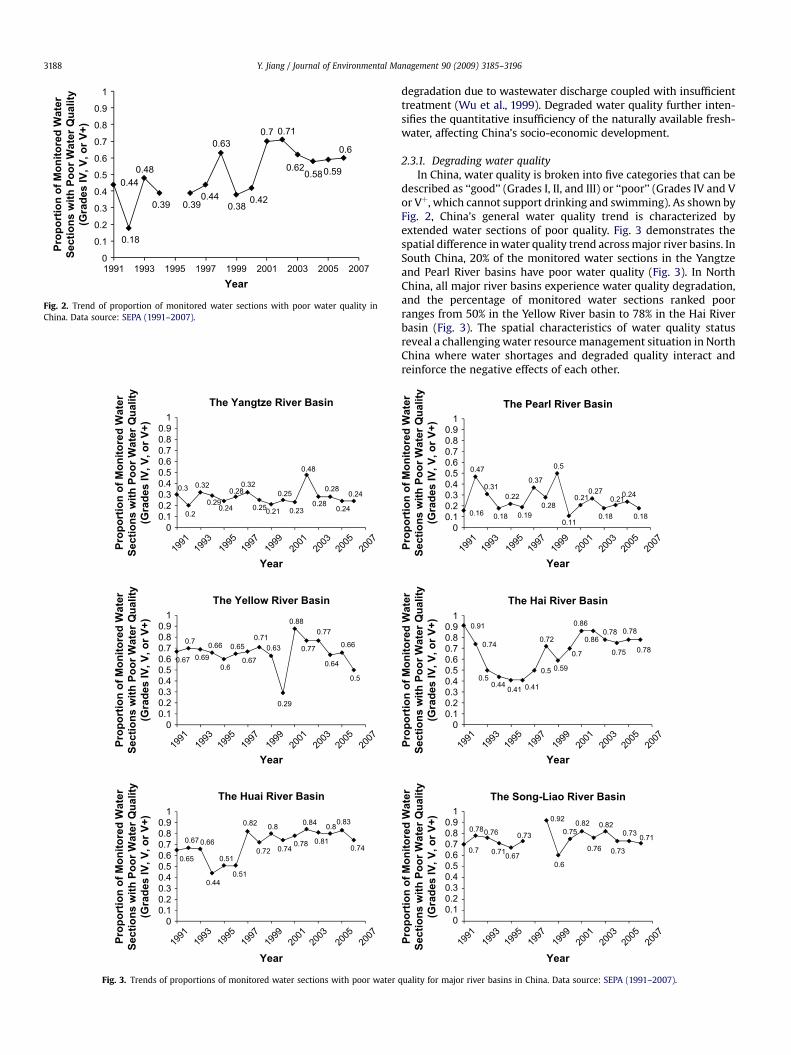
Fig. 3. Trends of proportions of monitored water sections with poor water
Y. Jiang / Journal of Environmental Management 90 (2009) 3185–31963188
degradation due to wastewater discharge coupled with insufficienttreatment (Wu et al., 1999). Degraded water quality further inten-sifies the quantitative insufficiency of the naturally available fresh-water, affecting China’s socio-economic development.
2.3.1. Degrading water qualityIn China, water quality is broken into five categories that can be
described as ‘‘good’’ (Grades I, II, and III) or ‘‘poor’’ (Grades IV and Vor Vþ, which cannot support drinking and swimming). As shown byFig. 2, China’s general water quality trend is characterized byextended water sections of poor quality. Fig. 3 demonstrates thespatial difference in water quality trend across major river basins. InSouth China, 20% of the monitored water sections in the Yangtzeand Pearl River basins have poor water quality (Fig. 3). In NorthChina, all major river basins experience water quality degradation,and the percentage of monitored water sections ranked poorranges from 50% in the Yellow River basin to 78% in the Hai Riverbasin (Fig. 3). The spatial characteristics of water quality statusreveal a challenging water resource management situation in NorthChina where water shortages and degraded quality interact andreinforce the negative effects of each other.
Pro
po
rtio
n o
f M
on
ito
red
W
ater
Sectio
ns w
ith
P
oo
r W
ater Q
uality
(G
rad
es IV
, V
, o
r V
+)
Pro
po
rtio
n o
f M
on
ito
red
W
ater
Sectio
ns
w
ith
P
oo
r W
ater Q
uality
(G
rad
es IV
, V
, o
r V
+)
Pro
po
rtio
n o
f M
on
ito
red
W
ater
Sectio
ns w
ith
P
oo
r W
ater Q
uality
(G
rad
es IV
, V
, o
r V
+)
00.10.20.30.40.50.60.70.80.9
1
1997
1999
1991
1993
1995
2001
2003
2005
2007
Year
0.16
0.47
0.31
0.18
0.22
0.19
0.37
0.28
0.5
0.11
0.210.27
0.18
0.210.24
0.18
The Pearl River Basin
00.10.20.30.40.50.60.70.80.9
1
1991
1993
1995
1997
1999
2001
2003
2005
2007
Year
00.10.20.30.40.50.60.70.80.9
1
1991
1993
1995
1997
1999
2001
2003
2005
2007
Year
0.91
0.74
0.50.44 0.41 0.41
0.5
0.72
0.59
0.7
0.86
0.860.78
0.75
0.78
0.78
The Hai River Basin
0.7
0.780.76
0.710.67
0.73
0.92
0.6
0.750.82
0.76
0.82
0.73
0.73 0.71
The Song-Liao River Basin
quality for major river basins in China. Data source: SEPA (1991–2007).
Y. Jiang / Journal of Environmental Management 90 (2009) 3185–3196 3189
China has a large number of lakes and reservoirs with a totalfreshwater capacity of about 863 billion m3 (Jin et al., 2005). Thewater quality of lakes and reservoirs traditionally is measured bytrophic status and can be classified into oligotrophic, mesotrophic,eutrophic, and hypertrophic based on increasing levels of nutrientsin the water. A moving from oligotrophic to hypertrophic indicatesa transition from relatively unpolluted to highly polluted water.China’s lakes and reservoirs are experiencing accelerated eutro-phication and degraded water quality. Jin et al. (1995) found thatmost of the 34 lakes studied were of mesotrophic status in the1970s; the percentage of eutrophic lakes increased from 5% to 55%between 1978 and 1987. Currently, 57.5% of the 40 main freshwaterlakes in China have become eutrophic and hypertrophic (Table 2).According to the 2006 China Environment Bulletin (SEPA, 2007), ofthe 27 lakes of national priority for pollution control, only 8 (or29%) met the standards for good water quality and 19 (or 70%) wereranked poor. The three major lakes including Tai, Chao, and Dianchiare the most polluted with water quality below Grade V.
2.3.2. Socio-economic impactWater scarcity due to poor water quality has occurred in
northern and eastern China. Shanghai, located at the down-stream of the Yangtze River and the Lake Tai basin, has its waterpolluted from both upstream and the local area. Zhejiang facesthe same problem: water scarcity not because of a lack of waterto use, but because poor quality renders water unusable. In May2007, a sudden large algae bloom in Lake Tai polluted 70% of thelocal water supply in Wuxi in eastern China, affecting 2 millionpeople.
Poor water quality threatens water availability even in southernChina where water resources are abundant. Zhu et al. (2002) esti-mated that in the Pearl River basin, pollution degraded waterresources would reach 352 million m3 in 2010 and 537 million m3
in 2020. This amount of water could otherwise support 2.54 millionand 3.68 million people in the basin each year, respectively.
Table 2Current trophic level of lakes and reservoirs in China.a
Lakes Year Water qualityparameter
Trophic state
TP, mg/L TN, mg/L
Five major lakesPoyang 2000 0.102 0.862 Mesotrophic–eutrophicDongting 2001 0.336 0.89 EutrophicTai 2001 0.126 3.24 EutrophicHongze 2004 0.103 1.906 EutrophicChao 1999 0.193 2.96 Eutrophic
Urban lakesCibi (Dali) 2003 0.016 0.39 MesotrophicXi (Hangzhou) 2003 0.17 3.06 EutrophicDong (Wuhan) 2001 0.125 2.5 EutrophicXuanwu (Nanjing) 2003 0.478 3.5 EutrophicGantang (Jiujiang) 2003 0.24 1.73 EutrophicNan (Changchun) 2003 0.529 5.45 EutrophicLu (Guangzhou) 2003 0.22 3.04 EutrophicXi (Huizhou) 2003 0.124 0.83 EutrophicHaixihai (Dali) 2003 0.033 0.28 Mesotrophic
ReservoirMiyun 1990 0.018 0.115 MesotrophicDahuofang 1988–1991 0.06 1.09 Mesotrophic–eutrophicYuqiao 1999 0.14 2.5 EutrophicGuanting 2000 0.047 2.92 EutrophicShanzai 2001 0.05 0.27 Mesotrophic–eutrophic
a Adapted from Jin et al. (1995), Jin (2003), and Jin et al. (2005).
With a lack of clean, usable water, households, industries, andagriculture were forced to cut back their water use. At the sametime, the limited available water resources were threatened bypollution. From 2000 to 2003, as much as 25 billion m3 of waterwas not used because of pollution (WB, 2007a). About 47 billion m3
of the water that was used came from degraded supplies that didnot meet the before-treatment quality standard (WB, 2007a),which was almost 10% of China’s total water supply of 563.3 billionm3 in 2005 (NBSC, 2006).
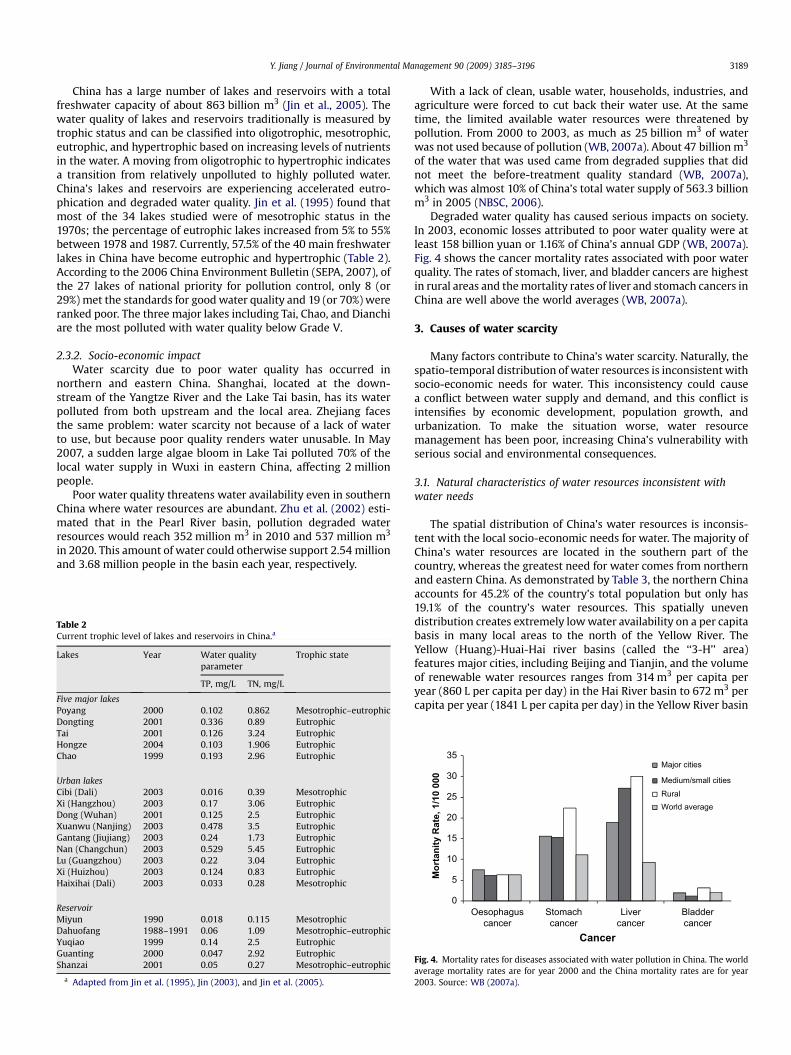
Degraded water quality has caused serious impacts on society.In 2003, economic losses attributed to poor water quality were atleast 158 billion yuan or 1.16% of China’s annual GDP (WB, 2007a).Fig. 4 shows the cancer mortality rates associated with poor waterquality. The rates of stomach, liver, and bladder cancers are highestin rural areas and the mortality rates of liver and stomach cancers inChina are well above the world averages (WB, 2007a).
3. Causes of water scarcity
Many factors contribute to China’s water scarcity. Naturally, thespatio-temporal distribution of water resources is inconsistent withsocio-economic needs for water. This inconsistency could causea conflict between water supply and demand, and this conflict isintensifies by economic development, population growth, andurbanization. To make the situation worse, water resourcemanagement has been poor, increasing China’s vulnerability withserious social and environmental consequences.
3.1. Natural characteristics of water resources inconsistent withwater needs
The spatial distribution of China’s water resources is inconsis-tent with the local socio-economic needs for water. The majority ofChina’s water resources are located in the southern part of thecountry, whereas the greatest need for water comes from northernand eastern China. As demonstrated by Table 3, the northern Chinaaccounts for 45.2% of the country’s total population but only has19.1% of the country’s water resources. This spatially unevendistribution creates extremely low water availability on a per capitabasis in many local areas to the north of the Yellow River. TheYellow (Huang)-Huai-Hai river basins (called the ‘‘3-H’’ area)features major cities, including Beijing and Tianjin, and the volumeof renewable water resources ranges from 314 m3 per capita peryear (860 L per capita per day) in the Hai River basin to 672 m3 percapita per year (1841 L per capita per day) in the Yellow River basin
0
5
10
15
20
25
30
35
Oesophaguscancer
Stomachcancer
Livercancer
Bladdercancer
Mo
rtan
ity R
ate, 1/10 000
Cancer
Major cities
Medium/small citiesRuralWorld average
Fig. 4. Mortality rates for diseases associated with water pollution in China. The worldaverage mortality rates are for year 2000 and the China mortality rates are for year2003. Source: WB (2007a).
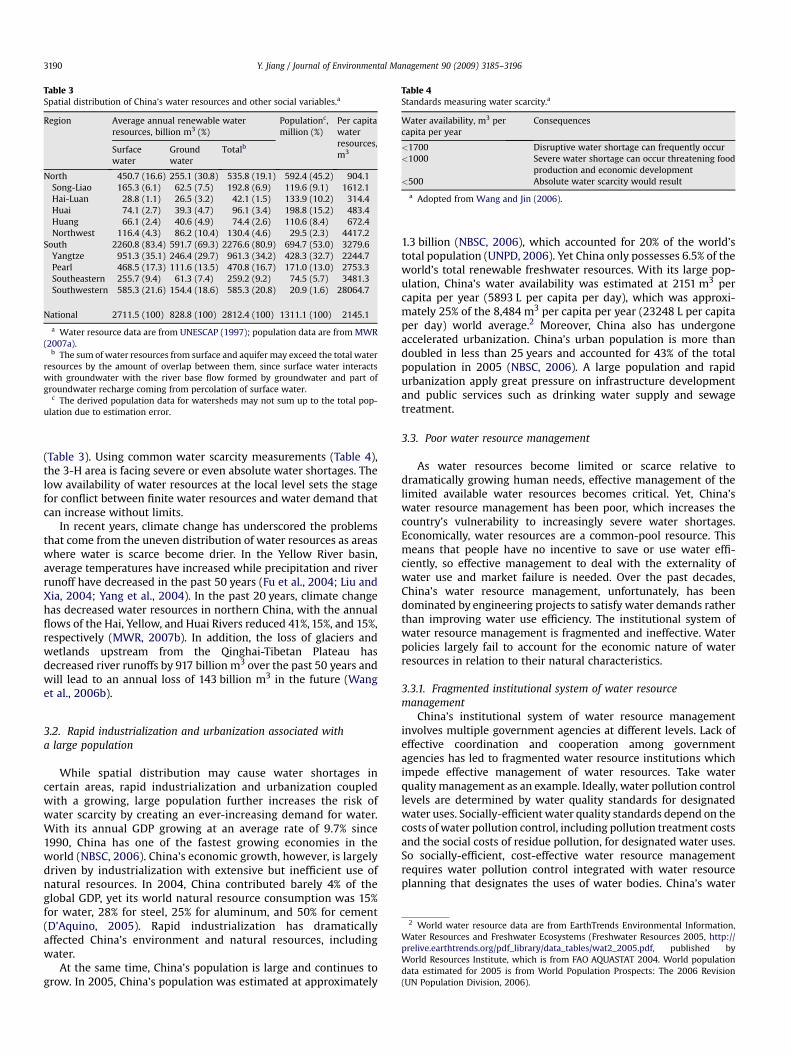
Table 3Spatial distribution of China’s water resources and other social variables.a
Region Average annual renewable waterresources, billion m3 (%)
Populationc,million (%)
Per capitawaterresources,m3Surface
waterGroundwater
Totalb
North 450.7 (16.6) 255.1 (30.8) 535.8 (19.1) 592.4 (45.2) 904.1Song-Liao 165.3 (6.1) 62.5 (7.5) 192.8 (6.9) 119.6 (9.1) 1612.1Hai-Luan 28.8 (1.1) 26.5 (3.2) 42.1 (1.5) 133.9 (10.2) 314.4Huai 74.1 (2.7) 39.3 (4.7) 96.1 (3.4) 198.8 (15.2) 483.4Huang 66.1 (2.4) 40.6 (4.9) 74.4 (2.6) 110.6 (8.4) 672.4Northwest 116.4 (4.3) 86.2 (10.4) 130.4 (4.6) 29.5 (2.3) 4417.2
South 2260.8 (83.4) 591.7 (69.3) 2276.6 (80.9) 694.7 (53.0) 3279.6Yangtze 951.3 (35.1) 246.4 (29.7) 961.3 (34.2) 428.3 (32.7) 2244.7Pearl 468.5 (17.3) 111.6 (13.5) 470.8 (16.7) 171.0 (13.0) 2753.3Southeastern 255.7 (9.4) 61.3 (7.4) 259.2 (9.2) 74.5 (5.7) 3481.3Southwestern 585.3 (21.6) 154.4 (18.6) 585.3 (20.8) 20.9 (1.6) 28064.7
National 2711.5 (100) 828.8 (100) 2812.4 (100) 1311.1 (100) 2145.1
a Water resource data are from UNESCAP (1997); population data are from MWR(2007a).
b The sum of water resources from surface and aquifer may exceed the total waterresources by the amount of overlap between them, since surface water interactswith groundwater with the river base flow formed by groundwater and part ofgroundwater recharge coming from percolation of surface water.
c The derived population data for watersheds may not sum up to the total pop-ulation due to estimation error.
Table 4Standards measuring water scarcity.a
Water availability, m3 percapita per year
Consequences
<1700 Disruptive water shortage can frequently occur<1000 Severe water shortage can occur threatening food
production and economic development<500 Absolute water scarcity would result
a Adopted from Wang and Jin (2006).
Y. Jiang / Journal of Environmental Management 90 (2009) 3185–31963190
(Table 3). Using common water scarcity measurements (Table 4),the 3-H area is facing severe or even absolute water shortages. Thelow availability of water resources at the local level sets the stagefor conflict between finite water resources and water demand thatcan increase without limits.
In recent years, climate change has underscored the problemsthat come from the uneven distribution of water resources as areaswhere water is scarce become drier. In the Yellow River basin,average temperatures have increased while precipitation and riverrunoff have decreased in the past 50 years (Fu et al., 2004; Liu andXia, 2004; Yang et al., 2004). In the past 20 years, climate changehas decreased water resources in northern China, with the annualflows of the Hai, Yellow, and Huai Rivers reduced 41%, 15%, and 15%,respectively (MWR, 2007b). In addition, the loss of glaciers andwetlands upstream from the Qinghai-Tibetan Plateau hasdecreased river runoffs by 917 billion m3 over the past 50 years andwill lead to an annual loss of 143 billion m3 in the future (Wanget al., 2006b).
2 World water resource data are from EarthTrends Environmental Information,Water Resources and Freshwater Ecosystems (Freshwater Resources 2005, http://prelive.earthtrends.org/pdf_library/data_tables/wat2_2005.pdf, published byWorld Resources Institute, which is from FAO AQUASTAT 2004. World populationdata estimated for 2005 is from World Population Prospects: The 2006 Revision(UN Population Division, 2006).
3.2. Rapid industrialization and urbanization associated witha large population
While spatial distribution may cause water shortages incertain areas, rapid industrialization and urbanization coupledwith a growing, large population further increases the risk ofwater scarcity by creating an ever-increasing demand for water.With its annual GDP growing at an average rate of 9.7% since1990, China has one of the fastest growing economies in theworld (NBSC, 2006). China’s economic growth, however, is largelydriven by industrialization with extensive but inefficient use ofnatural resources. In 2004, China contributed barely 4% of theglobal GDP, yet its world natural resource consumption was 15%for water, 28% for steel, 25% for aluminum, and 50% for cement(D’Aquino, 2005). Rapid industrialization has dramaticallyaffected China’s environment and natural resources, includingwater.
At the same time, China’s population is large and continues togrow. In 2005, China’s population was estimated at approximately
1.3 billion (NBSC, 2006), which accounted for 20% of the world’stotal population (UNPD, 2006). Yet China only possesses 6.5% of theworld’s total renewable freshwater resources. With its large pop-ulation, China’s water availability was estimated at 2151 m3 percapita per year (5893 L per capita per day), which was approxi-mately 25% of the 8,484 m3 per capita per year (23248 L per capitaper day) world average.2 Moreover, China also has undergoneaccelerated urbanization. China’s urban population is more thandoubled in less than 25 years and accounted for 43% of the totalpopulation in 2005 (NBSC, 2006). A large population and rapidurbanization apply great pressure on infrastructure developmentand public services such as drinking water supply and sewagetreatment.
3.3. Poor water resource management
As water resources become limited or scarce relative todramatically growing human needs, effective management of thelimited available water resources becomes critical. Yet, China’swater resource management has been poor, which increases thecountry’s vulnerability to increasingly severe water shortages.Economically, water resources are a common-pool resource. Thismeans that people have no incentive to save or use water effi-ciently, so effective management to deal with the externality ofwater use and market failure is needed. Over the past decades,China’s water resource management, unfortunately, has beendominated by engineering projects to satisfy water demands ratherthan improving water use efficiency. The institutional system ofwater resource management is fragmented and ineffective. Waterpolicies largely fail to account for the economic nature of waterresources in relation to their natural characteristics.
3.3.1. Fragmented institutional system of water resourcemanagement
China’s institutional system of water resource managementinvolves multiple government agencies at different levels. Lack ofeffective coordination and cooperation among governmentagencies has led to fragmented water resource institutions whichimpede effective management of water resources. Take waterquality management as an example. Ideally, water pollution controllevels are determined by water quality standards for designatedwater uses. Socially-efficient water quality standards depend on thecosts of water pollution control, including pollution treatment costsand the social costs of residue pollution, for designated water uses.So socially-efficient, cost-effective water resource managementrequires water pollution control integrated with water resourceplanning that designates the uses of water bodies. China’s water
0
15
30
45
60
75
90
105
120
Vo
lu
me, 10
8m
3/year
Provinces
water quota allocationwater abstraction
Fig. 5. Water quota allocation and water abstraction in year 1997 for the Yellow Riverbasin, China. Source: He and Chen (2001).
Y. Jiang / Journal of Environmental Management 90 (2009) 3185–3196 3191
resource administration, however, is divided between these twosectors and each has separate administrative authorities. The StateEnvironmental Protection Administration (SEPAP)3 mainly isresponsible for controlling water pollution, while the Ministry ofWater Resources (MWR) oversees water resources planning,including designating water functional zones for different uses andestablishing corresponding water quality standards. With nocoordination mechanism, this institutional separation not onlyimpedes efficient water resource management but also increasesthe administrative transaction costs.
China’s river basin management, which involves governmentagencies at different administrative levels and across politicalboundaries, is a second example of fragmented water resourceinstitutions. Integrated river basin management has been commonlyaccepted as an effective approach for managing water resources(Spulber and Sabbaghi, 1998). Although China has established basincommissions for major rivers and lakes to promote integratedmanagement, these basin commissions have limited power to allo-cate water resources, coordinate water resource exploitation andconservation, and enforce water resource planning at the basin level.On the other hand, obscure delineation of authority and responsi-bilities among those government agencies involved in waterresource management at different levels undermines the ability ofbasin commissions to regulate water resource exploitation withina sustainable framework. This fragmented river basin managementhas led directly to a water resource administration largely based onpolitical boundaries rather than on watersheds, which amplifies theissue of water resources as a common-pool resource by creatingincentives for local myopic decision-makings on water resourceexploitation.
Fig. 5 details a case in the Yellow River basin where water with-drawals went beyond allocated water quotas. This water manage-ment failure eventually can be attributed to fragmented waterresource institutions at the basin level. The river basin commissionsunder the MWR are responsible for watershed-wide water allocationamong provinces. Yet, issuing permits for water withdrawal is left tolocal governments and their water resources bureaus that have norepresentation in the basin commissions. With weak basincommissions, there is no guarantee that water withdrawals areregulated within the framework of basin-level allocation of waterresources.
3.3.2. Supply-driven water resources management and inefficientwater use
China’s water resource management traditionally has beendominated by engineering projects to meet socio-economic needs forwater. This supply-driven water resource management style ignoresthe economic nature of water resources and the potential conflictbetween locally limited water availability and water demand that candramatically increase. With economic expansion and populationgrowth, this passive management with no restrictions on demandhas led to inefficient industrial structure and water use, intensifyingthe conflict between water supply and demand. China has developedan industrial structure that requires a large amount of water;a different industrial structure with lower water needs would havedeveloped if measures had been taken to restrict demand.
With no restrictions on demand, it is not surprising that China’swater use efficiency is low as compared to other industrializedcountries. Indicators measuring water use efficiency includemarginal water consumption per one more unit of economic return,average economic return per unit of water consumption, or the
3 The SEPA was changed to the Ministry of Environmental Protection (MEP) in2008.
ratio of actual water consumption to diverted amount. In 2003,China’s water use per 10,000 GDP and per 10,000 industry-addedvalue were 4.5 and 5–10 times the levels in developed countries,respectively; China’s average recycling rate of industrial water usewas estimated to be 40–50%, compared to 80% in developedcountries (CAS, 2007). In agriculture, while allocating a largevolume of limited water resources to low value-added agriculture iseconomically inefficient, low efficiency in agricultural water usealso has occurred. As indicated by CAS (2007) and Zhang et al.(2007), the ratio of actual irrigation water consumption to theamount diverted in China is only 0.45, far below the level of 0.7–0.8in developed countries. Other studies reported that only 50% ofwater from canals was delivered to the field (Xu, 2001) and onlyabout 40% of water withdrawal for agriculture was actually used oncrops (Wang et al., 2005).
The supply-driven water resource management also is respon-sible for the over-withdrawal of water resources. In recent years,northern China has seen an increasing exploitation of groundwaterthat may be attributed to the failure to regulate groundwater and torestrict demands (Wang et al., 2007). According to extensivesurveys on rural groundwater use in northern China, Wang et al.(2007) found that less than 10% of the well owners surveyedobtained permits before drilling a well and only 5% of the villagesbelieved their drilling decisions needed to consider spacing deci-sions. Water extraction was not charged in any village and therewere no physical limits imposed on well owners (Wang et al.,2007). From 2000 to 2003, the average annual amount of ground-water withdrawn was estimated to be 24 billion m3, with 74% ofthat for agricultural use (WB, 2007a).
3.3.3. Underdeveloped water rights systemA water rights system is the foundation of effective water
resource management. Clearly defined, legally enforceable waterrights can provide incentives to improve water use efficiency.Unfortunately, China’s institutional system of water rights has notbeen well developed and is not strictly enforced. Managing waterresources based on water rights has not been successful. Much ofthe water use inefficiency and the current water scarcity in Chinacan be attributed to an underdeveloped system of water rights.
In China, the State owns water resources except where water inlocal ponds is owned by the local collectives that constructed theponds. On behalf of the State, the MWR manages water resourceexploitation by delegating management to river basin commissionsand local government bureaus. In 1988, China enacted its first waterlaw and established a permit system to regulate water withdrawal.Regarded as defining the right to use water, the permit system is
Y. Jiang / Journal of Environmental Management 90 (2009) 3185–31963192
mainly for surface water and is far from being complete. Lack of cleardelineation of jurisdictional control over water impedes the devel-opment of a water rights system and its effective administration.
Agriculture is the largest water use sector, accounting for about70% of China’s annual water consumption. Well defined farmers’water rights could facilitate government efforts to improve wateruse efficiency and mitigate water scarcity. Yet, farmers’ water rightsare largely unclear. For example, an important component of waterrights is the amount of water that one is entitled to use. Lack ofvolumetric metering of water use at the farm level makes the waterrights of individual farmers unclear. Moreover, during watershortages, farmers’ irrigation demands are often forced to yield todomestic or industrial use without compensation. This impliesunclearly defined water rights, if any water rights at all. In addition,decisions about irrigation water delivery, including volume andtiming, are largely made by irrigation districts rather than farmers.With an irrigation water charge tied to the acreage of irrigated landrather than actual water consumption, farmers have no incentivesto save water and use it efficiently.
Since 2000, China has been moving toward strengthening waterrights development and administration, including revising thewater law and issuing policy guidance. Water rights, however, arestill incomplete by modern standards (FAO, 2001). Systems havenot been established to manage the three components of waterrights: the amounts that can be withdrawn, transferred, and mustbe returned with certain quality. Legal delineation is unclear on therights and responsibilities associated with a water withdrawalpermit. Rules and methods on water allocation are still incomplete.Allocating water to establish initial water rights has not beencompleted. Not all water uses are measured and managed bypermits. No coordination mechanism exists within basins to ensurethat water withdrawal permits are consistent with water allocation.Although water rights trading has been proposed to promote effi-cient water resources allocation, the actual management stilllargely depends on administrative command and control. Withunderdeveloped water rights, it is difficult to regulate water usewithin a sustainable framework.
China recently launched pilot projects in local areas to explorewater rights management. A good example is a MWR project inZhangye, Gansu to examine building a water-saving society withtradable water quotas. This project has exposed barriers to waterrights trading, largely due to insufficient market institutions andpolicies (Zhang, 2007). All the pilot projects show that farmers dorespond to incentives, implying that much of the inefficient use ofwater can be attributed to the current water resource institutionsand policies failure to consider farmers’ incentives.
3.3.4. Inadequate water pricingWater pricing is an important policy instrument that can
provide incentives for water saving and enhancing water use effi-ciency, although it alone may not resolve water resource issues(Molle and Berkoff, 2008). Theoretically, market-determined pricescan balance water demand and supply by reflecting the value ofscarce water. The balancing process is based on a premise thatprices cover the full cost of water supply. China’s water prices,however, historically have been set through a political top-downadministration instead of through the market. Prices are purposelyset low and are insufficient to cover the full cost of water supply, sothey do not allow the market to balance demand and supply. It isestimated that current household expenditures for water onlyaccount for about 1.2% of disposable income. This percentage islower than the 2% level that stimulates water-saving behavior andis much lower than the 4% in developed countries (Zhang et al.,2007). These low water prices provide little or no incentives to savewater.
The 2002 Water Law introduced a cost recovery policy for waterresource use. In the past few years, progress has been made inreforming water tariffs in many cities. Nonetheless, raising waterprices has been slow because of concerns that access to water isa human right. The user charges for urban water supplies andwastewater treatment still do not fully cover all operating andinvestment costs. In Xi’an, for instance, households pay 1.6 yuan/m3
for water, while the full cost is 5 yuan/m3 (OECD, 2007). Charges forsewage treatment either have not been implemented, or are verylow. Insufficient water tariffs have led to slow infrastructuredevelopment and poor services and maintenance. In urban areas,the number of water leaks is among the highest in the world.
In agriculture, volumetric pricing of irrigation water use isunderdeveloped although it is China’s policy that water use chargesshould be based on the actual amount of water consumption. SinceChina’s farms are characterized by small size and fragmentation,accurately measuring water use at the farm level to implementvolumetric pricing is difficult (Huang et al., 2009). While there maybe areas where irrigation charges reflect actual water consumptionat the village level, irrigation charges for individual farms in manyrural areas still are based on the number of acres irrigated ratherthan the actual amount of water used for irrigation (Lohmar et al.,2007). With the irrigation charges being sunk costs, farmers haveno incentive to save water and improve irrigation efficiency. Thismay explain the low adaption rate (<20%) of water-saving tech-nologies such as plastic sheeting, sprinkler system, drip irrigation,and other efficient, less capital- and energy-intensive techniques inwater strapped northern China (Yang et al., 2003; Deng et al., 2006;Blanke et al., 2007; Huang et al., 2009). On one hand, it iseconomically inefficient to allocate a large amount of scarce waterto low value-added agriculture; on the other hand, irrigation wateruse is not sufficiently constrained by water prices to improve effi-ciency. In addition, since water prices rarely reflect the full cost ofsupplying water, including operation and maintenance costs plusoverhaul and replacement costs for water delivery systems, lack ofmaintenance is common for irrigation infrastructure, furtherincreasing insufficient water use.
3.3.5. Insufficient investment in environmental protection and weakpollution control
Water shortages due to poor water quality can be attributed toinsufficient investment in environmental protection and weakpollution control. In the past three decades, investments in envi-ronmental protection accounted for only 0.68%, 0.81%, and 1.19% ofChina’s GDP, respectively, which are insufficient to achieve plannedlevels (WB, 2007b). In the next five years (2006–2010), investmentin environmental protection is slated to increase by 85% comparedto previous levels but that is still lower than investments in floodcontrol, soil conservation, and water resource allocation (Ma et al.,2006). With insufficient funding, the development of urban sewagetreatment facilities, including sewer networks, has been slow,especially in small cities and ‘‘established towns.’’ According toa 2005 survey by the Ministry of Urban Construction, 278 out of 661major cities did not build sewage treatment plants (CAS, 2007). In2003, sewage treatment rates ranged from 43% for cities with morethan 2 million people to 16% for cities with populations of less than200,000 (NBSC, 2004). Lagging sewage system development hasled to large amounts of untreated wastewater being dumpeddirectly into the environment, which may explain why pollutioncontrol targets, such as reducing COD discharge by 10% by 2005,have not been met.
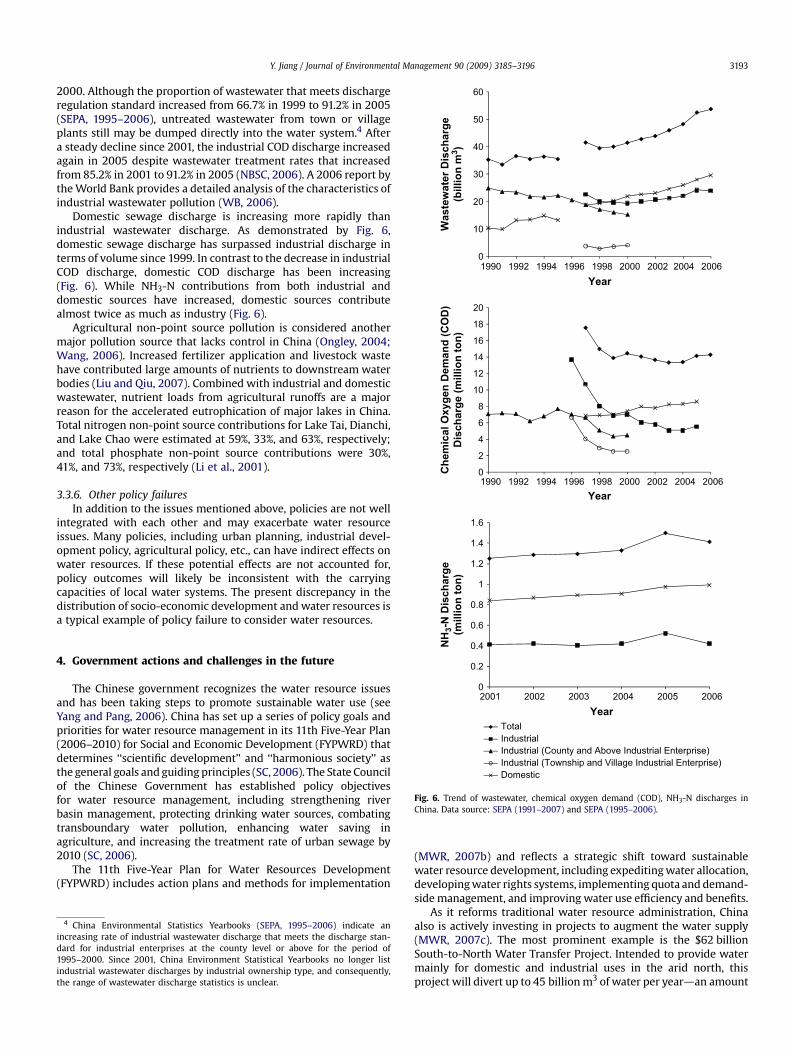
Due to a lack of funding and weak regulation, water pollution inChina is increasing and pollution sources are becoming morediverse. As demonstrated by Fig. 6, after declining form 1995 to2000, industrial wastewater discharge has been increasing since
0
10
20
30
40
50
60
1990 1992 1994 1996 1998 2000 2002 2004 2006
Wastew
ater D
isch
arg
e
(b
illio
n m
3)
Year
0
2
4
6
8
10
12
14
16
18
20
1990 1992 1994 1996 1998 2000 2002 2004 2006
Ch
em
ical O
xyg
en
D
em
an
d (C
OD
)
Disch
arg
e (m
illio
n to
n)
Year
0.6
0.8
1
1.2
1.4
1.6
-N
D
isch
arg
e
illio
n to
n)
Y. Jiang / Journal of Environmental Management 90 (2009) 3185–3196 3193
2000. Although the proportion of wastewater that meets dischargeregulation standard increased from 66.7% in 1999 to 91.2% in 2005(SEPA, 1995–2006), untreated wastewater from town or villageplants still may be dumped directly into the water system.4 Aftera steady decline since 2001, the industrial COD discharge increasedagain in 2005 despite wastewater treatment rates that increasedfrom 85.2% in 2001 to 91.2% in 2005 (NBSC, 2006). A 2006 report bythe World Bank provides a detailed analysis of the characteristics ofindustrial wastewater pollution (WB, 2006).
Domestic sewage discharge is increasing more rapidly thanindustrial wastewater discharge. As demonstrated by Fig. 6,domestic sewage discharge has surpassed industrial discharge interms of volume since 1999. In contrast to the decrease in industrialCOD discharge, domestic COD discharge has been increasing(Fig. 6). While NH3-N contributions from both industrial anddomestic sources have increased, domestic sources contributealmost twice as much as industry (Fig. 6).
Agricultural non-point source pollution is considered anothermajor pollution source that lacks control in China (Ongley, 2004;Wang, 2006). Increased fertilizer application and livestock wastehave contributed large amounts of nutrients to downstream waterbodies (Liu and Qiu, 2007). Combined with industrial and domesticwastewater, nutrient loads from agricultural runoffs are a majorreason for the accelerated eutrophication of major lakes in China.Total nitrogen non-point source contributions for Lake Tai, Dianchi,and Lake Chao were estimated at 59%, 33%, and 63%, respectively;and total phosphate non-point source contributions were 30%,41%, and 73%, respectively (Li et al., 2001).
3.3.6. Other policy failuresIn addition to the issues mentioned above, policies are not well
integrated with each other and may exacerbate water resourceissues. Many policies, including urban planning, industrial devel-opment policy, agricultural policy, etc., can have indirect effects onwater resources. If these potential effects are not accounted for,policy outcomes will likely be inconsistent with the carryingcapacities of local water systems. The present discrepancy in thedistribution of socio-economic development and water resources isa typical example of policy failure to consider water resources.
0
0.2
0.4
2001 20032002 2004 2005 2006
NH
3
(m
Year
TotalIndustrialIndustrial (County and Above Industrial Enterprise)Industrial (Township and Village Industrial Enterprise)Domestic
Fig. 6. Trend of wastewater, chemical oxygen demand (COD), NH3-N discharges inChina. Data source: SEPA (1991–2007) and SEPA (1995–2006).
4. Government actions and challenges in the future
The Chinese government recognizes the water resource issuesand has been taking steps to promote sustainable water use (seeYang and Pang, 2006). China has set up a series of policy goals andpriorities for water resource management in its 11th Five-Year Plan(2006–2010) for Social and Economic Development (FYPWRD) thatdetermines ‘‘scientific development’’ and ‘‘harmonious society’’ asthe general goals and guiding principles (SC, 2006). The State Councilof the Chinese Government has established policy objectivesfor water resource management, including strengthening riverbasin management, protecting drinking water sources, combatingtransboundary water pollution, enhancing water saving inagriculture, and increasing the treatment rate of urban sewage by2010 (SC, 2006).
The 11th Five-Year Plan for Water Resources Development(FYPWRD) includes action plans and methods for implementation
4 China Environmental Statistics Yearbooks (SEPA, 1995–2006) indicate anincreasing rate of industrial wastewater discharge that meets the discharge stan-dard for industrial enterprises at the county level or above for the period of1995–2000. Since 2001, China Environment Statistical Yearbooks no longer listindustrial wastewater discharges by industrial ownership type, and consequently,the range of wastewater discharge statistics is unclear.
(MWR, 2007b) and reflects a strategic shift toward sustainablewater resource development, including expediting water allocation,developing water rights systems, implementing quota and demand-side management, and improving water use efficiency and benefits.
As it reforms traditional water resource administration, Chinaalso is actively investing in projects to augment the water supply(MWR, 2007c). The most prominent example is the $62 billionSouth-to-North Water Transfer Project. Intended to provide watermainly for domestic and industrial uses in the arid north, thisproject will divert up to 45 billion m3 of water per yeardan amount
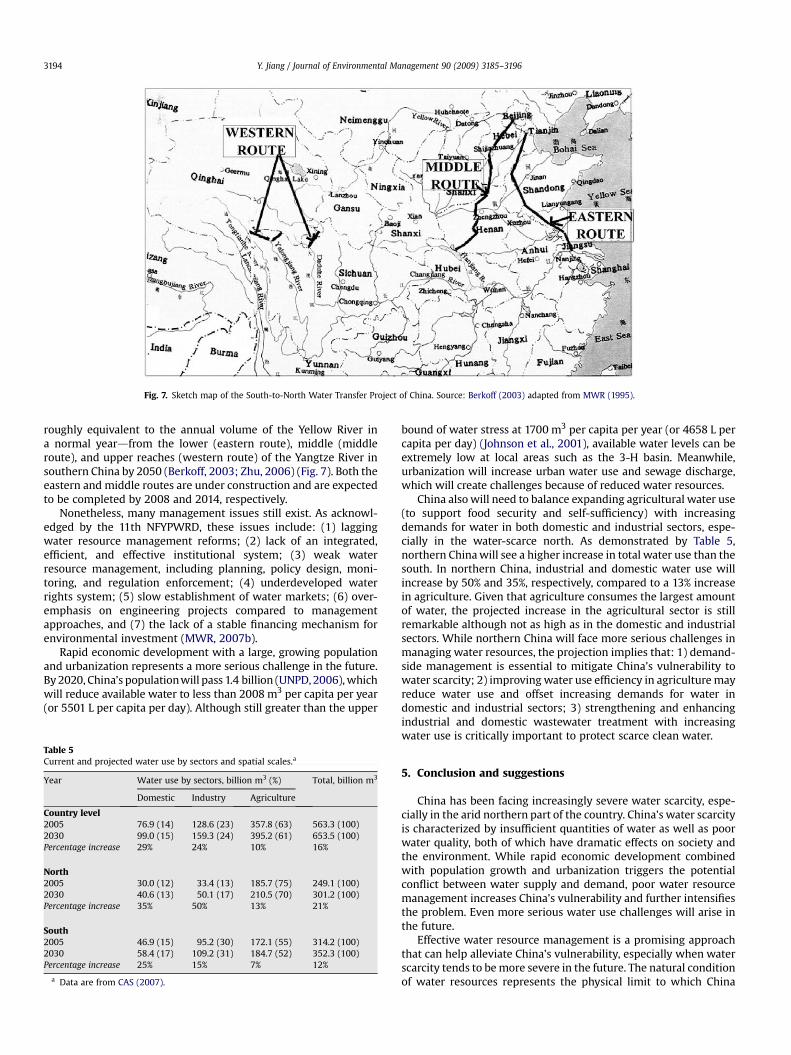
Fig. 7. Sketch map of the South-to-North Water Transfer Project of China. Source: Berkoff (2003) adapted from MWR (1995).
Y. Jiang / Journal of Environmental Management 90 (2009) 3185–31963194
roughly equivalent to the annual volume of the Yellow River ina normal yeardfrom the lower (eastern route), middle (middleroute), and upper reaches (western route) of the Yangtze River insouthern China by 2050 (Berkoff, 2003; Zhu, 2006) (Fig. 7). Both theeastern and middle routes are under construction and are expectedto be completed by 2008 and 2014, respectively.
Nonetheless, many management issues still exist. As acknowl-edged by the 11th NFYPWRD, these issues include: (1) laggingwater resource management reforms; (2) lack of an integrated,efficient, and effective institutional system; (3) weak waterresource management, including planning, policy design, moni-toring, and regulation enforcement; (4) underdeveloped waterrights system; (5) slow establishment of water markets; (6) over-emphasis on engineering projects compared to managementapproaches, and (7) the lack of a stable financing mechanism forenvironmental investment (MWR, 2007b).
Rapid economic development with a large, growing populationand urbanization represents a more serious challenge in the future.By 2020, China’s population will pass 1.4 billion (UNPD, 2006), whichwill reduce available water to less than 2008 m3 per capita per year(or 5501 L per capita per day). Although still greater than the upper
Table 5Current and projected water use by sectors and spatial scales.a
Year Water use by sectors, billion m3 (%) Total, billion m3
Domestic Industry Agriculture
Country level2005 76.9 (14) 128.6 (23) 357.8 (63) 563.3 (100)2030 99.0 (15) 159.3 (24) 395.2 (61) 653.5 (100)Percentage increase 29% 24% 10% 16%
North2005 30.0 (12) 33.4 (13) 185.7 (75) 249.1 (100)2030 40.6 (13) 50.1 (17) 210.5 (70) 301.2 (100)Percentage increase 35% 50% 13% 21%
South2005 46.9 (15) 95.2 (30) 172.1 (55) 314.2 (100)2030 58.4 (17) 109.2 (31) 184.7 (52) 352.3 (100)Percentage increase 25% 15% 7% 12%
a Data are from CAS (2007).
bound of water stress at 1700 m3 per capita per year (or 4658 L percapita per day) (Johnson et al., 2001), available water levels can beextremely low at local areas such as the 3-H basin. Meanwhile,urbanization will increase urban water use and sewage discharge,which will create challenges because of reduced water resources.
China also will need to balance expanding agricultural water use(to support food security and self-sufficiency) with increasingdemands for water in both domestic and industrial sectors, espe-cially in the water-scarce north. As demonstrated by Table 5,northern China will see a higher increase in total water use than thesouth. In northern China, industrial and domestic water use willincrease by 50% and 35%, respectively, compared to a 13% increasein agriculture. Given that agriculture consumes the largest amountof water, the projected increase in the agricultural sector is stillremarkable although not as high as in the domestic and industrialsectors. While northern China will face more serious challenges inmanaging water resources, the projection implies that: 1) demand-side management is essential to mitigate China’s vulnerability towater scarcity; 2) improving water use efficiency in agriculture mayreduce water use and offset increasing demands for water indomestic and industrial sectors; 3) strengthening and enhancingindustrial and domestic wastewater treatment with increasingwater use is critically important to protect scarce clean water.
5. Conclusion and suggestions
China has been facing increasingly severe water scarcity, espe-cially in the arid northern part of the country. China’s water scarcityis characterized by insufficient quantities of water as well as poorwater quality, both of which have dramatic effects on society andthe environment. While rapid economic development combinedwith population growth and urbanization triggers the potentialconflict between water supply and demand, poor water resourcemanagement increases China’s vulnerability and further intensifiesthe problem. Even more serious water use challenges will arise inthe future.
Effective water resource management is a promising approachthat can help alleviate China’s vulnerability, especially when waterscarcity tends to be more severe in the future. The natural conditionof water resources represents the physical limit to which China
Y. Jiang / Journal of Environmental Management 90 (2009) 3185–3196 3195
needs to adapt in its development. While it is challenging or evenimpossible in the short run to adjust population distribution, theregional layout of urban systems, and the economic structure toconform to the physical circumstance of water resources,improving water resource management seems to be a cost-effectiveapproach that deserves government efforts and holds promise formitigating the effects of water shortages. Indeed, poor manage-ment is one of the most important factors responsible for currentwater resources issues.
Addressing China’s water scarcity requires a holistic, integrated,scientific approach with long-term, coordinated efforts. Given thecomplexity of the issue and policy challenges (Lasserre, 2003), thispaper makes three recommendations that represent the currentpolicy priority for China to address the water scarcity issue whileimproving water resource management.
First, China needs to improve or establish institutional systemsthat register and regulate water withdrawal and use with clearlydefined, legally enforceable water rights. These institutionalsystems may be defined by basins consistent with the hydrologicalcycle of water resources. The basin commissions, under themanagement of MWR, should be the leaders in authorizing andregulating water use within their basin boundaries. Issuing waterwithdrawal permits must be consistent with water resource plan-ning and allocation. Water rights transfer based on initial waterallocation may be allowed as long as it is registered with the basincommissions and has passed scientific assessment with no signif-icant negative impact. A mechanism is needed to coordinate waterrights administration across government agencies. Until water useis regulated and controlled by institutional systems, effective waterresource management cannot possibly be achieved.
Second, China needs to pay more attention to market-basedapproaches as opposed to passively and solely relying on engi-neering measures to resolve water shortages. Appropriate engi-neering projects are necessary to ensure water supplies forsustainable socio-economic development. Adopting engineeringprojects to meet water demands, however, may not be alwayssocially efficient. The motivation for emphasizing market-basedapproaches rather than engineering measures is based on theeconomics of demand and supply and the resulting social welfareeffect. Specifically, both water demand and supply can adjust withwater prices. With administratively controlled, often low prices,water demand is not restricted and may reach a level higher thanthat which can be supplied at the full-cost recovery for given waterprices. In this case, pursuing engineering measures to meet thedemand is not only socially inefficient but also maybe expensive oreven impossible. Market-based approaches such as water pricingand water rights trading can cost-effectively balance the demandfor water with the capacity of the water supply at a socially-effi-cient level. Market-determined prices not only cover the cost ofwater supply but also restrict water demand while providingincentives to save water. Allocating water rights and allowing waterrights trading provide an economic approach to resolving waterscarcity while mitigating the negative impact of water pricing, ifany, on the poor. To facilitate and regulate the implementation ofmarket-based approaches, the government needs to create rulesand conditions.
Third, research-based, data-driven decision support systems andcapacity building need to play an important role in governmentefforts. Poor policy design and management not only waste limitedresources but also exacerbate water resource issues. Decisionsupport systems based on scientific research and reliable data is thefoundation of effective water resource management and can informgood policy design. Currently, basin-level decision support systemsthat integrate the biophysical and hydrological processes of waterresources and the socio-economic dynamics of water use are either
unavailable or not well-developed. The capacity to conduct rigorouspolicy-relevant analysis is weak. A unified information system withmeasurement and quality standards that maintains a record ofwater quality and quantity data has not been well developed. Lack ofcapacity to conduct scientific research impedes identifying localissues and the design of targeted policies. With its impressiveeconomic development, China is able to pursue more sophisticatedresearch with cutting-edge scientific methods. China can afford toinvest in scientific research and developing and maintainingcomplete information systems. Of course, mechanisms are neededthat can effectively and efficiently convert and transfer scientificinformation to policy design and water resource management.
Acknowledgments
This paper is written based on consulting work conducted forthe World Bank Analytical Advisory Assistance (AAA) Program,‘‘Addressing China’s Water Scarcity: From Analysis to Action.’’ Dr.Jian Xie provided valuable advice and materials for the consultingwork which help organize and prepare the paper. However, thispaper does not necessarily reflect the view of the World Bank.
References
Berkoff, J., 2003. China: the south-north water transfer projectdis it justified?Water Policy 5, 1–29.
Blanke, A., Rozelle, S., Lohmar, B., Wang, J., Huang, J., 2007. Water saving technologyand saving water in China. Agricultural Water Management 87, 139–150.
Brown, L.R., Halweil, B., 1998. China’s water shortage could shake world foodsecurity. World Watch Magazine 11, 10–21.
Cai, X.M., Ringler, C., 2007. Balancing agriculture and environmental water needs inChina: alternative scenarios and policy options. Water Policy 9, 95–108.
CAS (Chinese Academy of Science), 2007. China Sustainable Development StrategyReport 2007: Water Governance and Innovation. Scientific Press, Beijing, China.
Chen, Z.K., 1985. China’s water resources and its utilization. GeoJournal 10, 167–171.Chen, J.Q., Xia, J., 1999. Facing the challenge: barriers to sustainable water resources
development in China. Hydrological Sciences Journal 44, 507–516.D’Aquino, R., 2005. Changes and challengesdChina’s new five year plan. Chemical
Engineering Progress 101, 6–7.Deng, J., Jin, X., 2000. Study on the fishery biodiversity and its conservation in Laizhou
Bay and Yellow River Estuary. Zoological Research 21, 76–82 (in Chinese).Deng, X., Shan, L., Zhang, H., Turner, N.C., 2006. Improving agricultural water use
efficiency in arid and semiarid areas of China. Agricultural Water Management80, 23–40.
Economist, 2009. The rainman comes. Economist, Feb 12.Fan, H., Huang, H., Zeng, T., 2006. Impacts of anthropogenic activity on the recent
evolution of the Huang (Yellow) River Delta. Journal of Coastal Research 22,919–929.
FAO (Food and Agriculture Organization of the United Nations), 2001. ModernWater Rights: Theory and Practice. Legislative Study No. 92. Food and Agri-culture Organization of the United Nations, Rome, Italy.
Foster, S., Garduno, H., Evans, R., Olson, D., Tian, Y., Zhang, W., Han, Z., 2004.Quaternary aquifer of the North China Plaindassessing and achievinggroundwater resource sustainability. Hydrogeology Journal 12, 81–93.
Fu, G., Chen, S., Liu, C., Shepard, D., 2004. Hydro-climatic trends of the Yellow RiverBasin for the last 50 years. Climatic Change 65, 149–178.
Han, Z.S., 2003. Groundwater resources protection and aquifer recovery in China.Environmental Geology 44, 106–111.
He, D.W., Chen, J.S., 2001. Issues, perspectives and need for integrated watershedmanagement in China. Environmental Conservation 28, 368–377.
Huang, H., Fan, H., 2004. Monitoring changes of nearshore zones in the Huanghe(Yellow River) delta since 1976. Oceanologia Et Liminologia Sinica 35, 306–314.
Huang, Q., Rozelle, S., Wang, J., Huang, J., 2009. Water management institutionalreform: a representative look at northern China. Agricultural Water Manage-ment 96, 215–225.
Jin, X.C., 2003. Analysis of eutrphication state and trend for lakes in China. Journal ofLimnology 62, 60–66.
Jin, X.C., Liu, S.K., Zhang, Z.S., 1995. Lakes in ChinadResearch of Their Environment(I). China Ocean Press, Qingdao, China.
Jin, X.C., Xu, Q.J., Huang, C.Z., 2005. Current status and future tendency of lakeeutrophication in China. Science in China Series C Life Sciences 48, 948–954.
Johnson, N., Revenga, C., Echeverria, J., 2001. Managing water for people and nature.Science 292, 1071–1072.
Lasserre, F., 2003. Alleviating water scarcity in northern China: balancing optionsand policies among Chinese decision-makers. Water Science and Technology 47,153–159.

Y. Jiang / Journal of Environmental Management 90 (2009) 3185–31963196
Li, S.T., 2006. Urban water pollution issues. China Youth, 09/13/2006. http://news.xinhuanet.com/environment/2006-09/13/content_5084123.htm accessed July2007.
Li, G.B., Yin, C.Q., Zhou, H.D., 2001. Three-lake water problem of China and its coun-termeasures and management. Water Problem Forum 3, 36–39 (in Chinese).
Lin, C., Su, J., Xu, B., Tang, Q., 2001. Long-term variations of temperature and salinityof the Bohai Sea and their influence on its ecosystem. Progress of Oceanography49, 7–19.
Liu, J., Diamond, J., 2005. China’s environment in a globalizing world. Nature 435,1179–1186.
Liu, W., Qiu, R.L., 2007. Water eutrophication in China and the combating strategies.Journal of Chemical Technology and Biotechnology 82, 781–786.
Liu, C.M., Wei, Z.Y., 1989. Agricultural Hydrology and Water Resources in the NorthChina Plain. Science Press, Beijing, China (in Chinese).
Liu, C.M., Xia, J., 2004. Water problems and hydrological research in the YellowRiver and the Huai and Hai River Basins of China. Hydrological Processes 18,2197–2210.
Liu, C.M., Yu, J.J., 2001. Groundwater exploitation and its impact on the environmentin the North China Plain. Water International 26, 265–272.
Lohmar, B., Huang, Q., Lei, B., Gao, Z., 2007. Water pricing policies and recentreforms in China: the conflict between conservation and other policy goals. In:Molle, F., Berkoff, J. (Eds.), Irrigation Water Pricing: The Gap Between Theoryand Practice. CABI, Oxfordshire, UK.
Lou, X.C., 1998. Handbook of Water Resources and Water Treatment for China. ChinaEnvironmental Science Press, Beijing, China (in Chinese).
Ma, Z., Wang, Y.X., Wu, J., 2006. Setting up the environmental financial mechanismand increasing environmental investmentdthe key to implement ‘‘decision’’ bythe State Council. China Environmental News, 9 July.
Molle, F., Berkoff, J., 2008. Irrigation water pricing: the gap between theory andpractice. CABI, Oxfordshire, UK.
MWR (Ministry of Water Resources, P.R. China),1995. Brief Introduction of the Planningfor South-to-North Water Transfers. Ministry of Water Resources, Beijing, China.
MWR (Ministry of Water Resources, P.R. China), 2004a. Water Resources in China.Ministry of Water Resources, Beijing, China. http://www.mwr.gov.cn/english1/20040802/38161.asp retrieved in July 2007.
MWR (Ministry of Water Resources, P.R. China), 2007a. Water Resources Bulletin2006. Ministry of Water Resources, Beijing, China.
MWR (Ministry of Water Resources, P.R. China), 2007b. The 11th Five-Year Plan ofNational Water Resources Development, Gazette of the Ministry of WaterResources of the P.R. China 2007, 34–48.
MWR (Ministry of Water Resources, P.R. China), 2007c. Statistic Bulletin on ChinaWater Activities 2006. China Water Power Press, Beijing, China.
NBSC (National Bureau of Statistics of China), 2004. China Urban Statistical Year-book 2004. National Bureau of Statistics Press, Beijing, China.
NBSC (National Bureau of Statistics of China), 2006. China Statistical Yearbook 2006.National Bureau of Statistics Press, Beijing, China.
Ongley, E.D., 2004. Non-point source water pollution in China: current status andfuture prospects. Water International 29, 299–306.
OECD (Organization for Economic Cooperation and Development), 2007. Environ-mental Performance Reviews: China. OECD, Paris, France.
Shalizi, Z., 2006. Addressing China’s Growing Water Shortages and Associated Socialand Environmental Consequences. World Bank, Washington D.C., USA.
Smakhtin, V., Revenga, C., Doll, P., 2004. Taking into Account Environmental WaterRequirements in Global-Scale Water Resources Assessments. ComprehensiveAssessment Research Report 2. Comprehensive Assessment Secretariat,Colombo, Sri Lanka.
Spulber, N., Sabbaghi, A., 1998. Economics of Water Resources: From Regulation ToPrivatisation. Kluwer Academic Publishers, Boston, USA.
SC (State Council, P.R. China), 2006. The 11th Five-Year National Plan for Social andEconomic Development. People’s Publishing House, Beijing, China.
SEPA (State Environmental Protection Administration, P.R. China), 1991–2007. ChinaEnvironmental Bulletins 1990–2006. State Environmental Protection Adminis-tration, Beijing, China.
SEPA (State Environmental Protection Administration, P.R. China), 1995–2006.China Environmental Statistics Yearbooks 1995–2006. State EnvironmentalProtection Administration, Beijing, China.
Tso, T.C., 2004. Agriculture of the future. Nature 428, 215–217.UNESCAP (United Nations Economic and Social Commission for Asia and the
Pacific), 1997. Study on Assessment of Water Resources of Member Countriesand Demand by User Sectors: ChinadWater Resources and Their Use. UNESCAP,New York, USA.
United Nations Population Division, 2006. World Population Prospects: The 2006Revision. UN Population Division, New York, USA. http://esa.un.org/unpp/p2k0data.asp assessed in January 2008.
Wang, X.Y., 2006. Management of agricultural non-point source pollution in China:current status and challenge. Water Science and Technology 53, 1–9.
Wang, X.C., Jin, P.K., 2006. Water shortage and needs for wastewater re-use in theNorth China. Water Science & Technology 53, 35–44.
Wang, Z.M., Ren, X.S., Guo, H.Y., 2000. Hai Water Resource Facing the 21st Century.Tianjin Science and Technology Press, Tianjin, China. in Chinese.
Wang, J., Xu, Z., Huang, J., Rozelle, S., 2005. Incentives in water management reform:assessing the effect on water use, production and property in the Yellow riverbasin. Environment and Development Economics 10, 769–799.
Wang, H.J., Yang, Z.S., Saito, Y., Liu, J.P., Sun, X.X., 2006a. Interannual and seasonalvariation of the Huanghe (Yellow River) Water Discharge over the past 50 years:connections to impacts from ENSO events and dams. Global and PlanetaryChange 50, 212–225.
Wang, Z.S., Zhou, C.F., Guan, B.H., Deng, Z.F., Zhi, Y.B., Liu, Y.H., Xu, C., Fang, S.B.,Xu, Z., Yang, H.B., Liu, F.D., Zheng, J.W., Li, H.L., 2006b. The headwater loss of thewestern plateau exacerbate China’s long thirst. AMBIO 35, 271–272.
Wang, J., Huang, J., Blanke, A., Huang, Q., Rozelle, S., 2007. The development,challenges and management of groundwater in rural China. In: Giordano, M.,Villholth, K.G. (Eds.), The Agricultural Groundwater RevolutiondOpportunitiesand Threats to Development. International Water Management Institute,Colombo, Sri Lanka.
Wong, S., 2007. China bets on massive water transfers to solve crisis. World RiversReview, December 15, 2007. http://internationalrivers.org/en/print/2397,retrieved Feb. 2009.
WB (World Bank), 2001. Agenda for Water Sector Strategy for North China:Summary Report. World Bank, Washington DC, USA.
WB (World Bank), 2002. China Water Resource Assistance Strategy. World Bank,Washington D.C., USA.
WB (World Bank), 2006. China Water Quality ManagementdPolicy and Institu-tional Considerations. World Bank, Washington DC, USA.
WB (World Bank), 2007a. Cost of Pollution in China: Economic Estimates of PhysicalDamages. World Bank, Washington DC, USA.
WB (World Bank), 2007b. Water Pollution Emergencies in ChinadPrevention andResponse. Background paper for World Bank China analytical and advisoryAssistance (AAA) program, Washington DC, USA.
Wu, K., Xue, Y.Q., Liu, E.M., 1998. Characteristics, variations and forecasting of dry-up episodes of the Huang River. Geographical Research 17, 125–129(in Chinese).
Wu, C.H., Maurer, C., Wang, Y., Xue, S.Z., Davis, D.L., 1999. Water pollution andhuman health in China. Environmental Health Perspectives 107, 251–256.
Xia, J., Chen, Y.Q.D., 2001. Water problems and opportunities in hydrologicalSciences in China. Hydrological Sciences Journal 46, 907–922.
Xia, J., Liu, M.Y., Jia, S.F., Song, X.F., Luo, Y., Zhang, S.F., 2004. Water security problemand research perspective in North China. Journal of Natural Resources 19,550–560 (in Chinese).
Xia, J., Zhang, L., Liu, C.M., Yu, J.J., 2007. Towards better water security in NorthChina. Water Resource Management 21, 233–247.
Xu, Z., 2001. Study on increasing water use efficiency. Journal of China WaterResources 455, 25–26 (in Chinese).
Yang, X.L., Pang, J.W., 2006. Implementing China’s ‘‘Water Agenda 21.’’ Frontiers inEcology and The Environment 4, 362–368.
Yang, H., Zhang, X., Zehnder, A., 2003. Water scarcity, pricing mechanism andinstitutional reform in northern China irrigated agriculture. Agricultural WaterManagement 61, 143–161.
Yang, D., Li, C., Hu, H., Lei, Z., Yang, S., Kusuda, T., Koike, T., Musiake, K., 2004.Analysis of water resources variability in the Yellow River of China during thelast half century using historical data. Water Resources Research 40, W06502.
Yardley, J., 2007. Beneath booming cities, China’s future is drying up. The New YorkTimes. September 28, 2007.
Zhang, J.L., 2007. Barriers to water markets in the Heihe River basin in northwestChina. Agricultural Water Management 87, 32–40.
Zhang, J.K., Gao, S.J., Fen, J., Yan, L.L., 2007. China’s Water Resource Management:Strategic Issues, Governance, and Government Capabilities. The State CouncilCenter for Development Research, Beijing, China.
Zhu, R., 2006. China’s South-North Water Transfer Project and Its Impacts onEconomic and Social Development. Ministry of Water Resources, Beijing, China.http://www.mwr.gov.cn/english1/20060110/20060110104100XDENTE.pdfaccessed Sept. 2007.
Zhu, Z.Y., Zhou, H.Y., Ouyang, T.P., Deng, Q.L., Kuang, Y.Q., Huang, N.S., 2001. Watershortage: a serious problem in sustainable development of China. InternationalJournal of Sustainable Development and World Ecology 8, 233–237.
Zhu, Z.Y., Deng, Q.L., Zhou, H.Y., Ouyang, T.P., Kuang, Y.Q., Huang, N.S., Qiao, Y.L.,2002. Water pollution and degradation in Pearl River Delta, South China.AMBIO 31, 226–230.