Embed Size (px)
Citation preview

SP-289.22
Application of Packing Concepts to High Performance Self-Consolidating Mortar
(SCM) Systems
by Syed Ali Rizwan, Sajjad Ahmad, and Thomas A. Bier
Synopsis: This study reports the effects of packing of aggregate phase on the fresh and hardened state properties of high performance self-consolidating mortar (SCM) systems. The sands of five different gradings were utilized in this study. The final grading curves were obtained using Modified Andreassen model by varying its distribution modulus (q) from 0.20 to 0.50 so as to find its optimum value for maximum packing density of aggregate phase. The experimental results showed that the maximum packing density of sand used in research occurs when the distribution modulus (q) has a value of 0.35 in the Modified Andreassen model and that the total flow of the self-consolidating mortar (SCM) formula-tions increased with the increase in the packing density of sand in the SCM formulations while the V-funnel time reduced. The strength results showed improvement with higher packing degrees of mixes.
Keywords: Andreassen and Modified Andreassen model, Optimized grading curve, SCM
299

ACI member Syed Ali Rizwan is a Professor at the National University of Sciences and Technology (NUST), Islamabad, Pakistan. He received his B.Sc. in Civil Engineering from the UET, Lahore, Pakistan; his M.Sc. in Structural Engineering from University of Surrey, UK; and his PhD from the Technical University, Freiberg, Germany. He is a member of ACI committees 237, 234 and 232. His current research interests include SCC and ultra-high early strength self-leveling grout systems. Sajjad Ahmad is a PhD student at Department of Structural Engineering at Politecnico di Torino, Italy. He received his Bachelor’s degree in Civil Engineering from Military College of Engineering (MCE), NUST and Master’s Degree from NUST, Islamabad, Paki-stan. His current research interests include Self-Consolidating Concrete and application of packing concepts in self-compacting cementitious systems. Thomas A. Bier is a Professor and Chair of Construction Materials Technology at the Technische Universitat Bergakademie Freiberg, Germany. He received his PhD on Carbonation of Concrete in 1982. He has extensive research experience in USA and France. His research interests include microstructure, hydration and Rheology of hydraulic binders, high performance concrete and mortars, monolithic castables and sophisticated dry mortars.
INTRODUCTIONA commercially available ordinary Portland cement of Grade 53 was utilized in the
research work. The mortar mixes were made with mixing water equal to the water demand of the system. Self-compacting concrete technology was originally discovered by Okamura1 and some practical mixes used in its application in a German tunnel of a teaching mine are given in Reference 2. Andreassen and Andersen3 presented a semi-empirical study of the packing of continuous PSD for the granular materials and determined the PSD with the densest packing. Funk and Dinger4 modified this PSD to account for the smallest particle size (known as modified A&A method). There seems to be a positive relationship between rheological properties and packing density of concrete mix: for a given mixing water content, the better the packing, the more is the effective water available to lubricate solids and hence better the fluidity.5It appears that a fine sand is a useful component in optimizing the PSD and increases the stability and flow ability of the concrete mix and percentage of sand/coarse aggregates in the range of 40-60 gives an optimized voids fraction of around 23%5 in compacted state. Fuller curve suits normal concretes with particle size larger than 500 microns while it is not suited to SCC which contains high amounts of solids in form of powders and ideally, the grading curve of all solids should follow the modified Andreasen and Andersen curve.5The SCM systems find their applications in self-leveling underlayments and repairs of structures. Such formulations are usually characterized by the high powder content, high flow-ability, low yield stress and adequate viscosity. These systems possess excellent filling and passing abilities without bleeding and segregation. Different secondary raw materials (SRMs), when used in these systems, give different fresh and hardened state response.6 It is also stated that suitable blends of different SRMs can also enhance the response of such systems.7 There is limited literature available on
300 Rizwan et al.

the utilization of packing density concept in self-consolidating mortar (SCM) systems and self-consolidating concrete (SCC) systems; which incorporate high powder content to make sufficient quantity of paste available in the mix. The paste performs two functions in fresh state including filling the voids of the aggregate phases and serving as a vehicle for the transport of aggregate phase.8 The flow of the mixes increases with increase in paste content.9 Extra paste translates in higher costs and possibly higher shrinkages. To optimize the paste content, it is desirous to minimize the void content of the aggregates in the mix resulting in durable and economical self-consolidating mortar system.
Particle packing optimization methodsThe term packing density or packing degree of a material (aggregates, particles etc) is
defined as the ratio of volume occupied by the solid particles to the unit volume of the mix.10
α = = +( )Vs Vt Vs Vs Vv
(1)
Here ‘a’ is the packing density, Vs is the volume of solids, Vv is the volume of voids and Vt is the total volume of the mix. The concept of particle packing gained its importance with the advent of the concrete technology in 19th century. The concept of particle packing optimization takes into account the factor of selecting the right small sized particles that fill up the voids of larger sized material resulting in higher packing density. There are several methods for the selection of particle sizes and their proportioning in the mix to produce dense or desired degree of packing. Furnas11 proposed a model, with some assumptions, for predicting the packing density of the binary mixes. Thereafter he utilized the model for the production of particle size distribution curve for proportioning the mixes with higher packing density. Füller and Thompson in 190712 and Andreassen and Andersen in 19303 and Funk et al4 proposed continuous particle size distribution curves for the purpose of achieving higher workability of mixes. A Füller curve is utilized for designing Portland cement concrete and asphalt mixes by minimizing the internal voids content. ASTM also provides particle distribution curves, declaring lower limit and upper limit of particles sizes to be used in mix13 possibly to ensure stability of mixes without bleeding and segregation.
Several commercial software programs are now available, developed on the basis of above mentioned models, to predict the packing density of the mix such as 4C-Packing developed by Danish Technological Institute, DTI,14 Europack15 by Idorn, and EMMA and Elkem material mix analyzer.16 Generally packing density optimization methods can be divided into three groups: Particle packing models, discrete element models and Optimiza-tion curves.
Particle packing modelsParticle packing models result in set of mathematical expressions which can predict the
packing densities of the mixes composed of two or more size classes of particles. Because of inherent assumptions, such techniques are just theoretical approach for designing the granular mixes for higher packing densities.17 The packing models may or may not
Application of Packing Concepts to High Performance SCM Systems 301

consider the interaction between the particles of the different sizes and shapes. The basic mathematical equations of almost all particle packing models are the same and are based on the geometry of the particles. These models can be utilized to design granular mixes but a major limitation is that they consider spherical shape particles and at a time only material of two sizes can be considered.
Discrete element modelsDiscrete element models (DEMs) are computer generated models which produce virtual
particle structure for a given particle size and shape. There are two types of DEMs i.e. static and dynamic. In the static model simulation, the particles are placed randomly in a two or three dimensional space and afterwards they are not allowed to move, addition-ally the contact between the particles is also not given consideration. A software package “Hymostruc” developed by the researchers at TU Delft is an example of static type discrete element model.18 In the dynamic type discrete element models, the particles are generated randomly in a specific volume and then some force is applied to the particles so that they occupy the most stable place in that volume. This ensures the stable contact between the particles and shows higher virtual packing as compared to the static type discrete element model.
Optimization curvesIn self-consolidating concrete mixes, the particle size ranges from several millimeters
to some microns. The particle density depends upon the particle size distribution (PSD) shown in form of curve. It presents the particle sizes and their respective quantities present in the mix. The PSD of a mix is related to the packing density of mix which can be opti-mized. Some researchers tried to improve the relation for obtaining better performance, Andreassen an Andersen proposed that the Füller model gives better results if the distribu-tion modulus (q) is less than ‘0.5’ as Füller used it as 0.5 (Eq.2). They proposed that the distribution modulus ‘q’ (Eq.3) should be in the range of ‘0.33’ to ‘0.50’.
CPFT = d d max .( )0 5
(2)
CPFT = d d qmax( ) (3)
Here CPFT is the Cumulative Percentage of material Finer Than the sieve/particle size‘d’ and dmax is the maximum size of the particle available in the mix.
The distribution modulus (q) for the optimized grading curve depends upon the charac-teristics of the aggregate particles and can vary for the aggregates from different sources and origins. Angular particles give poor packing due to their sharp edges. The sharp edges restrict the particles from coming close and thus cause more voids in the mix; such that a larger proportion of fine particles is required to fill the space between large angular parti-
302 Rizwan et al.

cles; hence the suitable value of distribution modulus will be lower than that required for spherical particles.19
The main limitation in the Füller or Andreassen model is the requirement of the parti-cles of infinitely small size to complete the particle size distribution curve. These models pay attention only to the maximum size of the particle in the mix and do not take into account the minimum size limits of the aggregate used in the mix. This issue was later on addressed by modifying the Andreassen model and including a factor to take into account the minimum size available for the mix.4
The packing density varies as the proportions of different size classes in the mix are varied, so PSD curve is an effective tool for controlling the proportions of different size classes in the mix in a sequential way. Optimizing curves are easy to use as they require limited input parameters. If distribution modulus is fixed then only parameters required are the maximum and minimum average size of particles. Commercial computer program EMMA developed by Elkem is based on the Andreassen and modified Andreassen model and can be utilized to optimize the particle size distribution of the mix.
RESEARCH SIGNIFICANCESelf-consolidating or self-compacting cementitious systems (SCCS) incorporate a rela-
tively large quantity of powder (cement plus SRMs) material to provide adequate paste for the flow and consistency of the mixes. Hence for achieving the economy and environment friendliness, it is desirable to reduce the cement content of the mix by adding SRMs so that all the functional requirements of the self-consolidating cementitious system are met with and PSDs are also optimized. A systematic aggregate optimization method is to minimize the void content that will enable the production of durable and environment friendly self-compacting concrete systems. This paper addresses this area and gives satisfactory results.
EXPERIMENTAL INVESTIGATIONNormal Portland cement of grade 53 having 95% clinker and 5% gypsum content was
utilized in the research work. EDX (Energy Dispersive X-ray) analysis was carried out to investigate the chemical composition of the Portland cement. Table 1 gives the chemical
Table 1–Chemical composition of portland cement
Properties/ Oxides Cement (mass %)
CaO 63.84
SiO2 16.95
Al2O3 6.40
Fe2O3 5.27
SO3 3.89
MgO 2.18
K2O 1.47
Loss on Ignition (%) 1.77
Specific Gravity 3.18
Application of Packing Concepts to High Performance SCM Systems 303

and physical properties of the cement. The selected mix proportions of self-consolidating mortar systems were 1:1.33 by mass (cement: sand) with water cement ratio of 0.30. The mortar mix proportion consisted of sand with five different grading curves. The sand was obtained from natural sand deposits at Lawrencepur in Pakistan. It was fine sand having fineness modulus of 2.059. A commercially available polycarboxylate, liquid type super plasticizer Glenium ACE 30 meeting ASTM C494 type ‘A’ and ‘F’ was used to give a Hagerman’s mix slump flow of 31±1cm (12.5 ± 1/2.5 inch). The super plasticizer was tested for its properties and results are shown in Table 2.
Grading of fine aggregateThe sand obtained from source was first oven dried at 105°C for 24 hours and then sieved
through ASTM standard sized sieves. The distribution curve of the sand is shown in Fig. 1. The PSD curve of sand was compared with the ASTM C-33 limits and it was found that the PSD curve of sand remains within the ASTM limits between size range of 1-300mm and after this size range the PSD curve show that the sand contains more fine material than the ASTM limit.
Table 2–Glenium ACE-30 super plasticizer properties
Property Manufacturer’s Specifications Actual Properties
Appearance Brown, free flowing liquid Brown and free flowing
Specific gravity 1.210 at 25oC 1.210 at 25oC
PH value 6.5–9.0 6.54
Solid content 38%–48% 42%
Dosage 0.5–1.0 liter per 100kg cement
Note: 1kg = 2.204lbs
Fig. 1–Particle Size Distribution of Fine Aggregate and ASTM Limits
304 Rizwan et al.

Five particle size distribution curves were selected for composing the SCM formulations. These PSD curves were obtained from modified Andreassen model by varying the distribu-tion modulus (q).
CPFT = dq d q d q d q−( ) −( ) ×min max min 100
(4)
Where‘d’ is the particle size for which CPFT parameter is being considered, dmin is the minimum size of particle and dmax is the maximum size of particle in the mix.
Eq 4 shows the Modified Andreassen model. The five different distribution moduli used were 0.50, 0.40, 0.35, 0.30 and 0.20. The mix composed with the sand of distribution modulus of 0.50 was taken as the base mix. The particle size distribution curves obtained from the model are shown in Fig. 2.
For manufacturing the sands, out of the given natural sand, according to the PSD curves shown in Fig. 2, the as available sand was sieved and separated into five different size ranges. The size ranges were marked as S1 to S5. The average size of sand classes decreased as the number in the subscript increases from 1 to 5. The size range of the each size class is given in Table 3.
These sand ranges were mixed in the required proportions to produce the sand mix with desired PSD curve as dictated by the Modified Andreassen model. The resultant blended sand mixes were named according to the distribution modulus on which they were composed (i.e. S0.50, S0.40 and so on).
Packing density of fine aggregate mixesThe five blended sand mixes were analyzed for their packing density in two conditions
as per BS -812 (D1: Dry un-compacted packing density and D2: Dry compacted packing
Fig. 2–PSDs of Blended Sand Mixes with Different Distribu-tion Moduli
Application of Packing Concepts to High Performance SCM Systems 305

density) to determine the effects of particle size distribution curve/distribution modulus on the packing density using the following equation.
α ρ= ×Mp p V (5)
Here packing density is denoted by ‘a’, Mp is the mass of sand that filled the container of volume ‘V’ and ‘rp’ is the density of the blended sand. Fig. 3 and Fig. 4 show the results of packing density of sand mixes in loose and compacted state.
Mixing regimeThe mixing regime has a very significant effect on the fresh and hardened state proper-
ties of cement based systems.20 A special mixing regime was used with a view to reduce the required super plasticizer content for the target flow and to ensure its activation as suggested in.20 It consisted of dry mixing of previously weighed sand and powder for 30
Table 3–Different size classes (ranges) obtained from sieving
Notation Upper Size Limit Lower Size Limit
Passing Sieve # Opening (mm) Retained Sieve # Opening (mm)
S1 #8 2360 #16 1180
S2 #16 1180 #30 600
S3 #30 600 #50 300
S4 #50 300 #100 150
S5 #100 150 #200 74
Note: 1in=25000mm
Fig. 3–Dry Loose Packing Density (D1) of Blended Sand Mixes
306 Rizwan et al.

seconds at slow speed in 5 liters Hobart mixer and then adding 80% of the total mixing water and shearing for another 30 seconds at slow speed. Thereafter, one minute of mixing at fast speed was done. The walls of mixer were then cleaned and the remaining 20% of the mixing water, along with the super plasticizer was added and formulations were mixed for another three minutes at fast speed. The total mixing time was, therefore, five minutes. The target flow spread for all formulations was 31±1cm (12.5 ± 1/2.5 inch).
Flow response of SCM with different packing densityAs the packing density changes, the paste content required to fill up the voids of the
aggregate mix also changes and for the mixes of higher packing density the minimum paste content fills up the voids of the aggregate matrix in the SCM system by making more paste available to aggregate particles to provide flow. To investigate the effect of packing density on the flow of the self-consolidating mortars, five mortar mixes were used and the details are given in Table 4. As a first trial, in all the formulations the mixing water content and super plasticizer content were kept constant and the only variable was the packing density of the sand mixes. The results of the flow tests are shown in Fig. 5 while Fig. 6 shows the typical dimensions of the Hagerman’s mini slump cone.
SCM formulations for constant flowIn the second trial, the SP content for SCM formulations was then adjusted for providing
the target flow for the similar formulations mentioned in Table 4 and the response is given in Table 5. The rheological parameters including T25 cm (1inch = 2.5cm) cone time as suggested by Rizwan6 along with mini V-funnel times were also measured and results are shown in Figs 7 to 10.
Strength response of SCM formulationsFor assessing the effects of packing density on hardened state properties of the SCM
systems, 40 prisms of 4x4x16 cm3 (1inch = 2.5cm) were cast. The specimens were kept at
Fig. 4–Dry Compacted Packing Density (D2) of Blended Sand Mixes
Application of Packing Concepts to High Performance SCM Systems 307

room temperature and humidity (18°C & 65%) for the initial 24 hours and then demolded. The specimens were then immersed in water at 20°C until the test age. At the desired ages, the specimens were taken out from curing tank and were wiped thoroughly by using tissue
Table 4–Composition of mortar for flow test at constant SP content
Mortar Mix Designation
Cement Sand (gram) Water Flow SP
gram S1 S2 S3 S4 S5 Total gram cm %
MF-q50 300 142.56 98.76 71.88 50.84 35.96 400 90 27.25 1.00
MF-q40 300 129.44 96.04 74.84 56.72 43.00 400 90 30.50 1.00
MF-q35 300 122.93 94.38 76.12 59.72 46.86 400 90 31.00 1.00
MF-q30 300 116.48 92.56 77.24 62.76 50.96 400 90 29.25 1.00
MF-q20 300 103.92 88.40 79.00 68.80 59.76 400 90 28.00 1.00
Note: 1in=2.5cm, 1gm = 2.204x10⁻³ lbs
Fig. 5–Flow of SCM mixes as a function of packing density at Constant SP Content
Table 5–Composition of SCM formulations for constant target flow
Mortar Mix Designation
Cement Sand (gram) WaterSP (%) for target flowGram S1 S2 S3 S4 S5 gram
M-q50 300 142.56 98.76 71.88 50.84 35.96 90 1.20
M-q40 300 129.44 96.04 74.84 56.72 43.00 90 1.10
M-q35 300 122.93 94.38 76.12 59.72 46.86 90 1.00
M-q30 300 116.48 92.56 77.24 62.76 50.96 90 1.30
M-q20 300 103.92 88.40 79.00 68.80 59.76 90 1.50
Note: 1in=2.5cm, 1gm = 2.204x10⁻³ lbs
308 Rizwan et al.

papers to bring samples around saturated surface dry (SSD) condition and then were tested as per DIN EN 196-3. The results of the strength tests are show in Fig. 11 and Fig.12.
EXPERIMENTAL RESULTS AND DISCUSSIONThe sand mixes were prepared by mixing individual sand sizes S1 to S5 with the percent-
ages given by Modified Andreassen model for various distribution moduli. The packing density of sand mixes increases with the distribution modulus and maximum packing degree occurs at the distribution modulus of ‘0.35’ after which it starts decreasing. The trend of packing density of sand mixes is similar for both cases i.e. loose and compacted.
The relationship of packing density with distribution modulus can easily be established by correlating the fineness modulus of the sand mixes to their distribution modulus of Modified Andreassen model (Fig. 13). The fineness modulus of sand mixes increases with the distribution modulus. As the distribution modulus is increased the sand mix becomes coarser. At distribution modulus of ‘0.20’ the sand is fine and contains more quantity of fine particles as compared to the content of coarse particles. The individual packing density
Fig. 6–Typical Dimensions of Hagerman’s Cone
Fig. 7–T25 Time of SCM Formulation’s Flow by Hagerman’s Cone
Application of Packing Concepts to High Performance SCM Systems 309

of fine sand is lower as compared to the packing density of coarse sand. By increasing the distribution modulus of the mix, the content of fine sand decreases and that of coarse sand increases resulting in increased packing density of the mix. This happens until distribution modulus approaches 0.35 after which an increase in “q” again results in lower packing densities of the given mix.
The flow test results of self-consolidating mortars show that the flow of SCM systems is directly related to the packing density of sand in the mortars (Fig. 5).The ‘MF-q35’ mix produced the highest flow as compared to other mixes at ‘1%’ SP and W/C of ‘0.30’ (which is the water demand of the systems and is a sum of Vicat demand of powders plus SSD water requirement of aggregates). This is because higher packing density of the
Fig. 8–V-Funnel Time for SCM Formulations
Fig. 9–V-Funnel Time and T25 cm (1inch = 2.5cm) Time Relationship for SCM Formulations
310 Rizwan et al.

‘MF-q35’ mix, the void volume is reduced and hence the effective available water/paste content is increased. It may be stated that flow of self-consolidating mortar systems is inversely related to the packing density of fine aggregate matrix in the mortar for a given mixture formulation.
Fig. 10–Total Cone Flow Time and T25 cm (1inch = 2.5cm) Time Relationship for SCM Formulations
Fig. 11–Compressive Strength of SCM Formulations at spec-ified ages
Application of Packing Concepts to High Performance SCM Systems 311
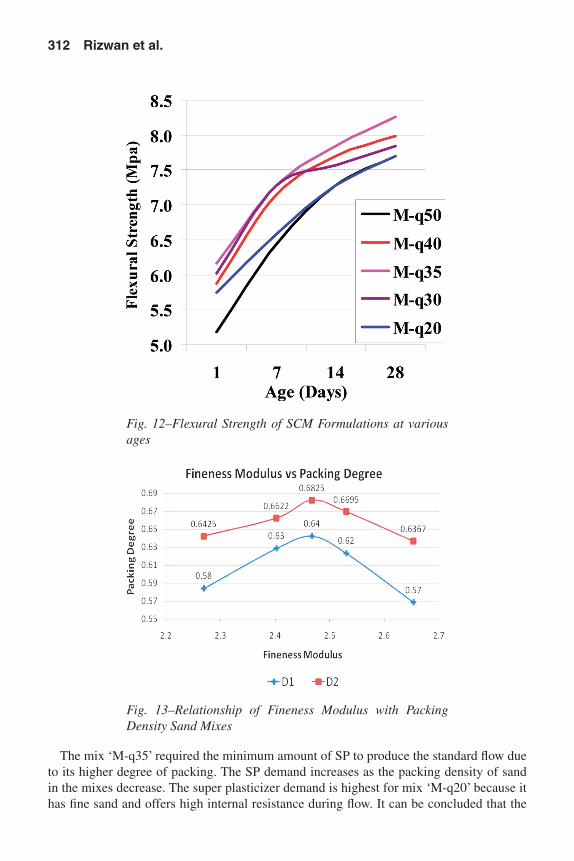
The mix ‘M-q35’ required the minimum amount of SP to produce the standard flow due to its higher degree of packing. The SP demand increases as the packing density of sand in the mixes decrease. The super plasticizer demand is highest for mix ‘M-q20’ because it has fine sand and offers high internal resistance during flow. It can be concluded that the
Fig. 12–Flexural Strength of SCM Formulations at various ages
Fig. 13–Relationship of Fineness Modulus with Packing Density Sand Mixes
312 Rizwan et al.

SP demand is larger for lower packing density of sand in the given mixture formulation or vice versa.
Literature suggests that the T25 cm (1inch = 2.5cm) time is a function of both yield stress and viscosity of a self-consolidating cementitious system while V-funnel times are indicative of the viscosity of the SCM systems.6,20 The SCM formulations were tested for T25 cm (1inch = 2.5cm) time, total cone spread time and mini-V-funnel time. It was found that the T25 cm time increases as the distribution modulus decreases (finer sands) while the V-funnel time show some relation with the packing density of the mixes. The T25 cm (1inch = 2.5cm) time increases because higher fine sand content takes up higher water to lubricate its particles and hence reduced water is available for paste manufacture. The mix ‘M-q50’ carries least quantity of fine sand so the mix is not very cohesive and creeps faster as compared to other mixes. The trend of V-funnel time shows that it is related to the packing density of the sand in the mix. Higher packing density SCM mixes requires less V-funnel time as expected and explained above.
The compressive and flexural strength tests were performed as per DIN standards to see the effects of the packing density of fine aggregate on the mechanical properties of SCM systems. The results show that the mixes with higher packing density give higher compres-sive as well as higher flexural strengths. For quantification of flexural and compressive strengths consider the mix ‘M-q50’ as a base line mix (coarse mix) or perhaps M-q20 may also serve as baseline. At one day age, the mix ‘M-q35’ gives 24.48% higher compressive strength than base line mix and at the age of 28 days the strength of ‘M-q35’ is about 8% higher. It can be concluded that the SCM mixes (all having same proportions) with higher packing density give higher strength.
CONCLUSIONSBased on this research work, the following conclusions may be drawn.1. The higher packing density of the fine aggregates in the SCM mixes enhances the flow
of SCM mixes having given mix proportions at constant SP content.2. The effect of packing density on response of SCM systems without SRMs shows an
optimal result at maximum packing density when q=0.35 or more realistically when q is the range of 0.3-0.4.
3. The flow of SCM mixes with given mix proportions increases at constant SP content with the increase in the packing density of fine aggregates in such mixes.
4. Compressive strength of SCM given mix proportions increases at all ages when q drops from 05 to 0.35 and thereafter it starts decreasing with decrease of q value from 0.35 to 0.20.
5. It is recommended to use T25 cm (1inch = 2.5cm) time for SCM and SCP systems as equivalent to T50 cm (1inch = 2.5cm) time for SCC as there exists an excellent relationship between the total cone spread time and T 25 cm (1inch = 2.5cm) time (R2= 0.997, Fig.10).
6. The viscosity of SCM systems for the used mix proportion remains almost the same within q=0.3-0.4(Fig. 8) thereby indicating the absence of segregation.
7. The strength graphs show that extreme fineness of sand M-q20 and M-q50 show least strengths. The rate of gain of flexural strength is of consequence during first seven days.
Application of Packing Concepts to High Performance SCM Systems 313

ACKNOWLEDGMENTSThe authors are thankful to Mr. Qamar uz Zaman, Master’s student at NICE (NUST) for
his help in applying modifications and corrections indicated by the authors and the referees in this paper.
REFERENCES1. Okamura, H., and Ouchi, M., “Self Compacting Concrete,” Journal of Advanced
Concrete Technology, V. 1, No. 1, April 2003, pp. 5-15.2. Rizwan, S. A.; Bier, T. A.; and Ahmad, H., “Self-Compacting Concrete- A Useful
Technology”, Pakistan Engineering Congress, 70th Annual Proceedings, Paper No 670, pp. 294-318
3. Andreassen, A.H.M. and Andersen, “Über die Beziehung zwischen Kornabstufung und Zwischenraum in Produkten aus los Körnern”, 1930, pp. 217-228
4. Funk, J. E., and Dinger, D. R., “Predictive Process Control of Crowded Particulate Suspensions: Applied to Ceramic Manufacturing” Boston, Kluwer Academic Publishers, 1994, pp. 75-84
5. Brouwers, H. J. H., and Radix, H. J., “Self-compacting concrete:Theoretical and experimental study,” C&CR, V. 35, 2005, pp. 2116-2136.
6. Rizwan, S., “A and Bier, T.A.,”Self-Consolidating Mortars Using Various Secondary Raw Materials,” ACI Materials Journal, V. 106, No. 1, January-February 2009, pp. 25-32.
7. Rizwan, S., “A and Bier, T.A.,”Blends of limestone powder and fly-ash enhance the response of self-compacting mortars,” Construction and Building Materials Journal, V. 27, 2012, pp. 398-403.
8. Bier, T. A., and Rizwan, S. A., “ Influence of Mineral and Organic Additives on Rheology and Workability of Concrete”, ”-.Proc. ACI/RILEM, CSCE and ACBM(USA) International Conference on Advanced Cement Based Materials (Editors:Syed Ali Rizwan & Abdul Ghaffar), Lahore, Pakistan, December, 12-14, 2007. Pp. 29-38.Vol 1 ISBN 978-969-546-015-3.
9. Rizwan, S., A and Bier, T.A, “Self-Compacting Paste Systems using Secondary Raw Materials”, Pakistan Journal of Engineering & Applied Sciences, Vol. 3, July 2008, pp. 1-7, ISSN: 1995-1302
10. Quiroga, P. N., and Fowler, D. W., “The Effects of Aggregates Characteristics on the Performance of Portland Cement Concrete”, ICAR Report 104-1F, August 20 A04, pp. 5-28
11. Furnas, C. C., “Grading Aggregates: Mathematical Relation for Beds of Broken Solids of Maximum Density,” Industrial & Engineering Chemistry, V. 23, No. 9, 1931, pp. 1052-1064.
12. Füller, W. B., and Thompson, S. E., “The Laws of Proportioning Concrete”, ASCE Journal of Transportation, 1907, pp. 223-298
13. ASTM C 33-03, “Standard Specification for Concrete Aggregates”, ASTM Stan-dards, American Society of Testing and Materials, 2003, pp. 1-11
14. Pade, C., “4C-Packing-User’s Manual”, Version 3.0, Danish Technological Institute, 2009, pp. 3-24
15. De Larrard, “MIXSIM-98”, User’s Manual, 1998, pp. 1-10
314 Rizwan et al.

16. Trygve Hanssen, “EMMA: Elkem Material Mix Analyzer”, Version 3.4.1, Help File, Available with installation files.
17. Goltermann, P.; Johansen, V.; and Palbol, L., ““Packing of Aggregates: An Alter-nate Tool to Determine the Optimal Aggregate Mix”, Title No. 94-M51,” ACI Materials Journal, 1997, pp. 435-443.
18. van Breugel, K. et al., “Hymostruc Model”, Delft University of Technology, Nether-land, Year 2010, Help File, Available with installation files
19. Kwan, A. K. H., and Mora, C. F., “Effects of Various Shape Parameters on Packing of Aggregate Particles,” Magazine of Concrete Research, V. 53, No. 2, April 2001, pp. 91-100.
20. Rizwan, S. A., “High Performance Mortars and Concretes using Secondary Raw Materials,” PhD Thesis Technical University Freiberg, Germany, Oct. 2006. ISBN 978-3-639-17878-4, VDM Verlag Dr.Muller, Germany), pp. 136.
Application of Packing Concepts to High Performance SCM Systems 315