Embed Size (px)
DESCRIPTION
Published: 1/2014 Any recollection of the performance of the Latin American economies during the so-called "Lost Decade" of the 1980s should suffice to convince us how much the region has progressed over the last two decades. Particularly during the last ten years the region has enjoyed, for the most part, financial and price stability, reasonable economic growth, a substantial reduction in poverty rates, and improvements in income distribution. As this report makes clear, however, it would be a terrible mistake for Latin American governments and societies to be complacent about the challenges in front of them. The report provides an excellent description of the challenges that will have to be overcome, but also rightly identifies the significant strengths that the Latin American economies already have. - Download Latin America: The Long Road (PDF): http://bit.ly/1j8jdcL - Order the print version of GLatin America: The Long Road: http://bit.ly/1e2QSxR Visit the Credit Suisse Research Institute website: http://bit.ly/18Cxa0p
Citation preview
Latin America: The long road
February 2014
Research InstituteThought leadership from Credit Suisse Research
and the world’s foremost experts

Contents03 Introduction
04 The 20-year view: Two decades
of progress
12 The next decade: Leaders and
laggards
20 The rise of the middle-income class
28 Mexico: Reforms and more reforms
31 Consumer trends and opportunities
36 Financial services: Opportunities
for “bancarization”
43 Energy – divergence and
convergence
51 Infrastructure: The Achilles’ heel
59 Imprint / Disclaimer
co
ve
Rp
ho
to:
isto
ck
ph
oto
.co
m/m
ax
fc,
ph
oto
: is
toc
kp
ho
to.c
om
/Ro
llin
ge
aR
th
For more information, please contact:
Richard kersley, head of global securities
products and themes, credit suisse
investment Banking,
michael o’sullivan, chief investment
officer, Uk & eemea, credit suisse
private Banking & Wealth management,
michael.o’[email protected]
latin ameRica_2
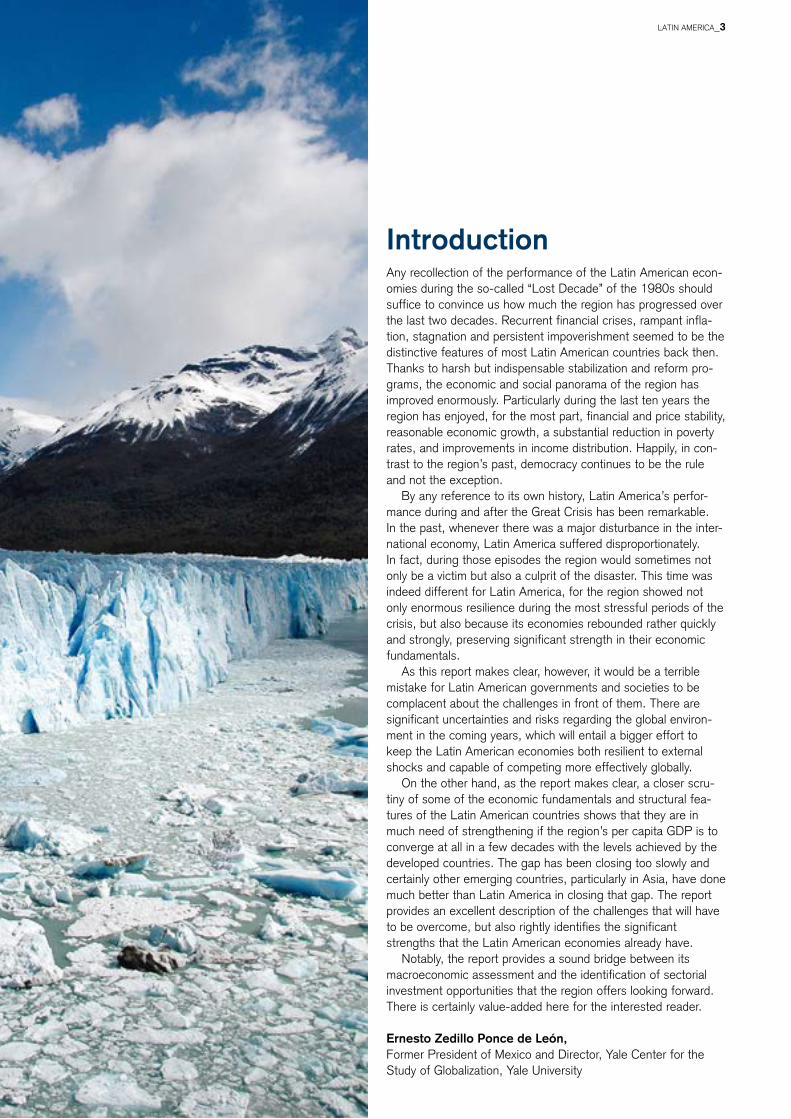
Introductionany recollection of the performance of the latin american econ-omies during the so-called “lost Decade” of the 1980s should suffice to convince us how much the region has progressed over the last two decades. Recurrent financial crises, rampant infla-tion, stagnation and persistent impoverishment seemed to be the distinctive features of most latin american countries back then. thanks to harsh but indispensable stabilization and reform pro-grams, the economic and social panorama of the region has improved enormously. particularly during the last ten years the region has enjoyed, for the most part, financial and price stability, reasonable economic growth, a substantial reduction in poverty rates, and improvements in income distribution. happily, in con-trast to the region’s past, democracy continues to be the rule and not the exception.
By any reference to its own history, latin america’s perfor-mance during and after the great crisis has been remarkable. in the past, whenever there was a major disturbance in the inter-national economy, latin america suffered disproportionately. in fact, during those episodes the region would sometimes not only be a victim but also a culprit of the disaster. this time was indeed different for latin america, for the region showed not only enormous resilience during the most stressful periods of the crisis, but also because its economies rebounded rather quickly and strongly, preserving significant strength in their economic fundamentals.
as this report makes clear, however, it would be a terrible mistake for latin american governments and societies to be complacent about the challenges in front of them. there are significant uncertainties and risks regarding the global environ-ment in the coming years, which will entail a bigger effort to keep the latin american economies both resilient to external shocks and capable of competing more effectively globally.
on the other hand, as the report makes clear, a closer scru-tiny of some of the economic fundamentals and structural fea-tures of the latin american countries shows that they are in much need of strengthening if the region’s per capita gDp is to converge at all in a few decades with the levels achieved by the developed countries. the gap has been closing too slowly and certainly other emerging countries, particularly in asia, have done much better than latin america in closing that gap. the report provides an excellent description of the challenges that will have to be overcome, but also rightly identifies the significant strengths that the latin american economies already have.
notably, the report provides a sound bridge between its macroeconomic assessment and the identification of sectorial investment opportunities that the region offers looking forward. there is certainly value-added here for the interested reader.
Ernesto Zedillo Ponce de León, former president of mexico and Director, Yale center for the study of globalization, Yale University
latin ameRica_3

Unprecedented economic progress of recent decades
taking a specific period to analyze markets, econo-mies or countries is always risky. Yet, when trying to understand the recent evolution of latin america, we feel that the last 20 years have been a crucial period as they represent the most radical change in the political, macro and social structures of latin america in the last two centuries.
throughout its history latin america has been subject to economic fluctuations primarily linked to commodity prices (figure 1). only in the early 1990s did the region begin gradually to modernize its domestic economy, and services became an increas-ingly important engine for growth. sounder macro policies, much-needed structural reforms, increased political stability, lower inflation (figure 2), a growing
The 20-year view: Two decades of progressover the last two decades, latin america has made significant progress in bridging the economic and social gap with more advanced economies. there has been significant improvement in living standards. 20 years ago, latin american countries were approximately somewhere in the middle on the United nations’ human Development index, whereas today the region is closer to the top quartile of countries in terms of development.
ph
oto
: is
toc
kp
ho
to.c
om
/gR
afi
ss
imo
Figure 1
Commodity prices and Latin America GDP since 1900source: a. maddison, s. pfaffenzeller, credit suisse
-2.5
-2.0
-1.5
-1.0
0
1.0
1.5
2.0
2.5
3.0
3.5
4.4
4.6
4.8
5.0
5.2
5.4
5.6
5.8
6.0 Price index (log scale) Standard deviations from trend
1900 1910 1920 1940 1950 1960 1970 1980 1990 2000 2010
Agricultural food commodity prices (deflated by US GDP deflator, l.h.s.)
Latin America GDP per capita (deviation from trend, r.h.s.)
1930
latin ameRica_4

latin ameRica_5
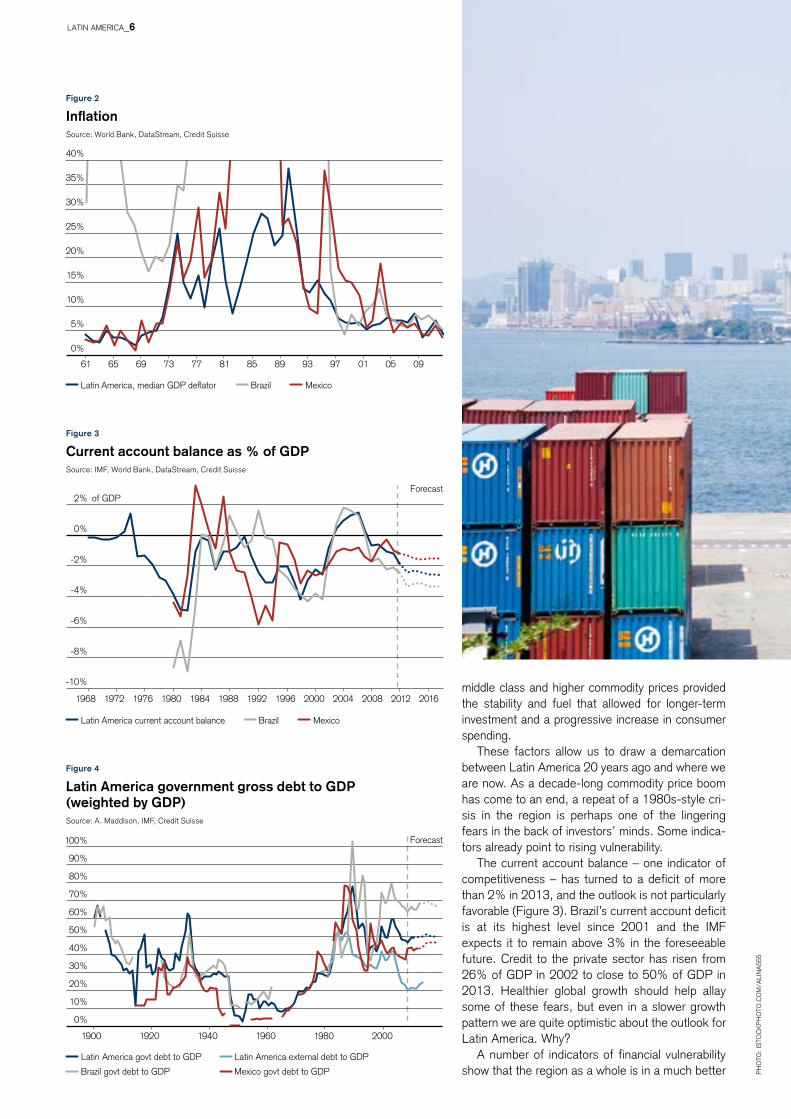
Figure 2
Inflationsource: World Bank, Datastream, credit suisse
Figure 3
Current account balance as % of GDPsource: imf, World Bank, Datastream, credit suisse
Figure 4
Latin America government gross debt to GDP (weighted by GDP)source: a. maddison, imf, credit suisse
middle class and higher commodity prices provided the stability and fuel that allowed for longer-term investment and a progressive increase in consumer spending.
these factors allow us to draw a demarcation between latin america 20 years ago and where we are now. as a decade-long commodity price boom has come to an end, a repeat of a 1980s-style cri-sis in the region is perhaps one of the lingering fears in the back of investors’ minds. some indica-tors already point to rising vulnerability.
the current account balance – one indicator of competitiveness – has turned to a deficit of more than 2% in 2013, and the outlook is not particularly favorable (figure 3). Brazil’s current account deficit is at its highest level since 2001 and the imf expects it to remain above 3% in the foreseeable future. credit to the private sector has risen from 26% of gDp in 2002 to close to 50% of gDp in 2013. healthier global growth should help allay some of these fears, but even in a slower growth pattern we are quite optimistic about the outlook for latin america. Why?
a number of indicators of financial vulnerability show that the region as a whole is in a much better
0%
5%
10%
15%
20%
25%
30%
35%
40%
61 65 69 73 77 85 89 93 97 01 05 09
Latin America, median GDP deflator Brazil Mexico
81
Latin America current account balance Brazil Mexico
1968 1972 1976 1980 1984 1988 1992 1996 2000 2004 2008 2012 2016
-10%
-8%
-6%
-4%
-2%
0%
2% of GDPForecast
0%
10%
20%
30%
40%
50%
60%
70%
80%
90%
100%
1900 1920 1940 1960 1980 2000
Latin America govt debt to GDP Latin America external debt to GDP
Brazil govt debt to GDP
Forecast
Mexico govt debt to GDP ph
oto
: is
toc
kp
ho
to.c
om
/ali
na
555
latin ameRica_6
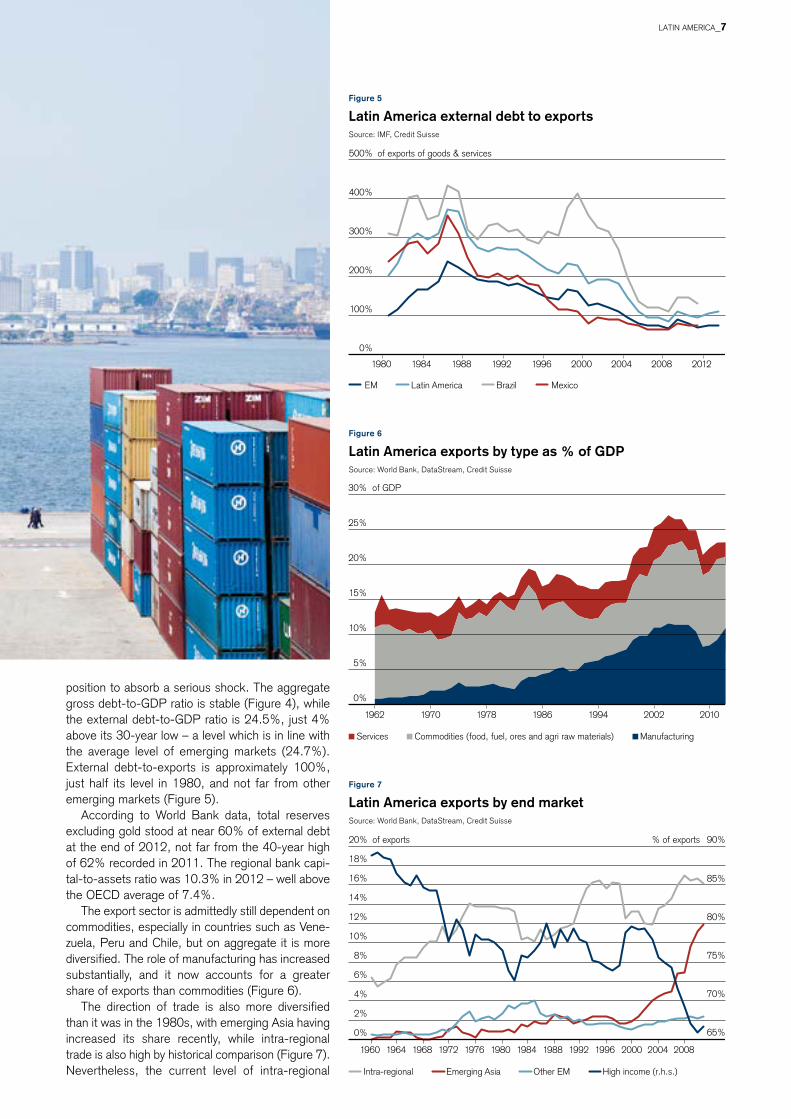
Figure 5
Latin America external debt to exportssource: imf, credit suisse
position to absorb a serious shock. the aggregate gross debt-to-gDp ratio is stable (figure 4), while the external debt-to-gDp ratio is 24.5%, just 4% above its 30-year low – a level which is in line with the average level of emerging markets (24.7%). external debt-to-exports is approximately 100%, just half its level in 1980, and not far from other emerging markets (figure 5).
according to World Bank data, total reserves excluding gold stood at near 60% of external debt at the end of 2012, not far from the 40-year high of 62% recorded in 2011. the regional bank capi-tal-to-assets ratio was 10.3% in 2012 – well above the oecD average of 7.4%.
the export sector is admittedly still dependent on commodities, especially in countries such as vene-zuela, peru and chile, but on aggregate it is more diversified. the role of manufacturing has increased substantially, and it now accounts for a greater share of exports than commodities (figure 6).
the direction of trade is also more diversified than it was in the 1980s, with emerging asia having increased its share recently, while intra-regional trade is also high by historical comparison (figure 7). nevertheless, the current level of intra-regional
Figure 6
Latin America exports by type as % of GDPsource: World Bank, Datastream, credit suisse
Figure 7
Latin America exports by end marketsource: World Bank, Datastream, credit suisse
EM Latin America Brazil Mexico
0%
100%
200%
300%
400%
500%
1980 1984 1988 1992 1996 2000 2004 2008 2012
of exports of goods & services
0%
5%
10%
15%
20%
25%
30%
1962 1970 1978 1986 1994 2002 2010
Commodities (food, fuel, ores and agri raw materials)
of GDP
ManufacturingServices
65%
70%
75%
80%
85%
90%
0%
2%
4%
6%
8%
10%
12%
14%
16%
18%
20%
1960 1964 1968 1972 1976 1980 1984 1988 1992 1996 2000 2004 2008
Intra-regional Emerging Asia Other EM High income (r.h.s.)
of exports % of exports
latin ameRica_7
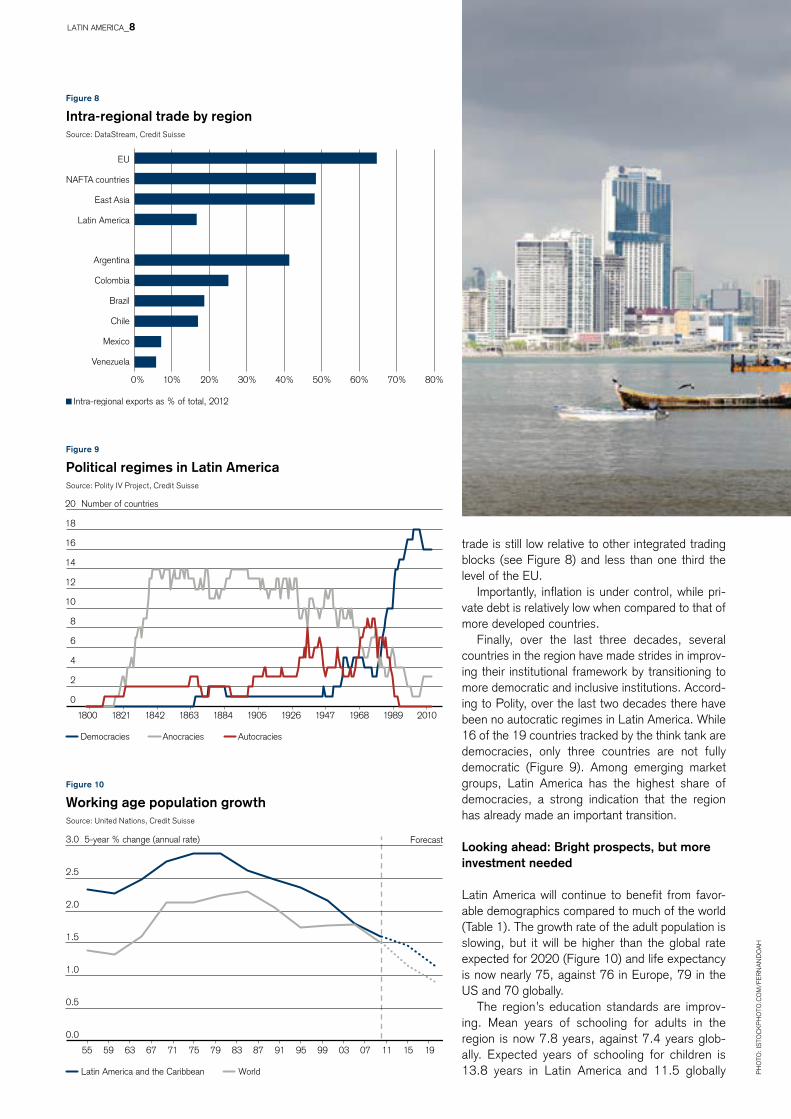
Figure 8
Intra-regional trade by regionsource: Datastream, credit suisse
Figure 9
Political regimes in Latin Americasource: polity iv project, credit suisse
Figure 10
Working age population growthsource: United nations, credit suisse
trade is still low relative to other integrated trading blocks (see figure 8) and less than one third the level of the eU.
importantly, inflation is under control, while pri-vate debt is relatively low when compared to that of more developed countries.
finally, over the last three decades, several countries in the region have made strides in improv-ing their institutional framework by transitioning to more democratic and inclusive institutions. accord-ing to polity, over the last two decades there have been no autocratic regimes in latin america. While 16 of the 19 countries tracked by the think tank are democracies, only three countries are not fully democratic (figure 9). among emerging market groups, latin america has the highest share of democracies, a strong indication that the region has already made an important transition.
Looking ahead: Bright prospects, but more investment needed
latin america will continue to benefit from favor-able demographics compared to much of the world (table 1). the growth rate of the adult population is slowing, but it will be higher than the global rate expected for 2020 (figure 10) and life expectancy is now nearly 75, against 76 in europe, 79 in the Us and 70 globally.
the region’s education standards are improv-ing. mean years of schooling for adults in the region is now 7.8 years, against 7.4 years glob-ally. expected years of schooling for children is 13.8 years in latin america and 11.5 globally
0% 10% 20% 30% 40% 50% 60% 70% 80%
EU
NAFTA countries
East Asia
Latin America
Argentina
Colombia
Brazil
Chile
Mexico
Venezuela
Intra-regional exports as % of total, 2012
Democracies Anocracies Autocracies
0
2
4
6
8
10
12
14
16
18
20
1800 1821 1842 1863 1884 1905 1926 1947 1968 1989 2010
Number of countries
Latin America and the Caribbean
0.0
0.5
1.0
1.5
2.0
2.5
3.0
55 59 63 67 71 75 79 83 87 91 95 99 03 07 11 15 19
World
5-year % change (annual rate) Forecast
ph
oto
: is
toc
kp
ho
to.c
om
/fe
Rn
an
Do
ah
latin ameRica_8

Table 1
Latin America demographic indicatorssource: Un, credit suisse Demographics Research
Population (m)
argentina Brazil chile colombia mexico venezuela World more developed regions
less developed regions
1995 34.86 161.85 14.41 36.45 92.27 22.03 5,741.82 1,173.48 4,568.34
2010 40.41 194.95 17.11 46.29 113.42 28.98 6,916.18 1,240.93 5,675.25
Population growth rate
argentina Brazil chile colombia mexico venezuela World more developed regions
less developed regions
1995–2000 1.16% 1.50% 1.36% 1.74% 1.60% 2.00% 1.30% 0.34% 1.54%
2010–2015 0.85% 0.84% 0.86% 1.28% 1.14% 1.49% 1.15% 0.30% 1.33%
Total fertility rate (children per woman)
argentina Brazil chile colombia mexico venezuela World more developed regions
less developed regions
1995–2000 2.63 2.45 2.21 2.75 2.67 2.94 2.73 1.56 2.99
2010–2015 2.17 1.80 1.83 2.29 2.23 2.39 2.50 1.68 2.63
Life expectancy at birth (years)
argentina Brazil chile colombia mexico venezuela World more developed regions
less developed regions
1995–2000 73.2 69.3 75.9 70.3 73.7 72.1 65.6 74.7 63.7
2010–2015 76.1 74.0 79.3 74.0 77.2 74.7 70.0 77.7 68.3
Old-age dependency ratio (ratio of population aged 65+ per 100 population 15–64)
argentina Brazil chile colombia mexico venezuela World more developed regions
less developed regions
1995 15.40 8.02 10.41 7.39 8.05 6.90 10.65 20.35 7.89
2010 16.40 10.37 13.49 8.56 9.84 8.63 11.68 23.81 8.93
latin ameRica_9

latin ameRica_10

Figure 12
Savings and investment rates by region (2012)source: World Bank, Datastream, credit suisse
Figure 13
Consumption* versus investment share of GDP (2013, %)*private and government sector combined; source: imf, credit suisse
Figure 11
Years of schoolingsource: World Bank, credit suisse
(figure 11). as a result, the prospects for human capital are fairly positive, especially given the region’s relatively young population and low unem-ployment rate. it is still well below the investment that countries like korea or taiwan made in edu-cation, but the trend is positive. Brazil and mexico are the countries where more investment is needed in this area.
Despite the significant progress made over the last 20 years in many key areas, several chal-lenges remain. latin america has grown at an annual pace of 3.1% since 1990, but productivity growth has disappointed. When measured against other regions in the two decades after 1990, the conference Board finds that average total factor productivity in latin america has been almost stagnant, compared to very high growth in emerg-ing asia. this is also reflected in the region’s poor scores in technological innovation. the ratio of patents filed per million inhabitants was 7.1 in 2010, against 155 in emerging east asia and 638 in the oecD. Research and development expendi-ture was only 0.8% of gDp in 2009, against 1.5% in emerging asia and 2.5% in the oecD.
there is some evidence that the region is mov-ing into higher value added sectors. it is indicative that the dollar value of high technology exports has increased at a rate of 12% p.a. since 1994, although it is still at low levels (10% of manufactur-ing exports against 27% in emerging east asia and 16.8% in the oecD).
savings and investment ratios are below other emerging markets (figure 12), translating into lower growth of the capital stock. the relatively high share of consumption and low share of invest-ment to gDp is in strong contrast to higher growth asian economies (figure 13). investment-to-gDp ratios close to 30% rather than the current 20% would be needed to ensure above-average long term growth. this explains in part why total factor productivity growth has been so low (wage increases are the other reason), and suggests that if investment and innovation continue to be low, there is little scope for the region to close the gap and grow at a faster pace. government policy should therefore directly target these areas.
the legal frameworks need to improve too. currently, the region is approximately in the middle of the World Bank’s “ease of doing business” scorecard. there is evidence that significant prog-ress has been made over the last decade. for example the time required to start a business has fallen to 35 days in 2013, from nearly 74 days in 2003. as a comparison, the equivalent figure is 11 days in the oecD and 40 days in emerging asia. there is a lot of scope in areas such as jus-tice, where the time required to enforce a contract has risen from 710 days in 2003 to 726 days in 2013, against 517 days in the oecD. in order to close the productivity gap with advanced econo-mies, this is another area on which the public sec-tor needs to focus.
Mean years of schooling
0 2 4 6 8 10 12 14 16 18 20
North America
Europe
Latin America
Asia-Pacific
Chile
Argentina
Mexico
Venezuela
Colombia
Brazil
Expected years of schooling
Years
16.2
28.5
23.6
24.1
22.9
24.4
17.2
20.9
30.7
18.1
20.3
20.7
21.8
23.6
24.1
17.8
20.2
30.0
10% 15% 20% 25% 30% 35%
Brazil
Venezuela
Mexico
Argentina
Colombia*
Chile
OECD (high income)*
Latin America
EMs
Gross fixed asset investment Gross domestic savings *Data refers to 2011
% of GDP
Brazil
Mexico
Russia
India
China
Turkey
South Africa
Poland
Indonesia
Korea
Taiwan
Thailand
5%
10%
15%
20%
25%
30%
35%
40%
45%
50%
40% 50% 60% 70% 80% 90%
Investment share of GDP
Consumption share of GDP
Asia EMEA &Latin America
ph
oto
: is
toc
kp
ho
to.c
om
/ap
om
aR
es
latin ameRica_11

The next decade: Leaders and laggardsanalyzing structural changes in latin america and how each country stands relative to the developed world, reveals each country’s potential growth and allows us to identify the sectors that are likely to offer the greatest opportunities. key areas for our analysis of the long term outlook for the region are demographics, infrastructure, intangible infrastructure and macro conditions (particularly public finances).
ph
oto
: is
toc
kp
ho
to.c
om
/co
tes
eB
as
tie
n
latin ameRica_12

latin ameRica_13

Figure 1
Fertility rate by countrysource: Un, credit suisse
Figure 2
Life expectancy at birthsource: Un, credit suisse
Demographics
latin american economies generally have favorable demographics relative to global standards. the fer-tility rate has been on a declining trend over the last few decades, and has now fallen below the world average, but still stands well above the rate of developed economies and the replacement rate of 2.1. there are large variations within the region. Brazil, the most populous country, and wealthy countries such as chile, Uruguay and argentina, have fertility rates below the replacement rate (figure 1). mexico on the other hand has a fertility rate above the regional weighted average, but still trails the global fertility rate. the remaining smaller economies in the region have generally higher fer-tility rates.
Despite declining fertility rates, several econo-mies enjoy relatively low dependency rates (i.e. population outside the working age relative to total population). in addition, life expectancy has improved substantially over the years, from approximately 51 years in 1950 to 73 years in 2010 (figure 2). the vast majority of countries have life expectancy rates above the world aver-age, while chile and costa Rica exceed the devel-oped market average of 76.9 years. countries with high fertility rates are expected to show stronger growth in basic staples consumption. in contrast, countries with low fertility rates and higher dependency rates will see healthcare expenditure grow at a faster relative rate.
our global demographics scorecard combines three key demographics variables: fertility rates, life expectancy at birth and old-age dependency (table 1). Demographic conditions in latin amer-ica are in line with other emerging economies but much better than high-income economies. it is worth mentioning that demographic indicators in Brazil have dropped over the last few years, so the country has one of the lowest scores in the region.
Employment
favorable demographics can be a strong contribu-tor to future economic growth, but an expanding labor force can create social instability if the labor market is not able to absorb the new workers. one of the reasons often mentioned for the uprisings in the arab world was the high rate of youth unem-ployment. Data from the international labor orga-nization indicates that most economies in the region had a youth unemployment rate that was well below the global rate in 2010 (figure 3). among the economies with the highest incidence of youth unemployment are colombia and argentina. Brazil and chile, two countries that have seen protests recently, have youth unemployment rates that are below the world average.
We have constructed an employment outlook scorecard (table 2) that depends on two compo-nents: the “misery index” and economic vulnerabil-
Country Region
1.5 2.0 2.5 3.0 3.5 4.0 4.5
Guatemala Bolivia
Honduras Paraguay
Belize Nicaragua
Ecuador Panama
Peru Venezuela
World Colombia Suriname
Mexico El Salvador
Latin America Argentina Uruguay
Costa Rica Brazil Chile
Developed countries Latin America
1950 1955 1960 1965 1970 1975 1980 1985 1990 1995 2000 2005 2010
50
55
60
65
70
75
80 Years
latin ameRica_14

Country Fertility rate, total
Life expectancy at birth
Age depen-dency ratio (old population)
Demo-graphics *
honduras 65.2% 51.7% 58.4% 73.1%
guatemala 73.9% 48.4% 51.1% 71.8%
nicaragua 55.8% 59.1% 55.8% 67.7%
panama 53.7% 78.6% 38.3% 67.1%
ecuador 57.1% 71.2% 41.0% 65.1%
mexico 45.0% 77.9% 43.7% 63.0%
paraguay 63.1% 49.7% 48.4% 59.0%
venezuela 49.7% 61.8% 46.4% 57.0%
peru 51.7% 60.5% 43.0% 55.7%
Bolivia 69.2% 33.6% 51.7% 54.3%
Latin America 49.6% 62.4% 42.4% 52.9%
Low and middle-income economies
56.4% 40.3% 56.5% 52.9%
costa Rica 28.2% 82.6% 41.7% 52.3%
colombia 46.4% 55.1% 47.0% 48.9%
chile 30.9% 81.9% 31.6% 42.9%
argentina 43.0% 70.5% 28.2% 40.9%
High-income economies
24.8% 89.1% 24.4% 37.8%
Uruguay 39.6% 75.9% 16.8% 30.8%
el salvador 43.7% 49.0% 37.6% 28.1%
Brazil 27.6% 53.1% 39.6% 22.1%
Table 1
Demographics scorecardsource: World Bank, Datastream, credit suisse
Figure 3
Youth unemployment, 2010 / 2009source: ilo, credit suisse
ity. the misery index was devised by the economist arthur okun and exists in several permutations. While the economic cycle has a strong influence on score, there are also structural issues behind each component of the index.
We find that there are big disparities within latin america. venezuela and argentina score in the bot-tom 30% of the countries on our misery index scorecard, as they suffer from low growth, high inflation and high unemployment. panama, chile, peru and el salvador are among the top 30% of economies globally on this score, enjoying a good combination of high rates of gDp growth, and rela-tively low unemployment and inflation. among large economies, Brazil has a fairly low score, while mex-ico scores well above the global average.
Infrastructure
the level and quality of a country’s infrastructure is a key to enabling economic activity and meeting basic needs, from sanitation to access to electricity and transportation. infrastructure requirements have evolved over time, and are now extending to infor-mation technology and internet access which are essential for enabling growth in the new world econ-omy. our infrastructure scorecard employs nine vari-ables grouped into two categories: utilities and transportation (table 3). the utilities index includes variables such as number of internet users, electric power consumption and also access to water and sanitation. the transportation index includes vari-ables such as air transportation, road density, port infrastructure and the World Bank’s logistics perfor-mance index. the overall infrastructure of the region is in line with the global average, and much better than middle and low-income countries, although it trails the score of high income economies. among the largest countries, mexico needs to invest more in utilities and services and Brazil in transportation logistics. however, when measured against gDp per capita, the quality of infrastructure is relatively low, and there is a lot of room for improvement.
interestingly, electricity consumption per capita is one area where every country in the region is in rela-tive deficit. access to telecommunications is rela-tively good in the region, with most countries above or near the levels warranted by income. in transpor-tation infrastructure the divergence is even greater, with some large economies, including Brazil, colom-bia, venezuela and peru showing a large gap versus developed economies (figure 4). port infrastructure is very poor in many countries, while the road net-works and airport scores are more consistent. this is key to assessing the potential for future growth in manufacturing and commodity exports.
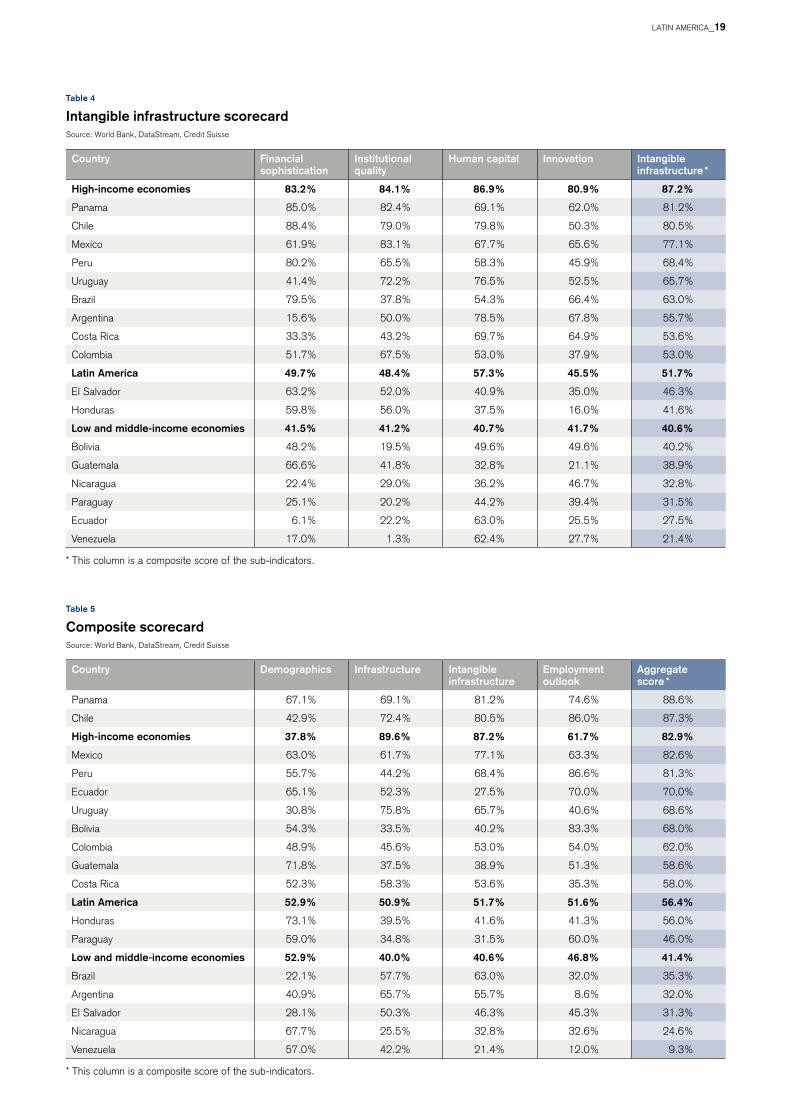
Intangible infrastructure
We define intangible infrastructure as the set of fac-tors that develop human capability and permit the easy and efficient growth of business activity.
Youth unemployment rate Group median
0% 5% 10% 15% 20% 25% 30% 35% 40%
Honduras
Mexico
Ecuador
Paraguay
El Salvador
Panama
Costa Rica
Latin America
Venezuela
Brazil
Chile
World
Uruguay
Argentina
Colombia
Belize
* this column is a composite score of the sub-indicators.
latin ameRica_15
Latin America Misery index Economic vulnerability
Employment outlook *
peru 76.0% 80.6% 86.6%
chile 79.3% 76.6% 86.0%
Bolivia 64.0% 86.0% 83.3%
panama 87.3% 49.3% 74.6%
ecuador 67.3% 59.3% 70.0%
mexico 65.3% 51.3% 63.3%
High-income economies 57.3% 61.0% 61.7%
paraguay 38.6% 74.6% 60.0%
colombia 47.3% 61.3% 54.0%
Latin America 54.7% 47.9% 51.6%
guatemala 46.6% 56.0% 51.3%
Low and middle-income economies
48.0% 47.1% 46.8%
el salvador 74.0% 22.6% 45.3%
honduras 63.3% 25.3% 41.3%
Uruguay 40.6% 45.3% 40.6%
costa Rica 51.3% 30.6% 35.3%
nicaragua 52.6% 24.6% 32.6%
Brazil 36.6% 40.0% 32.0%
venezuela 24.6% 13.3% 12.0%
argentina 14.6% 18.0% 8.6%
Country Utilities Transportation Infrastructure *
High-income economies 90.0% 88.1% 89.6%
Uruguay 74.4% 74.3% 75.8%
chile 71.1% 68.2% 72.4%
panama 52.3% 81.7% 69.1%
argentina 70.4% 58.7% 65.7%
mexico 53.6% 65.5% 61.7%
costa Rica 59.7% 52.0% 58.3%
Brazil 59.0% 50.6% 57.7%
ecuador 47.6% 56.0% 52.3%
Latin America 51.3% 49.0% 50.9%
el salvador 42.9% 58.1% 50.3%
colombia 48.9% 45.9% 45.6%
peru 43.6% 45.2% 44.2%
venezuela 63.0% 24.3% 42.2%
Low and middle-income economies
39.9% 40.3% 40.0%
honduras 38.9% 41.8% 39.5%
guatemala 41.6% 33.7% 37.5%
paraguay 38.2% 29.0% 34.8%
Bolivia 35.5% 27.0% 33.5%
nicaragua 32.2% 20.9% 25.5%
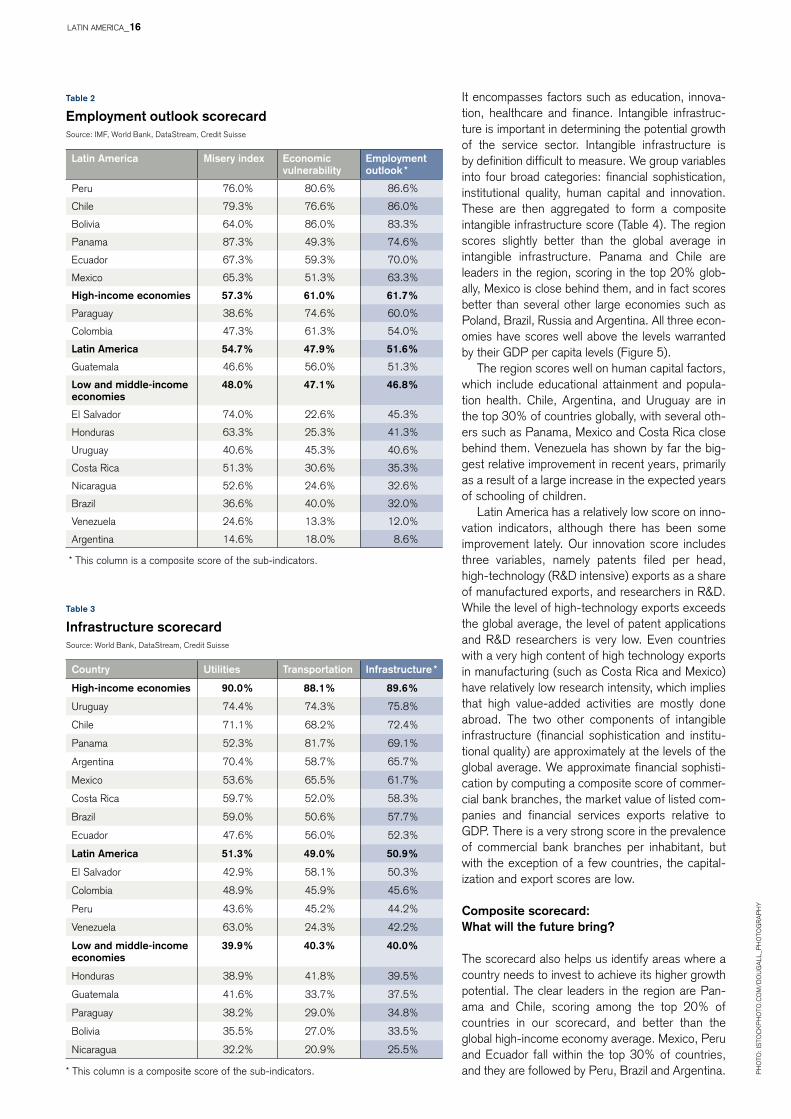
Table 2
Employment outlook scorecard source: imf, World Bank, Datastream, credit suisse
Table 3
Infrastructure scorecardsource: World Bank, Datastream, credit suisse
it encompasses factors such as education, innova-tion, healthcare and finance. intangible infrastruc-ture is important in determining the potential growth of the service sector. intangible infrastructure is by definition difficult to measure. We group variables into four broad categories: financial sophistication, institutional quality, human capital and innovation. these are then aggregated to form a composite intangible infrastructure score (table 4). the region scores slightly better than the global average in intangible infrastructure. panama and chile are leaders in the region, scoring in the top 20% glob-ally, mexico is close behind them, and in fact scores better than several other large economies such as poland, Brazil, Russia and argentina. all three econ-omies have scores well above the levels warranted by their gDp per capita levels (figure 5).
the region scores well on human capital factors, which include educational attainment and popula-tion health. chile, argentina, and Uruguay are in the top 30% of countries globally, with several oth-ers such as panama, mexico and costa Rica close behind them. venezuela has shown by far the big-gest relative improvement in recent years, primarily as a result of a large increase in the expected years of schooling of children.
latin america has a relatively low score on inno-vation indicators, although there has been some improvement lately. our innovation score includes three variables, namely patents filed per head, high-technology (R&D intensive) exports as a share of manufactured exports, and researchers in R&D. While the level of high-technology exports exceeds the global average, the level of patent applications and R&D researchers is very low. even countries with a very high content of high technology exports in manufacturing (such as costa Rica and mexico) have relatively low research intensity, which implies that high value-added activities are mostly done abroad. the two other components of intangible infrastructure (financial sophistication and institu-tional quality) are approximately at the levels of the global average. We approximate financial sophisti-cation by computing a composite score of commer-cial bank branches, the market value of listed com-panies and financial services exports relative to gDp. there is a very strong score in the prevalence of commercial bank branches per inhabitant, but with the exception of a few countries, the capital-ization and export scores are low.
Composite scorecard: What will the future bring?
the scorecard also helps us identify areas where a country needs to invest to achieve its higher growth potential. the clear leaders in the region are pan-ama and chile, scoring among the top 20% of countries in our scorecard, and better than the global high-income economy average. mexico, peru and ecuador fall within the top 30% of countries, and they are followed by peru, Brazil and argentina.
* this column is a composite score of the sub-indicators.
* this column is a composite score of the sub-indicators. ph
oto
: is
toc
kp
ho
to.c
om
/Do
Ug
all
_ph
oto
gR
ap
hY
latin ameRica_16

latin ameRica_17

venezuela, despite its natural resource wealth and high gDp per capita, is a laggard in many respects and falls within the lowest decile of countries.
While gDp growth is determined by several factors, we have tested whether our scorecards contain predictive power. We have reconstructed our global scorecards for the year 2006 (albeit with less data due to poorer availability) and esti-mated the relationship of the 2006 score with real gDp per capita growth until 2012, controlling for the relative level of gDp per capita. We find that there is a strong positive relationship between the composite score and subsequent real gDp per capita growth.
assuming this relationship will continue to hold, we have used the 2012 composite score and the current relative gDp-per-capita levels to estimate the future growth rate relative to the global aver-age. some of the smaller economies, such as Bolivia, panama and ecuador may well surprise significantly to the upside. at the other end, we find venezuela a country that might see growth in the next few years significantly undershoot.
While argentina has potential as a result of good intangible and tangible infrastructure, its aggregate score is particularly low as a result of the dire eco-nomic conditions that currently prevail. the situa-tion has deteriorated further in recent times, with international reserves falling further in 2013.
Brazil also has a relatively low aggregate score but for different reasons. the country suffers from worsening demographic conditions which limit its growth prospects. in addition, it has an infrastructure deficit that needs to be bridged to ensure strong productivity growth. there has already been strong improvement in the employment outlook score in recent years, and this will likely continue in the com-ing years, as the economy expands. nevertheless, the employment score is still low relative to the country’s potential. policy makers need to do more to support productivity growth and competitiveness.
among other economies, mexico, chile and peru could exceed the global average growth level. mexico in particular receives consistently high scores across all factors and as a result it is well positioned to see a pick up in growth in the coming years. this will likely be supported by the imple-mentation of the structural reforms recently approved, as well as higher growth in the Usa.
chile and peru are among the most successful economies in the region, enjoying a strong growth potential. peru scores relatively poorly in infra-structure but is still among the top 20% of econo-mies globally. this is underpinned by a very favor-able employment outlook – an area where the economy enjoys the highest score in the region. Demographics in chile are relatively unfavorable compared to other economies in the region, pri-marily due to an aging population and a low fertility rate. Yet, the economy scores better than several high-income economies, and could enjoy high growth rates for more years to come.
Figure 5
Intangible infrastructure and GDP per capitasource: World Bank, Datastream, credit suisse
Argentina Costa Rica
Brazil
Chile
Colombia El Salvador
GuatemalaParaguay
Ecuador
Honduras Bolivia
Mexico
Nicaragua
Panama
Peru Uruguay
Venezuela EM
DM
0.0
0.1
0.2
0.3
0.4
0.5
0.6
0.7
0.8
0.9
1.0
100 1,000 10,000 100,000
Intangible infrastructure score
GDP per capita, 2012
Figure 4
Transportation infrastructure score and GDP per capitasource: World Bank, Datastream, credit suisse
Argentina
Bolivia
Brazil
Chile
Colombia
Ecuador El Salvador
Mexico
Panama
Paraguay
Peru
Uruguay
Venezuela
EM
DM
200 2,000 20,000
0.0
0.1
0.2
0.3
0.4
0.5
0.6
0.7
0.8
0.9
1.0 Transportation infrastructure score
GDP per capita, USD
Honduras
Nicaragua
Guatemala
Costa Rica
latin ameRica_18
Country Financial sophistication
Institutional quality
Human capital Innovation Intangible infrastructure *
High-income economies 83.2% 84.1% 86.9% 80.9% 87.2%
panama 85.0% 82.4% 69.1% 62.0% 81.2%
chile 88.4% 79.0% 79.8% 50.3% 80.5%
mexico 61.9% 83.1% 67.7% 65.6% 77.1%
peru 80.2% 65.5% 58.3% 45.9% 68.4%
Uruguay 41.4% 72.2% 76.5% 52.5% 65.7%
Brazil 79.5% 37.8% 54.3% 66.4% 63.0%
argentina 15.6% 50.0% 78.5% 67.8% 55.7%
costa Rica 33.3% 43.2% 69.7% 64.9% 53.6%
colombia 51.7% 67.5% 53.0% 37.9% 53.0%
Latin America 49.7% 48.4% 57.3% 45.5% 51.7%
el salvador 63.2% 52.0% 40.9% 35.0% 46.3%
honduras 59.8% 56.0% 37.5% 16.0% 41.6%
Low and middle-income economies 41.5% 41.2% 40.7% 41.7% 40.6%
Bolivia 48.2% 19.5% 49.6% 49.6% 40.2%
guatemala 66.6% 41.8% 32.8% 21.1% 38.9%
nicaragua 22.4% 29.0% 36.2% 46.7% 32.8%
paraguay 25.1% 20.2% 44.2% 39.4% 31.5%
ecuador 6.1% 22.2% 63.0% 25.5% 27.5%
venezuela 17.0% 1.3% 62.4% 27.7% 21.4%
Table 4
Intangible infrastructure scorecardsource: World Bank, Datastream, credit suisse
Country Demographics Infrastructure Intangible infrastructure
Employment outlook
Aggregate score *
panama 67.1% 69.1% 81.2% 74.6% 88.6%
chile 42.9% 72.4% 80.5% 86.0% 87.3%
High-income economies 37.8% 89.6% 87.2% 61.7% 82.9%
mexico 63.0% 61.7% 77.1% 63.3% 82.6%
peru 55.7% 44.2% 68.4% 86.6% 81.3%
ecuador 65.1% 52.3% 27.5% 70.0% 70.0%
Uruguay 30.8% 75.8% 65.7% 40.6% 68.6%
Bolivia 54.3% 33.5% 40.2% 83.3% 68.0%
colombia 48.9% 45.6% 53.0% 54.0% 62.0%
guatemala 71.8% 37.5% 38.9% 51.3% 58.6%
costa Rica 52.3% 58.3% 53.6% 35.3% 58.0%
Latin America 52.9% 50.9% 51.7% 51.6% 56.4%
honduras 73.1% 39.5% 41.6% 41.3% 56.0%
paraguay 59.0% 34.8% 31.5% 60.0% 46.0%
Low and middle-income economies 52.9% 40.0% 40.6% 46.8% 41.4%
Brazil 22.1% 57.7% 63.0% 32.0% 35.3%
argentina 40.9% 65.7% 55.7% 8.6% 32.0%
el salvador 28.1% 50.3% 46.3% 45.3% 31.3%
nicaragua 67.7% 25.5% 32.8% 32.6% 24.6%
venezuela 57.0% 42.2% 21.4% 12.0% 9.3%
Table 5
Composite scorecardsource: World Bank, Datastream, credit suisse
* this column is a composite score of the sub-indicators.
* this column is a composite score of the sub-indicators.
latin ameRica_19
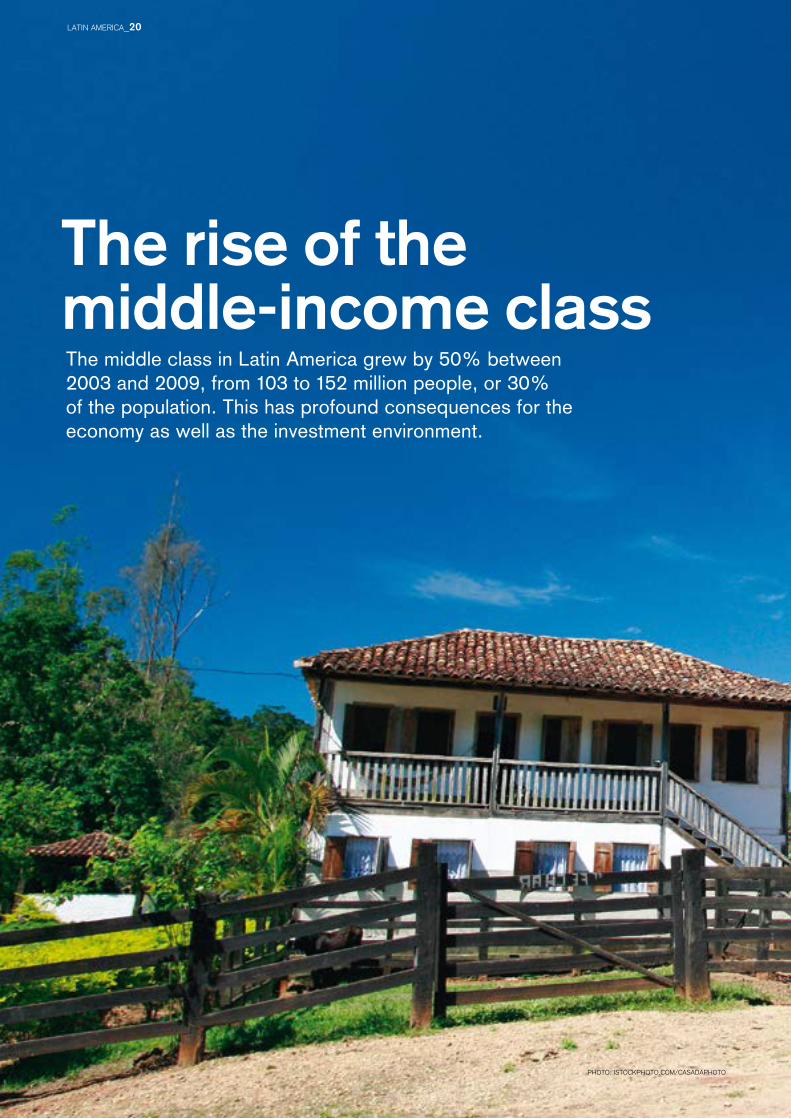
The rise of the middle-income class The middle class in Latin America grew by 50% between 2003 and 2009, from 103 to 152 million people, or 30% of the population. This has profound consequences for the economy as well as the investment environment.
photo: istockphoto.com/casaDaphoto
latin ameRica_20

latin ameRica_21

Figure 1
Middle-income class in Latin America is expected to become the majority of the population in the next few decadessource: Bussolo and murad 2011, World Bank
Figure 2
Latin America will be the second-largest contributor globally to growth in the middle-income classinhabitants (in millions) in the middle-income group; source: Bussolo and murad 2011, World Bank
Figure 3
Average annual per capita GDP growth, 2000–2010gDp growth adjusted for purchasing power parity; source: World Bank, credit suisse estimates
in the last decade the growth in the middle class in the region has been a key engine of economic growth. Yet, there has been significant variance in the performance of the different countries. Brazil has had a remarkable performance with the middle income class growing from 39% of total population to 50% of total over the last decade (figure 5). meanwhile, countries such as mexico continue to have surprisingly low social mobility and depressed consumer credit penetration (figure 6). We believe both of these conditions might be set for structural improvement during the coming years, as a result of the landmark reform agenda put in place by the new administration in mexico.
according to the study “economic mobility and the Rise of the latin american middle class” by the international Bank for Reconstruction and Development / the World Bank, which was pub-lished in 2013, the middle income class will repre-sent 42% of the latin american population by 2030 versus 29% in 2009. the middle income class is defined as the group of people who earn from UsD 10 to UsD 50 per day, adjusted for pur-chasing power parity.
Brazil’s booming middle-income class
the growth of Brazil’s expanding middle class is especially noteworthy because of the country’s rel-evance for the region and possible lessons for other countries. Brazil has promoted policies which have stimulated a migration of individuals from the D and e income classes to the a, B, and c classes. for example, the number of individuals belonging
2005 2030
50%
40%
30%
20%
10%
0%
Poor(USD 0–4 a day)
Vulnerable (USD 4 –10 a day)
Middle class(USD 10–50 a day)
Percentage of population
2005 2030
0
200
400
600
800
1,000
1,200
1,400
1,600
1,800
2,000
Central Asia & Eastern Europe
China
East Asia
Latin America& the Caribbean
North Africa South Asia Sub-Saharan Africa
5% 4% 3% 2% 1% 0%
Peru
Argentina
Ecuador
Chile
Colombia
Brazil
Uruguay
Latin America average
Venezuela
Mexico
ph
oto
: is
toc
kp
ho
to.c
om
/ma
om
eji
a
latin ameRica_22
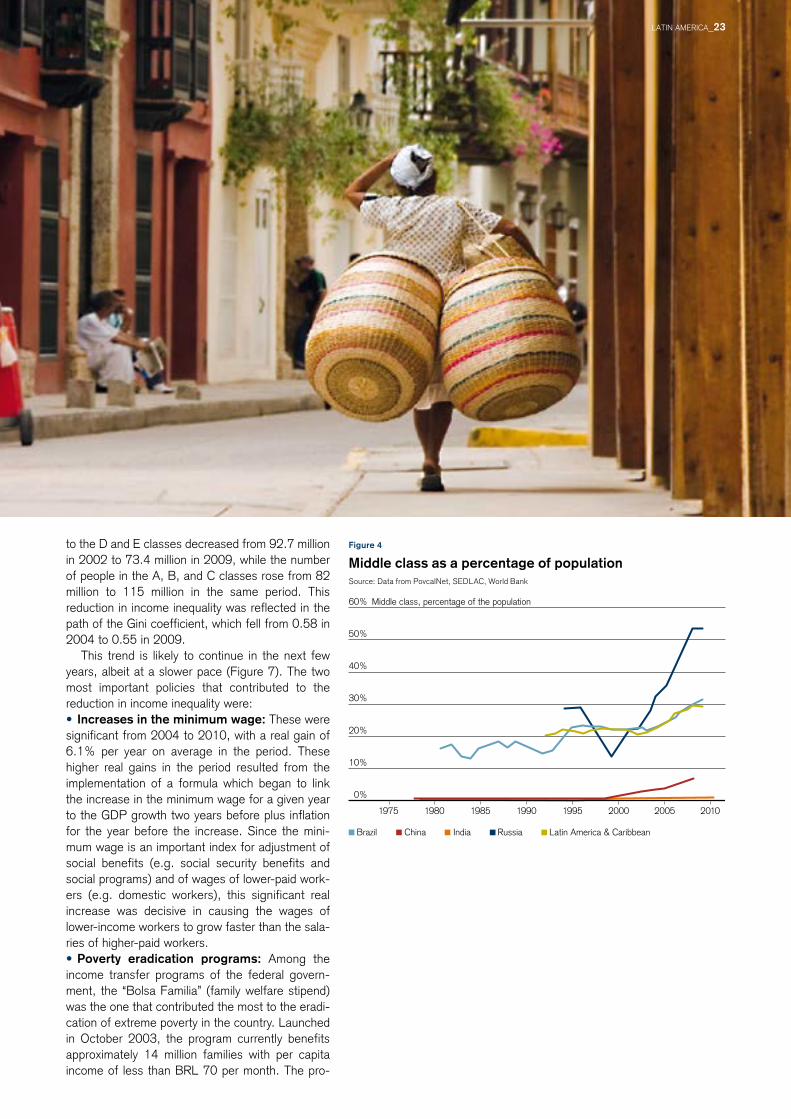
Figure 4
Middle class as a percentage of populationsource: Data from povcalnet, seDlac, World Bank
to the D and e classes decreased from 92.7 million in 2002 to 73.4 million in 2009, while the number of people in the a, B, and c classes rose from 82 million to 115 million in the same period. this reduction in income inequality was reflected in the path of the gini coefficient, which fell from 0.58 in 2004 to 0.55 in 2009.
this trend is likely to continue in the next few years, albeit at a slower pace (figure 7). the two most important policies that contributed to the reduction in income inequality were: • Increases in the minimum wage: these were
significant from 2004 to 2010, with a real gain of 6.1% per year on average in the period. these higher real gains in the period resulted from the implementation of a formula which began to link the increase in the minimum wage for a given year to the gDp growth two years before plus inflation for the year before the increase. since the mini-mum wage is an important index for adjustment of social benefits (e.g. social security benefits and social programs) and of wages of lower-paid work-ers (e.g. domestic workers), this significant real increase was decisive in causing the wages of lower-income workers to grow faster than the sala-ries of higher-paid workers. • Poverty eradication programs: among the
income transfer programs of the federal govern-ment, the “Bolsa familia” (family welfare stipend) was the one that contributed the most to the eradi-cation of extreme poverty in the country. launched in october 2003, the program currently benefits approximately 14 million families with per capita income of less than BRl 70 per month. the pro-
China RussiaBrazil India Latin America & Caribbean
1975 1980 1985 1990 1995 2000 2005 2010
0%
10%
20%
30%
40%
50%
60% Middle class, percentage of the population
latin ameRica_23
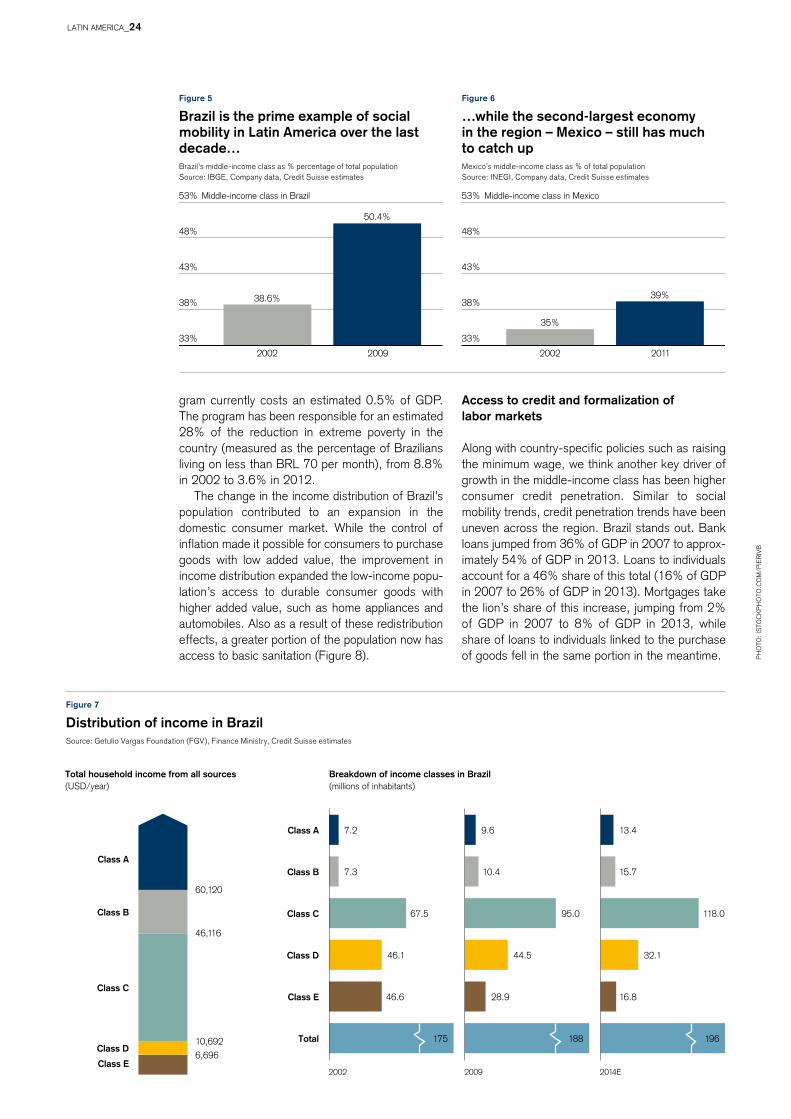
Figure 7
Distribution of income in Brazilsource: getulio vargas foundation (fgv), finance ministry, credit suisse estimates
Figure 5
Brazil is the prime example of social mobility in Latin America over the last decade…Brazil’s middle-income class as % percentage of total population source: iBge, company data, credit suisse estimates
Figure 6
…while the second-largest economy in the region – Mexico – still has much to catch upmexico’s middle-income class as % of total population source: inegi, company data, credit suisse estimates
gram currently costs an estimated 0.5% of gDp. the program has been responsible for an estimated 28% of the reduction in extreme poverty in the country (measured as the percentage of Brazilians living on less than BRl 70 per month), from 8.8% in 2002 to 3.6% in 2012.
the change in the income distribution of Brazil’s population contributed to an expansion in the domestic consumer market. While the control of inflation made it possible for consumers to purchase goods with low added value, the improvement in income distribution expanded the low-income popu-lation’s access to durable consumer goods with higher added value, such as home appliances and automobiles. also as a result of these redistribution effects, a greater portion of the population now has access to basic sanitation (figure 8).
Access to credit and formalization of labor markets
along with country-specific policies such as raising the minimum wage, we think another key driver of growth in the middle-income class has been higher consumer credit penetration. similar to social mobility trends, credit penetration trends have been uneven across the region. Brazil stands out. Bank loans jumped from 36% of gDp in 2007 to approx-imately 54% of gDp in 2013. loans to individuals account for a 46% share of this total (16% of gDp in 2007 to 26% of gDp in 2013). mortgages take the lion’s share of this increase, jumping from 2% of gDp in 2007 to 8% of gDp in 2013, while share of loans to individuals linked to the purchase of goods fell in the same portion in the meantime.
2002 2009
38.6%
50.4%
33%
38%
43%
48%
53% Middle-income class in Brazil
2002 2011
35%
39%
33%
38%
43%
48%
53% Middle-income class in Mexico
Total household income from all sources(USD/year)
Breakdown of income classes in Brazil(millions of inhabitants)
60,120
46,116
10,6926,696
2002 2009 2014E
Class A
Class B
Class C
Class D
Class E
Class A 7.2 9.6 13.4
Class B 7.3 15.710.4
Class C 67.5 95.0 118.0
Class D 46.1 44.5 32.1
Class E 46.6 28.9 16.8
Total 175 188 196
ph
oto
: is
toc
kp
ho
to.c
om
/pie
Riv
B
latin ameRica_24

Figure 8
Social improvement in Brazil in recent yearssource: iBge, credit suisse estimates
47.857.1
96.8 99.5
Households with access to electricity (% of total)
Households with access to sewerage(% of total)
87.396.7
65.2
91.2
Households with access to a telephone(% of total)
Households with access to a refrigerator(% of total)
2004 20122004 2012
16.3
46.4
34.3
55.1
Households with access to a washing machine(% of total)
Households with access to a computer(% of total)
Improvement to basic living conditions
Access to durable goods of lesser value
Access to durable goods with higher added value
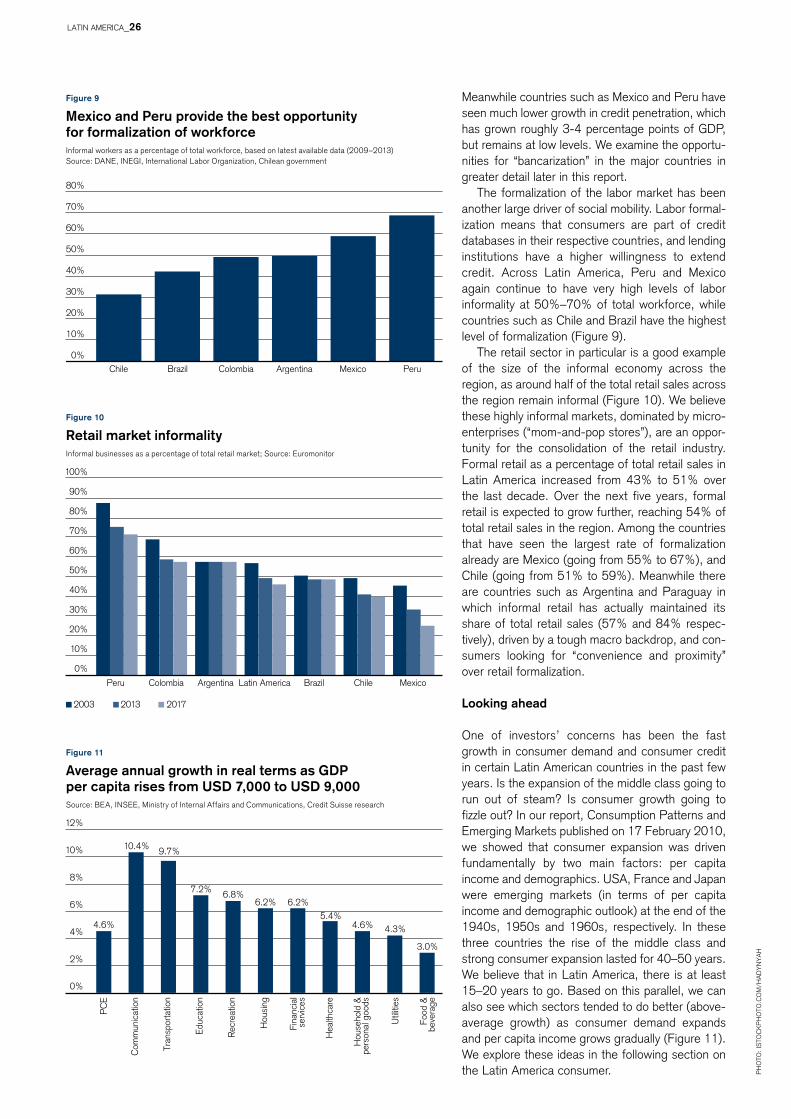
Figure 9
Mexico and Peru provide the best opportunity for formalization of workforce informal workers as a percentage of total workforce, based on latest available data (2009–2013) source: Dane, inegi, international labor organization, chilean government
Figure 10
Retail market informalityinformal businesses as a percentage of total retail market; source: euromonitor
Figure 11
Average annual growth in real terms as GDP per capita rises from USD 7,000 to USD 9,000source: Bea, insee, ministry of internal affairs and communications, credit suisse research
meanwhile countries such as mexico and peru have seen much lower growth in credit penetration, which has grown roughly 3-4 percentage points of gDp, but remains at low levels. We examine the opportu-nities for “bancarization” in the major countries in greater detail later in this report.
the formalization of the labor market has been another large driver of social mobility. labor formal-ization means that consumers are part of credit databases in their respective countries, and lending institutions have a higher willingness to extend credit. across latin america, peru and mexico again continue to have very high levels of labor informality at 50%–70% of total workforce, while countries such as chile and Brazil have the highest level of formalization (figure 9).
the retail sector in particular is a good example of the size of the informal economy across the region, as around half of the total retail sales across the region remain informal (figure 10). We believe these highly informal markets, dominated by micro-enterprises (“mom-and-pop stores”), are an oppor-tunity for the consolidation of the retail industry. formal retail as a percentage of total retail sales in latin america increased from 43% to 51% over the last decade. over the next five years, formal retail is expected to grow further, reaching 54% of total retail sales in the region. among the countries that have seen the largest rate of formalization already are mexico (going from 55% to 67%), and chile (going from 51% to 59%). meanwhile there are countries such as argentina and paraguay in which informal retail has actually maintained its share of total retail sales (57% and 84% respec-tively), driven by a tough macro backdrop, and con-sumers looking for “convenience and proximity” over retail formalization.
Looking ahead
one of investors’ concerns has been the fast growth in consumer demand and consumer credit in certain latin american countries in the past few years. is the expansion of the middle class going to run out of steam? is consumer growth going to fizzle out? in our report, consumption patterns and emerging markets published on 17 february 2010, we showed that consumer expansion was driven fundamentally by two main factors: per capita income and demographics. Usa, france and japan were emerging markets (in terms of per capita income and demographic outlook) at the end of the 1940s, 1950s and 1960s, respectively. in these three countries the rise of the middle class and strong consumer expansion lasted for 40–50 years. We believe that in latin america, there is at least 15–20 years to go. Based on this parallel, we can also see which sectors tended to do better (above-average growth) as consumer demand expands and per capita income grows gradually (figure 11). We explore these ideas in the following section on the latin america consumer.
0%
10%
20%
30%
40%
50%
60%
70%
80%
Chile Brazil Colombia Argentina Mexico Peru
0%
10%
20%
30%
40%
50%
60%
70%
80%
90%
100%
Peru Colombia Argentina Latin America Brazil Chile Mexico
2003 2013 2017
0%
2%
4%
6%
8%
10%
12%
PC
E
Com
mun
icat
ion
Tran
spor
tatio
n
Educ
atio
n
Rec
reat
ion
Hou
sing
Fina
ncia
lse
rvic
es
Hea
lthca
re
Hou
seho
ld &
pers
onal
goo
ds
Util
ities
Food
&be
vera
ge
4.6%
10.4% 9.7%
7.2% 6.8%6.2% 6.2%
5.4%4.6% 4.3%
3.0%
ph
oto
: is
toc
kp
ho
to.c
om
/ha
DY
nY
ah
latin ameRica_26

latin ameRica_27
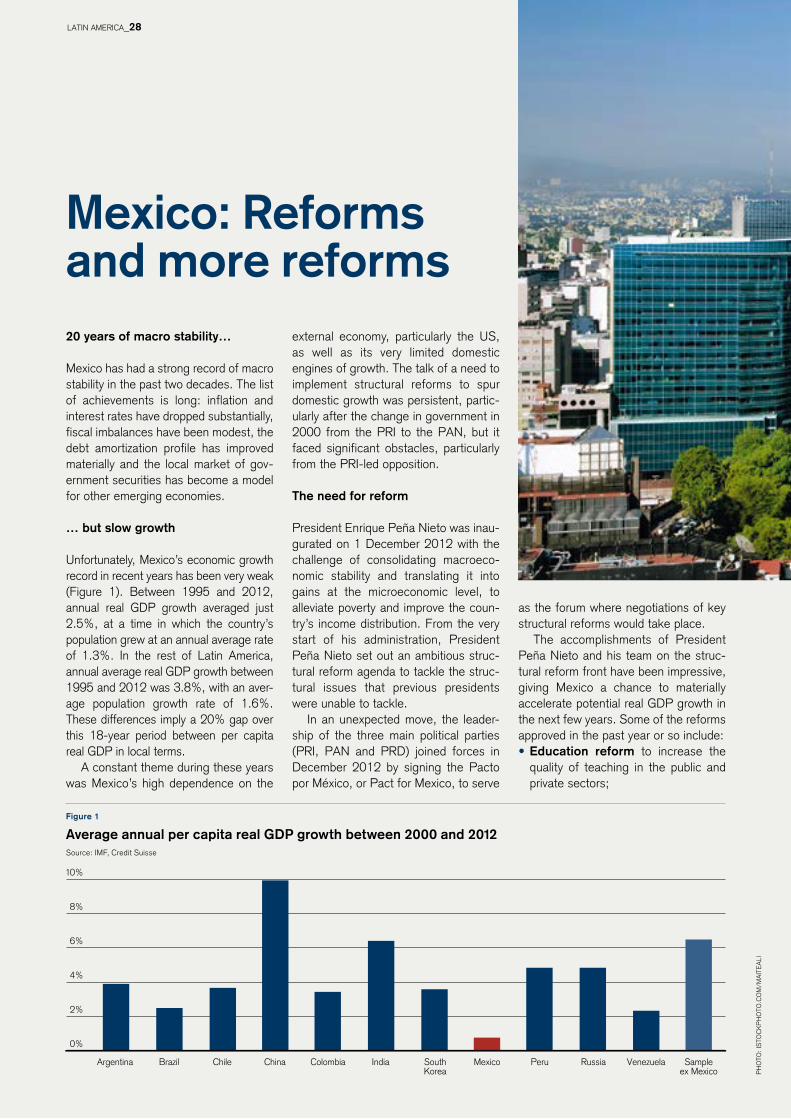
Figure 1
Average annual per capita real GDP growth between 2000 and 2012source: imf, credit suisse
20 years of macro stability…
mexico has had a strong record of macro stability in the past two decades. the list of achievements is long: inflation and interest rates have dropped substantially, fiscal imbalances have been modest, the debt amortization profile has improved materially and the local market of gov-ernment securities has become a model for other emerging economies.
… but slow growth
Unfortunately, mexico’s economic growth record in recent years has been very weak (figure 1). Between 1995 and 2012, annual real gDp growth averaged just 2.5%, at a time in which the country’s population grew at an annual average rate of 1.3%. in the rest of latin america, annual average real gDp growth between 1995 and 2012 was 3.8%, with an aver-age population growth rate of 1.6%. these differences imply a 20% gap over this 18-year period between per capita real gDp in local terms.
a constant theme during these years was mexico’s high dependence on the
Mexico: Reforms and more reforms
external economy, particularly the Us, as well as its very limited domestic engines of growth. the talk of a need to implement structural reforms to spur domestic growth was persistent, partic-ularly after the change in government in 2000 from the pRi to the pan, but it faced significant obstacles, particularly from the pRi-led opposition.
The need for reform
president enrique peña nieto was inau-gurated on 1 December 2012 with the challenge of consolidating macroeco-nomic stability and translating it into gains at the microeconomic level, to alleviate poverty and improve the coun-try’s income distribution. from the very start of his administration, president peña nieto set out an ambitious struc-tural reform agenda to tackle the struc-tural issues that previous presidents were unable to tackle.
in an unexpected move, the leader-ship of the three main political parties (pRi, pan and pRD) joined forces in December 2012 by signing the pacto por méxico, or pact for mexico, to serve
as the forum where negotiations of key structural reforms would take place.
the accomplishments of president peña nieto and his team on the struc-tural reform front have been impressive, giving mexico a chance to materially accelerate potential real gDp growth in the next few years. some of the reforms approved in the past year or so include: • Education reform to increase the quality of teaching in the public and private sectors;
Argentina Brazil Chile China Colombia India SouthKorea
Mexico Peru Russia Venezuela Sampleex Mexico
10%
8%
6%
4%
2%
0%
ph
oto
: is
toc
kp
ho
to.c
om
/ma
ite
ali
latin ameRica_28

Figure 2
Mexicans living in poverty (% of total population)source: coneval, credit suisse
• Competition and telecommunica-tions reform to enhance the powers of the anti-trust commission and to spur competition in the telecommuni-cations and media industries;
• Fiscal reform to strengthen the pub-lic sector’s non-oil tax collections;
• Financial reform to stimulate lending by the commercial and developments banks and
• Energy reform to open up the energy sector to private sector participation.
We think that the energy reform that congress approved in mid-December 2013 represents the most important structural change for the mexican econ-omy since the signing of the north america free trade agreement in 1993. the approved reform allows the govern-ment to give contracts to the private sec-tor (local and foreign) for the exploration and extraction of oil and other hydrocar-bons, according to the now modified article 27 of the constitution. previously,
the constitution explicitly prohibited con-tracts and concessions in the oil industry.
additionally, the approved reform opened up the electricity sector to private sector participation, as it deleted the constitutional text that previously gave the monopoly of the electricity industry to the state. We estimate that these reforms could boost mexico’s real gDp growth potential by as much as two per-centage points in the next few years, from 3.0% to 5.0%. our estimates are in line with those published by the central bank and the ministry of finance. the main contribution comes from the energy reform, which is seen as adding one per-centage point to potential growth.
Conclusion
the very sound macroeconomic frame-work, partly forced by the tequila crisis and enhanced by more recent reforms, has materially improved growth prospects and will make mexico one of the most appealing destinations for investment– both fixed and financial – in the coming years in our view. What used to be a story of stability is effectively becoming an exciting story of stability and growth.
21.4 20.0 19.7
53.1
60%
50%
40%
30%
20%
10%
0%
50.052.3
1992
Patrimonial povertyFood poverty
2002 2012
latin ameRica_29

Ph
oTo
: is
Toc
kP
ho
To.c
om
/.s
ho
ck
latin ameRica_30

Consumertrends andopportunities
Social migration and consumer “sophistication”
our research confirms that social mobility not only results in higher consumption, but it also gradually brings “sophistication” to consumption patterns, which helps drive spending, even in the prevalence of more modest volume growth rates. in other words, while upwards social mobility will support growth, consumption will also benefit from the sale of higher value-added products as consumers change and trade-up. for example, according to the Boston consulting group (Bcg), while house-holds in Brazil earning up to UsD 3,000 per year are limited to the purchase of a little more than their basic needs, households earning between UsD 3,001 and UsD 15,000 per year (i.e. 59% of the Brazilian population) are already looking to buy higher value-added products.
in practical terms, this means that consumers not only buy more tv sets and refrigerators, but: (1) they buy more tv sets and refrigerators with larger screens and offering more features; (2) there is increasing consumption of frozen and ready-to-eat
the ongoing rise of the middle class and further gains in income levels in latin america are likely to lead to important shifts in consumer behavior, which will pose challenges and opportunities for companies in the retail, packaged goods, e-commerce and financial services segments. these shifts are likely to include: increasing consumer sophistication for products, increasing sophistication for retail channels (including e-commerce), reduced brand loyalty, and changes in consumption patterns from an aging population.
Ph
oTo
: is
Toc
kP
ho
To.c
om
/.s
ho
ck
latin ameRica_31
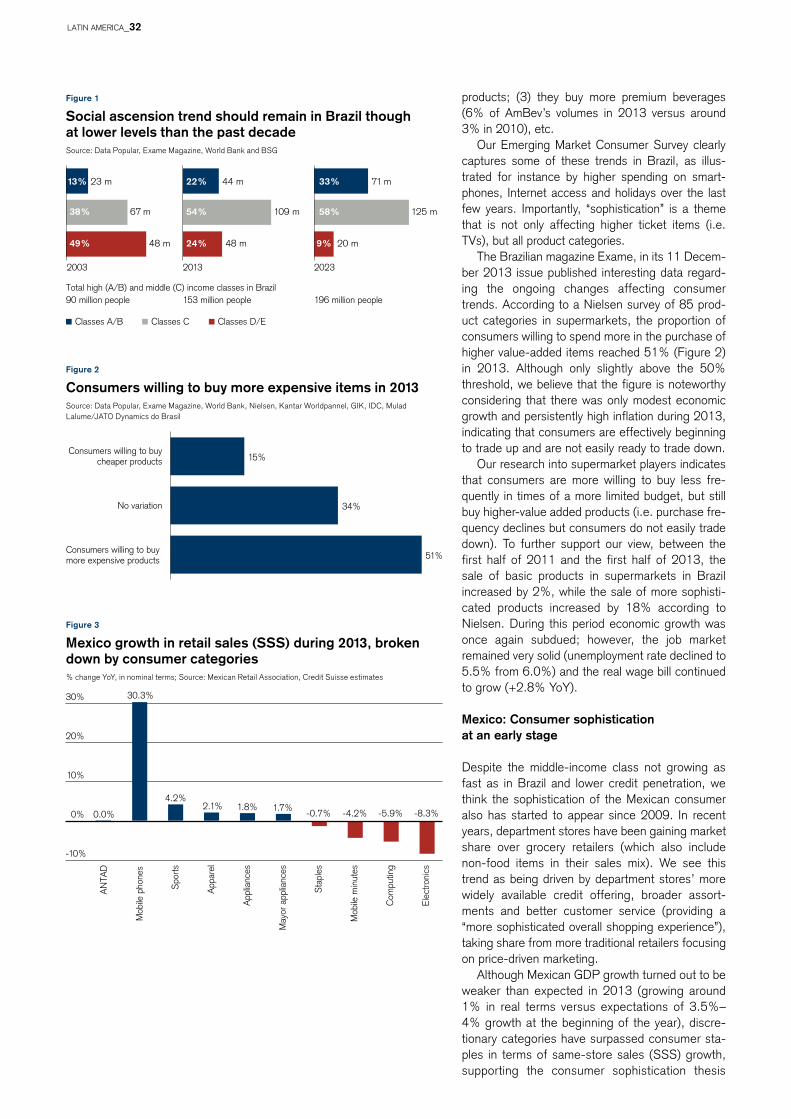
Figure 2
Consumers willing to buy more expensive items in 2013source: Data popular, exame magazine, World Bank, nielsen, kantar Worldpannel, gik, iDc, mulad lalume/jato Dynamics do Brasil
products; (3) they buy more premium beverages (6% of amBev’s volumes in 2013 versus around 3% in 2010), etc.
our emerging market consumer survey clearly captures some of these trends in Brazil, as illus-trated for instance by higher spending on smart-phones, internet access and holidays over the last few years. importantly, “sophistication” is a theme that is not only affecting higher ticket items (i.e. tvs), but all product categories.
the Brazilian magazine exame, in its 11 Decem-ber 2013 issue published interesting data regard-ing the ongoing changes affecting consumer trends. according to a nielsen survey of 85 prod-uct categories in supermarkets, the proportion of consumers willing to spend more in the purchase of higher value-added items reached 51% (figure 2) in 2013. although only slightly above the 50% threshold, we believe that the figure is noteworthy considering that there was only modest economic growth and persistently high inflation during 2013, indicating that consumers are effectively beginning to trade up and are not easily ready to trade down.
our research into supermarket players indicates that consumers are more willing to buy less fre-quently in times of a more limited budget, but still buy higher-value added products (i.e. purchase fre-quency declines but consumers do not easily trade down). to further support our view, between the first half of 2011 and the first half of 2013, the sale of basic products in supermarkets in Brazil increased by 2%, while the sale of more sophisti-cated products increased by 18% according to nielsen. During this period economic growth was once again subdued; however, the job market remained very solid (unemployment rate declined to 5.5% from 6.0%) and the real wage bill continued to grow (+2.8% YoY).
Mexico: Consumer sophistication at an early stage
Despite the middle-income class not growing as fast as in Brazil and lower credit penetration, we think the sophistication of the mexican consumer also has started to appear since 2009. in recent years, department stores have been gaining market share over grocery retailers (which also include non-food items in their sales mix). We see this trend as being driven by department stores’ more widely available credit offering, broader assort-ments and better customer service (providing a “more sophisticated overall shopping experience”), taking share from more traditional retailers focusing on price-driven marketing.
although mexican gDp growth turned out to be weaker than expected in 2013 (growing around 1% in real terms versus expectations of 3.5%–4% growth at the beginning of the year), discre-tionary categories have surpassed consumer sta-ples in terms of same-store sales (sss) growth, supporting the consumer sophistication thesis
Figure 3
Mexico growth in retail sales (SSS) during 2013, broken down by consumer categories% change YoY, in nominal terms; source: mexican Retail association, credit suisse estimates
Figure 1
Social ascension trend should remain in Brazil though at lower levels than the past decadesource: Data popular, exame magazine, World Bank and Bsg
Classes A/B Classes C Classes D/E
Total high (A/B) and middle (C) income classes in Brazil
23 m
67 m
2003
49%
90 million people
109 m
48 m
2013
54%
153 million people
71 m
125 m
20 m
2023
33%
58%
196 million people
9%
13%
24%
22% 44 m
38%
48 m
15%
34%
51%
Consumers willing to buycheaper products
No variation
Consumers willing to buy more expensive products
-10%
0%
10%
20%
30%
AN
TAD
Mob
ile p
hone
s
Spo
rts
App
arel
App
lianc
es
May
or a
pplia
nces
Sta
ples
Mob
ile m
inut
es
Com
putin
g
Elec
troni
cs
0.0%
30.3%
4.2%2.1% 1.8% 1.7%
-0.7% -4.2% -8.3%-5.9%
latin ameRica_32

Figure 4
Brand loyalty per category and reasons to switch brandssource: cs supermercado moderno, consumer Database
(figure 3). the exception to this trend has been consumer electronics and computing (4% down year-on-year).
We think an important driver of consumer sophistication in mexico (in addition to the rise of the middle income class mentioned in the previous section) was the removal of import tariffs on apparel manufactured in china (the tariff went down from between 60%–350% to 20%). as a result of the removal of these import tariffs, multinational brands long absent in mexico are now rushing to get in.
this has become a powerful industry driver as: • the cultural ties between mexico and Usa have
made mexican consumers extremely “brand-driven” even compared to the rest of latin america (mex-ico has the lowest penetration of private label brands relative to the rest of the region). • there has been a “democratization process” of
foreign brands, as now the middle income seg-ments are able to afford fashionable products com-ing from abroad (the average price gap for apparel sold in mexico relative to a similar product sold in Usa has gone down from 60%–90% before the removal of the former import tariffs to 15–20% currently).
the bad news for multinational brands trying to enter mexico is that vacancy rates at class-a shopping malls in mexico’s largest cities (where multinational apparel retailers would like to open their flagship stores) are virtually zero, making the “real estate” of department stores willing to lease space to these new entrant apparel retailers a very valuable asset.
Latin American consumers: lack of brand loyalty may intensify going forward
While the greater purchasing power of the con-sumer creates huge opportunities, consumer com-panies in latin america are facing pressures from multiple angles. consumers are becoming more sophisticated and demanding more variety and a better shopping experience, distribution still faces important bottlenecks, and multinationals are mov-ing more aggressively. in addition, competition from informal players is still a factor and limits strategic moves in many sectors and regions. the outcome for consumer goods manufacturers is clear: mar-keting and trade spending should continue to rise. Retailers will need to adapt formats to new con-sumer demands.
a small portion of consumers may show loyalty to a brand while others focus on prices, but the bulk of consumers often have two or three different preferred brands and will switch among them when their top pick is not available or when they are attracted by promotions in secondary categories. from a sample of 33 consumer cate-gories surveyed for brand loyalty in Brazil, the share of loyal consumers was above 50% in only eight categories. more interestingly, among cate-gories showing a higher propensity to change, price was the main reason in only five categories (figure 4 shows a sample of these 33 consumer categories).
the lack of loyalty may intensify going forward. first, many categories are new additions to the product basket of the rising middle class, and con-
Would change brand Doesn’t change brand Try the product Price Advertisement
Brand loyalty (%) Which factors influences the consumer to change the product’s brand (%)
26 74 Cola carbonates
40 60 Mayonnaise
55 45 Powder soap
55 45 Beer
57 43 Energy drinks
57 43 Margarine
60 40 Toothpaste
60 40 Hamburgers
62 38 Tomato sauce
67 33 Soap
67 33 Shampoo
71 29 Conditioner
71 29 Mineral water
71 29 Yogurt
71 29 Ready meal
74 26 Cookies/crackers
74 26 Flour
81 19 Juice
Juice 67 21 12
Conditioner 64 10 26
Yogurt 64 17 19
Ready meal 64 15 21
Cookies/crackers 62 10 28
Shampoo 60 14 26
Hamburgers 57 26 17
Beer 57 24 19
Tomato sauce 55 33 12
Toothpaste 52 17 31
Energy drinks 52 21 27
Soap 48 26 26
Margarine 43 29 28
Flour 40 52 8
Powder soap 38 50 12
31 50 19 Mineral water
latin ameRica_33
sumers might be inclined to try options before establishing a preference. second, young con-sumers are typically more open to novelties and the group represents a significant portion of the population.
The sophistication of channels
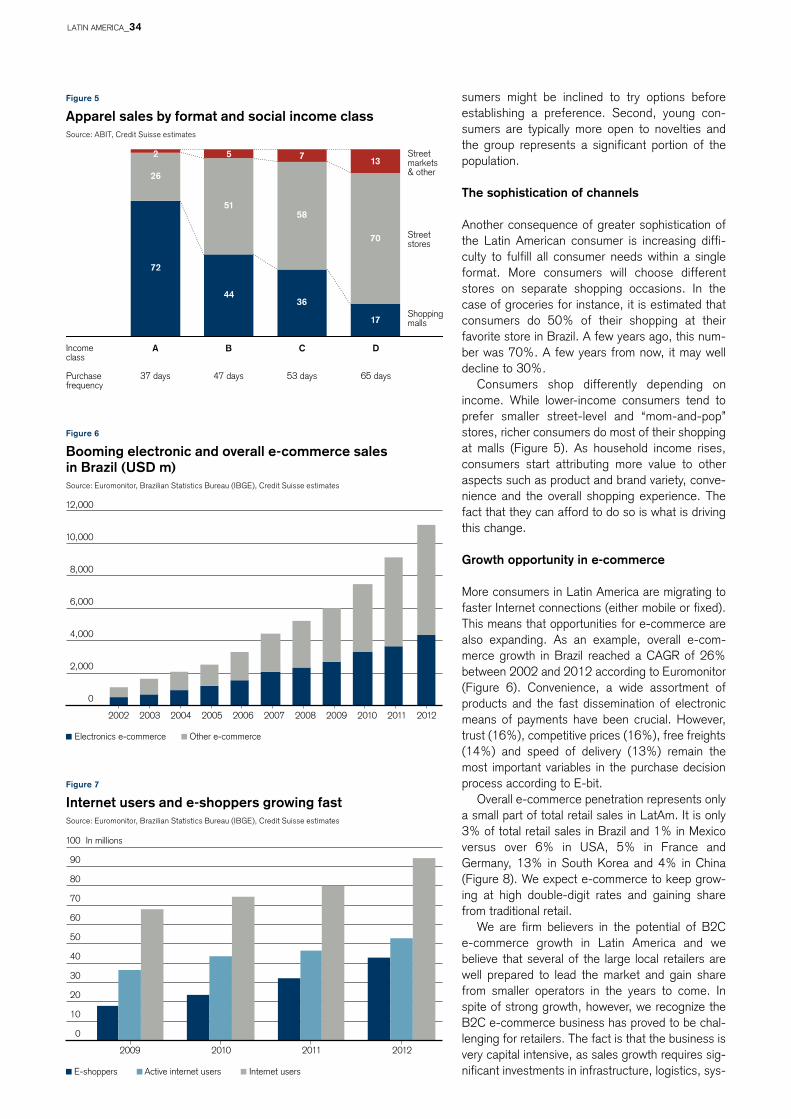
another consequence of greater sophistication of the latin american consumer is increasing diffi-culty to fulfill all consumer needs within a single format. more consumers will choose different stores on separate shopping occasions. in the case of groceries for instance, it is estimated that consumers do 50% of their shopping at their favorite store in Brazil. a few years ago, this num-ber was 70%. a few years from now, it may well decline to 30%.
consumers shop differently depending on income. While lower-income consumers tend to prefer smaller street-level and “mom-and-pop” stores, richer consumers do most of their shopping at malls (figure 5). as household income rises, consumers start attributing more value to other aspects such as product and brand variety, conve-nience and the overall shopping experience. the fact that they can afford to do so is what is driving this change.
Growth opportunity in e-commerce
more consumers in latin america are migrating to faster internet connections (either mobile or fixed). this means that opportunities for e-commerce are also expanding. as an example, overall e-com-merce growth in Brazil reached a cagR of 26% between 2002 and 2012 according to euromonitor (figure 6). convenience, a wide assortment of products and the fast dissemination of electronic means of payments have been crucial. however, trust (16%), competitive prices (16%), free freights (14%) and speed of delivery (13%) remain the most important variables in the purchase decision process according to e-bit.
overall e-commerce penetration represents only a small part of total retail sales in latam. it is only 3% of total retail sales in Brazil and 1% in mexico versus over 6% in Usa, 5% in france and germany, 13% in south korea and 4% in china (figure 8). We expect e-commerce to keep grow-ing at high double-digit rates and gaining share from traditional retail.
We are firm believers in the potential of B2c e-commerce growth in latin america and we believe that several of the large local retailers are well prepared to lead the market and gain share from smaller operators in the years to come. in spite of strong growth, however, we recognize the B2c e-commerce business has proved to be chal-lenging for retailers. the fact is that the business is very capital intensive, as sales growth requires sig-nificant investments in infrastructure, logistics, sys-
Figure 7
Internet users and e-shoppers growing fastsource: euromonitor, Brazilian statistics Bureau (iBge), credit suisse estimates
Figure 6
Booming electronic and overall e-commerce sales in Brazil (USD m)source: euromonitor, Brazilian statistics Bureau (iBge), credit suisse estimates
Figure 5
Apparel sales by format and social income classsource: aBit, credit suisse estimates
Shoppingmalls
Street stores
Street markets& other
Purchasefrequency
Income class
B
44
51
5
47 days
C
36
58
7
53 days
D
17
70
13
65 days
A
72
26
37 days
2
2002
0
2,000
4,000
6,000
8,000
10,000
12,000
2003 2004 2005 2006 2007 2008 2009 2010 2011 2012
Electronics e-commerce Other e-commerce
0
10
20
30
40
50
60
70
80
90
100 In millions
2009 2010 2011 2012
E-shoppers Active internet users Internet users
latin ameRica_34

tems, technology and, more importantly, working capital. Unlike most of the markets around the globe, sales in Brazil are hugely dependent on sell-ing in installments with no interest rates, which results in a large financial burden, as e-commerce operators end-up discounting their receivables to fund working capital. While top-line growth rates remain attractive, over the last few months some large players have decided to close or scale back their online operations.
The population is gradually aging
income is often the key variable explaining per-capita consumption differences across geogra-phies. however, it should not be analyzed in isola-tion. the effects of age, urbanization, the role of gender in the household and financial leverage of families are also important in understanding con-sumption patterns (figure 10). these trends also explain a key challenge facing consumer compa-nies in latin america in the years ahead, namely the growing complexity of their product portfolio.
Demographic trends offer enormous potential for consumption growth, but we see companies facing increasing difficulties in converting theoreti-cal market potential into bottom-line results based on old strategies. historically, mass market strate-gies focused on cost efficiency have been quite effective. however, the expected shifts in the demographic profile of the population, combined with changing trends in consumption habits, will require companies to rethink what effectively drives consumption.
as the age-distribution of the region’s popula-tion is expected to change significantly in the com-ing years, so should some consumption patterns. in a more holistic view, as the population gets older, spending on healthcare and housing should increase significantly, while consumption of some products will suffer.
Figure 8
E-commerce penetration – % of total retail sales (l.h.s.) vs. YoY changesource: ebit Webshopper, mckinsey e euromonitor, credit suisse estimates
Figure 9
Price impact of e-commerce has been strong (YoY change)source: ebit Webshopper, mckinsey e euromonitor, credit suisse estimates
Figure 10
Brazil – Understanding consumption gaps across the age spectrumsource: cs consumer Database
India
Indonesia
Japan
South KoreaAustralia
Russia
BrazilChile
Colombia
Mexico
South Africa
Canada
USA
France
Germany
Italy
Portugal
Spain
UK
0%
10%
20%
30%
40%
50%
60%
0 2% 4% 6% 8% 10% 12% 14%
-0.11
-0.35
-2.33
-2.90
-5.88
-9.32
-10.86
-12.75
-14.51
-7.46
3.51
-6.13
0.11
Cosmetics
Home & depot
Sports and leisure
Computer hardware/software
Toys and games
Telecom
Photography
Apparel
Electronics
110 categories down
Total (151 categories)
Home appliances
41 categories up
Age 15–25 Age +55
113
74
109
77
106
81
9690
98 9587
97
82
9484
101
71
100
71
124
Apparel,footwear & accessories
Personalcare
Homecare Communication Education Transportationservices
& vehicles
Food awayfrom home
Recreation Financialservices
Healthcare
Markets dominated by young consumers Markets dominated by older consumers
latin ameRica_35
Financial services:Opportunities for “bancarization”financial services is one of the largest business opportunities in the region. as the economy expands in a tame inflationary environment, banks and insurance companies are poised to grow at a faster rate than the rest of the economy.
in this report we analyze some of the myths and “maths” of the bancarization process in the largest economies in latin america, with a critical look at the strong bancarization of the past ten years and a view of what the future holds for the main banking sectors in the region over the next decade. We analyze demographics, macro and sector data to assess the addressable market in each country, and make the case that gDp growth is a necessary but not sufficient condition to increase loan pene-tration in these economies, if it does not come accompanied by better income distribution.
Using Brazil as the benchmark of bancarization given the successful growth in this segment over the past decade (consumer loans represented ~7% of gDp in the beginning of 2001 vs ~19% today), we come to the conclusion that peru is the most attractive market, followed by mexico (but by a large distance), as the growth potential is far less than what simple penetration metrics would sug-gest. in chile, there is not as much room to grow as many banks would claim and their strategies would suggest. colombia seems to be the least compelling market as weak income distribution has reduced the size of the addressable market.
Despite the increased penetration of financial services in latin america over the last 10–15 years (figures 1 and 2), there is still significant upside. When assessing the opportunity for “bancarization”, we see two important caveats: • consumer credit penetration in chile and mexico
is higher than what it appears on the surface, espe-
cially if we take into account credit given by retail-ers. Retailers’ non-banking operations add up to 180 basis points and 80 basis points to the con-sumer credit-to-gDp ratios for chile and mexico respectively. • comparing the penetration of consumer credit
across regions tends to overestimate the upside potential of the andean markets and especially mexico versus Brazil, by failing to account for the size of the addressable market in each country, due to different income distributions and lower per cap-ita income levels (even when ppp-adjusted).the addressable market for banking products var-ies depending on the average income and its distri-bution across the population. We consider UsD 267 ppp per capita monthly income to be the minimum threshold to assess the addressable mar-ket. this is the level of average per capita income of the c class in Brazil (ppp-adjusted).
in Brazil, only 21% of the population has a monthly income below UsD 267 (ppp-adjusted), and hence the country stands with the largest addressable market (79%) in latin america. mex-ico and colombia have the smallest addressable markets – only 50% of the population, followed by peru with 59% (figure 3). chile’s addressable market on the other hand is much higher, at 69%. another important factor is each country’s dispos-able income. if we adjust by the difference in pur-chasing power of each country (ppp), mexico and colombia are actually less attractive on a relative basis (figure 4). p
ho
to:
isto
ck
ph
oto
.co
m/s
toc
kc
am
latin ameRica_36

latin ameRica_37
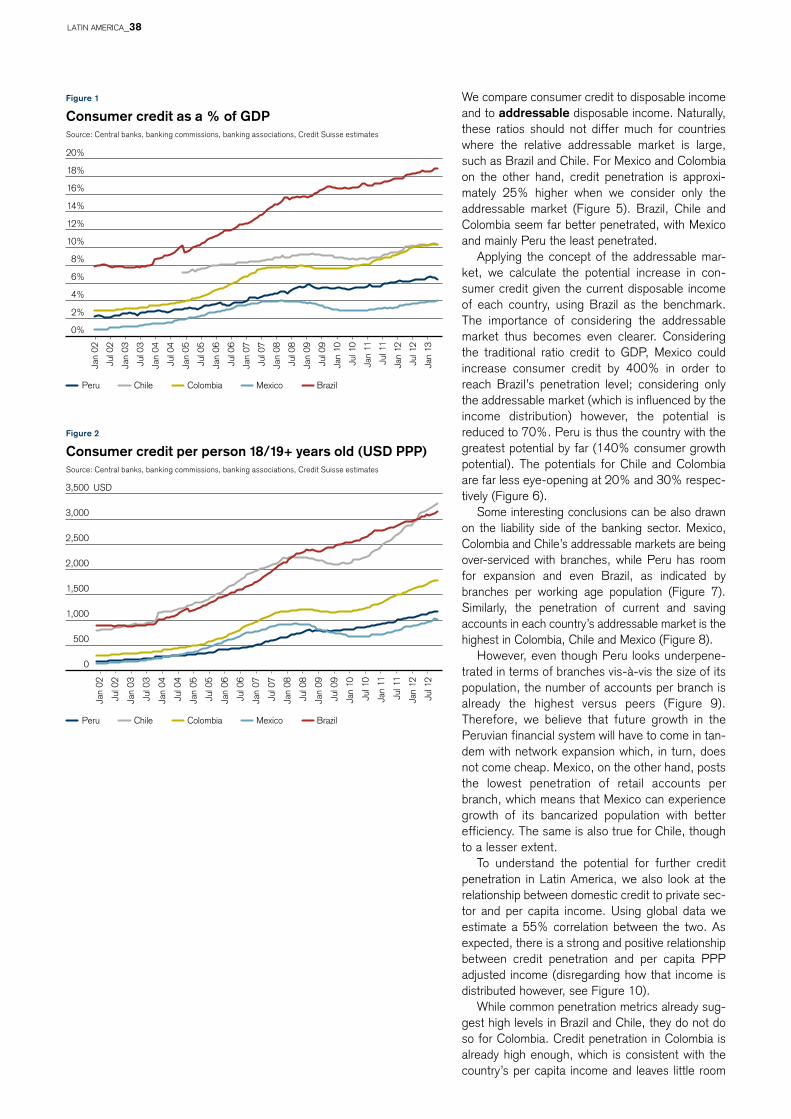
Figure 1
Consumer credit as a % of GDPsource: central banks, banking commissions, banking associations, credit suisse estimates
Figure 2
Consumer credit per person 18/19+ years old (USD PPP)source: central banks, banking commissions, banking associations, credit suisse estimates
We compare consumer credit to disposable income and to addressable disposable income. naturally, these ratios should not differ much for countries where the relative addressable market is large, such as Brazil and chile. for mexico and colombia on the other hand, credit penetration is approxi-mately 25% higher when we consider only the addressable market (figure 5). Brazil, chile and colombia seem far better penetrated, with mexico and mainly peru the least penetrated.
applying the concept of the addressable mar-ket, we calculate the potential increase in con-sumer credit given the current disposable income of each country, using Brazil as the benchmark. the importance of considering the addressable market thus becomes even clearer. considering the traditional ratio credit to gDp, mexico could increase consumer credit by 400% in order to reach Brazil’s penetration level; considering only the addressable market (which is influenced by the income distribution) however, the potential is reduced to 70%. peru is thus the country with the greatest potential by far (140% consumer growth potential). the potentials for chile and colombia are far less eye-opening at 20% and 30% respec-tively (figure 6).
some interesting conclusions can be also drawn on the liability side of the banking sector. mexico, colombia and chile’s addressable markets are being over-serviced with branches, while peru has room for expansion and even Brazil, as indicated by branches per working age population (figure 7). similarly, the penetration of current and saving accounts in each country’s addressable market is the highest in colombia, chile and mexico (figure 8).
however, even though peru looks underpene-trated in terms of branches vis-à-vis the size of its population, the number of accounts per branch is already the highest versus peers (figure 9). therefore, we believe that future growth in the peruvian financial system will have to come in tan-dem with network expansion which, in turn, does not come cheap. mexico, on the other hand, posts the lowest penetration of retail accounts per branch, which means that mexico can experience growth of its bancarized population with better efficiency. the same is also true for chile, though to a lesser extent.
to understand the potential for further credit penetration in latin america, we also look at the relationship between domestic credit to private sec-tor and per capita income. Using global data we estimate a 55% correlation between the two. as expected, there is a strong and positive relationship between credit penetration and per capita ppp adjusted income (disregarding how that income is distributed however, see figure 10).
While common penetration metrics already sug-gest high levels in Brazil and chile, they do not do so for colombia. credit penetration in colombia is already high enough, which is consistent with the country’s per capita income and leaves little room
0%
2%
4%
6%
8%
10%
12%
14%
16%
18%
20%
Peru Chile Colombia Mexico Brazil
Jan
02
Jan
03
Jan
04
Jan
05
Jan
06
Jan
07
Jan
08
Jan
09
Jan
10
Jan
11
Jan
12
Jan
13
Jul 0
2
Jul 0
3
Jul 0
4
Jul 0
5
Jul 0
6
Jul 0
7
Jul 0
8
Jul 0
9
Jul 1
0
Jul 1
1
Jul 1
2
0
Jan
02
Jan
03
Jan
04
Jan
05
Jan
06
Jan
07
Jan
08
Jan
09
Jan
10
Jan
11
Jan
12
Jul 0
2
Jul 0
3
Jul 0
4
Jul 0
5
Jul 0
6
Jul 0
7
Jul 0
8
Jul 0
9
Jul 1
0
Jul 1
1
Jul 1
2
500
1,000
1,500
2,000
2,500
3,000
3,500 USD
Peru Chile Colombia Mexico Brazil
latin ameRica_38

Figure 3
Banking addressable marketsource: central banks, banking commissions, banking associations, credit suisse estimates
% of total population
Figure 4
GDP/capita vs. disposable income/capita (PPP-adjusted) (as of 2012)source: central banks, banking commissions, banking associations, credit suisse estimates
Figure 5
Consumer credit to disposable income and to addressable disposable income as of 2012; source: company data, credit suisse estimates
for more. more importantly, the curve shows that credit penetration in peru and mexico is indeed low, leaving room for further penetration while leaving per capita income unchanged. the key, however, will be how this per capita income is distributed across income brackets.
Banking potential: Peru offers the best opportunity
• Peru: By far the greatest potential. peru scores the best in every aspect. it has the best demographics over the next 10 years, its address-able market is truly the most underpenetrated, having the biggest potential in the region for con-sumer credit growth (140%) in its addressable market, not to mention the highest gDp growth in latin america and the biggest potential for the for-malization of the workforce. peru is also underban-carized on the liability side, as measured in branches and number of accounts. however, as indicated by having the highest retail accounts per branch ratio among peers, there is no room to increase branch efficiency, meaning that incorpo-rating new clients into the system will require new branches to be opened. so while the top line growth is promising, attention should be paid to costs. moreover, despite the positive growth in the wage bill over recent years, it has lagged gDp growth substantially. thus slowdowns in economic activity could have a bigger negative impact on the bancarization process and consumer credit growth than in other latin american peers.
• Mexico: Second biggest potential in the region, though less than it appears. While it is true that the potential for increasing consumer credit penetration in mexico is significant, the potential is much smaller versus what traditional metrics would suggest. When looking at consumer credit to addressable disposable income, the potential stands at 70%, significantly below peru’s 140%. this contrasts with a 400% potential if one looks only at consumer credit to gDp. Unequal lev-els of income distribution, which reduce the addressable market to only 49% of the working age population, are the culprit here. given the small addressable market, it gives the impression that the current potential market is already over-served. thus, it becomes evident that higher gDp growth rates, a reduction in informality of the work force and higher wage bill growth, all leading to social mobility towards the middle class, are major preconditions for consumer credit penetration to really go up. Unlike peru, mexico does not seem to be in the need of a significant branch expansion in the short to medium term, posting the highest ratio of branches per 1,000 per addressable adult. the current branch network is also underutilized, mean-ing that banks will be able to increase bancariza-tion levels without much expenditure on the distri-bution network.
79%
69%
59%
50% 49%
0%
10%
20%
30%
40%
50%
60%
70%
80%
90%
Brazil Chile Peru Colombia Mexico
10,166
6,6655,088 4,585 4,329
22,442
11,874 11,263 11,099
18,055
0
5,000
10,000
15,000
20,000
25,000
Chile Brazil Peru Colombia Mexico
Disposable income per capita (addressable market) GDP per capita
32%
25%
21%
15%
12%
33%
27% 26%
19%
14%
0%
5%
10%
15%
20%
25%
30%
35%
Brazil Chile Colombia Mexico Peru
Credit to disposable income Credit to addressable disposable income
latin ameRica_39

Figure 6
Potential increase in consumer credit penetration (to reach the benchmark)as implied by consumer credit to gDp ratio and consumer credit to addressable disposable income source: central banks, banking commissions, banking associations, credit suisse estimates
Figure 7
Bank branches per adult as of 2012; source: central banks, banking commissions, banking associations, credit suisse estimates
• Colombia: Potential is smaller than it may seem. While consumer credit to gDp indicates sig-nificant upside, as is the case with mexico, the weak income distribution reduces the addressable market to only 50% of the working age population; credit to addressable disposable income is the sec-ond highest among latin american peers at 26%, only behind Brazil. adjusting for such an address-able market, we see potential for only a 30% increase in consumer credit penetration. high levels of informality and the small size of the middle class are the main constraint for growth. Despite robust real gDp growth around 4% over recent years, real wages grew only 1.5%, showing the biggest gap in latin america (250 basis points). hence, sound gDp growth is not enough to sustain consumer credit growth; better income distribution and formal-ization of employment are key. moreover, when look-ing at credit penetration versus per capita income, penetration is high enough already in the country. colombia also seems over-bancarized on the liability side (as evidenced by the highest account and branch penetration in the region), which might make it more difficult to fund future growth.
• Chile: Room for further consumer penetra-tion looks rather limited. chile posts the lowest potential for increasing consumer credit penetration among andean peers, with only a 20% upside ver-sus the benchmark (Brazil). having better income distribution, a wage bill that grows almost in tan-dem with gDp, and the lowest informality of the workforce in latin america all contribute to having the second-largest addressable market in the region (69%) and providing some support to con-sumer credit growth. nevertheless, consumer credit to addressable disposable income suggest that the addressable market is already properly served (either by banks or retailers, who play an
5.0x
2.9x
1.8x 1.8x
1.0x
1.7x
2.4x
1.3x 1.2x1.0x
0x
1x
2x
3x
4x
5x
6x
Mexico Peru Colombia Chile Brazil
Consumer credit to GDP Consumer credit to addressable disposable income
Mexico PeruColombiaChile Brazil
19.217.4
16.1 15.9
9.4
27.9
34.6 33.0
20.0
15.8
0
5
10
15
20
25
30
35
40
Branches per 100,000 adultsBranches per 100,000 addressable adults p
ho
to:
isto
ck
ph
oto
.co
m/e
RlU
ch
o
latin ameRica_40
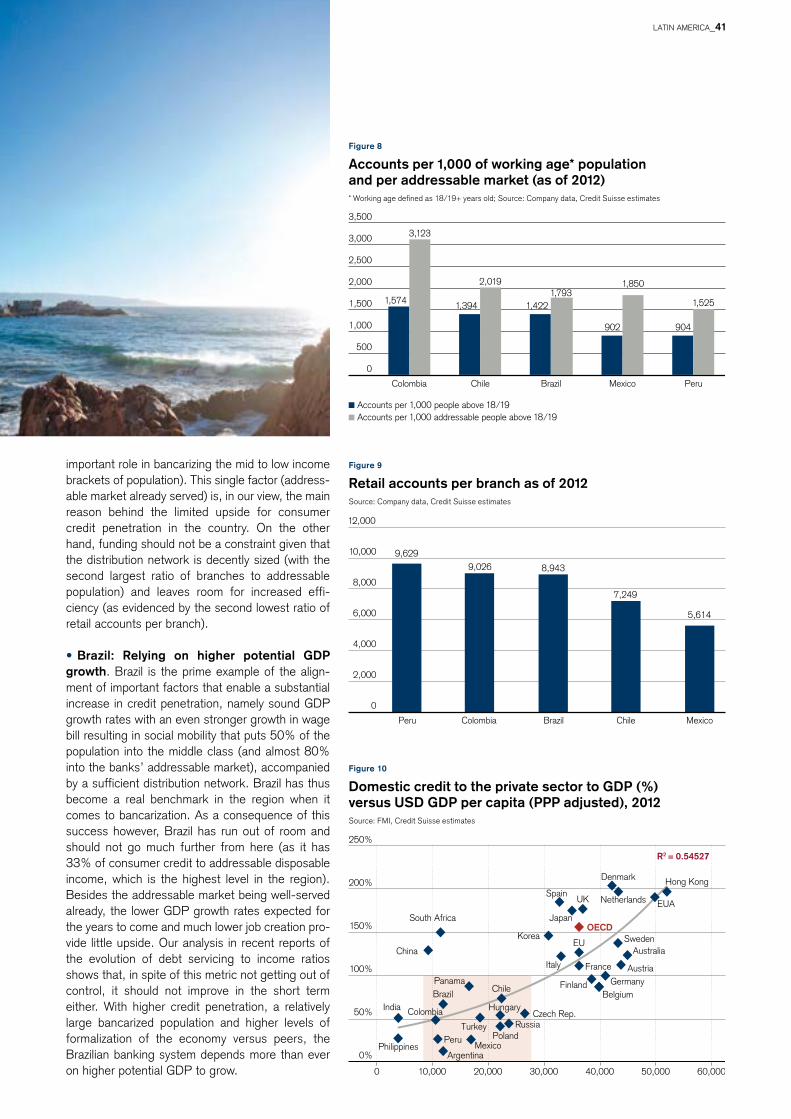
Figure 8
Accounts per 1,000 of working age* population and per addressable market (as of 2012)* Working age defined as 18/19+ years old; Source: Company data, Credit Suisse estimates
Figure 10
Domestic credit to the private sector to GDP (%) versus USD GDP per capita (PPP adjusted), 2012source: fmi, credit suisse estimates
Figure 9
Retail accounts per branch as of 2012source: company data, credit suisse estimates
important role in bancarizing the mid to low income brackets of population). this single factor (address-able market already served) is, in our view, the main reason behind the limited upside for consumer credit penetration in the country. on the other hand, funding should not be a constraint given that the distribution network is decently sized (with the second largest ratio of branches to addressable population) and leaves room for increased effi-ciency (as evidenced by the second lowest ratio of retail accounts per branch).
• Brazil: Relying on higher potential GDP growth. Brazil is the prime example of the align-ment of important factors that enable a substantial increase in credit penetration, namely sound gDp growth rates with an even stronger growth in wage bill resulting in social mobility that puts 50% of the population into the middle class (and almost 80% into the banks’ addressable market), accompanied by a sufficient distribution network. Brazil has thus become a real benchmark in the region when it comes to bancarization. as a consequence of this success however, Brazil has run out of room and should not go much further from here (as it has 33% of consumer credit to addressable disposable income, which is the highest level in the region). Besides the addressable market being well-served already, the lower gDp growth rates expected for the years to come and much lower job creation pro-vide little upside. our analysis in recent reports of the evolution of debt servicing to income ratios shows that, in spite of this metric not getting out of control, it should not improve in the short term either. With higher credit penetration, a relatively large bancarized population and higher levels of formalization of the economy versus peers, the Brazilian banking system depends more than ever on higher potential gDp to grow.
Accounts per 1,000 people above 18/19Accounts per 1,000 addressable people above 18/19
1,574 1,394 1,422
902 904
3,123
2,0191,793
1,850
1,525
0
500
1,000
1,500
2,000
2,500
3,000
3,500
Colombia Chile Brazil Mexico Peru
9,6299,026 8,943
7,249
5,614
0
2,000
4,000
6,000
8,000
10,000
12,000
Peru Colombia Brazil Chile Mexico
R2 = 0.54527
50%
0%
100%
150%
200%
250%
0 10,000
South Africa
China
India
PhilippinesArgentina
Peru
Colombia
Mexico
Turkey
HungaryBrazil Chile
Czech Rep.
GermanyFinlandBelgium
AustraliaSweden
Hong Kong
EUA
Denmark
NetherlandsUK
Japan
Spain
Korea
Italy France
EU
Austria
RussiaPoland
Panama
20,000 30,000 40,000 50,000 60,000
OECD
latin ameRica_41

Ph
oTo
: is
Toc
kP
ho
To.c
om
/Le
of
rA
nc
ini
latin ameRica_42

Energy – divergence and convergenceafter years of diverging directions in energy policy among key latin american countries, the region may now finally be converging towards deregulation, increasing energy supply and relevance in a global context. in the past decade or so, divergence was characterized by Brazil and colombia being the only countries that saw deregulation and an increase in oil production and reserves. argentina, venezuela and mexico saw increased government intervention and a lack of supply growth.
after years of significant divergence in the energy policies and production profiles across latin amer-ica, a new convergence may happen with a second leg of growth in Brazil (via the development of the pre-salt discoveries), the emergence of world-class shale plays in argentina, a much-needed historic mexican energy reform, and the continuation of the colombian oil sector development with the emer-gence of various smaller e&p players. the direction of venezuelan energy policy and prospects remains unclear at this point, despite the country holding the world’s largest oil reserves.
Where Latin America currently stands
latin america is already a relevant part of the global energy picture. since the 1980s, the share of the region in global energy consumption has increased from 5% to 7%, driven by higher-than-average economic growth (figure 1). a key distin-guishing factor in latin america, led by Brazil, is
Figure 1
Latin America energy consumption and share of world energy consumptionsource: Bp statistical Review. note: latin america includes all countries in south and central america plus mexico
0%
1%
2%
3%
4%
5%
6%
7%
8%
0
200
400
600
800
1,000
1980
1983
1986
1989
1992
1995
1998
2001
2004
2007
2010
m tons oil equivalent
Latin America energy consumption Latin America as % of world (r.h.s.)
latin ameRica_43
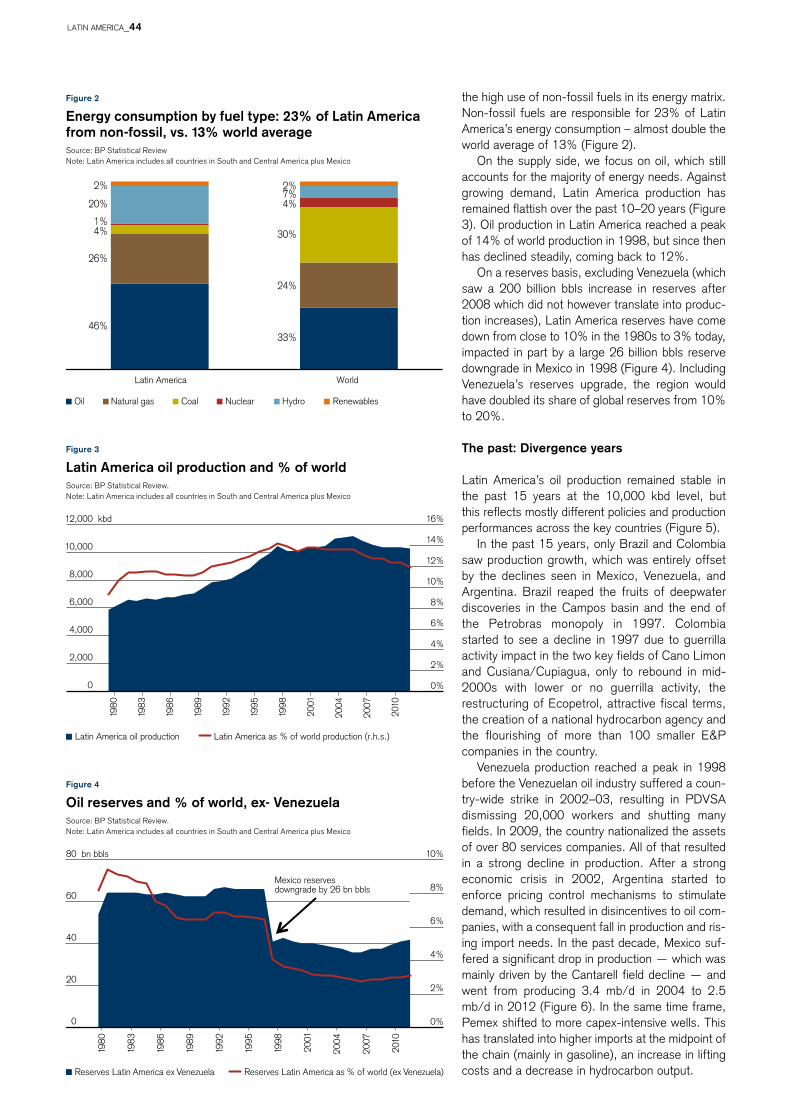
Figure 2
Energy consumption by fuel type: 23% of Latin America from non-fossil, vs. 13% world averagesource: Bp statistical Review note: latin america includes all countries in south and central america plus mexico
Figure 3
Latin America oil production and % of worldsource: Bp statistical Review. note: latin america includes all countries in south and central america plus mexico
Figure 4
Oil reserves and % of world, ex- Venezuelasource: Bp statistical Review. note: latin america includes all countries in south and central america plus mexico
the high use of non-fossil fuels in its energy matrix. non-fossil fuels are responsible for 23% of latin america’s energy consumption – almost double the world average of 13% (figure 2).
on the supply side, we focus on oil, which still accounts for the majority of energy needs. against growing demand, latin america production has remained flattish over the past 10–20 years (figure 3). oil production in latin america reached a peak of 14% of world production in 1998, but since then has declined steadily, coming back to 12%.
on a reserves basis, excluding venezuela (which saw a 200 billion bbls increase in reserves after 2008 which did not however translate into produc-tion increases), latin america reserves have come down from close to 10% in the 1980s to 3% today, impacted in part by a large 26 billion bbls reserve downgrade in mexico in 1998 (figure 4). including venezuela’s reserves upgrade, the region would have doubled its share of global reserves from 10% to 20%.
The past: Divergence years
latin america’s oil production remained stable in the past 15 years at the 10,000 kbd level, but this reflects mostly different policies and production performances across the key countries (figure 5).
in the past 15 years, only Brazil and colombia saw production growth, which was entirely offset by the declines seen in mexico, venezuela, and argentina. Brazil reaped the fruits of deepwater discoveries in the campos basin and the end of the petrobras monopoly in 1997. colombia started to see a decline in 1997 due to guerrilla activity impact in the two key fields of cano limon and cusiana/cupiagua, only to rebound in mid-2000s with lower or no guerrilla activity, the restructuring of ecopetrol, attractive fiscal terms, the creation of a national hydrocarbon agency and the flourishing of more than 100 smaller e&p companies in the country.
venezuela production reached a peak in 1998 before the venezuelan oil industry suffered a coun-try-wide strike in 2002–03, resulting in pDvsa dismissing 20,000 workers and shutting many fields. in 2009, the country nationalized the assets of over 80 services companies. all of that resulted in a strong decline in production. after a strong economic crisis in 2002, argentina started to enforce pricing control mechanisms to stimulate demand, which resulted in disincentives to oil com-panies, with a consequent fall in production and ris-ing import needs. in the past decade, mexico suf-fered a significant drop in production — which was mainly driven by the cantarell field decline — and went from producing 3.4 mb/d in 2004 to 2.5 mb/d in 2012 (figure 6). in the same time frame, pemex shifted to more capex-intensive wells. this has translated into higher imports at the midpoint of the chain (mainly in gasoline), an increase in lifting costs and a decrease in hydrocarbon output.
26%
46%
24%
33%
4% 30% 1%
4% 20% 7%
2% 2%
Latin America World
Oil Natural gas Coal Nuclear Hydro Renewables
1980
1983
1986
1989
1992
1995
1998
2001
2004
2007
2010
kbd
0%
2%
4%
6%
8%
10%
12%
14%
16%
0
2,000
4,000
6,000
8,000
10,000
12,000
Latin America oil production Latin America as % of world production (r.h.s.)
1980
1983
1986
1989
1992
1995
1998
2001
2004
2007
2010
Reserves Latin America ex Venezuela Reserves Latin America as % of world (ex Venezuela)
0%
2%
4%
6%
8%
10%
0
20
40
60
80 bn bbls
Mexico reserves downgrade by 26 bn bbls
latin ameRica_44
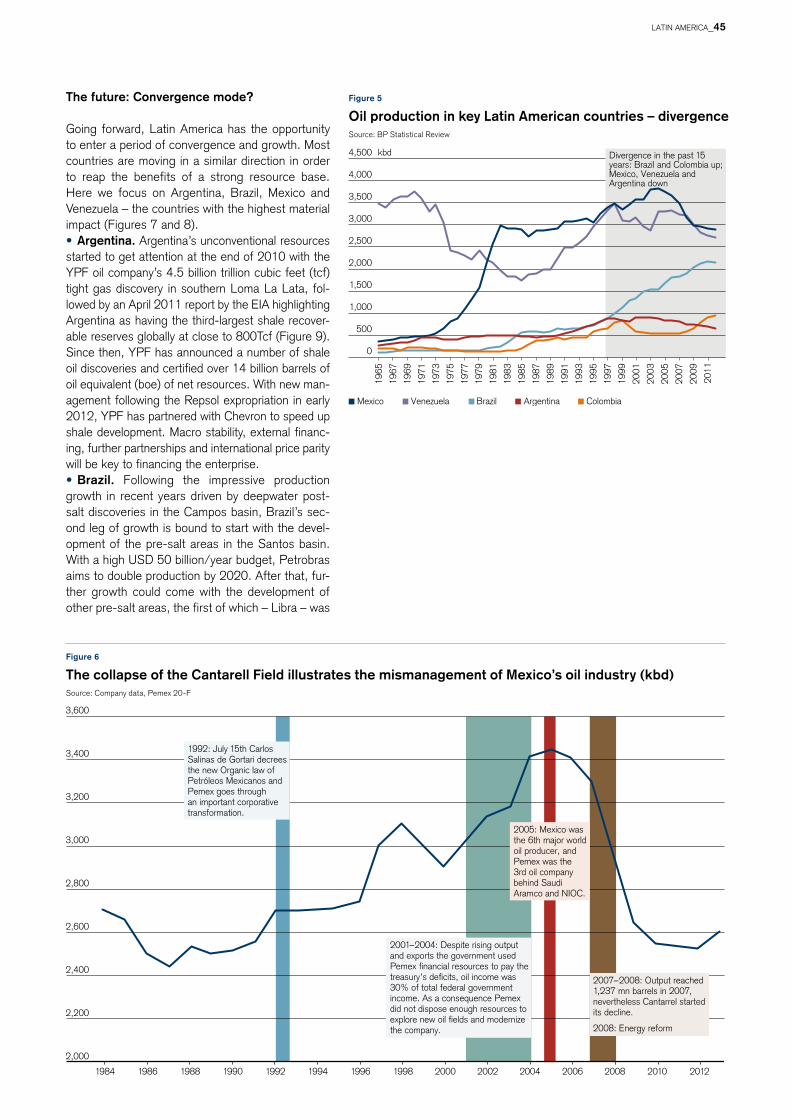
Figure 5
Oil production in key Latin American countries – divergencesource: Bp statistical Review
The future: Convergence mode?
going forward, latin america has the opportunity to enter a period of convergence and growth. most countries are moving in a similar direction in order to reap the benefits of a strong resource base. here we focus on argentina, Brazil, mexico and venezuela – the countries with the highest material impact (figures 7 and 8). • Argentina. argentina’s unconventional resources
started to get attention at the end of 2010 with the Ypf oil company’s 4.5 billion trillion cubic feet (tcf) tight gas discovery in southern loma la lata, fol-lowed by an april 2011 report by the eia highlighting argentina as having the third-largest shale recover-able reserves globally at close to 800tcf (figure 9). since then, Ypf has announced a number of shale oil discoveries and certified over 14 billion barrels of oil equivalent (boe) of net resources. With new man-agement following the Repsol expropriation in early 2012, Ypf has partnered with chevron to speed up shale development. macro stability, external financ-ing, further partnerships and international price parity will be key to financing the enterprise. • Brazil. following the impressive production
growth in recent years driven by deepwater post-salt discoveries in the campos basin, Brazil’s sec-ond leg of growth is bound to start with the devel-opment of the pre-salt areas in the santos basin. With a high UsD 50 billion/year budget, petrobras aims to double production by 2020. after that, fur-ther growth could come with the development of other pre-salt areas, the first of which – libra – was
Figure 6
The collapse of the Cantarell Field illustrates the mismanagement of Mexico’s oil industry (kbd)source: company data, pemex 20-f
0
500
1,000
1,500
2,000
2,500
3,000
3,500
4,000
4,500
1965
1967
1969
1971
1973
1975
1977
1979
1981
1983
1985
1987
1989
1991
1993
1995
1997
1999
2001
2003
2005
2007
2009
2011
kbd
Mexico BrazilVenezuela ColombiaArgentina
Divergence in the past 15 years: Brazil and Colombia up; Mexico, Venezuela and Argentina down
2,000
2,200
2,400
2,600
2,800
3,000
3,200
3,400
3,600
1984 1986 1988 1990 1992 1994 1996 1998 2000 2002 2004 2006 2008 2010 2012
1992: July 15th Carlos Salinas de Gortari decrees the new Organic law of Petróleos Mexicanos and Pemex goes through an important corporative transformation.
2001–2004: Despite rising output and exports the government used Pemex financial resources to pay the treasury’s deficits, oil income was 30% of total federal government income. As a consequence Pemex did not dispose enough resources to explore new oil fields and modernize the company.
2005: Mexico was the 6th major world oil producer, and Pemex was the 3rd oil company behind Saudi Aramco and NIOC.
2007–2008: Output reached 1,237 mn barrels in 2007, nevertheless Cantarrel started its decline.
2008: Energy reform
latin ameRica_45
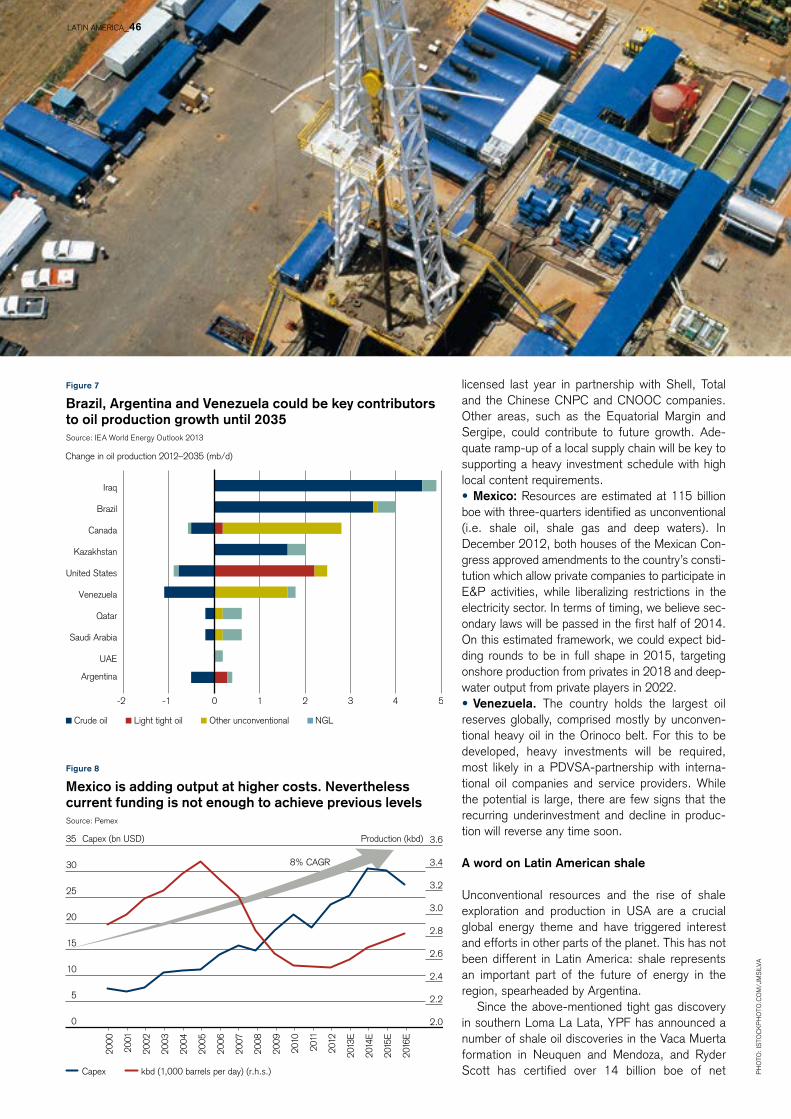
Figure 7
Brazil, Argentina and Venezuela could be key contributors to oil production growth until 2035source: iea World energy outlook 2013
Figure 8
Mexico is adding output at higher costs. Nevertheless current funding is not enough to achieve previous levelssource: pemex
licensed last year in partnership with shell, total and the chinese cnpc and cnooc companies. other areas, such as the equatorial margin and sergipe, could contribute to future growth. ade-quate ramp-up of a local supply chain will be key to supporting a heavy investment schedule with high local content requirements. • Mexico: Resources are estimated at 115 billion
boe with three-quarters identified as unconventional (i.e. shale oil, shale gas and deep waters). in December 2012, both houses of the mexican con-gress approved amendments to the country’s consti-tution which allow private companies to participate in e&p activities, while liberalizing restrictions in the electricity sector. in terms of timing, we believe sec-ondary laws will be passed in the first half of 2014. on this estimated framework, we could expect bid-ding rounds to be in full shape in 2015, targeting onshore production from privates in 2018 and deep-water output from private players in 2022. • Venezuela. the country holds the largest oil
reserves globally, comprised mostly by unconven-tional heavy oil in the orinoco belt. for this to be developed, heavy investments will be required, most likely in a pDvsa-partnership with interna-tional oil companies and service providers. While the potential is large, there are few signs that the recurring underinvestment and decline in produc-tion will reverse any time soon.
A word on Latin American shale
Unconventional resources and the rise of shale exploration and production in Usa are a crucial global energy theme and have triggered interest and efforts in other parts of the planet. this has not been different in latin america: shale represents an important part of the future of energy in the region, spearheaded by argentina.
since the above-mentioned tight gas discovery in southern loma la lata, Ypf has announced a number of shale oil discoveries in the vaca muerta formation in neuquen and mendoza, and Ryder scott has certified over 14 billion boe of net
-2 -1 0 1 2 3 4 5
Iraq
Brazil
Canada
Kazakhstan
United States
Venezuela
Qatar
Saudi Arabia
UAE
Argentina
Change in oil production 2012–2035 (mb/d)
Crude oil Light tight oil Other unconventional NGL
2.0
2.2
2.4
2.6
2.8
3.0
3.2
3.4
3.6
0
5
10
15
20
25
30
35
2000
2001
2002
2003
2004
2005
2006
2007
2008
2009
2010
2011
2012
2013
E 20
14E
2015
E 20
16E
Production (kbd)Capex (bn USD)
Capex kbd (1,000 barrels per day) (r.h.s.)
8% CAGR
ph
oto
: is
toc
kp
ho
to.c
om
/jm
sil
va
latin ameRica_46
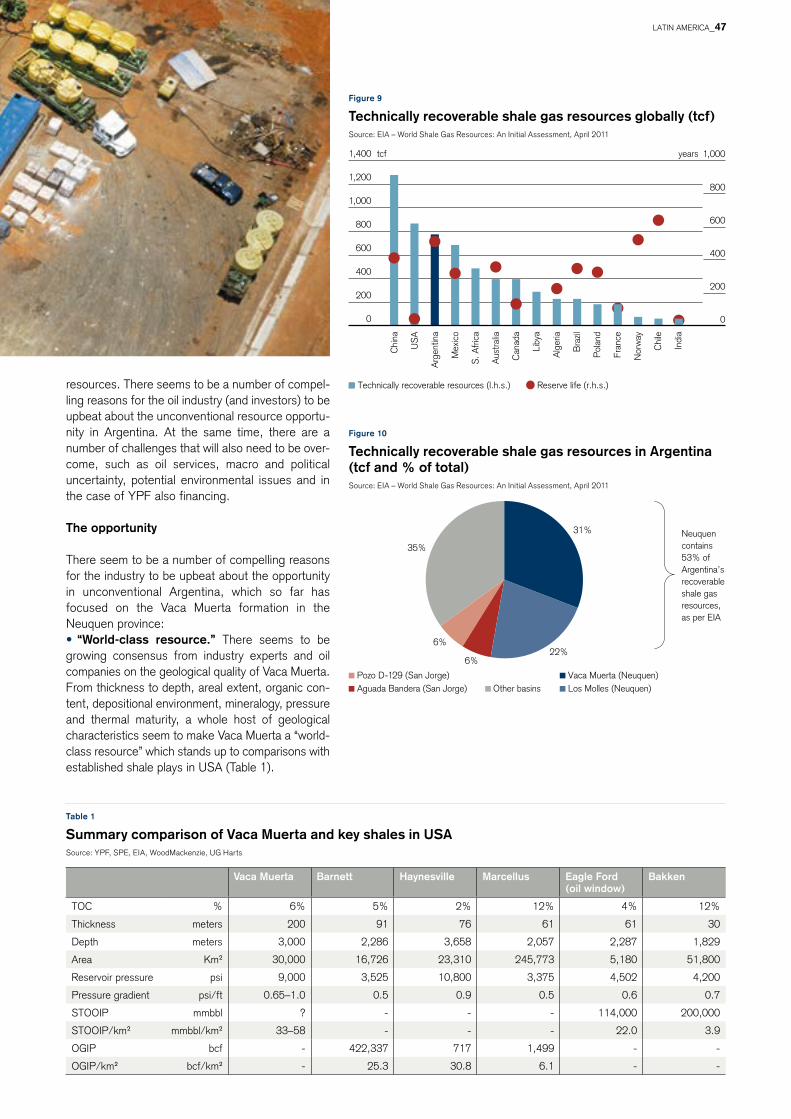
Figure 9
Technically recoverable shale gas resources globally (tcf)source: eia – World shale gas Resources: an initial assessment, april 2011
Figure 10
Technically recoverable shale gas resources in Argentina (tcf and % of total)source: eia – World shale gas Resources: an initial assessment, april 2011
Vaca Muerta Barnett Haynesville Marcellus Eagle Ford (oil window)
Bakken
toc % 6% 5% 2% 12% 4% 12%
thickness meters 200 91 76 61 61 30
Depth meters 3,000 2,286 3,658 2,057 2,287 1,829
area km2 30,000 16,726 23,310 245,773 5,180 51,800
Reservoir pressure psi 9,000 3,525 10,800 3,375 4,502 4,200
pressure gradient psi/ft 0.65–1.0 0.5 0.9 0.5 0.6 0.7
stooip mmbbl ? - - - 114,000 200,000
stooip/km2 mmbbl/km2 33–58 - - - 22.0 3.9
ogip bcf - 422,337 717 1,499 - -
ogip/km2 bcf/km2 - 25.3 30.8 6.1 - -
Technically recoverable resources (l.h.s.) Reserve life (r.h.s.)
0
200
400
600
800
1,000
0
200
400
600
800
1,000
1,200
1,400
Chi
na
US
A
Arg
entin
a
Mex
ico
S. A
frica
Aus
tralia
Can
ada
Liby
a
Alg
eria
Bra
zil
Pol
and
Fran
ce
Nor
way
Chi
le
Indi
a
yearstcf
31%
22% 6%
6%
35%
Vaca Muerta (Neuquen) Los Molles (Neuquen) Aguada Bandera (San Jorge)
Neuquen contains 53% of Argentina’s recoverable shale gas resources, as per EIA
Pozo D-129 (San Jorge) Other basins
Table 1
Summary comparison of Vaca Muerta and key shales in USAsource: Ypf, spe, eia, Woodmackenzie, Ug harts
resources. there seems to be a number of compel-ling reasons for the oil industry (and investors) to be upbeat about the unconventional resource opportu-nity in argentina. at the same time, there are a number of challenges that will also need to be over-come, such as oil services, macro and political uncertainty, potential environmental issues and in the case of Ypf also financing.
The opportunity
there seem to be a number of compelling reasons for the industry to be upbeat about the opportunity in unconventional argentina, which so far has focused on the vaca muerta formation in the neuquen province: • “World-class resource.” there seems to be
growing consensus from industry experts and oil companies on the geological quality of vaca muerta. from thickness to depth, areal extent, organic con-tent, depositional environment, mineralogy, pressure and thermal maturity, a whole host of geological characteristics seem to make vaca muerta a “world-class resource” which stands up to comparisons with established shale plays in Usa (table 1).
latin ameRica_47

latin ameRica_48
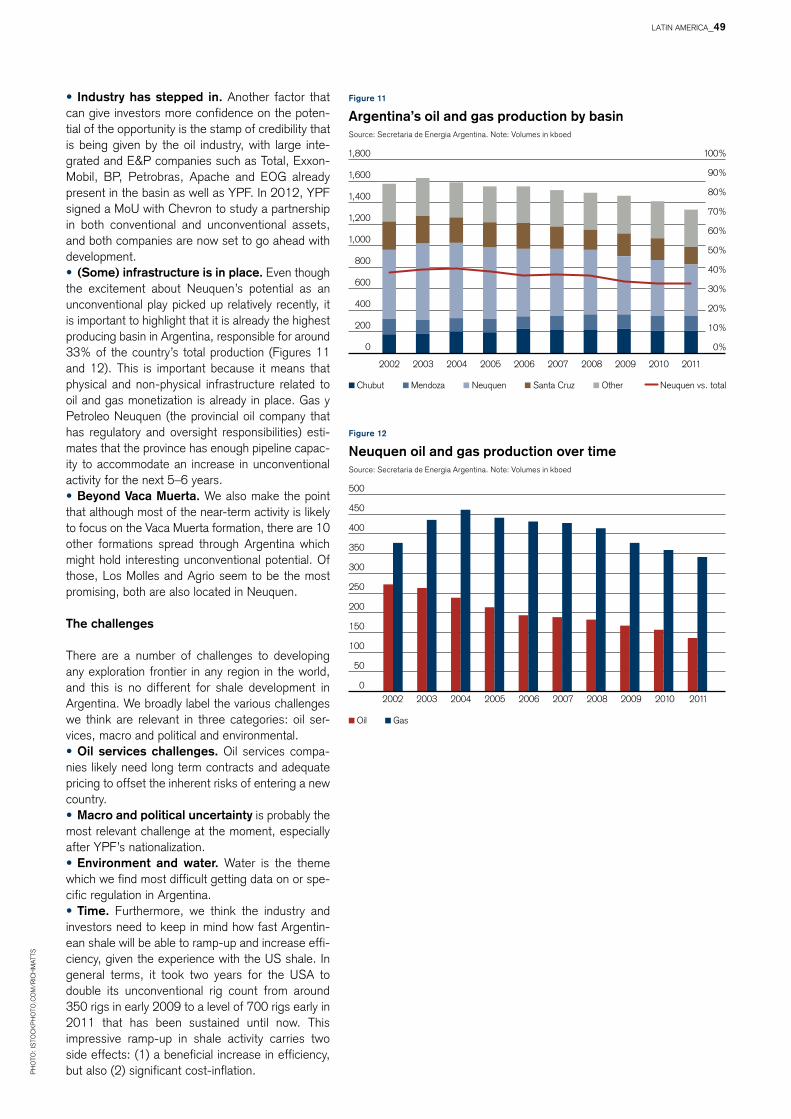
Figure 12
Neuquen oil and gas production over time source: secretaria de energia argentina. note: volumes in kboed
Figure 11
Argentina’s oil and gas production by basin source: secretaria de energia argentina. note: volumes in kboed
• Industry has stepped in. another factor that can give investors more confidence on the poten-tial of the opportunity is the stamp of credibility that is being given by the oil industry, with large inte-grated and e&p companies such as total, exxon-mobil, Bp, petrobras, apache and eog already present in the basin as well as Ypf. in 2012, Ypf signed a moU with chevron to study a partnership in both conventional and unconventional assets, and both companies are now set to go ahead with development. • (Some) infrastructure is in place. even though
the excitement about neuquen’s potential as an unconventional play picked up relatively recently, it is important to highlight that it is already the highest producing basin in argentina, responsible for around 33% of the country’s total production (figures 11 and 12). this is important because it means that physical and non-physical infrastructure related to oil and gas monetization is already in place. gas y petroleo neuquen (the provincial oil company that has regulatory and oversight responsibilities) esti-mates that the province has enough pipeline capac-ity to accommodate an increase in unconventional activity for the next 5–6 years. • Beyond Vaca Muerta. We also make the point
that although most of the near-term activity is likely to focus on the vaca muerta formation, there are 10 other formations spread through argentina which might hold interesting unconventional potential. of those, los molles and agrio seem to be the most promising, both are also located in neuquen.
The challenges
there are a number of challenges to developing any exploration frontier in any region in the world, and this is no different for shale development in argentina. We broadly label the various challenges we think are relevant in three categories: oil ser-vices, macro and political and environmental. • Oil services challenges. oil services compa-
nies likely need long term contracts and adequate pricing to offset the inherent risks of entering a new country. • Macro and political uncertainty is probably the
most relevant challenge at the moment, especially after Ypf’s nationalization. • Environment and water. Water is the theme
which we find most difficult getting data on or spe-cific regulation in argentina. • Time. furthermore, we think the industry and
investors need to keep in mind how fast argentin-ean shale will be able to ramp-up and increase effi-ciency, given the experience with the Us shale. in general terms, it took two years for the Usa to double its unconventional rig count from around 350 rigs in early 2009 to a level of 700 rigs early in 2011 that has been sustained until now. this impressive ramp-up in shale activity carries two side effects: (1) a beneficial increase in efficiency, but also (2) significant cost-inflation.
Chubut Mendoza Neuquen Santa Cruz Other Neuquen vs. total
1,800 100%
90%
80%
70%
60%
50%
40%
30%
20%
10%
0%
2002 2003 2004 2005 2006 2007 2008 2009 2010 2011
1,600
1,400
1,200
1,000
800
600
400
200
0
Oil Gas
500
450
400
350
300
250
200
150
100
50
02002 2003 2004 2005 2006 2007 2008 2009 2010 2011
ph
oto
: is
toc
kp
ho
to.c
om
/Ric
hm
atts
latin ameRica_49

latin ameRica_50

according to the United nations economic com-mission for latin america (eclac), latin ameri-ca’s average total investment in infrastructure amounted to around 2% of gDp in the last decade, less than half of the minimum required to sustain economic growth of 4.5% (table 1). to put things into perspective, china and india invested around 13% and around 5% of their gDp respectively.
How did we get here?
latin america’s inadequate investment in infrastruc-ture the last 20-30 years has been a consequence of several factors, including the lack of appropriate fiscal policy, an unstable macroeconomic backdrop and ultimately the absence of long-term planning. in the past, whenever governments faced constrained balance sheets, a choice between infrastructure investments and other social priorities such as edu-cation, healthcare and pension funding ended up precluding higher investments in infrastructure. according to a study published by the central Bank of chile, infrastructure investments in latin america declined by 0.8% of gDp when the region faced rising deficits.
While latin america’s public infrastructure invest-ments were jeopardized by the above-mentioned factors, private investments were also hampered by the poor regulatory framework and cumbersome environmental licensing process.
looking at the World economic forum ranking, almost all latin american countries suffered dete-rioration in their overall infrastructure (figure 1).
Infrastructure: The Achilles’ heelWhile latin america has been one of the most dynamic regions globally, offering interesting investment opportunities, its underinvestment in infrastructure puts the region at a disadvantage relative to other developing regions, namely asia pacific and eastern europe.
Figure 1
Ranking of quality of infrastructure (1 = best performer, 144 = worst performer); source: World economic forum, credit suisse Research
1993–2003 2003–2012 2013–2020
Brazil 2.19% 2.13% 4%–5%
mexico 1.49% 3.95% 5%–6%
colombia 3.10% 4.30% 8%–9%
peru 1.86% 2.54% 4%–5%
chile 4.80% 4.9% 5%–6%
Table 1
Major Latin American countries, infrastructure investments as % of GDPsource: World Bank, inter.B consultoria, credit suisse Research
BrazilChile ColombiaPeru ArgentinaMexico
20
30
40
50
60
70
80
90
100
110
120
2006 2007 2008 2009 2010 2011 2012 2013
ph
oto
: is
toc
kp
ho
to.c
om
/Ric
ag
Uia
R
latin ameRica_51
for the past five years, countries such as Brazil, chile, argentina and colombia have consistently witnessed a deterioration in modes of transporta-tion; this according to surveys such as the World economic forum annual rankings in infrastructure competitiveness. only mexico and peru have shown any improvement.
While infrastructure investments would have to run at around 4% of gDp in order to provide the latin american region a sustainable growth rate of 4.5% p.a., it is important to note that, given the limited investment profile in the past 20-30 years, infrastructure investments would have to be kept at a higher level for the next ten years in order to close the gap relative to more developed regions. according to a study by the United nations eco-nomic commission for latin america and the caribbean, the region would have to deploy 7.9% of its gDp in the medium term to meet the existing infrastructure demand and keep up with the growth of east asian countries.
Laying the plans to fix the problem
Recently, latin american countries have begun to address restrained economic growth by setting out long-term strategic plans to solve the lack of ade-quate infrastructure. historically, chile has been quite successful in attracting private investments. Brazil, mexico, peru, and colombia should all ben-efit from regulatory reforms implemented to boost private investments in infrastructure. • Brazil: the government is mindful of the massive
economic constraint created by infrastructure defi-ciency and seems highly focused on stimulating investments with strong private participation. in this sense, it has been (1) straightening the regulatory framework, (2) tackling the limited availability of pri-vate funding, (3) streamlining the environmental licensing process and (4) launching an aggressive pipeline of infrastructure auctions, amounting to BRl 334 billion in investment opportunities, includ-ing toll roads, railroads, ports, airports and urban mobility. this sizeable pipeline alone represents one third of the gap, but is six times higher than the BRl 52 billion auctioned in the last ten years. Brazil has a 16% asset-to-gDp ratio (infrastructure stock)
and is a global underperformer with highly depreci-ated assets. the average infrastructure stock ratio globally stands at around 70%. in order to narrow this gap, UsD 1 trillion in infrastructure investments would be required, half of which in transportation alone. according to the government, in the next five years, infrastructure investments in Brazil could shift from around 2.2% of gDp to twice as much, mostly driven by private investments. • Mexico: the mexican infrastructure plan for the
2013–2018 period proposes infrastructure expen-diture in the vicinity of 5.5%–6.0% of gDp, repre-senting a 33% increase from the 4.5% of gDp seen under the last administration. total investment in roads, ports and transportation for the entire six-year term was forecast by the new administra-tion to be approximately UsD 50 billion. toll roads expected to be built through private concessions are estimated to require some UsD 10 billion.
however, the plan has had a slow kick-off, which we expect to improve in 2014 starting with a 32% increase in the ministry of communications and transportation expenditure budget which cur-rently stands at mxn 114 billion (some UsD 9 bil-lion). out of 34 projects identified by sct for toll roads, only one project (siglo xxi highway) was tendered last year. three mass transit train systems in addition to the new mexico city airport are still under study and the funding for these projects has yet to be outlined. • Chile: according to the chilean government,
about UsD 14 billion should be deployed in the infrastructure sector in the short to medium term. the largest investments are targeted towards air-ports, ports, hospitals and railroads, to be devel-oped mostly by private players. after posting a decline in investment in 2001–2006, at 4.57% of gDp, chile reversed this scenario and invested around 5.1% between 2008 and 2011. since 2001, roughly 60% of expenditure has been car-ried out by the private sector, thanks to the coun-try’s strong regulatory framework. • Colombia: the national infrastructure agency
of colombia has announced potential investments of around 3% of gDp in 2012–2017, more than doubling the investments in transportation infra-structure seen in the last ten years, which stood in p
ho
to:
isto
ck
ph
oto
.co
m/p
ieR
ivB
latin ameRica_52

Figure 2
Fixed line telephony subscriptions per 100 people, by region (in %, 1976–2012)source: credit suisse with data from the World Bank, itU, and credit suisse estimates
Figure 3
Mobile subscriptions per 100 people, by region (in %, 1990–2012)source: credit suisse with data from the World Bank, itU, and credit suisse estimates
the vicinity of around 1%–1.5%. these should be deployed mostly in ports, highways and railroads. accordingly, colombia’s overall investment in infra-structure could reach 9%–10% of gDp, from around 6% currently. • Peru: the peruvian government has guided for
an UsD 88 billion investment in infrastructure over the next eight years, which we believe could repre-sent around 4%–6% of gDp in any given year. of the total investment, approximately 50% will be channeled to the transportation and communications sector. in the past ten years, peru’s investments in infrastructure have been modest, reaching just 2.5% of gDp. therefore the government is expected to provide incentives to prevent the infrastructure gap from widening. the country holds one of the most liberalized and modern regulation frameworks in the region, allowing for non-solicited projects to be brought forward by the private sector. the two most recent emblematic projects in lima (the javier prado urban highway and the viaexpress Bypass) were both non-solicited projects which were carried out as concessions to the private sector.
observing that latin american governments are mindful of the urgency of further infrastructure investments, there is a plethora of interesting proj-ects in the pipeline. Yet, the execution challenges cannot be understated as (1) some projects are still in the analysis stage and (2) the process for obtain-ing environmental licenses can be cumbersome. in this sense, public investments can take longer to materialize and in our view, an ultimate improve-ment in the countries’ infrastructure will not come through greater public investments in the sector but rather by promoting a friendlier environment to pri-vate investments, similar to what happened in chile and now is happening in Brazil and colombia.
a well balanced mix of (1) regulatory risk, (2) execution risk and (3) project return is key to witness greater expenditure in infrastructure. therefore, we attribute a greater probability to toll roads, urban mobility (subways, bus rapid transit and light train vehicles) and airport projects as potential sectors to experience material infrastruc-ture improvements.
Connectivity: Data penetration and internet
another important piece of the infrastructure puzzle is related to telecom and data networks, where higher levels of data penetration have been shown to boost productivity and income growth across econo-mies. We characterize the past ten years as the “post-privatization” era for latin american telecom markets. most countries sold government control of their incumbent operators to private ownership in the 1990s. this process of transfer culminated with the privatization of the telebras system in Brazil in 1998. the objective of privatization was to attract private capital to achieve universal access and improve the quality of telecom services to a degree that cash-strapped government operators could not.
0%
10%
20%
30%
40%
50%
60%
70%
1976 1980 1984 1988 1992 1996 2000 2004 2008 2012
East Asia & Pacific
Latin America & Caribbean
North America Europe & Central Asia
World
East Asia & Pacific
Latin America & Caribbean
North America Europe & Central Asia
World
0%
20%
40%
60%
80%
100%
120%
140%
1990 1992 1994 1996 1998 2000 2002 2004 2006 2008 2010 2012
latin ameRica_53

Figure 5
Internet users per 100 people, by region (in %, 1990–2012)source: credit suisse with data from the World Bank
Figure 4
PCs in use per 100 people, by region (in %, 1996–2012)source: credit suisse with data from euromonitor, the World Bank and credit suisse estimates
We believe that the goal of universal access to voice services has largely been accomplished. somewhat surprisingly, mobile telephony played the key role in meeting these goals. after an initial post-privatization boost to fixed telephony, the pen-etration of fixed voice lines has stagnated at only about 20% (lines/population) for the past five years (figure 2). in more mature markets (e.g., chile), fixed line penetration has actually started to decline (cord-cutting).
on the other hand, the universalization of mobile services has been surprisingly rapid over this period. We attribute the astonishing growth in wire-less to increased competition, rising income levels (particularly in the middle class), declining handsets prices, calling party pays billing, and a proliferation of sim-card only sales. in 2002, mobile penetration was only about 20% in the region (lines/popula-tion). it increased to an impressive level of 109% by the end of 2012 (figure 3). Wireless penetra-tion in latin america now exceeds levels in the Usa and has approached european levels.
the slowdown in new wireless subscribers over the past year suggests that the “heavy lifting” of voice universalization is coming to an end. in the future, operators are likely to shift attention to driving higher usage from existing subscribers (minutes of use) and converting prepaid subscribers to postpaid (more consistent revenue stream). But with market maturity ever nearer, we believe the priority for the next decade shifts to increasing access to internet / data services. this is likely to be the priority both from a policy perspective (government) and market opportunity point of view (telecom companies).
Challenge ahead: Internet and the development of data networks
in contrast to the rapid adoption of mobile telephony, latin american countries still lag developed markets in rates of internet access and usage (figures 4, 5, 7 and 8). in latin america, 43% of the population tallied as internet users in 2012. this figure exceeded the world average of 36%, but was way behind the european and north american averages of 63% and 82% respectively. We consider this a negative externality of many consumers having “leapfrogged” fixed voice connections for wireless voice connections. low fixed penetration, limited coverage of cable networks and lagging personal computer penetration (affordability) are other factors that have restrained internet penetration.
private investment in telecom services has recov-ered over the past decade from the very depressed level of 2003, when the argentinean default and Brazil’s post-election financial crisis pulled invest-ment down to a paltry UsD 7 billion. investment has averaged closer to UsD 20 billion per year in most recent years (figure 6). more than half of the UsD 22 billion invested in the region in 2011 was directed towards Brazil, while seven of every ten dollars invested went to Brazil and mexico.
East Asia & Pacific
Latin America & Caribbean
North America Europe & Central Asia
World
20%
0%
40%
60%
80%
100%
1996 1998 2000 2002 2004 2006 2008 2010 2012
East Asia & Pacific
Latin America & Caribbean
North America Europe & Central Asia
World
0%
10%
20%
30%
40%
50%
60%
70%
80%
90%
1990 1992 1994 1996 1998 2000 2002 2004 2006 2008 2010 2012
ph
oto
: is
toc
kp
ho
to.c
om
/alU
xU
m
latin ameRica_54

Figure 6
Latin America and the Caribbean – investment in telecoms with private participation (current USD in billions, 1996–2011)source: credit suisse with data from the World Bank
0
5
10
15
20
25
30
35
40 bn USD
1996 1997 1998 1999 2000 2001 2002 2003 2004 2005 2006 2007 2008 2009 2010 2011
Others Chile Peru Colombia Argentina Mexico Brazil
latin ameRica_55

We believe current levels of investment are suffi-cient to maintain a gradual increase in the base of broadband access, but our estimates suggest latin american internet penetration rates would still not catch up to developed market rates in the next five years at current investment levels. government officials in several main latin american markets have indicated that they consider current invest-ment levels. to be inadequate and would like to see more rapid digital inclusion via higher levels of broadband penetration.
as was the case with voice services, we believe most of the onus is likely to fall upon mobile tech-nologies. We estimate 3g devices make up 20%–25% of the total mobile base in latin amer-ica, a proportion that should continue to rise at a healthy rate due to the handset replacement cycle and lower handset price points.
at the same time, governments have moved to make the 4g spectrum available to clear the way for lte services. these auctions have taken place in the higher frequency bands (generally 2.5 ghz) that are considered less attractive by the operators, but we have seen moves from several governments (such as Brazil and chile) to make a more attractive spectrum available. an increasing supply of 4g ser-vices / spectrums / devices is likely to be an impor-tant driver of wireless data. one crucial difference between the investments in voice mobility over the past decade and the future investments in data mobility is the strain that data traffic places on the transport capacity of fixed networks (both long haul and backhaul).
at this point, we believe the jury is still out as to how governments can provide the necessary incen-tives for more rapid broadband deployment and associated investments in transport capacity. on the one hand, governments may leave market incentives in place and allow these investments to be made according to market forces with oversight from a semi-autonomous regulator. this would be consistent with the model that has succeeded for voice mobility over the past decade. in this case, the winners would be companies that have invested the most aggressively in high capacity data net-works, both long haul and metropolitan fiber.
on the other hand, we have seen increasing sig-nals that governments intend to take a more active role in pushing broadband penetration at a faster rate. some of these signals include (1) the re-cap-italization of telebras in Brazil to increase data line and satellite capacity, (2) the mexican govern-ment’s plan to utilize a 700 mhz spectrum to oper-ate an “open access” wireless network, as foreseen in the constitutional reform, and (3) the argentin-ean government’s unwillingness to award the 3g spectrum to existing private sector players in favor of retaining it for a government operator. these decisions, made on a country-by-country basis, are likely to have an important bearing on the market opportunity and returns on investment for existing private sector operators.
Figure 7
Mobile data and internet traffic by region (in petabytes per month, 2011–2017E)source: credit suisse with data from cisco vni
Figure 8
Global consumer internet video traffic by region (in petabytes per month, 2011–2017E)source: credit suisse with data from cisco vni
1,000
0
2,000
3,000
4,000
5,000
6,000 petabytes per month
2011 2012 2013E 2014E 2015E 2016E 2017E
Latin America Central & Eastern Europe
Asia Pacific North America Western Europe
Middle East & Africa
Latin America Central & Eastern Europe
Asia Pacific North America Western Europe
petabytes per month
2011 2012 2013E 2014E 2015E 2016E 2017E
Middle East & Africa
5,000
0
10,000
15,000
20,000
25,000
ph
oto
: is
toc
kp
ho
to.c
om
/gR
afi
ss
imo
latin ameRica_56


Also published by the Research Institute
Emerging Consumer Survey 2012january 2012
Asian FamilyBusinesses Report 2011october 2011
From Springto Revivalnovember 2011
Investing for impactjanuary 2012
Global WealthReport 2011october 2011
Family businesses:Sustaining performanceseptember 2012
Opportunities in an urbanizing worldapril 2012
Gender diversity and corporate performanceaugust 2012
Global Wealth Report 2012october 2012
Credit Suisse Global Investment Returns Yearbook 2012january 2012
The shale revolutionDecember 2012
Emerging Consumer Survey 2013 january 2013
Credit Suisse Global Investment Returns Yearbook 2013february 2013
SugarConsumption at a crossroadsseptember 2013
Global WealthReport 2013october 2013
latin ameRica_58
latin ameRica_59
General disclaimer / Important informationthis document was produced by and the opinions expressed are those of credit suisse as of the date of writing and are subject to change. it has been prepared solely for information purposes and for the use of the recipient. it does not constitute an offer or an invitation by or on behalf of credit suisse to any person to buy or sell any security. nothing in this material constitutes investment, legal, accounting or tax advice, or a representation that any investment or strategy is suitable or appropriate to your individual circumstances, or otherwise constitutes a personal recommendation to you. the price and value of investments mentioned and any income that might accrue may fluctuate and may fall or rise. any reference to past performance is not a guide to the future.the information and analysis contained in this publication have been compiled or arrived at from sources believed to be reliable but credit suisse does not make any representation as to their accuracy or completeness and does not accept liability for any loss arising from the use hereof. a credit suisse group company may have acted upon the information and analysis contained in this publication before being made available to clients of credit suisse. investments in emerging markets are speculative and considerably more volatile than investments in established markets. some of the main risks are political risks, economic risks, credit risks, currency risks and market risks. investments in foreign currencies are subject to exchange rate fluctuations. Before entering into any transaction, you should consider the suitability of the transaction to your particular circumstances and independently review (with your professional advisers as necessary) the specific financial risks as well as legal, regulatory, credit, tax and accounting consequences. this document is issued and distributed in the United states by credit suisse securities (Usa) llc, a U.s. registered broker-dealer; in canada by credit suisse securities (canada), inc.; and in Brazil by Banco de investimentos credit suisse (Brasil) s.a.this document is distributed in switzerland by credit suisse ag, a swiss bank. credit suisse is authorized and regulated by the swiss financial market supervisory authority (finma). this document is issued and distributed in europe (except switzerland) by credit suisse (Uk) limited and credit suisse securities (europe) limited. credit suisse securities (europe) limited and credit suisse (Uk) limited, both authorized by the prudential Regulation authority and regulated by the financial conduct authority and the prudential Regulation authority, are associated but independent legal entities within credit suisse. the protections made available by the financial conduct authority and/or the prudential Regulation authority for retail clients do not apply to investments or services provided by a person outside the Uk, nor will the financial services compensation scheme be available if the issuer of the investment fails to meet its obligations. this document is distributed in guernsey by credit suisse (channel islands) limited, an independent legal entity registered in guernsey under 15197, with its registered address at helvetia court, les echelons, south esplanade, st peter port, guernsey. credit suisse (channel islands) limited is wholly owned by credit suisse ag and is regulated by the guernsey financial services commission. copies of the latest audited accounts are available on request. this document is distributed in jersey by credit suisse (channel islands) limited, jersey Branch, which is regulated by the jersey financial services commission. the business address of credit suisse (channel islands) limited, jersey Branch, in jersey is: tradeWind house, 22 esplanade, st helier, jersey je2 3Qa. this document has been issued in asia-pacific by whichever of the following is the appropriately authorised entity of the relevant jurisdiction: in hong kong by credit suisse (hong kong) limited, a corporation licensed with the hong kong securities and futures commission or credit suisse hong kong branch, an authorized institution regulated by the hong kong monetary authority and a Registered institution regulated by the securities and futures ordinance (chapter 571 of the laws of hong kong); in japan by credit suisse securities (japan) limited; elsewhere in asia/pacific by whichever of the following is the appropriately authorized entity in the relevant jurisdiction: credit suisse equities (australia) limited, credit suisse securities (thailand) limited, credit suisse securities (malaysia) sdn Bhd, Credit Suisse AG, Singapore Branch, and elsewhere in the world by the relevant authorized affiliate of the above.this document may not be reproduced either in whole, or in part, without the written permission of the authors and credit suisse. © 2014 credit suisse group ag and/or its affiliates. all rights reserved
PUBLISHERCREDIT SUISSE AGResearch instituteparadeplatz 8ch-8070 Zurichswitzerland
PRODUCTION MANAGEMENTINVESTMENT STRATEGY & RESEARCH INVESTMENT PUBLISHINGmarkus kleeb (head)Ross hewittkatharina schlatter
AUTHORSandrew campbellalonso cerveraantonios koutsoukisemerson leitestefano natellanilson teixeira
EDITORIAL DEADLINE7 january 2014
ADDITIONAL COPIESadditional copies of this publication can be ordered via the credit suisse publication shop www.credit-suisse.com/publications or via your customer advisor.
Imprint

Rc
e 1
5458
04
02/2
014
CREDIT SUISSE AGResearch instituteparadeplatz 8ch-8070 Zurichswitzerland
[email protected]/researchinstitute