Embed Size (px)
Citation preview
The Costs of Road Injuries in Latin America 2013 Kavi Bhalla,PhD Johns Hopkins University International Injury Research Unit. with the collaboration of Esteban Diez-Roux, Alejandro Taddia, Sissi De La Peña Mendoza, Andrés Pereyra. Inter-American Development Bank
October 2013
Inter-American Development Bank IDB Road Safety Strategy INE/TSP TECHNICAL NOTES N°. IDB-TN-597

The Costs of Road Injuries in
Latin America 2013
Kavi Bhalla, PhD Assistant Professor
Leon Robertson Faculty Development Chair Johns Hopkins International Injury Research Unit
Department of International Health Johns Hopkins Bloomberg School of Public Health
with the collaboration of
Esteban Diez-Roux Alejandro Taddia
Sissi De La Peña Mendoza Andrés Pereyra
Inter-American Development Bank
Inter-American Development Bank 2013
The opinions expressed in this publication are those of the authors and do not necessarily reflect the views of the Inter-American Development Bank, its Board of Directors, or the countries they represent.
The unauthorized commercial use of Bank documents is prohibited and may be punishable under the Bank’s policies and/or applicable laws.
Copyright © 2013 Inter-American Development Bank. All rights reserved; may be freely reproduced for any non-commercial purpose.
Cataloguing-in-Publication data provided by the Inter-American Development Bank Felipe Herrera Library
Bhalla, Kavi The costs of road injuries in Latin America 2013 /Kavi Bhalla with the collaboration of Esteban Diez-Roux, Alejandro Taddia, Sissi De La Peña Mendoza, Andres Pereyra.
p. cm. — (IDB Technical Note ; 597)
Includes bibliographical references. 1. Crash injuries—Research. 2. Crash injuries—Cost. 3. Crash injuries—Economic aspects—Latin America. 4. Traffic accidents—Economic aspects—Latin America. 5. Traffic accidents—Colombia—Statistics. 6. Crash injuries—Colombia—Statistics. I. Esteban Diez-Roux II. Taddia, Alejandro Pablo. III. De La Peña Mendoza, Sissi Maribel. IV. Luz, Andres Pereyra da. V. Inter-American Development Bank. Transport Division. VI. Title. VII. Series. Clasification JEL Code: R4, R40, R41, R48, R49, R5, R50, R51, R52, R58.
About this project This analysis of the economic burden of road injuries in Latin America was funded by a grant from the Inter American Development Bank to Harvard University. Dr Kavi Bhalla, PhD, was the Principal Investigator. The analysis was done in close collaborations with Dr Maria Isabel Gutierrez-Martinez and Mr Francisco Javier Bonilla-Escobar, Cisalva Institute, Universidad del Valle, Cali, Colombia, and Dr Ramiro Guerrero Carvajal, Proesa, Universidad Icesi, Cali, Colombia.
Acknowledgements The following experts provided advice and suggestions at various stages of this project: Professor Joshua Salomon, Harvard School of Public Health, Professor David Bloom, Harvard University, Dr Ted Miller, Pacific Institute for Research and Evaluation, Professor James Harrison, Flinders University (Australia), Ms Dorothy Romanus, PhD student, Health Policy, Harvard University, Dr Natalie Carvalho, PhD student, Health Policy, Harvard University, and Ms Kidist Bartolomeos, WHO-Geneva.
IDB-TN-597 Contact IDB: [email protected], [email protected] 1300 New York Ave, NW, Washington DC, USA 20577
4
TABLE OF CONTENTS
EXECUTIVE SUMMARY ................................................................................................. 7
1.0 INTRODUCTION ...................................................................................................... 9
2.0 REVIEW OF HEALTH COSTING METHODS .............................................................. 11 COST-‐OF-‐ILLNESS METHOD ................................................................................................. 11 WILLINGNESS TO PAY METHOD ............................................................................................ 12 MACROECONOMIC GROWTH MODELS ................................................................................... 13
3.0 METHODS AND DATA SOURCES ............................................................................ 18 ESTIMATING INCIDENCE OF ROAD INJURIES IN COLOMBIA .......................................................... 18 ESTIMATING COSTS OF ROAD INJURIES IN COLOMBIA ................................................................ 19
WILLINGNESS-‐TO-‐PAY AND VALUE OF A STATISTICAL LIFE YEAR METHODS ......................................... 19 LABOR LOSSES ................................................................................................................ 21 MEDICAL EXPENSES .......................................................................................................... 21 FUNERAL COSTS .............................................................................................................. 22 PROPERTY DAMAGE ......................................................................................................... 22 ADMINISTRATIVE COSTS ..................................................................................................... 23
4.0 RESULTS ............................................................................................................... 24 PUBLIC HEALTH BURDEN OF ROAD INJURIES IN COLOMBIA ......................................................... 24 ESTIMATES OF COSTS OF ROAD INJURIES IN COLOMBIA .............................................................. 36
METHODS BASED ON VALUATION OF STATISTICAL LIFE YEARS ........................................................ 36 METHODS BASED ON COST-‐OF-‐ILLNESS ................................................................................... 39 COMPARISONS OF COST-‐OF-‐ILLNESS AND VSLY METHODS ............................................................. 42 COST OF ROAD INJURIES IN ARGENTINA, MEXICO, AND PARAGUAY .................................................. 43
5.0 DISCUSSION ......................................................................................................... 48 IMPLICATIONS OF FINDINGS .................................................................................................. 48 RECOMMENDATIONS FOR FUTURE WORK ON COSTING IN LATIN AMERICA .................................... 50
REFERENCES ............................................................................................................... 53
APPENDIX 1 ............................................................................................................... 56 APPENDIX 1A. LITERATURE REVIEW: COUNTRY AND CROSS-‐COUNTRY COSTING STUDIES .................. 56 APPENDIX 1B. LITERATURE REVIEW: GUIDELINES, MANUALS, AND REVIEW PAPERS DESCRIBING BEST PRACTICES ........................................................................................................................ 60 APPENDIX 1C. LITERATURE REVIEW: RELEVANT WILLINGNESS TO PAY LITERATURE .......................... 61

5
TABLES
Table 2.1 Selected sample of studies from the health costing literature ......................... 13 Table 3.2 Unit cost estimates used in our cost-‐of-‐illness analysis .................................... 22 Table 4.1: Leading causes of deaths among different age groups in Colombia in 2010 ... 24 Table 4.2 Leading causes of premature death (years of life lost) among different age
groups in Colombia in 2010 ...................................................................................... 25 Table 4.3 Leading causes of healthy life lost (disability adjusted life years) among
different age groups in Colombia in 2010 ................................................................ 25 Table 4.4 Road injury deaths and non-‐fatal injuries warranting formal medical care
disaggregated by sex and age groups in Colombia in 2010. ..................................... 29 Table 4.5 Road deaths and the burden of non-‐fatal injuries by type of road user in
Colombia in 2010. ..................................................................................................... 32 Table 4.6 Costs (millions of US$, current prices) of road crashes in Colombia in 2010
using various implementations of methods based on value of a statistical life year. .................................................................................................................................. 37
Table 4.7 Various aspects of costs (millions of US$, current prices) of road crashes in Colombia in 2010 using the cost-‐of-‐illness method. ................................................ 40

6
FIGURES
Figure 4.2 Age-‐ and sex-‐ distribution of road injury deaths, (a), non-‐fatal road injuries warranting hospitalization, (b), and non-‐fatal road injuries warranting outpatient care, (c), in Colombia in 2010. .................................................................................. 30
Figure 4.3 Age-‐ and sex-‐ distribution of road injury death rates, (a), rate of non-‐fatal road injuries warranting hospitalization, (b), and rate of non-‐fatal road injuries warranting outpatient care, (c), per 100 000 population in Colombia in 2010. ....... 31
Figure 4.4 Road user distributions of road traffic deaths, (a), Years of Life Lost, (b), Years Lived with Disability, and Disability Adjusted Life Years Lost in Colombia in 2010. . 33
Figure 4.5 Age-‐ and sex-‐ distributions of Years of Life Lost, (a), Years Lived with Disability, (b), and Disability Adjusted Life Years Lost, (c), to road injuries in Colombia in 2010. .................................................................................................................................. 34
Figure 4.6 Age-‐ and sex-‐ distribution of the rate (per 100 000 population) of Years of Life Lost, (a), Years Lived with Disability, (b), and Disability Adjusted Life Years Lost, (c), to road injuries in Colombia in 2010. ....................................................................... 35
Figure 4.7 Age-‐ and sex-‐ distributions of costs (millions of US$, current prices) of road crashes in Colombia in 2010 using various implementations of five methods based on value of a statistical life year. .............................................................................. 38
Figure 4.8 Age-‐ and sex-‐ distributions of various aspects of costs (millions of US$, current prices) of road crashes in Colombia in 2010 using cost-‐of-‐illness method. .............. 41
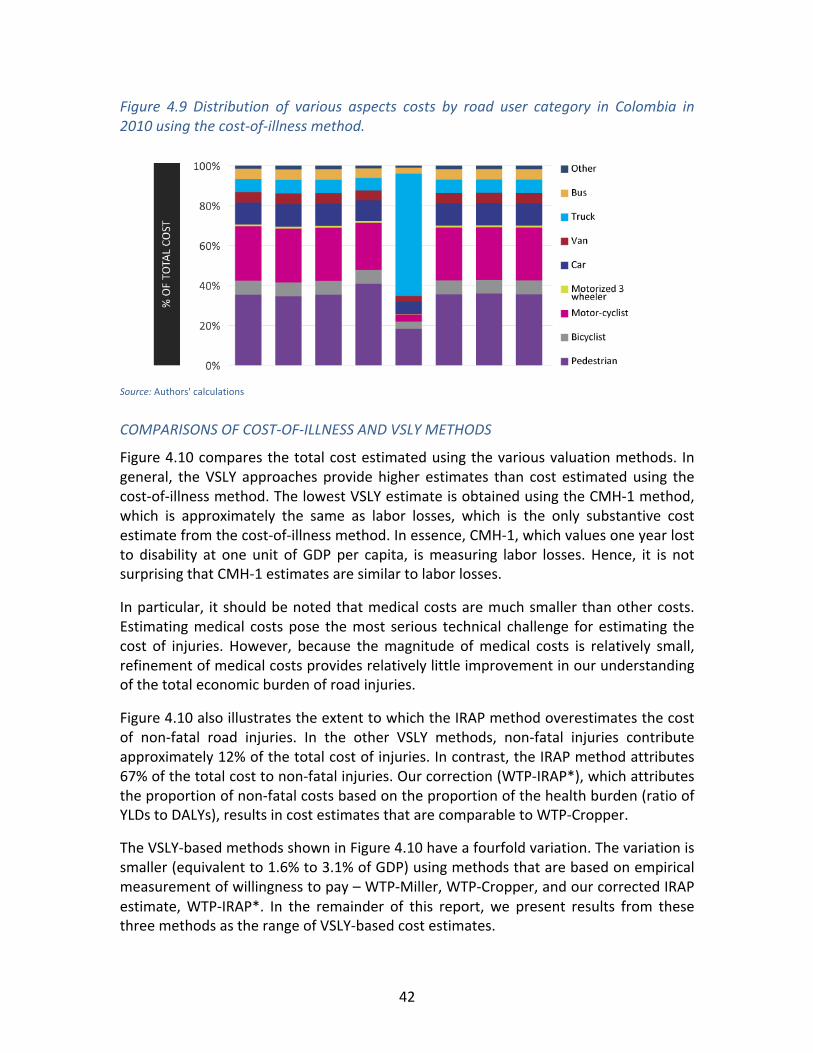
Figure 4.9 Distribution of various aspects costs by road user category in Colombia in 2010 using the cost-‐of-‐illness method. .................................................................... 42
Figure 4.10 Comparison of estimates of costs of road injuries in Colombia in 2010 using various costing methods. .......................................................................................... 43
Figure 4.11 Total cost of road injuries, (a), and road-‐user distribution (b), in Argentina in 2010 using VSLY-‐based methods. Cost is in millions of US$, current prices. Road-‐user break down of costs is shown for the VSLY-‐Cropper method. ......................... 44
Figure 4.12 Total cost of road injuries, (a), and road-‐user distribution (b), in Mexico in 2010 using VSLY-‐based methods. Cost is in millions of US$, current prices. Road-‐user break down of costs is shown for the VSLY-‐Cropper method. ......................... 45
Figure 4.13 Total cost of road injuries, (a), and road-‐user distribution (b), in Paraguay in 2010 using VSLY-‐based methods. Cost is in millions of US$, current prices. Road-‐user break down of costs is shown for the VSLY-‐Cropper method. ......................... 46
Figure 4.14 Total cost of road injuries in Argentina, Colombia, Mexico, and Paraguay, shown in units of national GDP. ............................................................................... 47
7
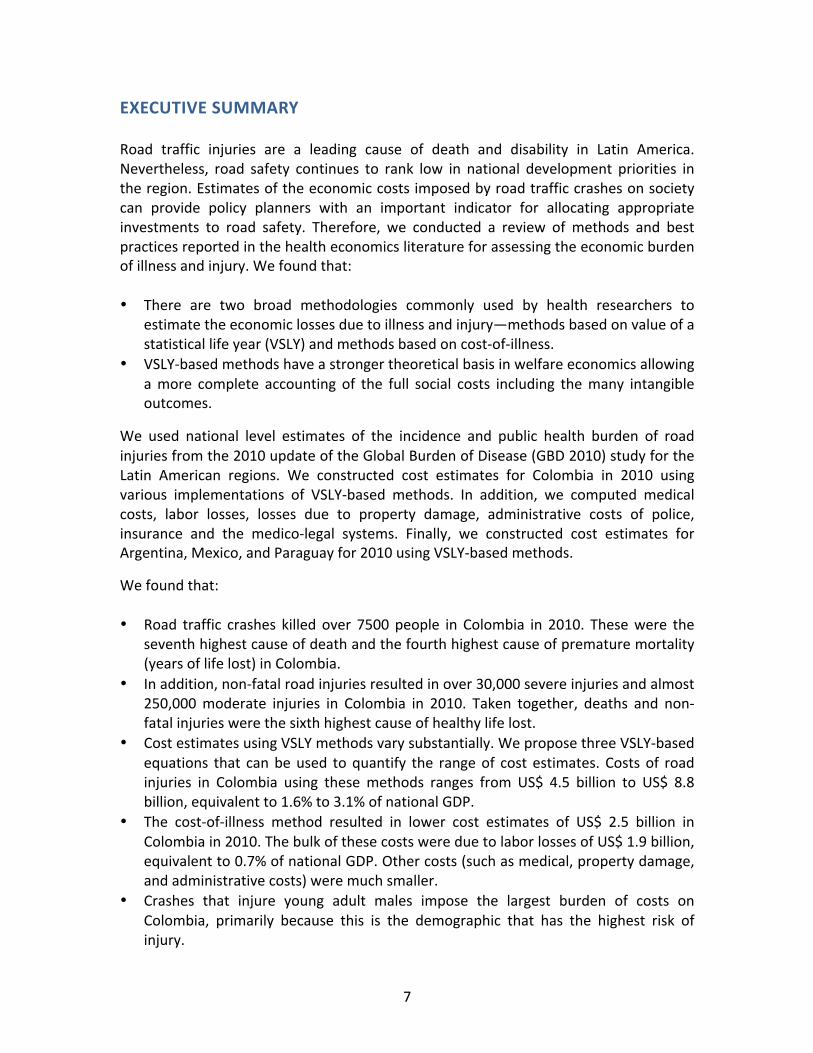
EXECUTIVE SUMMARY
Road traffic injuries are a leading cause of death and disability in Latin America. Nevertheless, road safety continues to rank low in national development priorities in the region. Estimates of the economic costs imposed by road traffic crashes on society can provide policy planners with an important indicator for allocating appropriate investments to road safety. Therefore, we conducted a review of methods and best practices reported in the health economics literature for assessing the economic burden of illness and injury. We found that:
• There are two broad methodologies commonly used by health researchers to estimate the economic losses due to illness and injury—methods based on value of a statistical life year (VSLY) and methods based on cost-‐of-‐illness.
• VSLY-‐based methods have a stronger theoretical basis in welfare economics allowing a more complete accounting of the full social costs including the many intangible outcomes.
We used national level estimates of the incidence and public health burden of road injuries from the 2010 update of the Global Burden of Disease (GBD 2010) study for the Latin American regions. We constructed cost estimates for Colombia in 2010 using various implementations of VSLY-‐based methods. In addition, we computed medical costs, labor losses, losses due to property damage, administrative costs of police, insurance and the medico-‐legal systems. Finally, we constructed cost estimates for Argentina, Mexico, and Paraguay for 2010 using VSLY-‐based methods.
We found that:
• Road traffic crashes killed over 7500 people in Colombia in 2010. These were the seventh highest cause of death and the fourth highest cause of premature mortality (years of life lost) in Colombia.
• In addition, non-‐fatal road injuries resulted in over 30,000 severe injuries and almost 250,000 moderate injuries in Colombia in 2010. Taken together, deaths and non-‐fatal injuries were the sixth highest cause of healthy life lost.
• Cost estimates using VSLY methods vary substantially. We propose three VSLY-‐based equations that can be used to quantify the range of cost estimates. Costs of road injuries in Colombia using these methods ranges from US$ 4.5 billion to US$ 8.8 billion, equivalent to 1.6% to 3.1% of national GDP.
• The cost-‐of-‐illness method resulted in lower cost estimates of US$ 2.5 billion in Colombia in 2010. The bulk of these costs were due to labor losses of US$ 1.9 billion, equivalent to 0.7% of national GDP. Other costs (such as medical, property damage, and administrative costs) were much smaller.
• Crashes that injure young adult males impose the largest burden of costs on Colombia, primarily because this is the demographic that has the highest risk of injury.
8
• We show that road crashes impose a substantial economic burden on society, with economic losses equivalent to between 1.5% to 2.9% of national GDP in Argentina, 1.8% to 3.5% in Mexico, and 2.0% to 3.9% in Paraguay.
We recommend VSLY-‐based methods for cross-‐national analysis because of their stronger theoretical foundation, comparability of results, and ease of analysis. However, cost-‐of-‐illness methods may be valuable for national analysis because they allow partitioning costs into clear categories (such as medical costs, labor losses, loss of infrastructure capacity) that are easy to interpret and can be useful inputs in national policy dialogue.
The large economic losses associated with road crashes suggest an immediate need to strengthen the capacity of institutions in Latin America and the Caribbean to improve road safety and implement the recommendations of the United Nations Decade of Action for Road Safety. Countries need to invest in safer highway infrastructure, implement regulatory vehicular safety standards, develop trauma care systems, improve enforcement of road safety laws and education to encourage safe road use.

9
1.0 INTRODUCTION
Road safety ranks low in national and regional priorities for development in Latin America even though the social costs of road traffic crashes have been well known for a long time. As early as 1996, the Global Burden of Disease (GBD) project had identified road traffic crashes as one of the leading causes of mortality and morbidity in the region (Murray and Lopez, 1996). In 2010, road traffic crashes accounted for over 100,000 deaths in Latin America and the Caribbean. Premature mortality measured in years of life lost, due to road traffic crashes in the region, exceeded that from diseases such as diabetes and lung cancer. The total burden of ill health due to road traffic crashes, measured in Disability Adjusted Life Years Lost, exceeded the combined burden of HIV, tuberculosis and malaria in the region (Murray et al. 2012).
Reducing this burden will require substantial investments in improving institutional capacity to manage road safety, developing highway safety infrastructure, regulating vehicle safety standards, developing trauma systems, enforcing laws and education to encourage safe road use (WHO, 2004). While the governments of several countries and the private sector could spend about $700 billion on transport in Latin America during the current decade (RIO+20, 2012), it is important that they make appropriate allocations of funds to incorporate transport safety and sustainability. Estimates of economic losses due to medical expenses, lost labor, property damage and estimates of the amount that society is willing to pay for improved safety, are all important indicators that can help policy makers decide how much should be spent on road safety.
Our calls for increased investments in road safety need to be supported by economic evidence that can influence the decision-‐making processes that determine the allocation of financial resources. This is widely recognized by global health researchers, leading to a dramatic increase in recent years in the number of studies that aim to estimate various aspects of the economic losses associated with illness and injuries (WHO 2009). Often these assessments of the economic burden of illness aim to influence policy makers at the highest level, arguing for the need for increased attention regarding this matter. For instance, a recent report quantifying the economic burden of non-‐communicable diseases (Bloom et al. 2011) was conducted at the World Economic Forum in the context of a high level meeting of the UN General Assembly focusing on the prevention and control of non-‐communicable diseases. Similarly, it is common for costing studies to target national policy makers. For instance, a 1989 study on the cost of injuries to the US Congress aimed to influence an ongoing debate on road safety expenditures in the country.
Our study aimed to estimate the economic burden of road injuries in Latin America with the primary purpose of illustrating the need for increased attention to road safety. We started by reviewing the literature on methods and best practices used by health economists for assessing the economic burden of illness and injury. We used a snowball search strategy to identify notable studies in the costing literature. Our intention was
10
not to systematically identify all costing studies. Instead, we focused our attention on key reports -‐-‐ especially three WHO best-‐practice reports (WHO, 2003, WHO, 2008b, and WHO 2009)-‐-‐ to summarize theoretical considerations. We supplemented these with studies that illustrated practical applications using different costing methods, from different regions of the world and for different health issues. Chapter 2 summarizes the findings from this review of the literature.
Using the findings of our literature review as a guide, we construct estimates of the cost of road injuries in Colombia. We implement two broad methodologies commonly used in the health literature: methods involving the valuation of a statistical life year (VSLY), and the cost-‐of-‐illness method. In addition, we construct VSLY-‐based estimates for Argentina, Mexico, and Paraguay. Chapter 3 compares the resulting cost estimates based on the application of these methods.
Finally, in Chapter 4 we discuss the implications of our findings. We describe the theoretical and technical limitations of constructing cost estimates and recommend how such work should be undertaken by road safety researchers for costing injuries in Latin America and the Caribbean.

11
2.0 REVIEW OF HEALTH COSTING METHODS
Health researchers aim to characterize the costs of illness and injuries by estimating the various aspects of economic losses borne by families and households, government budgets, private enterprises, and society as a whole. Appendix 1 provides a summary of methods used in a selected sample of costing studies from the health economics literature. There are three broad methodologies that have been used for estimating the economic burden of illness—cost-‐of-‐illness based methods, willingness-‐to-‐pay methods, and macroeconomic simulations. We discuss each of these in the following sections, focusing on their strengths and shortcomings.
Cost-‐of-‐Illness Method The cost-‐of-‐illness method focuses on the most tangible impacts of illness and injury. For a road traffic injury, this includes direct medical costs arising from medical treatments, medical transport, funeral and medico-‐legal costs, among others. In addition, the method includes estimates of indirect costs of income that is lost due to premature death, temporary inability to work or reduced capacity to work due to permanent disability. However, focusing on these tangible medical and labor costs ignores non-‐market labor, such as housework, and the vast amounts of pain and suffering to which individuals and families are subjected. Thus, many cost-‐of-‐illness studies try to fill this gap by including estimates of costs for informal work and for other intangible costs.
The cost-‐of-‐illness approach is popular among researchers primarily because it provides estimates in cost categories (such as medical, labor, administrative, etc.) that are easy to interpret. Thus, the costs are easy to communicate to policy makers and use in policy discussions. For instance, injury-‐costing studies commissioned by government agencies in the US (Blincoe et al. 2002, Corso et al. 2006, Naumann et al. 2010) have all used a cost-‐of-‐illness approach. These studies focused solely on medical and labor costs. Most other studies attempt to include at least some non-‐market costs (see Table 2.1 for a selected sample of the costing studies from our review). Intangible costs are sometimes included by factoring in willingness-‐to-‐pay, which we discuss in the next section.
In addition to these direct and indirect costs, highway crashes are an important cause of traffic congestion, which leads to a loss of capacity of transport infrastructure. Congestion poses a burden on society due to time lost due to travel delays, higher consumption of fossil fuels and higher vehicular emissions. Although these costs are not commonly included in cost-‐of-‐illness studies, when they have been computed the costs have shown to be substantial. For instance, cost-‐of-‐illness studies in the US show that travel delay caused by congestion at the crash site accounts for 11% of the economic costs of crashes (Blincoe et al. 2002).
Although commonly used and easy to interpret, economists do not recommend the cost-‐of-‐illness method because it does not have a firm foundation in economic theory.
12
Perhaps the most serious and most common violations of theory happen when these studies present aggregated costs as “GDP loss”, which is extremely problematic for multiple reasons. First, the direct costs (e.g. medical expenditures) are part of the formal economy and thus contribute positively to GDP. Second, measuring labor losses as the product of days and wages lost is an overestimate, especially in settings with high unemployment. For industry, the loss of labor productivity may be as little as the cost of replacing the employee, which is much smaller than the aggregate future earnings of the employee. More generally, labor losses estimated in this manner are not borne by households either, where another member may go to work and the loss of household income would be much smaller. Finally, if the goal is to measure the GDP loss then we cannot include imputed wages for housework and intangible costs for pain and suffering, which do not have a market value.
Although the comparisons with GDP are inappropriate, the cost-‐of-‐illness method provides multiple, clearly understood indicators that are closely related with the broad notion of economic burden. E.g., total out-‐of-‐pocket payments for road injuries or total medical costs are clearly understood concepts.
Willingness to Pay Method Health is not a conventional market good. Thus, if we are interested in the impact of injuries on overall economic welfare, measuring the willingness of individuals to pay to avoid injury is a more appropriate approach. Such economic choices can be revealed via trade-‐offs that people make in the marketplace or by the preferences of people measured via techniques such as contingent valuation surveys. There is a large body of literature (see reviews by Cropper & Sahin, 2009, Miller, 2000, Viscusi et al. 2003) that provides empirical estimates of the value of a statistical life. Increasingly, there are also studies that provide measurements of willingness to pay to avoid non-‐fatal disabilities (Brent, 2011, Kuhn and Ruf, 2008).
Economists prefer willingness-‐to-‐pay methods for estimating the loss to overall welfare because these methods are much better suited for measuring the intangible costs of non-‐market goods such as pain and suffering. Measurements of willingness to pay provide a comprehensive single measure of the benefits of healthy life. There are substantial measurement issues with these valuation techniques that remain unresolved. For instance, these methods usually estimate willingness-‐to-‐pay values for small reductions in risk and then assume that the willingness-‐to-‐pay estimates scale linearly with risk, which is unlikely to be true. Stated preference surveys potentially suffer from respondents attempting to engage in strategic behaviors or ignoring income constraints. Revealed preference studies may provide more valid measurements but are usually conducted on severely biased populations (often high-‐risk blue collar males) even though estimates of value of life are expected to be strongly dependent on study population.
13
Macroeconomic Growth Models Neither cost-‐of-‐illness nor willingness-‐to-‐pay methods are adequate for estimating the macroeconomic impact of illness on GDP. Estimating this requires a conceptual model that combines the circular flow of income between households, firms and government. The projected impact of injuries to aggregate economic output (GDP) can be assessed by simulations using general equilibrium models or by cross-‐country regressions. A detailed discussion of these methods and guidelines for implementation are provided by the 2009 WHO Guide to Identifying the Economic Consequences of Disease and Injury. Our review of the current literature suggests that these methods have been rarely used for estimating the macroeconomic impact of illness and have never been used for injuries. However, most recent studies acknowledge that growth models have a stronger theoretical foundation for estimating macroeconomic impacts. We expect that the use of these methods will become common in the near future. However, constructing such models was beyond the scope of our current study.
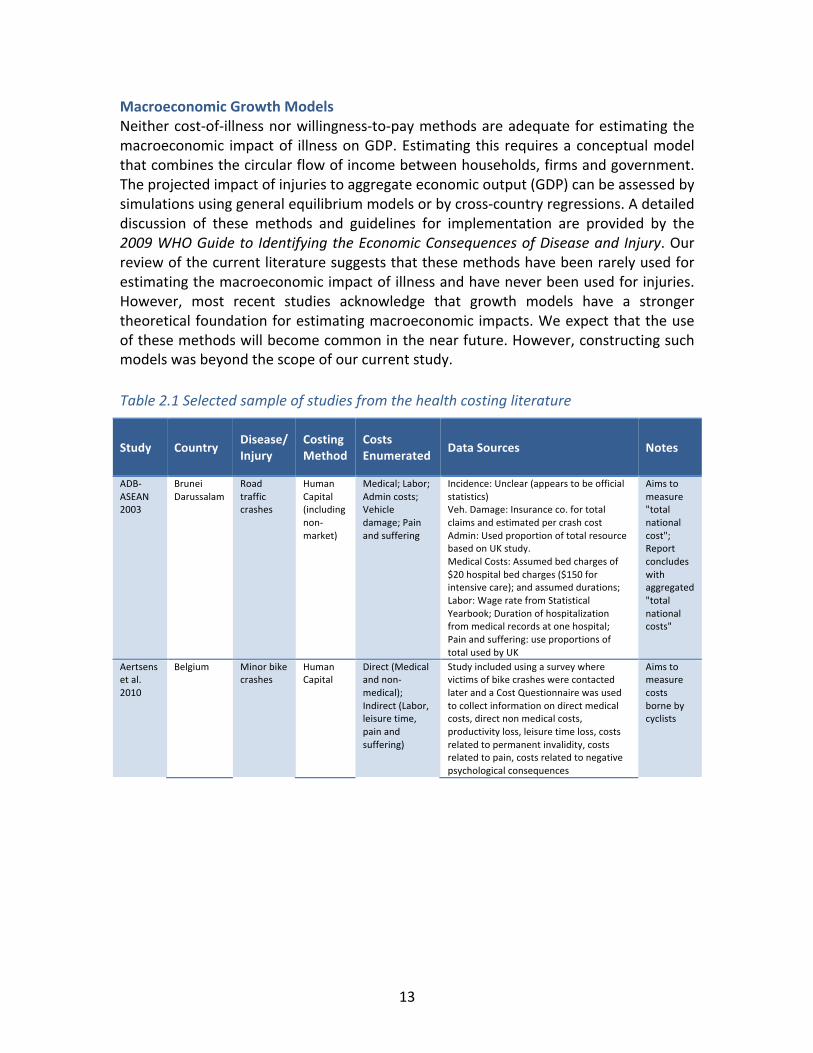
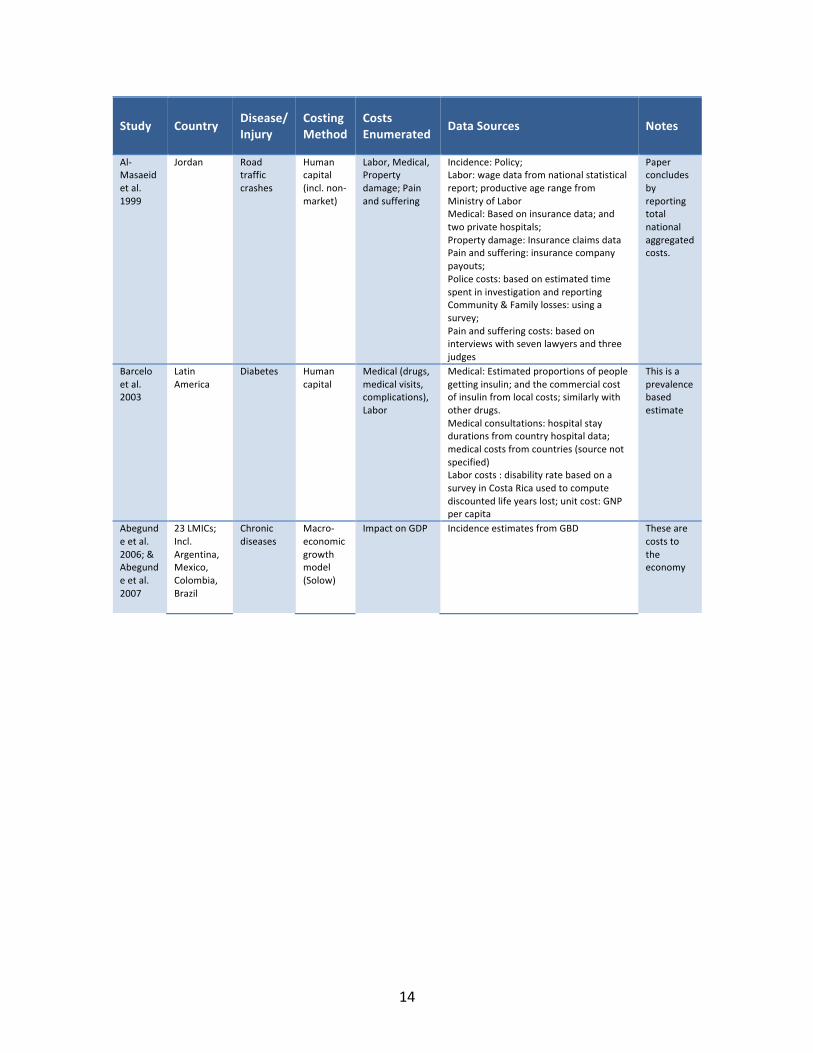
Table 2.1 Selected sample of studies from the health costing literature
Study Country Disease/ Injury
Costing Method
Costs Enumerated Data Sources Notes
ADB-‐ASEAN 2003
Brunei Darussalam
Road traffic crashes
Human Capital (including non-‐market)
Medical; Labor; Admin costs; Vehicle damage; Pain and suffering
Incidence: Unclear (appears to be official statistics) Veh. Damage: Insurance co. for total claims and estimated per crash cost Admin: Used proportion of total resource based on UK study. Medical Costs: Assumed bed charges of $20 hospital bed charges ($150 for intensive care); and assumed durations; Labor: Wage rate from Statistical Yearbook; Duration of hospitalization from medical records at one hospital; Pain and suffering: use proportions of total used by UK
Aims to measure "total national cost"; Report concludes with aggregated "total national costs"
Aertsens et al. 2010
Belgium Minor bike crashes
Human Capital
Direct (Medical and non-‐medical); Indirect (Labor, leisure time, pain and suffering)
Study included using a survey where victims of bike crashes were contacted later and a Cost Questionnaire was used to collect information on direct medical costs, direct non medical costs, productivity loss, leisure time loss, costs related to permanent invalidity, costs related to pain, costs related to negative psychological consequences
Aims to measure costs borne by cyclists
14
Study Country Disease/ Injury
Costing Method
Costs Enumerated Data Sources Notes
Al-‐Masaeid et al. 1999
Jordan Road traffic crashes
Human capital (incl. non-‐market)
Labor, Medical, Property damage; Pain and suffering
Incidence: Policy; Labor: wage data from national statistical report; productive age range from Ministry of Labor Medical: Based on insurance data; and two private hospitals; Property damage: Insurance claims data Pain and suffering: insurance company payouts; Police costs: based on estimated time spent in investigation and reporting Community & Family losses: using a survey; Pain and suffering costs: based on interviews with seven lawyers and three judges
Paper concludes by reporting total national aggregated costs.
Barcelo et al. 2003
Latin America
Diabetes Human capital
Medical (drugs, medical visits, complications), Labor
Medical: Estimated proportions of people getting insulin; and the commercial cost of insulin from local costs; similarly with other drugs. Medical consultations: hospital stay durations from country hospital data; medical costs from countries (source not specified) Labor costs : disability rate based on a survey in Costa Rica used to compute discounted life years lost; unit cost: GNP per capita
This is a prevalence based estimate
Abegunde et al. 2006; & Abegunde et al. 2007
23 LMICs; Incl. Argentina, Mexico, Colombia, Brazil
Chronic diseases
Macro-‐economic growth model (Solow)
Impact on GDP Incidence estimates from GBD These are costs to the economy

15
Study Country Disease/ Injury
Costing Method
Costs Enumerated Data Sources Notes
Corso et al. 2006
USA Injuries (by type, incl motor vehicle)
Human Capital
Medical; Labor (inc. house keeping services)
MEDICAL: Coroner/ME: for fatalities based on a 1981 paper; Ambulance costs: based on ambulance transport costs for injury victims in 1999 Medicare 5% sample; Cost of ED treatment from a 1997 study of 363 injury deaths; plus cost estimates from MEPS; Cost of hospital treatment were computed by n-‐code using 10889 cases in the HCUP-‐NIS data; MEPS; hospital cost-‐to-‐charge ratios provided by the Agency for HealthCare Research and Quality; Medstat MarketScan’s estimates of non-‐facility fees; HCUP-‐NIS provides facilities charges for each injury. This is multiplied by cost-‐to-‐charge ratios by AHRQ to get costs. This further inflated for non-‐facility costs using the Medstat MarketScan; Costs of readmission are computed using HCUP-‐NIS; Costs of rehabilitation for 14 N-‐codes x 6 E-‐codes are from a previous study by Miler, from data from the Prospective Payment System.; Nursing Home Costs: 1999 National Nursing Home Survey (NCHS provider survey); Short-‐term to medium-‐term costs are estimated using the ratio of MEPS (tracks medical costs up to 2 years) costs to inpatient costs. ; Long term costs: using multipliers derived from the Detailed Claim Information (DCI) data on ~500,000 Workers Compensation Claims. PRODUCTIVITY: Haddix et al. 2003 provide earnings (salary + fringe benefits) for each age bracket. These are adjusted for productivity growth and discounted to present value. Housework is handled in a similar way based on data from Haddix. Short-‐term: NHIS and a 1993 Annual Survey of Occupational Injuries give probability of lost workdays. Long-‐term: Total disability -‐using Haddix (as for deaths). Partial disability – based on a scale of % disability.
Only labor and medical costs are computed

16
Study Country Disease/ Injury
Costing Method
Costs Enumerated Data Sources Notes
Gonzalez et al. 2009
Colombia Diabetes Mellitus
Human Capita
Medical (drugs, lab, hospital, other health care), Labor (work time lost, leisure and non-‐market labor)
Incidence: from a Markov transition model MEDICAL: Categories of screening, diagnostics, care delivery are based on values provided by the International Diabetes Federation Unit costs based on: (1) Ministry of Social Protection. List of prices for medication, surgical procedures and hospital fees. Derecto 2423 of 2005; (2) Pharma price guide 2007; (3) some missing unit costs were converted from comparable costs in Spain after converting using purchasing power parity; (4) unit costs for myocardial infarction from a national report; LABOR: Wages were computed using the GNI per capita; loss of work days were modeled/estimated;
Incidence approach for diabetes (compare with Barcelo et al. 2003); The primary viewpoint is the Colombian Ministry of Health as payer (second perspective is society, which includes indirect costs)
Ibanez et al. 2001
Colombia (Bogota)
Morbidity from ARI
WTP WTP for reduction in respiratory morbidity
Contingent valuation survey of 1200 residents of Bogota aimed at measuring the Willingness to Pay for reducing acute respiratory illness.
Kim et al. 2002
Korea Cancer Human Capital
Medical, non-‐medical, lost productivity
Incidence: Based on national cancer registry Medical: Healthcare claims from health insurance review agency (note that Korea has compulsory health insurance for the whole population). This provided unit cost information, length of hospital stays; medical treatments received for outpatient visits; Labor: hospital inpatient days + 50% of number of outpatient visits; Wage data from national labor statistics
Prevalence based estimates;
Perez-‐Nunez et al. 2011
Mexico (Guadalajara and Jalisco)
road traffic injuries
Human Capital
Direct costs (medical and non-‐medical), labor loss
Direct Costs (Medical and non-‐medical) For non-‐fatal, based on interviews of patients who survived RTI in four hospitals; For fatal, based on the average duration of hospital stays from the MoH Hospital Discharge Database Labor: For non-‐fatal, based on interviews Caregiver costs were estimated using minimum wage For fatal, average annual wage was estimated from the 2008 National Survey of Household Income and Expenditure
Study perspective is loss to households

17
Study Country Disease/ Injury
Costing Method
Costs Enumerated Data Sources Notes
Wren et al. 2010
New Zealand
Injuries (incl. road injuries)
Human capital and WTP
Medical, labor (incl. non market)
Incidence: VR data and MoH hospital discharge data used to estimate incidence; DALYs distributions rely on an Australian Burden of Disease study. Accident Claims Corporations (ACC) detailed claims data for expenditure provides estimates of the treatment and rehabilitation costs Labor loss: Average income from the Household Labor Force Survey (also non market labor is added) WTP (for intangibles) Official national figure for Value of Statistical Life ($3.352 million) Value for a DALY is derived from VSL
Note the use of both Human Capital and WTP methods in the same study
Table 1 provides a selected sample from the country costing studies reviewed in this project. See Appendix 1 for bibliography of other studies. WTP: willingness-‐to-‐pay. Source: Authors' calculations
18
3.0 METHODS AND DATA SOURCES
As we have discussed earlier, the methods used by health researchers to estimate the economic burden of illness vary substantially in what they seek to measure. Furthermore, they rely on dramatically differing methodological foundations, making their results inherently incomparable. In this study, we start by estimating the incidence of fatal and non-‐fatal injuries from road traffic crashes and construct estimates of costs using both the cost-‐of-‐illness methods and the willingness-‐to-‐pay methods.
Estimating Incidence of Road Injuries in Colombia We obtained estimates of the road traffic injury mortality and morbidity disaggregated by sex, 18 age groups, and five categories specifying the mode of transport of the victim (hereafter referred to as “road-‐user type”) from the 2010 Global Burden of Disease Study (GBD 2010). The methods for estimating the public health burden in the GBD 2010 study have been described elsewhere (see Lozano et al., 2012, and Murray et al., 2012, for a detailed description). Briefly, the guiding principle of the burden of disease approach is that estimates of population health metrics (such as incidence and prevalence) should be generated after careful analysis and correction for bias of all available data sources. Therefore, GBD 2010 aimed to include all empirical measurements of population health that could help inform estimates of the incidence of fatal and non-‐fatal injuries in a region, including vital registration statistics, hospital databases, household surveys, and prospective studies of disability outcome. Notably, data from Colombia included cause-‐of-‐death data from national vital registration statistics, injury surveillance data from Universidad del Valle Hospital in Cali, and road injury incidence measurements from the 2007 national health survey. GBD 2010 estimated the burden of non-‐fatal outcomes of road injuries by first estimating the incidence of road injuries using household survey data, hospital data, and injury mortality estimates. Next, the incidence of external causes was mapped to the incidence of sequelae using hospital data. Finally, prevalence of ill health due to injuries was estimated taking into account the short-‐term and long-‐term disability consequences.
We report the public health burden of road injuries in Colombia using the following summary measures of population health:
• Years of Life Lost (YLLs): This is the number of years of life lost because of premature death. It is calculated by multiplying the number of deaths at each age by the standard life expectancy at that age.
• Years of Life Lived with Disability (YLDs): This is the number of years of life that are lived with short-‐term or long-‐term health loss weighted by the severity of the disabling sequelae of diseases and injuries.
• Disability-‐Adjusted Life Years (DALYs): This is the main summary measure of population health used in GBD to quantify health loss. DALYs provide a metric that

19
allows comparison of health loss across different diseases and injuries. They are calculated as the sum of YLLs and YLDs. Thus, they are a measure of the number of years of healthy life that are lost due to death and non-‐fatal illness or impairment.
Estimating Costs of Road Injuries in Colombia
WILLINGNESS-‐TO-‐PAY AND VALUE OF A STATISTICAL LIFE YEAR METHODS
The influential 2001 WHO Report of the Commission on Macroeconomics and Health (CMH) (WHO, 2001) presented two rules-‐of-‐thumb for estimating the cost of ill health from estimates of DALYs. The first rule of thumb, which we refer to as CMH-‐1, assumes that the economic loss due to the loss of one year of life, i.e. one DALY, is the loss of one unit of GDP per capita. In essence, this assumes that the loss of a life year is exactly the economic output produced during that year. The CMH report further pointed out that this estimate is likely lower than that of the true cost because a year of healthy life is worth considerably more than the market income that will be earned in the year. They suggested that in order to approximate the true cost of intangibles such as the costs of pain and suffering and the value of leisure time, a more realistic rule-‐of-‐thumb would equate the loss of one year with the loss of three units of GDP per capita. We refer to this as the CMH-‐3 estimate. Thus, we construct estimates for CMH-‐1 and CMH-‐3 by applying multipliers of one and three, respectively, to estimates of healthy life years (DALYs) lost due to road traffic accidents.
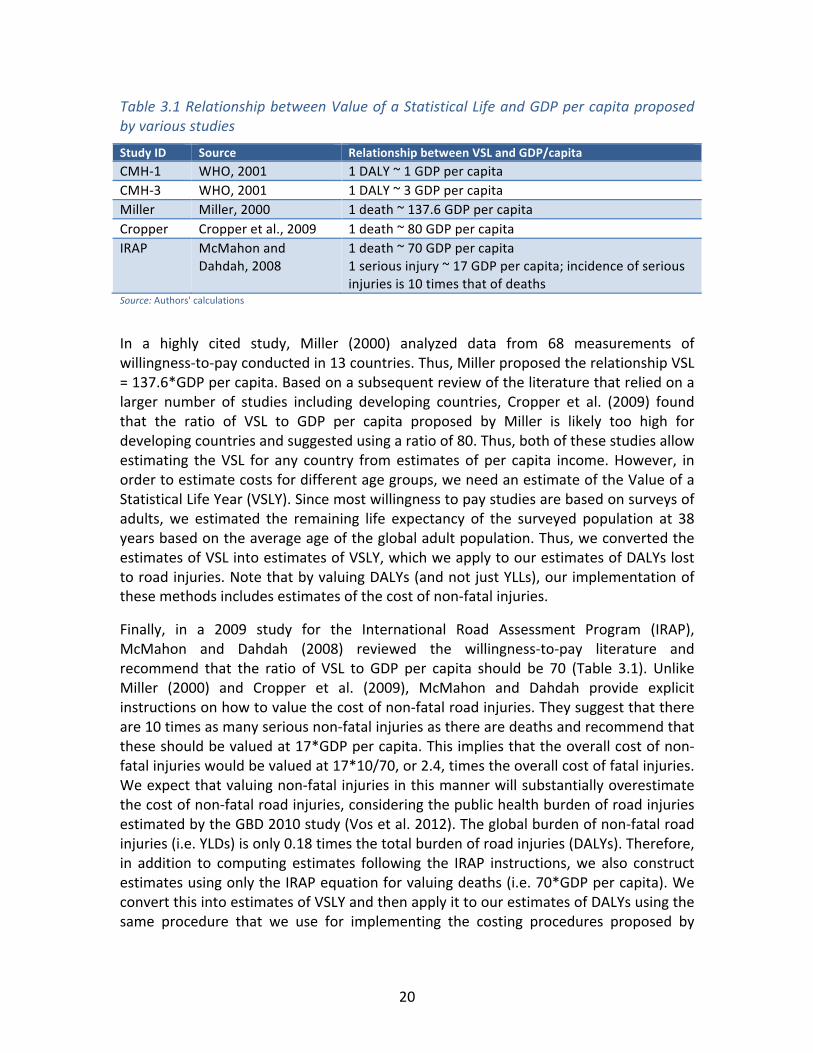
Several empirical studies of the willingness of individuals to pay to avoid ill health have shown that the value of a statistical life in a country is related to its GDP per capita. Based on a review of these measurements, several authors and agencies have offered recommendations on how to model this relationship (Table 3.1). We implemented the algorithms proposed in three of the most commonly referenced studies.
20
Table 3.1 Relationship between Value of a Statistical Life and GDP per capita proposed by various studies
Study ID Source Relationship between VSL and GDP/capita CMH-‐1 WHO, 2001 1 DALY ~ 1 GDP per capita CMH-‐3 WHO, 2001 1 DALY ~ 3 GDP per capita Miller Miller, 2000 1 death ~ 137.6 GDP per capita Cropper Cropper et al., 2009 1 death ~ 80 GDP per capita IRAP McMahon and
Dahdah, 2008 1 death ~ 70 GDP per capita 1 serious injury ~ 17 GDP per capita; incidence of serious injuries is 10 times that of deaths
Source: Authors' calculations
In a highly cited study, Miller (2000) analyzed data from 68 measurements of willingness-‐to-‐pay conducted in 13 countries. Thus, Miller proposed the relationship VSL = 137.6*GDP per capita. Based on a subsequent review of the literature that relied on a larger number of studies including developing countries, Cropper et al. (2009) found that the ratio of VSL to GDP per capita proposed by Miller is likely too high for developing countries and suggested using a ratio of 80. Thus, both of these studies allow estimating the VSL for any country from estimates of per capita income. However, in order to estimate costs for different age groups, we need an estimate of the Value of a Statistical Life Year (VSLY). Since most willingness to pay studies are based on surveys of adults, we estimated the remaining life expectancy of the surveyed population at 38 years based on the average age of the global adult population. Thus, we converted the estimates of VSL into estimates of VSLY, which we apply to our estimates of DALYs lost to road injuries. Note that by valuing DALYs (and not just YLLs), our implementation of these methods includes estimates of the cost of non-‐fatal injuries.
Finally, in a 2009 study for the International Road Assessment Program (IRAP), McMahon and Dahdah (2008) reviewed the willingness-‐to-‐pay literature and recommend that the ratio of VSL to GDP per capita should be 70 (Table 3.1). Unlike Miller (2000) and Cropper et al. (2009), McMahon and Dahdah provide explicit instructions on how to value the cost of non-‐fatal road injuries. They suggest that there are 10 times as many serious non-‐fatal injuries as there are deaths and recommend that these should be valued at 17*GDP per capita. This implies that the overall cost of non-‐fatal injuries would be valued at 17*10/70, or 2.4, times the overall cost of fatal injuries. We expect that valuing non-‐fatal injuries in this manner will substantially overestimate the cost of non-‐fatal road injuries, considering the public health burden of road injuries estimated by the GBD 2010 study (Vos et al. 2012). The global burden of non-‐fatal road injuries (i.e. YLDs) is only 0.18 times the total burden of road injuries (DALYs). Therefore, in addition to computing estimates following the IRAP instructions, we also construct estimates using only the IRAP equation for valuing deaths (i.e. 70*GDP per capita). We convert this into estimates of VSLY and then apply it to our estimates of DALYs using the same procedure that we use for implementing the costing procedures proposed by

21
Miller (2000) and Cropper et al. (2009). In our study, we refer to these corrected IRAP estimates as IRAP*.
LABOR LOSSES
Estimates of labor losses due to road traffic injuries require estimating the unit cost of labor and the duration of work loss. Since our interest is in estimating the loss on the national economy, we set the unit cost of labor at 1 GDP per capita (Table 3.2). We estimate durations as follows. For deaths, we assume that the duration of work loss is the remaining life expectancy. For road injury victims that are admitted to the hospital, the duration of work loss equals at least the duration of the hospital stay. In addition, many hospitalized victims will suffer substantial losses due to disabilities. Since the distribution of such disabilities and their implications on work loss are not known for Colombia, we approximate proportions based on the likelihood of disability following injury estimated in the GBD-‐2010 project (Vos et al., 2012). Thus, we estimate that 10% of hospital admissions for road traffic injuries result in total permanent disabilities. Since this population will not return to work, the duration of work loss is equivalent to their remaining life expectancy. We estimate that another 20% of hospital admissions have partial permanent disability, such that their future work capacity (and hence, wage) is diminished by 30%. Finally, for the remainder (70% of the population), we estimate that temporary disability leads to loss of work for one month. For outpatient visits that do not result in admission, we estimate that the loss of work is one day per hospital visit. Finally, since the bulk of the labor losses occur in future years due to the loss of future earnings, we discount these future losses to their present value using a discount rate of 3%.
MEDICAL EXPENSES
We use two methods to compute the medical costs of injuries. The first method (which we have labeled Medical-‐1) is a bottom-‐up approach that estimates unit costs for each interaction with the medical system and applies these to our incidence estimates. Our unit cost estimates are based on average costs reported from a referral public hospital in Cali, Colombia and a private health service provider at national level in Colombia (Table 3.2). In addition, we estimate that 30% of all road traffic injuries (deaths, admissions, and outpatients) require an ambulance trip, and 30% of hospital admissions for road traffic injuries require, on average, 2 days of stay in intensive care.

22
Table 3.2 Unit cost estimates used in our cost-‐of-‐illness analysis
Labor Losses
Unit Costs 1 DALY ~ Loss of 1 GDP per capita
Medical Expenses-‐1* (Bottom-‐up approach)[1]
Ambulance use: US$35.1 per trip Outpatient visit: US$15.9 per visit Hospital admission: US $85.96 per day Average hospital stay of 5.4 days Intensive care: US$995 per day
Medical Expenses-‐2 (Top-‐down approach)[2]
Fatal crashes: US$551 per victim Injury-‐only crashes: US$1322 per victim
Funeral[3] US$ 732 per funeral Property Damage[4] Used vehicle prices:
Passenger car: US$6000 per vehicle Motorized two wheeler: $1500 per vehicle Truck (including cargo): $60000 per vehicle Other vehicles: US$6000 per vehicle
Administrative Costs[2] Insurance admin: US$446 per victim Police: US$584 per death, US$287 per injured victim Legal medicine: US$1014 per death, US$518 per injured victim
[1] Based on costs reported from a referral hospital in Cali, Colombia, and a national private health service provider [2] Based on Bocarejo et al., 2011 [3] Based on average funeral costs at three funeral homes in Cali [4] Based on average new and used vehicle prices in Colombia Our second method (labeled Medical-‐2) is a top-‐down estimate using payments for medical insurance claims. Since 1993, the Colombian health system has aimed to provide universal coverage of health service by guaranteeing medical payments via a variety of mechanisms (Cabrera, 2011). The Compulsory Traffic Crashes Insurance (Seguro Obligatorio de Accidentes de Transito, SOAT) is a mandatory insurance program that contributes first to medical costs for injuries. In circumstances where vehicle insurance cannot provide coverage (e.g. for hit-‐and-‐run crashes) and when expenses exceed the payments limits of SOAT, the National Solidarity and Guarantee Fund (El Fondo de Solidaridad y Garantia, FOSYGA) provides additional coverage. Other mechanisms, such as Mandatory Worker Insurance (Administradora de Riesgos Profesionales, ARP) often provide additional coverage for medical expenses. Bocarejo et al. (2011) analyzed data from SOAT and FOSYGA and reported unit medical costs of US$ 551 and US$ 1,322 for crashes with fatalities and injury-‐only, respectively (Table 3.2). We further partition the non-‐fatal unit costs by estimating that the unit costs for outpatient visits are half of those for admissions. We apply these unit cost estimates to our non-‐fatal road traffic injury incidence estimates. Source: Authors' calculations
FUNERAL COSTS
We obtained the average costs of funerals at three funeral homes (US$ 682, US $624, US$ 891) in Cali, Colombia. We apply the average of these three (US$ 732) to our mortality estimates (Table 3.2).
PROPERTY DAMAGE
We estimated the unit costs of vehicle damage by approximating the cost of new and used vehicles sold in Colombia. Our unit costs estimates are shown in Table 3.2. In order to estimate the counts of vehicles damaged in crashes from the distribution of injury outcomes, we make several assumptions. For crashes involving deaths of car and bus

23
occupants, we estimate that all of the vehicles are a total loss. In crashes involving deaths of motorcycle riders, we estimate that half the vehicles are a total loss. In crashes involving deaths of cyclists and pedestrians, we estimate that 10% of impacting vehicles are a total loss. In crashes resulting in hospital admissions of car occupants, we estimate that 10% of vehicles are a total loss. In crashes resulting in hospital admissions of motorcycle riders, we estimate that 10% of vehicles are a total loss. In crashes resulting in admissions of heavy vehicle occupants, we estimate that all vehicles and cargo are a total loss. In crashes resulting in admissions of cyclists and pedestrians, we estimate that 10% of impacting vehicles are a total loss. In each case, we assume that vehicles that are not a total loss are a partial loss.
ADMINISTRATIVE COSTS
Bocarejo et al. (2011) reported unit administrative costs based on analysis of data from insurance administration (US$ 446 for deaths and non-‐fatal injuries), police(US$ 584 and US$ 287 for deaths and non-‐fatal crashes, respectively), and legal medicine (US$ 1,014 and US$ 518 for deaths and non-‐fatal injuries, respectively). We further partition the non-‐fatal crash costs by assuming that the costs for outpatient visits are half of those for admissions.

24
4.0 RESULTS
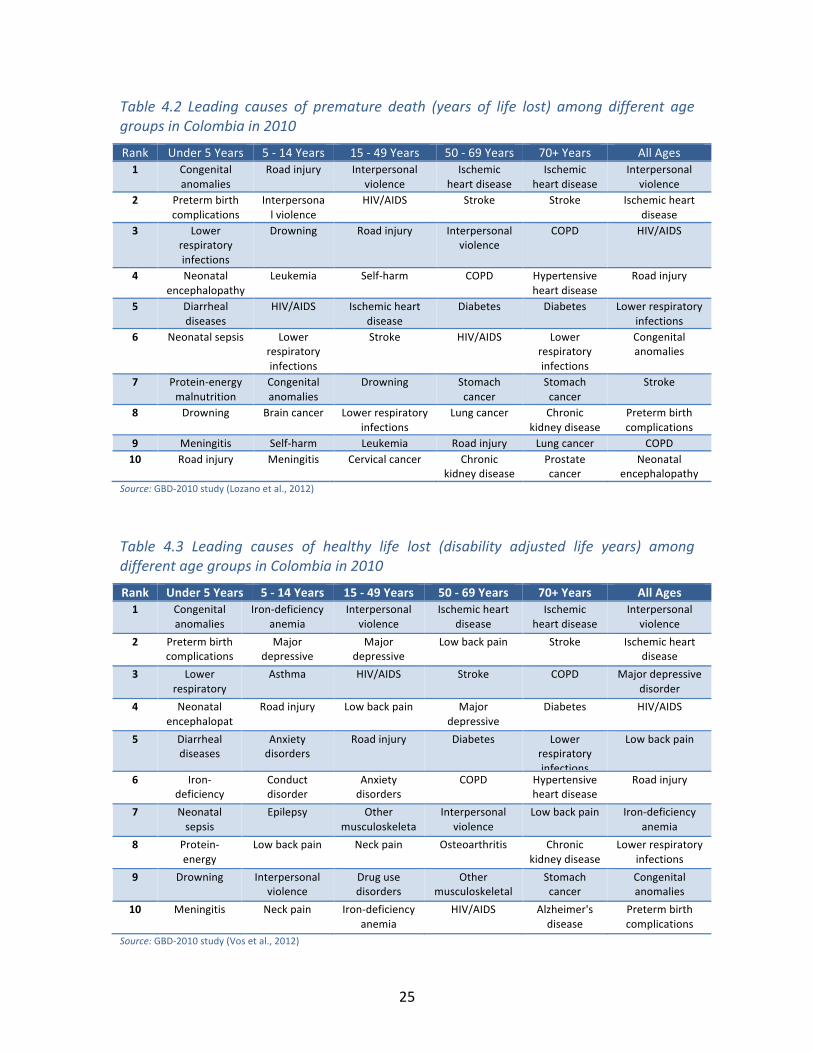
Public Health Burden of Road Injuries in Colombia Road crashes are a leading cause of health loss in Colombia. In 2010, road injuries killed over 7,500 people and were the seventh leading cause of death ahead of diseases such as diabetes, stomach cancer, and lung cancer, which receive substantial attention in public health (Table 4.1). Although road crashes rank among the top 10 leading causes of death among all age groups other than the elderly, they are particularly important amongst the young. Among children from 5-‐14 years old, road traffic crashes are the leading cause of death, and among young adults from 15-‐49 years old, they are the third leading cause of death, with a death toll that is only exceeded by HIV/AIDS and homicides. Because road traffic crashes impact the young, the impact on premature mortality is even higher (Table 4.2). They are the fourth leading cause of years of life lost in Colombia. In addition to deaths, road crashes result in substantial morbidity from non-‐fatal crashes and are the sixth leading cause of overall health loss (Table 4.3).
Table 4.1: Leading causes of deaths among different age groups in Colombia in 2010
Rank Under 5 Years 5 -‐ 14 Years 15 -‐ 49 Years 50 -‐ 69 Years 70+ Years All Ages 1 Congenital
anomalies Road injury Interpersonal
violence Ischemic
heart disease Ischemic
heart disease Ischemic heart
disease 2 Preterm birth
complications Interpersonal
violence HIV/AIDS Stroke Stroke Interpersonal
violence 3 Lower
respiratory infections
Drowning Road injury COPD COPD Stroke
4 Neonatal encephalopathy
Leukemia Self-‐harm Diabetes Hypertensive heart disease
COPD
5 Diarrheal diseases
HIV/AIDS Ischemic heart disease
Interpersonal violence
Lower respiratory infections
HIV/AIDS
6 Neonatal sepsis Lower respiratory infections
Stroke Stomach cancer
Diabetes Lower respiratory infections
7 Protein-‐energy malnutrition
Congenital anomalies
Drowning HIV/AIDS Chronic kidney disease
Road injury
8 Drowning Brain cancer Lower respiratory infections
Lung cancer Stomach cancer
Diabetes
9 Meningitis Self-‐harm Cervical cancer Chronic kidney disease
Prostate cancer
Hypertensive heart disease
10 Road injury Meningitis Stomach cancer Road injury Lung cancer Stomach cancer
Source: GBD-‐2010 study (Lozano et al., 2012)
25
Table 4.2 Leading causes of premature death (years of life lost) among different age groups in Colombia in 2010
Rank Under 5 Years 5 -‐ 14 Years 15 -‐ 49 Years 50 -‐ 69 Years 70+ Years All Ages 1 Congenital
anomalies Road injury Interpersonal
violence Ischemic
heart disease Ischemic
heart disease Interpersonal
violence 2 Preterm birth
complications Interpersonal violence
HIV/AIDS Stroke Stroke Ischemic heart disease
3 Lower respiratory infections
Drowning Road injury Interpersonal violence
COPD HIV/AIDS
4 Neonatal encephalopathy
Leukemia Self-‐harm COPD Hypertensive heart disease
Road injury
5 Diarrheal diseases
HIV/AIDS Ischemic heart disease
Diabetes Diabetes Lower respiratory infections
6 Neonatal sepsis Lower respiratory infections
Stroke HIV/AIDS Lower respiratory infections
Congenital anomalies
7 Protein-‐energy malnutrition
Congenital anomalies
Drowning Stomach cancer
Stomach cancer
Stroke
8 Drowning Brain cancer Lower respiratory infections
Lung cancer Chronic kidney disease
Preterm birth complications
9 Meningitis Self-‐harm Leukemia Road injury Lung cancer COPD 10 Road injury Meningitis Cervical cancer Chronic
kidney disease Prostate cancer
Neonatal encephalopathy
Source: GBD-‐2010 study (Lozano et al., 2012)
Table 4.3 Leading causes of healthy life lost (disability adjusted life years) among different age groups in Colombia in 2010
Rank Under 5 Years 5 -‐ 14 Years 15 -‐ 49 Years 50 -‐ 69 Years 70+ Years All Ages 1 Congenital
anomalies Iron-‐deficiency
anemia Interpersonal
violence Ischemic heart
disease Ischemic
heart disease Interpersonal
violence 2 Preterm birth
complications Major
depressive disorder
Major depressive disorder
Low back pain Stroke Ischemic heart disease
3 Lower respiratory infections
Asthma HIV/AIDS Stroke COPD Major depressive disorder
4 Neonatal encephalopat
hy
Road injury Low back pain Major depressive disorder
Diabetes HIV/AIDS
5 Diarrheal diseases
Anxiety disorders
Road injury Diabetes Lower respiratory infections
Low back pain
6 Iron-‐deficiency anemia
Conduct disorder
Anxiety disorders
COPD Hypertensive heart disease
Road injury
7 Neonatal sepsis
Epilepsy Other musculoskeleta
l
Interpersonal violence
Low back pain Iron-‐deficiency anemia
8 Protein-‐energy
malnutrition
Low back pain Neck pain Osteoarthritis Chronic kidney disease
Lower respiratory infections
9 Drowning Interpersonal violence
Drug use disorders
Other musculoskeletal
Stomach cancer
Congenital anomalies
10 Meningitis Neck pain Iron-‐deficiency anemia
HIV/AIDS Alzheimer's disease
Preterm birth complications
Source: GBD-‐2010 study (Vos et al., 2012)

26
Figure 4.1 Trends in road traffic injury mortality in Colombia from various sources.
Sources: GBD-‐2010 from Lozano et al., 2012; Analysis of death registration data from Bhalla et al. 2010; Forensic medicine data from The National Institute for Legal Medicine and Forensic Science (Instituto Nacional de Medicina Legal y Ciencia Forense, INMLCF); and official national statistics reported in the 2009 and 2013 WHO Global Status Report on Road Safety (WHO-‐GSRRS).
Figure 4.1 shows estimates of national road deaths in Colombia based on a variety of sources, including GBD-‐2010 estimates, vital registration, National Forensic Medicine Institute (Instituto Nacional de Medicina Legal y Ciencia Forense, INMLCF) and the official national statistics as reported to WHO. While the WHO statistics are consistent with the data from forensic medicine, the estimates from GBD-‐2010 which rely on analysis of national death registration statistics, are substantially higher. For the year 2010, the GBD-‐2010 estimates are 36% higher than official national statistics.
Despite the discrepancy in magnitude, the time trends are broadly similar. These trends show that national road traffic deaths in Colombia rose until the mid-‐1990s and then declined for the next 10 years. However, although the death toll has declined substantially from its peak, the decline ceased in 2004 and currently deaths are rising again.
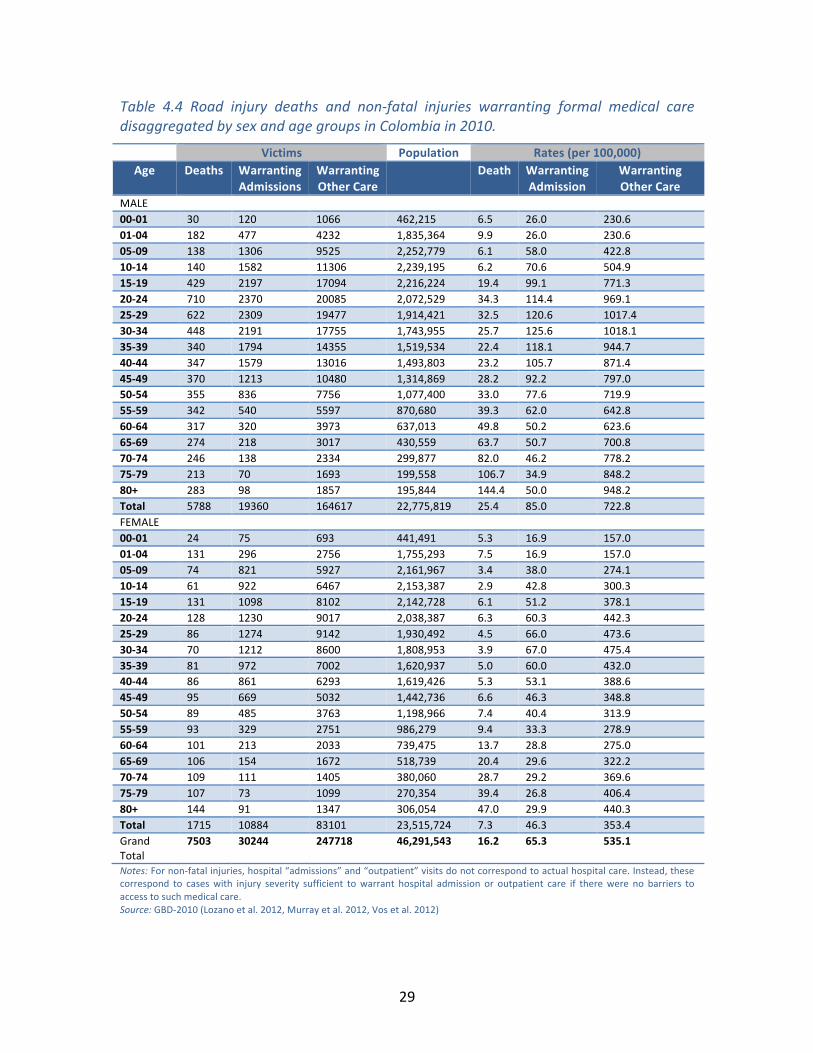
Table 4.4 and Figures 4.2-‐4.3 further illustrate the age-‐ and sex-‐ profile of road injuries and road injury rates in Colombia. The road injury death rate in Colombia (16.2 per 100 000) is typical of other countries in the Latin American region (see Bhalla et al., 2010, for a comparison). However, the death rate from road injuries in the region is more than three times the death rate in countries such as Sweden, the UK and the Netherlands, which have the best road safety performance.

27
Most deaths and injuries occur among young adults, with deaths peaking in the 20-‐24 years age group among men, who have a death rate that is more than three times higher than that of women. The ratio of male to female deaths varies substantially with age broadly reflecting exposure to road traffic. Among children below nine years, the number of deaths among boys and girls are similar. However, the proportion of male deaths is much higher among adults before declining among the elderly.
While deaths peak among young adults, the age profile of death rates is quite different. Death rates increase abruptly with age among children from 15-‐19 years old. After an initial peak in the 25-‐29 year age group, death rates decline with age before rising again starting in the 50-‐54 year old age group. The highest death rates occur among the oldest age group (85+ years), exceeding 70 deaths per 100 000 among men older than 65 years.
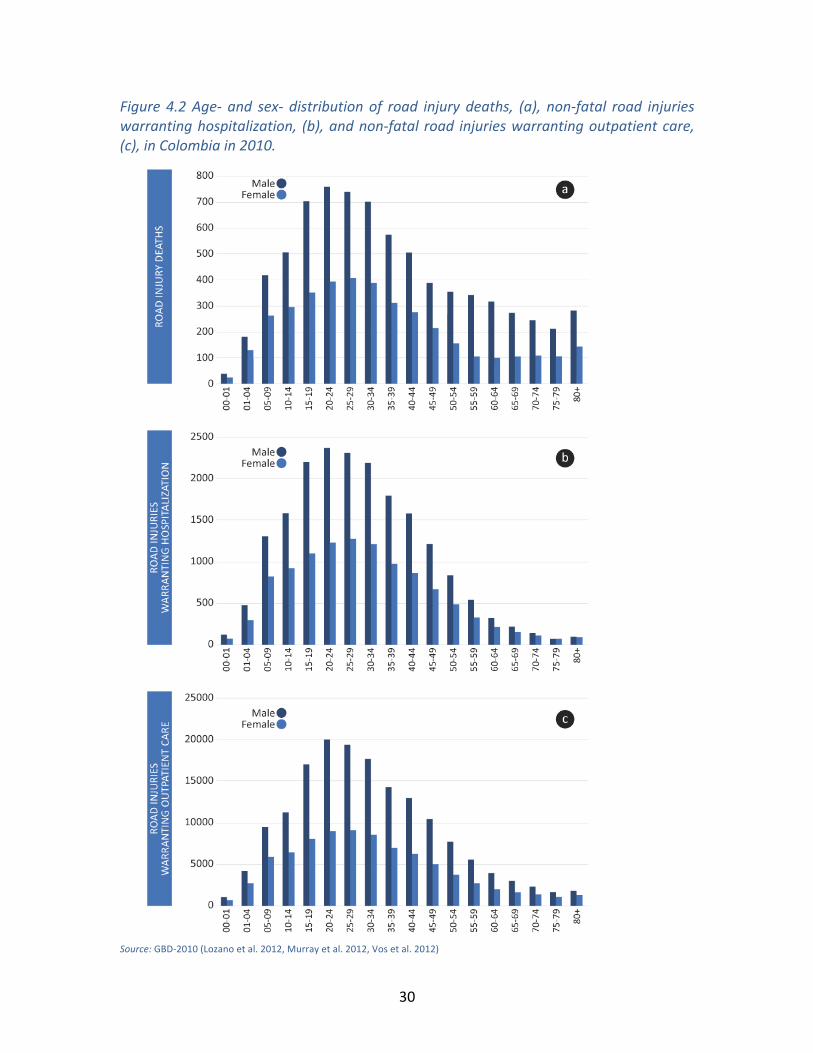
Table 4.4 and Figures 4.2-‐4.3 also illustrate the incidence of non-‐fatal injuries from crashes in Colombia. In 2010, there were over 30,000 non-‐fatal injuries warranting hospital admissions and almost 250,000 non-‐fatal injuries warranting other medical care. These correspond to non-‐fatal road injury rates of 65.3 and 535.1 per 100 000, respectively. The age-‐ and sex-‐ distribution of non-‐fatal road injuries (Figure 4.2b) is broadly similar to that of deaths with peak non-‐fatal injuries occurring in the age group of 20-‐24 years among both men and women. The rate of non-‐fatal injuries, however, has an age-‐ and sex-‐ profile that is strikingly different from the rate of deaths. While death rates increase with age during adulthood, severe injury rates decline. For less severe injuries, non-‐fatal injury rates show an increasing age-‐profile amongst the oldest groups.
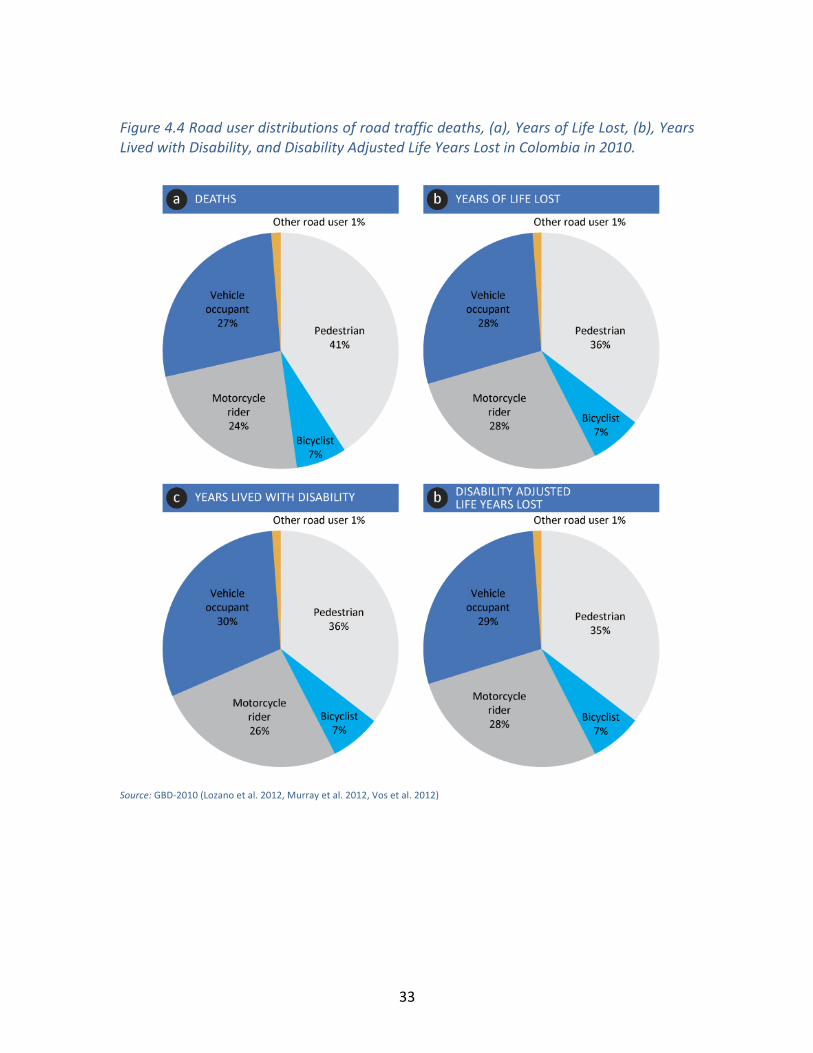
Table 4.5 and Figure 4.4 illustrate the health burden of road injuries disaggregated by road user categories. Pedestrians are the single largest victim type with 3069 deaths in 2010, and over 120,000 years of life lost due to premature death. Pedestrians alone comprise 40% of all road deaths and 45% of all non-‐fatal road injuries.
Remarkably, road deaths in Colombia are more than twice as likely to be non car related (i.e. pedestrians, cyclists, and motorcyclists) than inside vehicles. Occupants of motor vehicles (cars, vans, buses and trucks) constituted 2044 deaths, 27% of the road traffic death toll in Colombia in 2010. Motorcycle riders accounted for another 1776 deaths.
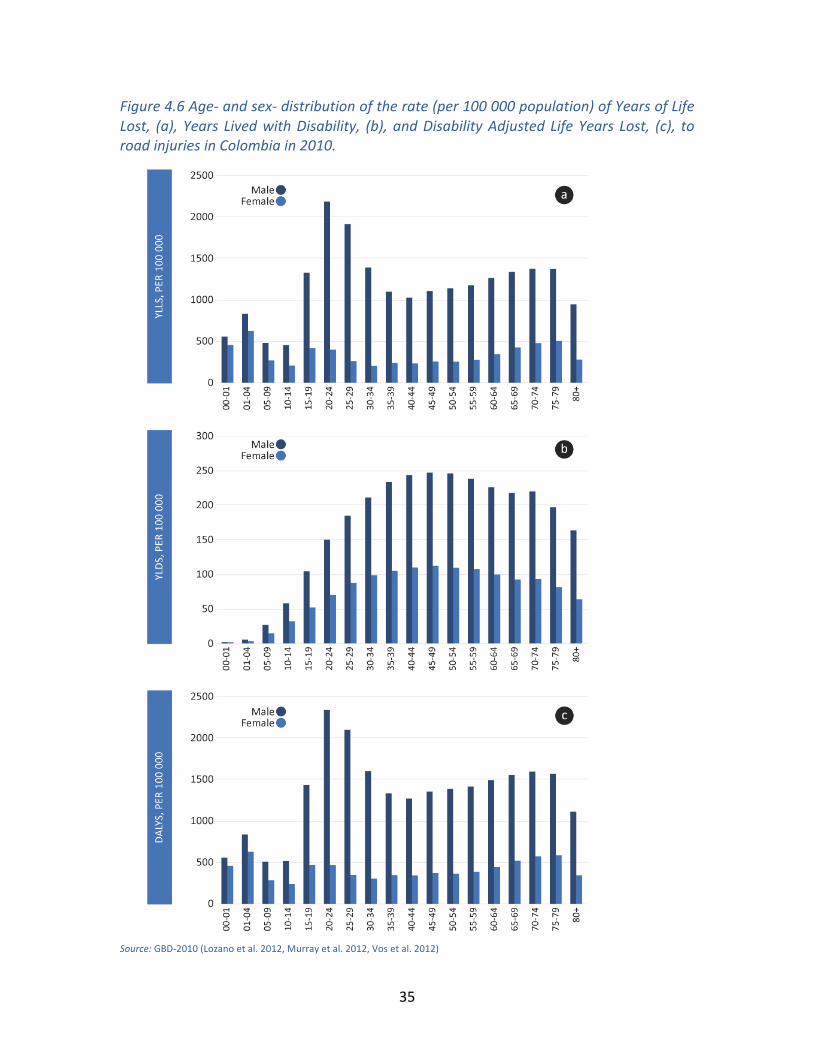
Figures 4.5 and 4.6 present the mortality and morbidity from road injuries using the three summary measures of public health, years of life lost, years lived with disability, and disability adjusted life years lost. Since most deaths from road injuries occur among young adults (Figure 4.2), the age profile of years of life lost show an even more pronounced peak among young adults and sharper decline in older ages than the age profile of deaths. For the same reason, the age profile of the population rate of YLLs differs from the age-‐profile of deaths. Although death rates peak in the oldest age group, the YLL rate shows a peak among young adults aged 20-‐24 years old even though the rate of years of life lost increases with age among older adults.

28
Unlike years of life lost, which show a large sex-‐differential in most age groups, years lived with disability due to non-‐fatal injuries are relatively similar for men and women. However, the bulk of the burden of road injuries is due to mortality, with non-‐fatal injuries making a relatively small contribution to the overall public health burden. As a result, the overall disability adjusted life years lost, which is the sum of years of life lost and years lived with disability, closely follows the age-‐ sex-‐ profile of years of life lost.
29
Table 4.4 Road injury deaths and non-‐fatal injuries warranting formal medical care disaggregated by sex and age groups in Colombia in 2010.
Victims Population Rates (per 100,000) Age
Deaths
Warranting Admissions
Warranting Other Care
Death
Warranting Admission
Warranting Other Care
MALE 00-‐01 30 120 1066 462,215 6.5 26.0 230.6 01-‐04 182 477 4232 1,835,364 9.9 26.0 230.6 05-‐09 138 1306 9525 2,252,779 6.1 58.0 422.8 10-‐14 140 1582 11306 2,239,195 6.2 70.6 504.9 15-‐19 429 2197 17094 2,216,224 19.4 99.1 771.3 20-‐24 710 2370 20085 2,072,529 34.3 114.4 969.1 25-‐29 622 2309 19477 1,914,421 32.5 120.6 1017.4 30-‐34 448 2191 17755 1,743,955 25.7 125.6 1018.1 35-‐39 340 1794 14355 1,519,534 22.4 118.1 944.7 40-‐44 347 1579 13016 1,493,803 23.2 105.7 871.4 45-‐49 370 1213 10480 1,314,869 28.2 92.2 797.0 50-‐54 355 836 7756 1,077,400 33.0 77.6 719.9 55-‐59 342 540 5597 870,680 39.3 62.0 642.8 60-‐64 317 320 3973 637,013 49.8 50.2 623.6 65-‐69 274 218 3017 430,559 63.7 50.7 700.8 70-‐74 246 138 2334 299,877 82.0 46.2 778.2 75-‐79 213 70 1693 199,558 106.7 34.9 848.2 80+ 283 98 1857 195,844 144.4 50.0 948.2 Total 5788 19360 164617 22,775,819 25.4 85.0 722.8 FEMALE 00-‐01 24 75 693 441,491 5.3 16.9 157.0 01-‐04 131 296 2756 1,755,293 7.5 16.9 157.0 05-‐09 74 821 5927 2,161,967 3.4 38.0 274.1 10-‐14 61 922 6467 2,153,387 2.9 42.8 300.3 15-‐19 131 1098 8102 2,142,728 6.1 51.2 378.1 20-‐24 128 1230 9017 2,038,387 6.3 60.3 442.3 25-‐29 86 1274 9142 1,930,492 4.5 66.0 473.6 30-‐34 70 1212 8600 1,808,953 3.9 67.0 475.4 35-‐39 81 972 7002 1,620,937 5.0 60.0 432.0 40-‐44 86 861 6293 1,619,426 5.3 53.1 388.6 45-‐49 95 669 5032 1,442,736 6.6 46.3 348.8 50-‐54 89 485 3763 1,198,966 7.4 40.4 313.9 55-‐59 93 329 2751 986,279 9.4 33.3 278.9 60-‐64 101 213 2033 739,475 13.7 28.8 275.0 65-‐69 106 154 1672 518,739 20.4 29.6 322.2 70-‐74 109 111 1405 380,060 28.7 29.2 369.6 75-‐79 107 73 1099 270,354 39.4 26.8 406.4 80+ 144 91 1347 306,054 47.0 29.9 440.3 Total 1715 10884 83101 23,515,724 7.3 46.3 353.4 Grand Total
7503 30244 247718 46,291,543 16.2 65.3 535.1
Notes: For non-‐fatal injuries, hospital “admissions” and “outpatient” visits do not correspond to actual hospital care. Instead, these correspond to cases with injury severity sufficient to warrant hospital admission or outpatient care if there were no barriers to access to such medical care. Source: GBD-‐2010 (Lozano et al. 2012, Murray et al. 2012, Vos et al. 2012)
30
Figure 4.2 Age-‐ and sex-‐ distribution of road injury deaths, (a), non-‐fatal road injuries warranting hospitalization, (b), and non-‐fatal road injuries warranting outpatient care, (c), in Colombia in 2010.
Source: GBD-‐2010 (Lozano et al. 2012, Murray et al. 2012, Vos et al. 2012)

31
Figure 4.3 Age-‐ and sex-‐ distribution of road injury death rates, (a), rate of non-‐fatal road injuries warranting hospitalization, (b), and rate of non-‐fatal road injuries warranting outpatient care, (c), per 100 000 population in Colombia in 2010.
Source: GBD-‐2010 (Lozano et al. 2012, Murray et al. 2012, Vos et al. 2012)

32
Table 4.5 Road deaths and the burden of non-‐fatal injuries by type of road user in Colombia in 2010.
Health Burden Rates (per 100,000) Deaths YLLs YLDs DALYs Deaths YLLs YLDs DALYs
Pedestrians 3069 120992 18715 139706 6.6 261.4 40.4 301.8 cyclists 518 24273 3657 27930 1.1 52.4 7.9 60.3 Motorcyclists 1776 95790 13770 109560 3.8 206.9 29.7 236.7 Occupants 2044 96859 16011 112870 4.4 209.2 34.6 243.8 Others 96 4035 622 4657 0.2 8.7 1.3 10.1
Total 7503 341949 52775 394724 16 739 114 853 Source: GBD-‐2010 (Lozano et al. 2012, Murray et al. 2012, Vos et al. 2012)
33
Figure 4.4 Road user distributions of road traffic deaths, (a), Years of Life Lost, (b), Years Lived with Disability, and Disability Adjusted Life Years Lost in Colombia in 2010.
Source: GBD-‐2010 (Lozano et al. 2012, Murray et al. 2012, Vos et al. 2012)

34
Figure 4.5 Age-‐ and sex-‐ distributions of Years of Life Lost, (a), Years Lived with Disability, (b), and Disability Adjusted Life Years Lost, (c), to road injuries in Colombia in 2010.
Source: GBD-‐2010 (Lozano et al. 2012, Murray et al. 2012, Vos et al. 2012)
35
Figure 4.6 Age-‐ and sex-‐ distribution of the rate (per 100 000 population) of Years of Life Lost, (a), Years Lived with Disability, (b), and Disability Adjusted Life Years Lost, (c), to road injuries in Colombia in 2010.
Source: GBD-‐2010 (Lozano et al. 2012, Murray et al. 2012, Vos et al. 2012)

36
Estimates of Costs of Road Injuries in Colombia
METHODS BASED ON VALUATION OF STATISTICAL LIFE YEARS
Table 4.6 illustrates that the cost of road traffic injuries varies substantially based on the method used to implement the VSLY approach. The cost of road traffic injuries in Colombia ranges from US$ 2.4 billion to $11.8 billion. The highest estimate results from the equation proposed by IRAP (WTP-‐IRAP) using VSLYs based on the willingness to pay method and is equivalent to 4.2% of the national GDP. However, the WTP-‐IRAP estimate is almost three times our corrected estimate (WTP-‐IRAP*) of $4.5 billion, equivalent to 1.6% of the national GDP. The method proposed by Miller (WTP-‐Miller) results in cost estimates that are approximately three-‐fourths of the WTP-‐IRAP estimate. Finally, the method proposed by Cropper (WTP-‐Cropper) results in a cost estimate that is about half of this value (US$ 5.1 billion, equivalent to 1.8% of the national GDP).
The CMH1 and CMH3 rule-‐of-‐thumb estimates differ by a factor of exactly 3 because the rule assigns an economic value to DALYs that differ by a factor of 3. While the CMH1 estimate is much smaller than the other VSLY estimates, the CMH3 cost estimate (US$ 7.3 billion) falls within the range of estimates from the other methods that rely on more sophisticated analysis for estimating VSLY.
The age-‐ and sex-‐ profile (Figure 4.7) of the costs is similar across the methods with some notable differences. In each age group, the ratio of costs for men and women is similar to the public health burden (Figure 4.5). This is to be expected because the cost structure and costing methods do not differentiate between genders. Across the various methods, the male-‐female ratio of costs ranges from 3.1 to 3.4. In comparison, the male-‐female ratio of DALYs is 3.2.
Costs to society are highest for the 20-‐24 years age group across all methods. The age-‐profile of CMH-‐1, CMH-‐3, WTP-‐Miller, and WTP-‐Cropper closely resemble each other. However, WTP-‐IRAP is notably different from the other VSLY methods. The cost structure for WTP-‐IRAP shows substantially higher costs among older age groups and a spike in the oldest age group. The difference in cost profiles is because WTP-‐IRAP costs are not indexed on DALYs but on deaths and serious injuries.

37
Table 4.6 Costs (millions of US$, current prices) of road crashes in Colombia in 2010 using various implementations of methods based on value of a statistical life year.
Value of a Statistical Life Year Methods CMH1 CMH3 WTP-‐Miller WTP-‐Cropper WTP-‐IRAP WTP-‐IRAP* MALE 00-‐01 16.1 48.3 58.3 34.0 61.3 29.7 01-‐04 95.7 287.1 346.4 201.9 367.7 176.4 05-‐09 71.8 215.5 260.0 151.6 270.9 132.1 10-‐14 197.5 592.5 715.0 416.7 265.2 133.0 15-‐19 301.3 903.9 1090.7 635.7 791.4 365.2 20-‐24 250.0 750.0 905.0 527.5 1270.5 556.6 25-‐29 173.7 521.0 628.7 366.4 1077.2 462.5 30-‐34 126.0 378.1 456.2 265.9 751.7 322.0 35-‐39 118.1 354.2 427.4 249.1 551.2 233.8 40-‐44 110.9 332.6 401.3 233.9 542.9 219.2 45-‐49 71.5 214.4 258.7 150.8 558.6 206.0 50-‐54 93.0 279.0 336.7 196.2 516.8 172.7 55-‐59 76.7 230.0 277.5 161.7 479.3 142.4 60-‐64 59.0 177.1 213.7 124.6 427.7 109.7 65-‐69 41.6 124.9 150.8 87.9 356.0 77.2 70-‐74 29.8 89.3 107.7 62.8 307.2 55.3 75-‐79 19.5 58.5 70.6 41.1 256.5 36.2 80+ 13.5 40.6 49.0 28.6 320.4 25.2 Total 1865.6 5596.9 6753.6 3936.5 9172.4 3455.0 FEMALE 00-‐01 12.6 37.9 45.7 26.7 48.2 23.3 01-‐04 68.7 206.2 248.8 145.0 264.5 126.7 05-‐09 32.4 97.3 117.4 68.4 145.5 71.0 10-‐14 63.0 189.1 228.2 133.0 116.7 60.2 15-‐19 59.7 179.2 216.2 126.0 242.0 116.9 20-‐24 42.1 126.3 152.4 88.9 229.0 110.9 25-‐29 34.5 103.5 124.9 72.8 149.5 78.6 30-‐34 35.1 105.4 127.1 74.1 116.8 64.8 35-‐39 34.7 104.2 125.7 73.3 130.3 66.0 40-‐44 33.3 100.0 120.7 70.4 134.8 65.2 45-‐49 38.4 115.2 139.0 81.0 143.4 62.7 50-‐54 27.3 81.8 98.8 57.6 129.1 51.2 55-‐59 23.8 71.5 86.3 50.3 129.6 44.6 60-‐64 20.5 61.6 74.4 43.3 136.3 38.4 65-‐69 16.8 50.5 60.9 35.5 137.6 31.3 70-‐74 13.6 40.8 49.2 28.7 136.4 25.3 75-‐79 9.9 29.6 35.7 20.8 128.3 18.4 80+ 6.6 19.8 23.9 13.9 162.0 12.4 Total 573.3 1719.9 2075.4 1209.7 2680.0 1067.9 Grand Total 2439.0 7316.9 8829.0 5146.2 11852.4 4522.9 WTP-‐IRAP* is our correction to the IRAP valuation method, where we estimate the cost of non-‐fatal road injuries based on their relative public health burden. Source: Authors' calculations

38
Figure 4.7 Age-‐ and sex-‐ distributions of costs (millions of US$, current prices) of road crashes in Colombia in 2010 using various implementations of five methods based on value of a statistical life year.
Source: Authors' calculations

39
METHODS BASED ON COST-‐OF-‐ILLNESS
In general, methods that are based on valuing statistical life result in cost estimates that are higher than methods that aim to estimate the direct and indirect costs of labor losses, medical expenses, funeral expenses, property damage, and various administrative costs (Table 4.7). The only substantial cost using cost-‐of-‐illness methods is labor loss, which amounts to US$ 1.9 billion, or 0.7% of the national GDP. Medical costs computed using the two methods were US$ 0.04 billion and US$ 0.07 billion. Although these estimates of medical costs differ substantially, these differences are small compared with the difference between medical costs and labor losses, which are over 20 times higher.
Property damage results in losses of US$ 0.49 billion, which are more than six times that of medical costs, but only about one-‐fourth of labor losses. In comparison with these costs, funeral costs are negligibly small at US$ 0.003 billion. Among administrative costs, the largest costs are those of administering legal medicine. These costs amount to US$ 0.07 billion and are similar in magnitude to medical losses. In comparison, the administration costs of police and insurance are substantially lower at US$ 0.02 billion and US$ 0.03 billion, respectively.
The age-‐ and sex-‐ profile (Figure 4.8) of the costs differs only slightly based on the type of cost. In general, costs are highest among young adults in the 15-‐19 and 20-‐24 years age groups. The age-‐profiles differ relatively more at higher ages. Labor losses are small for injuries among the elderly because of the shorter future earning streams in older age groups. However, in contrast, medical costs are higher for the elderly. Similarly, costs of funerals and all administrative costs are higher in this age group primarily because these costs are higher for deaths and the case fatality rates are higher in the elderly.
The male-‐female ratio of costs is similar to the male-‐female ratio of injury incidence. This is primarily because our unit costs were intentionally estimated to be the same for both genders to avoid gender inequities in cost estimates. Across the various methods, the male-‐female ratio of costs ranges from 1.8 to 3.4.
The proportional contribution of different road user groups to the total societal cost (Figure 4.9) varies substantially across methods. With the notable exception of property damage, the largest contribution for most aspects of the costs is due to pedestrian injuries, ranging from 35% to 41% of total costs. As expected, property damage costs are highest in crashes that involve injuries to truck occupants. Trucks contribute 61% of the total property damage costs, even though truck occupants account for a small portion (6%) of deaths. Similarly, crashes that result in injuries to motorcyclists contribute between 23% and 27% of costs with the exception of losses due to property damage, where such crashes only account for 3.5% of overall costs.

40
Table 4.7 Various aspects of costs (millions of US$, current prices) of road crashes in Colombia in 2010 using the cost-‐of-‐illness method.
Administrative Costs Total Costs
Labor
Medical-‐1
Medical-‐2
Funeral
Property Damage
Insur-‐ance
Police
Legal Med
Using Medical-‐1
Using Medical-‐2
MALE 00-‐01 9.5 0.2 0.3 0.0 3.1 0.1 0.1 0.3 13.2 13.3 01-‐04 49.5 0.6 1.3 0.1 8.3 0.5 0.4 1.2 60.6 61.3 05-‐09 66.3 1.7 2.9 0.1 17.0 1.2 0.8 2.7 89.7 90.9 10-‐14 74.8 2.1 3.5 0.1 21.9 1.4 1.0 3.3 104.6 105.9 15-‐19 144.1 3.0 5.2 0.2 29.1 2.2 1.5 5.0 185.2 187.4 20-‐24 194.2 3.2 6.0 0.3 32.7 2.6 1.8 5.8 240.6 243.3 25-‐29 171.6 3.1 5.8 0.3 34.0 2.5 1.7 5.6 218.8 221.4 30-‐34 134.5 2.9 5.3 0.2 34.8 2.2 1.5 5.1 181.3 183.6 35-‐39 102.1 2.4 4.3 0.2 29.4 1.8 1.2 4.1 141.3 143.1 40-‐44 92.8 2.1 3.9 0.2 27.7 1.6 1.1 3.7 129.3 131.0 45-‐49 81.7 1.6 3.1 0.2 22.8 1.3 0.9 3.0 111.5 113.0 50-‐54 66.3 1.2 2.3 0.2 17.2 1.0 0.7 2.3 88.8 90.0 55-‐59 53.2 0.8 1.7 0.2 12.1 0.7 0.5 1.7 69.1 70.0 60-‐64 41.0 0.5 1.2 0.1 8.1 0.5 0.4 1.2 51.8 52.5 65-‐69 30.1 0.3 0.9 0.1 5.9 0.4 0.3 0.9 38.2 38.7 70-‐74 22.1 0.2 0.7 0.1 4.0 0.3 0.3 0.7 27.7 28.2 75-‐79 14.9 0.1 0.5 0.1 2.9 0.2 0.2 0.5 19.0 19.4 80+ 11.1 0.2 0.6 0.1 3.2 0.3 0.2 0.6 15.8 16.2 Total 1359.8 26.4 49.3 2.7 314.1 21.1 14.6 47.8 1786.5 1809.4 FEMALE 00-‐01 6.9 0.1 0.2 0.0 2.1 0.1 0.1 0.2 9.4 9.5 01-‐04 34.2 0.4 0.8 0.1 5.4 0.4 0.3 0.8 41.5 41.9 05-‐09 38.7 1.1 1.8 0.0 11.7 0.7 0.5 1.7 54.4 55.1 10-‐14 38.6 1.2 1.9 0.0 13.1 0.8 0.5 1.8 56.1 56.8 15-‐19 55.8 1.4 2.4 0.1 16.1 1.0 0.7 2.3 77.4 78.3 20-‐24 57.9 1.6 2.7 0.1 17.8 1.1 0.7 2.5 81.8 82.9 25-‐29 50.3 1.7 2.7 0.0 20.0 1.1 0.7 2.6 76.5 77.5 30-‐34 44.1 1.6 2.6 0.0 19.6 1.1 0.7 2.4 69.5 70.5 35-‐39 38.4 1.3 2.1 0.0 15.8 0.9 0.6 2.0 58.9 59.8 40-‐44 34.7 1.1 1.9 0.0 14.7 0.8 0.5 1.8 53.7 54.4 45-‐49 29.2 0.9 1.5 0.0 11.4 0.6 0.4 1.4 44.0 44.6 50-‐54 22.4 0.6 1.1 0.0 8.0 0.5 0.3 1.1 32.9 33.4 55-‐59 17.9 0.4 0.8 0.0 5.9 0.3 0.2 0.8 25.7 26.0 60-‐64 15.0 0.3 0.6 0.0 4.1 0.3 0.2 0.6 20.5 20.8 65-‐69 12.7 0.2 0.5 0.0 3.4 0.2 0.2 0.5 17.3 17.5 70-‐74 10.5 0.2 0.4 0.1 2.5 0.2 0.1 0.4 13.9 14.1 75-‐79 7.9 0.1 0.3 0.0 1.9 0.1 0.1 0.3 10.5 10.7 80+ 5.5 0.1 0.4 0.1 2.3 0.2 0.1 0.4 8.8 9.0 Total 520.7 14.4 24.8 0.8 175.8 10.3 7.0 23.5 752.6 763.0 Grand Total
1880.6 40.8 74.1 3.5 489.9 31.4 21.6 71.3 2539.1 2572.3
Source: Authors' calculations

41
Figure 4.8 Age-‐ and sex-‐ distributions of various aspects of costs (millions of US$, current prices) of road crashes in Colombia in 2010 using cost-‐of-‐illness method.
Source: Authors' calculations
42
Figure 4.9 Distribution of various aspects costs by road user category in Colombia in 2010 using the cost-‐of-‐illness method.
Source: Authors' calculations
COMPARISONS OF COST-‐OF-‐ILLNESS AND VSLY METHODS
Figure 4.10 compares the total cost estimated using the various valuation methods. In general, the VSLY approaches provide higher estimates than cost estimated using the cost-‐of-‐illness method. The lowest VSLY estimate is obtained using the CMH-‐1 method, which is approximately the same as labor losses, which is the only substantive cost estimate from the cost-‐of-‐illness method. In essence, CMH-‐1, which values one year lost to disability at one unit of GDP per capita, is measuring labor losses. Hence, it is not surprising that CMH-‐1 estimates are similar to labor losses.
In particular, it should be noted that medical costs are much smaller than other costs. Estimating medical costs pose the most serious technical challenge for estimating the cost of injuries. However, because the magnitude of medical costs is relatively small, refinement of medical costs provides relatively little improvement in our understanding of the total economic burden of road injuries.
Figure 4.10 also illustrates the extent to which the IRAP method overestimates the cost of non-‐fatal road injuries. In the other VSLY methods, non-‐fatal injuries contribute approximately 12% of the total cost of injuries. In contrast, the IRAP method attributes 67% of the total cost to non-‐fatal injuries. Our correction (WTP-‐IRAP*), which attributes the proportion of non-‐fatal costs based on the proportion of the health burden (ratio of YLDs to DALYs), results in cost estimates that are comparable to WTP-‐Cropper.
The VSLY-‐based methods shown in Figure 4.10 have a fourfold variation. The variation is smaller (equivalent to 1.6% to 3.1% of GDP) using methods that are based on empirical measurement of willingness to pay – WTP-‐Miller, WTP-‐Cropper, and our corrected IRAP estimate, WTP-‐IRAP*. In the remainder of this report, we present results from these three methods as the range of VSLY-‐based cost estimates.

43
Figure 4.10 Comparison of estimates of costs of road injuries in Colombia in 2010 using various costing methods.
Note: Numbers in parenthesis show costs in terms of percentage of GDP. Source: Authors' calculations
COST OF ROAD INJURIES IN ARGENTINA, MEXICO, AND PARAGUAY
Figures 4.11-‐4.13 illustrate the costs of road injuries in Argentina, Mexico, and Paraguay in 2010 using the WTP-‐Cropper, WTP-‐Miller, and our corrected IRAP estimate, WTP-‐IRAP*. As with the estimates for Colombia, the WTP-‐Miller estimates are the highest and WTP-‐IRAP* are the lowest in all three countries.
In Argentina, the VSLY-‐based estimates range from US$ 5.2 billion to US$ 10.0 billion. Crashes that injure vehicle occupants result in 63% of all costs of road injuries. Crashes that injure motorcycle riders result in an additional 17% of all costs of road injuries. In Mexico, the VSLY-‐based estimates range from US$ 18.0 billion to US$ 35.1 billion. Crashes that injure occupants of vehicles result in half of all costs of road injuries. Crashes that injure pedestrians result in an additional 37% of all costs of road injuries. In Paraguay, the VSLY-‐based estimates range from US$ 345 million to US$ 673 million. Crashes that injure pedestrians result in 37% and crashes that injure motorcyclists result in an additional 31% of all costs.
Figure 4.14 illustrates costs in Argentina, Colombia, Mexico, and Paraguay as proportions of national GDP. Our cost estimates range from 1.5% to 2.9% for Argentina, from 1.6% to 3.1% in Colombia, from 1.8% to 3.5% in Mexico, and 2.0% to 3.9% in Paraguay.1
1 In 2010, Argentina had a GDP of US$351 billion and GDP per capita of US$8,663; Colombia: US$283 billion and US$6,221; Mexico: US$1004 billion and US$9,243; and Paraguay: US$17 billion and US$2,682.

44
Figure 4.11 Total cost of road injuries, (a), and road-‐user distribution (b), in Argentina in 2010 using VSLY-‐based methods. Cost is in millions of US$, current prices. Road-‐user break down of costs is shown for the VSLY-‐Cropper method.
Source: Authors' calculations

45
Figure 4.12 Total cost of road injuries, (a), and road-‐user distribution (b), in Mexico in 2010 using VSLY-‐based methods. Cost is in millions of US$, current prices. Road-‐user break down of costs is shown for the VSLY-‐Cropper method.
Source: Authors' calculations

46
Figure 4.13 Total cost of road injuries, (a), and road-‐user distribution (b), in Paraguay in 2010 using VSLY-‐based methods. Cost is in millions of US$, current prices. Road-‐user break down of costs is shown for the VSLY-‐Cropper method.
Source: Authors' calculations
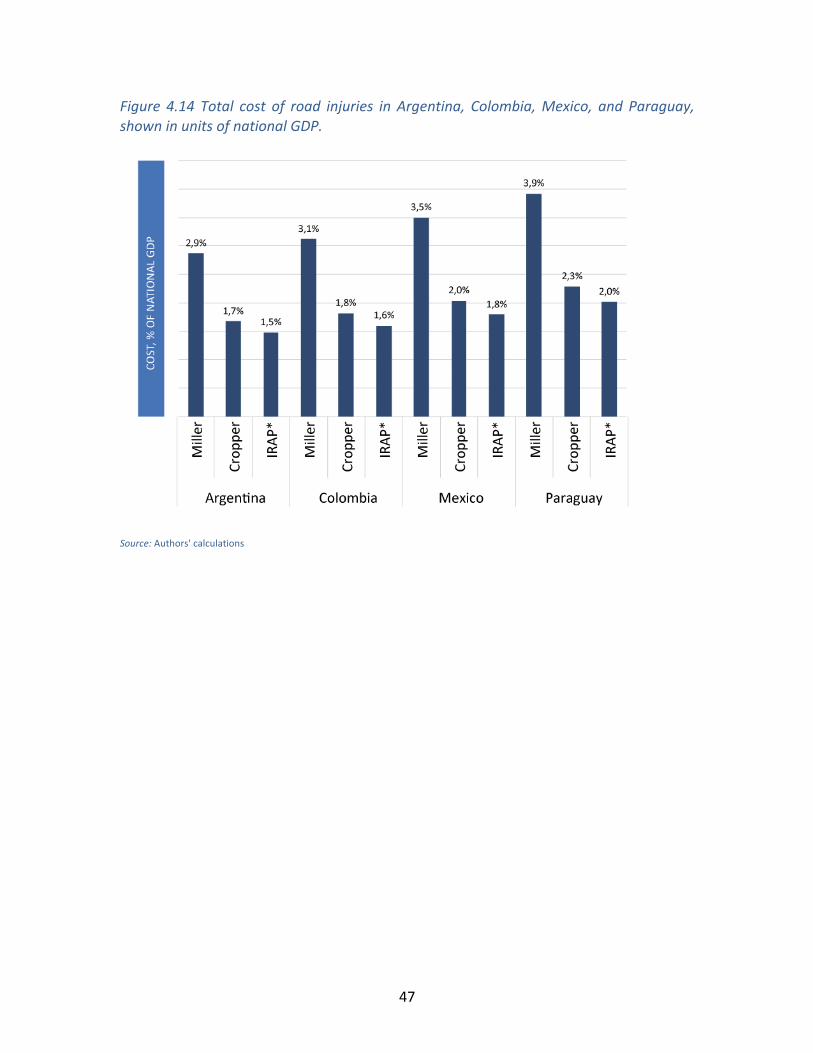
47
Figure 4.14 Total cost of road injuries in Argentina, Colombia, Mexico, and Paraguay, shown in units of national GDP.
Source: Authors' calculations

48
5.0 DISCUSSION
Road safety ranks low in national health and development priorities even though the large public health burden of traffic crashes has been known since the mid 1990s when results from the first Global Burden of Disease study were published. Safety programs will require large and sustained investments in a wide range of areas including strengthening national institutions, highway infrastructure, vehicle design, trauma care, enforcement and education for safe road use. Our call for increased financial investments in road safety needs to be supported by economic arguments directed at decision makers who manage the allocation of financial resources. Estimates of the economic impacts of diseases and injuries can provide guidance in such decision-‐making. This report surveyed the methods that have been commonly used in the health economics research literature to estimate the economic burden of illness. We implemented these methods to construct estimates of the cost of road traffic injuries in Colombia, Argentina, Mexico, and Paraguay.
Implications of findings We show that the estimates of road traffic injuries can differ substantially depending on the choice of method and cost indicator. This is partly because the methods differ substantially in their underlying theoretical foundation. The methods based on valuing a statistical life have a clearer basis in welfare economics. These methods aim to estimate how much a society would be willing to spend on a health problem. However, the process of constructing such estimates does not allow disaggregating costs into categories that may be of special interest to particular policy makers. For instance, a Minister of Health may have a primary interest in quantifying medical expenses but this indicator cannot be isolated from the aggregated estimate of the cost of a statistical life. Thus, producing disaggregated costs are important for guiding policy dialogue even if the only methods that allow theoretically defensible estimates of aggregate costs are based on a completely different methodological framework.
The wide variation in cost estimates using different methods and cost indicators has important practical implications for costing research. It is often believed that the availability of better and more data could improve estimates of costs. Indeed, it is true that our estimation of costs of road traffic injuries in Colombia required many assumptions to fill gaps in information and to allow us to combine data from a variety of sources. If we had more detailed data from the medical system then our estimates of medical costs could be refined. Such assumptions explain, for example, the differences between our estimates of medical costs for road traffic injuries in Colombia and the estimates constructed by Bocarejo et al. (2011). However, such differences are much smaller than the variation in cost estimates that results from different methodological frameworks. The estimates based on valuing a statistical life are much higher than other cost estimates. Further, even within methods that value statistical life, there is substantial variation in estimates based on how they are implemented. The large

49
variations evident in Figure 4.10 imply that refining estimates from any one method by incorporating better data sources (e.g. better hospital facility data or vehicle damage data) will not reduce the spread in estimates that result from variation across methodological frameworks. As a result, investing in improving data availability is unlikely to yield much dividend in terms of improved cost estimates. Instead, it may be much more important to replicate the simple methods illustrated in this paper in as many countries as possible to encourage immediate investments in road safety.
In fact, the uncertainty in the estimates of costs is less important than the overwhelming fact that the estimates are large. Across the four countries for which costs were assessed in this report, the estimates based on the willingness-‐to-‐pay literature range from 1.5% to 3.9% of national GDP (Figure 4.14), which are orders of magnitude higher than current investments in road safety. Even crude estimates can make the case for the large economic burden relatively easily. For this reason it is common for health researchers to use crude rules-‐of-‐thumb (CMH-‐1 and CMH-‐3) for estimating the costs of diseases and justifying investments in health. These rules-‐of-‐thumb were one of the approaches used by Bloom et al. (2011) to estimate the global economic burden of non-‐communicable diseases in a report to the 2011 World Economic Forum in the context of a high level meeting of the UN General Assembly focusing on the prevention and control of non-‐communicable diseases (NCDs). Many other studies (Stein and Qaim (2007), Rijsberman (2004), Collier and Hoeffler (2004), Zimmerman and Qaim (2004), and Mills and Shillcutt (2004)) have used the same approach.
Costing studies are inevitably done in a political context with either advocacy in mind or for providing statistics for rational resource allocation. As discussed above, Bloom et al. (2011) aimed to influence global discussions on NCDs. Similarly, it is common for costing studies to target national policy makers. For instance, a 1989 study on the cost of injuries to the US Congress aimed to influence an on-‐going debate on road safety expenditure. Thus, a fundamental consideration in constructing economic burden estimates is to understand the ongoing policy debate and who are participating in it. These could be government agencies that have a stake in road safety, international agencies that provide development assessment for health, the private sector which often bears economic losses or civil society. A better understanding of the policy makers and the policy dialogue should determine what economic indicators we choose to estimate – e.g. loss of GDP, total medical expenditure in the country, loss of production of private enterprises, loss of family incomes, etc.
The purpose of constructing estimates of the cost of injuries is to present economic arguments about the costs and benefits of road safety programs. However, it is important to note that studies that aim to aggregate the total costs of illness and injury (such as our study) say nothing about the existence of solutions. To complete the economic argument we need to show that road injuries are a tractable problem. Although a detailed description of the effectiveness of road safety interventions is beyond the scope of our costing project, we should note that compared with most other
50
health problems, road injuries are highly amenable to prevention and control. This is clearly evident from the history of road injury rates in North American and European countries, which have well-‐established road safety programs and have seen steadily declining injury rates over the last four decades of sustained efforts. In some of these countries, it is commonplace to conduct detailed Cost-‐Benefit Analyses to support decision making in Transport Policy. See, for instance, the guidance from the UK Department for Transportation (UKDFT 2011) on how to conduct such studies, and the illustrative example provided by the American Public Health Association of urban and transport planning in San Francisco (APHA 2010).
Although road safety competes for attention with other pressing global health concerns, road traffic crashes occur in a development context that is different from that of many diseases and illnesses. Malnutrition, diarrhea, and many infectious diseases occur in a context of extreme poverty where financial resources are severely limited. Instead road traffic crashes are an outcome of a vision of economic development that involves large financial flows. The dramatic growth in highway infrastructure and vehicle fleet, even in some of the poorest regions of the world, highlights the financial strength of the transport sector globally. In such a context, our estimates highlight that road safety deserves a substantive proportion of these financial flows. This will allow investments in safer infrastructure, safer vehicle designs, human resources for enforcement and large population programs aimed at improving behavior that are necessary to provide safe, sustainable and equitable economic development for everybody.
Recommendations for Future Work on Costing in Latin America The central question addressed by our study is about the choice of methods for constructing estimates of cost of road injuries in countries in Latin America. Our primary recommendation is that the choice of methods should be based on whether costs are being constructed in a cross-‐national perspective or in a national (or sub-‐national) perspective, and if there is an existing policy debate that the estimates are seeking to influence.
We recommend using methods based on valuation of a statistical life year (VSLY) if the economic burden estimates are being constructed for cross-‐national comparative work with the purpose of bringing global and regional policy attention to road safety. There are several advantages to the VSLY approach in this context. Importantly, the willingness-‐to-‐pay approaches used in most valuations of life have a much stronger foundation in welfare economics than competing methods based in cost-‐of-‐illness. As such, these valuation methods allow a much more complete account of the full costs by including intangible outcomes of pain and suffering. Partly for this reason, the resulting cost estimates are higher using VSLY-‐based methods than the cost-‐of-‐illness method.
A second reason in support of VSLY-‐based methods in cross-‐national work is that they allow constructing cost estimates in a common and comparative framework. As we have shown in this study, costing of road injuries requires starting from estimates of the

51
incidence of injuries. This requires a comprehensive accounting of deaths and non-‐fatal injuries among different sex-‐ and age-‐ groups, and road-‐user types. However, national databases on the incidence of road injuries can be inherently incomparable because of variation in definitions, injury severity thresholds and under-‐reporting. In recent years a substantial amount of effort in the health metrics community has focused on developing techniques to combine estimates of the incidence of morbidity and mortality of disease in a single summary measure of population health, DALYs. As we have shown, VSLY methods are easily adapted to valuation of DALYs allowing a consistent estimate of costs that is not only comparable across countries but also across other health concerns.
Finally, VSLY methods are easy to implement, which is important for maintaining up-‐to-‐date cross-‐country databases. Thus, for instance, the GBD-‐2010 study is now expected to produce a continuously updated database of the health burden (deaths, YLLs, YLDs) for all diseases including road injuries at the national level. This creates an opportunity to code the VSLY calculations from our study into a plug-‐in module that provides a database of continuously updated costs of road injuries in all Latin American countries.
In general, there is a large variation in cost estimates within the VSLY-‐based methods. These variations partly reflect differences in attempts at aggregating the limited evidence on willingness to pay especially from low-‐ and middle-‐income countries. They also reflect the effect of ad-‐hoc assumptions that often need to be made in such work, such as the parameters used for costing non-‐fatal injuries in the IRAP method. We do not expect that the availability of such evidence will dramatically improve in the short-‐term and it is likely that different researchers will continue to use different implementations of VSLY. Therefore, we suggest that wherever possible road injury cost estimates should be calculated using multiple methods (including WTP-‐Miller, WTP-‐Cropper, and WTP-‐IRAP*) and the results should be reported as ranges highlighting the uncertainty inherent in such calculations.
Therefore, we recommend VSLY-‐based methods because of a stronger theoretical foundation, consistency in cross-‐national analysis and ease of analysis. However, cost-‐of-‐illness methods may have an important role to play in national studies. A key weakness of VSLY-‐based methods is that they do not allow partitioning costs into clear categories such as medical costs, labor losses, administrative costs and reduction in infrastructure capacity, which may be important to different stakeholders. In particular, assessing the costs of delays due to congestion at crash sites is an important consideration for the transport sector. Assessing these costs were beyond the scope of our analysis but should be considered in future work.
Constructing cost-‐of-‐illness estimates becomes especially important if an ongoing national policy dialogue is focused on a particular aspect of costs and if competing health policy options are already being framed using a cost-‐of-‐illness approach. It should be noted however that a careful accounting of costs (such as medical costs) and financial flows is technically challenging. The substantial effort may not be warranted in
52
the absence of an ongoing policy dialogue especially since the resulting cost estimates are much lower than VSLY-‐based estimates and do not reflect the true social costs.
These conclusions are based on considerations of how costing studies in Latin America should be implemented in the short term given the current state of knowledge on how to cost illness. In the longer term, it is likely that macroeconomic growth simulations will become common in the health economics community. The reason for this transition is that such simulations are the only legitimate approach to estimating losses to GDP due to illness and injuries. However, these methods are still in the early stages of development and have never been applied to estimating losses from injuries. Developing such models for road injuries was beyond the scope of the current work but research in this area may be important in the longer term.

53
REFERENCES
• ADB-‐ASEAN. (2003). The cost of road traffic accidents in Brunei Darussalam. ADB-‐ASEAN Regional Road Safety Program.
• Abegunde, D., & Stanciole, A. (2006). Estimation of the economic impact of chronic noncommunicable diseases in selected countries. World Health Organization.
• Abegunde, D. O., Mathers, C. D., Adam, T., Ortegon, M., & Strong, K. (2007). The burden and costs of chronic diseases in low-‐income and middle-‐income countries. Lancet, 370(9603), 1929-‐1938. doi: 10.1016/S0140-‐6736(07)61696-‐1
• Aertsens, J., Geus, B. d., Vandenbulcke, G., Degraeuwe, B., Broekx, S., Nocker, L. D., et al. (2010). Commuting by bike in Belgium, the costs of minor accidents. Accident Analysis and Prevention, 42(6), 2149-‐2157. doi: 10.1016/j.aap.2010.07.008
• Al-‐Masaeid, H. R., Al-‐Mashakbeh, A. A., & Qudah, A. M. (1999). Economic costs of traffic accidents in Jordan. Accident Analysis & Prevention, 31(4), 347-‐357.
• Barceló, A., Aedo, C., Rajpathak, S., & Robles, S. (2003). The cost of diabetes in Latin America and the Caribbean. Bulletin of the World Health Organization, 81(1), 19-‐27.
• Bocarejo, J.P., Velasquez, J.M., Diaz, C.A., and Rojas, J.S. (2011). Desarrollo de Metodologia de valoracion del costo economic de la accidentalidad vial en Colombia y su calculo para el periodo 2008-‐2010, Universidad de los Andes y Fondo de Prevencion Vial.
• Bhalla, K., Harrison, J., Shahraz, S., & Fingerhut, L. (2010). Availability and quality of cause-‐of-‐death data for estimating the global burden of injuries. Bulletin of the World Health Organization, 88(11), 831–838.
• Bhalla, K, Sharaz, S, Abraham, JP, Bartels, D, and Yeh, PH, 2011, Road injuries in 18 countries, Department of Global Health and Population, Harvard School of Public Health, Boston, MA, USA.
• Blincoe, L., Seay, A., Zaloshnja, E., Miller, T., Romano, E., Luchter, S., et al. (2002). The economic impact of motor vehicle crashes in the USA, 2000. DOT HS, 809, 446.
• Brent, R. J. (2011). An implicit price of a DALY for use in a cost-‐benefit analysis of ARVs. Applied Economics, 43(11), 1413-‐1421.
• Corso, P. (2006). Incidence and lifetime costs of injuries in the United States. Injury Prevention, 12(4), 212-‐218. doi: 10.1136/ip.2005.010983.
• Cropper, M., & Sahin, S. (2009). Valuing mortality and morbidity in the context of disaster risks. World Bank Policy Research Working Paper No. 4832.
• González, J. C., Walker, J. H., & Einarson, T. R. (2009). Cost-‐of-‐illness study of type 2 diabetes mellitus in Colombia. Rev Panam Salud Publica, 26(1), 55-‐63.
• Ibáñez, A. M., & McConnell, K. (2001). Valuing Morbidity: Acute Respiratory Illnesses in Bogotá, Colombia Draft. AERE Workshop.
• Instituto Nacional de Medicina Legal y Ciencias Forenses. (2011) Forensis, Datos
54
para la Vida. Bogota, Colombia. • Kim, S.-‐G., Hahm, M.-‐I., Choi, K.-‐S., Seung, N.-‐Y., Shin, H.-‐R., & Park, E.-‐C. (2008).
The economic burden of cancer in Korea in 2002. Eur J Cancer Care, 17(2), 136-‐144. doi: 10.1111/j.1365-‐2354.2007.00818.x
• Kuhn, A., & Ruf, O. (2008). The Value of a Statistical Injury: New Evidence from the Swiss Labor Market. Institute for Emperical Research in Economics, University of Zurich, Working Paper Series, ISSN 1424-‐0459.
• Lozano, R., Naghavi, M., Foreman, K., Lim, S., Shibuya, K., Aboyans, V., et al. (2012). Global and regional mortality from 235 causes of death for 20 age groups in 1990 and 2010: a systematic analysis for the Global Burden of Disease Study 2010. The Lancet, 380(9859), 2095–2128. doi:10.1016/S0140-‐6736(12)61728-‐0
• McMahon, K., & Dahdah, S. (2008). The true cost of road crashes. International Road Assessment Program, IRAP, Hampshire, UK.
• Miller, T. (2000). Variations between countries in values of statistical life. Journal of Transport Economics and Policy, pp. 169-‐188.
• Murray, C. J., & Lopez, A. D. (1996). The global burden of disease: a comprehensive assessment of mortality and disability from diseases, injuries, and risk factors in 1990 and projected to 2020: Harvard University Press Cambridge, MA.
• Murray, C. J. L., Vos, T., Lozano, R., Naghavi, M., Flaxman, A. D., Michaud, C., et al. (2012). Disability-‐adjusted life years (DALYs) for 291 diseases and injuries in 21 regions, 1990–2010: a systematic analysis for the Global Burden of Disease Study 2010. The Lancet, 380(9859), 2197–2223. doi:10.1016/S0140-‐6736(12)61689-‐4
• Naumann, R., Dellinger, A., Zaloshnja, E., Lawrence, B., & Miller, T. (2010). Incidence and Total Lifetime Costs of Motor Vehicle-‐Related Fatal and Nonfatal Injury by Road User Type, United States, 2005. GCPI, 11(4), 353-‐360. doi: 10.1080/15389588.2010.486429
• Perez-‐Nunez, R., Avila-‐Burgos, L., Hijar-‐Medina, M., Pelcastre-‐Villafuerte, B., Celis, A., & Salinas-‐Rodriguez, A. (2011). Economic impact of fatal and non-‐fatal road traffic injuries in Guadalajara Metropolitan Area and Jalisco, Mexico. Injury Prevention. doi: 10.1136/ip.2010.027995
• RIO+20 (2012). Commitment to sustainable transport: Joint Statement to the Rio+20 United Nations Conference on Sustainable Development by the African Development Bank, Asian Development Bank, CAF-‐Development Bank of Latin America, European Bank for Reconstruction and Development, European Investment Bank, Inter-‐American Development Bank, Islamic Development Bank, and World Bank.
• Viscusi, W. K., & Aldy, J. E. (2003). The value of a statistical life: a critical review of market estimates throughout the world. Journal of risk and uncertainty, 27(1), 5-‐76.
• Vos, T., Flaxman, A. D., Naghavi, M., Lozano, R., Michaud, C., Ezzati, M., et al. (2012). Years lived with disability (YLDs) for 1160 sequelae of 289 diseases and injuries 1990–2010: a systematic analysis for the Global Burden of Disease Study
55
2010. The Lancet, 380(9859), 2163–2196. doi:10.1016/S0140-‐6736(12)61729-‐2 • WHO. (2001) Macroeconomics and Health: Investing in Health for Economic
Development, Report of the Commission on Macroeconomics and Health, World Health Organization, Geneva.
• WHO. (2003). Guide to cost effectiveness analysis. World Health Organization. • WHO (2004). World report on road traffic injury prevention: World Health
Organization, Geneva. • WHO. (2008a). The Global Burden of Disease: 2004 Update. Geneva: World
Health Organization. • WHO. (2008b). Manual for estimating the economic costs of injuries due to
interpersonal and self-‐directed violence. World Health Organization, Geneva. • WHO. (2009). Guide to identifying the economic consequences of disease and
injury. World Health Organization, Geneva. • WHO. (2009). Global Status Report on Road Safety. World Health Organization,
Geneva. • WHO, 2012, WHO mortality database, Available from:
www.who.int/healthinfo/morttables/, World Health Organization, Geneva. • Wren, J., & Barrell, K. (2010). Cost of injury in New Zealand. New Zealand
Government, New Zealand Injury Prevention Secretariat.

56
APPENDIX 1
Appendix 1a. Literature Review: Country and Cross-‐Country Costing Studies The following studies construct estimates of costs of illness or injury at the national or cross-‐national level. These studies were identified in our literature review. A sample of these studies is reviewed in Table 1.
1. Abegunde, D., & Stanciole, A. (2006). Estimation of the economic impact of chronic noncommunicable diseases in selected countries. World Health Organization.
2. Abegunde, D. O., Mathers, C. D., Adam, T., Ortegon, M., & Strong, K. (2007). The burden and costs of chronic diseases in low-‐income and middle-‐income countries. Lancet, 370(9603), 1929-‐1938. doi: 10.1016/S0140-‐6736(07)61696-‐1
3. ACS. (2010). The global economic cost of cancer. American Cancer Society. 4. ADB. (2005). The cost of road traffic accidents in Brunei Darussalam. ADB-‐ASEAN
Regional Road Safety Program. 5. Aertsens, J., Geus, B. d., Vandenbulcke, G., Degraeuwe, B., Broekx, S., Nocker, L.
D., et al. (2010). Commuting by bike in Belgium, the costs of minor accidents. Accident Analysis and Prevention, 42(6), 2149-‐2157. doi: 10.1016/j.aap.2010.07.008
6. Al-‐Masaeid, H. R., Al-‐Mashakbeh, A. A., & Qudah, A. M. (1999). Economic costs of traffic accidents in Jordan. Accident Analysis & Prevention, 31(4), 347-‐357.
7. Alvis, N., Reyes, J. C., & Carcamo, A. (2002). La mortalidad por SIDA y su impacto económico en Cartagena de Indias, Colombia, 1995-‐2000. Biomédica(003), 303-‐316.
8. Anh, T. T., Dao, N., & Anh, T. (2005). The cost of road traffic accident in Vietnam. Proceedings of the Eastern Asian Society for Transportation Studies, 5, 1923-‐1933.
9. APHA. (2010). Hidden costs of transportation. American Public Health Association.
10. Barceló, A., Aedo, C., Rajpathak, S., & Robles, S. (2003). The cost of diabetes in Latin America and the Caribbean. Bulletin of the World Health Organization, 81(1), 19-‐27.
11. Bastida, J. L., Aguilar, P. S., & González, B. D. (2004). The Economic Costs of Traffic Accidents in Spain. The Journal of Trauma: Injury, Infection, and Critical Care, 56(4), 883-‐889. doi: 10.1097/01.TA.0000069207.43004.A5
12. Bhalla, K, Sharaz, S, Abraham, JP, Bartels, D, and Yeh, PH, 2011, Road injuries in 18 countries, Department of Global Health and Population, Harvard School of Public Health, Boston, MA, USA. Available from: http://roadinjuries.globalburdenofinjuries.org
13. Bishai, D., & Bachani, A. (2012). Cost of Injury in Egypt. in Injury Costing Framework.
14. Blincoe, L., Seay, A., Zaloshnja, E., Miller, T., Romano, E., Luchter, S., et al. (2002). The economic impact of motor vehicle crashes in the USA, 2000. DOT HS, 809,
57
446. 15. Bloom, D. E., Cafiero, E. T., Jane-‐Llopis, E., Abrahams-‐Gessel, S., Bloom, L. R.,
Fathima, S., et al. (2011). The Global Economic Burden of Non-‐Communicable Diseases. World Economic Forum.
16. Chimal, S. Z. (2010). The social and economic cost of crime in Mexico. Universidad Autonoma de Barcelona.
17. Clark, P., Carlos, F., & Vázquez Martínez, J. L. (2010). Epidemiology, costs and burden of osteoporosis in Mexico. Arch Osteoporos, 5(1-‐2), 9-‐17. doi: 10.1007/s11657-‐010-‐0042-‐8
18. Connelly, L. B., & Supangan, R. (2006). The economic costs of road traffic crashes: Australia, states and territories. Accid Anal Prev, 38(6), 1087-‐1093. doi: 10.1016/j.aap.2006.04.015
19. Corso, P. (2006). Incidence and lifetime costs of injuries in the United States. Injury Prevention, 12(4), 212-‐218. doi: 10.1136/ip.2005.010983
20. Gambi, M. (2004). The economic cost of crime in Chile. Latin American Study Association Conference, Las Vegas, USA.
21. Garcia-‐Altes, A., & Perez, K. (2007). The economic cost of road traffic crashes in an urban setting. Injury Prevention, 13(1), 65-‐68. doi: 10.1136/ip.2006.012732
22. García-‐Altés, A., & Puig-‐Junoy, J. (2011). What Is the Social Cost of Injured People in Traffic Collisions? An Assessment for Catalonia. The Journal of Trauma and Acute Care Surgery, 70(3), 744.
23. Ghee, C., Silcock, D., Astrop, A., & Jacobs, G. (1997). Socio-‐economic aspects of road accidents in developing countries. TRL Report, 247, 1999.
24. González, J. C., Walker, J. H., & Einarson, T. R. (2009). Cost-‐of-‐illness study of type 2 diabetes mellitus in Colombia. Rev Panam Salud Publica, 26(1), 55-‐63.
25. Grimm, M., & Treibich, C. (2010). Socio-‐economic determinants of road traffic accident fatalities in low and middle income countries. ISS Working Paper Series/General Series, 504(504).
26. Gururaj, G. (2004). Socio economic impact of road traffic injuries in India. Global Forum for Health Research, Forum 8, Mexico City.
27. Híjar, M., Arredondo, A., Carrillo, Road traffic injuries in an urban area in Mexico: An epidemiological and cost analysis. Accident Analysis & Prevention, 36(1), 37-‐42.
28. Ibáñez, A. M., & McConnell, K. (2001). Valuing Morbidity: Acute Respiratory Illnesses in Bogotá, Colombia Draft. AERE Workshop.
29. Ismail, M. A., & Abdelmageed, S. M. M. (2010). Cost of Road Traffic Accidents in Egypt. World Academy of Science, Engineering and Technology.
30. Johanson, P. (2006). The social costs of alcohol in Sweden 2002. SoRAD, Stockholm University, Sweden, 1-‐180.
31. Kim, S.-‐G., Hahm, M.-‐I., Choi, K.-‐S., Seung, N.-‐Y., Shin, H.-‐R., & Park, E.-‐C. (2008). The economic burden of cancer in Korea in 2002. Eur J Cancer Care, 17(2), 136-‐144. doi: 10.1111/j.1365-‐2354.2007.00818.x
32. Lim, S.-‐J., Chung, W.-‐J., & Cho, W.-‐H. (2011). Economic burden of injuries in South Korea. Injury Prevention. doi: 10.1136/ip.2010.028118

58
33. Macharia, W. M., Njeru, E. K., Muli-‐Musiime, F., & Nantulya, V. (2009). Severe road traffic injuries in Kenya, quality of care and access. Afr Health Sci, 9(2), 118-‐124.
34. Meerding, W. J., Mulder, S., & Van Beeck, E. F. (2006). Incidence and costs of injuries in The Netherlands. The European Journal of Public Health, 16(3), 271-‐277. doi: 10.1093/eurpub/ckl006
35. Miller, T. R., Luchter, S., & Brinkman, C. P. (1989). Crash costs and safety investment. Accident Analysis & Prevention, 21(4), 303-‐315.
36. Mock, C. N., Gloyd, S., Adjei, S., Acheampong, F., & Gish, O. (2003). Economic consequences of injury and resulting family coping strategies in Ghana. Accident Analysis & Prevention, 35(1), 81-‐90.
37. Naumann, R., Dellinger, A., Zaloshnja, E., Lawrence, B., & Miller, T. (2010). Incidence and Total Lifetime Costs of Motor Vehicle-‐Related Fatal and Nonfatal Injury by Road User Type, United States, 2005. GCPI, 11(4), 353-‐360. doi: 10.1080/15389588.2010.486429
38. O'Dea, D., & Wren, J. (2010). New Zealand estimates of the total social and economic cost of all injuries and the six priority areas at June 2008 prices. Technical Report Prepared for NZIPS Evaluation, Accident Compensation Corporation, Wellington, New Zealand.
39. Olukoga, A. (2004). Cost analysis of road traffic crashes in South Africa. Injury control and safety promotion, 11(1), 59-‐62.
40. Perez-‐Nunez, R., Avila-‐Burgos, L., Hijar-‐Medina, M., Pelcastre-‐Villafuerte, B., Celis, A., & Salinas-‐Rodriguez, A. (2011). Economic impact of fatal and non-‐fatal road traffic injuries in Guadalajara Metropolitan Area and Jalisco, Mexico. Injury Prevention. doi: 10.1136/ip.2010.027995
41. Pérez-‐Núñez, R., Híjar-‐Medina, M., Heredia-‐Pi, I., Jones, S., & Silveira-‐Rodrigues, E. M. (2010). Economic impact of fatal and nonfatal road traffic injuries in Belize in 2007. Revista Panamericana de Salud Pública, 28(5), 326-‐336.
42. Piedrahita, H. (2006). Costs of work-‐related musculoskeletal disorders (MSDs) in developing countries: Colombia case. Int J Occup Saf Ergon, 12(4), 379-‐386.
43. Polinder, S., Meerding, W. J., Van Baar, M. E., Toet, H., Mulder, S., & Van Beeck, E. F. (2005). Cost Estimation of Injury-‐Related Hospital Admissions in 10 European Countries. The Journal of Trauma: Injury, Infection, and Critical Care, 59(6), 1283-‐1291. doi: 10.1097/01.ta.0000195998.11304.5b
44. Polinder, S., Toet, H., Mulder, S., & Beeck, E. v. (2008). The economic consequences of injury. APOLLO Project.
45. Riewpaiboon, A., & Piyauthakit, P. (2008). Economic burden of road traffic injuries: a micro-‐costing approach. Southeast Asian J Trop Med Public Health, 39(6), 1139-‐1149.
46. Rim, F., Iman, N., & Hala…, T. (2003). Cost of work-‐related injuries in insured workplaces in Lebanon. Bulletin of the World Health Organization.
47. Rosenthal, V. D., Guzman, S., Migone, O., & Safdar, N. (2005). The attributable cost and length of hospital stay because of nosocomial pneumonia in intensive care units in 3 hospitals in Argentina: a prospective, matched analysis. Am J

59
Infect Control, 33(3), 157-‐161. doi: 10.1016/j.ajic.2004.08.008 48. Spivacow, F. R., & Sánchez, A. (2010). Epidemiology, costs, and burden of
osteoporosis in Argentina, 2009. Arch Osteoporos, 5(1-‐2). doi: 10.1007/s11657-‐010-‐0038-‐4
49. Torres, J. R., & Castro, J. (2007). The health and economic impact of dengue in Latin America. Cad Saude Publica, 23 Suppl 1, S23-‐31.
50. Wren, J., & Barrell, K. (2010). Cost of injury in New Zealand. New Zealand Government, New Zealand Injury Prevention Secretariat.
51. Yabroff, K. R., Bradley, C. J., Mariotto, A. B., Brown, M. L., & Feuer, E. J. (2008). Estimates and Projections of Value of Life Lost From Cancer Deaths in the United States. JNCI Journal of the National Cancer Institute, 100(24), 1755-‐1762. doi: 10.1093/jnci/djn383
60
Appendix 1b. Literature Review: Guidelines, Manuals, and Review Papers Describing Best Practices The following is a listing of reports and papers that provide guidance on how to construct estimates of the economic burden of illness and injuries. These studies were identified in our literature review.
52. Belhaj, M., & Fridell, E. (2009). External costs in the transport sector: A literature review. Swedish Environmental Research Institute.
53. Bishai, D. (2012). Injury Costing Frameworks. in press, Johns Hopkins University. 54. Drummond, M. F., & Jefferson, T. O. (1996). Guidelines for authors and peer
reviewers of economic submissions to the BMJ. The BMJ Economic Evaluation Working Party. BMJ, 313(7052), 275-‐283.
55. Gold, M. (1996). Panel on cost effectiveness and health. Medical Care, 34(12), DS197-‐199.
56. Iglesias, C. P., Drummond, M. F., & Rovira, J. (2005). Health-‐care decision-‐making processes in Latin America: problems and prospects for the use of economic evaluation. International journal of technology assessment in health care, 21(1), 1-‐14.
57. Lindqvist, K., Nilsen, P., Jansson, B., & Khan, J. (2004). Manual for Economic Evaluation in Safe Community Practice. Karolinska Institutet Report.
58. Maibach, M., Shreyer, C., Sutter, D., Essen, H. v., Boon, B. H., Smokers, R., et al. (2007). Handbook on estimation of external cost in the transport sector. CE Delft Solutions for environment, economy and technology.
59. McMahon, K., & Dahdah, S. (2008). The true cost of road crashes. IRAP Report. 60. Moller, L., & Matic, S. (2010). Best practice in estimating the costs of alcohol.
WHO Europe. 61. Polinder, S., Segui-‐Gomez, M., Toet, H., Belt, E., Sethi, D., Racioppi, F., et al.
(2011). Systematic review and quality assessment of economic evaluation studies of injury prevention. Accident Analysis & Prevention. doi: 10.1016/j.aap.2011.07.004
62. Silcok, B. R. (2003). Guidelines for estimating the costs of road crashes in developing countries. Final Report, London: Department for International Development, 50.
63. UK_DFT. (2011). Guidance Accident sub-‐objective. UK Department for Transport, Transport Analysis Guidance, WebTAG.
64. USDOT. (1994). Motor Vehicle Accident Costs -‐ FHWA Safety Program. FHWA Safety Program.
65. WHO. (2003). Guide to cost effectiveness analysis. World Health Organization. 66. WHO. (2008). Manual for estimating the economic costs of injuries due to
interpersonal and self-‐directed violence. World Health Organization. 67. WHO. (2009). Guide to identifying the economic cosequences of disease and
injury. World Health Organization.
61
Appendix 1c. Literature Review: Relevant Willingness to Pay Literature The following is a listing of reports and papers that provide guidance on how to construct estimates of the economic burden of illness and injuries using WTP methods. These studies were identified in our literature review.
68. Abelson, P. (2003). The value of life and health for public policy. Economic Record, 79 (SpecialIssue), S2-‐S13.
69. Aldy, J. E., & Viscusi, W. K. (2008). Adjusting the value of a statistical life for age and cohort effects. The Review of Economics and Statistics, 90(3), 573-‐581.
1. Bloom, D. E., Canning, D., & Jamison, D. T. (2004). Health, wealth, and welfare. Finance and development, 41, 10-‐15.
2. Brent, R. J. (2011). An implicit price of a DALY for use in a cost-‐benefit analysis of ARVs. Applied Economics, 43(11), 1413-‐1421.
3. Castillo, J. (2010). Estimación de los beneficios en salud asociados a la reducción de la contaminación atmosférica en Bogotá, Colombia. MIC.
4. Cohen, M., & Rubio, M. (2007). Violence and Crime in Latin America. Consulta de San Jose 2007.
5. Cropper, M. (2004). The demand for a malaria vaccine: evidence from Ethiopia. Journal of Development Economics, 75, 303-‐318.
6. Cropper, M., & Sahin, S. (2009). Valuing mortality and morbidity in the context of disaster risks. World Bank Policy Research Working Paper No. 4832.
7. Hammitt, J. K. (2002). QALYs Versus WTP. Risk Analysis, 22(5), 985-‐1001. 8. Hammitt, J. K., & Zhou, Y. (2006). The Economic Value of Air-‐Pollution-‐Related
Health Risks in China: A Contingent Valuation Study. Environ Resource Econ, 33(3), 399-‐423. doi: 10.1007/s10640-‐005-‐3606-‐0
9. Kuhn, A., & Ruf, O. (2008). The Value of a Statistical Injury: New Evidence from the Swiss Labor Market. Institute for Emperical Research in Economics, University of Zurich, Working Paper Series, ISSN 1424-‐0459.
10. Mason, H., Jones-‐Lee, M., & Donaldson, C. (2009). Modelling the monetary value of a QALY: a new approach based on UK data. Health Econ., 18(8), 933-‐950. doi: 10.1002/hec.1416
11. Sunstein, C. R. (2003). Lives, life-‐years, and willingness to pay. The Chicago Working Paper Series(Working Paper No 191).
12. Udezi, W. A., Usifoh, C. O., & Ihimekepen, O. O. (2010). Willingness to pay for three hypothetical malaria vaccines in Nigeria. Clinical Therapeutics, 32(8), 1533-‐1544. doi: 10.1016/j.clinthera.2010.07.018
13. Viscusi, W. K., & Aldy, J. E. (2003). The value of a statistical life: a critical review of market estimates throughout the world. Journal of risk and uncertainty, 27(1), 5-‐76.
14. Wang, H., & He, J. (2010). Value of a Statistical Life -‐ A contingent investigation in China. World Bank Policy Research Working Paper, Paper 5421.