The Nucleation and Evolution of Riedel Shear Zones asDeformation Bands in Porous Sandstone
Item type text; Thesis-Reproduction (electronic)
Authors Ahlgren, Stephen G.
Publisher The University of Arizona.
Rights Copyright © is held by the author. Digital access to thismaterial is made possible by the Antevs Library,Department of Geosciences, and the University Libraries,University of Arizona. Further transmission, reproductionor presentation (such as public display or performance) ofprotected items is prohibited except with permission of theauthor or the department.
Downloaded 21-Mar-2018 20:56:52
Link to item http://hdl.handle.net/10150/249273

THE NUCLEATION AND EVOLUTION OF RIEDEL SHEAR ZONES ASDEFORMATION BANDS IN POROUS SANDSTONE
by
Stephen G. Ahlgren
A Prepublication Manuscript Submitted to the Faculty of the
DEPARTMENT OF GEOSCIENCES
In Partial Fulfillment of the Requirementsfor the Degree of
MASTER OF SCIENCE
In the Graduate College
THE UNIVERSITY OF ARIZONA
1999

STATEMENT BY AUTHOR
This manuscript, prepared for publication in the Journal of Structural Geology, has beensubmitted in partial fulfillment of requirements for the Masters of Science degree at TheUniversity of Arizona and is deposited in the Antevs Library to be made available toborrowers, as are copies of regular theses and dissertations.
Brief quotations from this manuscript are allowable without special permission, providedthat accurate acknowledgment of source is made. Requests for permission for extendedquotation from or reproduction of this manuscript in whole or in part may be granted bythe Department of Geosciences when the proposed use of the material is in the interestsof scholarship. In all other instances, however, permission must be obtained from theauthor.
(aut or's signature)ci' 131ti
APPROVAL BY RESEARCH ADVISORY COMMITTEE
As memanuScie
rs of the Research Committee, we recommend that this prepublicationcript be accepted as fulfilling the research requirement for the degree of Master of
ce.
Major Advisor Y (signature) (dat
SMay jqq'î(date)
v1A-14/(/(A-1
(signature)
(signature):3MM-i1 i'1
(date)

111
ACKNOWLEDGEMENTS
Deformation bands first invaded my life thanks to George Davis, to whom I owe a
great deal. His unrivaled field skills and enthusiasm for structural geology, teaching and
everything in between are an inspiration. I especially thank him for providing the unique
opportunity to explore and enjoy the lesser -known reaches of southern Utah under the
guise of science. I am also exceptionally grateful to have spent the last two years
surrounded by a close knit, eclectic group of classmates, and thank them all for
friendship, general silliness and shoulders to lean on. George will never be the same. I
would like to thank David Woody for help and goofiness in the field, as well as Dave
Streeter of the Mining and Geological Engineering department for assistance with sample
preparation. Last, but not least, I am grateful to my family for unending love and
support.
This study was supported in part by grants from (in alphabetical order) Amoco,
Arco, Midland Valley Services, and Sigma Xi GIAR.

iv
TABLE OF CONTENTS
STATEMENT BY THE AUTHOR ii
ACKNOWLEDGEMENTS iii
TABLE OF CONTENTS iv
LIST OF FIGURES v
LIST OF TABLES vi
ABSTRACT 1
INTRODUCTION 2
BACKGROUND 2
LOCATION OF STUDY AREA AND STUDY METHODOLOGY 7
STRUCTURAL GEOMETRY 9
Regional Scale Structure 9
Outcrop Scale Structure 11
Geometry of a Riedel Shear Zone 13
Geometry of Overstep Regions 19
VISUALIZING RIEDEL SHEAR ZONES IN THREE DIMENSIONS 19
DISCUSSION OF STRUCTURE 23
Z1 Band Nucleation 26
Interpretation of Structure 30
Strain Analysis 36
Stress Analysis 38
Three -Dimensional PSZ Geometry 43
CONCLUSIONS 46
REFERENCES 48

V
LIST OF FIGURES
FIGURE 1: Idealized Riedel shear zone geometry 4
FIGURE 2: The sequential development of a synthetic driven Riedel shear zone 6
FIGURE 3: Location and simplified structure map of the study area 8
FIGURE 4: Geometry and scale invariance of Riedel shear zones 12
FIGURE 5: Idealized up- gradient evolution from a PRZ to a PSZ 14
FIGURE 6: Geometry of PRZs from Sheets Gulch 15
FIGURE 7: Overstep region geometry 17
FIGURE 8: Summary of the orientations of observed Z1, Z2, Z3 and Z4bands 18
FIGURE 9: Method for three -dimensional reconstruction of a PSZ 21
FIGURE 10: Three- dimensional digital reconstruction of a sinistral PSZ 22
FIGURE 11: The sequential development of an antithetic driven Riedel shear zone 24
FIGURE 12:The development of tensile fractures within a sinistral shear zone 28
FIGURE 13: Conceptual Mohr circles illustrating the evolution of a Riedel shear zone 34
FIGURE 14: Sequential development of a Riedel shear zone in porous sandstone 35
FIGURE 15: Histograms of calculated 61 orientations 39
FIGURE 16: Localized rotation of the regional 61 within PSZs 42

vi
LIST OF TABLES
TABLE 1: Results from strain analysis of 13 PRZs 37

1
ABSTRACT
Riedel shear zones are geometric fault patterns commonly associated with strike -
slip fault systems. The progressive evolution of natural Riedel shear zones within the
Navajo Sandstone of southern Utah is interpreted from the spatial evolution of small -
scale, incipient Proto- Riedel Zones (PRZs) to better -developed Riedel shear zones using
field mapping and three -dimensional digital modeling. PRZs nucleate as a tabular zone
of localized shearing marked by en èchelon deformation bands, each of which is no more
than a few mm wide and tens of cm long, and oriented at 55° - 85° to the trend of the
zone. With increasing strain, deformation bands and sedimentary markers are sheared
ductily through granular flow and assume a sigmoidal form. The temporal and spatial
evolution of bands comprising a Riedel shear zone suggests that PRZs nucleate as
transitional -compactional deformation bands under localized, supra- lithostatic fluid
pressure. Subsequent bands develop under modified regional stresses as conjugate shear
fractures within the strain- hardened axis of the PRZ. These antithetic driven systems are
not compatible with traditional synthetic driven models of Riedel shear zones. Unlike
most synthetic driven examples, these antithetic driven systems are not controlled by pre-
existing "basement" structures, thus their geometries reflect a primary propagation or
secondary passive deformation mechanism.

2
INTRODUCTION
The purpose of this contribution is to explore and document the sequential
development of Riedel shear zones in porous sandstone from field examples, with
emphasis on the spatial and temporal evolution of the developing Riedel shear zone and
the individual shear surfaces comprising the zone. These systems are most commonly
recognized in natural wrench fault environments and are easily created in analog systems,
but their systematic structural evolution in natural systems is thus far poorly documented.
Although many of the fundamental concepts explored in this paper are not new, the
synthesis of these ideas in the context of interpreting naturally deformed structural
systems and the application of advanced visualization techniques may shed light on this
complex fault pattern.
BACKGROUND
The term "Riedel Shears" (Hills 1963) refers to a specific geometric fault pattern
first demonstrated in clay -cake models (Riedel 1929). The pattern includes relatively
short, en èchelon fault segments that may link to form a through -going Principal Shear
Zone (PSZ) (Skempton 1966). Numerous workers have subsequently generated the
Riedel pattern through clay cake experiments (e.g. Cloos 1955, Morgenstern &
Tchalenko 1967, Tchalenko 1968, Hildebrand -Mittlefehldt 1979, Gamond 1983,
Maltman 1987), direct shear experiments (e.g. Mandl et al. 1977, Bartlett et al. 1981,
Schreurs 1994), triaxial experiments (e.g. Marone & Scholz 1989, Morrow & Byerlee
1989), and through computer simulations (Dresan 1991, Braun 1994, McKinnon &

3
Garrido de la Barra 1998). Many workers document Riedel shear zones in natural
systems ranging in scale from regional -scale (e.g. Tchalenko & Ambraseys 1970, Moore
1979, Moore & Byerlee 1992) to outcrop -scale (e.g. Dengo & Logan 1979, Davis 1996,
Garcia & Davis 1997) to thin section -scale (e.g. Morgenstern & Tchalenko 1967,
Tchalenko 1968, Maltman 1987). Riedel shear zones are found in dip -slip fault regimes
(Dengo & Logan 1979, Garcia & Davis 1997) although the pattern is generally assumed
to form in the cover sequence overlying some planar "basement" wrench -fault system (as
in the wrench -fault block models of Tanner 1962, Wilcox et al. 1973, Moore 1979).
Thus, laboratory and computer experiments are typically designed to simulate this
situation and are composed of a single basement `fault' (such as a longitudinally split
board) overlain by a simulated cover sequence (e.g. Cloos 1955, Braun 1994). Smaller -
scale Riedel shear zones are generally associated with a larger -scale Riedel shear zone
system (e.g. Davis 1996) or found within fault zones (as in gouge experiments by Moore
& Byerlee 1991).
Geometrically, the idealized Riedel pattern is defined by a series of shear
fractures oriented at specific angles to the trend of the PSZ (Figure 1). The idealized
system includes conjugate R and R' shears, inclined at 7c/4 ± 0/2 (0 is the internal friction
angle of the host rock), a P shear, inclined at -7c /4 + 0/2, and a T fracture, inclined at rc /4
(e.g. Bartlett et al. 1981, Fig. 3). Some workers report X shears, oriented at -7c/4 -4/2
(Bartlett et al. 1981), but these shears are not considered in this study. The R and P
shears exhibit a synthetic sense of shear with respect to the PSZ, R' shears exhibit an
antithetic (terminology after Wilcox et al. 1973) sense of shear with respect to the PSZ,

4
Figure 1: Idealized Riedel shear zone geometry. 4) is the angle of internalfriction of the host rock. Principal Displacement Shears (PDS or Y shears) formsub-parallel to the trend of the zone.

5
and T fractures are considered purely tensional fractures (e.g. Skempton 1966, Bartlett et
al. 1981). Some shear fractures may be sub -parallel to the trend of the PSZ and are
alternatively termed "Principal Displacement Shears" (PDS) (Skempton 1966), "D"
shears (Tchalenko 1968) or "Y" shears (Bartlett et al. 1981). This study uses `R' to
describe a synthetic shear, 'I?" to describe an antithetic shear, and `PDS' to describe a
shear oriented sub -parallel to the trend of the Riedel shear zone.
In natural systems, the angular relationships between individual shear surfaces
and the PSZ is variable and dependent on a number of factors such as the strain rate
(Lucas & Moore 1986) and the stress state at the time of faulting. Localized elevated
fluid pressure within a faulting region may result in reorientation of the principal stresses
(e.g. Byerlee 1990, Byerlee 1992) causing synthetic and antithetic shears to be inclined
more steeply with respect to the trend of the PSZ (e.g. Gamond 1983, Naylor et al. 1986).
Propagation of shears with the Riedel shear zone may also induce local stress field
rotations, the local stress field, further influencing the orientations and types of shear
fractures that develop (e.g. Naylor et al. 1986, Mandl 1988).
The sequential development of shear surfaces within a natural Riedel system is
difficult to ascertain, and to the best of my knowledge is incompletely documented. In
models and computer simulations, however, the sequential progression of shearing within
Riedel shear zones is well defined but dependent on modeling conditions. Generally
speaking, the most widely accepted model for Riedel shear zone development is synthetic
driven in the sense that lower -angle synthetic R and P shears generally pre -date higher-
angle antithetic R' shears (Figure 2). Most workers agree that synthetic R shears are the

6
(a)
(b)
(c)NW,.......... .1-----
.....---7"
Figure 2: The sequential development of a sinistral synthetic driven Riedelshear zone. a)Zone initiates as en èchelon R shears and in most systems,b)antithetic R' shears develop, although in some systems, c)P shears maydevelop.

7
first or one of the first shears to form (e.g. Morgenstern & Tchalenko 1967, Tchalenko
1970, Bartlett et al. 1981), although P shears may also form first, especially in dilational
systems (Moore & Byerlee 1992). R and P shears may develop synonymously (Bartlett
et al. 1981) or P shears may also develop later as links between R shears (Tchalenko
1968, Moore & Byerlee 1992). R' shears may develop concurrently with or postdate R
shears (e.g. Tchalenko 1968, Moore 1979) and they are typically confined to the overlap
zones between overstepping R segments (e.g. Tchalenko 1968). Most workers agree that
Y shears (PDSs) are the last to develop (e.g. Tchalenko 1968, Bartlett et al. 1981),
although some computer modeling predicts that these shears actually form first (Braun
1994). It is important to note that individual shears generally remain active after other
types develop, thus strain within a Riedel shear zone will be accommodated by
synchronous movement on all surfaces comprising the zone (e.g. McKinnon & Garrido
de la Barra 1998).
LOCATION OF STUDY AREA AND STUDY METHODOLOGY
The study examines Riedel shear zones in the Jurassic Navajo Sandstone of
southern Utah, a relatively homogenous aeolian sandstone exposed throughout Utah (e.g.
Hintze 1988). The primary study area (hereafter referred to as Sheets Gulch) is located
near Sheets Gulch, a two square km region along the eastern edge of the Waterpocket
Fold in Capitol Reef National Park (Figure 3). Structural data from Sheets Gulch are
compiled from previous field maps (Davis et al. 1997) and from 1:600 and finer -scale
mapping on aerial photographic base maps. Supporting data were also collected within

8
1:3
>z
Idaho
WyomirYgSalt Lake' ity
Utah/ oCapitol Reef, ` o
N.P., r Q o
Bryce CanyonN.P. ycr
Arizona
Figure 3: Map of Utah showing location of Sheets Gulch and simplifiedstructural geology of the study area (after Billingsley et al. 1987).

the Navajo Sandstone exposed along the eastern edges of the San Rafael Swell and the
East Kaibab Monocline.
STRUCTURAL GEOMETRY
9
Regional Scale Structure
Sheets Gulch is located geographically between two Laramide uplifts, the Circle
Cliffs uplift to the southwest and the Miners Mountain uplift to the northwest (Bump et
al. 1997) (Figure 3). Structurally, this region may represent a transfer zone between
basement structure(s) controlling each of the uplifts, although the exact geometry of these
basement structures is unknown. Striking geometrical differences between the two
uplifts suggest that the Circle Cliffs uplift is cored by an east -vergent reverse fault and
the Miners Mountain uplift is cored by a west - vergent reverse fault with left -oblique slip,
which may be a backthrust subordinate to a dominant east -vergent reverse fault (Bump et
al. 1997). Incomplete hard linking (terminology after Walsh & Watterson 1991) between
the basement structures results in strain "leaking" from the basement into the cover
sequence, which is manifested as penetrative deformation within the cover rocks at
Sheets Gulch. The exposed supracrustal sequence comprises the Jurassic Navajo
Sandstone underlain by the shales and sandstones of the lower members of the Jurassic
Glen Canyon Group, and overlain by shales and sandstones of the Jurassic San Rafael
Group (Hintze 1988). Of the exposed units, the Navajo Sandstone is the most
mechanically competent unit, thus minor strain within the transfer zone, although

10
presumably distributed throughout the exposed supracrustal sequence, is visibly recorded
in the Navajo Sandstone.
The Navajo Sandstone within Sheets Gulch is penetratively deformed by a system
of conjugate strike -slip deformation band shear zones (DBSZs) (Davis et al. 1997).
Although DBSZs may extend the breadth of the study area, measurable offset on
individual bands is no more than 4m and total regional strain may not exceed 2 %.
DBSZs typically outcrop as resistant, light- colored bands, up to a few tens of cm wide,
composed of tens to hundreds of anastomosing individual deformation bands (Davis et al.
1997). Dextral and sinistral DBSZs are mutually offsetting and there is no clear temporal
relationship between DBSZs in the two orientations, thus they may have formed
contemporaneously (Davis et al. in press, Davis et al. 1997). Slickenlines on DBSZs are
generally oriented sub -parallel to bedding within the Navajo Sandstone and bands dip
more shallowly to the north with increasing southerly dips of bedding, suggesting that
band formation preceded local bedding rotation, and thus the formation of the
Waterpocket Fold (Davis pers. commun. 1997). As seen in other Riedel systems (e.g.
Morgenstern & Tchalenko 1967) the system at Sheets Gulch displays a remarkable scale -
invariance and self -similarity over at least three orders of magnitude (Davis 1996,
Ahlgren 1999) (Figure 4). For example, regional -scale DBSZs may be interpreted as
large -scale Riedel shear zones, sub -bands within the DBSZs often exhibit a Riedel
geometry, and these bands, in turn, may be Riedel shear zones.

11
Outcrop Scale Structure
This study examines the sequential development of outcrop -scale Riedel shear
zones composed of deformation bands (Davis 1996) marked by grain -scale cataclasis and
compaction of the Navajo Sandstone (e.g. Aydin 1978). Deformation bands are typically
less than one millimeter wide and crop out as positive weathering, light- colored planar to
slightly curviplanar shear bands. Riedel array deformation bands may form as subsidiary
shears associated with a regional -scale DBSZ, as a PSZ contained within a regional -scale
DBSZ, or within otherwise undisturbed host rock (Figure 4). Tipping PSZs are
common, and often form as subsidiary shears terminating on one end in undisturbed rock
and on the other end at a PSZ or DBSZ. Tip -to -tip examples, with both ends of the zone
terminating in undisturbed Navajo Sandstone, are also present although uncommon.
This study is most concerned with the geometry and kinematics of Riedel shear
zone development in both the tip regions of evolving PSZs and regions between adjacent,
en èchelon PSZs (Figure 4). These regions tend to be geometrically simple and,
kinematically, they capture the zone at a primitive developmental stage. Deformation
within the tip regions of a PSZ are interpreted as the lateral propagation mechanism of
the PSZ as well as the original nucleation mechanism (thus the earliest stage of sequential
development) of the PSZ. These regions of incipient Riedel array development are
termed Prow Riedel Zones (hereafter referred to as PRZs).
The following section describes the geometry of PRZs and PSZs and incorporates
a nomenclature similar to Morgenstern (1967) by which individual deformation band
types are labeled Zi ... Z4.

12
(a)
(b)
(C)
DBSZsoverstepregions
Area detailedin (b)
m
Area detailedin (c)
PSZ
7v\ /
overstepregions
PSZ\'
/ i4mMI M
PRZ PSZ
\ /1overstep
deformation bands regions4 cm
Figure 4: Geometry and scale invariance of Riedel shear zones composed ofdeformation bands and systems of deformation bands. Zones are shown withlong axis oriented horizontally. a)Regional -scale Deformation Band ShearZones (DBSZs) with overstep regions between adjacent DBSZs. b)Outcrop-scale Principal Shear Zones (PSZ) with overstep regions between other smaller-scale PSZs. c)Tip region of PSZ composed of individual deformation bands.PSZ tips as a Proto Riedel Zone (PRZ).

13
Geometry of a Riedel Shear Zone
Some Riedel arrays exhibit a systematic along- strike geometric change from a tip
with zero displacement to a Proto Riedel Zone (PRZ) to a well developed Principal Shear
Zone (PSZ) with the greatest displacement (Figure 5). These smaller -scale zones are
oriented similarly to regional -scale Deformation Band Shear Zones ( DBSZs) and may tip
into DBSZs or evolve into DBSZs along strike.
A PRZ is defined by a tabular zone of en èchelon, planar to curviplanar,
unconnected deformation bands (Z1 bands) (Figure 6). Spacing of the bands along strike
of the PRZ is semi- regular, and on the order of a few cm. Zi bands are oriented at 50° to
88° (average 67° ± 11 °) with respect to the strike of the PRZ, are roughly symmetric
about the PRZ axis and extend laterally a few cm to tens of cm. Some PRZs are
composed solely of spaced, en èchelon Z1 bands, which may or may not exhibit a
sigmoidal geometry in plan view (Figure 6a).
Moving up- gradient along the PRZ (e.g. Figure 5), Z1 bands typically assume a
gently curved, sigmoidal geometry in plan view, and a single Z1 band may exhibit a 13° -
43° angular discordance between the strike of one its free tips and the strike of its interior
region. Similarly, there may be a change in dip magnitude and/or direction from tip to tip
along a single Zi band, suggesting that the band is helicoidal in three dimensions. Z2
bands may be present in regions between adjacent Z1 bands. If present, Z2 bands are
centered on the axis of the PRZ, typically sigmoidal in plan view and oriented sub -
parallel to Z1 bands, at least near the axis of the PRZ (Figure 6b).

-( Increasing displacement (up- gradient)
14
More complexgeometry or
through -going faultzone develops
Figure 5: Plan view of the tip region of an idealized sinistral PSZ showingsystematic up- gradient evolution from a PRZ to a PSZ to a more complex faultzone.

15
..,..
Figure 6: Geometry of PRZs from Sheets Gulch. a)Plan view of a sinistralPRZ composed entirely of en èchelon Z1 bands oriented at a high angle to thezone boundary (b = 75 °). Note semi -regular spacing, linearity of Z1 bands andthe lack of lower -angle bands. b)Plan view of a sinistral PRZ composedprimarily of Z 1 and Z2 bands. Displacement grows toward the left side of theimage and the PRZ evolves into a PSZ along strike. Note the regular Z1 bandspacing, in filling by Z2 bands, sigmoidal form of Z 1 and Z2 bands, and minorZ3 band development.
16
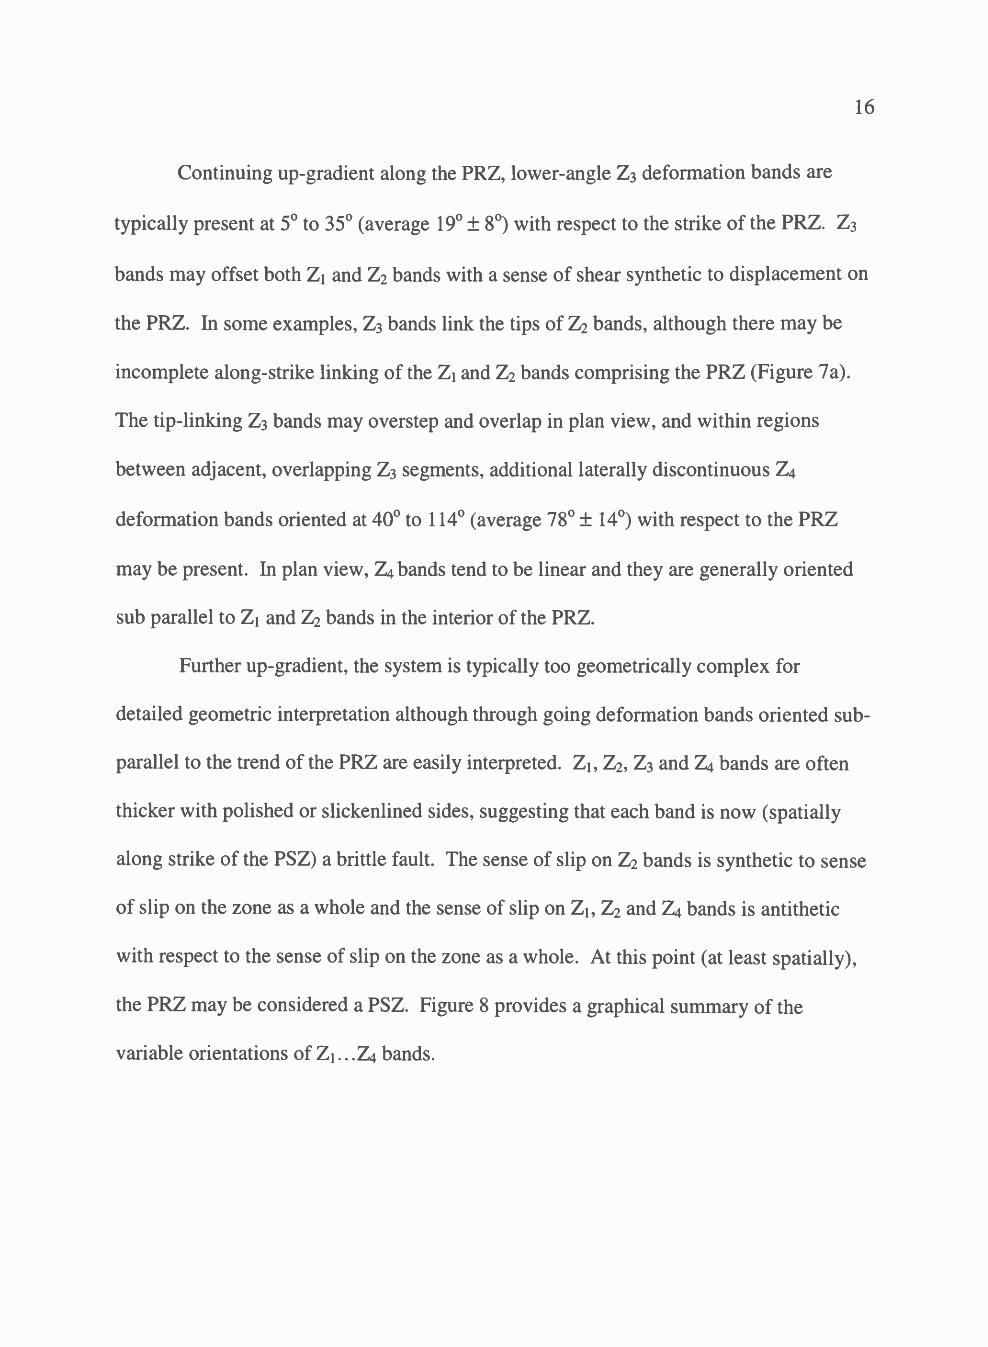
Continuing up- gradient along the PRZ, lower -angle Z3 deformation bands are
typically present at 5° to 35° (average 19° ± 8 °) with respect to the strike of the PRZ. Z3
bands may offset both Z1 and Z2 bands with a sense of shear synthetic to displacement on
the PRZ. In some examples, Z3 bands link the tips of Z2 bands, although there may be
incomplete along- strike linking of the Z1 and Z2 bands comprising the PRZ (Figure 7a).
The tip -linking Z3 bands may overstep and overlap in plan view, and within regions
between adjacent, overlapping Z3 segments, additional laterally discontinuous Z4
deformation bands oriented at 40° to 114° (average 78° ± 14 °) with respect to the PRZ
may be present. In plan view, Z4 bands tend to be linear and they are generally oriented
sub parallel to Z1 and Z2 bands in the interior of the PRZ.
Further up- gradient, the system is typically too geometrically complex for
detailed geometric interpretation although through going deformation bands oriented sub-
parallel to the trend of the PRZ are easily interpreted. Z1, Z2, Z3 and Z4 bands are often
thicker with polished or slickenlined sides, suggesting that each band is now (spatially
along strike of the PSZ) a brittle fault. The sense of slip on Z2 bands is synthetic to sense
of slip on the zone as a whole and the sense of slip on Z1, Z2 and Z4 bands is antithetic
with respect to the sense of slip on the zone as a whole. At this point (at least spatially),
the PRZ may be considered a PSZ. Figure 8 provides a graphical summary of the
variable orientations of Z1... Z4 bands.
(a) (b)
17
Increasing slip on PSZ1
Z2 bands,
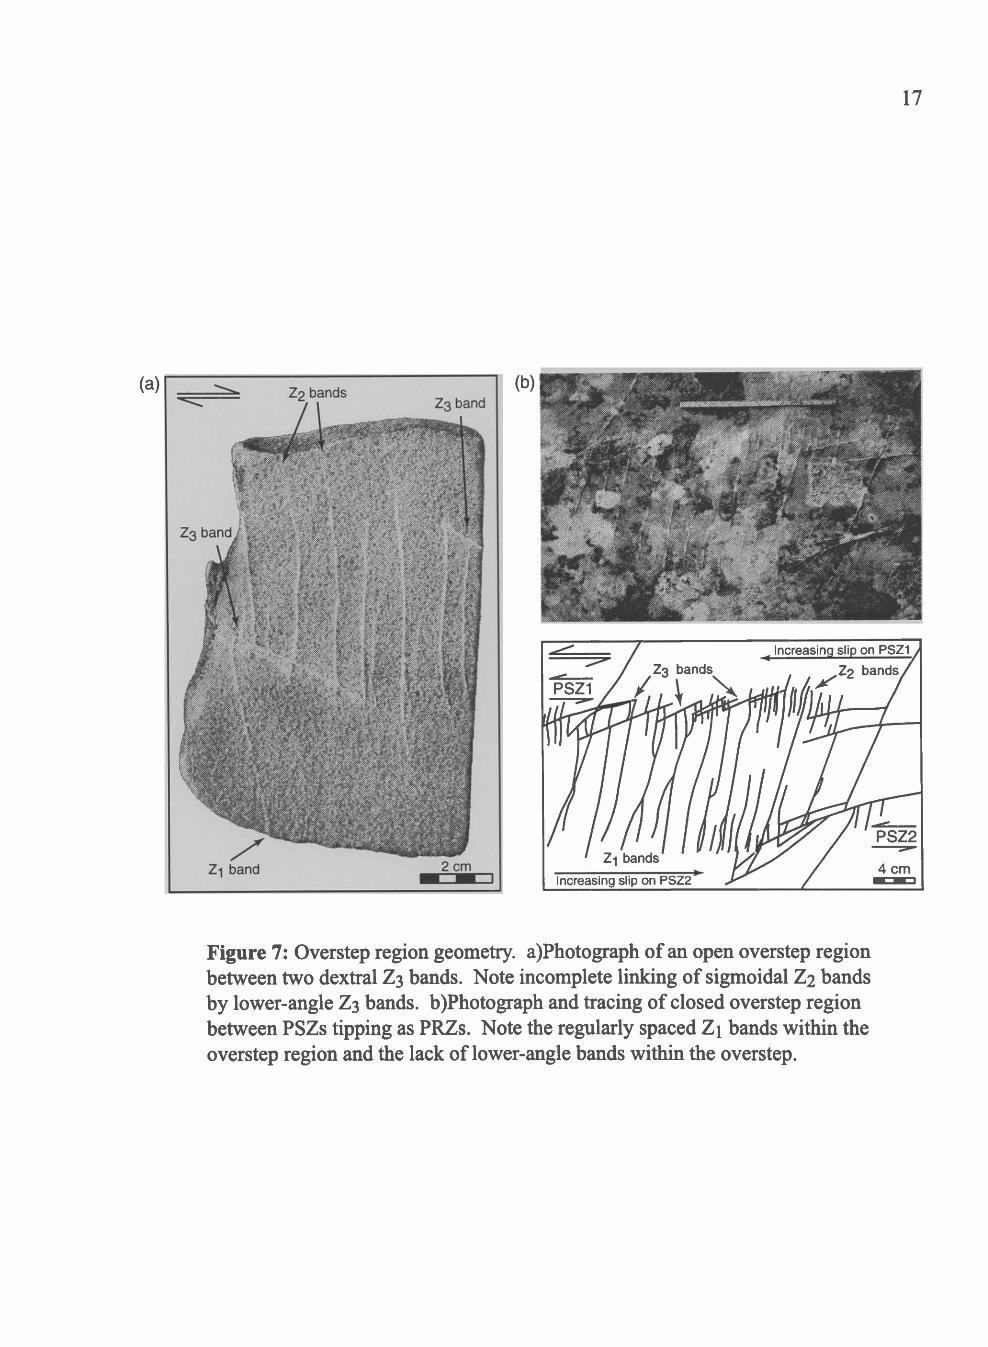
Figure 7: Overstep region geometry. a)Photograph of an open overstep regionbetween two dextral Z3 bands. Note incomplete linking of sigmoidal Z2 bandsby lower -angle Z3 bands. b)Photograph and tracing of closed overstep regionbetween PSZs tipping as PRZs. Note the regularly spaced Z1 bands within theoverstep region and the lack of lower -angle bands within the overstep.

18
Key
Z4: 780 +- 150
z1-z2: 670 +- 110
Z3: 19° +- 8o
Figure 8: Summary of the orientations of observed Z1, Z2, Z3 and Z4 bands.Angles are measured from the axis of the Riedel shear zone; anticlockwise ispositive. Average Z1 /Z2 inclination is 67° ± 11° (n = 139), average Z3 bandinclination is 16° ± 9° (n = 92), and average Z4 band inclination is 78° ± 15° (n= 26).

19
Geometry of Overstep Regions
Overstep regions are defined as discrete, roughly orthorhombic regions where
there is spatial overlap between pairs of deformation bands (commonly Z3 bands) or band
systems (PRZs or PSZs) (Davis 1996). The overstep zone is closed if the segments
overlap and are connected by other bands or band systems (for example, Z3 bands
connected by Z4 bands) and open otherwise (Figure 7). All observed examples are
contractional oversteps; dextral bands and band systems step to the left and sinistral
bands and band systems step to the right across an overstep zone, (Segall & Pollard
1980). In large -scale systems, spacing between PSZs or DBSZs may be tens of cm to a
few m, but in more poorly developed overstep systems between pairs of Z3 bands or
PRZs, spacing of the approaching segments is a few cm to twenty cm. Commonly,
stepping Z3 bands do not overlap spatially, and sigmoidal Z2 bands are present within the
overstepping region (Figure 7a). It is important to note, however, that the Z2 bands do
not necessarily physically connect with the overstepping Z3 bands, thus the Z2 bands form
part of the "soft" link (terminology after Walsh & Watterson 1991) between the Z3 bands.
In situations where Z3 bands do overlap spatially, however, Z4 bands are present and act
as hard links between the Z3 bands.
VISUALIZING RIEDEL SHEAR ZONES IN THREE DIMENSIONS
To better understand the internal geometry of a Riedel array, I reconstructed a
Riedel array in three- dimensional digital space (Ahlgren 1999), which, to the best of my
knowledge, has been previously documented only for analog models. Previous workers

20
effectively apply methods such as tomographic imaging to visualize the three-
dimensional structure of complex fault structures such as Riedel shear zones (e.g.
Schreurs 1994). Destructive methods, such as sequential sample dissection, lead to
complete annihilation of the original sample, but are inexpensive and more accessible
compared to methods such as tomography. In this study, the dissected sample is a field
sample of a representative PSZ.
The destructive modeling procedure includes sectioning, imaging and
reconstruction of a PSZ (Figure 9). The sample was cast into a 35 cm x 25 cm x 25 cm
block of gypsum cement and sliced sequentially at 5 mm intervals with a standard rock
saw. Each freshly exposed rock surface was photographed with tripod- mounted digital
and film cameras from an orthogonal distance of 65 cm. After digitally trimming and
scaling the photographs, deformation band traces were digitized in a two -dimensional
structural cross section balancing computer program, and these sequential cross sections
and plan -view sections were imported into a three- dimensional structural restoration
computer programs. Much like interpreting gridded seismic data, deformation band
traces were correlated across adjacent vertical sections and verified by plan view sections
(Figure l0a). The final model is composed of approximately forty vertical cross sections
and three plan -view sections, and unlike the original sample, the three- dimensional model
facilitates full virtual tours through the heart of the PSZ (Figure 10b). It is important to
1 Two -dimensional cross sections and three- dimensional models created with 2DMoveTMand 3DMoveTM, respectively, courtesy of Midland Valley Exploration, Glasgow, UK.

21
(c)
(d)
Sample PreparationSelect field Cast in gypsum with top
sample surface perp. to PSZ
Cut at 5 mmincrement
Data CollectionRecord image using
digital and film cameras\e9
O8,
t¡l no msa<k"
2D ReconstructionTrim and scale Trace bands indigital image -4- 2DMove
for e.C"'
3D ReconstructionImport 2D sections Group 2D lines
into 3DMove --0- and create 3Dplanes
19e"nterret 2D if nec. Verify with
Tidy 3D model, applytexture maps
colormaps, etc.Fin'sh
Figure 9: Method for three-dimensional reconstruction of a PSZ. a)Fieldsample is cast in block of gypsum cement prior to b)sequential dissection with arock saw. c)Digital photographs from each slice are traced as cross -sections intwo dimensions. d)Two- dimensional sections are used to construct a three-dimensional digital model. See text for details.

(a) (b)
22
Figure 10: Three -dimensional digital reconstruction of a sinistral PSZ. Note:scale bars are approximate due to perspective views. a)Two dimensional mapand cross section views of the dissected field sample mapped into threedimensions. Light -colored lines are traces of deformation bands in thedissection planes. b)Plan view of three-dimensional reconstruction of the PSZ.Surfaces are shaded by relative depth within the model.

23
emphasize that the digital model is a reconstruction of the dissected field sample, not an
interpretation of the dissected field sample.
The digital model supports and clarifies relationships gleaned from field
observations. Since this particular field sample is not from the exact tip region of a PSZ
(e.g. the sample is not a PRZ), all four types of deformation bands (Z1, Z2, Z3, and Z4) are
present and each is geometrically similar to field examples. Z1 bands are sigmoidal in
plan view and they are clearly helicoidal in three dimensions, with along- strike variability
in dip magnitude and direction. In plan view, Z2 bands are sigmoidal and sub -parallel to
Z1 bands, although they are not as laterally extensive as Zi bands. In cross -section, Z2
bands do not extend as deeply into the sample as Z1 bands, and they exhibit a more subtle
three -dimensional helicoidal geometry. Z3 bands are relatively planar, oriented at smaller
angles with respect to the PRZ, and clearly offset both Z1 and Z2 bands although these
mm -scale offsets are not honored in the digital representation. Similarly, Z4 bands are
present in overlap zones between stepping Z3 bands, but are not incorporated in the
digital reconstruction due to their small -scale and geometric complexity.
DISCUSSION OF STRUCTURE
As described, PSZs vary geometrically along- strike from a PRZ composed of
spaced Zi deformation bands, to a geometrically simple Riedel shear zone, to more
complex fault zones (e.g. Figure 5). The apparent along- strike spatial continuum
between a PRZ and a PSZ and the kinematic compatibility between components of the
PRZ and the PSZ suggests that the PRZ evolves continuously into a PSZ (Figure 11).

(a)
(b)
7/' °
tZ1 mm
PRZ
Z2
PRZ/1/1/1/1/Zlr E.
(c)
(d)
24
Figure 11: The sequential development of an antithetic driven Riedel shearzone. a)Zone initiates PRZ composed of spaced Z1 bands with S = 700(arbitrary). b)Simple shear sigmoidally deforms Z1 bands; Z2 bands form. c)Z3(R) and Z4 (R') bands form; shear on Z1 and Z2 bands (R'). d)Most slip occurson through going PDS bands sub - parallel to zone axis.

25
This variation in structural style is consistent with the along- strike displacement gradient
observed in numerous field examples, with zero displacement at the tip of the zone and
some maximum displacement near the center of the zone (for tip -to -tip examples) or at a
junction with another zone.
The PRZ nucleates as a tabular array of Zi bands and, if additional strain is
necessary, the zone propagates laterally as a tabular zone of Zi bands, while more
complex structures evolve toward the center of the zone (along strike) where strain is
greatest. The initiation of PSZs as tabular zones of high -angle Zi deformation bands is
incompatible with the traditional synthetic driven model of Riedel array development
documented in the literature. Rather, the preferred mode of array development is
antithetic driven in which Zi and Z2 bands (which evolve into R' bands) initiate the
brittle deformation process and are subsequently overprinted by a pair of conjugate Z3
and Z4 bands (which evolve into R and R' bands, respectively).
The along- strike geometrical evolution of a Riedel shear zone from a PSZ to a
PRZ, and in some examples, to zones of sigmoidally deformed cross beds projecting
along strike from the PSZ tip, is analogous to other documented examples of shear
fractures tipping in subsidiary structures. For example, brittle faults may terminate as
kink -bands projecting along strike away from the fault tip (e.g. Peacock 1991, fig. 3),
and, under higher- temperature conditions, a mylonitic ductile shear zone may project
from the tip of a strike -slip fault (Burgmann & Pollard 1994, fig. 3d). Similarly, a tensile
fracture may evolve into an en èchelon tensile crack array oriented along the strike
projection of the parent tensile fracture (e.g. Pollard et al. 1982).
26
In each of these analog examples, the changing structural morphology of the
primary strain feature (e.g. the fault zone) reflects the along- strike change in strain
magnitude. Thus, the region along strike of the primary strain feature with the lowest
strain records the lowest- strain mechanism. In a natural system the earliest physical
strain mechanism(s) may not be clear due to overprinting by higher- strain features. As
discussed, however, within Sheets Gulch these initial features are visible as isolated PRZs
and within the tip regions of propagating PSZs (e.g. Figure 6), suggesting that the strain
mechanism responsible for nucleation of PSZs is the same mechanism responsible for
lateral propagation of PSZs.
Z1 Band Nucleation
The presence of PRZs comprising only Z1 bands and the geometrical symmetry of
deformational styles about the center of tip -to -tip PSZs suggests that Z1 band formation is
the earliest stage in the progressive development of PSZs. After exploring a number of
possibilities to explain the formation mechanism(s) of these deformation bands, I
conclude that they most likely nucleate as shear fractures. Although it is unlikely that Z1
bands initiate as purely tensional features, the following discussion of Z1 bands possibly
nucleating as tension fractures is included due to the geometric similarly of PRZs and
tension fracture arrays composed of sigmoidal gash fractures (e.g. Shainin 1950, Plates 1-
2). Please note that the alternative interpretation may also apply to 12 bands.
There is debate about the kinematic significance and development of sigmoidal,
en èchelon tensional fractures (e.g. see Rickard & Rixon 1983, Olson & Pollard 1991)

27
but ideally, fractures within an array nucleate as planar tensile fractures at b = 45 °, where
b is the angle from the crack tip to the zone (e.g. Hancock 1972) and are subsequently
sigmoidally deformed by simple shear (e.g. Roering 1968). The angle b is variable and
dependent on a number of factors including the relative volume change of the shearing
zone during fracture propagation. For example, if the shear zone positively dilates, b will
be greater than 45 °, and if the zone negatively dilates, b will be less than 45° (e.g.
Ramsay & Huber 1983, fig. 3.21) (Figure 12). It is also possible that sigmoidal, en
èchelon tension fracture arrays may develop without a component of simple shear (Type
II fractures of Beach 1975). In this situation, fractures propagate under a localized stress
field influenced by interaction between neighboring fractures (Latjai 1969). This idea is
supported by field evidence (e.g. Nicholson & Pollard 1985) and more recently by
numerical modeling (Olson & Pollard 1991) which uses a randomly seeded fracture
population to demonstrate how some fracture orientations in favorable orientations with
respect to the far -field stresses evolve into en èchelon arrays of sigmoidal fractures. This
digital crack interaction model may be successfully applied to numerous field examples
(see Olson & Pollard 1991) but the model fails to predict fracture arrays with large b
values (S > 50 °). As Z1 and Z2 bands typically exhibit 50° <_ b <_ 90 °, the model probably
does not apply to Sheets Gulch. As discussed, there is also ample field evidence
suggesting that heterogeneous simple shear is an important component in PRZ
development.
It is most likely that incipient Z1 and Z2 deformation bands nucleate as shear
fractures, which is consistent with the generally accepted theory that deformation bands

28
(a)
(b)
1
i .vd, 46.0IX 50.X.6zone bounds y
arria amwR riiic-A j
bS >4500v <0
el
Figure 12: The development of tensile fractures within a sinistral shear zone.a)Constant volume deformation (0v = 0); S = 450, el = 450. b)Net negativedilation of the shear zone (Av > 0) (simple shear + pure shear); S > 45°, ei <450. Modified after Ramsay and Huber (1983), fig. 3.21.

29
form as shear fractures (faults) (e.g. Aydin 1978). In thin section, Zi bands are texturally
identical to other deformation bands from Sheets Gulch and documented examples from
the literature (for detailed microstructure of typical deformation bands see Aydin 1978,
Antonellini et al. 1994). Z1 bands are composed predominantly of crushed, angular
quartz grain fragments localized in discrete bands one -two grains wide, suggesting that
these bands form through localized compaction and cataclastic flow (e.g. Borradaile
1981) imposed during shearing. Direct evidence for shear offset across Z1 bands is
difficult to identify in thin section, although in all observed examples, the sense of
displacement of individually offset quartz grains is consistent with the "expected"
direction of slip along the Zi band gleaned from mesoscale shear zone relationships.
Thus, although these incipient Z1 bands appear to be shear fractures, their
relatively high angle (55° - 85 °) with respect to the strike of the shear zone is challenging
to interpret kinematically, as is their apparent antithetic affinity. Kinematically, these
bands are most convincingly interpreted as "transitional -compactional" shear fractures
nucleating within a region of localized high fluid pressure and low differential stress such
that failure takes place within the parabolic portion of the Mohr- Coulomb envelope of
failure. This failure mechanism is consistent with those proposed by other workers for
similar structures in porous sandstone (Davis pers. commun. 1998, Rickard & Rixon
1983).

30
Interpretation of Structure
The state of stress before and during PRZ development is shown on a series of
dimensionless Mohr circles with an arbitrary Coulomb failure envelope (Figure 13).
Under low differential stress, the system is stable (Figure 13a). Compaction of the
deforming region induces locally elevated fluid pressure (Byerlee 1990) resulting in
transitional -compactional shear failure (Figure 13b). Data from Sheets Gulch suggest
that the angle between ai and rupturing Z1 bands is 4° to 40° (average of 22° ± 9 °, n = 59)
(discussion of methodology follows). Failure within the parabolic portion of the failure
envelope normally implies a combination of opening -mode failure, net positive dilation
and shear. Z1 bands may exhibit initial positive dilation at peak stress, as demonstrated
other other types of shear & but
post -rupture compaction and cataclasis results in net negative dilation along the bands,
thus these bands may be termed "transitional anticracks" in contrast to transitional tensile
fractures (Davis pers. commun. 1998). It is important to note that this stress
interpretation, which is consistent with the construction used by others (e.g. Rickard &
Rixon 1983) and with the synthetic driven Riedel array model, predicts a pair of
conjugate shear fractures inclined at ± 6 with respect to 6l (where O is approximately
30 °). In the antithetic driven system at Sheets Gulch, however, the synthetic shear
fracture oriented at -6 to 61 is not observed. The lack of the lower -angle synthetic shear
fracture is likely due to increased normal stress on that potential failure plane resulting
from a component of pure shear orthogonal to the zone; this pure shear component is
reflected in negative dilation of the deforming zone.

31
It is apparent that the initiation and evolution of a PRZ includes both non-
destructive reorganization of the host sandstone within the boundaries of the PRZ and
localized grain -scale cataclasis of the host sandstone within deformation bands. As
described, compaction of the host sandstone within the nucleating PRZ provides the
elevated pore fluid pressure essential to Z1 band rupture, and passive deformation of these
Z1 bands and sedimentary horizons suggests that the subsequent evolution of a PRZ
includes heterogeneous simple shear. The interpretation of this particular deformation
path including elevated fluid pressure, distributed shearing, incipient cataclasis, and
subsequent shear localization is consistent with published interpretations of deformation
within overpressured porous sediments obtained from deep sea cores (Lucas & Moore
1986) (Figure 14). Increased fluid pressure within a deforming porous medium facilitates
non -destructive reorganization and compaction, and in systems where differential stress
is low, deformation may be distributed across a broad region (Borradaile 1981, Lucas &
Moore 1986). Experimental and theoretical evidence from similar porous media suggests
that shearing and compaction of the Navajo Sandstone may be facilitated by distributed
shear across the breadth of the PRZ through "independent particulate flow" (Borradaile
1981). This forms a continuous feedback loop; distributed granular shearing within some
pre -determined tabular region (where the PRZ nucleates) causes locally increased fluid
pressure, which, in turn, facilitates further distributed shearing. This cycle of fluid
pressure buildup and subsequent stress release allows for Z1 and Z2 band formation under
constant differential stress.

32
Eventually, distributed shearing becomes localized toward the center of the
deforming zone (e.g. Mandl et al. 1977, Cundall 1989), and different strain mechanisms
evolve including localized cataclasis (e.g. Griggs & Handin 1960). The changing strain
mechanisms reflect the changing mechanical characteristic of the host medium. Within a
PRZ nucleating in the Navajo Sandstone, shearing and compaction reduces porosity
within the PRZ (see Antonellini & Aydin 1994, for representative porosity values) and
the region becomes work -hardened (Edmond & Paterson 1972), with a fundamental
change in the mechanical character of the host sandstone such as increased cohesion
(Vernik et al. 1993) or a larger angle of internal friction (Underhill & Woodcock 1987).
Thus, initial strain softening facilitates granular flow resulting in strain hardening and
subsequent shear band localization toward the axis of the PRZ (e.g. Lucas & Moore
1986, Underhill & Woodcock 1987, Menèndez et al. 1996). The strain -hardened PRZ
then serves as a guide for further localized deformation first as Riedel -array deformation
bands, and, with increasing strain, as a through -going fault zone.
After formation of the incipient Z1 deformation bands, the state of stress becomes
sub -critical (Figure 13c), although minor Z2 bands continue to form near the axis of the
PRZ due to continued cyclical fluid pressure buildup and release. Compaction of the host
sandstone eventually reaches some critical level and cannot deform through granular flow
or compaction and fluids dissipate resulting in sub -lithostatic fluid pressure. At this
point, due to passive rotation, Z1 and Z2 bands may no longer be kinematically favorable
as strain paths thus differential stress builds (although the magnitudes of ß2 and 63 may
remain fixed). If the stress buildup is sufficient to cause failure, Z3 and Z4 deformation

33
bands will develop within the strain -hardened axis of the PRZ (Figure 13d). These
conjugate deformation bands are geometrically and kinematically consistent with R and
R' shears in the traditional Riedel framework (e.g. Figure 1). In addition, field evidence
indicates that at this point in the evolution of a PRZ to a PSZ, Zi and Z2 bands are
polished and/or slickenlined with a shear sense antithetic to the sense of shear along the
PSZ, and they may be interpreted as R' shears. These incipient deformation bands,
which initially accommodate negligible offset, become "recycled" as shear fractures
when strain along the developing PSZ reaches some critical level.
As deformation along the PSZ continues, additional shears (PDSs) oriented sub-
parallel with respect to the trend of the PSZ may develop, and a the PSZ may evolve into
a through -going fault system marked by a dense mass of coalescing deformation bands.
Previously formed deformation bands may become rotated within the fault zone due to
passive rotation accommodated by minor distributed shear and by mechanical rotation.
The suggestion that the orientation of Riedel shears, especially high -angle R' shear,
changes significantly through the progressive evolution of the fault zone is not
revolutionary (e.g. Morgenstern & Tchalenko 1967, Tchalenko 1970, Wilcox et al. 1973,
Moore 1979, Bartlett et al. 1981, Dresan 1991). Similarly, rotation across a PSZ is
illustrated by deformed passive markers (e.g. Tchalenko & Ambraseys 1970). Most
attribute the change in orientation to progressive block rotation on linked shears such as
documented in larger -scale wrench fault systems like the San Andreas (Nur et al. 1986).

34
(a)
(b)
(c)
(d)
Figure 13 : Conceptual Mohr circles illustrating the evolution of a Riedel shearzone. a)System is stable at low differential stress until b)elevated fluid pressureresults in failure on transitional- compactional shear fracture. c)System istemporarily stable with cyclical pressure buildup /release; strain-hardening maylead to an increase in the angle of internal friction. d)Failure within thestrengthened zone occurs under elevated differential stress on conjugatedeformation bands. See text for details.

35
(a)
(b)w
(c)
Figure 14: Sequential development of a Riedel shear zone in porous sandstone.a)Undeformed, fluid -saturated sandstone is subjected to dextral shearing.b)Elevated pore fluid pressure results in dilation and non -destructive particulateflow accompanied by angular shear fir. c)Continued shearing results incompaction and incipient cataclasis. Zone becomes work - hardened.d)Cataclastic deformation on localized shear bands 1 -2 grains wide. In Riedelshear zones, initial deformation is on high -angle, antithetic deformation bands(Z1 bands). See text for details. Modified after Lucas & Moore (1986), fig. 17.

36
Strain Analysis
It is possible to approximate the amount of shear strain accommodated within a
PRZ using the following equation relating the shear strain, area change of the shear zone
and the change in orientation of a linear marker crossing the zone (Ramsay & Huber
1987, eq. 26.4):
cota =cota1 +AA
(1)
a and a' are the angles a linear feature makes with the shear zone walls outside and
inside of the zone, respectively, yis the shear strain along the shear zone, and AA is the
area dilation of the shear zone. Simplifying for y, the equation becomes:
y = cot a - (cot a')(1 + A A) (2)
The amount of angular shear (yl) is then calculated from 'y using the simple relationship
(Ramsay & Huber 1983, p. 3):
y = tan(v) (3)
In this study, the "internal" strike of a Z1 band (proximal to the PRZ axis) and its
"external" strike (distal from the PRZ axis) are used as a' and a values, respectively, and
y values are computed iteratively for a range of area changes. Strain analysis of 13 PRZs
yields y values ranging from 0 to 1.75 with an average yy of .31 ± .28. Corresponding yJ
values range from 0° to 58° and average 22° ± 14° (n = 59) (Table 1). Although there is
great variability in shear strains calculated from different PRZs, y and NI values computed
from multiple Z1 bands within a single PRZ are reasonably consistent, and computed yf

37
Band Offset Sense yaverage std. dev. iy average std. dev.AH -4 Sinistrai 0.21 0.12 11.64 7.11
AH -7a Sinistral 0.32 0.08 17.87 4.32AH -8 Sinistral 0.19 0.11 10.93 6.15AH -10 Sinistral 0.68 0.01 34.22 0.57AH -11 Dextral 1.54 0.13 56.97 7.68AH -12 Dextral 0.32 0.04 17.66 2.28AH -15 Sinistral 0.78 0.01 37.87 0.37AH -16 Sinistrai 1.54 0.13 56.97 7.68AH -19 Sinistral 0.31 0.11 17.46 6.02AH -22 Sinistrai 0.26 0.02 14.54 0.99AH -23 Sinistral 0.50 0.01 26.63 0.74AH -24 Sinistrai 0.35 0.16 19.41 9.25AH -42 Dextral 0.59 0.13 30.63 7.43
Table 1: Results from strain analysis of 13 PRZs. Note lack of consistency incomputed y and yi values between different PRZs.

38
values are compatible with angular rotations of deformation bands and cross beds across
PRZs. A more complete strain analysis is necessary, however, to fully understand and
quantify the amount of shear accommodated on a PRZ prior to PSZ development.
Stress Analysis
The orientations of the principal paleostress axes may be interpreted from Riedel
shear zones using a simple graphical construction based on the angle between conjugate
R and R' bands, assuming that these two shears form conjugate deformation bands
symmetric about the 61 axis. This graphical stress interpretation may only be applied to
Riedel shear zones containing both R and R' bands, thus the method may not be entirely
accurate when applied to PRZs lacking R and R' (Z3 and Z4) bands. Additionally, since
the orientation of bands comprising one band type (e.g. R bands) may change along strike
of the band, average band orientations compiled from field data are generally used to
compute the stress orientation for a single PSZ. The computed inclination of 61 with
respect to PRZs is 22° to 61° (average of 47° ± 13 °, n = 92) (Figure 15a) (description of
computation method follows), which is consistent with theoretical and experimental data
suggesting that 61 is inclined at 45° to a shearing zone (e.g. Mandl et al. 1977, Naylor et
al. 1986). These 61 inclinations translate into N64E /S64W ± 13° (std. dev.) for sinistral
PSZs (n = 76) and S69E/N69W ± 13° (std. dev.) for dextral PSZs (n =14), with an
angular discordance between the two orientations of approximately 40° (Figure 15b).

(a) Average470 +- 13°
020 25 30 35 40 45 50 55 60 65 70 75 80
Angle (degrees)
(b)
39
Sinistra Regional65° +- 13° 80°
1
Dextral102° +- 13°
IS) oLn 0 L oLn 0 L 0 i oID 0 L oc `zr '4' V) LC) co co N N CO CO rn 0) o o r-T rAzimuth (degrees)
T
Figure 15. Histograms of calculated 6 i orientations. a)Average 6 i inclinationto PSZ axes computed from sinistral and dextral PSZs is 470 ± 130 (n = 92).b)ß1 azimuths computed from sinistral and dextral PSZs (n = 90). Average 6iazimuth compatible with sinistral PSZs is 650 ± 130 (n = 76). Average 6iazimuth compatible with dextral PSZs is 1020 ± 130 (n = 14). Note relativesymmetry of the two orientations about the regional ai azimuth (800).

40
The NW and NE striking regional -scale DBSZs within Sheets Gulch are thought
to have developed with a regional 61 orientation of approximately N80E /S 80W (Davis et
al. in press), an orientation that bisects the PSZs but is discordant with paleostress
orientations interpreted from PSZs. The apparent discontinuity between stress fields
compatiblé with DBSZs and mesoscale PSZs is likely due to localized changes in the
orientation of the principle far -field stress axes during shearing. The potential
discordance between local and far -field stress orientations is widely noted in the literature
(e.g. Mandl et al. 1977, Naylor et al. 1986, Byerlee 1992, McKinnon & Garrido de la
Barra 1998) although the exact mechanism for principal stress rotation is variably
explained. Rotations may be induced dynamically by movement along slip
discontinuities or statically by non- straining processes. For example, faults may exhibit
local stress field perturbations, especially near their tips (e.g. Chinnery 1966, Segall &
Pollard 1980, Gamond 1983), which has been reflected experimentally as changing
deformational styles along fault and crack tips (e.g. Mandl et al. 1977, Olson & Pollard
1991). Local stress field rotations and interactions are also interpreted from field
examples of brittle cracks and faults (e.g. Nicholson & Pollard 1985). These local stress
perturbations may be caused by induced local fluid pressures (Byerlee 1990) or the result
of some shear couple resulting from simple shear across a deforming region (e.g. Mandl
et al. 1977, Braun 1994, McKinnon & Garrido de la Barra 1998). More recently,
McKinnon & Garrido de la Barra (1998) document progressive stress rotations and
counter -rotations in two -dimensional modeling of Riedel shear arrays. They observe up
to 30° stress readjustments occurring during the shearing process and conclude that the

41
local orientation of the principal stress axes is at least partially controlled by the type of
active shear fracture; e.g. if the currently shearing surface is an R shear or R' shear.
These stress rotations may be responsible for the geometric evolution of Riedel shear
arrays including the development of new types of shear surfaces (e.g. Naylor et al. 1986).
Since PRZs and PSZs are in similar orientations as DBSZs and are structural
precursors to DBSZs, it is likely that these structures formed in the same WSW -ENE
regional stress field, although the discordance between interpreted ßi paleostress
orientations would suggest otherwise. Davis et al. (in press) note a similar discordance
between the regional 6i orientation and larger -scale Riedel geometries observed within
DBSZs, and conclude that this discordance is strong evidence for localized stress field
rotations within macroscale DBSZs. Data from small -scale structures at Sheets Gulch
strongly suggest that the regional 6i orientation becomes reoriented before the inception
of brittle faulting within conjugate Riedel shear arrays. Along sinistral PRZs, ai must
experience at least 15° of anticlockwise rotation, and along dextral PRZs. 6i must
experience at least 15° of clockwise rotation in order to be compatible with structures that
evolve within these PRZs (Figure 16). Although ßi rotations are well documented in the
literature, rotations documented from analog modeling are not entirely consistent with
stress rotations interpreted from Sheets Gulch. For example, analog modeling of sinistral
shear zones in unconsolidated sand (Gamond 1983) suggests a clockwise ai rotation, and
computer modeling of dextral shear zones, suggests an anticlockwise ßi rotation (Dresan
1991, Braun 1994). Stress rotations interpreted from modeling are probably dependent
on boundary conditions, e.g. the initial stress configuration preceding deformation and

42
Figure 16: Localized rotation of the regional al within PSZs. Computed ßlrotation is approximately +150 for dextral PSZs and -150 for sinistral PSZs(clockwise rotation is positive).

43
the direction of induced strain. Thus, confined models with loading orthogonal to the
shear plane will exhibit stress rotation opposing the sense of shear (e.g. clockwise 61
rotation with sinistral shearing) and models with loading parallel to the direction of stress
will exhibit rotation consistent with the sense of shear (anticlockwise rotation with
sinistral shearing) (e.g. Naylor et al. 1986). Models with isotropic horizontal stresses
(orthogonal to the strain plane) will assume an instantaneous 61 oriented at 45° to the
shear zone upon the inception of shearing (e.g. Mandl et al. 1977). Stress rotations
within Sheets Gulch are presumably strain -induced and are a response to localization and
first increment of shear strain along a PRZ.
Three -Dimensional PSZ Geometry
Both the three- dimensional digital PSZ reconstruction and field observations
document the helicoidal geometry of shears comprising a Riedel array, which has been
noted either directly or indirectly by other workers (e.g. Emmons 1969, Wilcox et al.
1973, Moore 1979, Naylor et al. 1986, Braun 1994, Schreurs 1994). In these and other
analog models, the synthetic shears exhibit a helicoidal morphology, not the antithetic
shears, as documented in this study. Schreurs (1994) alludes to the helicoidal geometry
of R' shears by suggesting that these shears exhibit along- strike changes in dip direction
in analog models but does not elaborate (Schreurs 1994 fig. 3). R shears within the three-
dimensional digital reconstruction created in this study are not helicoidal, which may be
due a fundamental difference in their rupture mechanism as compared with other
documented examples, or the relative difficulty in interpretation of these lower-angle

44
bands when constructing the model (they are inclined at a small angle to the dissection
plane).
Physical analog models designed to create a Riedel array commonly consist of a
deformable medium (e.g. clay cake or granular material) over a "rigid" basement with a
single "fault," a setup designed to reproduce a typical, natural wrench fault zones (e.g.
Wilcox et al. 1973). For example, flower structures are commonly interpreted as rooting
within a master fault zone at depth or within basement, and twist helicoidally and widen
toward shallower depths (e.g. Harding 1985). In analog models, brittle deformation will
nucleate at the break in the "rigid basement," hence the model setup is predisposed to
forming helicoidal Riedel shears. The shears nucleate from the basement "fault" and
twist helicoidally upward through the cover sequence to the free surface at the top of the
model, at which point they may be oriented at a significant angle to the basement
structure. The twisted geometry may reflect the discontinuity in the stress state from the
base of the model to the free surface of the model caused by shear stresses propagating
upward from the "basement ", with the fault surface seeking some ideal orientation within
the stress field (Naylor et al. 1986). For example, tensile fractures commonly evolve into
en èchelon crack arrays at their tips, which represents a localized stress perturbation at
the tip of the master fault (Pollard et al. 1982). Similarly, recent computer modeling of
wrench fault zones (Braun 1994) demonstrates that the helicoidal geometry of shears
within a Riedel array may be related to far -field stresses around the Riedel array. As with
physical analog models, Braun's computer model generates a Riedel array above a single
basement fault, and Riedel shears are sub -parallel to the basement fault at the

45
basement/cover interface and twist helicoidally upwards toward the free surface at the top
of the model. Braun (1994) indicates that the shears are P shears, since they exhibit a
sense of slip antithetic to the sense of slip on the PSZ. As with physical analog modeling,
this digital model seems predisposed to forming helicoidal Riedel shears due to the non-
linear failure criteria, in which stresses are depth dependent, used in the model (Braun
1994) .
As previously mentioned, observable deformation within Sheets Gulch is
confined to the relatively structurally competent Navajo Sandstone, which is sandwiched
between more structurally incompetent mixed sand and shale units. Thus, it is reasonable
to conclude that deformation within Sheets Gulch is not controlled by pre- existing
basement -type structures in the underlying sedimentary and basement rocks, and that
Riedel -array deformation banding occurs in free deformational space within the relatively
mechanically homogenous sandstone host. It follows that the helicoidal geometry of
antithetic deformation bands may be due to the state of stress during fracture propagation
or due to secondary, post -rupture rotation. As discussed, there is strong evidence for
localized regional ai reorientation along mesoscale PSZs and PRZs, and helicoidal
antithetic deformation bands (Z1 and Z2 bands) suggests that there may be further
modification of the regional stress field localized at the cm to mm -scale along
propagating deformation bands. These stress field readjustments may be due to
interaction between bands propagating close to each other spatially, as suggested to
explain along- strike curvature of propagating tensile cracks (e.g.Latjai 1969), although in
these documented examples, crack tips tend to propagate toward each other, not parallel

46
to each other as do Zi and Z2 bands. It is also possible that these incipient, high -angle
deformation bands propagate as planes and are subsequently sheared in three dimensions,
resulting in a three dimensional helicoidal geometry. As discussed, there is strong
evidence for distributed shearing in two dimensions, and it is reasonable to assume that
shearing was not restricted to a plane orthogonal to the strike of a PSZ or PRZ.
CONCLUSIONS
Antithetic driven Riedel shear arrays nucleate as Proto Riedel Zones (PRZs)
composed of spaced Z1 deformation bands localized within a negatively dilating and
shearing tabular zone of porous Navajo Sandstone. These initial shears develop as
transitional -compactional shears induced by supra -lithostatic fluid pressures driven by
fluid expulsion from the deforming region. The stress cycle of fluid pressure buildup
with subsequent stress relaxation after band formation results in Zi and Z2 band
formation under constant differential stress, and continues until the host sandstone can no
longer accommodate strain through compaction and granular flow. At this point, the
PRZ is work- hardened and strain localizes toward the axis of the PRZ. Conjugate Z3 and
Z4 deformation bands develop, transforming the PRZ into a Principal Shear Zone (PSZ).
These bands are consistent with R and R' bands in Riedel shear zones, and nucleate
symmetrically about ßl. With increasing strain, Z1 and Z2 deformation bands are
"recycled" as antithetic R' shears. Paleostress orientations consistent with PSZs are
discordant with regional, far -field stress orientations, and strongly suggest that far -field
stresses are rotated by ± 15° at the inception of deformation along PRZs. Helicoidal

47
deformation bands within PRZs and PSZs may also be indicative of localized stress
reorientation.
The evolution of a single Riedel shear zone through these distinct developmental
stages is apparent through along -strike transitions from simple, incipient geometries to
more complex Riedel geometries. These geometries are visualized and clarified by three -
dimensional digital reconstruction of a Riedel shear zone. The modeling technique
utilized in this study may be applied effectively to other structural systems and may have
far -ranging applications. For example, the models generated in this study are currently
being used to assess three -dimensional fluid flow through the deformed Navajo
Sandstone.

48
REFERENCES
Ahlgren, S. G. 1999. New interpretations of the sequential development of three -dimensional deformation band shear zone networks in the Navajo Sandstone,southern Utah. The American Association of Petroleum Geologists AnnualConvention Abstracts with Programs 8, A2.
Antonellini, M. & Aydin, A. 1994. Effect of faulting on fluid flow in porous sandstones:petrophysical properties. The American Association of Petroleum GeologistsBulletin 78(3), 355 -377.
Antonellini, M. A., Aydin, A. & Pollard, D. D. 1994. Microstructure of deformationbands on porous sandstones at Arches National Park, Utah. Journal of StructuralGeology 16(7), 941 -959.
Aydin, A. 1978. Small faults formed as deformation bands in sandstone. Pure andApplied Geophysics 116, 913 -930.
Bartlett, W. L., Friedman, M. & Logan, J. M. 1981. Experimental folding and faulting ofrocks under confining pressure. Part IX. Wrench faults in limestone layers.Tectonophysics 79, 255 -277.
Beach, A. 1975. The geometry of en- echelon vein arrays. Tectonophysics 28, 245 -263.
Borradaile, G. J. 1981. Particulate flow of rock and the formation of cleavage.Tectonophysics 72, 305 -321.
Braun, J. 1994. Three- dimensional numerical simulations of crustal -scale wrenchingusing a non -linear failure criterion. Journal of Structural Geology 16(8), 1173-1186.
Bump, A., Ahlgren, S. G. & Davis, G. H. 1997. The waterpocket fold, a tale of twouplifts, Capitol Reef National Park, Utah. EOS, Transactions of the AmericanGeophysical Union 78(46), F701.
Burgmann, R. & Pollard, D. D. 1994. Strain accommodation about strike -slip faultdiscontinuities in granitic rock under brittle -to- ductile conditions. Journal ofStructural Geology 16(12), 1655 -1674.
Byerlee, J. D. 1990. Friction, overpressure and fault normal compression. GeophysicalResearch Letters 7, 2109 -2112.
Byerlee, J. D. 1992. The change in orientation of subsidiary shears near faults containingpore fluid under high pressure. Tectonophysics 211, 295 -303.

49
Chinnery, M. A. 1966. Secondary faulting I. Theoretical aspects. Canadian Journal ofEarth Sciences 3, 163 -174.
Cloos, E. 1955. Experimental analysis of fracture patterns. Bulletin of the GeologicalSociety of America 66, 241 -256.
Cundall, P. A. 1989. Numerical experiments on localization in frictional materials.Ingeniur-Archiv 59, 148 -159.
Davis, G. H. 1996. "Riedel relays" in deformation band shear zones, Colorado Plateau,Utah. Geological Society of America Abstracts with Programs 28(7), A -188.
Davis, G. H., Garcia, P., Bump, A. P., Ahlgren, S. G. Conjugate Riedel deformationband shear zones. The Journal of Structural Geology. in press.
Davis, G. H., Garcia, P., Bump, A. P., Ahlgren, S. G. & Swanberg, K. 1997. Detailedinternal structure of a conjugate strike -slip deformation band shear zone system inthe Navajo Sandstone at a salient in the Waterpocket Fold, Capitol Reef NationalPark, Utah. EOS, Transactions of the American Geophysical Union 78(46), F701.
Dengo, C. A. & Logan, J. M. 1979. Correlation of fracture patterns in natural andexperimental shear zones. EOS, Transactions of the American Geophysical Union60(46), 955.
Dresan, G. 1991. Stress distribution and the orientation of Riedel shears. Tectonophysics188, 239 -247.
Edmond, J. M. & Paterson, M. S. 1972. Volume changes during the deformation of rocksat high pressures. International Journal of Rock Mechanics and Mining Science 9,161 -182.
Emmons, R. C. 1969. Strike -slip rupture patterns in sand models. Tectonophysics 7(1),71 -87.
Gamond, J. F. 1983. Displacement features associated with fault zones: a comparisonbetween observed examples and experimental models. Journal of StructuralGeology 5(1), 33-45.
Garcia, P. & Davis, G. H. 1997. Detailed internal structure of a conjugate normaldeformation band shear zone system in the Navajo Sandstone at the northern endof the East Kaibab Monocline, southern Utah. EOS, Transactions of the AmericanGeophysical Union 78(46), F702.

50
Griggs, D. & Handin, J. 1960. Observations on fracture and a hypothesis of earthquakes.In: Rock Deformation (edited by Griggs, D. & Handin, J.). Geological Society ofAmerica Memoir 79. The Geological Society of America, 347 -364.
Hancock, P. L. 1972. The analysis of en- echelon veins. Geological Magazine 109(3),269 -276.
Harding, T. P. 1985. Seismic characteristics and identification of negative flowerstructures, positive flower structures, and positive structural inversion. TheAmerican Association of Petroleum Geologists Bulletin 69(4), 582 -600.
Hildebrand- Mittlefehldt, N. 1979. Deformation near a fault termination, part I: a fault in aclay experiment. Tectonophysics 57, 131 -150.
Hills, E. S. 1963. Elements of Structural Geology. Methuen & Co. Ltd., London.
Hintze, L. F. 1988. Geologic history of Utah. Department of Geology, Brigham YoungUniversity.
Latjai, E. Z. 1969. Mechanics of second -order faults and tension gashes. Bulletin of theGeological Society of America 80(2253- 2272).
Lucas, S. E. & Moore, J. C. 1986. Cataclastic deformation in accretionary wedges: DeepSea Drilling Project Leg 66, southern Mexico, and on -land examples fromBarbados and Kodiak Islands. In: Structural Fabrics in Deep Sea Drilling ProjectCores from Forearcs (edited by Moore, J. C.). Geological Society of AmericaMemoir 166. The Geological Society of America, 89 -103.
Maltman, A. 1987. Shear zones in argillaceous sediments -- an experimental study. In:Deformation of Sediments and Sedimentary Rocks (edited by Jones, M. E. &Preston, R. M. F.). Geological Society Special Publication 29, 77 -87.
Mandl, G. 1988. Mechanics of tectonic faulting. Models and basic concepts. Elsevier,Amsterdam.
Mandl, G., de Jong, L. N. J. & Maltha, A. 1977. Shear zones in granular material. RockMechanics 9, 95 -144.
Marone, C. & Scholz, C. H. 1989. Particle -size distribution and microstructures withinsimulated fault gouge. Journal of Structural Geology 11(7), 799 -814.
McKinnon, S. D. & Garrido de la Barra, I. 1998. Fracture initiation, growth and effect onstress field: a numerical investigation. The Journal of Structural Geology 20(12),1673 -1689.

51
Menèndez, B.., Zhu, W. & Wong, T. -F. 1996. Micromechanics of brittle faulting and
cataclastic flow in Berea Sandstone. Journal of Structural Geology 18(1), 1 -16.
Moore, D. & Byerlee, J. 1991. Comparison of the San Andreas fault, California, andlaboratory fault zones. Bulletin of the Geological Society ofAmerica 103, 762-774.
Moore, D. E. &. Byerlee, J. 1992. Relationships between sliding behavior and internalgeometry of laboratory fault zones and some creeping and locked strike -slip faultsof California. Tectonophysics 211, 305 -316.
Moore, J. M. 1979. Tectonics of the Najd transcurrent fault system, Saudi Arabia.Journal of the Geological Society of London 136, 441 -454.
Morgenstern, N. R. & Tchalenko, J. S. 1967. Microscopic structures in kaolin subjectedto direct shear. Geotechnique 17, 309 -328.
Morrow, C. A. & Byerlee, J. D. 1989. Experimental studies of compaction and dilatancyduring frictional sliding on faults containing gouge. Journal of Structural Geology11(7), 815 -825.
Naylor, M. A., Mandl, G. & Sijpesteijn, C. H. K. 1986. Fault geometries in basement -induced wrench faulting under different initial stress states. Journal of StructuralGeology 8(7), 737 -752.
Nicholson, R. & Pollard, D. D. 1985. Dilation and linkage of echelon cracks. Journal ofStructural Geology 7(5), 583 -590.
Nur, A., Ron, H. & Scotti, O. 1986. Fault mechanics and the kinematics of blockrotations. Geology 14, 746 -749.
Olson, J. E. & Pollard, D. D. 1991. The initiation and growth of en echelon veins.Journal of Structural Geology 13(5), 595 -608.
Peacock, D. C. P. 1991. Displacements and segment linkage in strike -slip fault zones.Journal of Structural Geology 13(9), 1025 -1035.
Pollard, D. D., Segall, P. & Delaney, P. T. 1982. Formation and interpretation of dilatantechelon cracks. Bulletin of the Geological Society of America 93, 1291 -1303.
Ramsay, J. G. & Huber, M. I. 1983. The Techniques of Modern Structural Geology.Volume 1: Strain Analysis. Academic Press, London.
Ramsay, J. G. & Huber, M. I. 1987. The Techniques of Modern Structural Geology.Volume 2: Folds and Fractures. Academic Press, London.

52
Rickard, M. J. & Rixon, L. K. 1983. Stress configuration in conjugate quartz -vein arrays.Journal of Structural Geology 5(6), 573 -578.
Riedel, W. 1929. Zur mechanik geologischer brucherscheinungen. Zentralblatt furMineralogie, Geologie und paleontologie B, 354 -368.
Roering, C. 1968. The geometrical significance of natural en- echelon crack arrays.Tectonophysics 5(2), 107 -123.
Schreurs, G. 1994. Experiments on strike -slip faulting and block rotation. Geology 22,567 -570.
Segall, P. & Pollard, D. D. 1980. Mechanics of discontinuous faults. Journal ofGeophysical Research 85(B8), 4337 -4350.
Shainin, V. E. 1950. Conjugate sets of en echelon tension fractures in the AthensLimestone at Riverton, Virginia. Bulletin of the Geological Society of America 61,509 -517.
Skempton, A. W. 1966. Some observations on tectonic shear zones. Proceeedings of theInternational Congress on Rock Mechanics, 1st Lisbon 1, 329 -335.
Tanner, W. F. 1962. Surface structural patterns obtained from strike -slip models. Journalof Geology 70, 101 -107.
Tchalenko, J. S. 1968. The evolution of kink -bands and the development of compressiontextures in sheared clays. Tectonophysics 6(2), 159 -174.
Tchalenko, J. S. 1970. Similarities between shear zones of different magnitudes. Bulletinof the Geological Society of America 81, 1625 -1640.
Tchalenko, J. S. & Ambraseys, N. N. 1970. Structural analysis of the Dasht-e Bayaz(Iran) earthquake fractures. Bulletin of the Geological Society of America 81, 41-60.
Underhill, J. R. & Woodcock, N. H. 1987. Faulting mechanisms in high-porositysandstones; New Red Sandstone, Arran, Scotland. In: Deformation of Sedimentsand Sedimentary Rocks (edited by Jones, M. E. & Preston, R. M. F.). GeologicalSociety Special Publication 29, 91 -105.
Vernik, L., Bruno, M. & Bovberg, C. 1993. Empirical relations between compressivestrength and porosity of siliciclastic rocks. International Journal of RockMechanics and Mining Science and Geomechanics Abstracts 30(7), 677 -680.
Walsh, J. J. & Watterson, J. 1991. Geometric and kinematic coherence and scale effectsin normal fault systems. In: The Geometry of Normal Faults (edited by Roberts,

53
A. M., Yielding, G. & Freeman, B.). Geological Society Special Publication 56,193 -203.
Wilcox, R. E., Harding, T. P. & Seely, D. R. 1973. Basic wrench tectonics. The AmericanAssociation ofPetroleum Geologists Bulletin 57(1), 74 -96.
Recommended