NATIONAL ACCOUNTS OF SRI LANKA
2012
Department of Census and Statistics
September 2013
ISBN 978 -955-577-853-4
PREFACE This is the 39th publication in the series of National Accounts Estimates published by the National Accounts Division of the Department of Census and Statistics. This issue contains estimates for the year 2012 and a comprehensive set of accounts related to National Economic Accounts based on various sources of data, both public and private. The base year is 2002 for the constant estimates of national accounts. This publication includes set of tables on Production Accounts based on International Standard Industrial Classification of all economic activities (ISIC Rev.3), General Government Expenditure based on Classification of the Functions of Government (COFOG), and Private Consumption Expenditure based on Classification of Individual Consumption according to Purpose (COICOP). Further, this publication is consisted of “Annually data series from 2002 to 2012”. This task was undertaken by Ms. W.J.Nigamuni Deputy Director Mr. N.M.A.K. Nawarathna Senior Statistician, Mrs. G.G. Gunasekera, Mr. E.M.M.K. Ekanayake, Mrs.Y.P.Rajapaksha, Mr. W.M.A.U.B. Weerathunga Statisticians, Mr. B.A.U.Warnasiri, Mrs. S.Jeyagowry, Mr. S.T.T. Warapitiya, Mrs. H.M.N.K.Hennayaka,L.M.J.R. de Mel, Mr. K.D.P. Priyadarshana and Mrs. T.P.G.W.K. Thennakoon Statistical Officers, Ms. C.N. Balasooriya, Mrs. K.A.M.W.Kumari, Ms. R.K. Tharanga, Mrs. C.W.D.K. Chandrasekera, Mrs W.A.R.Mangalika, Mrs. I.G.V.L. Dasanayaka and Mrs.S.N.P.Warnamali Statistical Assistants and other staff of the National Accounts Division under the direction of Mr. K.G.Thilakarathne Director. The continued assistance given by the private and public sector organizations who supplied primary data to make this annual publication a success is very much appreciated. I hope that this publication will meet the interest of the data users including policy makers, academics and researchers etc. D.C.A.Gunawardana Director General. Department of Census and Statistics P.O.Box.563, Colombo 03.
Page No.
PREFACE
Part I Economic Performance - 2012 1
Part II Gross Domestic Product by Industry Detailed Sector Review - 2011
1 Agriculture, Livestock, Fisheries 8
2 Mining and Quarrying 17
3 Manufacturing Industries 18
4 Electricity, Gas and Water 22
5 Construction 23
6 Wholesale and Retail Trade, Restaurants and Hotels 23
7 Transport and Communication, Postal and Telecommunication 24
8 Banking, Insurance and Real Estate etc. 27
9 Ownership of Dwellings 28
10 Government Services 28
11 Private Services 28
Part III Expenditure on Gross Domestic Product
1 Private Consumption Expenditure (PCE) 29
2 General Government Final Consumption Expenditure 29
3 Capital Formation 30
4 Imports 30
5 Exports 32
6 Balance of Trade 35
Part IV Other Relevant Information
1 Weather 362 Colombo Consumers' Price Index (CCPI) 36
CONTENTS
Page No.
Socio Economic Indicators 41-43
1 Summary Indicators 44
2 Gross Domestic Product by Industrial Origin at Current Producer Prices and the Percentage Contribution of Major Economic Activities to GDP.
45
3 Gross Domestic Product by Industrial Origin at Constant (2002) prices and the Percentage Contribution of Major Economic Activities to GDP.
46
4 Gross Domestic product (Value Added) in Agricultural Sector at Current Producers' Prices by Industrial Activities.
47
5 Gross Domestic Product (Value Added) in Agricultural Sector at Constant (2002) Prices by Industrial Activities.
48
6 Expenditure on Gross Domestic Product at Current Prices. 49
7 Reconciliation of Key Aggregates at Current Prices . 50
8 Government Final Consumption Expenditure by purpose at Current Prices.
51
9 Government Final Consumption Expenditure by purpose at Constant (2002) prices.
52
10 External Transactions on Current Account. 53
11 Gross Fixed Capital Formation by type and Purchaser at Current Prices.
54
12 Gross Fixed Capital Formation by the type and Purchaser at Constant (2002) Prices.
55
LIST OF NATIONAL ACCOUNTS TABLES
NATIONAL ACCOUNTS - Quick Estimates 2012
Page No.NATIONAL ACCOUNTS - Final Estimates 2011
1 Expenditure on Gross Domestic Product at Current Prices. 59
2 Expenditure on Gross Domestic Product at Constant (2002) Prices.
59
3 Cost Components of Value Added - 2002. 604 Cost Components of Value Added - 2010. 615 Cost Components of Value Added - 2011. 626 Cost Components of Value Added - 2012. 637 Supply and Disposition of Agricultural Sector Commodities at
Current Prices - 2010. 64
8 Supply and Disposition of Agricultural Sector Commodities at Current Prices - 2011.
65
9 Supply and Disposition of Agricultural Sector Commodities at Current Prices - 2012.
66
10 Gross Domestic Product (Value Added) in Manufacturing Classified by Product Groups at Current Prices.
67
11 Gross Domestic Product (Value Added) in Manufacturing Classified by Product Groups at Constant (2002) Prices.
68
12 Foreign Aid Pledged Under Industrial Categories. 69
13 Distribution of Gross National Income. 70
14 Private Consumption Expenditure by Object at Current Prices. 71
15 Private Consumption Expenditure by Object at Constant (2002) Prices.
72
16 Summary-Expenditure on Gross Domestic Product - under 155 Basic Headings of International Comparison Programme (ICP) 2011-2012
73
CONSOLIDATED ACCOUNTS Page No.
Account No. 1 - Consolidated Accounts for The Nation - Gross Domestic Product and Expenditure
77
Account No. 2 - Consolidated Accounts for The Nation - National Disposable Income and its appropriation
78
Account No. 3 - Consolidated Accounts for The Nation -Capital Finance Account 79
Account No. 4 - Consolidated Accounts for The Nation - Rest of the World 80
Account No. 5 - General Government Income and Outlay 81
Account No. 6 - General Government Capital Accumulation 82
Account No. 7 - Income and Outlay Account Household and Private Unincorporated Enterprises (Non-Profit Institutions)
83
PRODUCTION ACCOUNTS
1. Production Account of the Total Economy 2002-2012 87
2.1 Production Account of the Total Economy, by Institutional Sectors - 2011 88
2.2 Production Account of the Total Economy, by Economic Activities - 2011 88
2.2.1 Production Account of the Non - Financial Coporations - 2011 89
2.2.2 Production Account of the Financial Coporations - 2011 89
2.2.3 Production Account of the General Government - 2011 90
2.2.4 Production Account of the Households - 2011 90
2.2.5 Production Account of the NPISHs - 2011 91
3.1 Production Account of the Total Economy, by Institutional Sectors - 2012 92
3.2 Production Account of the Total Economy, by Economic Activities - 2012 92
3.2.1 Production Account of the Non - Financial Coporations - 2012 93
3.2.2 Production Account of the Financial Coporations - 2012 93
3.2.3 Production Account of the General Government - 2012 94
3.2.4 Production Account of the Households - 2012 94
3.2.5 Production Account of the NPISHs - 2012 95
SPECIAL APPENDIX TABLES Page No.
1 Gross Domestic Product at Current & Constant Prices 1975 - 2012
99
2 Composition of Gross Domestic Product by Major three Sectors at Current & Constant Prices 1975 - 2012
100
3 Gross Domestic Product by Industrial Origin at Current Prices of Major Economic Activities 2002 and 2010 to 2012
101-104
4 Gross Domestic Product by Industrial origin at Constant (2002) Prices of Major Economic Activities 2002 and 2010 to 2012
105-108
APPENDIX LIST OF SUPPORTING TABLES
1 Paddy Statistics Extent Sown, Harvested (Gross and Net) and Production 2002-2012
111
2 Paddy Production and Paddy Purchases by PMB/SLAPMA 2006-2012
112
3 Production of Tea, Rubber and Coconut 2002-2012 113
4 Production of Highland Crops in Sri Lanka 2002-2012 114
5 Area of Land Under Principal Crops (Excluding Paddy) 2002-2012
115
6 Production and the Cost of Production of Principal Crops (Excluding Paddy) 2001-2012.
116
7 Export Value of Selected Items in Minor Export Crops in Sri Lanka 2003-2012
117
8 Volume and Value of Exports of Major Agricultural Products 2007-2012.
118
9 Export Quantity of Selected Items in Minor Export Crops in Sri Lanka 2002-2012.
119
10 Imports and Exports of Food Fish, Canned fish, dried fish and Maldive fish in Sri Lanka 2002-2012
120
11 Fishery, Livestock, Milk and Eggs Production in Sri Lanka 2005 - 2012.
121
12 Fertilizer Consumption of Principal Crops in Sri Lanka 2002-2012.
122
Page No.
13 Guaranteed Price Scheme for Paddy 2002 - 2012. 123
14 F.O.B. Prices and Colombo Market Prices (C.M.P.) of Major Agricultural Products 2008-2012.
124
15 Installed Capacity and Gross Electricity Generated 2002-2012. 125
16 Production and Sales of L.P. Gas . 126
17 Electricity Sales by the Type of Customer 2002-2012. 127
18 Gem Export Statistics 2008-2012. 128
19 Mineral Sands Production 2008-2012. 129
20 Mineral Sands Sales 2008-2012. 129
21 Garment Exports by Country 2010-2012 130
22 Production Value of Selected Petroleum Products 2004-2012. 131
23 Annual Petroleum Production. 2004-2012. 132
24 Annual Production and Sales of Cement 2002-2012. 133
25 Water Sales by the Type of Customer 2002-2012. 134
26 Transport Services - Railway 2003-2012. 135
27 Sri Lanka Transport Board 2004 -2012. 136
28 Motor Vehicles - Registered 2002-2012. 137
29 Growth Trends of Tourism 2003-2012. 138
30 Tourist Arrivals by Region of Residence 2003-2012. 139
31 Value of Exports by Principal Commodities 2003-2012. 140
32 Exports by Principal Countries 2003-2012. 141
33 Imports by Principal Countries 2004-2012. 142
34 Annual Averages of Producer Prices for Selected Agricultural Products 2003-2012.
143
35 Annual Averages of Open Market Retail Prices (in Colombo City) 2002-2012
144
36 Colombo Consumers' Price Index by Major Commodity Groups (2006/07 = 100) 2006/07-2012.
145
37 Wholesale Price Index (1974 = 100) 2002-2012. 146
38 Import Quantity by Principal Commodities 2002-2012. 147
39 Import Value by Principal Commodities 2002-2012. 147
40 Imports by Major Categories 2009-2012. 148
41 Exports by Major Categories 2009-2012. 149
PART ONE
ECONOMIC PERFORMANCE – 2012
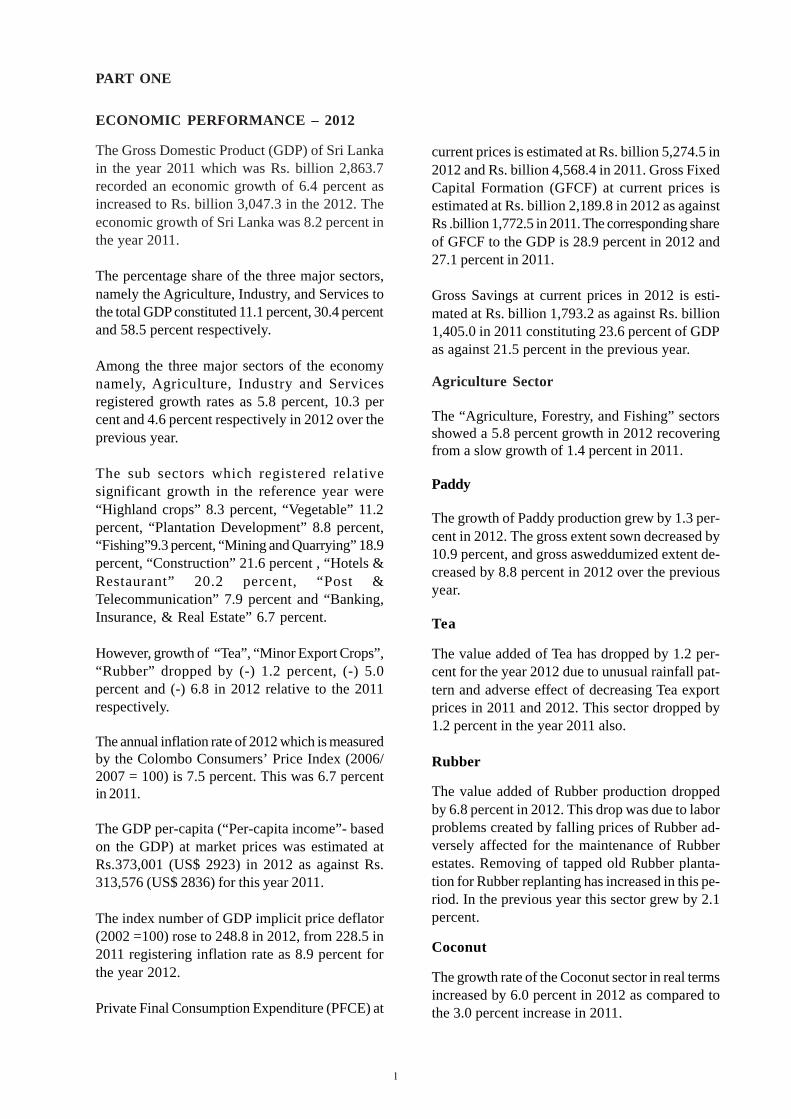
The Gross Domestic Product (GDP) of Sri Lankain the year 2011 which was Rs. billion 2,863.7recorded an economic growth of 6.4 percent asincreased to Rs. billion 3,047.3 in the 2012. Theeconomic growth of Sri Lanka was 8.2 percent inthe year 2011.
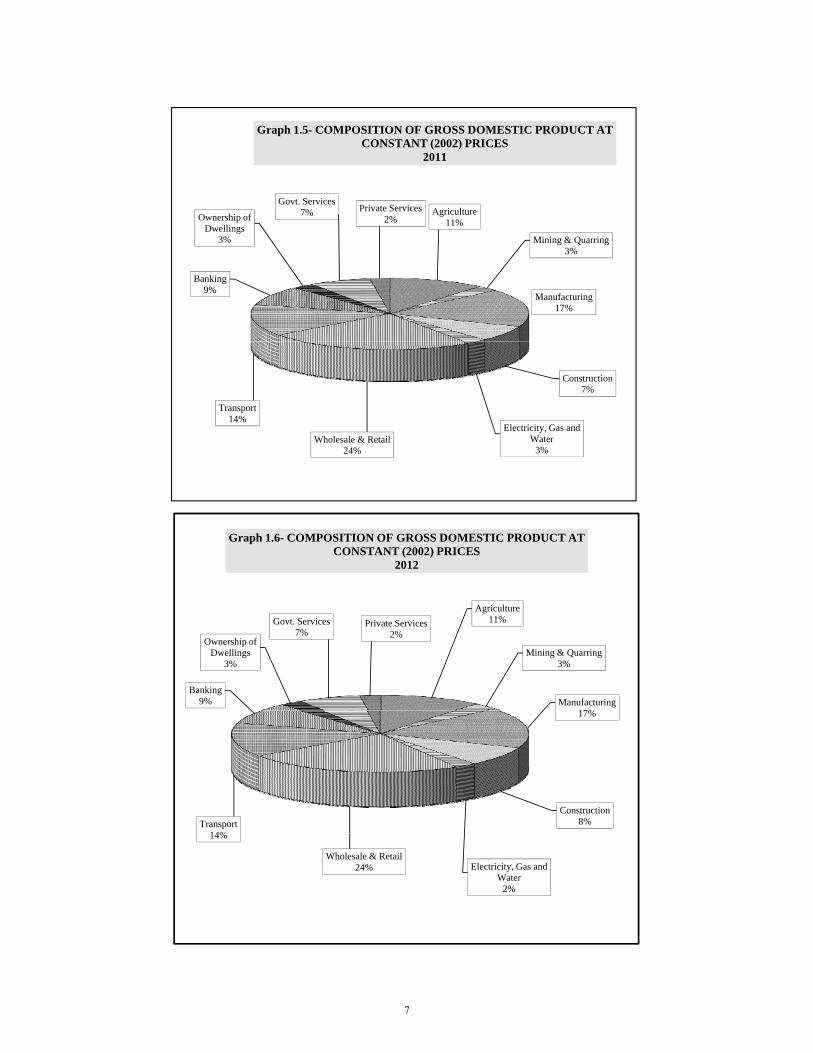
The percentage share of the three major sectors,namely the Agriculture, Industry, and Services tothe total GDP constituted 11.1 percent, 30.4 percentand 58.5 percent respectively.
Among the three major sectors of the economynamely, Agriculture, Industry and Servicesregistered growth rates as 5.8 percent, 10.3 percent and 4.6 percent respectively in 2012 over theprevious year.
The sub sectors which registered relativesignificant growth in the reference year were“Highland crops” 8.3 percent, “Vegetable” 11.2percent, “Plantation Development” 8.8 percent,“Fishing”9.3 percent, “Mining and Quarrying” 18.9percent, “Construction” 21.6 percent , “Hotels &Restaurant” 20.2 percent, “Post &Telecommunication” 7.9 percent and “Banking,Insurance, & Real Estate” 6.7 percent.
However, growth of “Tea”, “Minor Export Crops”,“Rubber” dropped by (-) 1.2 percent, (-) 5.0percent and (-) 6.8 in 2012 relative to the 2011respectively.
The annual inflation rate of 2012 which is measuredby the Colombo Consumers’ Price Index (2006/2007 = 100) is 7.5 percent. This was 6.7 percentin 2011.
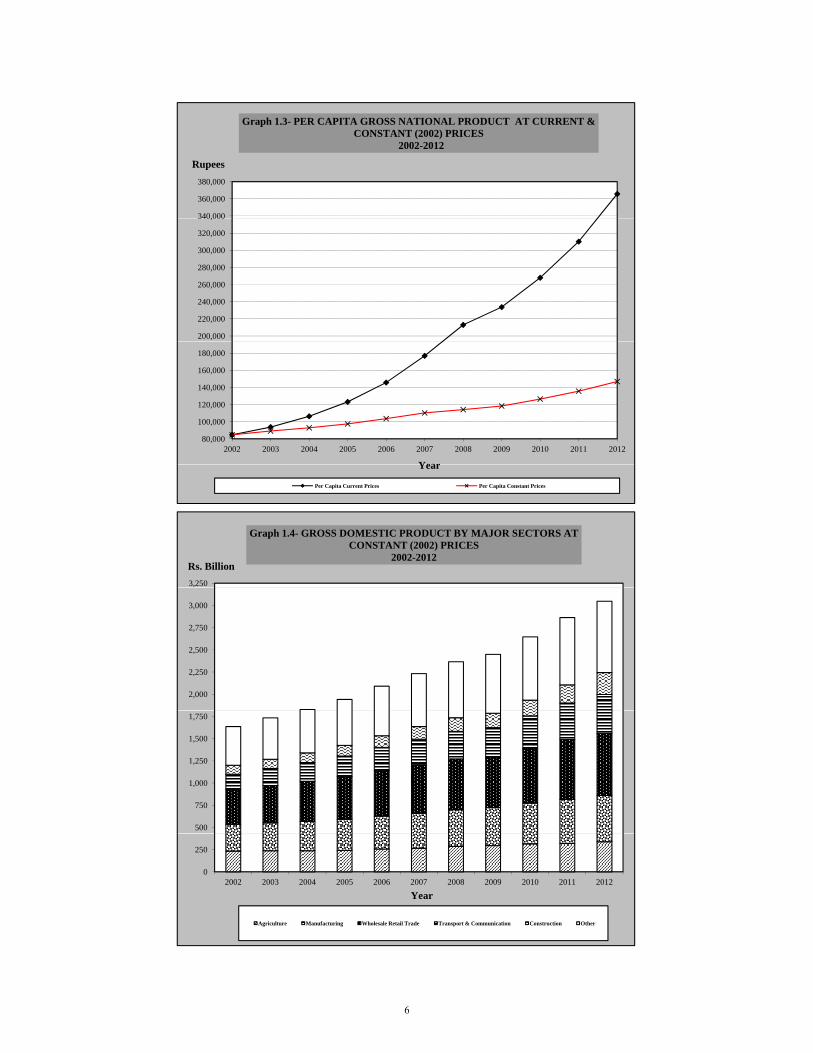
The GDP per-capita (“Per-capita income”- basedon the GDP) at market prices was estimated atRs.373,001 (US$ 2923) in 2012 as against Rs.313,576 (US$ 2836) for this year 2011.
The index number of GDP implicit price deflator(2002 =100) rose to 248.8 in 2012, from 228.5 in2011 registering inflation rate as 8.9 percent forthe year 2012.
Private Final Consumption Expenditure (PFCE) at
Agriculture Sector
The “Agriculture, Forestry, and Fishing” sectorsshowed a 5.8 percent growth in 2012 recoveringfrom a slow growth of 1.4 percent in 2011.
Paddy
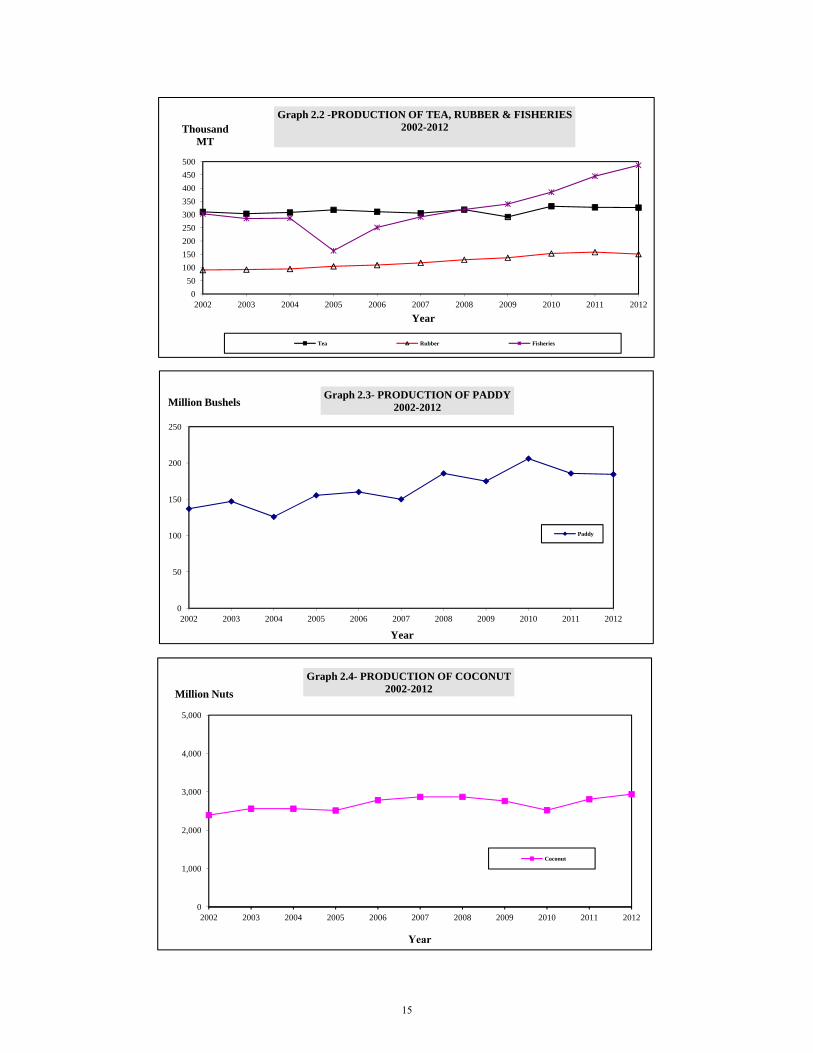
The growth of Paddy production grew by 1.3 per-cent in 2012. The gross extent sown decreased by10.9 percent, and gross asweddumized extent de-creased by 8.8 percent in 2012 over the previousyear.
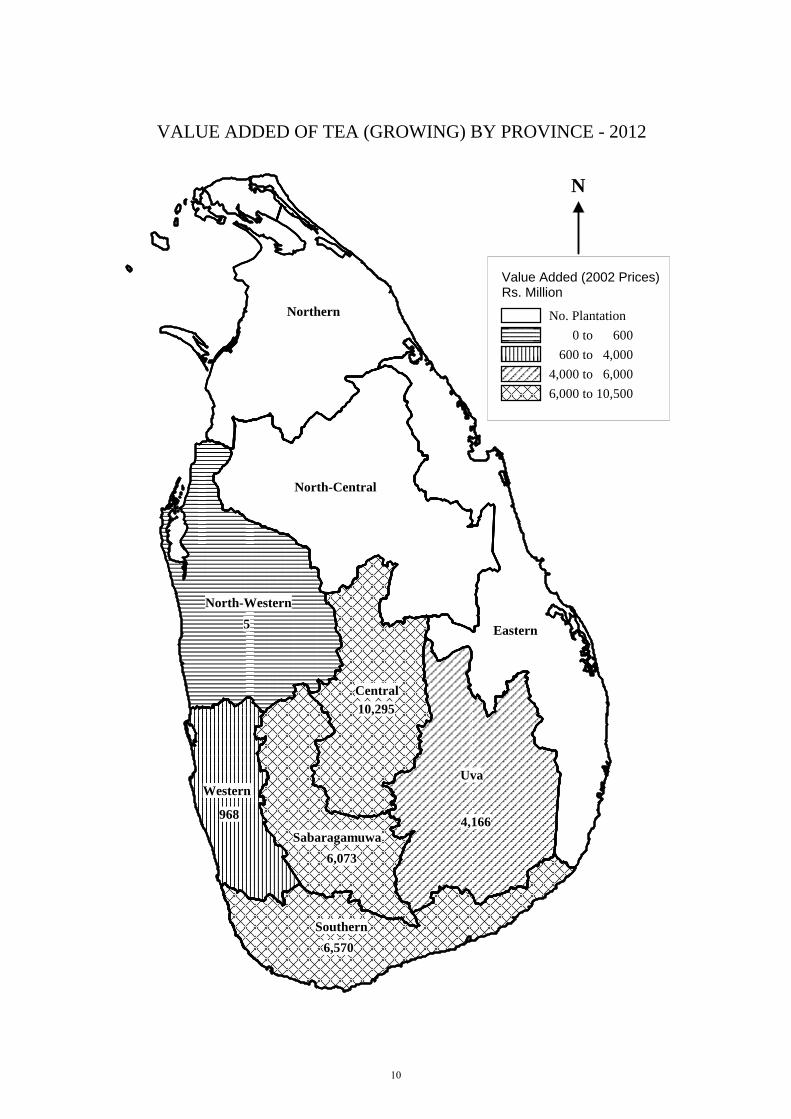
Tea
The value added of Tea has dropped by 1.2 per-cent for the year 2012 due to unusual rainfall pat-tern and adverse effect of decreasing Tea exportprices in 2011 and 2012. This sector dropped by1.2 percent in the year 2011 also.
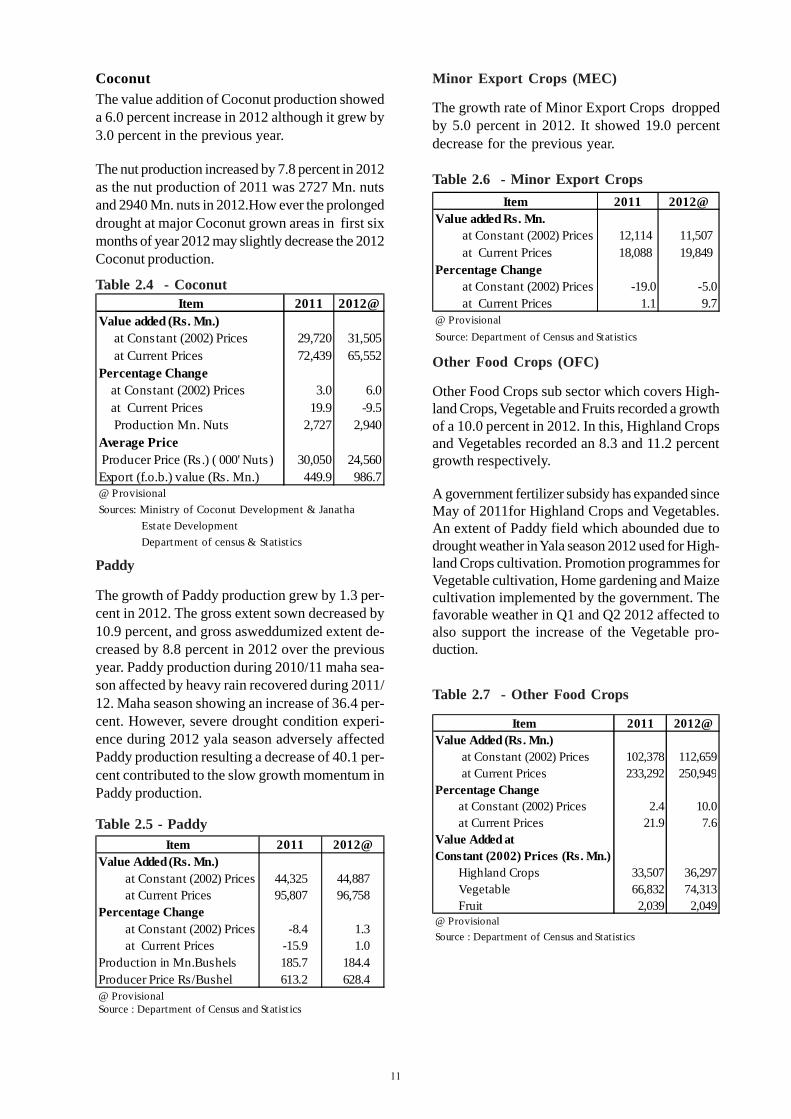
Rubber
The value added of Rubber production droppedby 6.8 percent in 2012. This drop was due to laborproblems created by falling prices of Rubber ad-versely affected for the maintenance of Rubberestates. Removing of tapped old Rubber planta-tion for Rubber replanting has increased in this pe-riod. In the previous year this sector grew by 2.1percent.
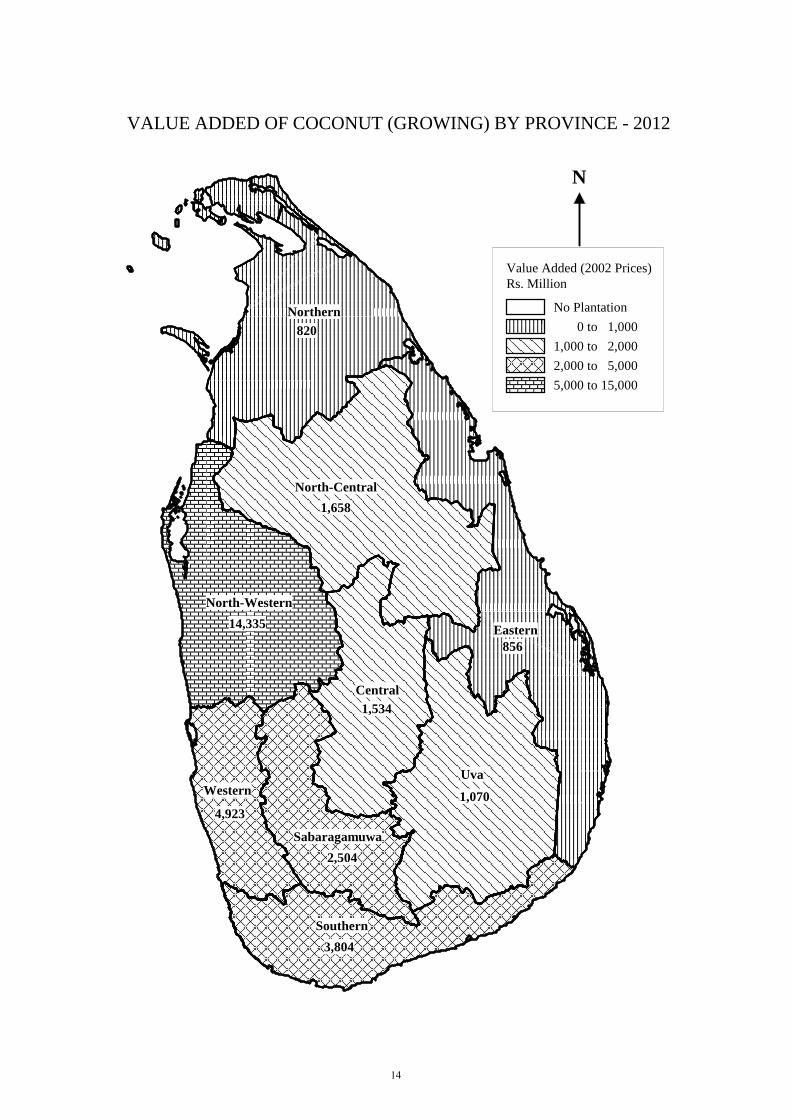
Coconut
The growth rate of the Coconut sector in real termsincreased by 6.0 percent in 2012 as compared tothe 3.0 percent increase in 2011.
Gross Savings at current prices in 2012 is esti-mated at Rs. billion 1,793.2 as against Rs. billion1,405.0 in 2011 constituting 23.6 percent of GDPas against 21.5 percent in the previous year.
2012 and Rs. billion 4,568.4 in 2011. Gross FixedCapital Formation (GFCF) at current prices isestimated at Rs. billion 2,189.8 in 2012 as againstRs .billion 1,772.5 in 2011. The corresponding shareof GFCF to the GDP is 28.9 percent in 2012 and27.1 percent in 2011.
current prices is estimated at Rs. billion 5,274.5 in
1
2
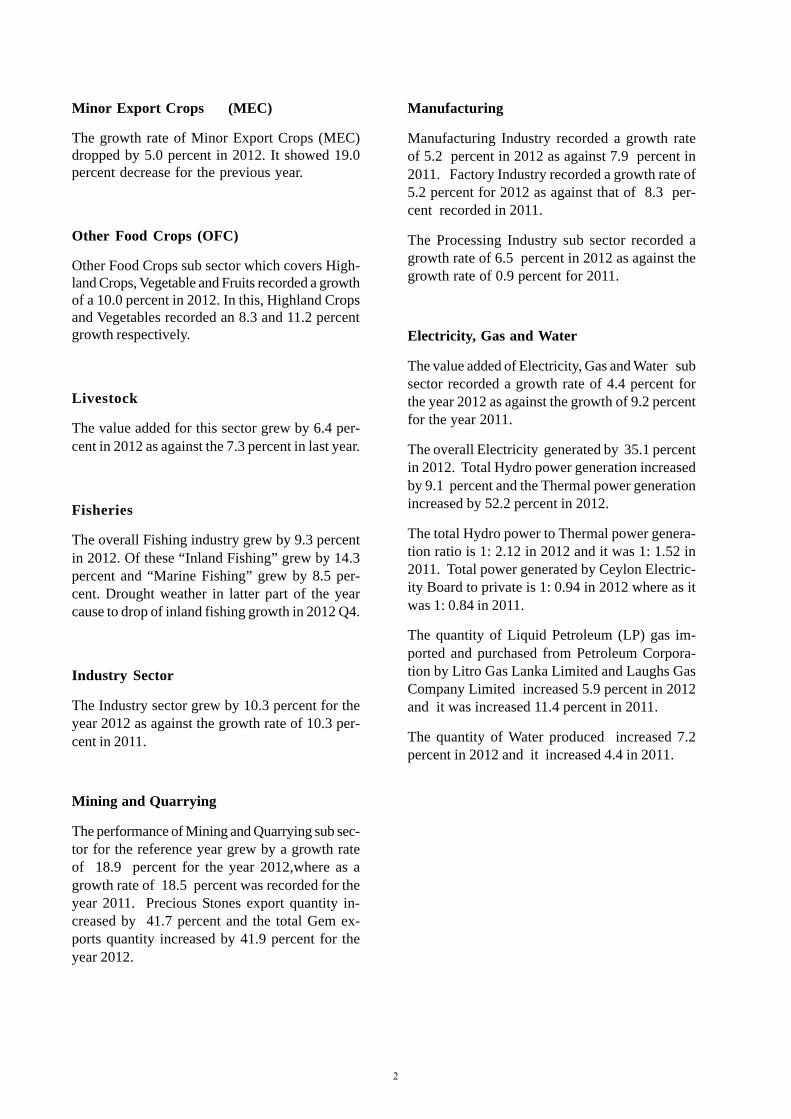
Minor Export Crops (MEC)
The growth rate of Minor Export Crops (MEC)dropped by 5.0 percent in 2012. It showed 19.0percent decrease for the previous year.
Other Food Crops (OFC)
Other Food Crops sub sector which covers High-land Crops, Vegetable and Fruits recorded a growthof a 10.0 percent in 2012. In this, Highland Cropsand Vegetables recorded an 8.3 and 11.2 percentgrowth respectively.
Livestock
The value added for this sector grew by 6.4 per-cent in 2012 as against the 7.3 percent in last year.
Fisheries
The overall Fishing industry grew by 9.3 percentin 2012. Of these “Inland Fishing” grew by 14.3percent and “Marine Fishing” grew by 8.5 per-cent. Drought weather in latter part of the yearcause to drop of inland fishing growth in 2012 Q4.
Industry Sector
The Industry sector grew by 10.3 percent for theyear 2012 as against the growth rate of 10.3 per-cent in 2011.
Mining and Quarrying
The performance of Mining and Quarrying sub sec-tor for the reference year grew by a growth rateof 18.9 percent for the year 2012,where as agrowth rate of 18.5 percent was recorded for theyear 2011. Precious Stones export quantity in-creased by 41.7 percent and the total Gem ex-ports quantity increased by 41.9 percent for theyear 2012.
Manufacturing
Manufacturing Industry recorded a growth rateof 5.2 percent in 2012 as against 7.9 percent in2011. Factory Industry recorded a growth rate of5.2 percent for 2012 as against that of 8.3 per-cent recorded in 2011.
The Processing Industry sub sector recorded agrowth rate of 6.5 percent in 2012 as against thegrowth rate of 0.9 percent for 2011.
Electricity, Gas and Water
The value added of Electricity, Gas and Water subsector recorded a growth rate of 4.4 percent forthe year 2012 as against the growth of 9.2 percentfor the year 2011.
The overall Electricity generated by 35.1 percentin 2012. Total Hydro power generation increasedby 9.1 percent and the Thermal power generationincreased by 52.2 percent in 2012.
The total Hydro power to Thermal power genera-tion ratio is 1: 2.12 in 2012 and it was 1: 1.52 in2011. Total power generated by Ceylon Electric-ity Board to private is 1: 0.94 in 2012 where as itwas 1: 0.84 in 2011.
The quantity of Liquid Petroleum (LP) gas im-ported and purchased from Petroleum Corpora-tion by Litro Gas Lanka Limited and Laughs GasCompany Limited increased 5.9 percent in 2012and it was increased 11.4 percent in 2011.
The quantity of Water produced increased 7.2percent in 2012 and it increased 4.4 in 2011.
2
3
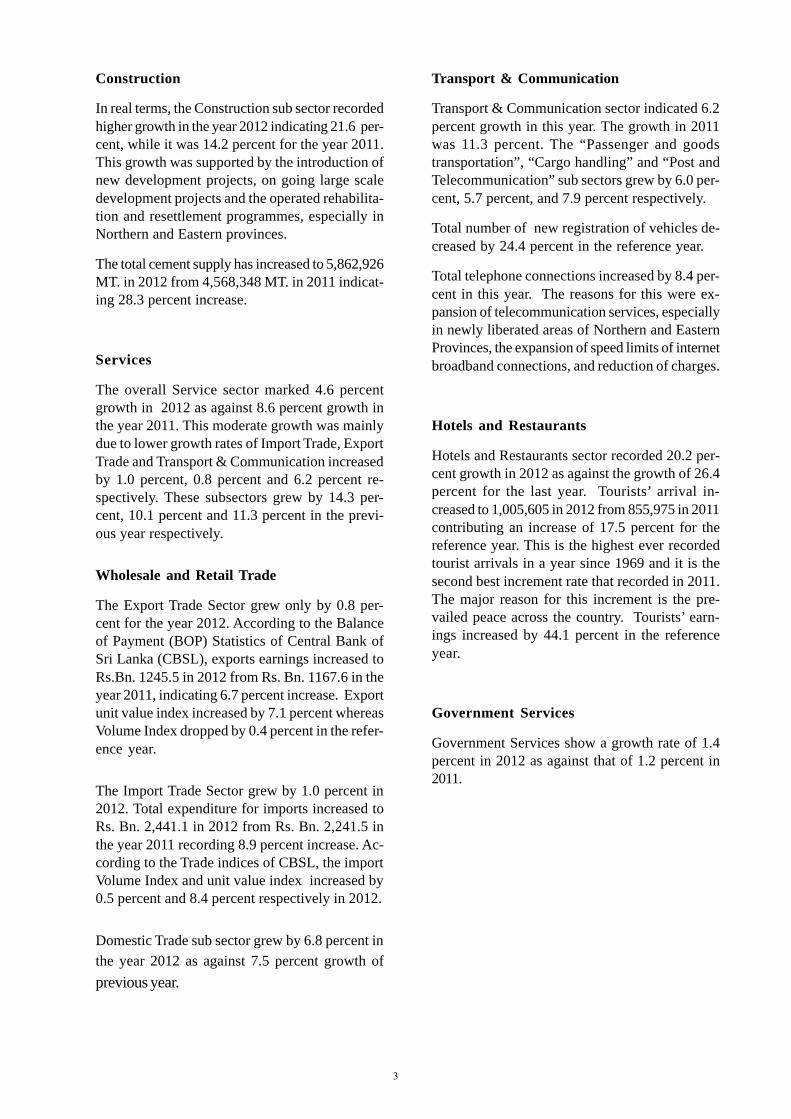
Construction
In real terms, the Construction sub sector recordedhigher growth in the year 2012 indicating 21.6 per-cent, while it was 14.2 percent for the year 2011.This growth was supported by the introduction ofnew development projects, on going large scaledevelopment projects and the operated rehabilita-tion and resettlement programmes, especially inNorthern and Eastern provinces.
The total cement supply has increased to 5,862,926MT. in 2012 from 4,568,348 MT. in 2011 indicat-ing 28.3 percent increase.
Services
The overall Service sector marked 4.6 percentgrowth in 2012 as against 8.6 percent growth inthe year 2011. This moderate growth was mainlydue to lower growth rates of Import Trade, ExportTrade and Transport & Communication increasedby 1.0 percent, 0.8 percent and 6.2 percent re-spectively. These subsectors grew by 14.3 per-cent, 10.1 percent and 11.3 percent in the previ-ous year respectively.
Wholesale and Retail Trade
The Export Trade Sector grew only by 0.8 per-cent for the year 2012. According to the Balanceof Payment (BOP) Statistics of Central Bank ofSri Lanka (CBSL), exports earnings increased toRs.Bn. 1245.5 in 2012 from Rs. Bn. 1167.6 in theyear 2011, indicating 6.7 percent increase. Exportunit value index increased by 7.1 percent whereasVolume Index dropped by 0.4 percent in the refer-ence year.
The Import Trade Sector grew by 1.0 percent in2012. Total expenditure for imports increased toRs. Bn. 2,441.1 in 2012 from Rs. Bn. 2,241.5 inthe year 2011 recording 8.9 percent increase. Ac-cording to the Trade indices of CBSL, the importVolume Index and unit value index increased by0.5 percent and 8.4 percent respectively in 2012.
Domestic Trade sub sector grew by 6.8 percent inthe year 2012 as against 7.5 percent growth ofprevious year.
Transport & Communication
Transport & Communication sector indicated 6.2percent growth in this year. The growth in 2011was 11.3 percent. The “Passenger and goodstransportation”, “Cargo handling” and “Post andTelecommunication” sub sectors grew by 6.0 per-cent, 5.7 percent, and 7.9 percent respectively.
Total number of new registration of vehicles de-creased by 24.4 percent in the reference year.
Total telephone connections increased by 8.4 per-cent in this year. The reasons for this were ex-pansion of telecommunication services, especiallyin newly liberated areas of Northern and EasternProvinces, the expansion of speed limits of internetbroadband connections, and reduction of charges.
Hotels and Restaurants
Hotels and Restaurants sector recorded 20.2 per-cent growth in 2012 as against the growth of 26.4percent for the last year. Tourists’ arrival in-creased to 1,005,605 in 2012 from 855,975 in 2011contributing an increase of 17.5 percent for thereference year. This is the highest ever recordedtourist arrivals in a year since 1969 and it is thesecond best increment rate that recorded in 2011.The major reason for this increment is the pre-vailed peace across the country. Tourists’ earn-ings increased by 44.1 percent in the referenceyear.
Government Services
Government Services show a growth rate of 1.4percent in 2012 as against that of 1.2 percent in2011.
3
4
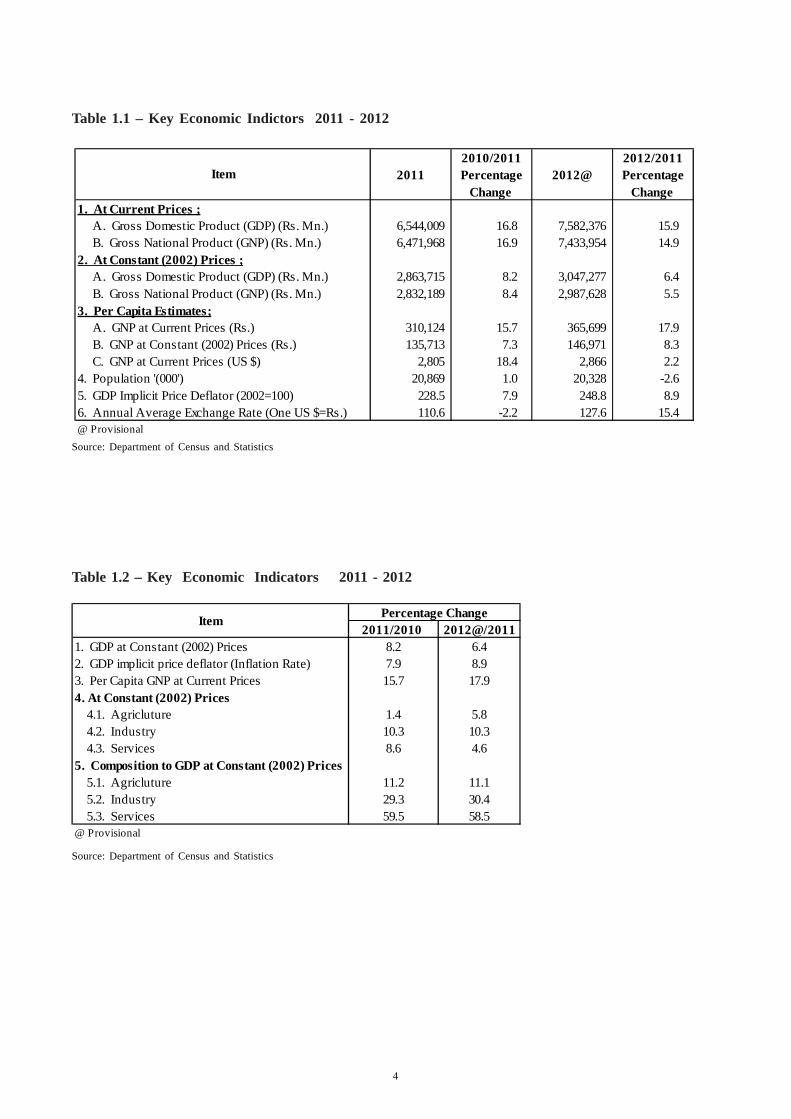
Table 1.2 – Key Economic Indicators 2011 - 2012
Table 1.1 – Key Economic Indictors 2011 - 2012
Source: Department of Census and Statistics
Source: Department of Census and Statistics
2010/2011 2012/20112011 Percentage 2012@ Percentage
Change Change 1. At Current Prices ; A. Gross Domestic Product (GDP) (Rs. Mn.) 6,544,009 16.8 7,582,376 15.9 B. Gross National Product (GNP) (Rs. Mn.) 6,471,968 16.9 7,433,954 14.92. At Constant (2002) Prices ; A. Gross Domestic Product (GDP) (Rs. Mn.) 2,863,715 8.2 3,047,277 6.4 B. Gross National Product (GNP) (Rs. Mn.) 2,832,189 8.4 2,987,628 5.53. Per Capita Estimates; A. GNP at Current Prices (Rs.) 310,124 15.7 365,699 17.9 B. GNP at Constant (2002) Prices (Rs.) 135,713 7.3 146,971 8.3 C. GNP at Current Prices (US $) 2,805 18.4 2,866 2.24. Population '(000') 20,869 1.0 20,328 -2.65. GDP Implicit Price Deflator (2002=100) 228.5 7.9 248.8 8.96. Annual Average Exchange Rate (One US $=Rs.) 110.6 -2.2 127.6 15.4@ Provisional
Item
2011/2010 2012@/20111. GDP at Constant (2002) Prices 8.2 6.42. GDP implicit price deflator (Inflation Rate) 7.9 8.93. Per Capita GNP at Current Prices 15.7 17.94. At Constant (2002) Prices
4.1. Agricluture 1.4 5.84.2. Industry 10.3 10.34.3. Services 8.6 4.6
5. Composition to GDP at Constant (2002) Prices5.1. Agricluture 11.2 11.15.2. Industry 29.3 30.45.3. Services 59.5 58.5
@ Provisional
Item Percentage Change
4
7 000
7,500
8,000
Rs. Billion
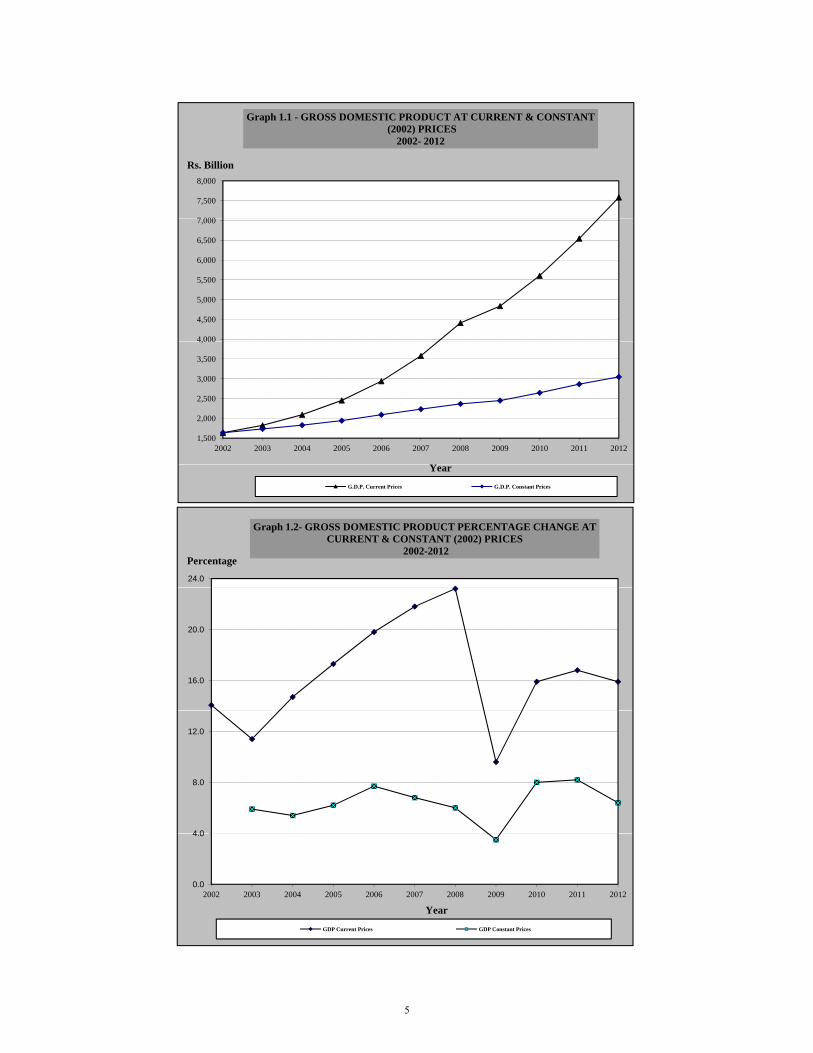
Graph 1.1 - GROSS DOMESTIC PRODUCT AT CURRENT & CONSTANT(2002) PRICES
2002- 2012
4,000
4,500
5,000
5,500
6,000
6,500
7,000
1,500
2,000
2,500
3,000
3,500
4,000
2002 2003 2004 2005 2006 2007 2008 2009 2010 2011 2012
YYearG.D.P. Current Prices G.D.P. Constant Prices
24.0
Percentage
Graph 1.2- GROSS DOMESTIC PRODUCT PERCENTAGE CHANGE AT CURRENT & CONSTANT (2002) PRICES
2002-2012
16.0
20.0
4 0
8.0
12.0
0.0
4.0
2002 2003 2004 2005 2006 2007 2008 2009 2010 2011 2012
Year
GDP Current Prices GDP Constant Prices
5
340,000
360,000
380,000
Rupees
Graph 1.3- PER CAPITA GROSS NATIONAL PRODUCT AT CURRENT & CONSTANT (2002) PRICES
2002-2012
200,000
220,000
240,000
260,000
280,000
300,000
320,000
340,000
80,000
100,000
120,000
140,000
160,000
180,000
2002 2003 2004 2005 2006 2007 2008 2009 2010 2011 2012
YearYear
Per Capita Current Prices Per Capita Constant Prices
3,250
Rs. Billion
Graph 1.4- GROSS DOMESTIC PRODUCT BY MAJOR SECTORS AT CONSTANT (2002) PRICES
2002-2012
2,000
2,250
2,500
2,750
3,000
500
750
1,000
1,250
1,500
1,750
0
250
2002 2003 2004 2005 2006 2007 2008 2009 2010 2011 2012
Year
Agriculture Manufacturing Wholesale Retail Trade Transport & Communication Construction Other
6
AgricultureOwnership of
Govt. Services7% Private Services
2%
Graph 1.5- COMPOSITION OF GROSS DOMESTIC PRODUCT AT CONSTANT (2002) PRICES
2011
11%
Mining & Quarring3%
Manufacturing17%
Banking9%
Ownership of Dwellings
3%
2%
Construction7%
Electricity, Gas and Water
3%Wholesale & Retail
24%
Transport14%
Graph 1.6- COMPOSITION OF GROSS DOMESTIC PRODUCT AT CONSTANT (2002) PRICES
2012
Agriculture11%
Mining & Quarring3%
Manufacturing17%
Banking9%
Ownership of Dwellings
3%
Govt. Services7%
Private Services2%
17%
Construction8%Transport
14%
Electricity, Gas and Water
2%
Wholesale & Retail24%
14%
7
8
01. AGRICULTURE, LIVESTOCK ANDFISHERIES
The “Agriculture, Forestry, and Fishing” sectorshowed a 5.8 percent growth in 2012 recoveringfrom a slow growth of 1.4 percent in 2011.
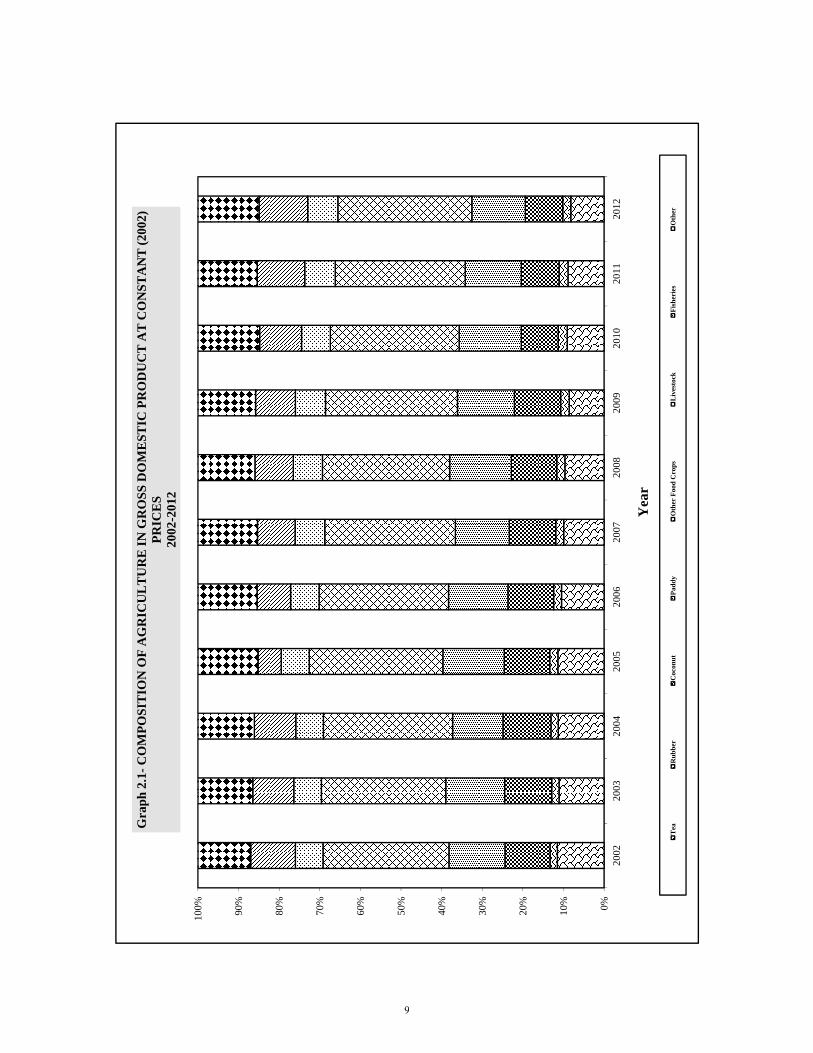
The sub sectors in Agriculture sector which regis-tered relative significant growth in the referenceyear were “Highland Crops” 8.3 percent, “Veg-etable” 11.2 percent, “Plantation Development” 8.8percent, “Fishing” 9.3 precent. However, growthof “Tea”, “Minor Export Crops”, “Rubber” droppedby (-) 1.2 percent, (-) 5.0 percent and (-) 6.8 in2012 relative to the 2011 respectively. The rela-tively higher growth rate in first half of 2012 wasmainly due to favorable weather in maha season2011/2012 extension of government fertilizer sub-sidies for Vegetables and Highland Crops sincemid of 2011. However , an expected droughtweather hindered Agriculture production in laterpart of 2012.
Agriculture sector (excluding Fishing) registereda growth of 5.3 percent for the year 2012.
Table 2.1 - Performance of the AgricultureSector
Source: Department of Census and Statistics
Tea
PART TWO
GROSS DOMESTIC PRODUCT BY INDUSTRIAL ORIGINDETAILED SECTORAL REVIEW
Rubber
The value added of Rubber production droppedby 6.8 percent in 2012. This drop was due to laborproblems created by falling prices of Rubber ad-versely affected for the maintenance of Rubberestates. Removing of tapped old Rubber planta-tion for Rubber replanting has increased in thisperiod. In the previous year this sector grew by2.1 percent.
Table 2.3 - Rubber
The growth rate of Tea has dropped by 1.2 per-cent for the year 2012 due to unusual rainfall pat-tern and adverse effect of decreasing Tea export
prices in 2011 and 2012. The same pattern shownin the year 2011 also.
Fishing sub sector indicated a growth rate of 9.3percent for 2012.
Table 2.2 - Tea
Item 2011 2012@Value Added (Rs. Mn.) at Constant (2002 ) Prices 320,178 338,625 at Current Prices 792,457 837,883Growth Rate (Percentage) at Constant (2002 ) Prices 1.4 5.8 at Current Prices 10.4 5.7Percentage Contribution to GDP at Constant (2002 ) Prices 11.2 11.1 at Current Prices 11.2 11.1@ Provisional
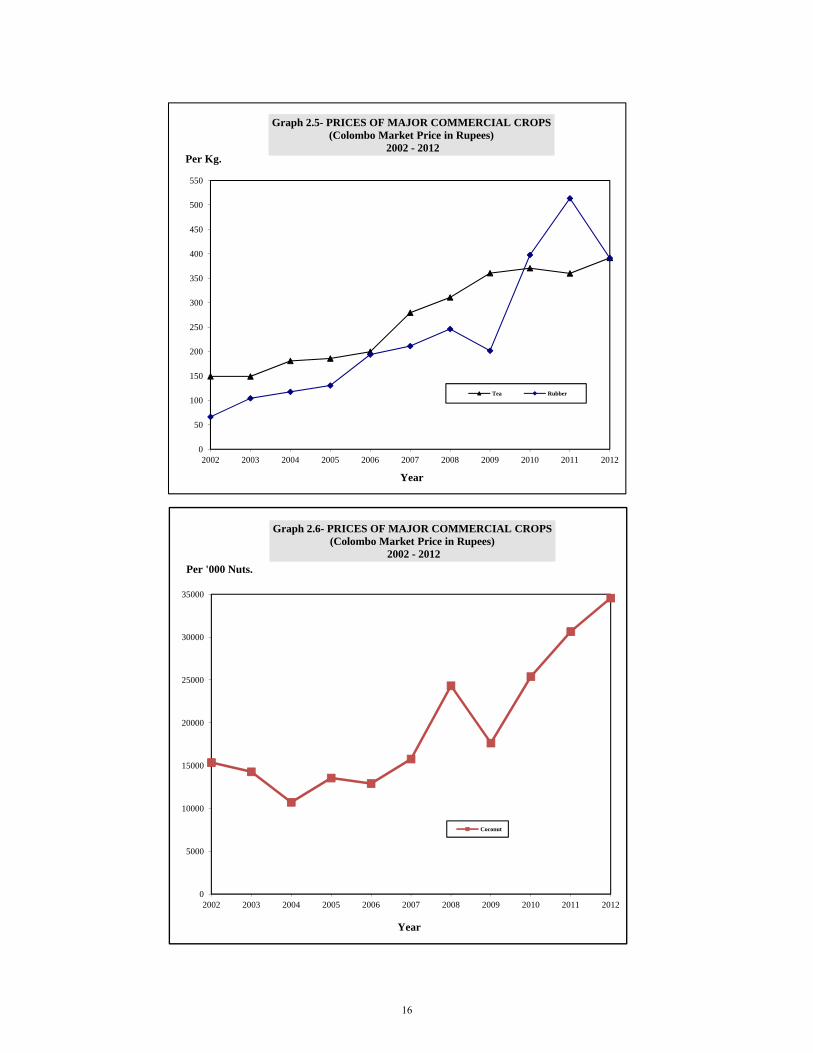
Item 2011 2012@Value Added (Rs. Mn.) at Constant (2002) Prices 28,432 28,077 at Current Prices 67,896 74,065Percentage Change at Constant (2002) Prices -1.2 -1.2 at Current Prices -6.1 9.1Production of made Tea Mn. Kg. 327.5 326.30Average CMP price Rs.Per/Kg. 359.89 391.64Average Export price (f.o.b.) Rs.Per/Kg. 511.08 563.90@ Provisional
Department of Census and Stat ist icsSource: Sri Lanka T ea Board
Item 2011 2012@Value Added (Rs. Mn.) at Constant (2002) Prices 7,128 6,647 at Current Prices 62,724 50,255Percentage change at Constant (2002) Prices 2.1 -6.8 at Current Prices 42.2 -19.9 Made rubber production Mn. Kg. 158.2 150.6
Average producer's price of Latex R s./ perKg. 500.19 403.98Average price of made RubberRs./perKg. Average Colombo Auction (Gross) 513.57 391.19 Average Export Price (f.o.b) Rs./Kg. 535.40 420.73@ ProvisionalSource: Rubber Development Department Department of Census and Stat istics
8
Gra
ph 2
.1-C
OM
POSI
TIO
N O
F A
GR
ICU
LT
UR
E IN
GR
OSS
DO
ME
STIC
PR
OD
UC
T A
T C
ON
STA
NT
(200
2)
PRIC
ES
2002
-201
2
80%
90%
100% 60
%
70%
40%
50%
10%
20%
30% 0%
2002
2003
2004
2005
2006
2007
2008
2009
2010
2011
2012
Yea
r
Tea
Rub
ber
Coc
onut
Padd
yO
ther
Foo
d C
rops
Liv
esto
ckFi
sher
ies
Oth
er
9
Central
Southern
Western
Sabaragamuwa
Eastern
North-Western
North-Central
10,295
6,073
4,166
5
6,570
968
Central
Southern
Western
Sabaragamuwa
Eastern
North-Western
North-Central
Uva
Northern
10,295
6,073
4,166
5
6,570
968
Value Added (2002 Prices)Rs. Million
No. Plantation
0 to 600
600 to 4,000
4,000 to 6,000
6,000 to 10,500
VALUE ADDED OF TEA (GROWING) BY PROVINCE - 2012
N
10
11
Table 2.5 - Paddy
Coconut
Paddy
Table 2.4 - Coconut
Table 2.6 - Minor Export Crops
Minor Export Crops (MEC)
Other Food Crops (OFC)
Other Food Crops sub sector which covers High-land Crops, Vegetable and Fruits recorded a growthof a 10.0 percent in 2012. In this, Highland Cropsand Vegetables recorded an 8.3 and 11.2 percentgrowth respectively.
A government fertilizer subsidy has expanded sinceMay of 2011for Highland Crops and Vegetables.An extent of Paddy field which abounded due todrought weather in Yala season 2012 used for High-land Crops cultivation. Promotion programmes forVegetable cultivation, Home gardening and Maizecultivation implemented by the government. Thefavorable weather in Q1 and Q2 2012 affected toalso support the increase of the Vegetable pro-duction.
Table 2.7 - Other Food Crops
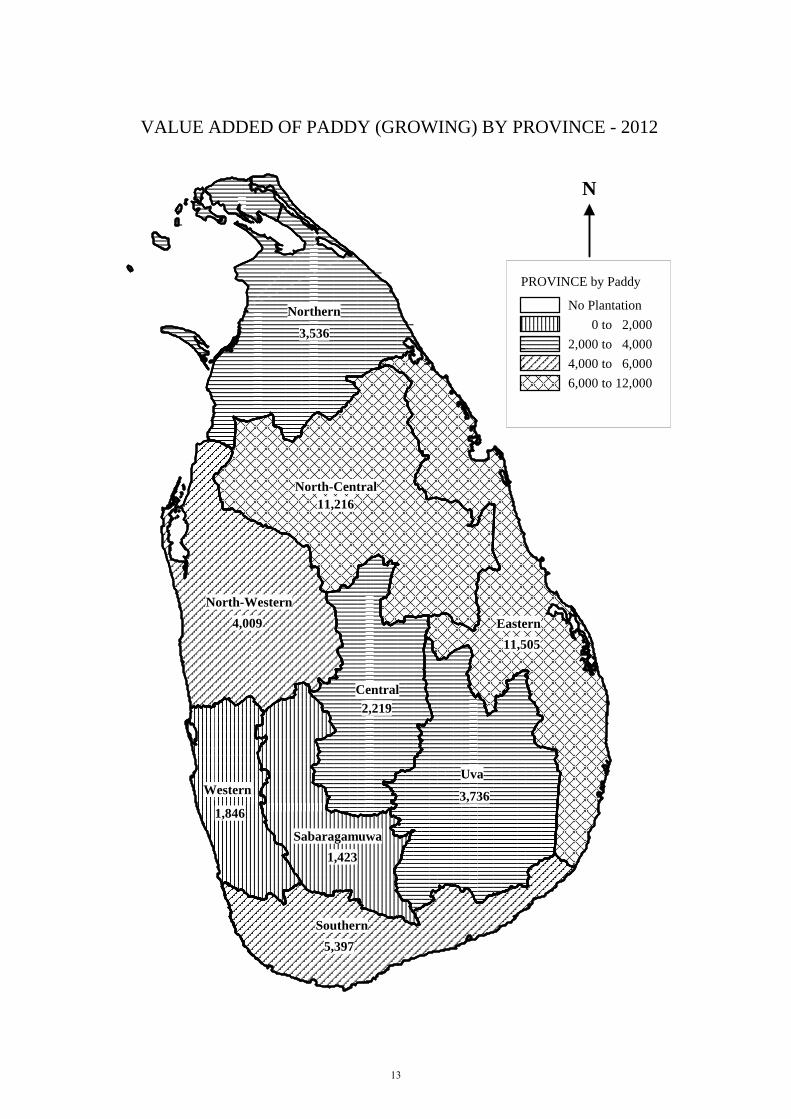
The value addition of Coconut production showeda 6.0 percent increase in 2012 although it grew by3.0 percent in the previous year.
The nut production increased by 7.8 percent in 2012as the nut production of 2011 was 2727 Mn. nutsand 2940 Mn. nuts in 2012.How ever the prolongeddrought at major Coconut grown areas in first sixmonths of year 2012 may slightly decrease the 2012Coconut production.
The growth rate of Minor Export Crops droppedby 5.0 percent in 2012. It showed 19.0 percentdecrease for the previous year.
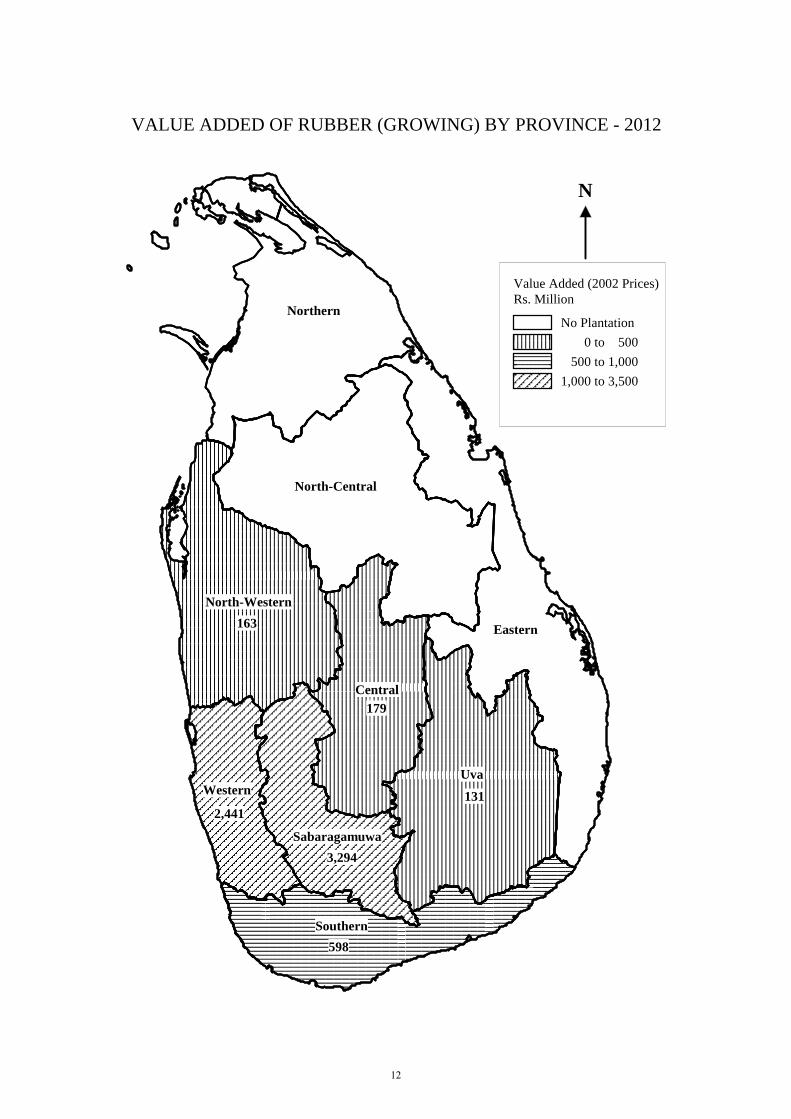
The growth of Paddy production grew by 1.3 per-cent in 2012. The gross extent sown decreased by10.9 percent, and gross asweddumized extent de-creased by 8.8 percent in 2012 over the previousyear. Paddy production during 2010/11 maha sea-son affected by heavy rain recovered during 2011/12. Maha season showing an increase of 36.4 per-cent. However, severe drought condition experi-ence during 2012 yala season adversely affectedPaddy production resulting a decrease of 40.1 per-cent contributed to the slow growth momentum inPaddy production.
Item 2011 2012@Value added (Rs. Mn.) at Constant (2002) Prices 29,720 31,505 at Current Prices 72,439 65,552 Percentage Change at Constant (2002) Prices 3.0 6.0 at Current Prices 19.9 -9.5 Production Mn. Nuts 2,727 2,940Average Price Producer Price (Rs.) ( 000' Nuts) 30,050 24,560 Export (f.o.b.) value (Rs. Mn.) 449.9 986.7@ ProvisionalSources: Ministry of Coconut Development & Janatha Estate Development Department of census & Statist ics
Item 2011 2012@Value Added (Rs. Mn.) at Constant (2002) Prices 44,325 44,887 at Current Prices 95,807 96,758 Percentage Change at Constant (2002) Prices -8.4 1.3 at Current Prices -15.9 1.0Production in Mn.Bushels 185.7 184.4 Producer Price Rs/Bushel 613.2 628.4 @ ProvisionalSource : Department of Census and Statist ics
Item 2011 2012@Value added Rs. Mn. at Constant (2002) Prices 12,114 11,507 at Current Prices 18,088 19,849 Percentage Change at Constant (2002) Prices -19.0 -5.0 at Current Prices 1.1 9.7@ ProvisionalSource: Department of Census and Stat istics
Item 2011 2012@Value Added (Rs. Mn.) at Constant (2002) Prices 102,378 112,659 at Current Prices 233,292 250,949Percentage Change at Constant (2002) Prices 2.4 10.0 at Current Prices 21.9 7.6Value Added atConstant (2002) Prices (Rs. Mn.) Highland Crops 33,507 36,297 Vegetable 66,832 74,313 Fruit 2,039 2,049 @ ProvisionalSource : Department of Census and Statistics
11
North-Western
Eastern
Central
North-Central
Western
Sabaragamuwa
Southern
163
131
179
2,441
3,294
598
North-Western
Eastern
Central
North-Central
Western
Sabaragamuwa
Southern
Uva
Northern
163
131
179
2,441
3,294
598
VALUE ADDED OF RUBBER (GROWING) BY PROVINCE - 2012
N
Value Added (2002 Prices)Rs. Million
No Plantation
0 to 500
500 to 1,000
1,000 to 3,500
12
Eastern
North-Central
North-Western
Central
Western
Sabaragamuwa
Southern
11,505
11,216
3,536
4,009
3,736
2,219
1,846
1,423
5,397
Eastern
North-Central
North-Western
Central
Western
Sabaragamuwa
Southern
Uva
Northern
11,505
11,216
3,536
4,009
3,736
2,219
1,846
1,423
5,397
VALUE ADDED OF PADDY (GROWING) BY PROVINCE - 2012
N
PROVINCE by Paddy
No Plantation
0 to 2,000
2,000 to 4,000
4,000 to 6,000
6,000 to 12,000
13
Central
Southern
Western
Sabaragamuwa
Eastern
North-Western
North-Central
1,534
4,923
2,504
856
1,070
14,335
1,658
820
3,804
Central
Southern
Western
Sabaragamuwa
Eastern
North-Western
North-Central
Uva
Northern
1,534
4,923
2,504
856
1,070
14,335
1,658
820
3,804
VALUE ADDED OF COCONUT (GROWING) BY PROVINCE - 2012
Value Added (2002 Prices)Rs. Million
No Plantation
0 to 1,000
1,000 to 2,000
2,000 to 5,000
5,000 to 15,000
N
14
300350400450500
Thousand MT
Graph 2.2 -PRODUCTION OF TEA, RUBBER & FISHERIES2002-2012
050
100150200250
2002 2003 2004 2005 2006 2007 2008 2009 2010 2011 2012
Year
i iTea Rubber Fisheries
200
250
Million BushelsGraph 2.3- PRODUCTION OF PADDY
2002-2012
50
100
150
200
Paddy
02002 2003 2004 2005 2006 2007 2008 2009 2010 2011 2012
Year
Million NutsGraph 2.4- PRODUCTION OF COCONUT
2002-2012
2,000
3,000
4,000
5,000
0
1,000
,
2002 2003 2004 2005 2006 2007 2008 2009 2010 2011 2012
Coconut
15
500
550
Per Kg.
Graph 2.5- PRICES OF MAJOR COMMERCIAL CROPS (Colombo Market Price in Rupees)
2002 - 2012
250
300
350
400
450
0
50
100
150
200
2002 2003 2004 2005 2006 2007 2008 2009 2010 2011 2012
Tea Rubber
Year
Per '000 Nuts.
Graph 2.6- PRICES OF MAJOR COMMERCIAL CROPS (Colombo Market Price in Rupees)
2002 - 2012
25000
30000
35000
10000
15000
20000
Coconut
0
5000
2002 2003 2004 2005 2006 2007 2008 2009 2010 2011 2012
Year
16
17
Livestock
Table 2.9 - Fisheries
Fishing Industry
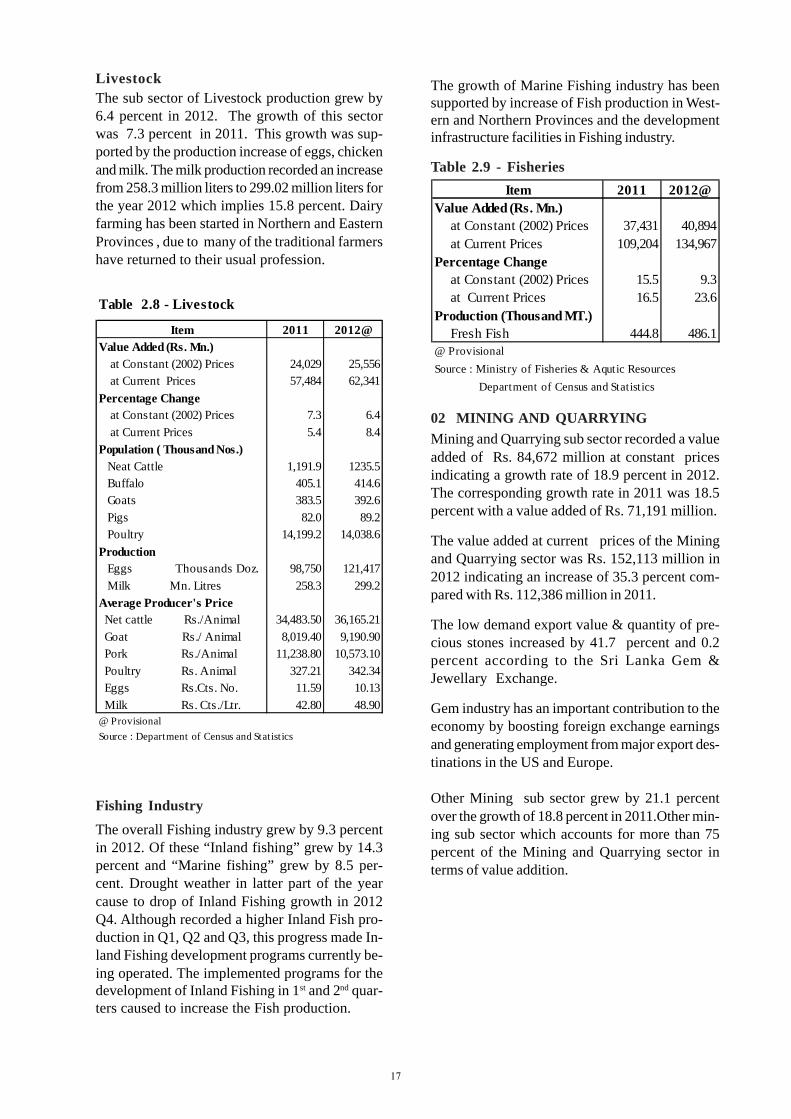
The sub sector of Livestock production grew by6.4 percent in 2012. The growth of this sectorwas 7.3 percent in 2011. This growth was sup-ported by the production increase of eggs, chickenand milk. The milk production recorded an increasefrom 258.3 million liters to 299.02 million liters forthe year 2012 which implies 15.8 percent. Dairyfarming has been started in Northern and EasternProvinces , due to many of the traditional farmershave returned to their usual profession.
The overall Fishing industry grew by 9.3 percentin 2012. Of these “Inland fishing” grew by 14.3percent and “Marine fishing” grew by 8.5 per-cent. Drought weather in latter part of the yearcause to drop of Inland Fishing growth in 2012Q4. Although recorded a higher Inland Fish pro-duction in Q1, Q2 and Q3, this progress made In-land Fishing development programs currently be-ing operated. The implemented programs for thedevelopment of Inland Fishing in 1st and 2nd quar-ters caused to increase the Fish production.
The growth of Marine Fishing industry has beensupported by increase of Fish production in West-ern and Northern Provinces and the developmentinfrastructure facilities in Fishing industry.
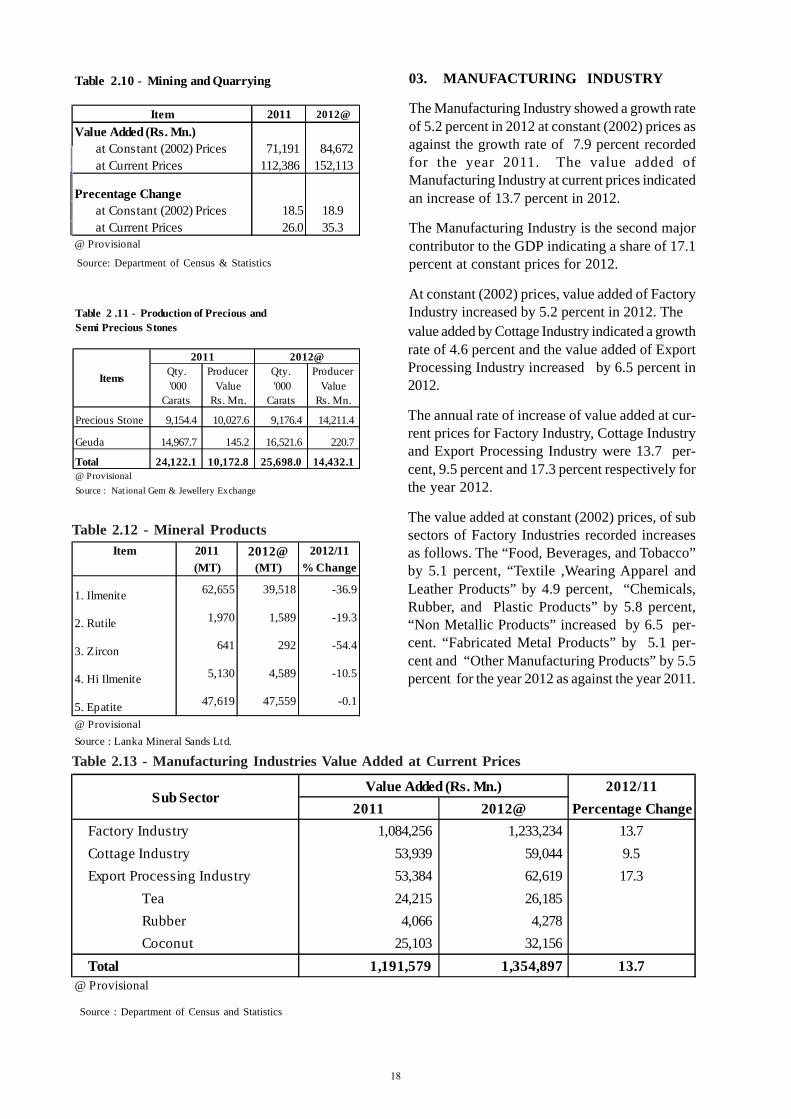
02 MINING AND QUARRYINGMining and Quarrying sub sector recorded a valueadded of Rs. 84,672 million at constant pricesindicating a growth rate of 18.9 percent in 2012.The corresponding growth rate in 2011 was 18.5percent with a value added of Rs. 71,191 million.
The value added at current prices of the Miningand Quarrying sector was Rs. 152,113 million in2012 indicating an increase of 35.3 percent com-pared with Rs. 112,386 million in 2011.
The low demand export value & quantity of pre-cious stones increased by 41.7 percent and 0.2percent according to the Sri Lanka Gem &Jewellary Exchange.
Gem industry has an important contribution to theeconomy by boosting foreign exchange earningsand generating employment from major export des-tinations in the US and Europe.
Other Mining sub sector grew by 21.1 percentover the growth of 18.8 percent in 2011.Other min-ing sub sector which accounts for more than 75percent of the Mining and Quarrying sector interms of value addition.
Table 2.8 - Livestock
Item 2011 2012@Value Added (Rs. Mn.) at Constant (2002) Prices 24,029 25,556 at Current Prices 57,484 62,341Percentage Change at Constant (2002) Prices 7.3 6.4 at Current Prices 5.4 8.4Population ( Thousand Nos.) Neat Cattle 1,191.9 1235.5 Buffalo 405.1 414.6 Goats 383.5 392.6 Pigs 82.0 89.2 Poultry 14,199.2 14,038.6Production Eggs Thousands Doz. 98,750 121,417 Milk Mn. Litres 258.3 299.2Average Producer's Price Net cattle Rs./Animal 34,483.50 36,165.21 Goat Rs./ Animal 8,019.40 9,190.90 Pork Rs./Animal 11,238.80 10,573.10 Poultry Rs. Animal 327.21 342.34 Eggs Rs.Cts. No. 11.59 10.13 Milk Rs. Cts./Ltr. 42.80 48.90@ ProvisionalSource : Department of Census and Statist ics
Item 2011 2012@Value Added (Rs. Mn.) at Constant (2002) Prices 37,431 40,894 at Current Prices 109,204 134,967Percentage Change at Constant (2002) Prices 15.5 9.3 at Current Prices 16.5 23.6Production (Thousand MT.) Fresh Fish 444.8 486.1@ ProvisionalSource : Ministry of Fisheries & Aqutic Resources Department of Census and Statistics
17
18
Table 2.12 - Mineral Products
03. MANUFACTURING INDUSTRY
The Manufacturing Industry showed a growth rateof 5.2 percent in 2012 at constant (2002) prices asagainst the growth rate of 7.9 percent recordedfor the year 2011. The value added ofManufacturing Industry at current prices indicatedan increase of 13.7 percent in 2012.
The Manufacturing Industry is the second majorcontributor to the GDP indicating a share of 17.1percent at constant prices for 2012.
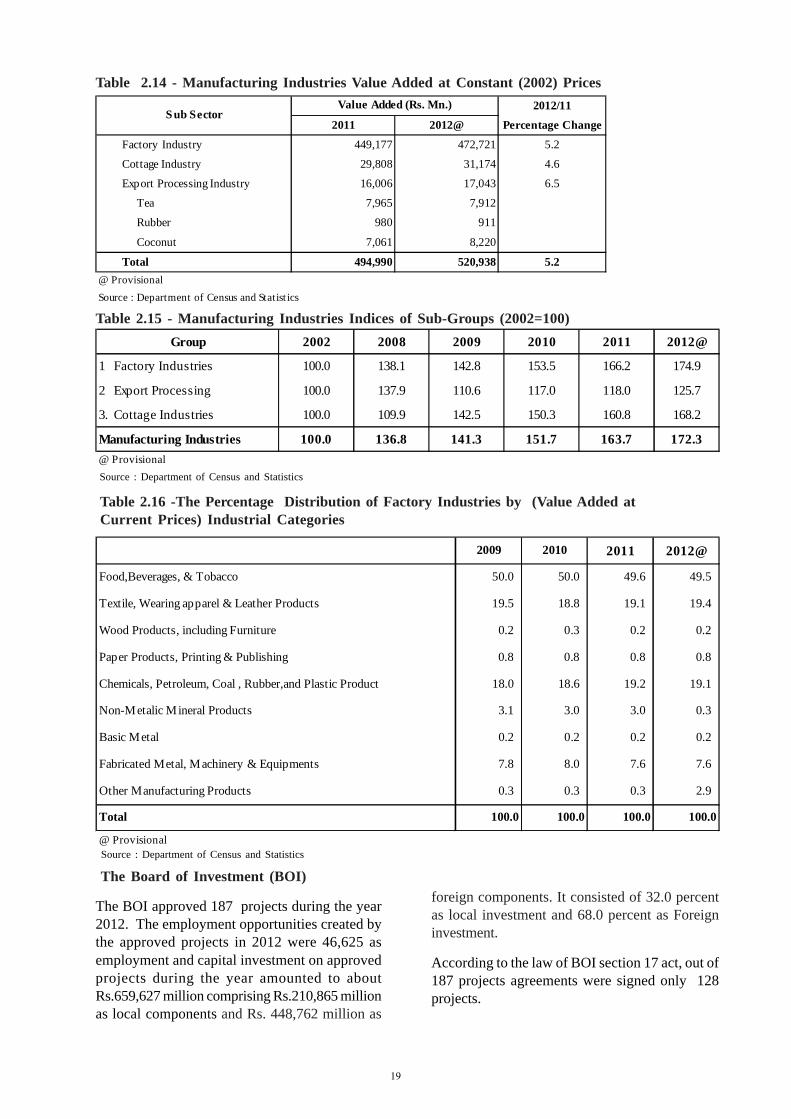
At constant (2002) prices, value added of FactoryIndustry increased by 5.2 percent in 2012. The
Table 2.13 - Manufacturing Industries Value Added at Current Prices
value added by Cottage Industry indicated a growthrate of 4.6 percent and the value added of ExportProcessing Industry increased by 6.5 percent in2012.
The annual rate of increase of value added at cur-rent prices for Factory Industry, Cottage Industryand Export Processing Industry were 13.7 per-cent, 9.5 percent and 17.3 percent respectively forthe year 2012.
The value added at constant (2002) prices, of subsectors of Factory Industries recorded increasesas follows. The “Food, Beverages, and Tobacco”by 5.1 percent, “Textile ,Wearing Apparel andLeather Products” by 4.9 percent, “Chemicals,Rubber, and Plastic Products” by 5.8 percent,“Non Metallic Products” increased by 6.5 per-cent. “Fabricated Metal Products” by 5.1 per-cent and “Other Manufacturing Products” by 5.5percent for the year 2012 as against the year 2011.
Source: Department of Census & Statistics
Source : Department of Census and Statistics
Table 2.10 - Mining and Quarrying
Item 2011 2012@
Value Added (Rs. Mn.) at Constant (2002) Prices 71,191 84,672 at Current Prices 112,386 152,113
Precentage Change at Constant (2002) Prices 18.5 18.9 at Current Prices 26.0 35.3@ Provisional
Semi Precious Stones
Qty. Producer Qty. Producer '000 Value '000 Value
Carats Rs. Mn. Carats Rs. Mn.
Precious Stone 9,154.4 10,027.6 9,176.4 14,211.4
Geuda 14,967.7 145.2 16,521.6 220.7
Total 24,122.1 10,172.8 25,698.0 14,432.1 @ ProvisionalSource : National Gem & Jewellery Exchange
Items
Table 2 .11 - Production of Precious and
2011 2012@
Item 2011 2012@ 2012/11(MT) (MT) % Change
1. Ilmenite 62,655 39,518 -36.9
2. Rutile 1,970 1,589 -19.3
3. Zircon 641 292 -54.4
4. Hi Ilmenite 5,130 4,589 -10.5
5. Epatite 47,619 47,559 -0.1
@ ProvisionalSource : Lanka Mineral Sands Ltd.
2012/112011 2012@ Percentage Change
Factory Industry 1,084,256 1,233,234 13.7Cottage Industry 53,939 59,044 9.5Export Processing Industry 53,384 62,619 17.3 Tea 24,215 26,185 Rubber 4,066 4,278 Coconut 25,103 32,156 Total 1,191,579 1,354,897 13.7
@ Provisional
Value Added (Rs. Mn.)Sub Sector
18
19
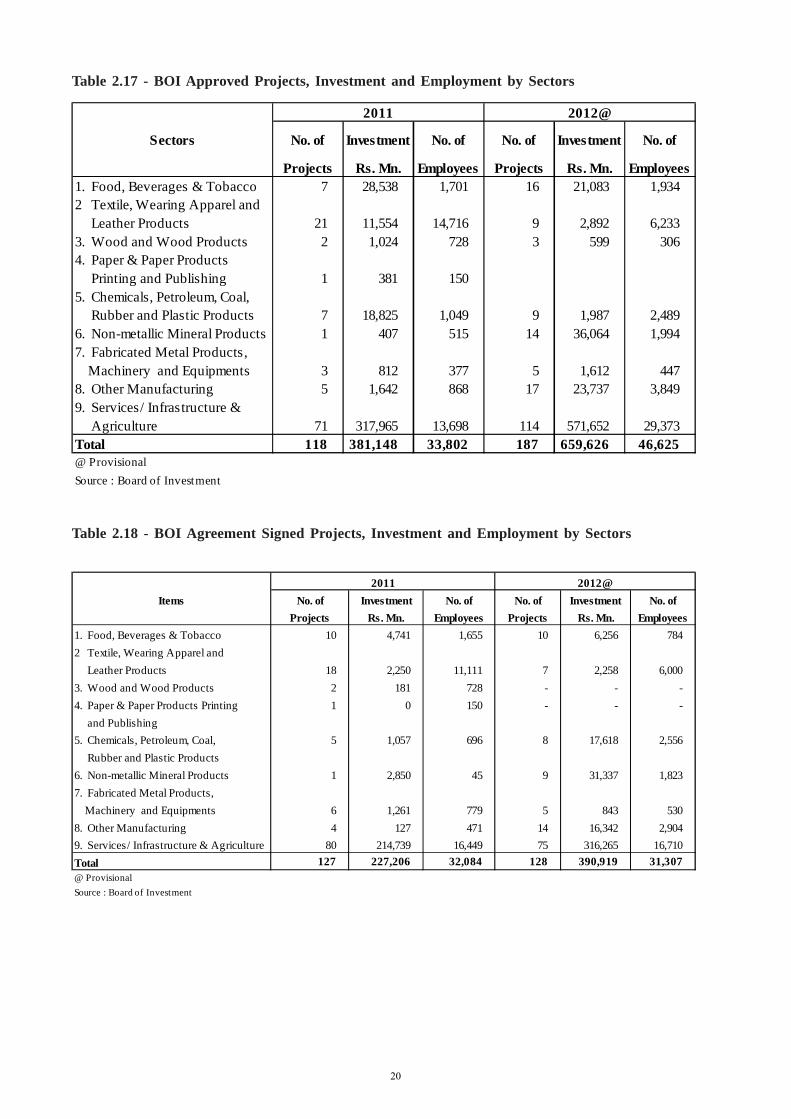
The Board of Investment (BOI)
The BOI approved 187 projects during the year2012. The employment opportunities created bythe approved projects in 2012 were 46,625 asemployment and capital investment on approvedprojects during the year amounted to aboutRs.659,627 million comprising Rs.210,865 millionas local components and Rs. 448,762 million as
Table 2.14 - Manufacturing Industries Value Added at Constant (2002) Prices
Table 2.15 - Manufacturing Industries Indices of Sub-Groups (2002=100)
foreign components. It consisted of 32.0 percentas local investment and 68.0 percent as Foreigninvestment.
According to the law of BOI section 17 act, out of187 projects agreements were signed only 128projects.
Table 2.16 -The Percentage Distribution of Factory Industries by (Value Added atCurrent Prices) Industrial Categories
Source : Department of Census and Statistics
Source : Department of Census and Statistics
2012/11
2011 2012@ Percentage Change
Factory Industry 449,177 472,721 5.2
Cottage Industry 29,808 31,174 4.6
Export Processing Industry 16,006 17,043 6.5
Tea 7,965 7,912
Rubber 980 911
Coconut 7,061 8,220
Total 494,990 520,938 5.2@ ProvisionalSource : Department of Census and Statist ics
Value Added (Rs. Mn.)Sub Sector
Group 2002 2008 2009 2010 2011 2012@
1 Factory Industries 100.0 138.1 142.8 153.5 166.2 174.9
2 Export Processing 100.0 137.9 110.6 117.0 118.0 125.7
3. Cottage Industries 100.0 109.9 142.5 150.3 160.8 168.2
Manufacturing Industries 100.0 136.8 141.3 151.7 163.7 172.3@ Provisional
2009 2010 2011 2012@
Food,Beverages, & Tobacco 50.0 50.0 49.6 49.5
Textile, Wearing apparel & Leather Products 19.5 18.8 19.1 19.4
Wood Products, including Furniture 0.2 0.3 0.2 0.2
Paper Products, Printing & Publishing 0.8 0.8 0.8 0.8
Chemicals, Petroleum, Coal , Rubber,and Plastic Product 18.0 18.6 19.2 19.1
Non-Metalic Mineral Products 3.1 3.0 3.0 0.3
Basic Metal 0.2 0.2 0.2 0.2
Fabricated Metal, Machinery & Equipments 7.8 8.0 7.6 7.6
Other Manufacturing Products 0.3 0.3 0.3 2.9
Total 100.0 100.0 100.0 100.0
@ Provisional
19
20
Table 2.18 - BOI Agreement Signed Projects, Investment and Employment by Sectors
Table 2.17 - BOI Approved Projects, Investment and Employment by Sectors
2011 2012@
Sectors No. of Investment No. of No. of Investment No. of
Projects Rs. Mn. Employees Projects Rs. Mn. Employees1. Food, Beverages & Tobacco 7 28,538 1,701 16 21,083 1,9342 Textile, Wearing Apparel and Leather Products 21 11,554 14,716 9 2,892 6,2333. Wood and Wood Products 2 1,024 728 3 599 3064. Paper & Paper Products Printing and Publishing 1 381 1505. Chemicals, Petroleum, Coal, Rubber and Plastic Products 7 18,825 1,049 9 1,987 2,4896. Non-metallic Mineral Products 1 407 515 14 36,064 1,9947. Fabricated Metal Products, Machinery and Equipments 3 812 377 5 1,612 4478. Other Manufacturing 5 1,642 868 17 23,737 3,8499. Services/ Infrastructure & Agriculture 71 317,965 13,698 114 571,652 29,373Total 118 381,148 33,802 187 659,626 46,625@ ProvisionalSource : Board of Investment
Items No. of Investment No. of No. of Investment No. ofProjects Rs. Mn. Employees Projects Rs. Mn. Employees
1. Food, Beverages & Tobacco 10 4,741 1,655 10 6,256 7842 Textile, Wearing Apparel and Leather Products 18 2,250 11,111 7 2,258 6,0003. Wood and Wood Products 2 181 728 - - -4. Paper & Paper Products Printing 1 0 150 - - - and Publishing5. Chemicals, Petroleum, Coal, 5 1,057 696 8 17,618 2,556 Rubber and Plastic Products6. Non-metallic Mineral Products 1 2,850 45 9 31,337 1,8237. Fabricated Metal Products, Machinery and Equipments 6 1,261 779 5 843 5308. Other Manufacturing 4 127 471 14 16,342 2,9049. Services/ Infrastructure & Agriculture 80 214,739 16,449 75 316,265 16,710Total 127 227,206 32,084 128 390,919 31,307@ ProvisionalSource : Board of Investment
2011 2012@
20
21
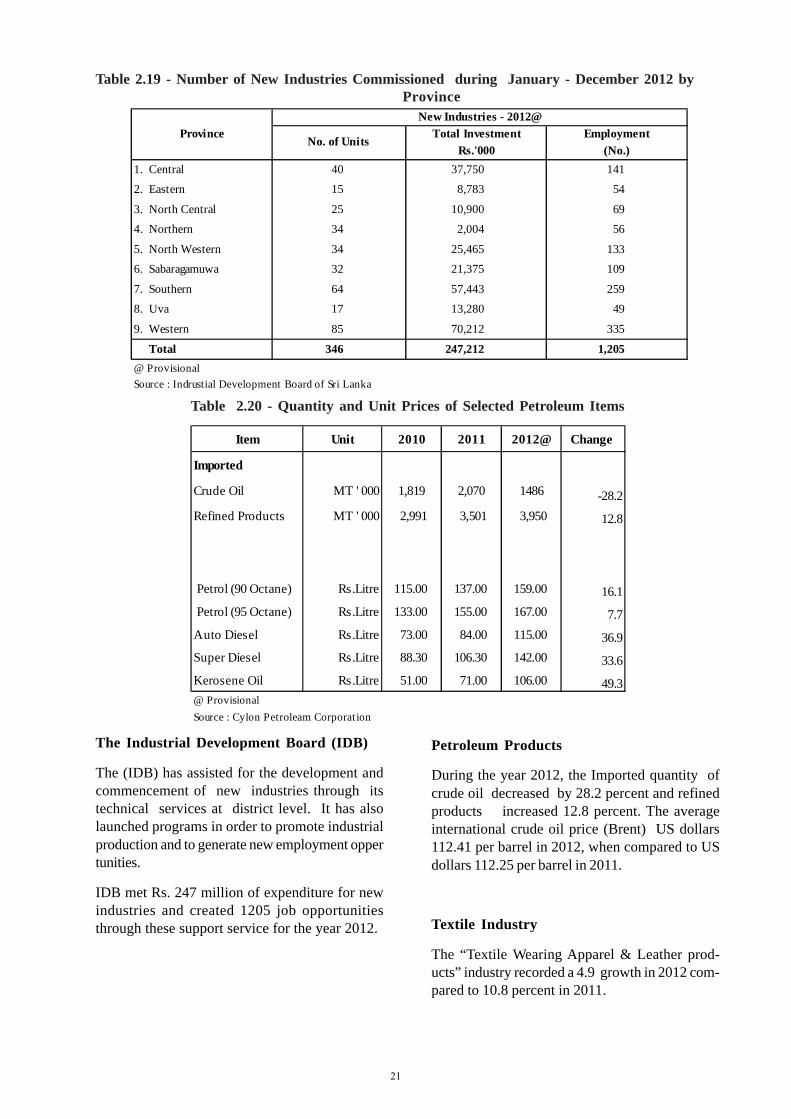
Table 2.19 - Number of New Industries Commissioned during January - December 2012 byProvince
Table 2.20 - Quantity and Unit Prices of Selected Petroleum Items
Petroleum Products
During the year 2012, the Imported quantity ofcrude oil decreased by 28.2 percent and refinedproducts increased 12.8 percent. The averageinternational crude oil price (Brent) US dollars112.41 per barrel in 2012, when compared to USdollars 112.25 per barrel in 2011.
Textile Industry
The “Textile Wearing Apparel & Leather prod-ucts” industry recorded a 4.9 growth in 2012 com-pared to 10.8 percent in 2011.
The Industrial Development Board (IDB)
The (IDB) has assisted for the development andcommencement of new industries through itstechnical services at district level. It has alsolaunched programs in order to promote industrialproduction and to generate new employment oppertunities.
IDB met Rs. 247 million of expenditure for newindustries and created 1205 job opportunitiesthrough these support service for the year 2012.
Province Total Investment EmploymentRs.'000 (No.)
1. Central 40 37,750 141
2. Eastern 15 8,783 54
3. North Central 25 10,900 69
4. Northern 34 2,004 56
5. North Western 34 25,465 133
6. Sabaragamuwa 32 21,375 109
7. Southern 64 57,443 259
8. Uva 17 13,280 49
9. Western 85 70,212 335
Total 346 247,212 1,205@ ProvisionalSource : Indrustial Development Board of Sri Lanka
New Industries - 2012@
No. of Units
Item Unit 2010 2011 2012@ Change
Imported
Crude Oil MT ' 000 1,819 2,070 1486 -28.2Refined Products MT ' 000 2,991 3,501 3,950 12.8
Petrol (90 Octane) Rs.Litre 115.00 137.00 159.00 16.1 Petrol (95 Octane) Rs.Litre 133.00 155.00 167.00 7.7Auto Diesel Rs.Litre 73.00 84.00 115.00 36.9Super Diesel Rs.Litre 88.30 106.30 142.00 33.6Kerosene Oil Rs.Litre 51.00 71.00 106.00 49.3@ ProvisionalSource : Cylon Petroleam Corporat ion
21
22
Table 2.21 - Imports and Exports of Textile & Garments
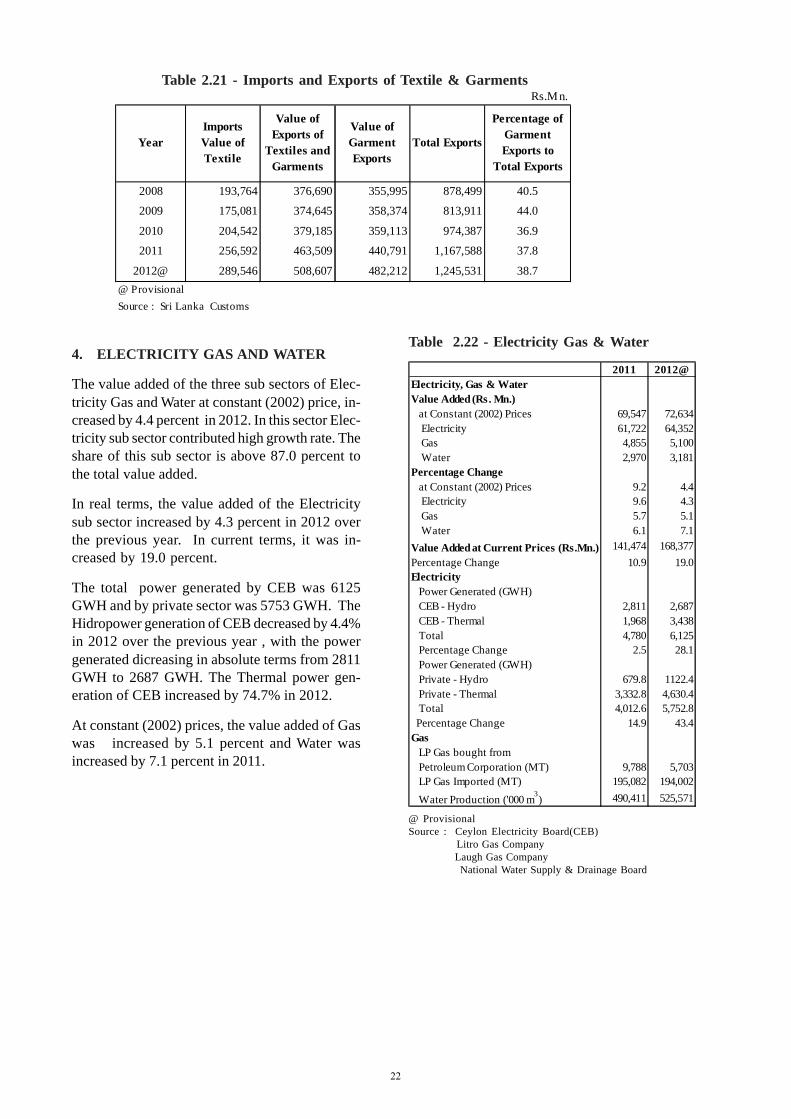
4. ELECTRICITY GAS AND WATER
The value added of the three sub sectors of Elec-tricity Gas and Water at constant (2002) price, in-creased by 4.4 percent in 2012. In this sector Elec-tricity sub sector contributed high growth rate. Theshare of this sub sector is above 87.0 percent tothe total value added.
In real terms, the value added of the Electricitysub sector increased by 4.3 percent in 2012 overthe previous year. In current terms, it was in-creased by 19.0 percent.
The total power generated by CEB was 6125GWH and by private sector was 5753 GWH. TheHidropower generation of CEB decreased by 4.4%in 2012 over the previous year , with the powergenerated dicreasing in absolute terms from 2811GWH to 2687 GWH. The Thermal power gen-eration of CEB increased by 74.7% in 2012.
At constant (2002) prices, the value added of Gaswas increased by 5.1 percent and Water wasincreased by 7.1 percent in 2011.
Table 2.22 - Electricity Gas & Water
@ ProvisionalSource : Ceylon Electricity Board(CEB) Litro Gas Company Laugh Gas Company National Water Supply & Drainage Board
Rs.M n.
Year Imports Value of Textile
Value of Exports of
Textiles and Garments
Value of Garment Exports
Total Exports
Percentage of Garment Exports to
Total Exports
2008 193,764 376,690 355,995 878,499 40.5
2009 175,081 374,645 358,374 813,911 44.0
2010 204,542 379,185 359,113 974,387 36.9
2011 256,592 463,509 440,791 1,167,588 37.8
2012@ 289,546 508,607 482,212 1,245,531 38.7@ ProvisionalSource : Sri Lanka Customs
2011 2012@Electricity, Gas & WaterValue Added (Rs. Mn.) at Constant (2002) Prices 69,547 72,634 Electricity 61,722 64,352 Gas 4,855 5,100 Water 2,970 3,181Percentage Change at Constant (2002) Prices 9.2 4.4 Electricity 9.6 4.3 Gas 5.7 5.1 Water 6.1 7.1Value Added at Current Prices (Rs.Mn.) 141,474 168,377Percentage Change 10.9 19.0Electricity Power Generated (GWH) CEB - Hydro 2,811 2,687 CEB - Thermal 1,968 3,438 Total 4,780 6,125 Percentage Change 2.5 28.1 Power Generated (GWH) Private - Hydro 679.8 1122.4 Private - Thermal 3,332.8 4,630.4 Total 4,012.6 5,752.8 Percentage Change 14.9 43.4Gas LP Gas bought from Petroleum Corporation (MT) 9,788 5,703 LP Gas Imported (MT) 195,082 194,002 Water Production ('000 m3) 490,411 525,571
22
23
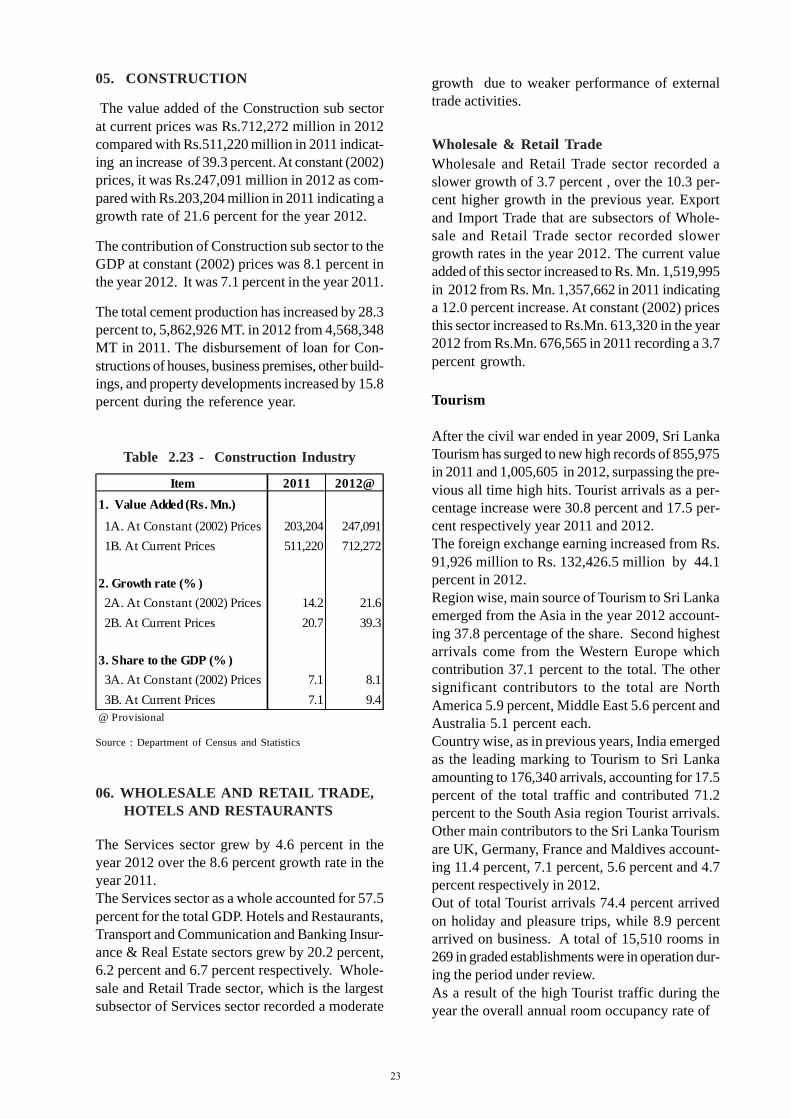
05. CONSTRUCTION
The value added of the Construction sub sectorat current prices was Rs.712,272 million in 2012compared with Rs.511,220 million in 2011 indicat-ing an increase of 39.3 percent. At constant (2002)prices, it was Rs.247,091 million in 2012 as com-pared with Rs.203,204 million in 2011 indicating agrowth rate of 21.6 percent for the year 2012.
The contribution of Construction sub sector to theGDP at constant (2002) prices was 8.1 percent inthe year 2012. It was 7.1 percent in the year 2011.
The total cement production has increased by 28.3percent to, 5,862,926 MT. in 2012 from 4,568,348MT in 2011. The disbursement of loan for Con-structions of houses, business premises, other build-ings, and property developments increased by 15.8percent during the reference year.
Table 2.23 - Construction Industry
06. WHOLESALE AND RETAIL TRADE, HOTELS AND RESTAURANTS
The Services sector grew by 4.6 percent in theyear 2012 over the 8.6 percent growth rate in theyear 2011.The Services sector as a whole accounted for 57.5percent for the total GDP. Hotels and Restaurants,Transport and Communication and Banking Insur-ance & Real Estate sectors grew by 20.2 percent,6.2 percent and 6.7 percent respectively. Whole-sale and Retail Trade sector, which is the largestsubsector of Services sector recorded a moderate
growth due to weaker performance of externaltrade activities.
Wholesale & Retail Trade
Tourism
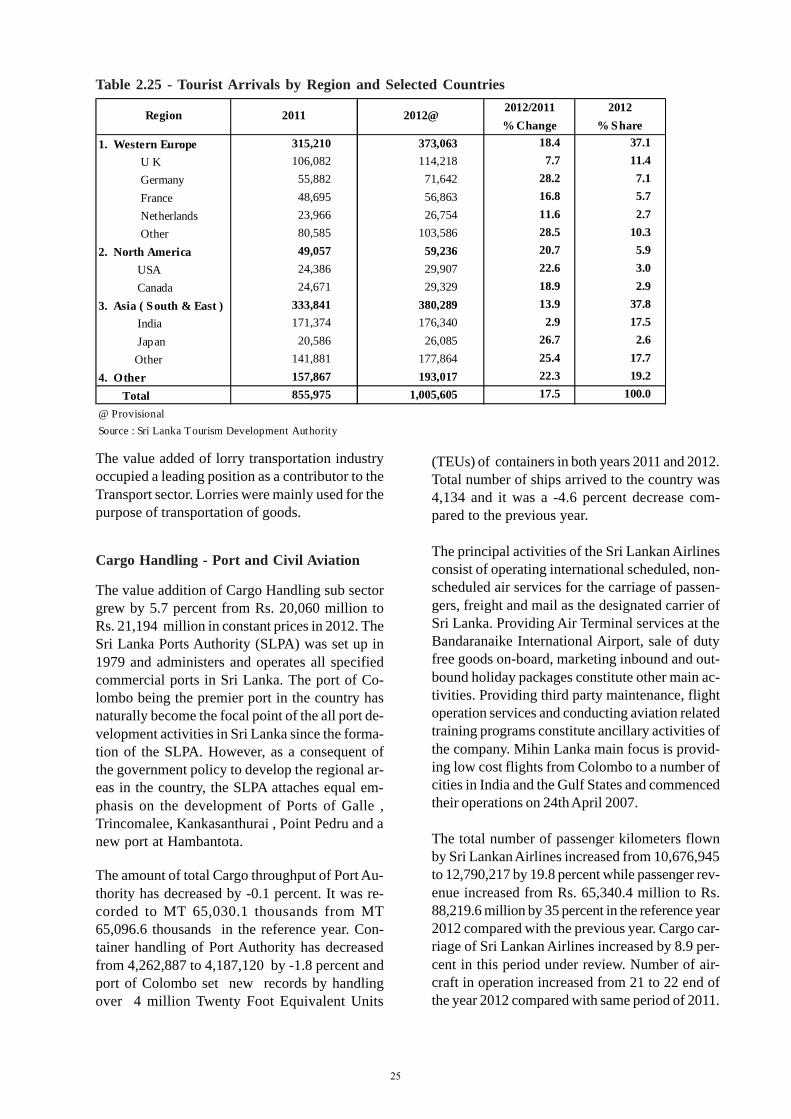
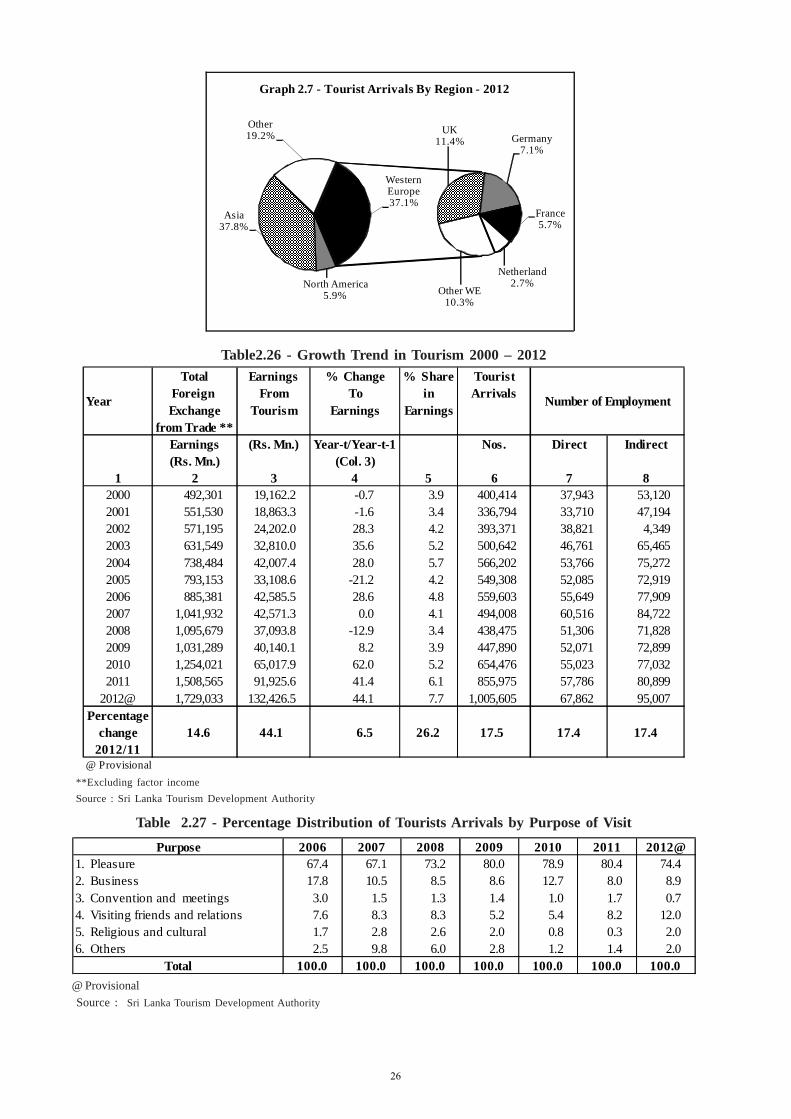
After the civil war ended in year 2009, Sri LankaTourism has surged to new high records of 855,975in 2011 and 1,005,605 in 2012, surpassing the pre-vious all time high hits. Tourist arrivals as a per-centage increase were 30.8 percent and 17.5 per-cent respectively year 2011 and 2012.The foreign exchange earning increased from Rs.91,926 million to Rs. 132,426.5 million by 44.1percent in 2012.Region wise, main source of Tourism to Sri Lankaemerged from the Asia in the year 2012 account-ing 37.8 percentage of the share. Second highestarrivals come from the Western Europe whichcontribution 37.1 percent to the total. The othersignificant contributors to the total are NorthAmerica 5.9 percent, Middle East 5.6 percent andAustralia 5.1 percent each.Country wise, as in previous years, India emergedas the leading marking to Tourism to Sri Lankaamounting to 176,340 arrivals, accounting for 17.5percent of the total traffic and contributed 71.2percent to the South Asia region Tourist arrivals.Other main contributors to the Sri Lanka Tourismare UK, Germany, France and Maldives account-ing 11.4 percent, 7.1 percent, 5.6 percent and 4.7percent respectively in 2012.Out of total Tourist arrivals 74.4 percent arrivedon holiday and pleasure trips, while 8.9 percentarrived on business. A total of 15,510 rooms in269 in graded establishments were in operation dur-ing the period under review.As a result of the high Tourist traffic during theyear the overall annual room occupancy rate of
Wholesale and Retail Trade sector recorded aslower growth of 3.7 percent , over the 10.3 per-cent higher growth in the previous year. Exportand Import Trade that are subsectors of Whole-sale and Retail Trade sector recorded slowergrowth rates in the year 2012. The current valueadded of this sector increased to Rs. Mn. 1,519,995in 2012 from Rs. Mn. 1,357,662 in 2011 indicatinga 12.0 percent increase. At constant (2002) pricesthis sector increased to Rs.Mn. 613,320 in the year2012 from Rs.Mn. 676,565 in 2011 recording a 3.7percent growth.
Source : Department of Census and Statistics
Item 2011 2012@1. Value Added (Rs. Mn.)
1A. At Constant (2002) Prices 203,204 247,091 1B. At Current Prices 511,220 712,272
2. Growth rate (% ) 2A. At Constant (2002) Prices 14.2 21.6 2B. At Current Prices 20.7 39.3
3. Share to the GDP (% ) 3A. At Constant (2002) Prices 7.1 8.1 3B. At Current Prices 7.1 9.4@ Provisional
23
24
Table 2.24 - Performance of Port Services 2010 - 2012
One TEU =Twenty-foot equivalent containerSource : Sri Lanka Ports Authority
graded establishment decreased to 71.2 percentfrom 77.1 percent in the previous year. Region-ally highest occupancy rate of 84.2 percent re-corded in the Colombo city and followed by greaterColombo 85.3 percent, South coast 80.9 percentand East coast 79.8 percent in 2012.Tourism has been given high priority in Sri Lanka’sdevelopment programmes and its forward linkagesare also high for other sub sectors of the economy.Direct and indirect employment opportunities aregenerated from the Tourism related business es-tablishments such as hotels and other accommo-dation units, restaurants, travel agents, tour opera-tors, recreation and entertainment businesses, sou-venir, handicraft and other shops etc. The totalnumber of persons employed directly in the Tour-ism sector as at end of 2012 amounted to 67,862which was an increase of 17.4 percent over thefigure of 57,786 recorded in 2011. The total num-ber of persons employed indirectly in the Tourismsector as at end of 2012 amounted to 95,007 whichwas an increase of 17.4 percent over the figure of80,899 recording 2011.
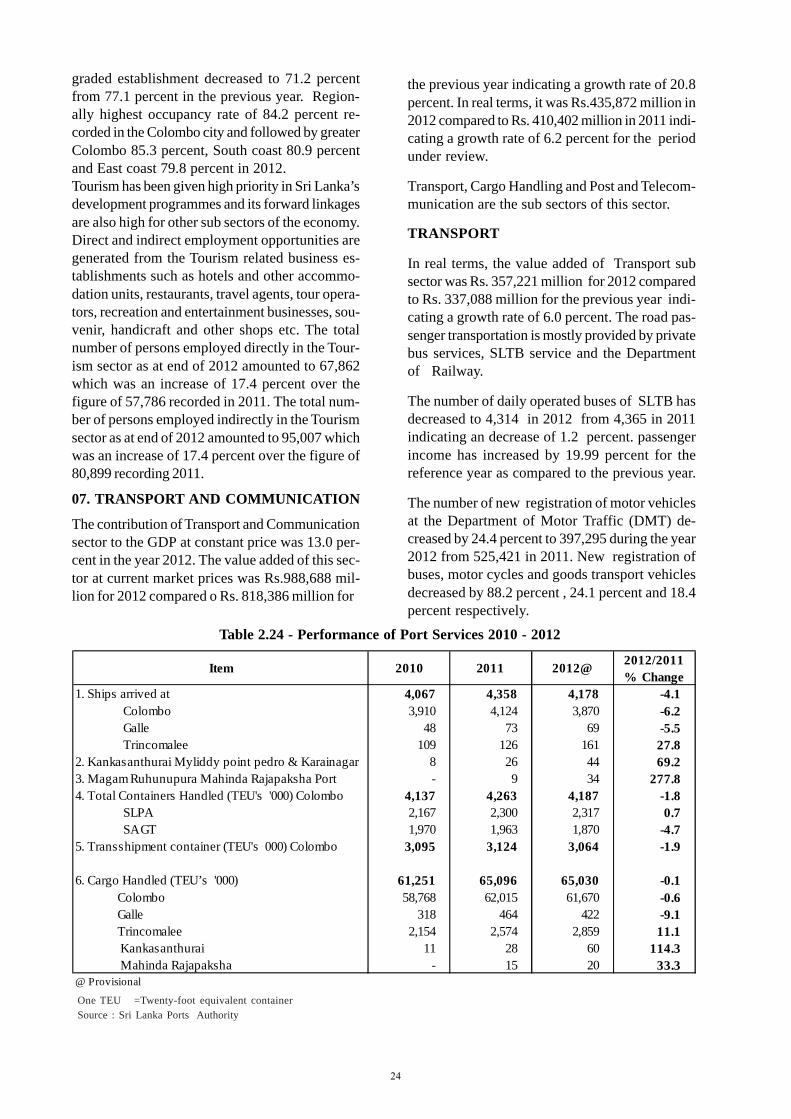
07. TRANSPORT AND COMMUNICATION
The contribution of Transport and Communicationsector to the GDP at constant price was 13.0 per-cent in the year 2012. The value added of this sec-tor at current market prices was Rs.988,688 mil-lion for 2012 compared o Rs. 818,386 million for
the previous year indicating a growth rate of 20.8percent. In real terms, it was Rs.435,872 million in2012 compared to Rs. 410,402 million in 2011 indi-cating a growth rate of 6.2 percent for the periodunder review.
Transport, Cargo Handling and Post and Telecom-munication are the sub sectors of this sector.
TRANSPORT
In real terms, the value added of Transport subsector was Rs. 357,221 million for 2012 comparedto Rs. 337,088 million for the previous year indi-cating a growth rate of 6.0 percent. The road pas-senger transportation is mostly provided by privatebus services, SLTB service and the Departmentof Railway.
The number of daily operated buses of SLTB hasdecreased to 4,314 in 2012 from 4,365 in 2011indicating an decrease of 1.2 percent. passengerincome has increased by 19.99 percent for thereference year as compared to the previous year.
The number of new registration of motor vehiclesat the Department of Motor Traffic (DMT) de-creased by 24.4 percent to 397,295 during the year2012 from 525,421 in 2011. New registration ofbuses, motor cycles and goods transport vehiclesdecreased by 88.2 percent , 24.1 percent and 18.4percent respectively.
Item 2010 2011 2012@ 2012/2011% Change
1. Ships arrived at 4,067 4,358 4,178 -4.1 Colombo 3,910 4,124 3,870 -6.2 Galle 48 73 69 -5.5 Trincomalee 109 126 161 27.82. Kankasanthurai Myliddy point pedro & Karainagar 8 26 44 69.23. Magam Ruhunupura Mahinda Rajapaksha Port - 9 34 277.84. Total Containers Handled (TEU's '000) Colombo 4,137 4,263 4,187 -1.8 SLPA 2,167 2,300 2,317 0.7 SAGT 1,970 1,963 1,870 -4.75. Transshipment container (TEU's 000) Colombo 3,095 3,124 3,064 -1.9
6. Cargo Handled (TEU’s '000) 61,251 65,096 65,030 -0.1 Colombo 58,768 62,015 61,670 -0.6 Galle 318 464 422 -9.1 Trincomalee 2,154 2,574 2,859 11.1 Kankasanthurai 11 28 60 114.3 Mahinda Rajapaksha - 15 20 33.3@ Provisional
24
25
Table 2.25 - Tourist Arrivals by Region and Selected Countries
The value added of lorry transportation industryoccupied a leading position as a contributor to theTransport sector. Lorries were mainly used for thepurpose of transportation of goods.
Cargo Handling - Port and Civil Aviation
The value addition of Cargo Handling sub sectorgrew by 5.7 percent from Rs. 20,060 million toRs. 21,194 million in constant prices in 2012. TheSri Lanka Ports Authority (SLPA) was set up in1979 and administers and operates all specifiedcommercial ports in Sri Lanka. The port of Co-lombo being the premier port in the country hasnaturally become the focal point of the all port de-velopment activities in Sri Lanka since the forma-tion of the SLPA. However, as a consequent ofthe government policy to develop the regional ar-eas in the country, the SLPA attaches equal em-phasis on the development of Ports of Galle ,Trincomalee, Kankasanthurai , Point Pedru and anew port at Hambantota.
The amount of total Cargo throughput of Port Au-thority has decreased by -0.1 percent. It was re-corded to MT 65,030.1 thousands from MT65,096.6 thousands in the reference year. Con-tainer handling of Port Authority has decreasedfrom 4,262,887 to 4,187,120 by -1.8 percent andport of Colombo set new records by handlingover 4 million Twenty Foot Equivalent Units
(TEUs) of containers in both years 2011 and 2012.Total number of ships arrived to the country was4,134 and it was a -4.6 percent decrease com-pared to the previous year.
The principal activities of the Sri Lankan Airlinesconsist of operating international scheduled, non-scheduled air services for the carriage of passen-gers, freight and mail as the designated carrier ofSri Lanka. Providing Air Terminal services at theBandaranaike International Airport, sale of dutyfree goods on-board, marketing inbound and out-bound holiday packages constitute other main ac-tivities. Providing third party maintenance, flightoperation services and conducting aviation relatedtraining programs constitute ancillary activities ofthe company. Mihin Lanka main focus is provid-ing low cost flights from Colombo to a number ofcities in India and the Gulf States and commencedtheir operations on 24th April 2007.
The total number of passenger kilometers flownby Sri Lankan Airlines increased from 10,676,945to 12,790,217 by 19.8 percent while passenger rev-enue increased from Rs. 65,340.4 million to Rs.88,219.6 million by 35 percent in the reference year2012 compared with the previous year. Cargo car-riage of Sri Lankan Airlines increased by 8.9 per-cent in this period under review. Number of air-craft in operation increased from 21 to 22 end ofthe year 2012 compared with same period of 2011.
2012/2011 2012% Change % Share
1. Western Europe 315,210 373,063 18.4 37.1 U K 106,082 114,218 7.7 11.4 Germany 55,882 71,642 28.2 7.1
France 48,695 56,863 16.8 5.7
Netherlands 23,966 26,754 11.6 2.7 Other 80,585 103,586 28.5 10.3
2. North America 49,057 59,236 20.7 5.9
USA 24,386 29,907 22.6 3.0
Canada 24,671 29,329 18.9 2.9
3. Asia ( South & East ) 333,841 380,289 13.9 37.8 India 171,374 176,340 2.9 17.5
Japan 20,586 26,085 26.7 2.6
Other 141,881 177,864 25.4 17.7
4. Other 157,867 193,017 22.3 19.2
Total 855,975 1,005,605 17.5 100.0
@ ProvisionalSource : Sri Lanka Tourism Development Authority
Region 2011 2012@
25
26
Table2.26 - Growth Trend in Tourism 2000 – 2012
Table 2.27 - Percentage Distribution of Tourists Arrivals by Purpose of Visit
@ Provisional Source : Sri Lanka Tourism Development Authority
**Excluding factor income Source : Sri Lanka Tourism Development Authority
Total Earnings % Change % Share TouristForeign From To in ArrivalsExchange Tourism Earnings Earnings
from Trade **Earnings (Rs. Mn.) Year-t/Year-t-1 Nos. Direct Indirect(Rs. Mn.) (Col. 3)
1 2 3 4 5 6 7 82000 492,301 19,162.2 -0.7 3.9 400,414 37,943 53,120 2001 551,530 18,863.3 -1.6 3.4 336,794 33,710 47,194 2002 571,195 24,202.0 28.3 4.2 393,371 38,821 4,349 2003 631,549 32,810.0 35.6 5.2 500,642 46,761 65,465 2004 738,484 42,007.4 28.0 5.7 566,202 53,766 75,272 2005 793,153 33,108.6 -21.2 4.2 549,308 52,085 72,919 2006 885,381 42,585.5 28.6 4.8 559,603 55,649 77,909 2007 1,041,932 42,571.3 0.0 4.1 494,008 60,516 84,722 2008 1,095,679 37,093.8 -12.9 3.4 438,475 51,306 71,828 2009 1,031,289 40,140.1 8.2 3.9 447,890 52,071 72,899 2010 1,254,021 65,017.9 62.0 5.2 654,476 55,023 77,032 2011 1,508,565 91,925.6 41.4 6.1 855,975 57,786 80,899
2012@ 1,729,033 132,426.5 44.1 7.7 1,005,605 67,862 95,007 Percentage
change 14.6 44.1 6.5 26.2 17.5 17.4 17.42012/11
@ Provisional
Year Number of Employment
Purpose 2006 2007 2008 2009 2010 2011 2012@1. Pleasure 67.4 67.1 73.2 80.0 78.9 80.4 74.42. Business 17.8 10.5 8.5 8.6 12.7 8.0 8.93. Convention and meetings 3.0 1.5 1.3 1.4 1.0 1.7 0.74. Visiting friends and relations 7.6 8.3 8.3 5.2 5.4 8.2 12.05. Religious and cultural 1.7 2.8 2.6 2.0 0.8 0.3 2.06. Others 2.5 9.8 6.0 2.8 1.2 1.4 2.0
Total 100.0 100.0 100.0 100.0 100.0 100.0 100.0
North America5.9%
Asia37.8%
Other19.2%
Other WE10.3%
UK11.4% Germany
7.1%
France5.7%
Netherland2.7%
WesternEurope37.1%
Graph 2.7 - Tourist Arrivals By Region - 2012
26
27
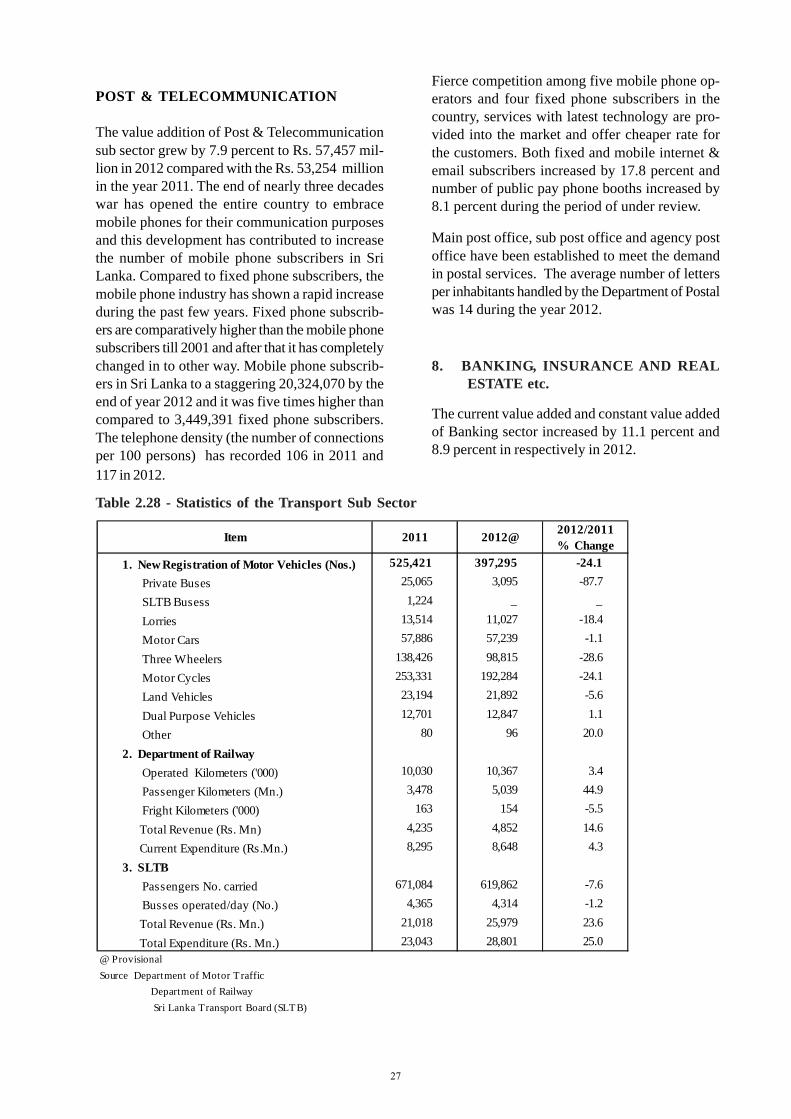
Table 2.28 - Statistics of the Transport Sub Sector
POST & TELECOMMUNICATION
The value addition of Post & Telecommunicationsub sector grew by 7.9 percent to Rs. 57,457 mil-lion in 2012 compared with the Rs. 53,254 millionin the year 2011. The end of nearly three decadeswar has opened the entire country to embracemobile phones for their communication purposesand this development has contributed to increasethe number of mobile phone subscribers in SriLanka. Compared to fixed phone subscribers, themobile phone industry has shown a rapid increaseduring the past few years. Fixed phone subscrib-ers are comparatively higher than the mobile phonesubscribers till 2001 and after that it has completelychanged in to other way. Mobile phone subscrib-ers in Sri Lanka to a staggering 20,324,070 by theend of year 2012 and it was five times higher thancompared to 3,449,391 fixed phone subscribers.The telephone density (the number of connectionsper 100 persons) has recorded 106 in 2011 and
Fierce competition among five mobile phone op-erators and four fixed phone subscribers in thecountry, services with latest technology are pro-vided into the market and offer cheaper rate forthe customers. Both fixed and mobile internet &email subscribers increased by 17.8 percent andnumber of public pay phone booths increased by8.1 percent during the period of under review.
Main post office, sub post office and agency postoffice have been established to meet the demandin postal services. The average number of lettersper inhabitants handled by the Department of Postalwas 14 during the year 2012.
8. BANKING, INSURANCE AND REAL ESTATE etc.
The current value added and constant value addedof Banking sector increased by 11.1 percent and8.9 percent in respectively in 2012.
117 in 2012.
2012/2011% Change
1. New Registration of Motor Vehicles (Nos.) 525,421 397,295 -24.1
Private Buses 25,065 3,095 -87.7
SLTB Busess 1,224 _ _
Lorries 13,514 11,027 -18.4
Motor Cars 57,886 57,239 -1.1
Three Wheelers 138,426 98,815 -28.6
Motor Cycles 253,331 192,284 -24.1
Land Vehicles 23,194 21,892 -5.6
Dual Purpose Vehicles 12,701 12,847 1.1
Other 80 96 20.0
2. Department of Railway Operated Kilometers ('000) 10,030 10,367 3.4
Passenger Kilometers (Mn.) 3,478 5,039 44.9
Fright Kilometers ('000) 163 154 -5.5
Total Revenue (Rs. Mn) 4,235 4,852 14.6
Current Expenditure (Rs.Mn.) 8,295 8,648 4.3
3. SLTB Passengers No. carried 671,084 619,862 -7.6
Busses operated/day (No.) 4,365 4,314 -1.2
Total Revenue (Rs. Mn.) 21,018 25,979 23.6
Total Expenditure (Rs. Mn.) 23,043 28,801 25.0@ ProvisionalSource Department of Motor T raffic Department of Railway Sri Lanka Transport Board (SLTB)
Item 2011 2012@
27
28
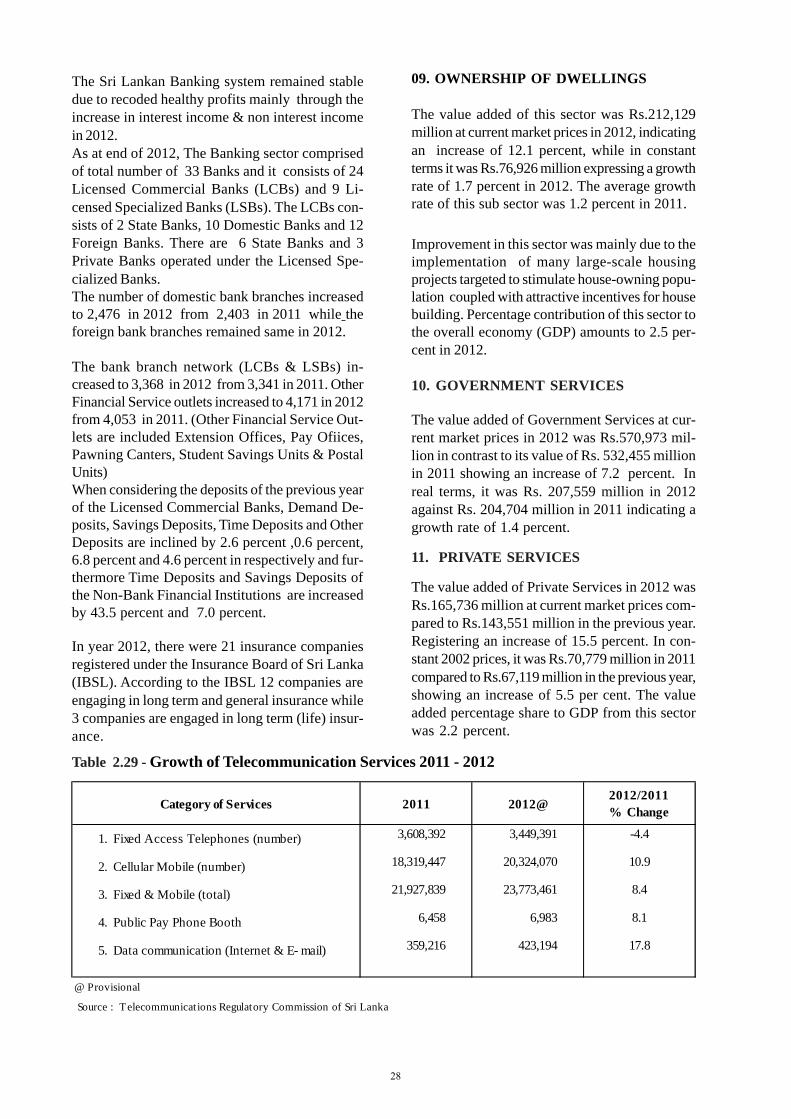
Table 2.29 - Growth of Telecommunication Services 2011 - 2012
Improvement in this sector was mainly due to theimplementation of many large-scale housingprojects targeted to stimulate house-owning popu-lation coupled with attractive incentives for housebuilding. Percentage contribution of this sector tothe overall economy (GDP) amounts to 2.5 per-cent in 2012.
10. GOVERNMENT SERVICES
The value added of Government Services at cur-rent market prices in 2012 was Rs.570,973 mil-lion in contrast to its value of Rs. 532,455 millionin 2011 showing an increase of 7.2 percent. Inreal terms, it was Rs. 207,559 million in 2012against Rs. 204,704 million in 2011 indicating agrowth rate of 1.4 percent.
11. PRIVATE SERVICES
The value added of Private Services in 2012 wasRs.165,736 million at current market prices com-pared to Rs.143,551 million in the previous year.Registering an increase of 15.5 percent. In con-stant 2002 prices, it was Rs.70,779 million in 2011compared to Rs.67,119 million in the previous year,showing an increase of 5.5 per cent. The valueadded percentage share to GDP from this sectorwas 2.2 percent.
The Sri Lankan Banking system remained stabledue to recoded healthy profits mainly through theincrease in interest income & non interest incomein 2012.As at end of 2012, The Banking sector comprisedof total number of 33 Banks and it consists of 24Licensed Commercial Banks (LCBs) and 9 Li-censed Specialized Banks (LSBs). The LCBs con-sists of 2 State Banks, 10 Domestic Banks and 12Foreign Banks. There are 6 State Banks and 3Private Banks operated under the Licensed Spe-cialized Banks.The number of domestic bank branches increasedto 2,476 in 2012 from 2,403 in 2011 while theforeign bank branches remained same in 2012.
The bank branch network (LCBs & LSBs) in-creased to 3,368 in 2012 from 3,341 in 2011. OtherFinancial Service outlets increased to 4,171 in 2012from 4,053 in 2011. (Other Financial Service Out-lets are included Extension Offices, Pay Ofiices,Pawning Canters, Student Savings Units & PostalUnits)When considering the deposits of the previous yearof the Licensed Commercial Banks, Demand De-posits, Savings Deposits, Time Deposits and OtherDeposits are inclined by 2.6 percent ,0.6 percent,6.8 percent and 4.6 percent in respectively and fur-thermore Time Deposits and Savings Deposits ofthe Non-Bank Financial Institutions are increasedby 43.5 percent and 7.0 percent.
In year 2012, there were 21 insurance companiesregistered under the Insurance Board of Sri Lanka(IBSL). According to the IBSL 12 companies areengaging in long term and general insurance while3 companies are engaged in long term (life) insur-ance.
09. OWNERSHIP OF DWELLINGS
The value added of this sector was Rs.212,129million at current market prices in 2012, indicatingan increase of 12.1 percent, while in constantterms it was Rs.76,926 million expressing a growthrate of 1.7 percent in 2012. The average growthrate of this sub sector was 1.2 percent in 2011.
Category of Services 2011 2012@2012/2011% Change
1. Fixed Access Telephones (number) 3,608,392 3,449,391 -4.4
2. Cellular Mobile (number) 18,319,447 20,324,070 10.9
3. Fixed & Mobile (total) 21,927,839 23,773,461 8.4
4. Public Pay Phone Booth 6,458 6,983 8.1
5. Data communication (Internet & E- mail) 359,216 423,194 17.8
@ Provisional
Source : Telecommunicat ions Regulatory Commission of Sri Lanka
28
29
2. GENERAL GOVERNMENT FINAL CONSUMPTION EXPENDITURE (GFCE)
The GFCE for the year under review wasRs.1,021,443 million at current market prices com-pared to Rs. 967,702 million in 2011, showing anincrease of 5.6 percent in the year 2012.
In constant terms, it was Rs.426, 223 million in2012 in contrast to Rs.428,623 million in 2011 in-dicating a negative growth rate of 0.56 percentfor 2012.
Out of total Government Final Consumption Ex-penditure 70.8 percent was spent on Defence,Social Security & Welfare, Education and Gen-eral Public Services in 2012.
Largest share of the Government Final Consump-tion Expenditure was on Defence, and it was 24.6percent in 2012. The expenditure for “Social Se-curity & Welfare” 19.3 percent, “Education” 15.2percent and “General Public Services” 11.6 per-cent placed the second, third and fourth respec-tively, in the reference year. Expenditure on Edu-cation and Health sector have increased by 1.04percent and 6.02 percent during this period com-pared with the previous year.
The expenditure on Defence as a percentage shareto total Government Consumption Expenditure in
PART THREE
EXPENDITURE ON GROSS DOMESTICPRODUCT
The expenditure approach to measure the GrossDomestic Product examines at the final uses ofthe country’s output such as Private Consumption,Government Consumption, Capital Formation,Change in Stocks and Net Exports (exports lessimports). It identifies the Expenditure on total goodsand services that have occurred during the refer-ence year.
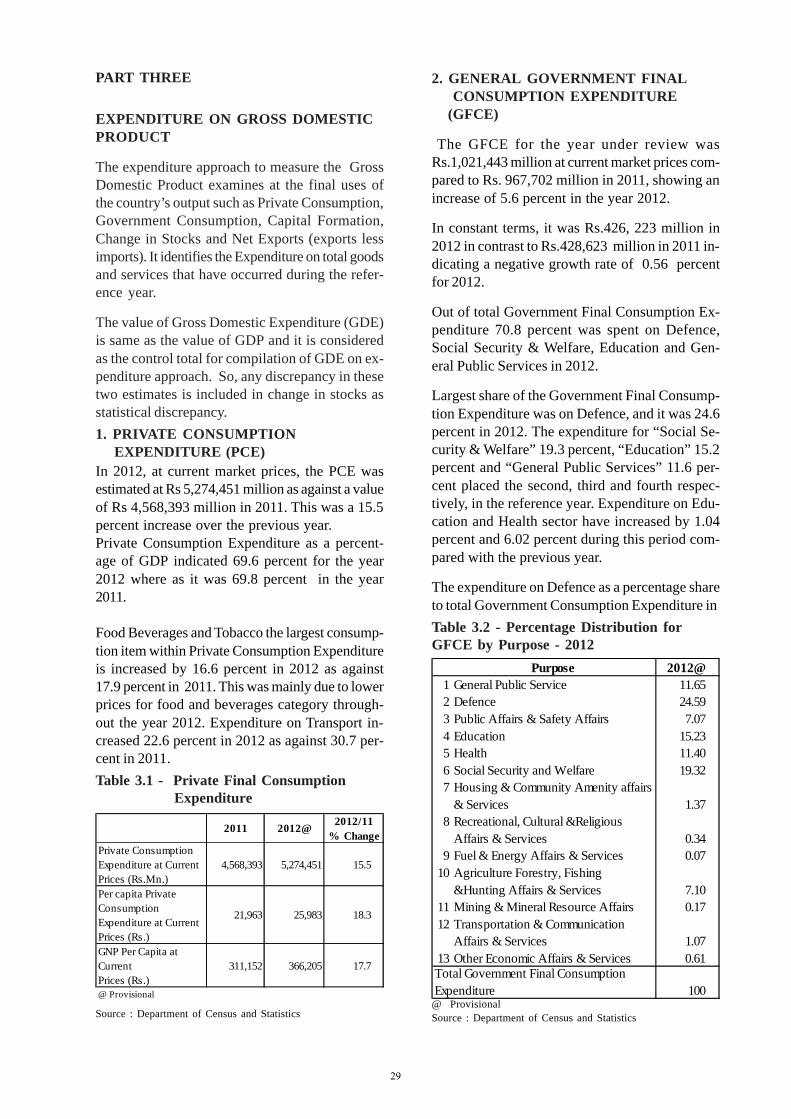
The value of Gross Domestic Expenditure (GDE)is same as the value of GDP and it is consideredas the control total for compilation of GDE on ex-penditure approach. So, any discrepancy in thesetwo estimates is included in change in stocks asstatistical discrepancy.1. PRIVATE CONSUMPTION EXPENDITURE (PCE)In 2012, at current market prices, the PCE wasestimated at Rs 5,274,451 million as against a valueof Rs 4,568,393 million in 2011. This was a 15.5percent increase over the previous year.Private Consumption Expenditure as a percent-age of GDP indicated 69.6 percent for the year2012 where as it was 69.8 percent in the year2011.
Food Beverages and Tobacco the largest consump-tion item within Private Consumption Expenditureis increased by 16.6 percent in 2012 as against17.9 percent in 2011. This was mainly due to lowerprices for food and beverages category through-out the year 2012. Expenditure on Transport in-creased 22.6 percent in 2012 as against 30.7 per-cent in 2011.Table 3.1 - Private Final Consumption Expenditure
Table 3.2 - Percentage Distribution forGFCE by Purpose - 2012
@ ProvisionalSource : Department of Census and Statistics Source : Department of Census and Statistics
2012/11% Change
Private Consumption Expenditure at Current Prices (Rs.Mn.)
4,568,393 5,274,451 15.5
Per capita Private Consumption Expenditure at Current Prices (Rs.)
21,963 25,983 18.3
GNP Per Capita at Current Prices (Rs.)
311,152 366,205 17.7
@ Provisional
2011 2012@
Purpose 2012@ 1 General Public Service 11.652 Defence 24.593 Public Affairs & Safety Affairs 7.074 Education 15.235 Health 11.406 Social Security and Welfare 19.327 Housing & Community Amenity affairs
& Services 1.378 Recreational, Cultural &Religious
Affairs & Services 0.349 Fuel & Energy Affairs & Services 0.07
10 Agriculture Forestry, Fishing &Hunting Affairs & Services 7.10
11 Mining & Mineral Resource Affairs 0.1712 Transportation & Communication
Affairs & Services 1.0713 Other Economic Affairs & Services 0.61
100Total Government Final Consumption Expenditure
29
30
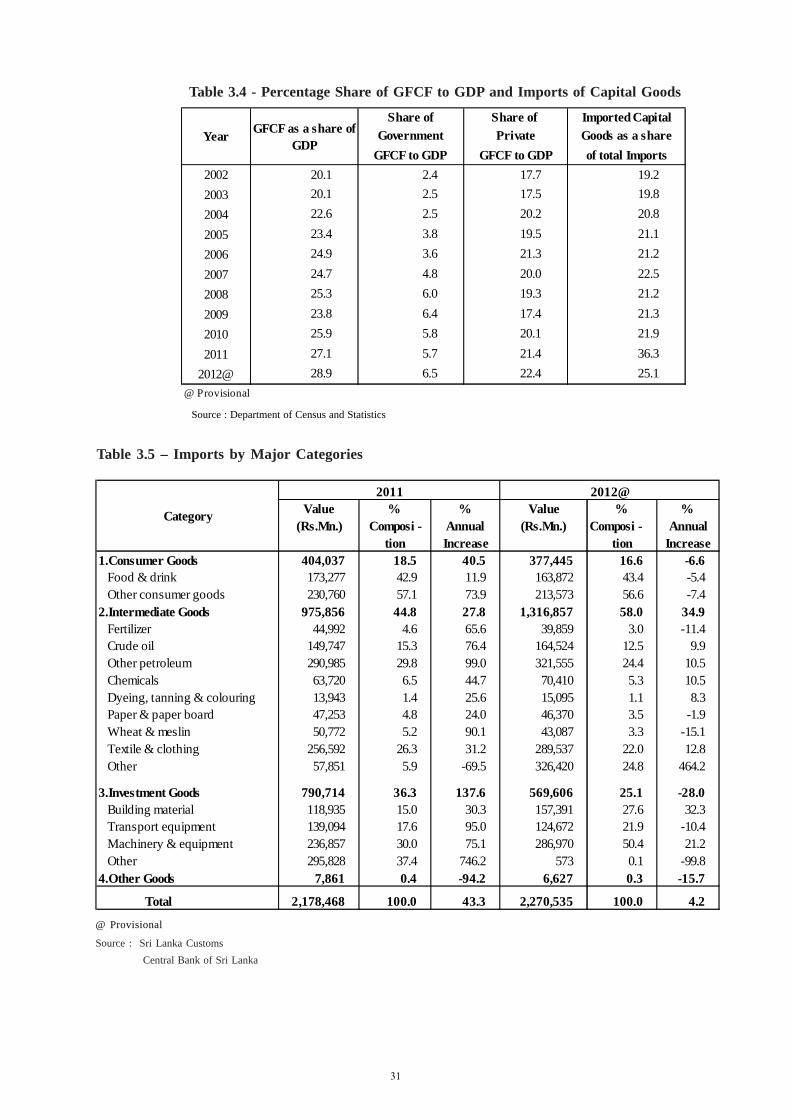
4. IMPORTS
The total payment of merchandised Imports in-creased by 4.2 percent in 2012 as against the 43.3percent in 2011. The Imports of Consumer goodswhich consist of nearly one sixth of the total im-ports decreased by 6.6 percent in 2012. The shareof Imports of Consumer goods showed a from 18.5percent in 2011 to 16.6 percent in 2012. Importsof Intermediate goods which is the largestsubsector in Imports increased by 34.9 percent in2012. This sector has increased by 27.8 percent inthe previous year as well. The share of this sec-tor has increased up to 58.0 percent and this indi-cator for the year 2011 was 44.8 percent. Petro-leum the largest sector, within intermediate Im-ports increased by 10.5 percent in 2012. Importsof Chemical and Textile & Clothing increased by10.5 percent and 12.8 percent respectively in theyear 2012. Imports of Fertilizer decreased by 11.4percent in 2012.
Investment goods hold one fourth of total Importshas decreased by 28.0 percent in 2012. Sub cat-egories of investment goods namely Building Ma-terials, and Machinery & Equipment increased by32.3 percent and 21.2 percent respectively. Trans-port equipment and all other investment goods im-ports decreased by 10.4 percent and 99.8 percentin 2012.
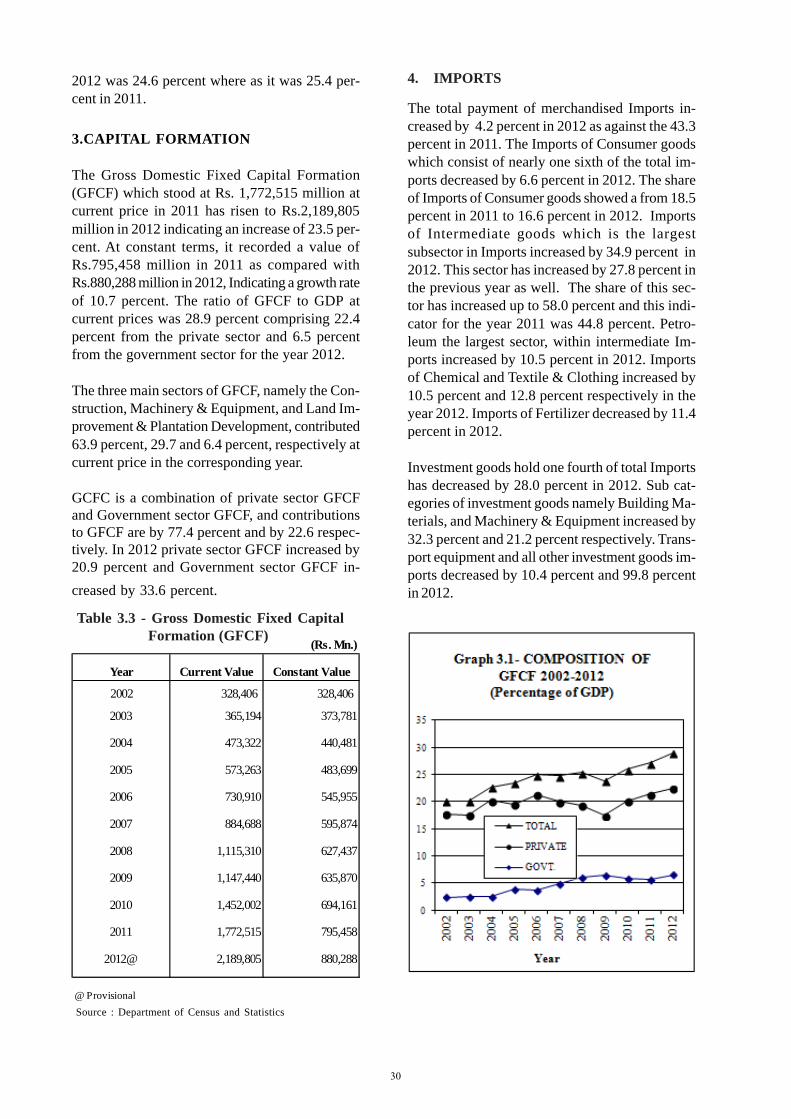
3.CAPITAL FORMATION
The Gross Domestic Fixed Capital Formation(GFCF) which stood at Rs. 1,772,515 million atcurrent price in 2011 has risen to Rs.2,189,805million in 2012 indicating an increase of 23.5 per-cent. At constant terms, it recorded a value ofRs.795,458 million in 2011 as compared withRs.880,288 million in 2012, Indicating a growth rateof 10.7 percent. The ratio of GFCF to GDP atcurrent prices was 28.9 percent comprising 22.4percent from the private sector and 6.5 percentfrom the government sector for the year 2012.
The three main sectors of GFCF, namely the Con-struction, Machinery & Equipment, and Land Im-provement & Plantation Development, contributed63.9 percent, 29.7 and 6.4 percent, respectively atcurrent price in the corresponding year.
GCFC is a combination of private sector GFCFand Government sector GFCF, and contributionsto GFCF are by 77.4 percent and by 22.6 respec-tively. In 2012 private sector GFCF increased by20.9 percent and Government sector GFCF in-creased by 33.6 percent.
Table 3.3 - Gross Domestic Fixed Capital Formation (GFCF)
Source : Department of Census and Statistics
2012 was 24.6 percent where as it was 25.4 per-cent in 2011.
(Rs. Mn.)
Year Current Value Constant Value
2002 328,406 328,406
2003 365,194 373,781
2004 473,322 440,481
2005 573,263 483,699
2006 730,910 545,955
2007 884,688 595,874
2008 1,115,310 627,437
2009 1,147,440 635,870
2010 1,452,002 694,161
2011 1,772,515 795,458
2012@ 2,189,805 880,288
@ Provisional
30
31
Table 3.4 - Percentage Share of GFCF to GDP and Imports of Capital Goods
Table 3.5 – Imports by Major Categories
@ Provisional
Source : Sri Lanka Customs Central Bank of Sri Lanka
Source : Department of Census and Statistics
Share of Share of Imported CapitalGovernment Private Goods as a share
GFCF to GDP GFCF to GDP of total Imports2002 20.1 2.4 17.7 19.22003 20.1 2.5 17.5 19.82004 22.6 2.5 20.2 20.82005 23.4 3.8 19.5 21.12006 24.9 3.6 21.3 21.22007 24.7 4.8 20.0 22.52008 25.3 6.0 19.3 21.22009 23.8 6.4 17.4 21.32010 25.9 5.8 20.1 21.92011 27.1 5.7 21.4 36.3
2012@ 28.9 6.5 22.4 25.1@ Provisional
Year GFCF as a share of GDP
Value % % Value % %(Rs.Mn.) Composi - Annual (Rs.Mn.) Composi - Annual
tion Increase tion Increase1.Consumer Goods 404,037 18.5 40.5 377,445 16.6 -6.6 Food & drink 173,277 42.9 11.9 163,872 43.4 -5.4 Other consumer goods 230,760 57.1 73.9 213,573 56.6 -7.42.Intermediate Goods 975,856 44.8 27.8 1,316,857 58.0 34.9 Fertilizer 44,992 4.6 65.6 39,859 3.0 -11.4 Crude oil 149,747 15.3 76.4 164,524 12.5 9.9 Other petroleum 290,985 29.8 99.0 321,555 24.4 10.5 Chemicals 63,720 6.5 44.7 70,410 5.3 10.5 Dyeing, tanning & colouring 13,943 1.4 25.6 15,095 1.1 8.3 Paper & paper board 47,253 4.8 24.0 46,370 3.5 -1.9 Wheat & meslin 50,772 5.2 90.1 43,087 3.3 -15.1 Textile & clothing 256,592 26.3 31.2 289,537 22.0 12.8 Other 57,851 5.9 -69.5 326,420 24.8 464.2
3.Investment Goods 790,714 36.3 137.6 569,606 25.1 -28.0 Building material 118,935 15.0 30.3 157,391 27.6 32.3 Transport equipment 139,094 17.6 95.0 124,672 21.9 -10.4 Machinery & equipment 236,857 30.0 75.1 286,970 50.4 21.2 Other 295,828 37.4 746.2 573 0.1 -99.84.Other Goods 7,861 0.4 -94.2 6,627 0.3 -15.7
Total 2,178,468 100.0 43.3 2,270,535 100.0 4.2
2011 2012@
Category
31
32
Table 3.7 - Annual Increase of Exports atCurrent Prices 2010-2012
Table 3.6 - Percentage Composition ofExports 2010-2012
Percentage
5. EXPORTS
Overall rupee value of Exports at current termsincreased by 9.0 percent in 2012 as against thegrowth of 18.6 percent in 2011. The changes ofExport income during the recent years can beseen in table 3.7.
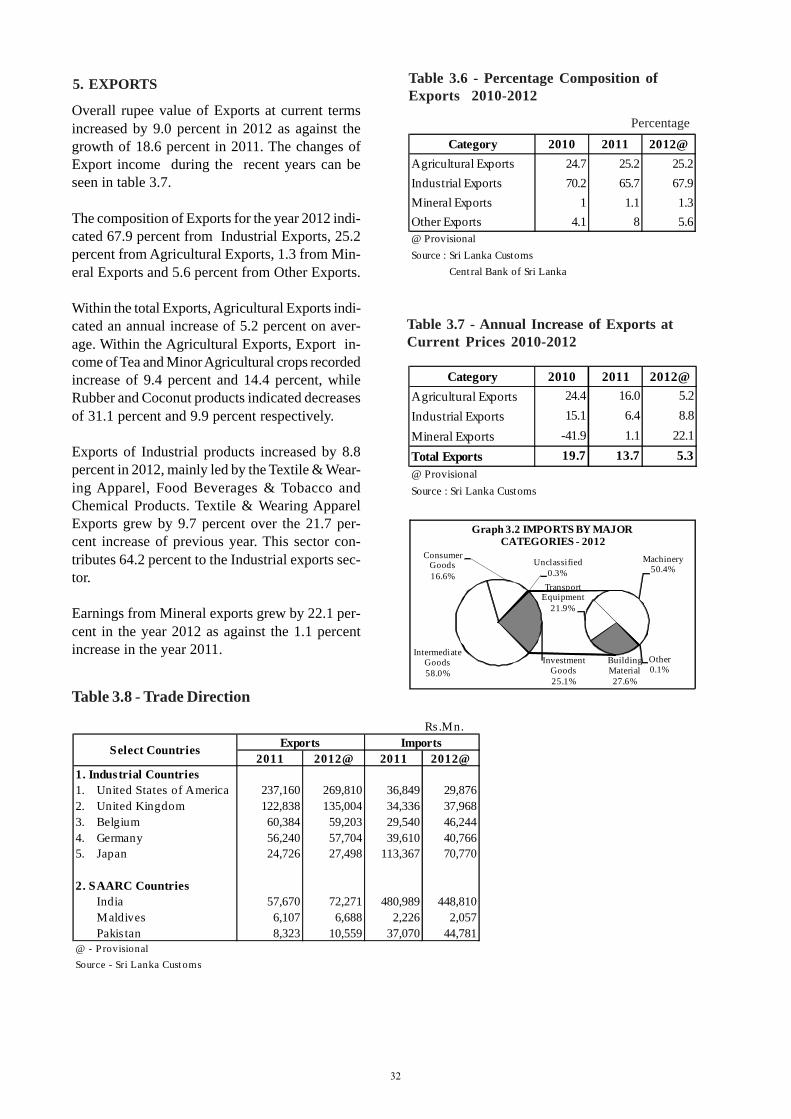
The composition of Exports for the year 2012 indi-cated 67.9 percent from Industrial Exports, 25.2percent from Agricultural Exports, 1.3 from Min-eral Exports and 5.6 percent from Other Exports.
Within the total Exports, Agricultural Exports indi-cated an annual increase of 5.2 percent on aver-age. Within the Agricultural Exports, Export in-come of Tea and Minor Agricultural crops recordedincrease of 9.4 percent and 14.4 percent, whileRubber and Coconut products indicated decreasesof 31.1 percent and 9.9 percent respectively.
Exports of Industrial products increased by 8.8percent in 2012, mainly led by the Textile & Wear-ing Apparel, Food Beverages & Tobacco andChemical Products. Textile & Wearing ApparelExports grew by 9.7 percent over the 21.7 per-cent increase of previous year. This sector con-tributes 64.2 percent to the Industrial exports sec-tor.
Earnings from Mineral exports grew by 22.1 per-cent in the year 2012 as against the 1.1 percentincrease in the year 2011.
Table 3.8 - Trade Direction
Category 2010 2011 2012@Agricultural Exports 24.7 25.2 25.2Industrial Exports 70.2 65.7 67.9Mineral Exports 1 1.1 1.3Other Exports 4.1 8 5.6@ ProvisionalSource : Sri Lanka Customs Cent ral Bank of Sri Lanka
Category 2010 2011 2012@Agricultural Exports 24.4 16.0 5.2Industrial Exports 15.1 6.4 8.8Mineral Exports -41.9 1.1 22.1Total Exports 19.7 13.7 5.3@ ProvisionalSource : Sri Lanka Customs
Rs .Mn.
2011 2012@ 2011 2012@1. Industrial Countries1. United States of America 237,160 269,810 36,849 29,876 2. United Kingdom 122,838 135,004 34,336 37,968 3. Belgium 60,384 59,203 29,540 46,244 4. Germany 56,240 57,704 39,610 40,766 5. Japan 24,726 27,498 113,367 70,770
2. SAARC Countries India 57,670 72,271 480,989 448,810 Maldives 6,107 6,688 2,226 2,057 Pakis tan 8,323 10,559 37,070 44,781 @ - P rovisionalSource - Sri Lanka Cust oms
Exports ImportsSelect Countries
Intermediate Goods58.0%
Consumer Goods16.6%
Unclassified0.3%
Building Material27.6%
Transport Equipment
21.9%
Machinery50.4%
Other0.1%
Investment Goods25.1%
Graph 3.2 IMPORTS BY MAJOR CATEGORIES - 2012
32
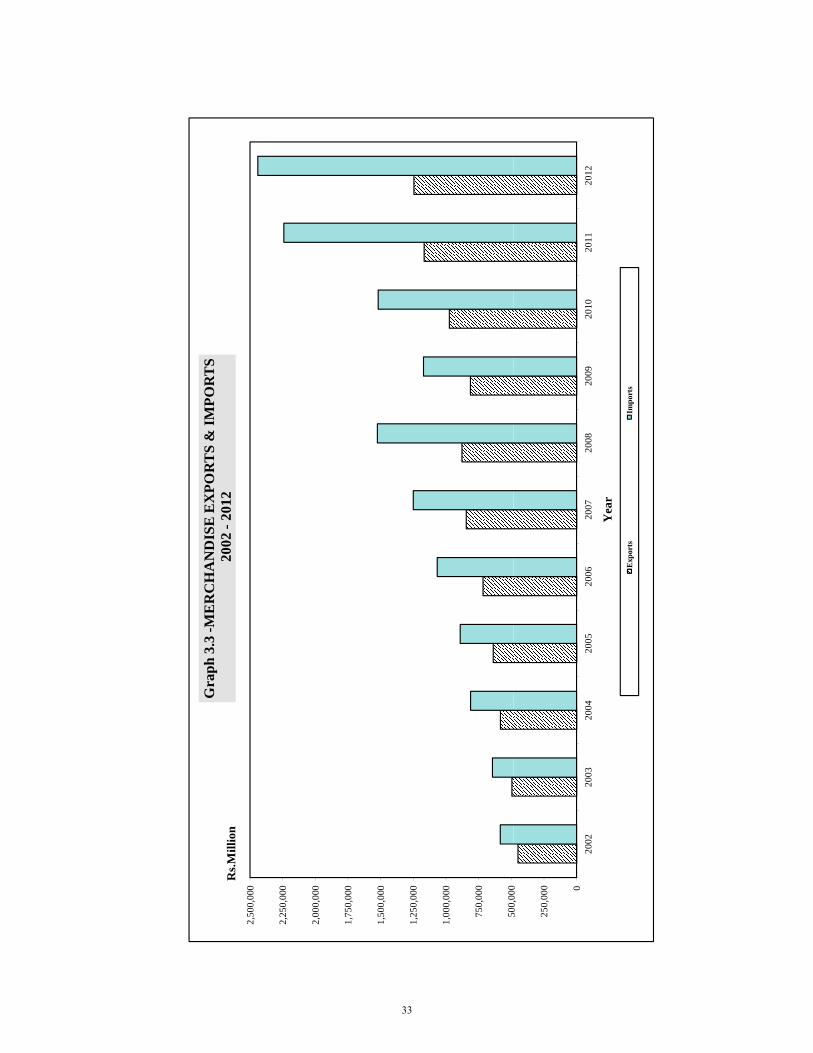
500,
000
750,
000
1,00
0,00
0
1,25
0,00
0
1,50
0,00
0
1,75
0,00
0
2,00
0,00
0
2,25
0,00
0
2,50
0,00
0
Rs.M
illio
n
Gra
ph 3
.3 -M
ER
CH
AN
DIS
E E
XPO
RT
S &
IMPO
RT
S20
02 -
2012
0
250,
000
500,
000
2002
2003
2004
2005
2006
2007
2008
2009
2010
2011
2012
Yea
r
Exp
orts
Impo
rts
33
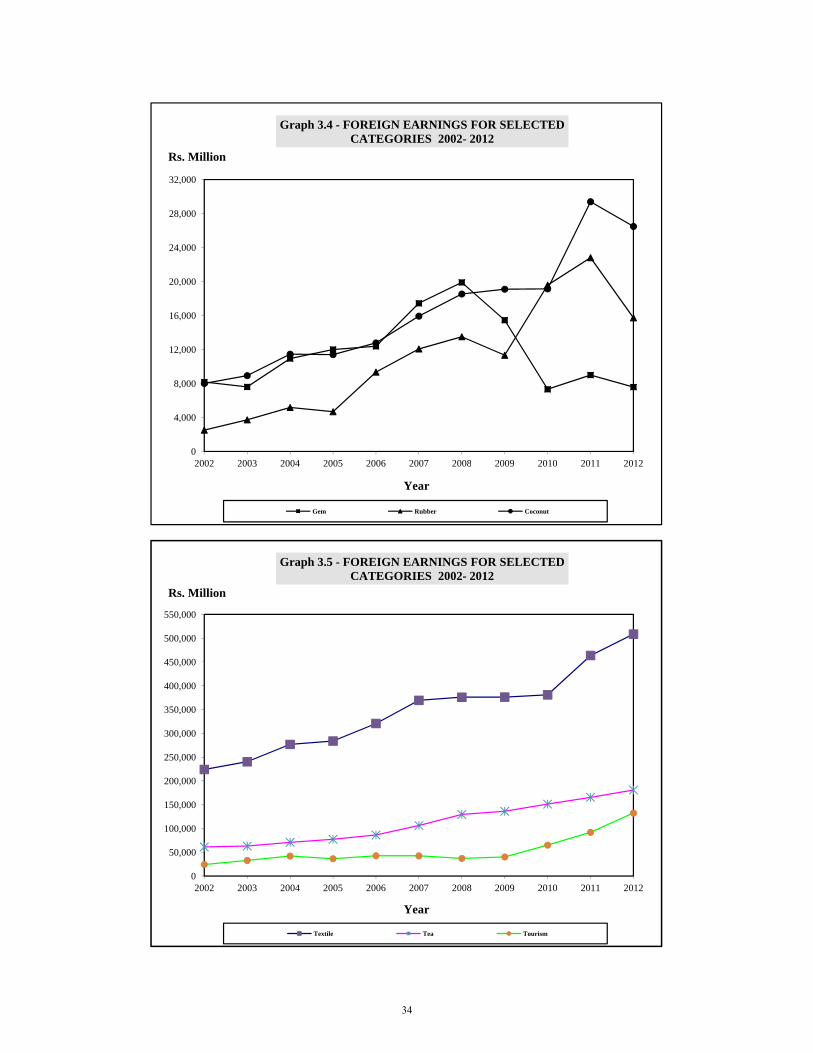
28,000
32,000
Rs. Million
Graph 3.4 - FOREIGN EARNINGS FOR SELECTED CATEGORIES 2002- 2012
16,000
20,000
24,000
,
0
4,000
8,000
12,000
2002 2003 2004 2005 2006 2007 2008 2009 2010 2011 20122002 2003 2004 2005 2006 2007 2008 2009 2010 2011 2012
Year
Gem Rubber Coconut
Graph 3.5 - FOREIGN EARNINGS FOR SELECTED CATEGORIES 2002- 2012
350 000
400,000
450,000
500,000
550,000
Rs. Million
100,000
150,000
200,000
250,000
300,000
350,000
0
50,000
2002 2003 2004 2005 2006 2007 2008 2009 2010 2011 2012
Year
Textile Tea Tourism
34
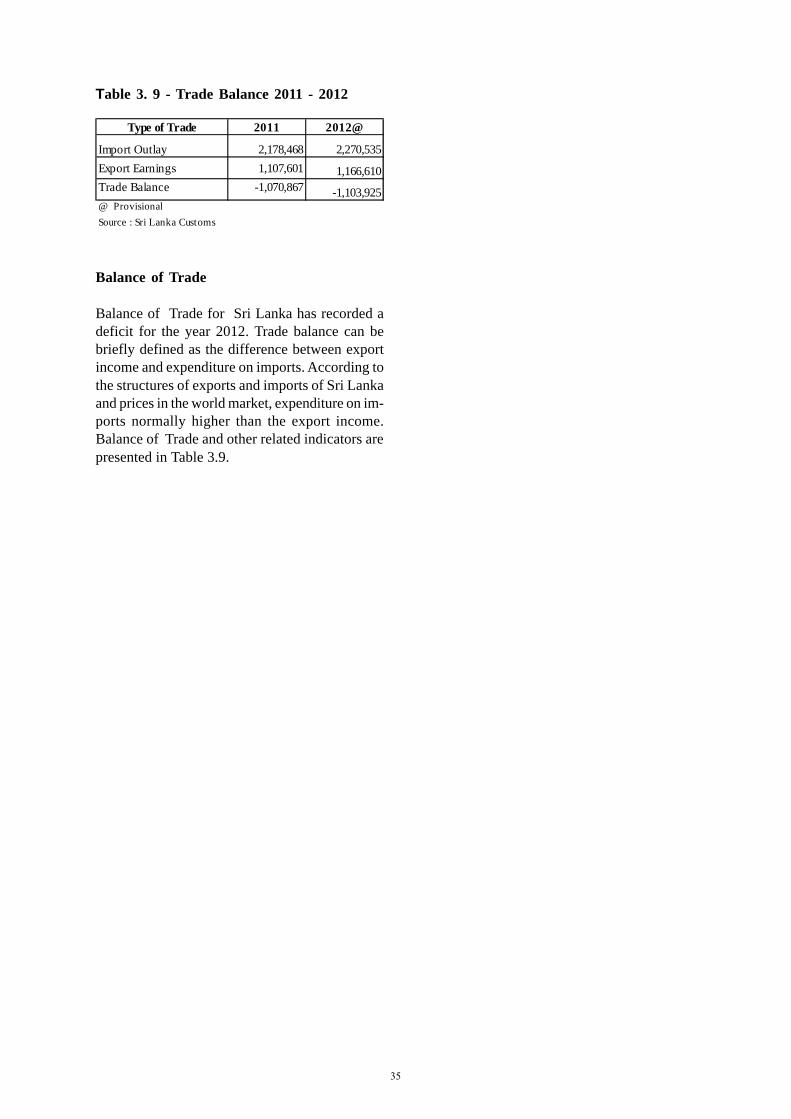
35
Table 3. 9 - Trade Balance 2011 - 2012
Balance of Trade
Balance of Trade for Sri Lanka has recorded adeficit for the year 2012. Trade balance can bebriefly defined as the difference between exportincome and expenditure on imports. According tothe structures of exports and imports of Sri Lankaand prices in the world market, expenditure on im-ports normally higher than the export income.Balance of Trade and other related indicators arepresented in Table 3.9.
Type of Trade 2011 2012@
Import Outlay 2,178,468 2,270,535Export Earnings 1,107,601 1,166,610Trade Balance -1,070,867 -1,103,925@ ProvisionalSource : Sri Lanka Customs
35
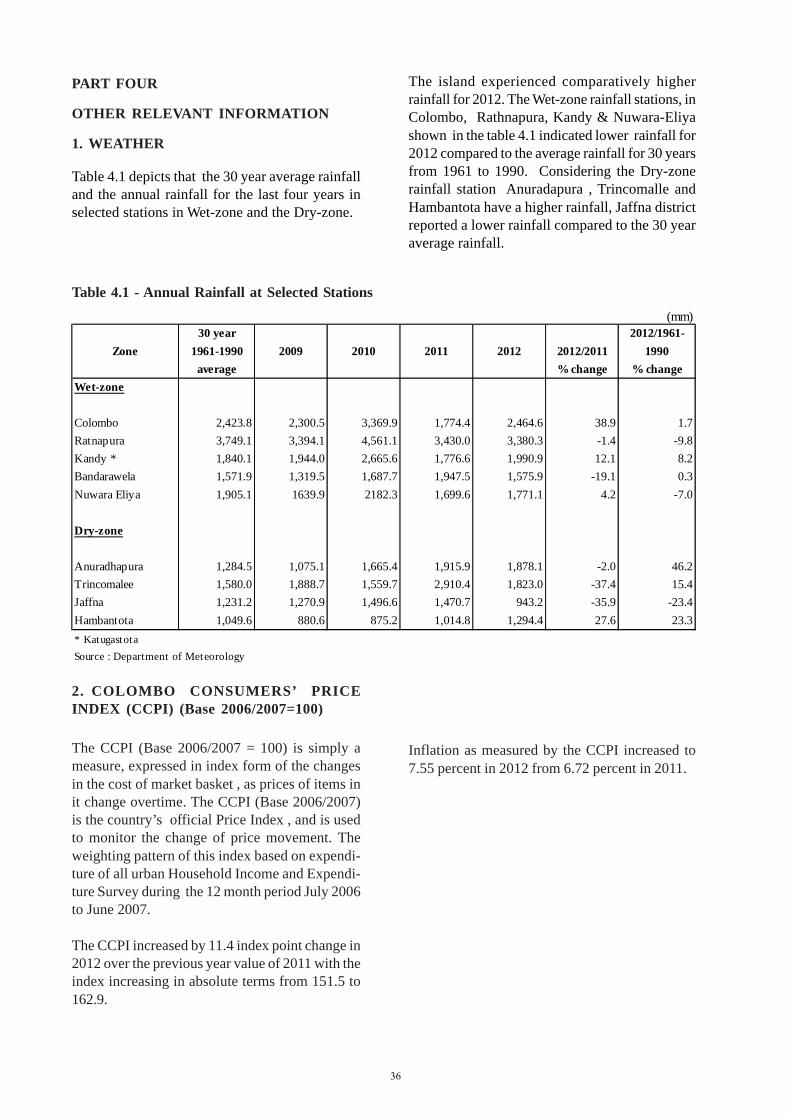
36
Table 4.1 - Annual Rainfall at Selected Stations
PART FOUR
OTHER RELEVANT INFORMATION
1. WEATHER
Table 4.1 depicts that the 30 year average rainfalland the annual rainfall for the last four years inselected stations in Wet-zone and the Dry-zone.
The island experienced comparatively higherrainfall for 2012. The Wet-zone rainfall stations, inColombo, Rathnapura, Kandy & Nuwara-Eliyashown in the table 4.1 indicated lower rainfall for2012 compared to the average rainfall for 30 yearsfrom 1961 to 1990. Considering the Dry-zonerainfall station Anuradapura , Trincomalle andHambantota have a higher rainfall, Jaffna districtreported a lower rainfall compared to the 30 yearaverage rainfall.
2. COLOMBO CONSUMERS’ PRICEINDEX (CCPI) (Base 2006/2007=100)
The CCPI (Base 2006/2007 = 100) is simply ameasure, expressed in index form of the changesin the cost of market basket , as prices of items init change overtime. The CCPI (Base 2006/2007)is the country’s official Price Index , and is usedto monitor the change of price movement. Theweighting pattern of this index based on expendi-ture of all urban Household Income and Expendi-ture Survey during the 12 month period July 2006to June 2007.
The CCPI increased by 11.4 index point change in2012 over the previous year value of 2011 with theindex increasing in absolute terms from 151.5 to162.9.
Inflation as measured by the CCPI increased to7.55 percent in 2012 from 6.72 percent in 2011.
(mm)30 year 2012/1961-
Zone 1961-1990 2009 2010 2011 2012 2012/2011 1990average % change % change
Wet-zone
Colombo 2,423.8 2,300.5 3,369.9 1,774.4 2,464.6 38.9 1.7Ratnapura 3,749.1 3,394.1 4,561.1 3,430.0 3,380.3 -1.4 -9.8Kandy * 1,840.1 1,944.0 2,665.6 1,776.6 1,990.9 12.1 8.2Bandarawela 1,571.9 1,319.5 1,687.7 1,947.5 1,575.9 -19.1 0.3Nuwara Eliya 1,905.1 1639.9 2182.3 1,699.6 1,771.1 4.2 -7.0
Dry-zone
Anuradhapura 1,284.5 1,075.1 1,665.4 1,915.9 1,878.1 -2.0 46.2Trincomalee 1,580.0 1,888.7 1,559.7 2,910.4 1,823.0 -37.4 15.4Jaffna 1,231.2 1,270.9 1,496.6 1,470.7 943.2 -35.9 -23.4Hambantota 1,049.6 880.6 875.2 1,014.8 1,294.4 27.6 23.3* KatugastotaSource : Department of Meteorology
36
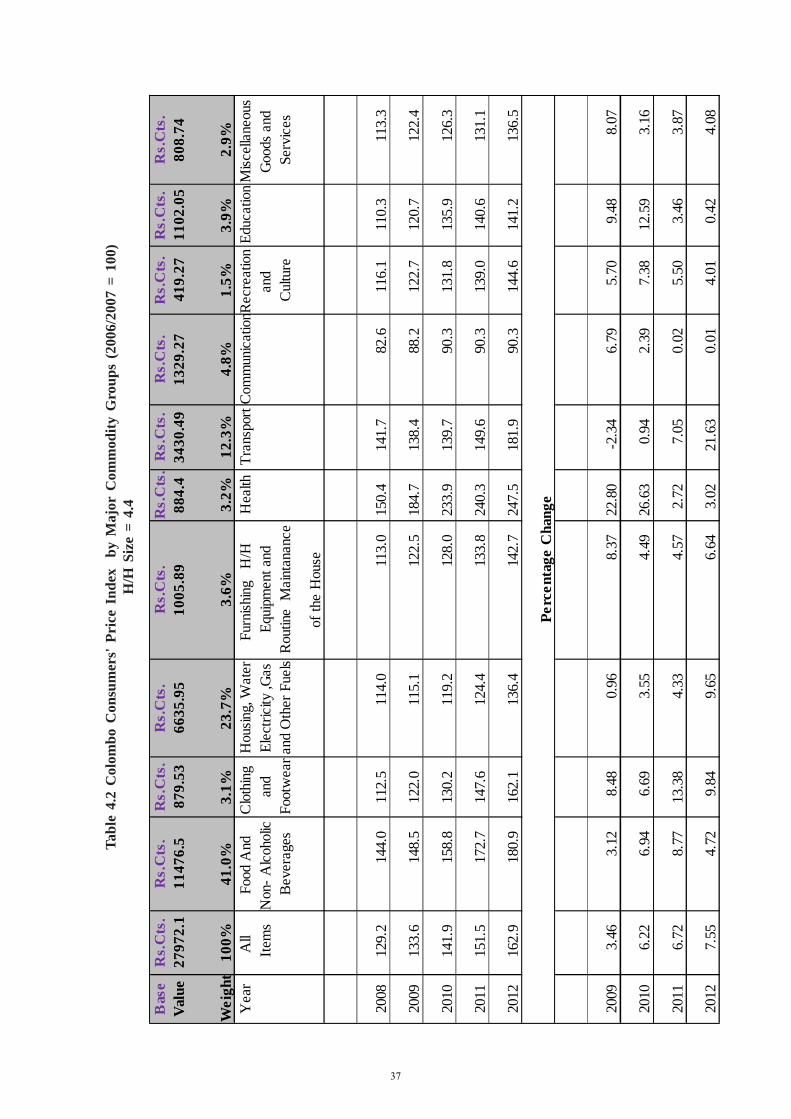
37
Tabl
e 4.
2 C
olom
bo C
onsu
mer
s' P
rice
Ind
ex
by M
ajor
Com
mod
ity G
roup
s (2
006/
2007
= 1
00)
H/H
Siz
e =
4.4
Bas
eR
s.C
ts.
Rs.
Cts
.R
s.C
ts.
Rs.
Cts
.R
s.C
ts.
Rs.
Cts
.R
s.C
ts.
Rs.
Cts
.R
s.C
ts.
Rs.
Cts
.R
s.C
ts.
Val
ue27
972.
111
476.
587
9.53
6635
.95
1005
.89
884.
434
30.4
913
29.2
741
9.27
1102
.05
808.
74
Wei
ght
100%
41.0
%3.
1%23
.7%
3.6%
3.2%
12.3
%4.
8%1.
5%3.
9%2.
9%Y
ear
All
Food
And
C
loth
ing
Hou
sing,
Wat
erFu
rnish
ing
H/H
H
ealth
Tran
spor
tCom
mun
icat
ionR
ecre
atio
n Ed
ucat
ion
Misc
ella
neou
s It
ems
Non
- Alc
ohol
ic
and
Elec
trici
ty ,G
asEq
uipm
ent a
ndan
d G
oods
and
B
ever
ages
Foot
wea
rand
Oth
er F
uels
Rou
tine
Mai
ntan
ance
C
ultu
reSe
rvic
es
of th
e H
ouse
2008
129.
214
4.0
112.
511
4.0
113.
015
0.4
141.
782
.611
6.1
110.
311
3.3
2009
133.
614
8.5
122.
011
5.1
122.
518
4.7
138.
488
.212
2.7
120.
712
2.4
2010
141.
915
8.8
130.
211
9.2
128.
023
3.9
139.
790
.313
1.8
135.
912
6.3
2011
151.
517
2.7
147.
612
4.4
133.
824
0.3
149.
690
.313
9.0
140.
613
1.1
2012
162.
918
0.9
162.
113
6.4
142.
724
7.5
181.
990
.314
4.6
141.
213
6.5
2009
3.46
3.12
8.48
0.96
8.37
22.8
0-2
.34
6.79
5.70
9.48
8.07
2010
6.22
6.94
6.69
3.55
4.49
26.6
30.
942.
397.
3812
.59
3.16
2011
6.72
8.77
13.3
84.
334.
572.
727.
050.
025.
503.
463.
87
2012
7.55
4.72
9.84
9.65
6.64
3.02
21.6
30.
014.
010.
424.
08
Perc
enta
ge C
hang
e
37

38
NATIONAL ACCOUNTS
QUICK ESTIMATES
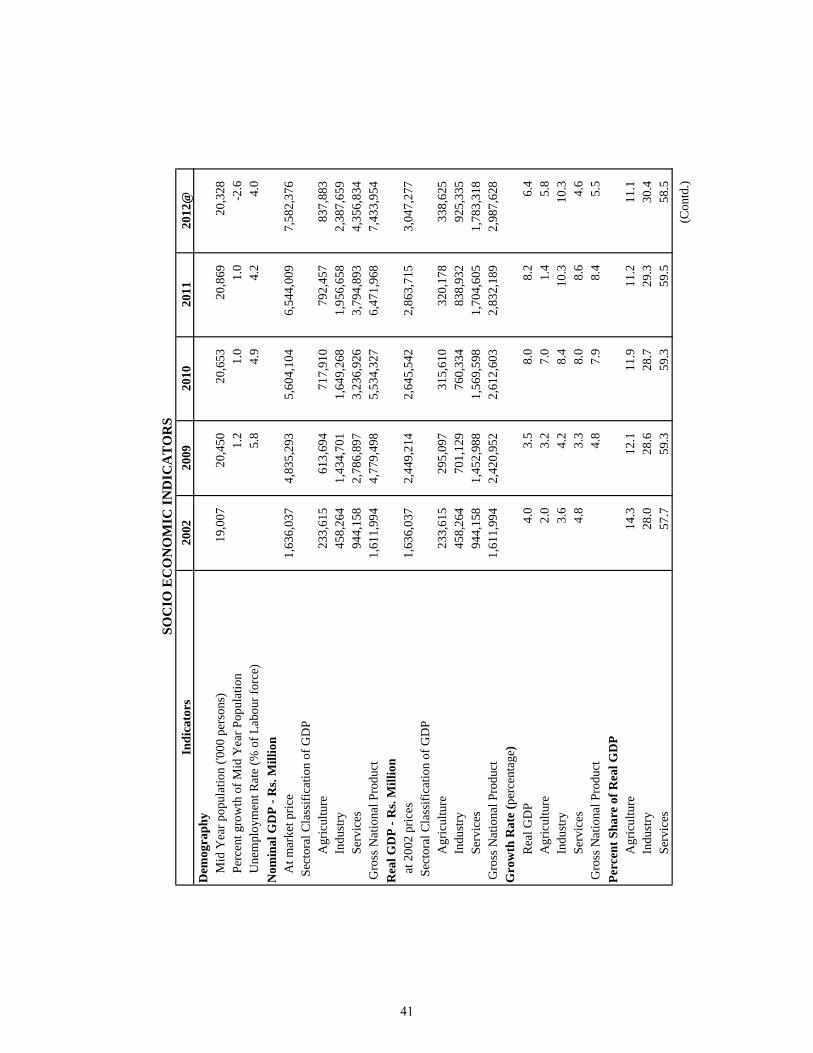
Indi
cato
rs20
0220
0920
1020
1120
12@
Dem
ogra
phy
Mid
Yea
r pop
ulat
ion
('000
per
sons
)19
,007
20,4
5020
,653
20,8
6920
,328
Perc
ent g
row
th o
f Mid
Yea
r Pop
ulat
ion
1.2
1.0
1.0
-2.6
Une
mpl
oym
ent R
ate
(% o
f Lab
our f
orce
)5.
84.
94.
24.
0N
omin
al G
DP
- Rs.
Mill
ion
A
t mar
ket p
rice
1,63
6,03
74,
835,
293
5,60
4,10
46,
544,
009
7,58
2,37
6 S
ecto
ral C
lass
ifica
tion
of G
DP
Agr
icul
ture
233,
615
613,
694
717,
910
792,
457
837,
883
Indu
stry
458,
264
1,43
4,70
11,
649,
268
1,95
6,65
82,
387,
659
Serv
ices
944,
158
2,78
6,89
73,
236,
926
3,79
4,89
34,
356,
834
Gro
ss N
atio
nal P
rodu
ct1,
611,
994
4,77
9,49
85,
534,
327
6,47
1,96
87,
433,
954
Rea
l GD
P - R
s. M
illio
n
at 2
002
pric
es1,
636,
037
2,44
9,21
42,
645,
542
2,86
3,71
53,
047,
277
Sec
tora
l Cla
ssifi
catio
n of
GD
P A
gric
ultu
re23
3,61
529
5,09
731
5,61
032
0,17
833
8,62
5In
dust
ry45
8,26
470
1,12
976
0,33
483
8,93
292
5,33
5Se
rvic
es94
4,15
81,
452,
988
1,56
9,59
81,
704,
605
1,78
3,31
8 G
ross
Nat
iona
l Pro
duct
1,61
1,99
42,
420,
952
2,61
2,60
32,
832,
189
2,98
7,62
8G
row
th R
ate
(per
cent
age)
R
eal G
DP
4.0
3.5
8.0
8.2
6.4
Agr
icul
ture
2.0
3.2
7.0
1.4
5.8
Indu
stry
3.6
4.2
8.4
10.3
10.3
Serv
ices
4.8
3.3
8.0
8.6
4.6
Gro
ss N
atio
nal P
rodu
ct4.
87.
98.
45.
5Pe
rcen
t Sha
re o
f Rea
l GD
PA
gric
ultu
re14
.312
.111
.911
.211
.1In
dust
ry28
.028
.628
.729
.330
.4Se
rvic
es57
.759
.359
.359
.558
.5(C
ontd
.)
SOC
IO E
CO
NO
MIC
IND
ICA
TO
RS
41
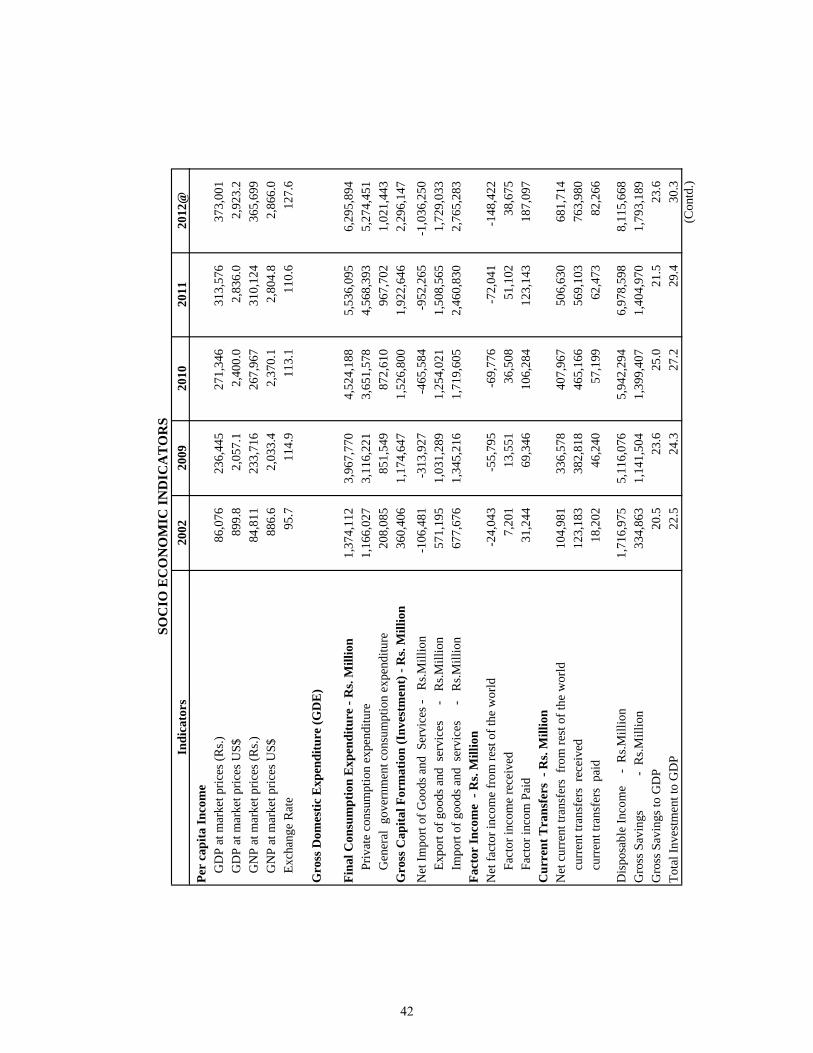
Indi
cato
rs20
0220
0920
1020
1120
12@
SOC
IO E
CO
NO
MIC
IND
ICA
TO
RS
Per
capi
ta In
com
eG
DP
at m
arke
t pric
es (R
s.)86
,076
236,
445
271,
346
313,
576
373,
001
GD
P at
mar
ket p
rices
US$
899.
82,
057.
12,
400.
02,
836.
02,
923.
2G
NP
at m
arke
t pric
es (R
s.)84
,811
233,
716
267,
967
310,
124
365,
699
GN
P at
mar
ket p
rices
US$
886.
62,
033.
42,
370.
12,
804.
82,
866.
0Ex
chan
ge R
ate
95.7
114.
911
3.1
110.
612
7.6
Gro
ss D
omes
tic E
xpen
ditu
re (G
DE
)
Fina
l Con
sum
ptio
n E
xpen
ditu
re -
Rs.
Mill
ion
1,37
4,11
23,
967,
770
4,52
4,18
85,
536,
095
6,29
5,89
4
Priv
ate
cons
umpt
ion
expe
nditu
re1,
166,
027
3,11
6,22
13,
651,
578
4,56
8,39
35,
274,
451
G
ener
al g
over
nmen
t con
sum
ptio
n ex
pend
iture
208,
085
851,
549
872,
610
967,
702
1,02
1,44
3G
ross
Cap
ital F
orm
atio
n (I
nves
tmen
t) -
Rs.
Mill
ion
360,
406
1,17
4,64
71,
526,
800
1,92
2,64
62,
296,
147
Net
Impo
rt of
Goo
ds a
nd S
ervi
ces -
R
s.Mill
ion
-106
,481
-313
,927
-465
,584
-952
,265
-1,0
36,2
50
Exp
ort o
f goo
ds a
nd s
ervi
ces
-
Rs.M
illio
n57
1,19
51,
031,
289
1,25
4,02
11,
508,
565
1,72
9,03
3
Impo
rt of
goo
ds a
nd s
ervi
ces
-
Rs.M
illio
n67
7,67
61,
345,
216
1,71
9,60
52,
460,
830
2,76
5,28
3Fa
ctor
Inco
me
- R
s. M
illio
nN
et fa
ctor
inco
me
from
rest
of t
he w
orld
-24,
043
-55,
795
-69,
776
-72,
041
-148
,422
F
acto
r inc
ome
rece
ived
7,
201
13,5
5136
,508
51,1
0238
,675
F
acto
r inc
om P
aid
31,2
4469
,346
106,
284
123,
143
187,
097
Cur
rent
Tra
nsfe
rs -
Rs.
Mill
ion
Net
cur
rent
tran
sfer
s fr
om re
st o
f the
wor
ld10
4,98
133
6,57
840
7,96
750
6,63
068
1,71
4
cur
rent
tran
sfer
s re
ceiv
ed
123,
183
382,
818
465,
166
569,
103
763,
980
c
urre
nt tr
ansf
ers
paid
18,2
0246
,240
57,1
9962
,473
82,2
66
Dis
posa
ble
Inco
me
-
Rs.M
illio
n1,
716,
975
5,11
6,07
65,
942,
294
6,97
8,59
88,
115,
668
Gro
ss S
avin
gs
- R
s.Mill
ion
334,
863
1,14
1,50
41,
399,
407
1,40
4,97
01,
793,
189
Gro
ss S
avin
gs to
GD
P20
.523
.625
.021
.523
.6To
tal I
nves
tmen
t to
GD
P22
.524
.327
.229
.430
.3(C
ontd
.)
42
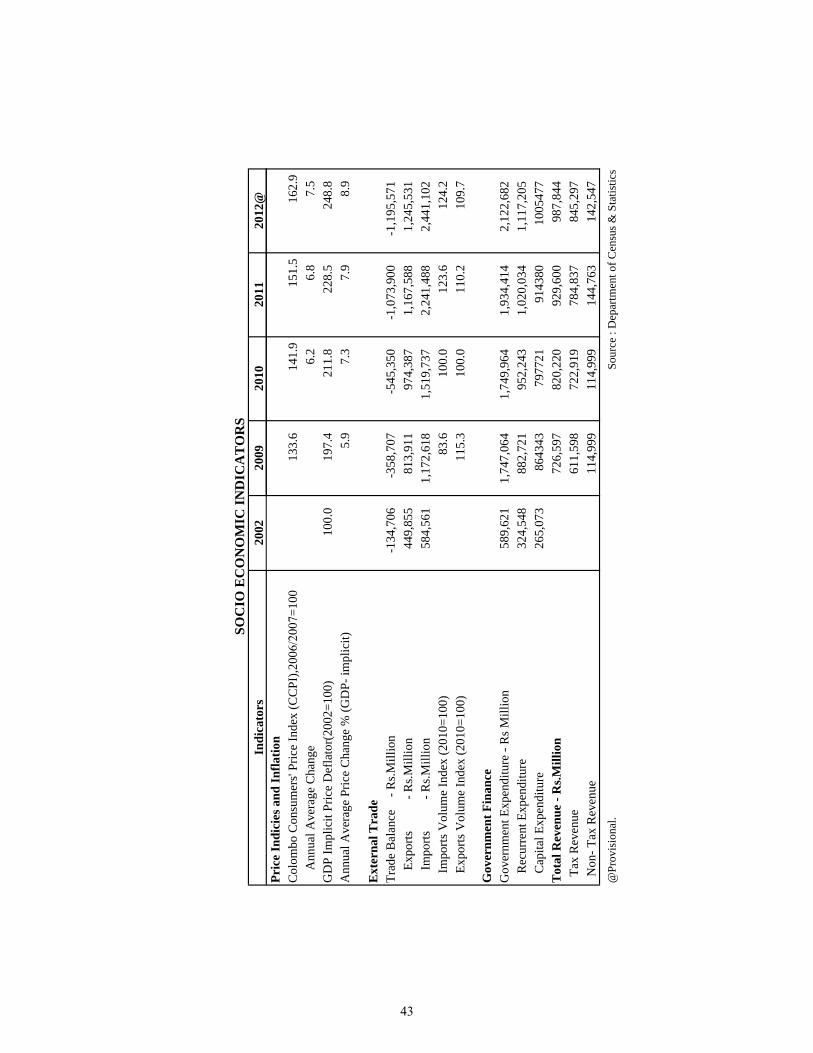
Indi
cato
rs20
0220
0920
1020
1120
12@
SOC
IO E
CO
NO
MIC
IND
ICA
TO
RS
Pric
e In
dici
es a
nd In
flatio
nC
olom
bo C
onsu
mer
s' Pr
ice
Inde
x (C
CPI
),200
6/20
07=1
00
133.
614
1.9
151.
516
2.9
A
nnua
l Ave
rage
Cha
nge
6.2
6.8
7.5
GD
P Im
plic
it Pr
ice
Def
lato
r(20
02=1
00)
100.
019
7.4
211.
822
8.5
248.
8A
nnua
l Ave
rage
Pric
e C
hang
e %
(GD
P- im
plic
it)5.
97.
37.
98.
9
Ext
erna
l Tra
deTr
ade
Bal
ance
-
Rs.M
illio
n-1
34,7
06-3
58,7
07-5
45,3
50-1
,073
,900
-1,1
95,5
71
Exp
orts
-
Rs.M
illio
n44
9,85
581
3,91
197
4,38
71,
167,
588
1,24
5,53
1
Impo
rts
- R
s.Mill
ion
584,
561
1,17
2,61
81,
519,
737
2,24
1,48
82,
441,
102
Impo
rts V
olum
e In
dex
(201
0=10
0)83
.610
0.0
123.
612
4.2
Expo
rts V
olum
e In
dex
(201
0=10
0)11
5.3
100.
011
0.2
109.
7
Gov
ernm
ent F
inan
ceG
over
nmen
t Exp
endi
ture
- R
s Mill
ion
589,
621
1,74
7,06
41,
749,
964
1,93
4,41
42,
122,
682
R
ecur
rent
Exp
endi
ture
324,
548
882,
721
952,
243
1,02
0,03
41,
117,
205
C
apita
l Exp
endi
ture
265,
073
8643
4379
7721
9143
8010
0547
7T
otal
Rev
enue
- R
s.Mill
ion
726,
597
820,
220
929,
600
987,
844
Tax
Rev
enue
611,
598
722,
919
784,
837
845,
297
Non
- Tax
Rev
enue
114,
999
114,
999
144,
763
142,
547
@Pr
ovis
iona
l.
S
ourc
e : D
epar
tmen
t of C
ensu
s & S
tatis
tics
43
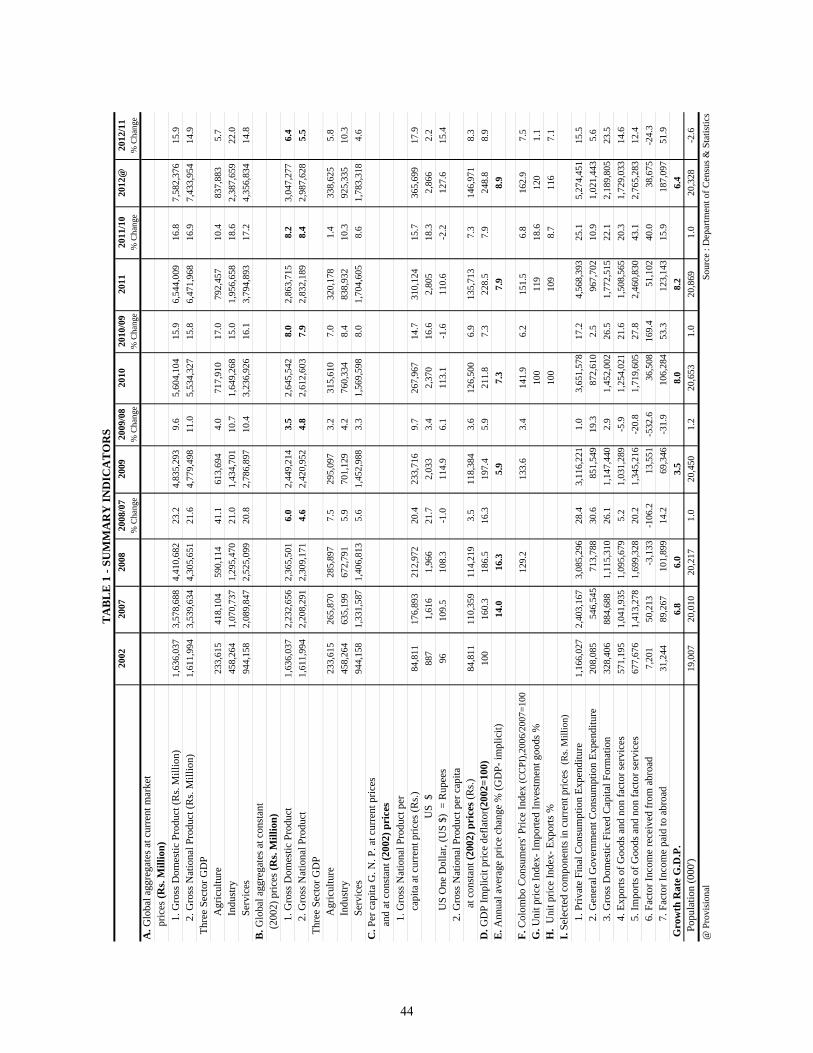
2002
2007
2008
2008
/07
2009
2009
/08
2010
2010
/09
2011
2011
/10
2012
@20
12/1
1%
Cha
nge
% C
hang
e%
Cha
nge
% C
hang
e%
Cha
nge
A. G
loba
l agg
rega
tes a
t cur
rent
mar
ket
p
rices
(Rs.
Mill
ion)
1. G
ross
Dom
estic
Pro
duct
(Rs.
Mill
ion)
1,63
6,03
73,
578,
688
4,41
0,68
223
.24,
835,
293
9.6
5,60
4,10
415
.96,
544,
009
16.8
7,58
2,37
615
.9
2
. Gro
ss N
atio
nal P
rodu
ct (R
s. M
illio
n)1,
611,
994
3,53
9,63
44,
305,
651
21.6
4,77
9,49
811
.05,
534,
327
15.8
6,47
1,96
816
.97,
433,
954
14.9
Thr
ee S
ecto
r GD
P
Agr
icul
ture
233,
615
418,
104
590,
114
41.1
613,
694
4.0
717,
910
17.0
792,
457
10.4
837,
883
5.7
In
dust
ry45
8,26
41,
070,
737
1,29
5,47
021
.01,
434,
701
10.7
1,64
9,26
815
.01,
956,
658
18.6
2,38
7,65
922
.0
Serv
ices
944,
158
2,08
9,84
72,
525,
099
20.8
2,78
6,89
710
.43,
236,
926
16.1
3,79
4,89
317
.24,
356,
834
14.8
B. G
loba
l agg
rega
tes a
t con
stan
t
(200
2) p
rices
(Rs.
Mill
ion)
1. G
ross
Dom
estic
Pro
duct
1,63
6,03
72,
232,
656
2,36
5,50
16.
02,
449,
214
3.5
2,64
5,54
28.
02,
863,
715
8.2
3,04
7,27
76.
4
2
. Gro
ss N
atio
nal P
rodu
ct1,
611,
994
2,20
8,29
12,
309,
171
4.6
2,42
0,95
24.
82,
612,
603
7.9
2,83
2,18
98.
42,
987,
628
5.5
Thr
ee S
ecto
r GD
P
Agr
icul
ture
233,
615
265,
870
285,
897
7.5
295,
097
3.2
315,
610
7.0
320,
178
1.4
338,
625
5.8
In
dust
ry45
8,26
463
5,19
967
2,79
15.
970
1,12
94.
276
0,33
48.
483
8,93
210
.392
5,33
510
.3
Serv
ices
944,
158
1,33
1,58
71,
406,
813
5.6
1,45
2,98
83.
31,
569,
598
8.0
1,70
4,60
58.
61,
783,
318
4.6
C. P
er c
apita
G. N
. P. a
t cur
rent
pric
es
and
at c
onst
ant (
2002
) pri
ces
1
. Gro
ss N
atio
nal P
rodu
ct p
er
cap
ita a
t cur
rent
pric
es (R
s.)84
,811
176,
893
212,
972
20.4
233,
716
9.7
267,
967
14.7
310,
124
15.7
365,
699
17.9
U
S $
887
1,61
61,
966
21.7
2,03
33.
42,
370
16.6
2,80
518
.32,
866
2.2
U
S O
ne D
olla
r, (U
S $)
= R
upee
s96
109.
510
8.3
-1.0
114.
96.
111
3.1
-1.6
110.
6-2
.212
7.6
15.4
2. G
ross
Nat
iona
l Pro
duct
per
cap
ita
at
con
stan
t (20
02) p
rice
s (R
s.)84
,811
110,
359
114,
219
3.5
118,
384
3.6
126,
500
6.9
135,
713
7.3
146,
971
8.3
D. G
DP
Impl
icit
pric
e de
flato
r(20
02=1
00)
100
160.
318
6.5
16.3
197.
45.
921
1.8
7.3
228.
57.
924
8.8
8.9
E. A
nnua
l ave
rage
pric
e ch
ange
% (G
DP-
impl
icit)
14.0
16.3
5.9
7.3
7.9
8.9
F. C
olom
bo C
onsu
mer
s' Pr
ice
Inde
x (C
CPI
),200
6/20
07=1
00
129.
213
3.6
3.4
141.
96.
215
1.5
6.8
162.
97.
5G
. Uni
t pric
e In
dex-
Impo
rted
Inve
stm
ent g
oods
%10
011
918
.612
01.
1H
. U
nit p
rice
Inde
x- E
xpor
ts %
100
109
8.7
116
7.1
I. Se
lect
ed c
ompo
nent
s in
curr
ent p
rices
(R
s. M
illio
n)
1
. Priv
ate
Fina
l Con
sum
ptio
n Ex
pend
iture
1,16
6,02
72,
403,
167
3,08
5,29
628
.43,
116,
221
1.0
3,65
1,57
817
.24,
568,
393
25.1
5,27
4,45
115
.5
2
. Gen
eral
Gov
ernm
ent C
onsu
mpt
ion
Expe
nditu
re20
8,08
554
6,54
571
3,78
830
.685
1,54
919
.387
2,61
02.
596
7,70
210
.91,
021,
443
5.6
3. G
ross
Dom
estic
Fix
ed C
apita
l For
mat
ion
328,
406
884,
688
1,11
5,31
026
.11,
147,
440
2.9
1,45
2,00
226
.51,
772,
515
22.1
2,18
9,80
523
.5
4
. Exp
orts
of G
oods
and
non
fact
or se
rvic
es57
1,19
51,
041,
935
1,09
5,67
95.
21,
031,
289
-5.9
1,25
4,02
121
.61,
508,
565
20.3
1,72
9,03
314
.6
5
. Im
ports
of G
oods
and
non
fact
or se
rvic
es67
7,67
61,
413,
278
1,69
9,32
820
.21,
345,
216
-20.
81,
719,
605
27.8
2,46
0,83
043
.12,
765,
283
12.4
6. F
acto
r Inc
ome
rece
ived
from
abr
oad
7,20
150
,213
-3,1
33-1
06.2
13,5
51-5
32.6
36,5
0816
9.4
51,1
0240
.038
,675
-24.
3
7
. Fac
tor I
ncom
e pa
id to
abr
oad
31,2
4489
,267
101,
899
14.2
69,3
46-3
1.9
106,
284
53.3
123,
143
15.9
187,
097
51.9
Gro
wth
Rat
e G
.D.P
.6.
86.
03.
58.
08.
26.
4
Popu
latio
n (0
00')
19,0
0720
,010
20,2
171.
020
,450
1.2
20,6
531.
020
,869
1.0
20,3
28-2
.6@
Pro
visi
onal
Sou
rce
: Dep
artm
ent o
f Cen
sus &
Sta
tistic
s
TA
BL
E 1
- SU
MM
AR
Y IN
DIC
AT
OR
S
44
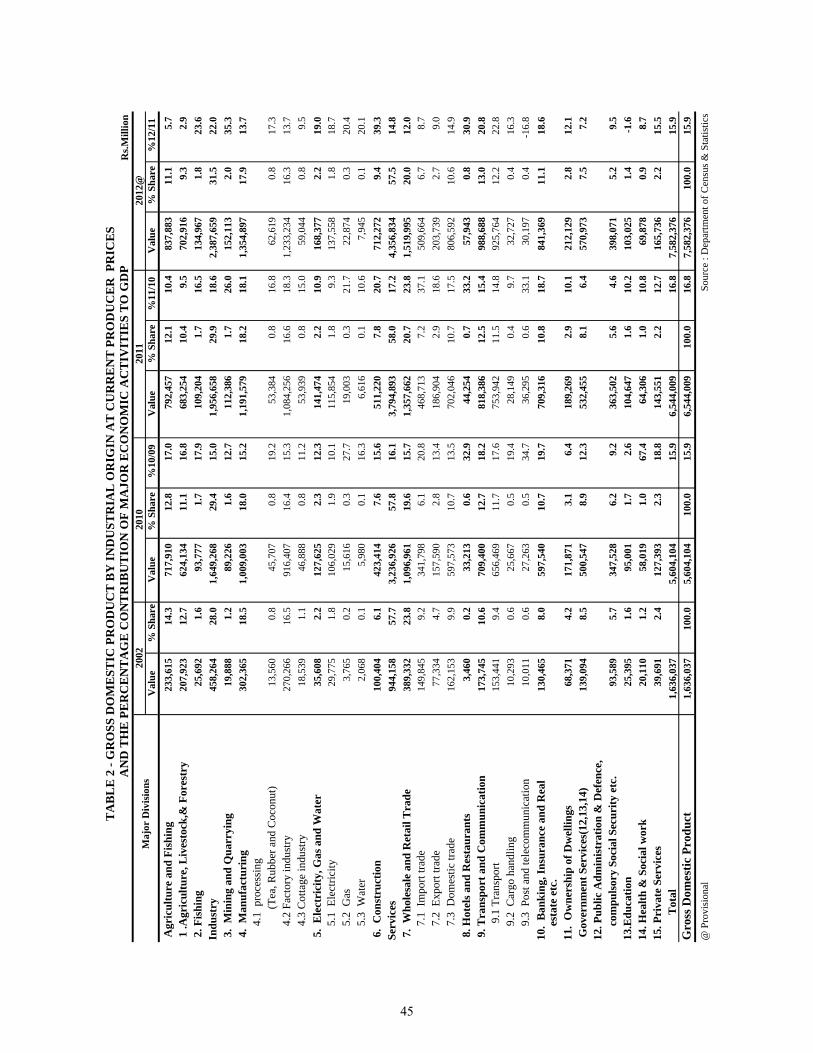
Rs.M
illio
n
Val
ue%
Sha
reV
alue
% S
hare
%10
/09
Val
ue%
Sha
re%
11/1
0V
alue
% S
hare
%12
/11
Agr
icul
ture
and
Fis
hing
233,
615
14
.371
7,91
0
12.8
17.0
792,
457
12.1
10.4
837,
883
11.1
5.7
1 .A
gric
ultu
re, L
ives
tock
,& F
ores
try
207,
923
12
.762
4,13
4
11.1
16.8
683,
254
10.4
9.5
702,
916
9.3
2.9
2. F
ishi
ng25
,692
1.6
93,7
771.
717
.910
9,20
41.
716
.513
4,96
71.
823
.6In
dust
ry45
8,26
428
.01,
649,
268
29.4
15.0
1,95
6,65
829
.918
.62,
387,
659
31.5
22.0
3.
Min
ing
and
Qua
rryi
ng19
,888
1.2
89,2
26
1.
612
.711
2,38
6
1.
726
.015
2,11
3
2.
035
.3 4
. M
anuf
actu
ring
302,
365
18.5
1,00
9,00
318
.015
.21,
191,
579
18.2
18.1
1,35
4,89
717
.913
.7
4.1
pro
cess
ing
(
Tea,
Rub
ber a
nd C
ocon
ut)
13,5
60
0.
845
,707
0.8
19.2
53,3
84
0.
816
.862
,619
0.
817
.3
4.2
Fac
tory
indu
stry
270,
266
16
.591
6,40
7
16.4
15.3
1,08
4,25
6
16.6
18.3
1,23
3,23
4
16.3
13.7
4
.3 C
otta
ge in
dust
ry18
,539
1.1
46,8
88
0.
811
.253
,939
0.8
15.0
59,0
44
0.8
9.5
5.
Ele
ctri
city
, Gas
and
Wat
er35
,608
2.2
127,
625
2.
312
.314
1,47
4
2.
210
.916
8,37
7
2.
219
.0
5.1
Ele
ctric
ity29
,775
1.8
106,
029
1.
910
.111
5,85
4
1.
89.
313
7,55
8
1.
818
.7
5.2
Gas
3,76
5
0.
215
,616
0.3
27.7
19,0
03
0.
321
.722
,874
0.
320
.4
5.3
Wat
er2,
068
0.1
5,98
0
0.1
16.3
6,61
6
0.1
10.6
7,94
5
0.
120
.1 6
. C
onst
ruct
ion
100,
404
6.
142
3,41
4
7.6
15.6
511,
220
7.8
20.7
712,
272
9.4
39.3
Serv
ices
944,
158
57.7
3,23
6,92
657
.816
.13,
794,
893
58.0
17.2
4,35
6,83
457
.514
.8 7
. W
hole
sale
and
Ret
ail T
rade
38
9,33
223
.81,
096,
961
19.6
15.7
1,35
7,66
220
.723
.81,
519,
995
20.0
12.0
7
.1 I
mpo
rt tra
de14
9,84
5
9.2
341,
798
6.
120
.846
8,71
3
7.
237
.150
9,66
4
6.
78.
7
7.2
Exp
ort t
rade
77,3
34
4.
715
7,59
0
2.8
13.4
186,
904
2.9
18.6
203,
739
2.7
9.0
7
.3 D
omes
tic tr
ade
16
2,15
3
9.9
597,
573
10
.713
.570
2,04
6
10
.717
.580
6,59
2
10
.614
.9 8
. Hot
els a
nd R
esta
uran
ts3,
460
0.2
33,2
13
0.
632
.944
,254
0.7
33.2
57,9
43
0.8
30.9
9. T
rans
port
and
Com
mun
icat
ion
173,
745
10
.670
9,40
0
12.7
18.2
818,
386
12.5
15.4
988,
688
13.0
20.8
9.1
Tran
spor
t15
3,44
1
9.4
656,
469
11
.717
.675
3,94
2
11
.514
.892
5,76
4
12
.222
.8
9.2
Car
go h
andl
ing
10,2
93
0.
625
,667
0.5
19.4
28,1
49
0.
49.
732
,727
0.
416
.3
9.3
Pos
t and
tele
com
mun
icat
ion
10,0
11
0.
627
,263
0.5
34.7
36,2
95
0.
633
.130
,197
0.
4-1
6.8
10.
Ban
king
, Ins
uran
ce a
nd R
eal
130,
465
8.0
597,
540
10.7
19.7
709,
316
10.8
18.7
841,
369
11.1
18.6
e
stat
e et
c.
11.
Ow
ners
hip
of D
wel
lings
68
,371
4.2
171,
871
3.1
6.4
189,
269
2.9
10.1
21
2,12
92.
812
.1
Gov
ernm
ent S
ervi
ces(
12,1
3,14
)13
9,09
48.
550
0,54
78.
912
.353
2,45
58.
16.
457
0,97
37.
57.
212
. Pub
lic A
dmin
istr
atio
n &
Def
ence
,
com
puls
ory
Soci
al S
ecur
ity e
tc.
93,5
895.
734
7,52
86.
29.
236
3,50
25.
64.
639
8,07
15.
29.
513
.Edu
catio
n25
,395
1.6
95,0
01
1.
72.
610
4,64
7
1.
610
.210
3,02
5
1.
4-1
.614
. Hea
lth &
Soc
ial w
ork
20,1
10
1.
258
,019
1.0
67.4
64,3
06
1.
010
.869
,878
0.
98.
715
. Pri
vate
Ser
vice
s39
,691
2.4
127,
393
2.
318
.814
3,55
1
2.
212
.716
5,73
6
2.
215
.5
Tot
al1,
636,
037
5,60
4,10
4
15
.96,
544,
009
16
.87,
582,
376
15
.9G
ross
Dom
estic
Pro
duct
1,63
6,03
710
0.0
5,60
4,10
410
0.0
15.9
6,54
4,00
910
0.0
16.8
7,58
2,37
610
0.0
15.9
@ P
rovi
sion
al
S
ourc
e : D
epar
tmen
t of C
ensu
s & S
tatis
tics
2010
2012
@
TA
BL
E 2
- G
RO
SS D
OM
EST
IC P
RO
DU
CT
BY
IND
UST
RIA
L O
RIG
IN A
T C
UR
RE
NT
PR
OD
UC
ER
PR
ICE
S
A
ND
TH
E P
ER
CE
NT
AG
E C
ON
TR
IBU
TIO
N O
F M
AJO
R E
CO
NO
MIC
AC
TIV
ITIE
S T
O G
DP
2011
2002
M
ajor
Div
isio
ns
45
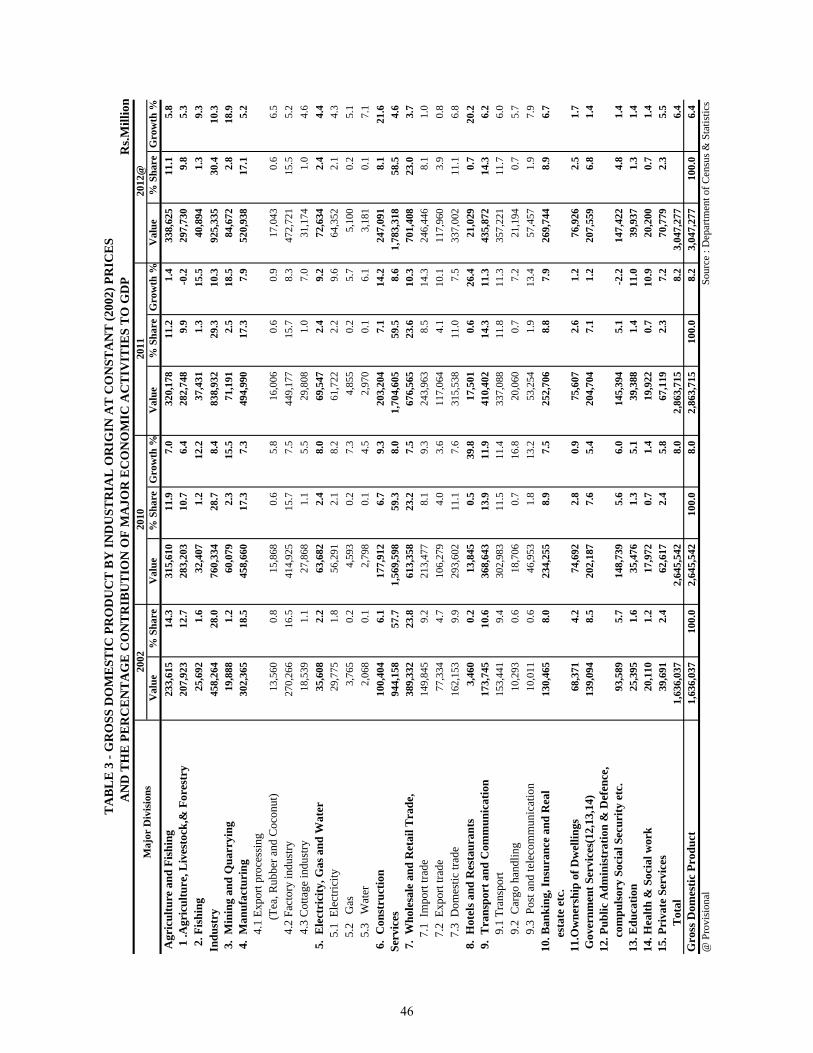
Rs.M
illio
n
Val
ue%
Sha
reV
alue
% S
hare
Gro
wth
%V
alue
% S
hare
Gro
wth
%V
alue
% S
hare
Gro
wth
% A
gric
ultu
re a
nd F
ishi
ng23
3,61
514
.331
5,61
011
.97.
032
0,17
811
.21.
433
8,62
511
.15.
8 1
.Agr
icul
ture
, Liv
esto
ck,&
For
estr
y20
7,92
312
.728
3,20
310
.76.
428
2,74
89.
9-0
.229
7,73
09.
85.
3 2
. Fis
hing
25,6
921.
632
,407
1.2
12.2
37,4
311.
315
.540
,894
1.3
9.3
Indu
stry
458,
264
28.0
760,
334
28.7
8.4
838,
932
29.3
10.3
925,
335
30.4
10.3
3.
Min
ing
and
Qua
rryi
ng19
,888
1.2
60,0
792.
315
.571
,191
2.5
18.5
84,6
722.
818
.9 4
. M
anuf
actu
ring
302,
365
18.5
458,
660
17.3
7.3
494,
990
17.3
7.9
520,
938
17.1
5.2
4.1
Expo
rt pr
oces
sing
(
Tea,
Rub
ber a
nd C
ocon
ut)
13,5
600.
815
,868
0.6
5.8
16,0
060.
60.
917
,043
0.6
6.5
4.2
Fact
ory
indu
stry
270,
266
16.5
414,
925
15.7
7.5
449,
177
15.7
8.3
472,
721
15.5
5.2
4.3
Cot
tage
indu
stry
18,5
391.
127
,868
1.1
5.5
29,8
081.
07.
031
,174
1.0
4.6
5.
Ele
ctri
city
, Gas
and
Wat
er35
,608
2.2
63,6
822.
48.
069
,547
2.4
9.2
72,6
342.
44.
4
5.1
Ele
ctric
ity29
,775
1.8
56,2
912.
18.
261
,722
2.2
9.6
64,3
522.
14.
3
5.2
G
as3,
765
0.2
4,59
30.
27.
34,
855
0.2
5.7
5,10
00.
25.
1
5.3
W
ater
2,06
80.
12,
798
0.1
4.5
2,97
00.
16.
13,
181
0.1
7.1
6.
Con
stru
ctio
n10
0,40
46.
117
7,91
26.
79.
320
3,20
47.
114
.224
7,09
18.
121
.6Se
rvic
es94
4,15
857
.71,
569,
598
59.3
8.0
1,70
4,60
559
.58.
61,
783,
318
58.5
4.6
7.
Who
lesa
le a
nd R
etai
l Tra
de,
389,
332
23.8
613,
358
23.2
7.5
676,
565
23.6
10.3
701,
408
23.0
3.7
7
.1 I
mpo
rt tra
de14
9,84
59.
221
3,47
78.
19.
324
3,96
38.
514
.324
6,44
68.
11.
0
7.2
Exp
ort t
rade
77,3
344.
710
6,27
94.
03.
611
7,06
44.
110
.111
7,96
03.
90.
8
7.3
Dom
estic
trad
e
162,
153
9.9
293,
602
11.1
7.6
315,
538
11.0
7.5
337,
002
11.1
6.8
8.
Hot
els a
nd R
esta
uran
ts
3,46
00.
213
,845
0.5
39.8
17,5
010.
626
.421
,029
0.7
20.2
9.
Tra
nspo
rt a
nd C
omm
unic
atio
n17
3,74
510
.636
8,64
313
.911
.941
0,40
214
.311
.343
5,87
214
.36.
2
9.
1 Tr
ansp
ort
153,
441
9.4
302,
983
11.5
11.4
337,
088
11.8
11.3
357,
221
11.7
6.0
9.2
Car
go h
andl
ing
10,2
930.
618
,706
0.7
16.8
20,0
600.
77.
221
,194
0.7
5.7
9.3
Pos
t and
tele
com
mun
icat
ion
10,0
110.
646
,953
1.8
13.2
53,2
541.
913
.457
,457
1.9
7.9
10. B
anki
ng, I
nsur
ance
and
Rea
l13
0,46
58.
023
4,25
58.
97.
525
2,70
68.
87.
926
9,74
48.
96.
7
est
ate
etc.
11
.Ow
ners
hip
of D
wel
lings
68
,371
4.2
74,6
922.
80.
975
,607
2.6
1.2
76,9
262.
51.
7 G
over
nmen
t Ser
vice
s(12
,13,
14)
139,
094
8.5
202,
187
7.6
5.4
204,
704
7.1
1.2
207,
559
6.8
1.4
12. P
ublic
Adm
inis
trat
ion
& D
efen
ce,
c
ompu
lsor
y So
cial
Sec
urity
etc
.93
,589
5.7
148,
739
5.6
6.0
145,
394
5.1
-2.2
147,
422
4.8
1.4
13. E
duca
tion
25,3
951.
635
,476
1.3
5.1
39,3
881.
411
.039
,937
1.3
1.4
14. H
ealth
& S
ocia
l wor
k20
,110
1.2
17,9
72
0.
71.
419
,922
0.7
10.9
20,2
00
0.7
1.4
15. P
riva
te S
ervi
ces
39,6
912.
462
,617
2.4
5.8
67,1
192.
37.
270
,779
2.3
5.5
T
otal
1,63
6,03
72,
645,
542
8.0
2,86
3,71
58.
23,
047,
277
6.4
Gro
ss D
omes
tic P
rodu
ct1,
636,
037
100.
02,
645,
542
100.
08.
02,
863,
715
100.
08.
23,
047,
277
100.
06.
4@
Pro
visi
onal
Sou
rce
: Dep
artm
ent o
f Cen
sus &
Sta
tistic
s
2012
@
TA
BL
E 3
- G
RO
SS D
OM
EST
IC P
RO
DU
CT
BY
IND
UST
RIA
L O
RIG
IN A
T C
ON
STA
NT
(200
2) P
RIC
ES
A
ND
TH
E P
ER
CE
NT
AG
E C
ON
TR
IBU
TIO
N O
F M
AJO
R E
CO
NO
MIC
AC
TIV
ITIE
S T
O G
DP
20
11
Maj
or D
ivis
ions
2002
2010
46
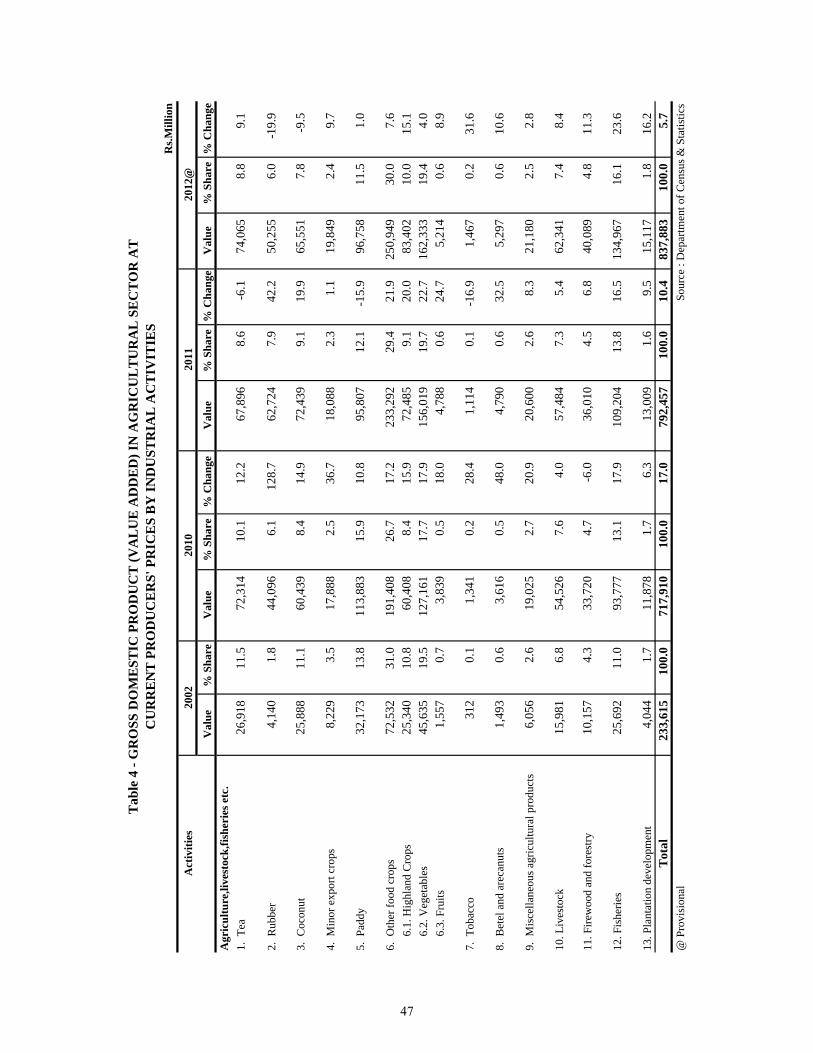
Rs.M
illio
n
Act
iviti
es
Val
ue %
Sha
reV
alue
% S
hare
% C
hang
eV
alue
% S
hare
% C
hang
eV
alue
% S
hare
% C
hang
eA
gric
ultu
re,li
vest
ock,
fishe
ries
etc
.1.
Tea
26,9
1811
.572
,314
10.1
12.2
67,8
968.
6-6
.174
,065
8.8
9.1
2. R
ubbe
r4,
140
1.8
44,0
966.
112
8.7
62,7
247.
942
.250
,255
6.0
-19.
9
3. C
ocon
ut25
,888
11.1
60,4
398.
414
.972
,439
9.1
19.9
65,5
517.
8-9
.5
4. M
inor
exp
ort c
rops
8,22
93.
517
,888
2.5
36.7
18,0
882.
31.
119
,849
2.4
9.7
5. P
addy
32,1
7313
.811
3,88
315
.910
.895
,807
12.1
-15.
996
,758
11.5
1.0
6. O
ther
food
cro
ps72
,532
31.0
191,
408
26.7
17.2
233,
292
29.4
21.9
250,
949
30.0
7.6
6
.1. H
ighl
and
Cro
ps25
,340
10.8
60,4
088.
415
.972
,485
9.1
20.0
83,4
0210
.015
.1
6.2
. Veg
etab
les
45,6
3519
.512
7,16
117
.717
.915
6,01
919
.722
.716
2,33
319
.44.
0
6.3
. Fru
its1,
557
0.7
3,83
90.
518
.04,
788
0.6
24.7
5,21
40.
68.
9
7. T
obac
co31
20.
11,
341
0.2
28.4
1,11
40.
1-1
6.9
1,46
70.
231
.6
8. B
etel
and
are
canu
ts1,
493
0.6
3,61
60.
548
.04,
790
0.6
32.5
5,29
70.
610
.6
9. M
isce
llane
ous a
gric
ultu
ral p
rodu
cts
6,05
62.
619
,025
2.7
20.9
20,6
002.
68.
321
,180
2.5
2.8
10. L
ives
tock
15,9
816.
854
,526
7.6
4.0
57,4
847.
35.
462
,341
7.4
8.4
11. F
irew
ood
and
fore
stry
10,1
574.
333
,720
4.7
-6.0
36,0
104.
56.
840
,089
4.8
11.3
12. F
ishe
ries
25,6
9211
.093
,777
13.1
17.9
109,
204
13.8
16.5
134,
967
16.1
23.6
13. P
lant
atio
n de
velo
pmen
t4,
044
1.7
11,8
781.
76.
313
,009
1.6
9.5
15,1
171.
816
.2T
otal
233,
615
100.
071
7,91
010
0.0
17.0
792,
457
100.
010
.483
7,88
310
0.0
5.7
@ P
rovi
sion
al
S
ourc
e : D
epar
tmen
t of C
ensu
s & S
tatis
tics
Tab
le 4
- G
RO
SS D
OM
EST
IC P
RO
DU
CT
(VA
LU
E A
DD
ED
) IN
AG
RIC
UL
TU
RA
L S
EC
TO
R A
T
2010
CU
RR
EN
T P
RO
DU
CE
RS'
PR
ICE
S B
Y IN
DU
STR
IAL
AC
TIV
ITIE
S
2002
2012
@20
11
47
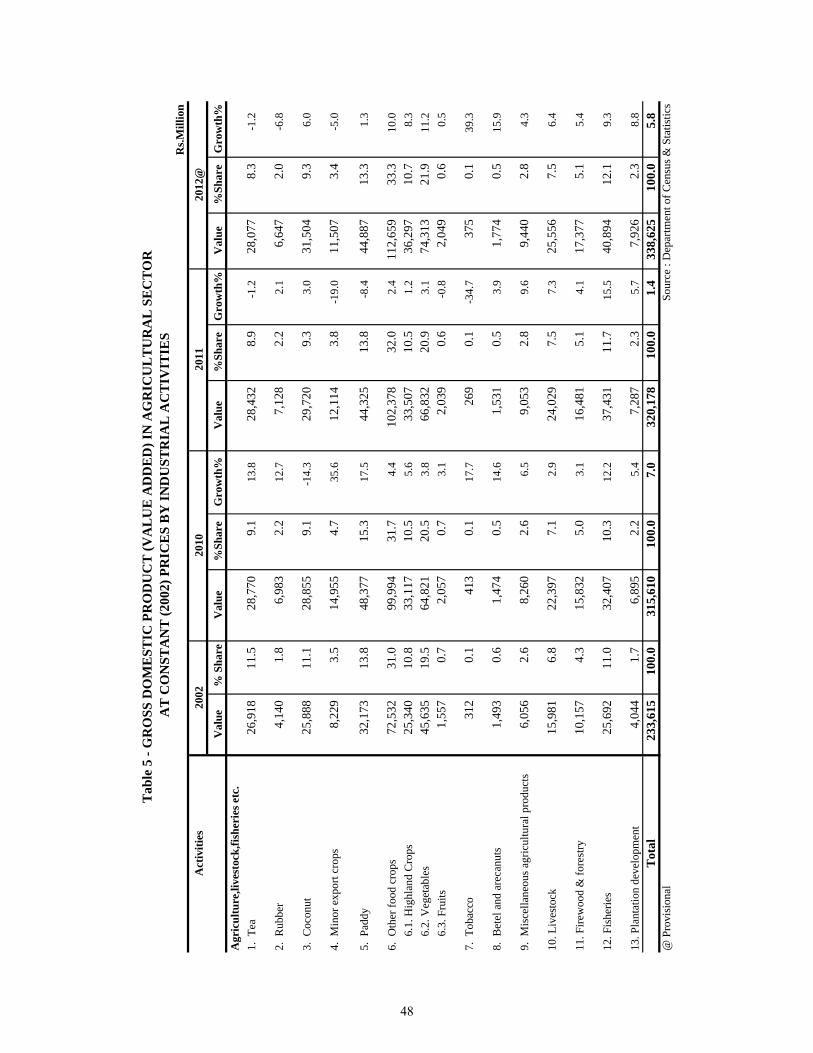
Rs.M
illio
n
Act
iviti
es
Val
ue %
Sha
reV
alue
%Sh
are
Gro
wth
%V
alue
%Sh
are
Gro
wth
%V
alue
%Sh
are
Gro
wth
%A
gric
ultu
re,li
vest
ock,
fishe
ries
etc
.1.
Tea
26,9
1811
.528
,770
9.1
13.8
28,4
328.
9-1
.228
,077
8.3
-1.2
2. R
ubbe
r4,
140
1.8
6,98
32.
212
.77,
128
2.2
2.1
6,64
72.
0-6
.8
3. C
ocon
ut25
,888
11.1
28,8
559.
1-1
4.3
29,7
209.
33.
031
,504
9.3
6.0
4. M
inor
exp
ort c
rops
8,22
93.
514
,955
4.7
35.6
12,1
143.
8-1
9.0
11,5
073.
4-5
.0
5. P
addy
32,1
7313
.848
,377
15.3
17.5
44,3
2513
.8-8
.444
,887
13.3
1.3
6. O
ther
food
cro
ps72
,532
31.0
99,9
9431
.74.
410
2,37
832
.02.
411
2,65
933
.310
.0
6.1
. Hig
hlan
d C
rops
25,3
4010
.833
,117
10.5
5.6
33,5
0710
.51.
236
,297
10.7
8.3
6
.2. V
eget
able
s45
,635
19.5
64,8
2120
.53.
866
,832
20.9
3.1
74,3
1321
.911
.2
6.3
. Fru
its1,
557
0.7
2,05
70.
73.
12,
039
0.6
-0.8
2,04
90.
60.
5
7. T
obac
co31
20.
141
30.
117
.726
90.
1-3
4.7
375
0.1
39.3
8. B
etel
and
are
canu
ts1,
493
0.6
1,47
40.
514
.61,
531
0.5
3.9
1,77
40.
515
.9
9. M
isce
llane
ous a
gric
ultu
ral p
rodu
cts
6,05
62.
68,
260
2.6
6.5
9,05
32.
89.
69,
440
2.8
4.3
10. L
ives
tock
15,9
816.
822
,397
7.1
2.9
24,0
297.
57.
325
,556
7.5
6.4
11. F
irew
ood
& fo
rest
ry10
,157
4.3
15,8
325.
03.
116
,481
5.1
4.1
17,3
775.
15.
4
12. F
ishe
ries
25,6
9211
.032
,407
10.3
12.2
37,4
3111
.715
.540
,894
12.1
9.3
13. P
lant
atio
n de
velo
pmen
t4,
044
1.7
6,89
52.
25.
47,
287
2.3
5.7
7,92
62.
38.
8T
otal
233,
615
100.
031
5,61
010
0.0
7.0
320,
178
100.
01.
433
8,62
510
0.0
5.8
@ P
rovi
sion
al
S
ourc
e : D
epar
tmen
t of C
ensu
s & S
tatis
tics
Tab
le 5
- G
RO
SS D
OM
EST
IC P
RO
DU
CT
(VA
LU
E A
DD
ED
) IN
AG
RIC
UL
TU
RA
L S
EC
TO
R
2010
2002
AT
CO
NST
AN
T (2
002)
PR
ICE
S B
Y IN
DU
STR
IAL
AC
TIV
ITIE
S
2012
@20
11
48
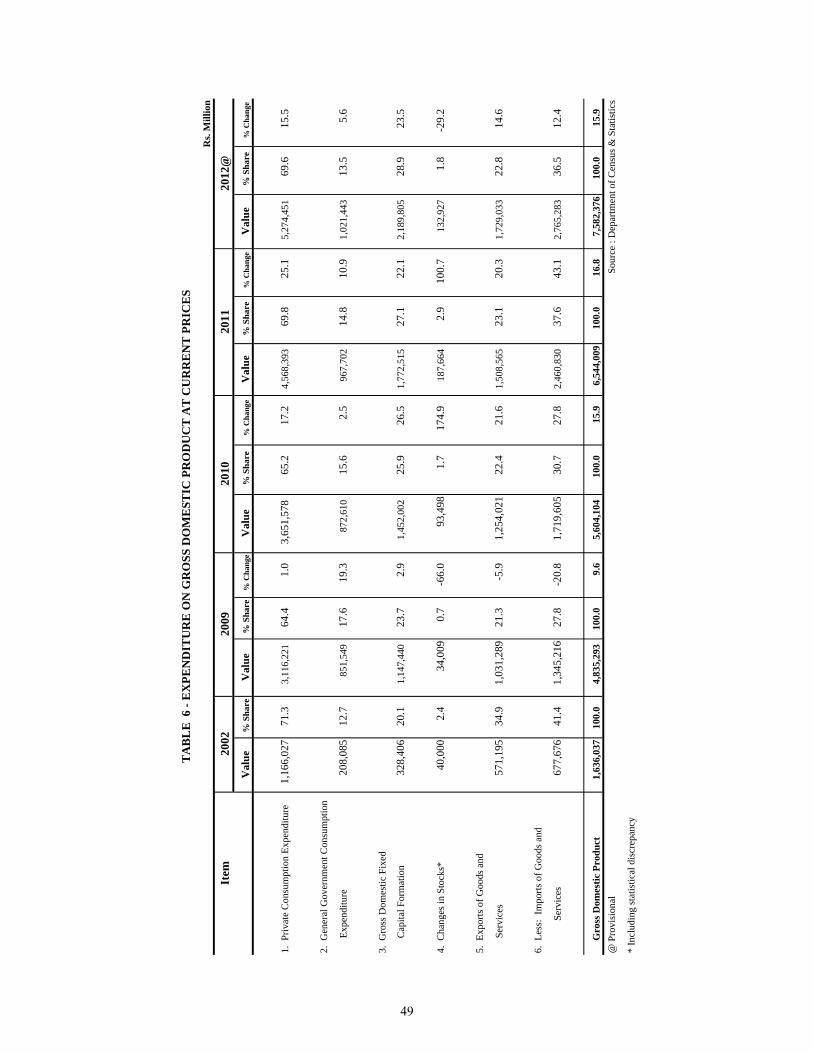
Item
Val
ue %
Sha
reV
alue
% S
hare
% C
hang
eV
alue
% S
hare
% C
hang
eV
alue
% S
hare
% C
hang
eV
alue
% S
hare
% C
hang
e
1. P
rivat
e C
onsu
mpt
ion
Expe
nditu
re1,
166,
027
71.3
3,11
6,22
1
64.4
1.0
3,65
1,57
865
.217
.24,
568,
393
69
.825
.15,
274,
451
69
.615
.5
2. G
ener
al G
over
nmen
t Con
sum
ptio
n
Expe
nditu
re20
8,08
512
.785
1,54
9
17.6
19.3
872,
610
15
.62.
596
7,70
2
14
.810
.91,
021,
443
13
.55.
6
3. G
ross
Dom
estic
Fix
ed
Cap
ital F
orm
atio
n32
8,40
620
.11,
147,
440
23
.72.
91,
452,
002
25.9
26.5
1,77
2,51
5
27.1
22.1
2,18
9,80
5
28.9
23.5
4. C
hang
es in
Sto
cks*
40,0
002.
434
,009
0.7
-66.
093
,498
1.7
174.
918
7,66
4
2.
910
0.7
132,
927
1.8
-29.
2
5. E
xpor
ts o
f Goo
ds a
nd
Serv
ices
571,
195
34.9
1,03
1,28
921
.3-5
.91,
254,
021
22.4
21.6
1,50
8,56
5
23.1
20.3
1,72
9,03
3
22.8
14.6
6. L
ess:
Im
ports
of G
oods
and
Ser
vice
s67
7,67
641
.41,
345,
216
27.8
-20.
81,
719,
605
30.7
27.8
2,46
0,83
0
37.6
43.1
2,76
5,28
3
36.5
12.4
G
ross
Dom
estic
Pro
duct
1,63
6,03
710
0.0
4,83
5,29
3
100.
09.
65,
604,
104
100.
015
.96,
544,
009
100.
016
.87,
582,
376
100.
015
.9@
Pro
visi
onal
S
ourc
e : D
epar
tmen
t of C
ensu
s & S
tatis
tics
* In
clud
ing
stat
istic
al d
iscr
epan
cy
2012
@
TA
BL
E 6
- E
XPE
ND
ITU
RE
ON
GR
OSS
DO
ME
STIC
PR
OD
UC
T A
T C
UR
RE
NT
PR
ICE
S
2010
2002
2011
2009
Rs.
Mill
ion
49
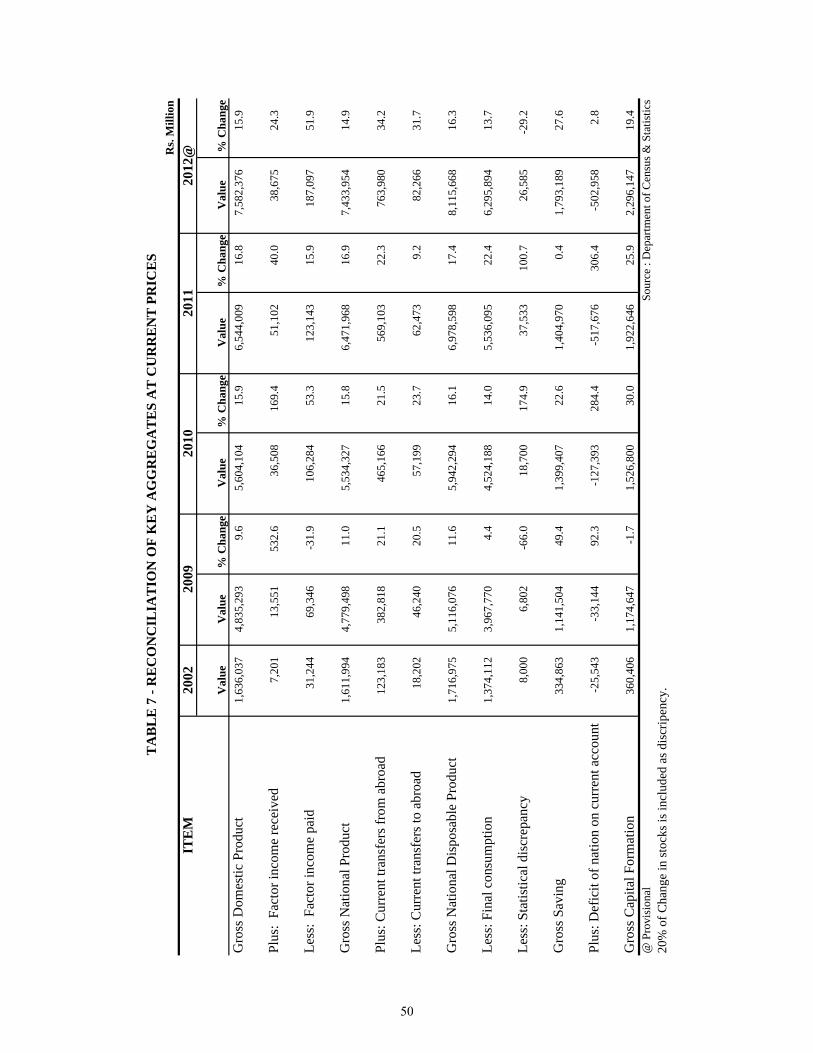
Rs.
Mill
ion
ITE
M
Val
ueV
alue
% C
hang
eV
alue
% C
hang
eV
alue
% C
hang
eV
alue
% C
hang
eG
ross
Dom
estic
Pro
duct
1,63
6,03
74,
835,
293
9.6
5,60
4,10
415
.96,
544,
009
16.8
7,58
2,37
615
.9
Plus
: Fa
ctor
inco
me
rece
ived
7,20
113
,551
532.
636
,508
169.
451
,102
40.0
38,6
7524
.3
Less
: Fa
ctor
inco
me
paid
31,2
4469
,346
-31.
910
6,28
453
.312
3,14
315
.918
7,09
751
.9
Gro
ss N
atio
nal P
rodu
ct1,
611,
994
4,77
9,49
811
.05,
534,
327
15.8
6,47
1,96
816
.97,
433,
954
14.9
Plus
: Cur
rent
tran
sfer
s fro
m a
broa
d12
3,18
338
2,81
821
.146
5,16
621
.556
9,10
322
.376
3,98
034
.2
Less
: Cur
rent
tran
sfer
s to
abro
ad18
,202
46,2
4020
.557
,199
23.7
62,4
739.
282
,266
31.7
Gro
ss N
atio
nal D
ispo
sabl
e Pr
oduc
t1,
716,
975
5,11
6,07
611
.65,
942,
294
16.1
6,97
8,59
817
.48,
115,
668
16.3
Less
: Fin
al c
onsu
mpt
ion
1,37
4,11
23,
967,
770
4.4
4,52
4,18
814
.05,
536,
095
22.4
6,29
5,89
413
.7
Less
: Sta
tistic
al d
iscr
epan
cy8,
000
6,80
2-6
6.0
18,7
0017
4.9
37,5
3310
0.7
26,5
85-2
9.2
Gro
ss S
avin
g33
4,86
31,
141,
504
49.4
1,39
9,40
722
.61,
404,
970
0.4
1,79
3,18
927
.6
Plus
: Def
icit
of n
atio
n on
cur
rent
acc
ount
-25,
543
-33,
144
92.3
-127
,393
284.
4-5
17,6
7630
6.4
-502
,958
2.8
Gro
ss C
apita
l For
mat
ion
360,
406
1,17
4,64
7-1
.71,
526,
800
30.0
1,92
2,64
625
.92,
296,
147
19.4
@ P
rovi
sion
al
S
ourc
e : D
epar
tmen
t of C
ensu
s & S
tatis
tics
20%
of C
hang
e in
stoc
ks is
incl
uded
as d
iscr
ipen
cy.
2012
@
TA
BL
E 7
- R
EC
ON
CIL
IAT
ION
OF
KE
Y A
GG
RE
GA
TE
S A
T C
UR
RE
NT
PR
ICE
S
2011
2010
2009
2002
50
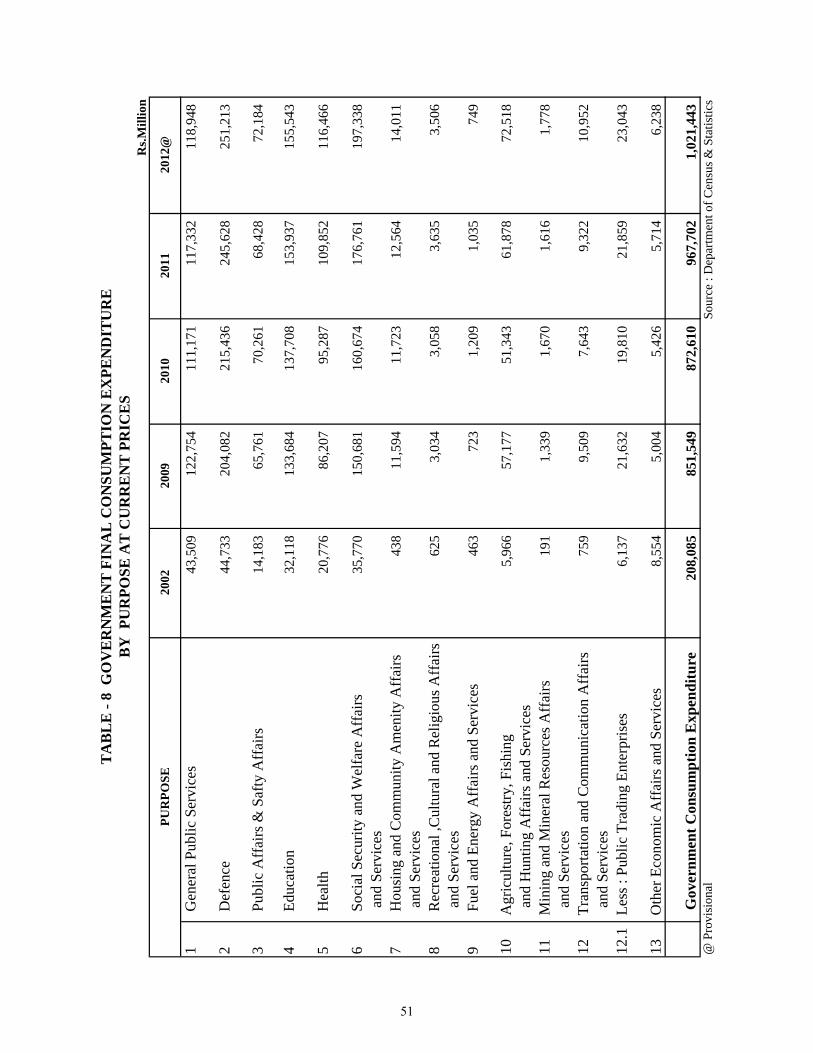
Rs.M
illio
n
1 G
ener
al P
ublic
Ser
vice
s43
,509
12
2,75
4
11
1,17
1
11
7,33
2
11
8,94
8
2 D
efen
ce44
,733
20
4,08
2
21
5,43
6
24
5,62
8
25
1,21
3
3 P
ublic
Aff
airs
& S
afty
Aff
airs
14,1
83
65,7
61
70
,261
68
,428
72
,184
4 E
duca
tion
32,1
18
133,
684
137,
708
153,
937
155,
543
5 H
ealth
20,7
76
86,2
07
95
,287
10
9,85
2
11
6,46
6
6 S
ocia
l Sec
urity
and
Wel
fare
Aff
airs
35
,770
15
0,68
1
16
0,67
4
17
6,76
1
19
7,33
8
an
d Se
rvic
es7
Hou
sing
and
Com
mun
ity A
men
ity A
ffai
rs
438
11
,594
11,7
23
12,5
64
14,0
11
and
Serv
ices
8 R
ecre
atio
nal ,
Cul
tura
l and
Rel
igio
us A
ffai
rs
625
3,
034
3,
058
3,
635
3,
506
an
d Se
rvic
es9
Fue
l and
Ene
rgy
Aff
airs
and
Ser
vice
s46
3
723
1,20
9
1,03
5
749
10 A
gric
ultu
re, F
ores
try, F
ishi
ng
5,96
6
57
,177
51,3
43
61,8
78
72,5
18
and
Hun
ting
Aff
airs
and
Ser
vice
s11
Min
ing
and
Min
eral
Res
ourc
es A
ffai
rs
191
1,
339
1,
670
1,
616
1,
778
an
d Se
rvic
es12
Tra
nspo
rtatio
n an
d C
omm
unic
atio
n A
ffai
rs
759
9,
509
7,
643
9,
322
10
,952
an
d Se
rvic
es12
.1 L
ess :
Pub
lic T
radi
ng E
nter
pris
es6,
137
21,6
32
19
,810
21
,859
23
,043
13 O
ther
Eco
nom
ic A
ffai
rs a
nd S
ervi
ces
8,55
4
5,
004
5,
426
5,
714
6,
238
Gov
ernm
ent C
onsu
mpt
ion
Exp
endi
ture
20
8,08
5
85
1,54
9
87
2,61
0
96
7,70
2
1,
021,
443
Sou
rce
: Dep
artm
ent o
f Cen
sus &
Sta
tistic
s
PUR
POSE
2002
2009
@ P
rovi
sion
al
2010
2012
@
TA
BL
E -
8 G
OV
ER
NM
EN
T F
INA
L C
ON
SUM
PTIO
N E
XPE
ND
ITU
RE
BY
PU
RPO
SE A
T C
UR
RE
NT
PR
ICE
S
2011
51
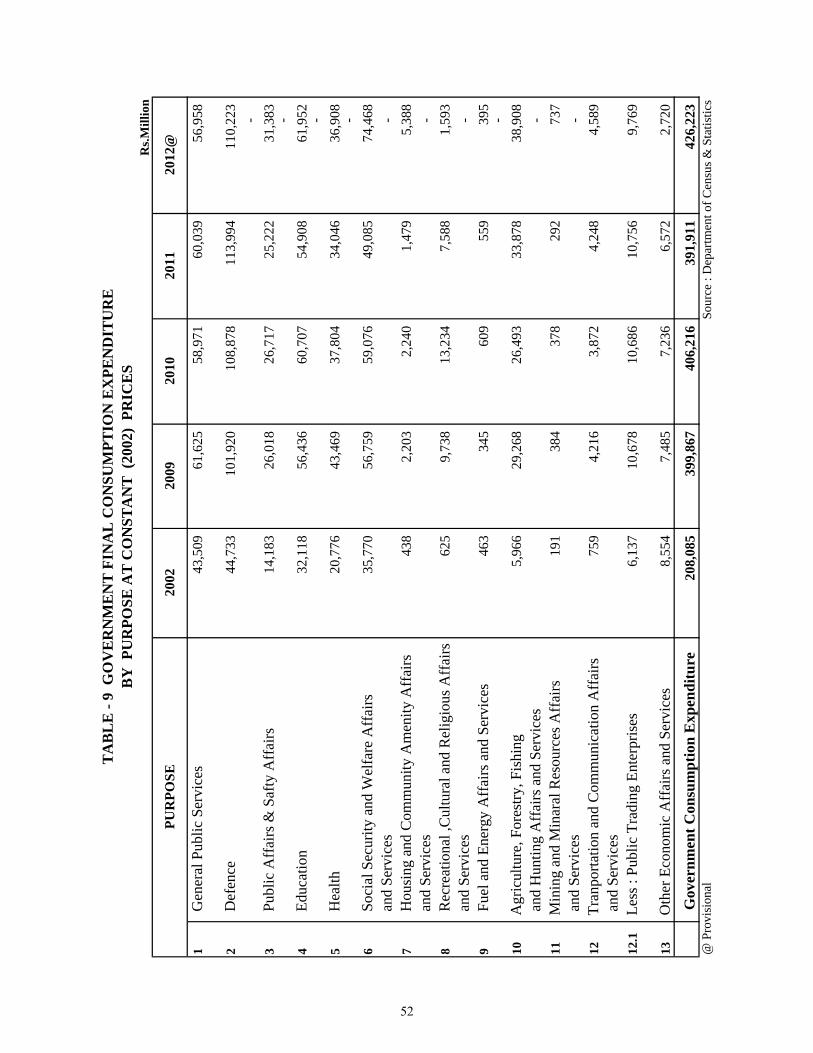
Rs.M
illio
n
1 G
ener
al P
ublic
Ser
vice
s43
,509
61,6
25
58,9
71
60
,039
56,9
58
2 D
efen
ce44
,733
101,
920
10
8,87
8
113,
994
11
0,22
3
-
3 P
ublic
Aff
airs
& S
afty
Aff
airs
14,1
83
26
,018
26
,717
25,2
22
31
,383
-
4 E
duca
tion
32,1
18
56
,436
60
,707
54,9
08
61
,952
-
5 H
ealth
20,7
76
43
,469
37
,804
34,0
46
36
,908
-
6 S
ocia
l Sec
urity
and
Wel
fare
Aff
airs
35
,770
56,7
59
59,0
76
49
,085
74,4
68
and
Ser
vice
s-
7 H
ousi
ng a
nd C
omm
unity
Am
enity
Aff
airs
43
8
2,
203
2,24
0
1,
479
5,38
8
and
Ser
vice
s-
8 R
ecre
atio
nal ,
Cul
tura
l and
Rel
igio
us A
ffai
rs
625
9,73
8
13
,234
7,58
8
1,
593
a
nd S
ervi
ces
-
9
Fue
l and
Ene
rgy
Aff
airs
and
Ser
vice
s46
3
34
5
609
55
9
395
-
10
Agr
icul
ture
, For
estry
, Fis
hing
5,
966
29
,268
26
,493
33,8
78
38
,908
a
nd H
untin
g A
ffai
rs a
nd S
ervi
ces
-
11
Min
ing
and
Min
aral
Res
ourc
es A
ffai
rs
191
384
37
8
292
73
7
a
nd S
ervi
ces
-
12
Tra
npor
tatio
n an
d C
omm
unic
atio
n A
ffai
rs
759
4,21
6
3,
872
4,24
8
4,
589
a
nd S
ervi
ces
12.1
Les
s : P
ublic
Tra
ding
Ent
erpr
ises
6,13
7
10,6
78
10,6
86
10
,756
9,76
9
13 O
ther
Eco
nom
ic A
ffai
rs a
nd S
ervi
ces
8,55
4
7,48
5
7,
236
6,57
2
2,
720
Gov
ernm
ent C
onsu
mpt
ion
Exp
endi
ture
20
8,08
5
399,
867
40
6,21
6
391,
911
42
6,22
3
S
ourc
e : D
epar
tmen
t of C
ensu
s & S
tatis
tics
2010
@ P
rovi
sion
al
2002
PUR
POSE
2012
@
TA
BL
E -
9 G
OV
ER
NM
EN
T F
INA
L C
ON
SUM
PTIO
N E
XPE
ND
ITU
RE
BY
PU
RPO
SE A
T C
ON
STA
NT
(20
02)
PRIC
ES
2009
2011
52
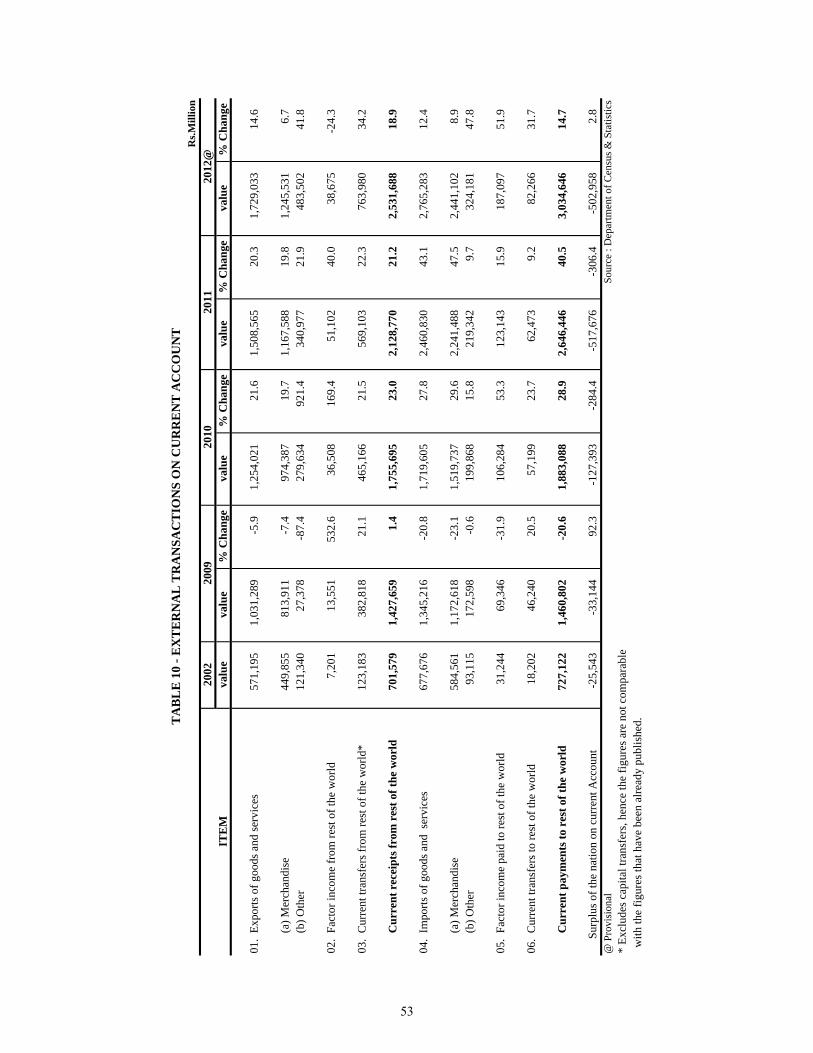
Rs.M
illio
n
valu
eva
lue
% C
hang
eva
lue
% C
hang
eva
lue
% C
hang
eva
lue
% C
hang
e
01.
Expo
rts o
f goo
ds a
nd se
rvic
es57
1,19
51,
031,
289
-5.9
1,25
4,02
121
.61,
508,
565
20.3
1,72
9,03
314
.6
(a) M
erch
andi
se44
9,85
581
3,91
1-7
.497
4,38
719
.71,
167,
588
19.8
1,24
5,53
16.
7
(b
) Oth
er12
1,34
027
,378
-87.
427
9,63
492
1.4
340,
977
21.9
483,
502
41.8
02.
Fact
or in
com
e fr
om re
st o
f the
wor
ld7,
201
13,5
5153
2.6
36,5
0816
9.4
51,1
0240
.038
,675
-24.
3
03.
Cur
rent
tran
sfer
s fro
m re
st o
f the
wor
ld*
123,
183
382,
818
21.1
465,
166
21.5
569,
103
22.3
763,
980
34.2
Cur
rent
rec
eipt
s fro
m r
est o
f the
wor
ld70
1,57
91,
427,
659
1.4
1,75
5,69
523
.02,
128,
770
21.2
2,53
1,68
818
.9
04.
Impo
rts o
f goo
ds a
nd s
ervi
ces
677,
676
1,34
5,21
6-2
0.8
1,71
9,60
527
.82,
460,
830
43.1
2,76
5,28
312
.4
(a) M
erch
andi
se58
4,56
11,
172,
618
-23.
11,
519,
737
29.6
2,24
1,48
847
.52,
441,
102
8.9
(b) O
ther
93,1
1517
2,59
8-0
.619
9,86
815
.821
9,34
29.
732
4,18
147
.8
05.
Fact
or in
com
e pa
id to
rest
of t
he w
orld
31,2
4469
,346
-31.
910
6,28
453
.312
3,14
315
.918
7,09
751
.9
06.
Cur
rent
tran
sfer
s to
rest
of t
he w
orld
18,2
0246
,240
20.5
57,1
9923
.762
,473
9.2
82,2
6631
.7
Cur
rent
pay
men
ts to
res
t of t
he w
orld
727,
122
1,46
0,80
2-2
0.6
1,88
3,08
828
.92,
646,
446
40.5
3,03
4,64
614
.7
S
urpl
us o
f the
nat
ion
on c
urre
nt A
ccou
nt-2
5,54
3-3
3,14
492
.3-1
27,3
93-2
84.4
-517
,676
-306
.4-5
02,9
582.
8@
Pro
visi
onal
Sou
rce
: Dep
artm
ent o
f Cen
sus &
Sta
tistic
s*
Excl
udes
cap
ital t
rans
fers
, hen
ce th
e fig
ures
are
not
com
para
ble
with
the
figur
es th
at h
ave
been
alre
ady
publ
ishe
d.
2002
ITE
M
TA
BL
E 1
0 - E
XT
ER
NA
L T
RA
NSA
CT
ION
S O
N C
UR
RE
NT
AC
CO
UN
T
2012
@20
1120
1020
09
53
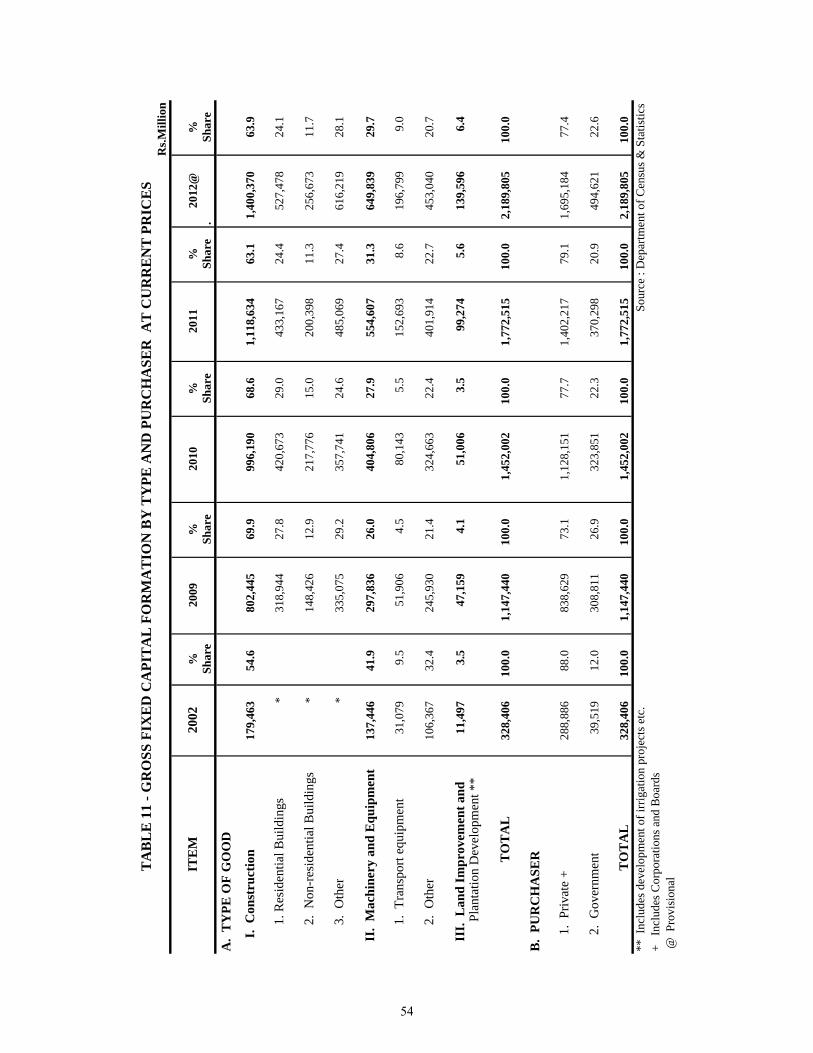
ITE
M20
02%
2009
%20
10%
2011
%20
12@
%Sh
are
Shar
eSh
are
Shar
e.
Shar
e
A.
TY
PE O
F G
OO
D
I.
Con
stru
ctio
n17
9,46
354
.680
2,44
569
.999
6,19
068
.61,
118,
634
63.1
1,40
0,37
063
.9
1. R
esid
entia
l Bui
ldin
gs*
318,
944
27.8
420,
673
29.0
433,
167
24.4
527,
478
24.1
2.
Non
-res
iden
tial B
uild
ings
*14
8,42
612
.921
7,77
615
.020
0,39
811
.325
6,67
311
.7
3.
Oth
er*
335,
075
29.2
357,
741
24.6
485,
069
27.4
616,
219
28.1
II
. M
achi
nery
and
Equ
ipm
ent
137,
446
41.9
297,
836
26.0
404,
806
27.9
554,
607
31.3
649,
839
29.7
1.
Tran
spor
t equ
ipm
ent
31,0
799.
551
,906
4.5
80,1
435.
515
2,69
38.
619
6,79
99.
0
2.
Oth
er10
6,36
732
.424
5,93
021
.432
4,66
322
.440
1,91
422
.745
3,04
020
.7
II
I. L
and
Impr
ovem
ent a
nd11
,497
3.5
47,1
594.
151
,006
3.5
99,2
745.
613
9,59
66.
4
Plan
tatio
n D
evel
opm
ent *
*
T
OT
AL
328,
406
100.
01,
147,
440
100.
01,
452,
002
100.
01,
772,
515
100.
02,
189,
805
100.
0
B.
PUR
CH
ASE
R
1
. Pr
ivat
e +
288,
886
88.0
838,
629
73.1
1,12
8,15
177
.71,
402,
217
79.1
1,69
5,18
477
.4
2
. G
over
nmen
t39
,519
12.0
308,
811
26.9
323,
851
22.3
370,
298
20.9
494,
621
22.6
T
OT
AL
328,
406
100.
01,
147,
440
100.
01,
452,
002
100.
01,
772,
515
100.
02,
189,
805
100.
0**
Inc
lude
s dev
elop
men
t of i
rrig
atio
n pr
ojec
ts e
tc.
Sou
rce
: Dep
artm
ent o
f Cen
sus &
Sta
tistic
s+
Inc
lude
s Cor
pora
tions
and
Boa
rds
@ P
rovi
sion
al
Rs.M
illio
nT
AB
LE
11
- GR
OSS
FIX
ED
CA
PIT
AL
FO
RM
AT
ION
BY
TY
PE A
ND
PU
RC
HA
SER
AT
CU
RR
EN
T P
RIC
ES
54
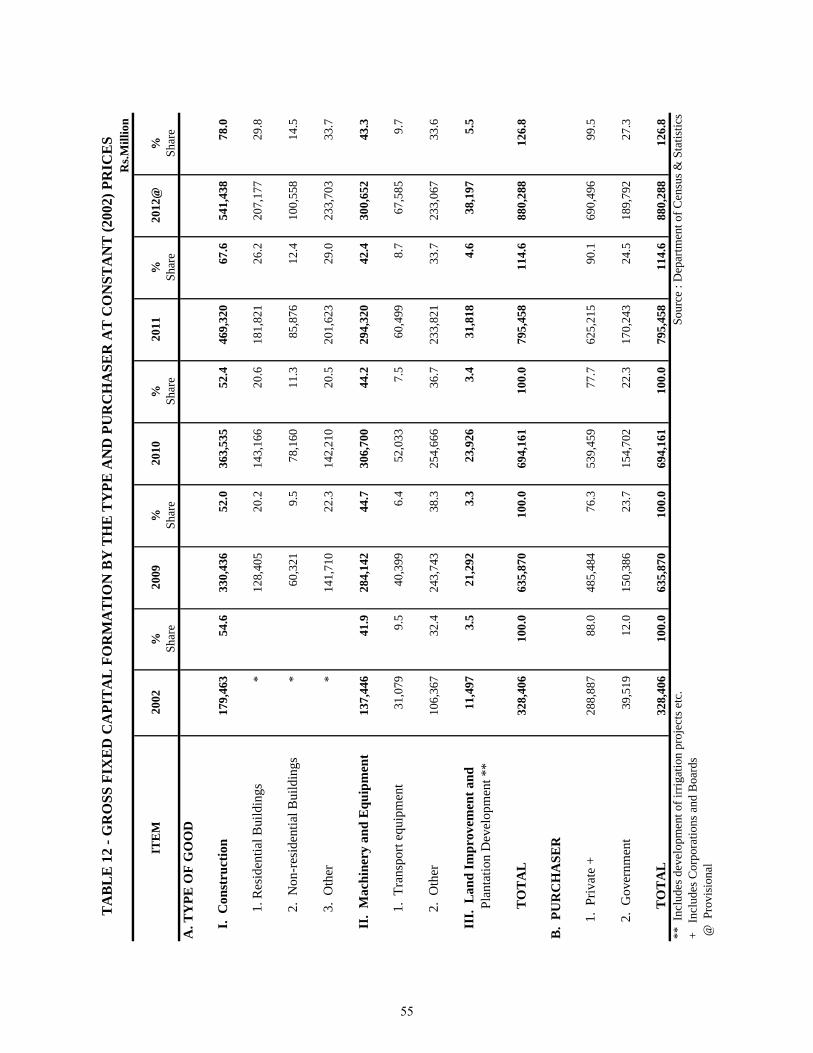
R
s.Mill
ion
ITE
M20
02%
2009
%20
10%
2011
%20
12@
%Sh
are
Shar
eSh
are
Shar
eSh
are
A. T
YPE
OF
GO
OD
I.
Con
stru
ctio
n17
9,46
3
54
.6
33
0,43
6
52
.0
36
3,53
5
52
.4
46
9,32
0
67
.6
54
1,43
8
78
.0
1. R
esid
entia
l Bui
ldin
gs*
128,
405
20.2
143,
166
20.6
181,
821
26.2
207,
177
29.8
2.
Non
-res
iden
tial B
uild
ings
*60
,321
9.5
78,1
60
11
.3
85
,876
12.4
100,
558
14.5
3.
Oth
er*
141,
710
22.3
142,
210
20.5
201,
623
29.0
233,
703
33.7
II
. M
achi
nery
and
Equ
ipm
ent
137,
446
41.9
284,
142
44.7
306,
700
44.2
294,
320
42.4
300,
652
43.3
1.
Tran
spor
t equ
ipm
ent
31,0
79
9.5
40,3
99
6.
4
52
,033
7.5
60,4
99
8.
7
67
,585
9.7
2.
Oth
er10
6,36
7
32
.4
24
3,74
3
38
.3
25
4,66
6
36
.7
23
3,82
1
33
.7
23
3,06
7
33
.6
II
I. L
and
Impr
ovem
ent a
nd11
,497
3.
5
21
,292
3.3
23,9
26
3.
4
31
,818
4.6
38,1
97
5.
5
Plan
tatio
n D
evel
opm
ent *
*
T
OT
AL
328,
406
100.
0
635,
870
100.
0
694,
161
100.
0
795,
458
114.
6
880,
288
126.
8
B.
PUR
CH
ASE
R
1
. Pr
ivat
e +
288,
887
88.0
485,
484
76.3
539,
459
77.7
625,
215
90.1
690,
496
99.5
2
. G
over
nmen
t39
,519
12
.0
15
0,38
6
23
.7
15
4,70
2
22
.3
17
0,24
3
24
.5
18
9,79
2
27
.3
T
OT
AL
328,
406
100.
0
635,
870
100.
0
694,
161
100.
0
795,
458
114.
6
880,
288
126.
8
** I
nclu
des d
evel
opm
ent o
f irr
igat
ion
proj
ects
etc
.
S
ourc
e : D
epar
tmen
t of C
ensu
s & S
tatis
tics
+ I
nclu
des C
orpo
ratio
ns a
nd B
oard
s @
Pro
visi
onal
TA
BL
E 1
2 - G
RO
SS F
IXE
D C
API
TA
L F
OR
MA
TIO
N B
Y T
HE
TY
PE A
ND
PU
RC
HA
SER
AT
CO
NST
AN
T (2
002)
PR
ICE
S
55
NATIONAL ACCOUNTS
FINAL ESTIMATES
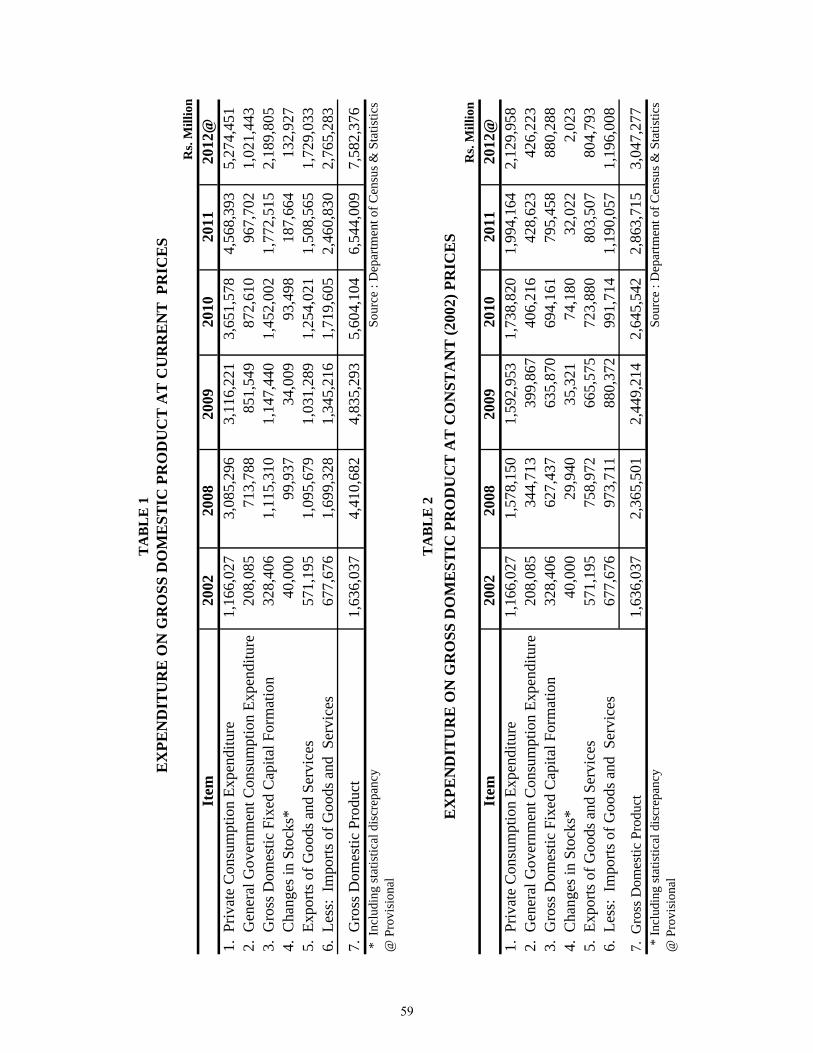
Rs.
Mill
ion
Item
2002
2008
2009
2010
2011
2012
@1.
Priv
ate
Con
sum
ptio
n Ex
pend
iture
1,16
6,02
73,
085,
296
3,11
6,22
13,
651,
578
4,56
8,39
35,
274,
451
2. G
ener
al G
over
nmen
t Con
sum
ptio
n Ex
pend
iture
208,
085
713,
788
851,
549
872,
610
967,
702
1,02
1,44
33.
Gro
ss D
omes
tic F
ixed
Cap
ital F
orm
atio
n32
8,40
61,
115,
310
1,14
7,44
01,
452,
002
1,77
2,51
52,
189,
805
4. C
hang
es in
Sto
cks*
40,0
0099
,937
34,0
0993
,498
187,
664
132,
927
5. E
xpor
ts o
f Goo
ds a
nd S
ervi
ces
571,
195
1,09
5,67
91,
031,
289
1,25
4,02
11,
508,
565
1,72
9,03
36.
Les
s: I
mpo
rts o
f Goo
ds a
nd S
ervi
ces
677,
676
1,69
9,32
81,
345,
216
1,71
9,60
52,
460,
830
2,76
5,28
3
7. G
ross
Dom
estic
Pro
duct
1,63
6,03
74,
410,
682
4,83
5,29
35,
604,
104
6,54
4,00
97,
582,
376
* I
nclu
ding
stat
istic
al d
iscr
epan
cy
S
ourc
e : D
epar
tmen
t of C
ensu
s & S
tatis
tics
@ P
rovi
sion
al
Rs.
Mill
ion
Item
2002
2008
2009
2010
2011
2012
@1.
Priv
ate
Con
sum
ptio
n Ex
pend
iture
1,16
6,02
71,
578,
150
1,59
2,95
31,
738,
820
1,99
4,16
42,
129,
958
2. G
ener
al G
over
nmen
t Con
sum
ptio
n Ex
pend
iture
208,
085
344,
713
39
9,86
740
6,21
642
8,62
342
6,22
33.
Gro
ss D
omes
tic F
ixed
Cap
ital F
orm
atio
n32
8,40
662
7,43
763
5,87
069
4,16
179
5,45
888
0,28
84.
Cha
nges
in S
tock
s*40
,000
29,9
4035
,321
74,1
8032
,022
2,02
35.
Exp
orts
of G
oods
and
Ser
vice
s57
1,19
575
8,97
266
5,57
572
3,88
080
3,50
780
4,79
36.
Les
s: I
mpo
rts o
f Goo
ds a
nd S
ervi
ces
677,
676
973,
711
880,
372
991,
714
1,19
0,05
71,
196,
008
7. G
ross
Dom
estic
Pro
duct
1,63
6,03
72,
365,
501
2,44
9,21
42,
645,
542
2,86
3,71
53,
047,
277
* In
clud
ing
stat
istic
al d
iscr
epan
cy
S
ourc
e : D
epar
tmen
t of C
ensu
s & S
tatis
tics
@ P
rovi
sion
al
E
XPE
ND
ITU
RE
ON
GR
OSS
DO
ME
STIC
PR
OD
UC
T A
T C
UR
RE
NT
PR
ICE
S
EX
PEN
DIT
UR
E O
N G
RO
SS D
OM
EST
IC P
RO
DU
CT
AT
CO
NST
AN
T (2
002)
PR
ICE
ST
AB
LE
2
TA
BL
E 1
59
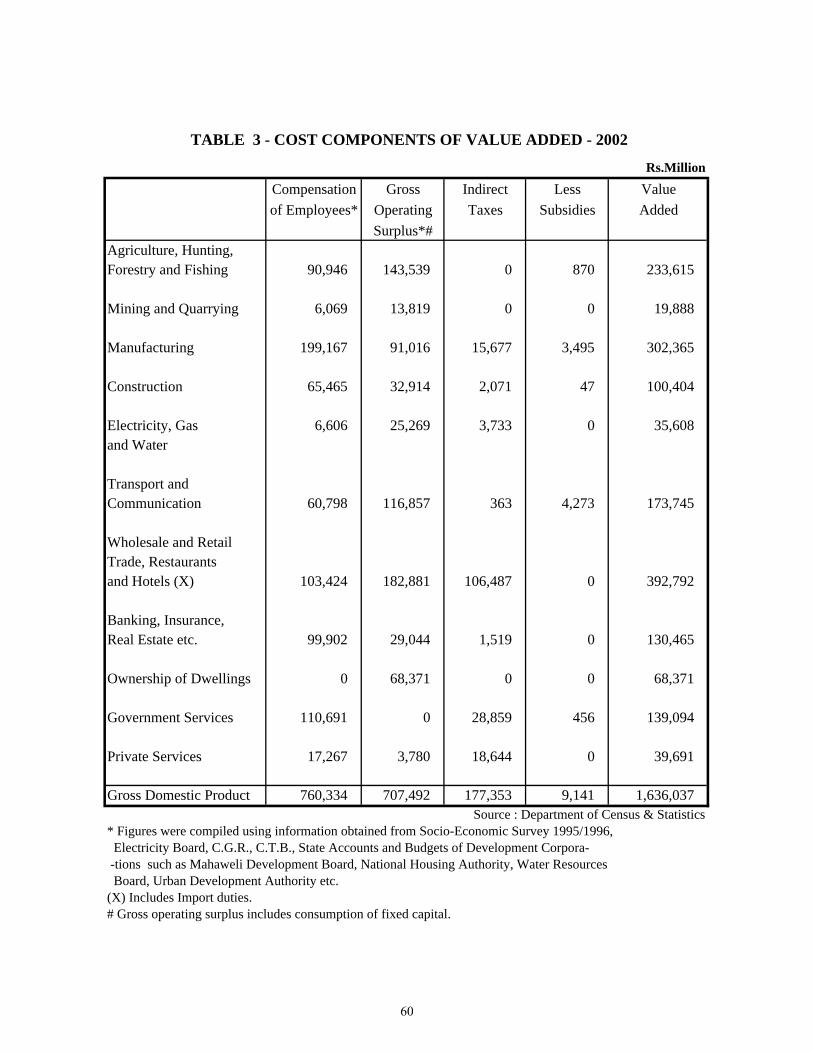
Rs.Million
Compensation Gross Indirect Less Valueof Employees* Operating Taxes Subsidies Added
Surplus*#Agriculture, Hunting,Forestry and Fishing 90,946 143,539 0 870 233,615
Mining and Quarrying 6,069 13,819 0 0 19,888
Manufacturing 199,167 91,016 15,677 3,495 302,365
Construction 65,465 32,914 2,071 47 100,404
Electricity, Gas 6,606 25,269 3,733 0 35,608and Water
Transport andCommunication 60,798 116,857 363 4,273 173,745
Wholesale and RetailTrade, Restaurantsand Hotels (X) 103,424 182,881 106,487 0 392,792
Banking, Insurance,Real Estate etc. 99,902 29,044 1,519 0 130,465
Ownership of Dwellings 0 68,371 0 0 68,371
Government Services 110,691 0 28,859 456 139,094
Private Services 17,267 3,780 18,644 0 39,691
Gross Domestic Product 760,334 707,492 177,353 9,141 1,636,037 Source : Department of Census & Statistics
* Figures were compiled using information obtained from Socio-Economic Survey 1995/1996, Electricity Board, C.G.R., C.T.B., State Accounts and Budgets of Development Corpora- -tions such as Mahaweli Development Board, National Housing Authority, Water Resources Board, Urban Development Authority etc.(X) Includes Import duties.# Gross operating surplus includes consumption of fixed capital.
TABLE 3 - COST COMPONENTS OF VALUE ADDED - 2002
60
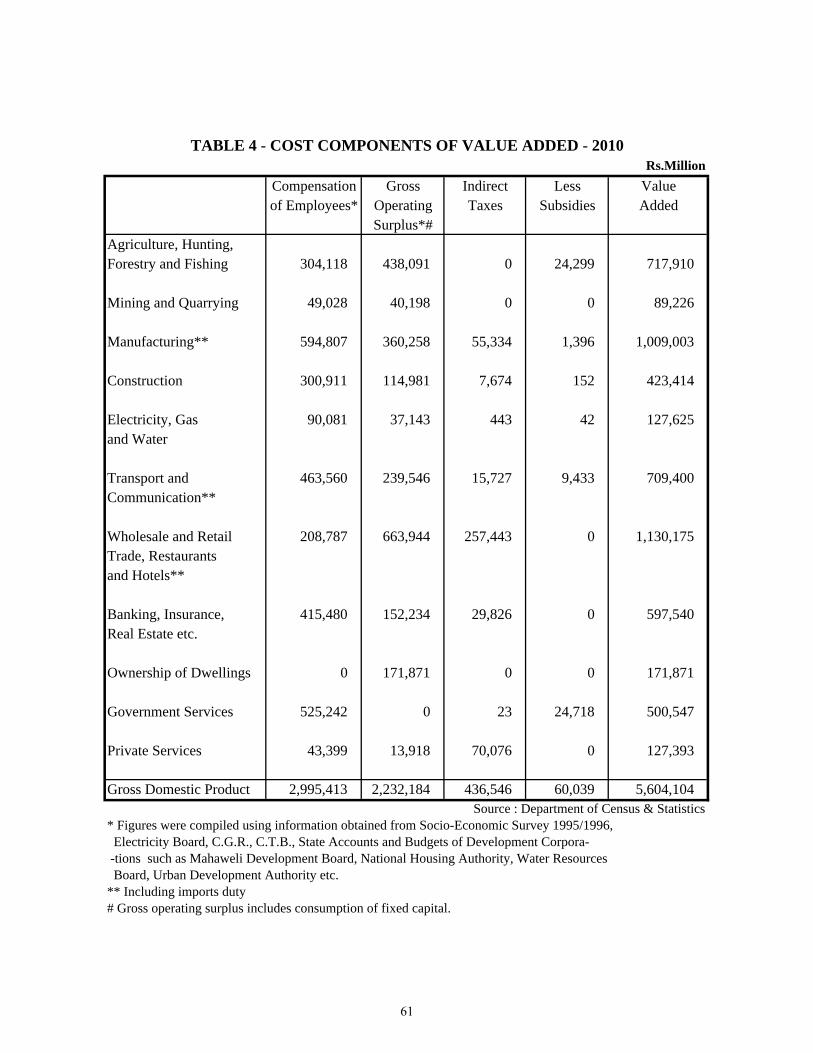
Rs.MillionCompensation Gross Indirect Less Valueof Employees* Operating Taxes Subsidies Added
Surplus*#Agriculture, Hunting,Forestry and Fishing 304,118 438,091 0 24,299 717,910
Mining and Quarrying 49,028 40,198 0 0 89,226
Manufacturing** 594,807 360,258 55,334 1,396 1,009,003
Construction 300,911 114,981 7,674 152 423,414
Electricity, Gas 90,081 37,143 443 42 127,625and Water
Transport and 463,560 239,546 15,727 9,433 709,400Communication**
Wholesale and Retail 208,787 663,944 257,443 0 1,130,175Trade, Restaurantsand Hotels**
Banking, Insurance, 415,480 152,234 29,826 0 597,540Real Estate etc.
Ownership of Dwellings 0 171,871 0 0 171,871
Government Services 525,242 0 23 24,718 500,547
Private Services 43,399 13,918 70,076 0 127,393
Gross Domestic Product 2,995,413 2,232,184 436,546 60,039 5,604,104 Source : Department of Census & Statistics
* Figures were compiled using information obtained from Socio-Economic Survey 1995/1996, Electricity Board, C.G.R., C.T.B., State Accounts and Budgets of Development Corpora- -tions such as Mahaweli Development Board, National Housing Authority, Water Resources Board, Urban Development Authority etc.** Including imports duty# Gross operating surplus includes consumption of fixed capital.
TABLE 4 - COST COMPONENTS OF VALUE ADDED - 2010
61

Rs.MillionCompensation Gross Indirect Less Valueof Employees* Operating Taxes Subsidies Added
Surplus*#Agriculture, Hunting,Forestry and Fishing 332,205 470,929 0 10,677 792,457
Mining and Quarrying 62,340 50,045 0 0 112,386
Manufacturing** 713,719 421,505 56,747 392 1,191,579
Construction 369,694 136,459 5,075 8 511,220
Electricity, Gas 100,678 40,176 625 5 141,474and Water
Transport and 529,284 265,961 30,526 7,385 818,386Communication**
Wholesale and Retail 261,102 820,045 320,770 1 1,401,916Trade, Restaurantsand Hotels**
Banking, Insurance, 507,990 179,604 21,722 0 709,316Real Estate etc.
Ownership of Dwellings 189,269 0 0 189,269
Government Services 540,023 15 7,583 532,455
Private Services 63,206 19,485 60,859 0 143,551
Gross Domestic Product 3,480,242 2,593,479 496,339 26,051 6,544,009 Source : Department of Census & Statistics
* Figures were compiled using information obtained from Socio-Economic Survey 1995/1996, Electricity Board, C.G.R., C.T.B., State Accounts and Budgets of Development Corpora- -tions such as Mahaweli Development Board, National Housing Authority, Water Resources Board, Urban Development Authority etc.** Including imports duty# Gross operating surplus includes consumption of fixed capital.
TABLE 5 - COST COMPONENTS OF VALUE ADDED - 2011
62
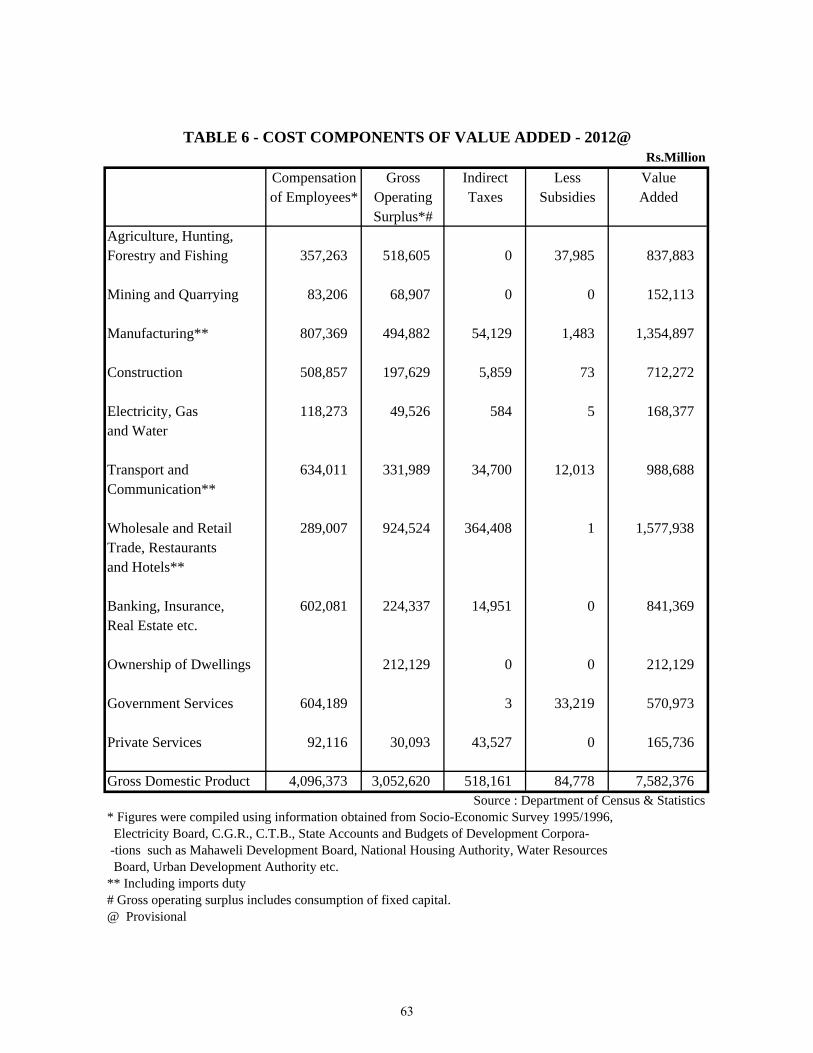
Rs.MillionCompensation Gross Indirect Less Valueof Employees* Operating Taxes Subsidies Added
Surplus*#Agriculture, Hunting,Forestry and Fishing 357,263 518,605 0 37,985 837,883
Mining and Quarrying 83,206 68,907 0 0 152,113
Manufacturing** 807,369 494,882 54,129 1,483 1,354,897
Construction 508,857 197,629 5,859 73 712,272
Electricity, Gas 118,273 49,526 584 5 168,377and Water
Transport and 634,011 331,989 34,700 12,013 988,688Communication**
Wholesale and Retail 289,007 924,524 364,408 1 1,577,938Trade, Restaurantsand Hotels**
Banking, Insurance, 602,081 224,337 14,951 0 841,369Real Estate etc.
Ownership of Dwellings 212,129 0 0 212,129
Government Services 604,189 3 33,219 570,973
Private Services 92,116 30,093 43,527 0 165,736
Gross Domestic Product 4,096,373 3,052,620 518,161 84,778 7,582,376 Source : Department of Census & Statistics
* Figures were compiled using information obtained from Socio-Economic Survey 1995/1996, Electricity Board, C.G.R., C.T.B., State Accounts and Budgets of Development Corpora- -tions such as Mahaweli Development Board, National Housing Authority, Water Resources Board, Urban Development Authority etc.** Including imports duty# Gross operating surplus includes consumption of fixed capital.@ Provisional
TABLE 6 - COST COMPONENTS OF VALUE ADDED - 2012@
63
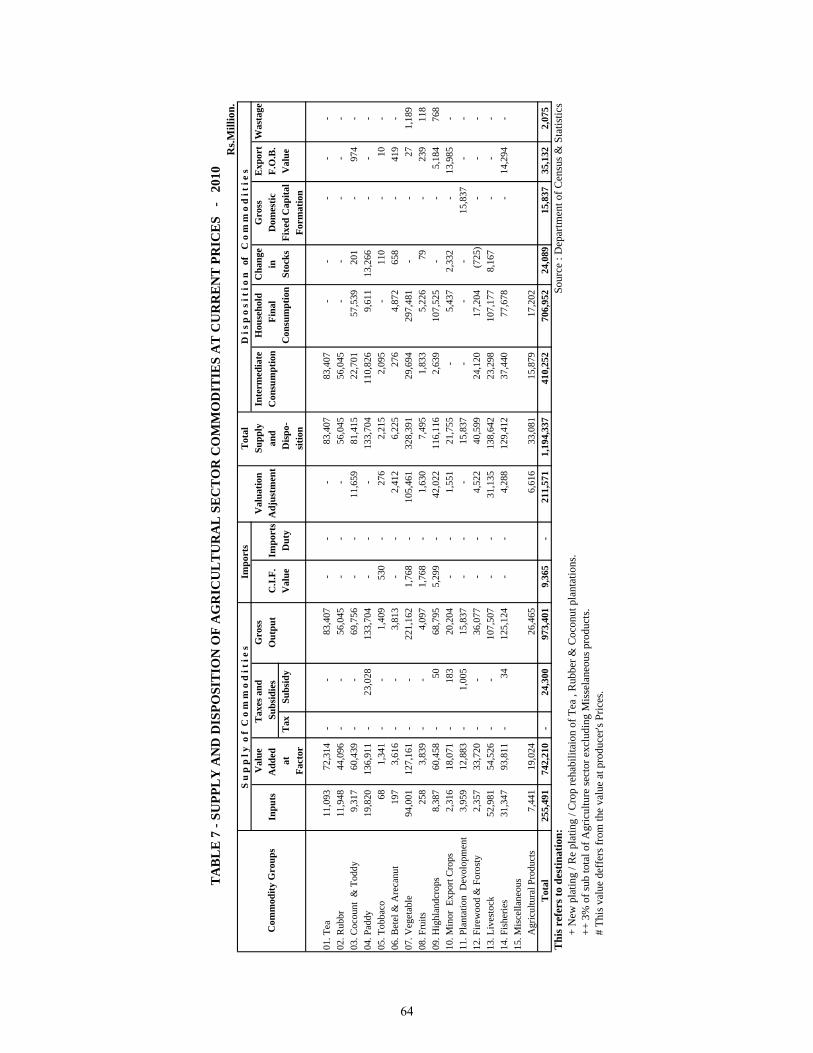
Tot
alV
alue
Gro
ss
Val
uatio
nSu
pply
Inte
rmed
iate
Hou
seho
ldC
hang
eG
ross
Exp
ort
Was
tage
Inpu
tsA
dded
O
utpu
tC
.I.F.
Impo
rts
Adj
ustm
ent
and
Con
sum
ptio
n
Fina
lin
Dom
estic
F.O
.B.
at
Tax
Subs
idy
V
alue
Dut
y
Dis
po-
C
onsu
mpt
ion
Stoc
ksFi
xed
Cap
ital
Val
ueFa
ctor
sitio
nFo
rmat
ion
01. T
ea11
,093
72,3
14
-
-
83
,407
-
-
-
83,4
07
83,4
07
-
-
-
-
-
02
. Rub
br11
,948
44,0
96
-
-
56
,045
-
-
-
56,0
45
56,0
45
-
-
-
-
-
03
. Coc
ount
& T
oddy
9,31
7
60
,439
- -
69,7
56
-
-
11
,659
81
,415
22
,701
57,5
39
20
1
-
97
4
-
04. P
addy
19,8
20
13
6,91
1
- 23
,028
133,
704
-
-
-
13
3,70
4
11
0,82
6
9,
611
13
,266
-
-
-
05. T
obba
co68
1,34
1
-
-
1,
409
530
-
27
6
2,21
5
2,09
5
-
11
0
-
10
-
06
. Bet
el &
Are
canu
t19
7
3,61
6
-
-
3,
813
-
-
2,41
2
6,
225
27
6
4,
872
65
8
-
41
9
-
07. V
eget
able
94,0
01
12
7,16
1
- -
221,
162
1,
768
-
105,
461
328,
391
29,6
94
29
7,48
1
-
-
27
1,
189
08. F
ruits
258
3,
839
- -
4,09
7
1,
768
-
1,63
0
7,
495
1,
833
5,
226
79
-
239
11
8
09. H
ighl
andc
rops
8,38
7
60
,458
- 50
68,7
95
5,
299
-
42,0
22
116,
116
2,63
9
107,
525
-
-
5,18
4
76
8
10. M
inor
Exp
ort C
rops
2,31
6
18
,071
- 18
3
20
,204
-
-
1,55
1
21
,755
-
5,43
7
2,33
2
-
13,9
85
-
11. P
lant
atio
n D
evol
opm
ent
3,95
9
12
,883
- 1,
005
15
,837
-
-
-
15,8
37
-
-
-
15,8
37
-
-
12
. Fire
woo
d &
For
osty
2,35
7
33
,720
- -
36,0
77
-
-
4,
522
40,5
99
24,1
20
17
,204
(725
)
-
-
-
13. L
ives
tock
52,9
81
54
,526
- -
107,
507
-
-
31
,135
13
8,64
2
23
,298
107,
177
8,
167
-
-
-
14
. Fis
herie
s31
,347
93,8
11
-
34
12
5,12
4
-
-
4,28
8
12
9,41
2
37
,440
77,6
78
-
14,2
94
-
15. M
isce
llane
ous
Agr
icul
tura
l Pro
duct
s7,
441
19,0
24
26
,465
6,61
6
33
,081
15
,879
17,2
02
T
otal
255,
491
74
2,21
0
- 24
,300
973,
401
9,
365
-
211,
571
1,19
4,33
7
410,
252
706,
952
24
,089
15,8
37
35
,132
2,
075
Sou
rce
: Dep
artm
ent o
f Cen
sus &
Sta
tistic
s
TA
BL
E 7
- SU
PPL
Y A
ND
DIS
POSI
TIO
N O
F A
GR
ICU
LT
UR
AL
SE
CT
OR
CO
MM
OD
ITIE
S A
T C
UR
RE
NT
PR
ICE
S -
20
10R
s.Mill
ion.
Com
mod
ity G
roup
s
S u
p p
l y o
f C
o m
m o
d i
t i e
s Im
port
sD
i s p
o s
i t i
o n
of
C o
m m
o d
i t i
e s
Tax
es a
nd
Subs
idie
s
Thi
s ref
ers t
o de
stin
atio
n: +
New
pla
ting
/ Re
plat
ing
/ Cro
p re
habi
litai
on o
f Tea
, R
ubbe
r & C
ocon
ut p
lant
atio
ns.
++
3% o
f sub
tota
l of A
gric
ultu
re se
ctor
exc
ludi
ng M
isse
lane
ous p
rodu
cts.
# T
his v
alue
def
fers
from
the
valu
e at
pro
duce
r's P
rices
.
64
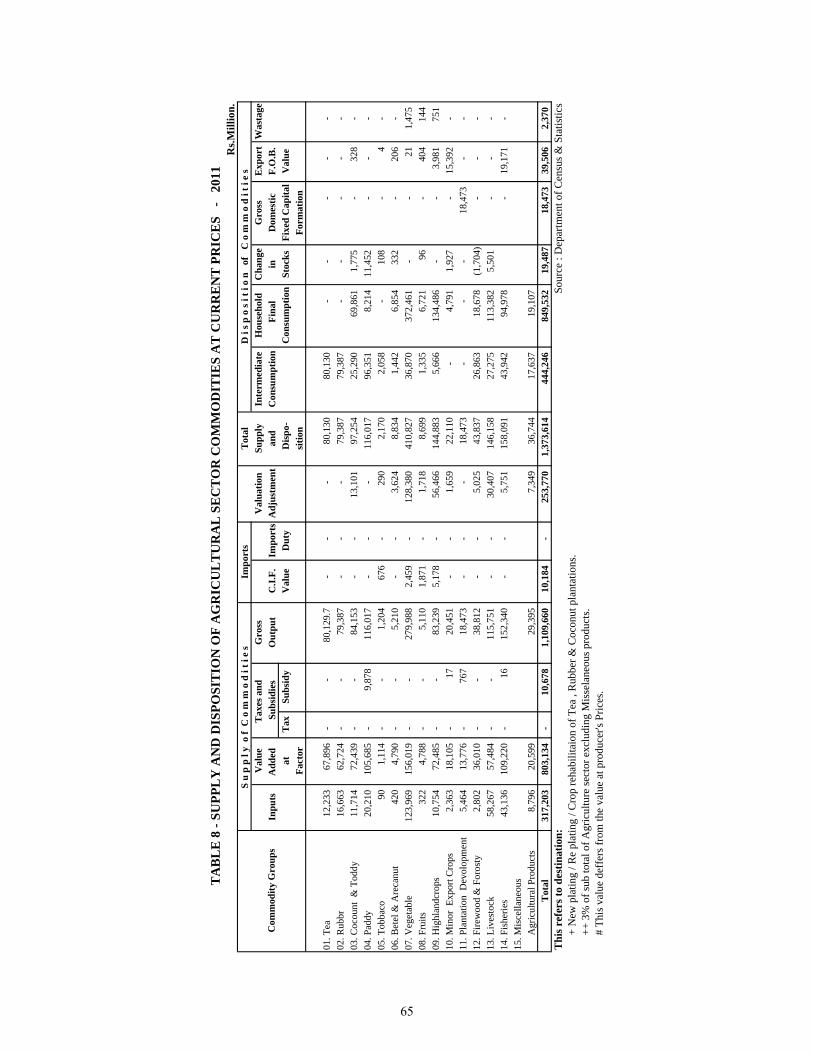
Tot
alV
alue
Gro
ss
Val
uatio
nSu
pply
Inte
rmed
iate
Hou
seho
ldC
hang
eG
ross
Exp
ort
Was
tage
Inpu
tsA
dded
O
utpu
tC
.I.F.
Impo
rts
Adj
ustm
ent
and
Con
sum
ptio
n
Fina
lin
Dom
estic
F.O
.B.
at
Tax
Subs
idy
V
alue
Dut
y
Dis
po-
C
onsu
mpt
ion
Stoc
ksFi
xed
Cap
ital
Val
ueFa
ctor
sitio
nFo
rmat
ion
01. T
ea12
,233
67,8
96
-
-
80
,129
.7
-
-
-
80,1
30
80,1
30
-
-
-
-
-
02
. Rub
br16
,663
62,7
24
-
-
79
,387
-
-
-
79,3
87
79,3
87
-
-
-
-
-
03
. Coc
ount
& T
oddy
11,7
14
72
,439
- -
84,1
53
-
-
13
,101
97
,254
25
,290
69,8
61
1,
775
-
32
8
-
04. P
addy
20,2
10
10
5,68
5
- 9,
878
11
6,01
7
-
-
-
116,
017
96,3
51
8,
214
11
,452
-
-
-
05. T
obba
co90
1,11
4
-
-
1,
204
676
-
29
0
2,17
0
2,05
8
-
10
8
-
4
-
06. B
etel
& A
reca
nut
420
4,
790
- -
5,21
0
-
-
3,
624
8,83
4
1,44
2
6,85
4
332
-
206
-
07
. Veg
etab
le12
3,96
9
156,
019
-
-
27
9,98
8
2,45
9
-
12
8,38
0
41
0,82
7
36
,870
372,
461
-
-
21
1,47
5
08
. Fru
its32
2
4,78
8
-
-
5,
110
1,87
1
-
1,
718
8,69
9
1,33
5
6,72
1
96
-
40
4
144
09
. Hig
hlan
dcro
ps10
,754
72,4
85
-
-
83
,239
5,17
8
-
56
,466
14
4,88
3
5,
666
13
4,48
6
-
-
3,
981
751
10
. Min
or E
xpor
t Cro
ps2,
363
18,1
05
-
17
20
,451
-
-
1,65
9
22
,110
-
4,79
1
1,92
7
-
15,3
92
-
11. P
lant
atio
n D
evol
opm
ent
5,46
4
13
,776
- 76
7
18
,473
-
-
-
18,4
73
-
-
-
18,4
73
-
-
12
. Fire
woo
d &
For
osty
2,80
2
36
,010
- -
38,8
12
-
-
5,
025
43,8
37
26,8
63
18
,678
(1,7
04)
-
-
-
13. L
ives
tock
58,2
67
57
,484
- -
115,
751
-
-
30
,407
14
6,15
8
27
,275
113,
382
5,
501
-
-
-
14
. Fis
herie
s43
,136
109,
220
-
16
15
2,34
0
-
-
5,75
1
15
8,09
1
43
,942
94,9
78
-
19,1
71
-
15. M
isce
llane
ous
Agr
icul
tura
l Pro
duct
s8,
796
20,5
99
29
,395
7,34
9
36
,744
17
,637
19,1
07
T
otal
317,
203
80
3,13
4
- 10
,678
1,10
9,66
0
10
,184
-
25
3,77
0
1,
373,
614
44
4,24
6
84
9,53
2
19,4
8718
,473
39,5
06
2,37
0
S
ourc
e : D
epar
tmen
t of C
ensu
s & S
tatis
tics
TA
BL
E 8
- SU
PPL
Y A
ND
DIS
POSI
TIO
N O
F A
GR
ICU
LT
UR
AL
SE
CT
OR
CO
MM
OD
ITIE
S A
T C
UR
RE
NT
PR
ICE
S -
20
11R
s.Mill
ion.
Com
mod
ity G
roup
s
S u
p p
l y o
f C
o m
m o
d i
t i e
s Im
port
sD
i s p
o s
i t i
o n
of
C o
m m
o d
i t i
e s
Tax
es a
nd
Subs
idie
s
Thi
s ref
ers t
o de
stin
atio
n: +
New
pla
ting
/ Re
plat
ing
/ Cro
p re
habi
litai
on o
f Tea
, R
ubbe
r & C
ocon
ut p
lant
atio
ns.
++
3% o
f sub
tota
l of A
gric
ultu
re se
ctor
exc
ludi
ng M
isse
lane
ous p
rodu
cts.
# T
his v
alue
def
fers
from
the
valu
e at
pro
duce
r's P
rices
.
65
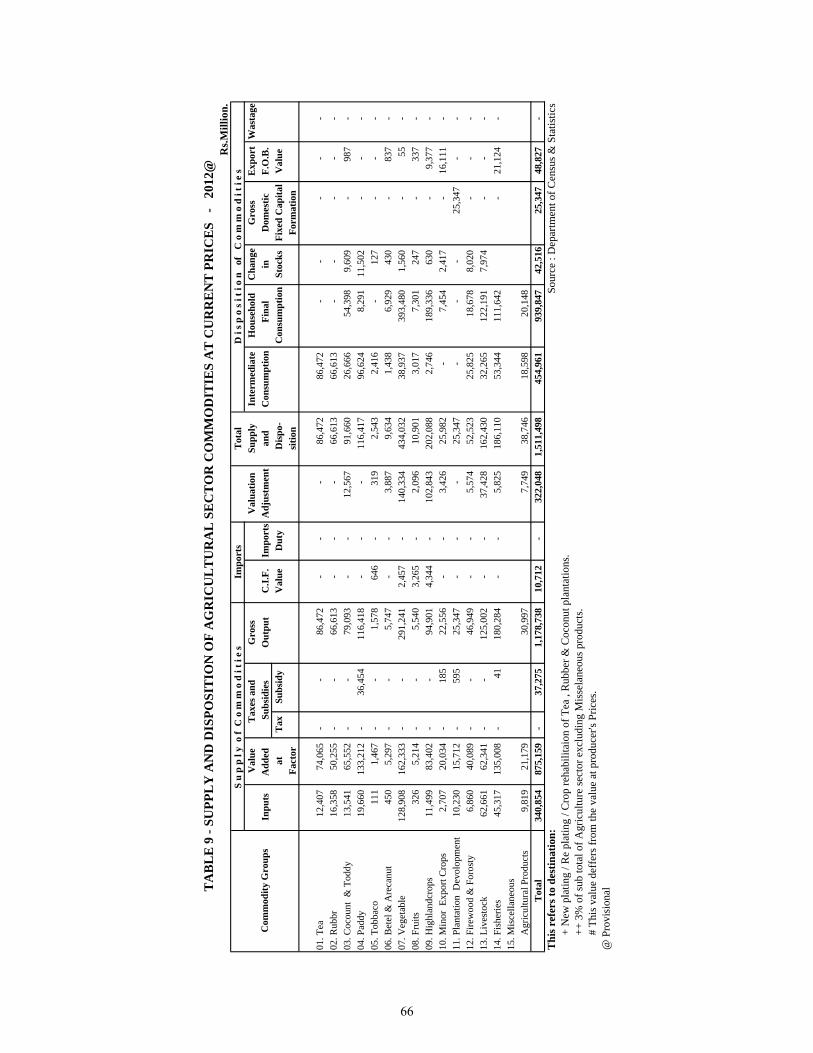
Tot
alV
alue
Gro
ss
Val
uatio
nSu
pply
Inte
rmed
iate
Hou
seho
ldC
hang
eG
ross
Exp
ort
Was
tage
Inpu
tsA
dded
O
utpu
tC
.I.F.
Impo
rts
Adj
ustm
ent
and
Con
sum
ptio
n
Fina
lin
Dom
estic
F.O
.B.
at
Tax
Subs
idy
V
alue
Dut
y
Dis
po-
C
onsu
mpt
ion
Stoc
ksFi
xed
Cap
ital
Val
ueFa
ctor
sitio
nFo
rmat
ion
01. T
ea12
,407
74,0
65
-
-
86
,472
-
-
-
86,4
72
86,4
72
-
-
-
-
-
02
. Rub
br16
,358
50,2
55
-
-
66
,613
-
-
-
66,6
13
66,6
13
-
-
-
-
-
03
. Coc
ount
& T
oddy
13,5
41
65
,552
- -
79,0
93
-
-
12
,567
91
,660
26
,666
54,3
98
9,
609
-
98
7
-
04. P
addy
19,6
60
13
3,21
2
- 36
,454
116,
418
-
-
-
11
6,41
7
96
,624
8,29
1
11,5
02
-
-
-
05
. Tob
baco
111
1,
467
- -
1,57
8
64
6
-
319
2,
543
2,
416
-
127
-
-
-
06. B
etel
& A
reca
nut
450
5,
297
- -
5,74
7
-
-
3,
887
9,63
4
1,43
8
6,92
9
430
-
837
-
07
. Veg
etab
le12
8,90
8
162,
333
-
-
29
1,24
1
2,45
7
-
14
0,33
4
43
4,03
2
38
,937
393,
480
1,
560
-
55
-
08
. Fru
its32
6
5,21
4
-
-
5,
540
3,26
5
-
2,
096
10,9
01
3,01
7
7,30
1
247
-
337
-
09
. Hig
hlan
dcro
ps11
,499
83,4
02
-
-
94
,901
4,34
4
-
10
2,84
3
20
2,08
8
2,
746
18
9,33
6
630
-
9,37
7
-
10
. Min
or E
xpor
t Cro
ps2,
707
20,0
34
-
185
22,5
56
-
-
3,
426
25,9
82
-
7,
454
2,
417
-
16
,111
-
11
. Pla
ntat
ion
Dev
olop
men
t10
,230
15,7
12
-
595
25,3
47
-
-
-
25
,347
-
-
-
25
,347
-
-
12. F
irew
ood
& F
oros
ty6,
860
40,0
89
-
-
46
,949
-
-
5,57
4
52
,523
25
,825
18,6
78
8,
020
-
-
-
13
. Liv
esto
ck62
,661
62,3
41
-
-
12
5,00
2
-
-
37,4
28
162,
430
32,2
65
12
2,19
1
7,97
4
-
-
-
14. F
ishe
ries
45,3
17
13
5,00
8
- 41
180,
284
-
-
5,
825
186,
110
53,3
44
11
1,64
2
-
21
,124
-
15
. Mis
cella
neou
s
A
gric
ultu
ral P
rodu
cts
9,81
9
21
,179
30,9
97
7,
749
38,7
46
18,5
98
20
,148
Tot
al34
0,85
4
875,
159
-
37,2
75
1,
178,
738
10,7
12
-
322,
048
1,51
1,49
8
454,
961
939,
847
42
,516
25,3
47
48
,827
-
S
ourc
e : D
epar
tmen
t of C
ensu
s & S
tatis
tics
@ P
rovi
sion
alTA
BL
E 9
- SU
PPL
Y A
ND
DIS
POSI
TIO
N O
F A
GR
ICU
LT
UR
AL
SE
CT
OR
CO
MM
OD
ITIE
S A
T C
UR
RE
NT
PR
ICE
S -
20
12@
Rs.M
illio
n.
Com
mod
ity G
roup
s
S u
p p
l y o
f C
o m
m o
d i
t i e
s Im
port
sD
i s p
o s
i t i
o n
of
C o
m m
o d
i t i
e s
Tax
es a
nd
Subs
idie
s
Thi
s ref
ers t
o de
stin
atio
n: +
New
pla
ting
/ Re
plat
ing
/ Cro
p re
habi
litai
on o
f Tea
, R
ubbe
r & C
ocon
ut p
lant
atio
ns.
++
3% o
f sub
tota
l of A
gric
ultu
re se
ctor
exc
ludi
ng M
isse
lane
ous p
rodu
cts.
# T
his v
alue
def
fers
from
the
valu
e at
pro
duce
r's P
rices
.
66
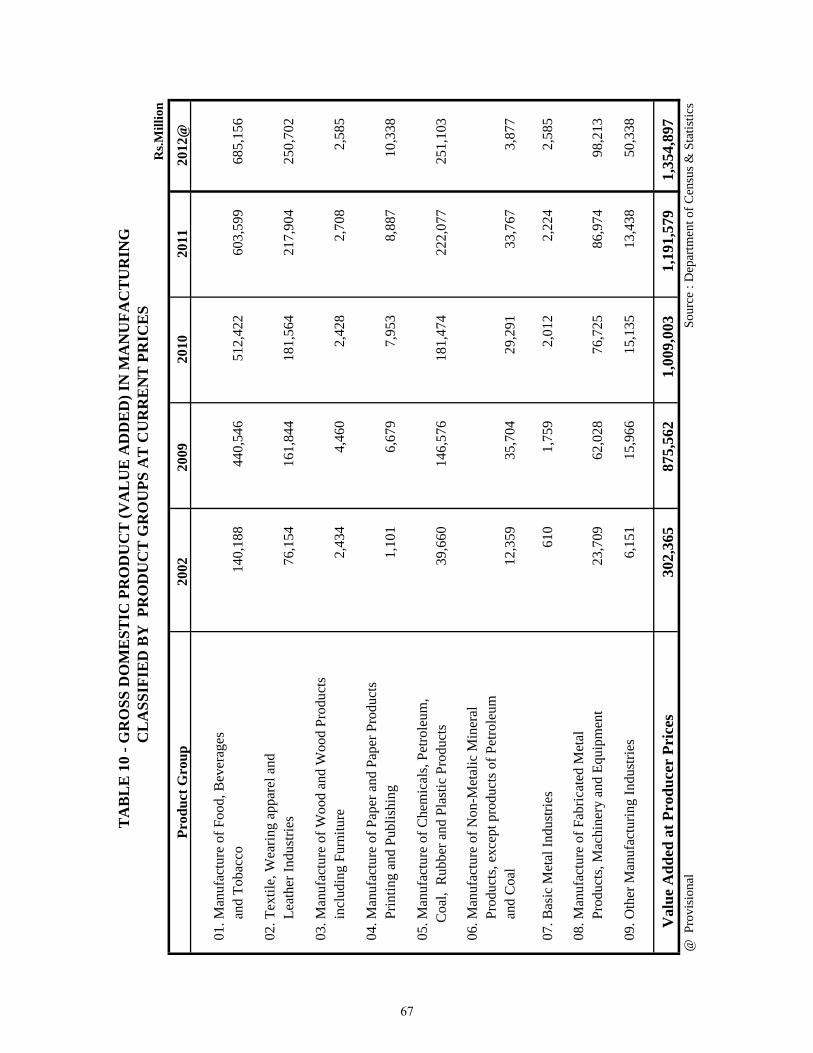
Rs.M
illio
n
Prod
uct G
roup
2002
2009
2010
2011
2012
@
01. M
anuf
actu
re o
f Foo
d, B
ever
ages
and
Toba
cco
140,
188
440,
546
512,
422
603,
599
685,
156
02. T
extil
e, W
earin
g ap
pare
l and
Leat
her I
ndus
tries
76,1
5416
1,84
418
1,56
421
7,90
425
0,70
2
03. M
anuf
actu
re o
f Woo
d an
d W
ood
Prod
ucts
incl
udin
g Fu
rnitu
re2,
434
4,46
02,
428
2,70
82,
585
04. M
anuf
actu
re o
f Pap
er a
nd P
aper
Pro
duct
s
Pr
intin
g an
d Pu
blis
hing
1,10
16,
679
7,95
38,
887
10,3
38
05. M
anuf
actu
re o
f Che
mic
als,
Petro
leum
,
Coa
l, R
ubbe
r and
Pla
stic
Pro
duct
s39
,660
146,
576
181,
474
222,
077
251,
103
06. M
anuf
actu
re o
f Non
-Met
alic
Min
eral
Prod
ucts
, exc
ept p
rodu
cts o
f Pet
role
um
an
d C
oal
12,3
5935
,704
29,2
9133
,767
3,87
7
07. B
asic
Met
al In
dust
ries
610
1,75
92,
012
2,22
42,
585
08. M
anuf
actu
re o
f Fab
ricat
ed M
etal
Prod
ucts
, Mac
hine
ry a
nd E
quip
men
t23
,709
62,0
2876
,725
86,9
7498
,213
09. O
ther
Man
ufac
turin
g In
dust
ries
6,15
115
,966
15,1
3513
,438
50,3
38
Val
ue A
dded
at P
rodu
cer
Pric
es30
2,36
587
5,56
21,
009,
003
1,19
1,57
91,
354,
897
@ P
rovi
sion
al
S
ourc
e : D
epar
tmen
t of C
ensu
s & S
tatis
tics
TA
BL
E 1
0 - G
RO
SS D
OM
EST
IC P
RO
DU
CT
(VA
LU
E A
DD
ED
) IN
MA
NU
FAC
TU
RIN
G
CL
ASS
IFIE
D B
Y P
RO
DU
CT
GR
OU
PS A
T C
UR
RE
NT
PR
ICE
S
67
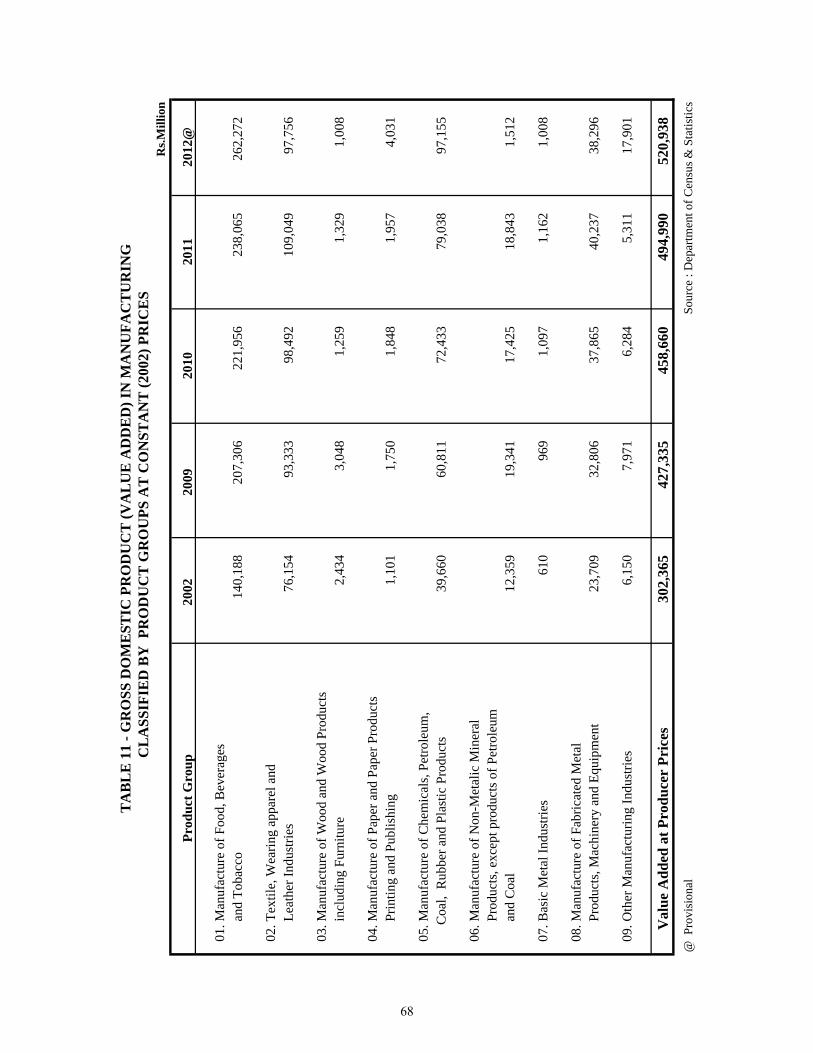
Rs.M
illio
n
Prod
uct G
roup
2002
2009
2010
2011
2012
@
01. M
anuf
actu
re o
f Foo
d, B
ever
ages
and
Toba
cco
140,
188
207,
306
221,
956
238,
065
262,
272
02. T
extil
e, W
earin
g ap
pare
l and
Leat
her I
ndus
tries
76,1
5493
,333
98,4
9210
9,04
997
,756
03. M
anuf
actu
re o
f Woo
d an
d W
ood
Prod
ucts
incl
udin
g Fu
rnitu
re2,
434
3,04
81,
259
1,32
91,
008
04. M
anuf
actu
re o
f Pap
er a
nd P
aper
Pro
duct
s
Pr
intin
g an
d Pu
blis
hing
1,10
11,
750
1,84
81,
957
4,03
1
05. M
anuf
actu
re o
f Che
mic
als,
Petro
leum
,
Coa
l, R
ubbe
r and
Pla
stic
Pro
duct
s39
,660
60,8
1172
,433
79,0
3897
,155
06. M
anuf
actu
re o
f Non
-Met
alic
Min
eral
Prod
ucts
, exc
ept p
rodu
cts o
f Pet
role
um
an
d C
oal
12,3
5919
,341
17,4
2518
,843
1,51
2
07. B
asic
Met
al In
dust
ries
610
969
1,09
71,
162
1,00
8
08. M
anuf
actu
re o
f Fab
ricat
ed M
etal
Prod
ucts
, Mac
hine
ry a
nd E
quip
men
t23
,709
32,8
0637
,865
40,2
3738
,296
09. O
ther
Man
ufac
turin
g In
dust
ries
6,15
07,
971
6,28
45,
311
17,9
01
Val
ue A
dded
at P
rodu
cer
Pric
es30
2,36
542
7,33
545
8,66
049
4,99
052
0,93
8
@ P
rovi
sion
al
S
ourc
e : D
epar
tmen
t of C
ensu
s & S
tatis
tics
TA
BL
E 1
1 - G
RO
SS D
OM
EST
IC P
RO
DU
CT
(VA
LU
E A
DD
ED
) IN
MA
NU
FAC
TU
RIN
G
CL
ASS
IFIE
D B
Y P
RO
DU
CT
GR
OU
PS A
T C
ON
STA
NT
(200
2) P
RIC
ES
68
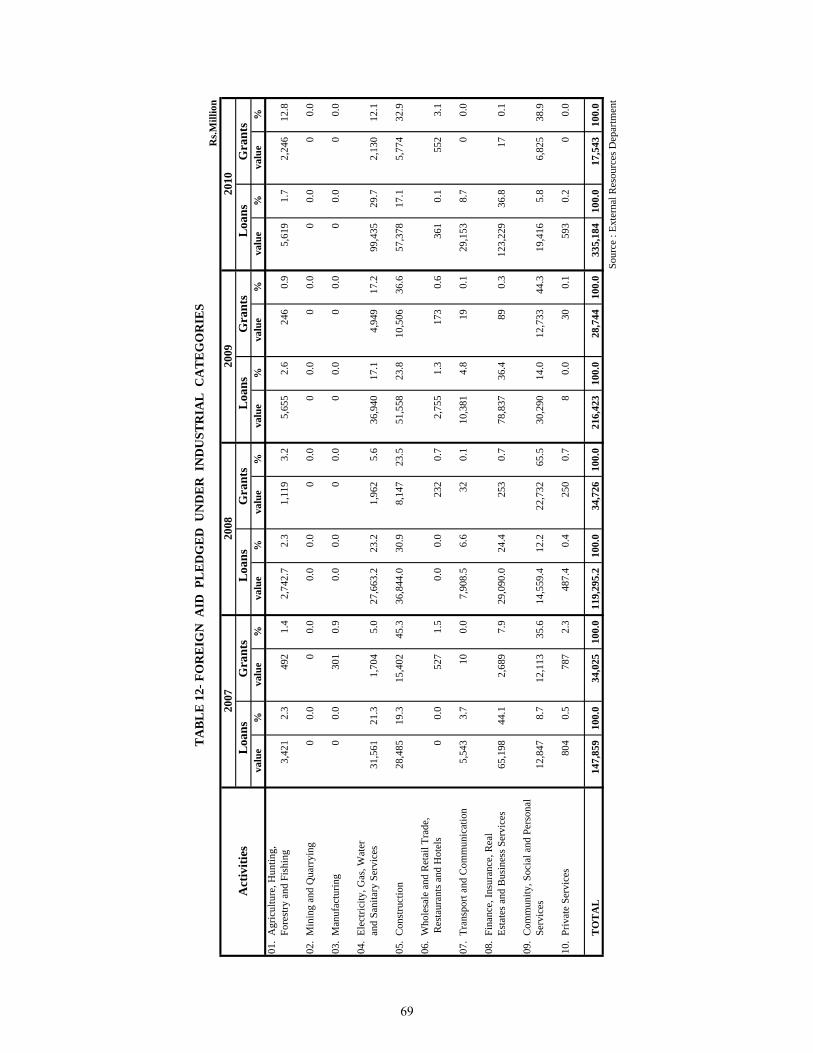
Rs.M
illio
n
Act
iviti
es
Loa
ns
G
rant
s
Loa
ns
G
rant
s
Loa
ns
G
rant
s
Loa
ns
G
rant
sva
lue
%va
lue
%va
lue
%va
lue
%va
lue
%va
lue
%va
lue
%va
lue
%01
. A
gric
ultu
re, H
untin
g,
For
estry
and
Fis
hing
3,42
12.
349
21.
42,
742.
72.
31,
119
3.2
5,65
52.
624
60.
95,
619
1.7
2,24
612
.8
02.
Min
ing
and
Qua
rryi
ng0
0.0
00.
00.
00.
00
0.0
00.
00
0.0
00.
00
0.0
03.
Man
ufac
turin
g0
0.0
301
0.9
0.0
0.0
00.
00
0.0
00.
00
0.0
00.
0
04.
Elec
trici
ty, G
as, W
ater
and
San
itary
Ser
vice
s31
,561
21.3
1,70
45.
027
,663
.223
.21,
962
5.6
36,9
4017
.14,
949
17.2
99,4
3529
.72,
130
12.1
05.
Con
stru
ctio
n28
,485
19.3
15,4
0245
.336
,844
.030
.98,
147
23.5
51,5
5823
.810
,506
36.6
57,3
7817
.15,
774
32.9
06.
Who
lesa
le a
nd R
etai
l Tra
de,
Res
taur
ants
and
Hot
els
00.
052
71.
50.
00.
023
20.
72,
755
1.3
173
0.6
361
0.1
552
3.1
07.
Tran
spor
t and
Com
mun
icat
ion
5,54
33.
710
0.0
7,90
8.5
6.6
320.
110
,381
4.8
190.
129
,153
8.7
00.
0
08.
Fina
nce,
Insu
ranc
e, R
eal
Est
ates
and
Bus
ines
s Ser
vice
s65
,198
44.1
2,68
97.
929
,090
.024
.425
30.
778
,837
36.4
890.
312
3,22
936
.817
0.1
09.
Com
mun
ity, S
ocia
l and
Per
sona
l
S
ervi
ces
12,8
478.
712
,113
35.6
14,5
59.4
12.2
22,7
3265
.530
,290
14.0
12,7
3344
.319
,416
5.8
6,82
538
.9
10.
Priv
ate
Serv
ices
804
0.5
787
2.3
487.
40.
425
00.
78
0.0
300.
159
30.
20
0.0
TO
TA
L14
7,85
910
0.0
34,0
2510
0.0
119,
295.
210
0.0
34,7
2610
0.0
216,
423
100.
028
,744
100.
033
5,18
410
0.0
17,5
4310
0.0
Sour
ce :
Exte
rnal
Res
ourc
es D
epar
tmen
t
2009
2010
TA
BL
E 1
2- F
OR
EIG
N A
ID P
LE
DG
ED
UN
DE
R I
ND
UST
RIA
L C
AT
EG
OR
IES
2007
2008
69
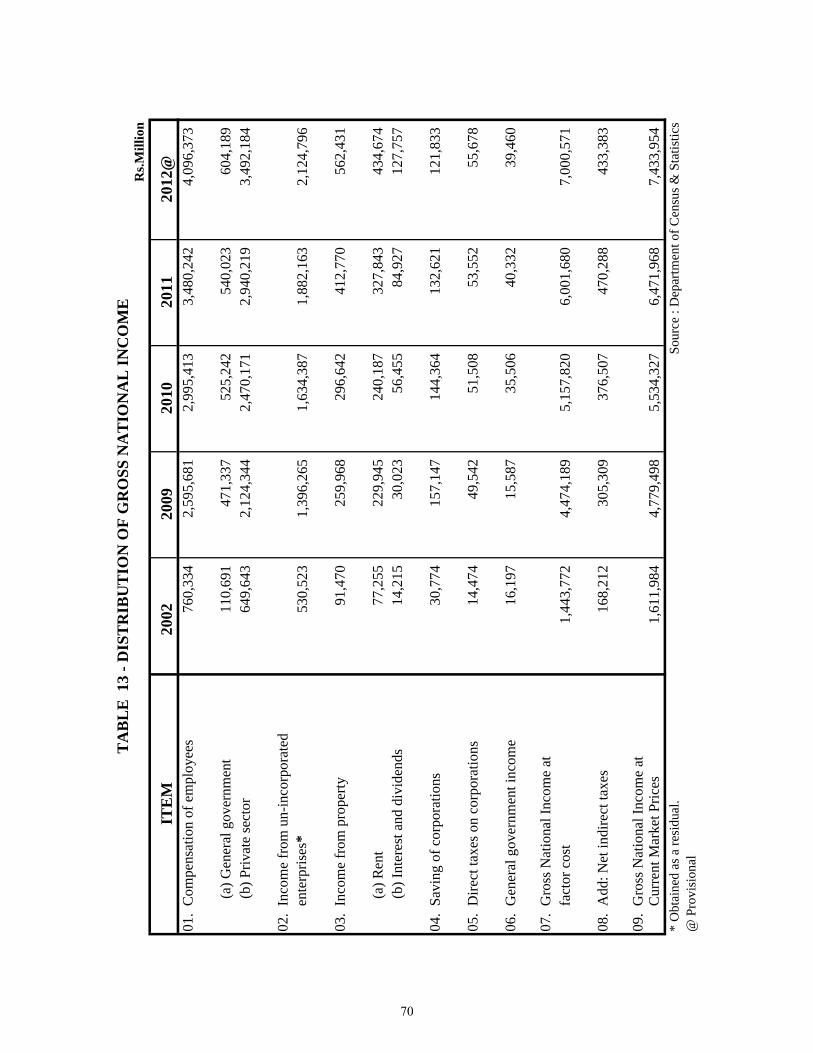
Rs.M
illio
n
ITE
M20
0220
0920
1020
1120
12@
01.
Com
pens
atio
n of
em
ploy
ees
760,
334
2,59
5,68
12,
995,
413
3,48
0,24
24,
096,
373
(a
) Gen
eral
gov
ernm
ent
110,
691
471,
337
525,
242
540,
023
604,
189
(b
) Priv
ate
sect
or64
9,64
32,
124,
344
2,47
0,17
12,
940,
219
3,49
2,18
4
02.
Inco
me
from
un-
inco
rpor
ated
e
nter
pris
es*
530,
523
1,39
6,26
51,
634,
387
1,88
2,16
32,
124,
796
03.
Inco
me
from
pro
perty
91,4
7025
9,96
829
6,64
241
2,77
056
2,43
1
(a
) Ren
t77
,255
229,
945
240,
187
327,
843
434,
674
(b
) Int
eres
t and
div
iden
ds14
,215
30,0
2356
,455
84,9
2712
7,75
7
04.
Savi
ng o
f cor
pora
tions
30,7
7415
7,14
714
4,36
413
2,62
112
1,83
3
05.
Dire
ct ta
xes o
n co
rpor
atio
ns14
,474
49,5
4251
,508
53,5
5255
,678
06.
Gen
eral
gov
ernm
ent i
ncom
e16
,197
15,5
8735
,506
40,3
3239
,460
07.
Gro
ss N
atio
nal I
ncom
e at
fact
or c
ost
1,44
3,77
24,
474,
189
5,15
7,82
06,
001,
680
7,00
0,57
1
08.
Add
: Net
indi
rect
taxe
s16
8,21
230
5,30
937
6,50
747
0,28
843
3,38
3
09.
Gro
ss N
atio
nal I
ncom
e at
Cur
rent
Mar
ket P
rices
1,61
1,98
44,
779,
498
5,53
4,32
76,
471,
968
7,43
3,95
4*
Obt
aine
d as
a re
sidu
al.
S
ourc
e : D
epar
tmen
t of C
ensu
s & S
tatis
tics
@ P
rovi
sion
al
TA
BL
E 1
3 - D
IST
RIB
UT
ION
OF
GR
OSS
NA
TIO
NA
L IN
CO
ME
70
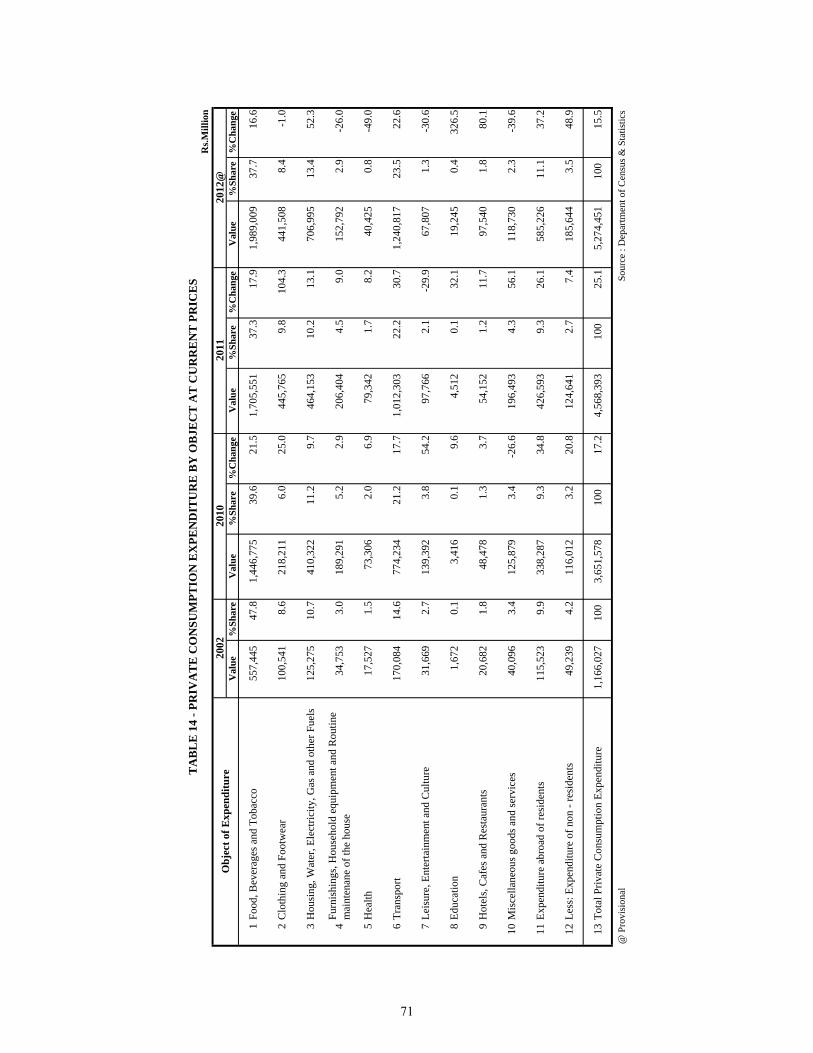
Val
ue%
Shar
eV
alue
%Sh
are
%C
hang
eV
alue
%Sh
are
%C
hang
eV
alue
%Sh
are
%C
hang
e
1Fo
od, B
ever
ages
and
Tob
acco
557,
445
47.8
1,44
6,77
5
39
.621
.51,
705,
551
37.3
17.9
1,98
9,00
9
37
.716
.6
2C
loth
ing
and
Foot
wea
r 10
0,54
1
8.
621
8,21
1
6.0
25.0
445,
765
9.
810
4.3
441,
508
8.
4-1
.0
3H
ousi
ng, W
ater
, Ele
ctric
ity, G
as a
nd o
ther
Fue
ls12
5,27
5
10
.741
0,32
2
11.2
9.7
464,
153
10
.213
.170
6,99
5
13.4
52.3
4Fu
rnis
hing
s, H
ouse
hold
equ
ipm
ent a
nd R
outin
e m
aint
enan
e of
the
hous
e34
,753
3.
018
9,29
1
5.2
2.9
206,
404
4.
59.
015
2,79
2
2.9
-26.
0
5H
ealth
17,5
27
1.5
73,3
06
2.
06.
979
,342
1.7
8.2
40,4
25
0.
8-4
9.0
6Tr
ansp
ort
170,
084
14.6
774,
234
21
.217
.71,
012,
303
22.2
30.7
1,24
0,81
7
23
.522
.6
7Le
isur
e, E
nter
tain
men
t and
Cul
ture
31,6
69
2.7
139,
392
3.
854
.297
,766
2.1
-29.
967
,807
1.3
-30.
6
8Ed
ucat
ion
1,67
2
0.1
3,41
6
0.
19.
64,
512
0.1
32.1
19,2
45
0.
432
6.5
9H
otel
s, C
afes
and
Res
taur
ants
20,6
82
1.8
48,4
78
1.
33.
754
,152
1.2
11.7
97,5
40
1.
880
.1
10M
isce
llane
ous g
oods
and
serv
ices
40,0
96
3.4
125,
879
3.
4-2
6.6
196,
493
4.
356
.111
8,73
0
2.3
-39.
6
11Ex
pend
iture
abr
oad
of re
side
nts
115,
523
9.9
338,
287
9.
334
.842
6,59
3
9.3
26.1
585,
226
11
.137
.2
12Le
ss: E
xpen
ditu
re o
f non
- re
side
nts
49,2
39
4.2
116,
012
3.
220
.812
4,64
1
2.7
7.4
185,
644
3.
548
.9
13To
tal P
rivat
e C
onsu
mpt
ion
Expe
nditu
re1,
166,
027
10
0
3,
651,
578
100
17
.24,
568,
393
100
25
.15,
274,
451
100
15
.5
Sou
rce
: Dep
artm
ent o
f Cen
sus &
Sta
tistic
s
2011
2002
Obj
ect o
f Exp
endi
ture
@ P
rovi
sion
al
2010
Rs.M
illio
n20
12@
TA
BL
E 1
4 - P
RIV
AT
E C
ON
SUM
PTIO
N E
XPE
ND
ITU
RE
BY
OB
JEC
T A
T C
UR
RE
NT
PR
ICE
S
71
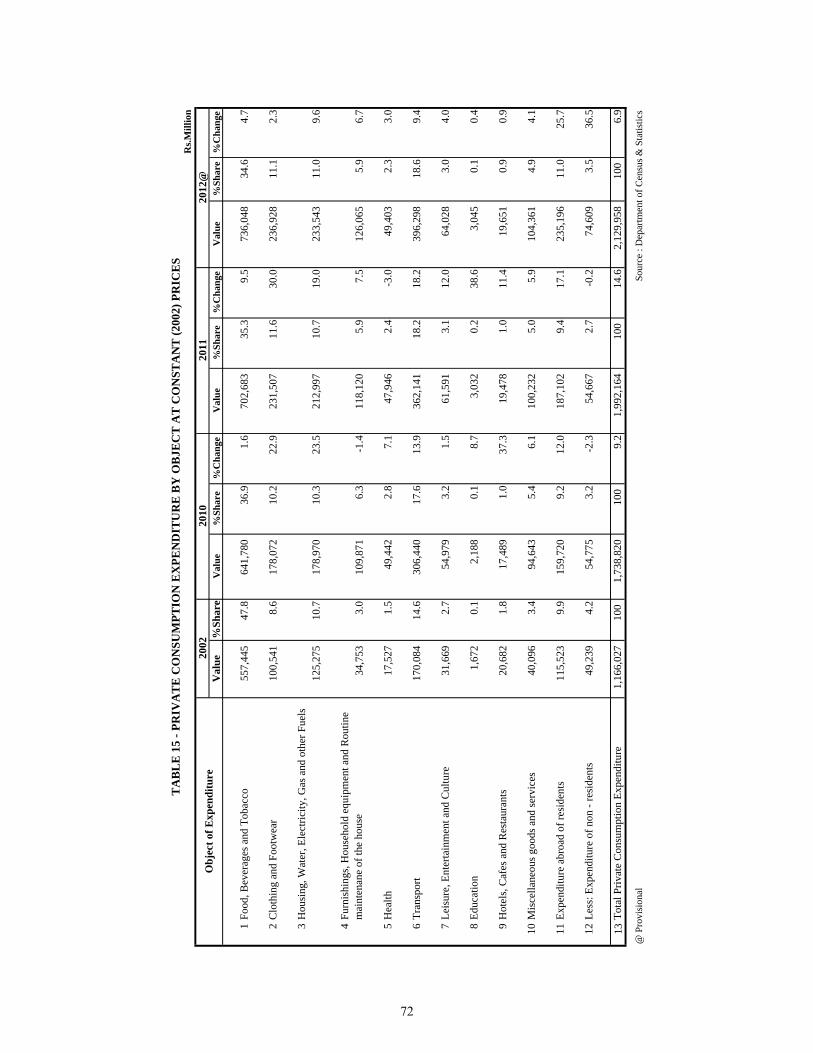
Val
ue%
Shar
eV
alue
%Sh
are
%C
hang
eV
alue
%Sh
are
%C
hang
eV
alue
%Sh
are
%C
hang
e
1Fo
od, B
ever
ages
and
Tob
acco
557,
445
47.8
641,
780
36
.91.
670
2,68
3
35.3
9.5
736,
048
34
.64.
7
2C
loth
ing
and
Foot
wea
r 10
0,54
1
8.
617
8,07
2
10.2
22.9
231,
507
11
.630
.023
6,92
8
11.1
2.3
3H
ousi
ng, W
ater
, Ele
ctric
ity, G
as a
nd o
ther
Fue
ls12
5,27
5
10
.717
8,97
0
10.3
23.5
212,
997
10
.719
.023
3,54
3
11.0
9.6
4Fu
rnis
hing
s, H
ouse
hold
equ
ipm
ent a
nd R
outin
e m
aint
enan
e of
the
hous
e34
,753
3.
010
9,87
1
6.3
-1.4
118,
120
5.
97.
512
6,06
5
5.9
6.7
5H
ealth
17,5
27
1.5
49,4
42
2.
87.
147
,946
2.4
-3.0
49,4
03
2.
33.
0
6Tr
ansp
ort
170,
084
14.6
306,
440
17
.613
.936
2,14
1
18.2
18.2
396,
298
18
.69.
4
7Le
isur
e, E
nter
tain
men
t and
Cul
ture
31,6
69
2.7
54,9
79
3.
21.
561
,591
3.1
12.0
64,0
28
3.
04.
0
8Ed
ucat
ion
1,67
2
0.1
2,18
8
0.
18.
73,
032
0.2
38.6
3,04
5
0.
10.
4
9H
otel
s, C
afes
and
Res
taur
ants
20,6
82
1.8
17,4
89
1.
037
.319
,478
1.0
11.4
19,6
51
0.
90.
9
10M
isce
llane
ous g
oods
and
serv
ices
40,0
96
3.4
94,6
43
5.
46.
110
0,23
2
5.0
5.9
104,
361
4.
94.
1
11Ex
pend
iture
abr
oad
of re
side
nts
115,
523
9.9
159,
720
9.
212
.018
7,10
2
9.4
17.1
235,
196
11
.025
.7
12Le
ss: E
xpen
ditu
re o
f non
- re
side
nts
49,2
39
4.2
54,7
75
3.
2-2
.354
,667
2.7
-0.2
74,6
09
3.
536
.5
13To
tal P
rivat
e C
onsu
mpt
ion
Expe
nditu
re1,
166,
027
10
0
1,
738,
820
100
9.
21,
992,
164
100
14
.62,
129,
958
100
6.
9
Sou
rce
: Dep
artm
ent o
f Cen
sus &
Sta
tistic
s
2010
@ P
rovi
sion
al
Obj
ect o
f Exp
endi
ture
2002
Rs.M
illio
n20
12@
TA
BL
E 1
5 - P
RIV
AT
E C
ON
SUM
PTIO
N E
XPE
ND
ITU
RE
BY
OB
JEC
T A
T C
ON
STA
NT
(200
2) P
RIC
ES
2011
72
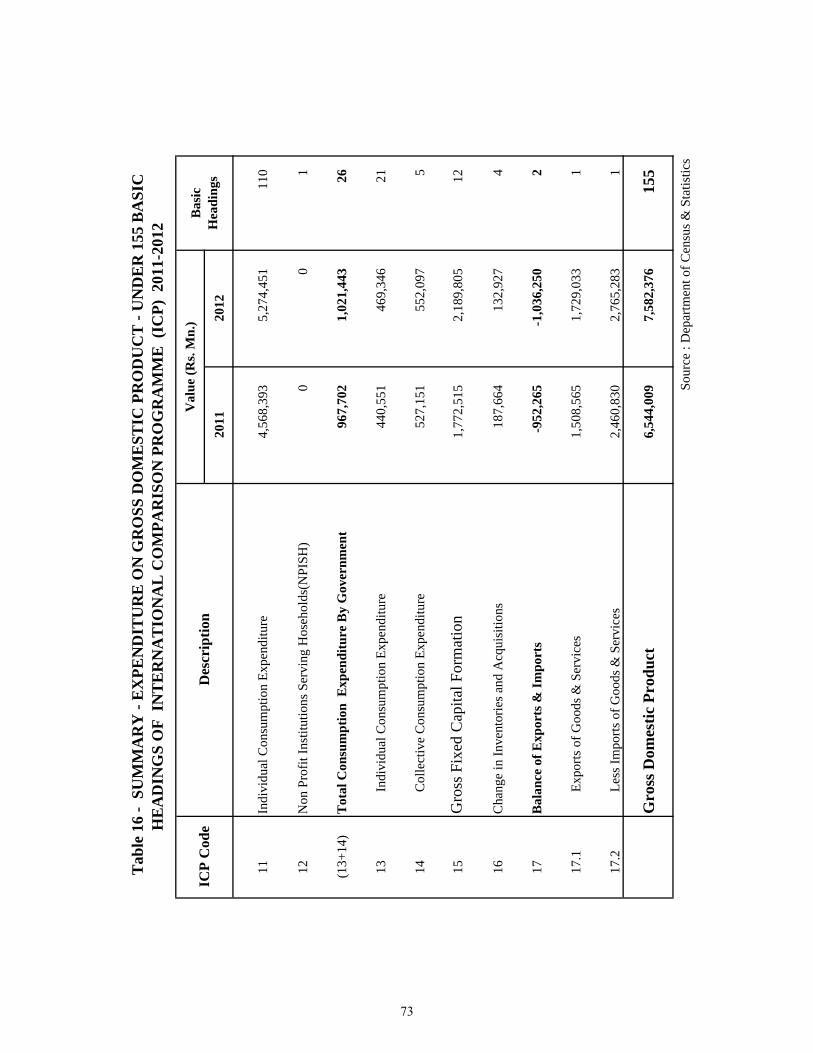
2011
2012
11In
divi
dual
Con
sum
ptio
n Ex
pend
iture
4,56
8,39
35,
274,
451
110
12N
on P
rofit
Inst
itutio
ns S
ervi
ng H
oseh
olds
(NPI
SH)
00
1
(13+
14)
Tot
al C
onsu
mpt
ion
Exp
endi
ture
By
Gov
ernm
ent
967,
702
1,02
1,44
326
13In
divi
dual
Con
sum
ptio
n Ex
pend
iture
440,
551
469,
346
21
14C
olle
ctiv
e C
onsu
mpt
ion
Expe
nditu
re52
7,15
155
2,09
75
15G
ross
Fix
ed C
apita
l For
mat
ion
1,77
2,51
52,
189,
805
12
16C
hang
e in
Inve
ntor
ies a
nd A
cqui
sitio
ns
187,
664
132,
927
4
17B
alan
ce o
f Exp
orts
& Im
port
s-9
52,2
65-1
,036
,250
2
17.1
Expo
rts o
f Goo
ds &
Ser
vice
s1,
508,
565
1,72
9,03
31
17.2
Less
Impo
rts o
f Goo
ds &
Ser
vice
s2,
460,
830
2,76
5,28
31
Gro
ss D
omes
tic P
rodu
ct6,
544,
009
7,58
2,37
615
5
Sou
rce
: Dep
artm
ent o
f Cen
sus &
Sta
tistic
s
Tab
le 1
6 -
SUM
MA
RY
- E
XPE
ND
ITU
RE
ON
GR
OSS
DO
ME
STIC
PR
OD
UC
T -
UN
DE
R 1
55 B
ASI
C
HE
AD
ING
S O
F IN
TE
RN
AT
ION
AL
CO
MPA
RIS
ON
PR
OG
RA
MM
E (
ICP)
201
1-20
12
ICP
Cod
eD
escr
iptio
nB
asic
Hea
ding
s
Val
ue (R
s. M
n.)
73
CONSOLIDATED ACCOUNTS
TABLES
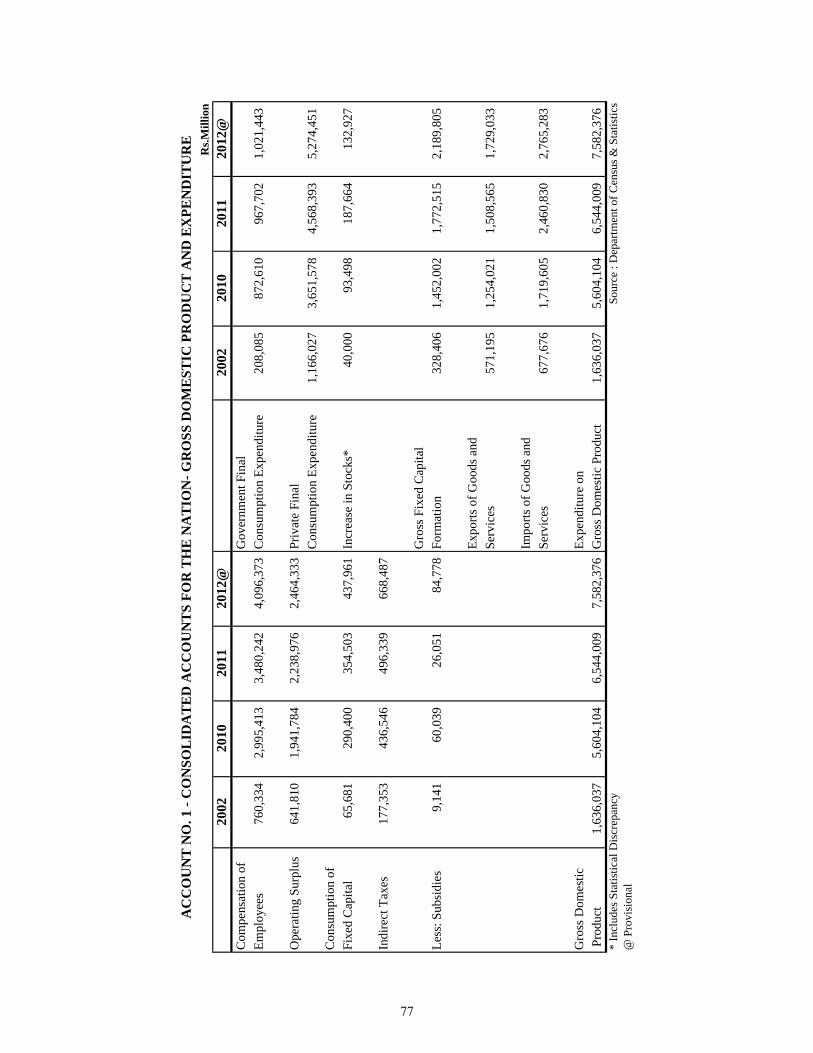
Rs.M
illio
n20
0220
1020
1120
12@
20
0220
1020
1120
12@
Com
pens
atio
n of
Gov
ernm
ent F
inal
Empl
oyee
s76
0,33
42,
995,
413
3,48
0,24
24,
096,
373
Con
sum
ptio
n Ex
pend
iture
208,
085
872,
610
967,
702
1,02
1,44
3
Ope
ratin
g Su
rplu
s64
1,81
01,
941,
784
2,23
8,97
62,
464,
333
Priv
ate
Fina
l C
onsu
mpt
ion
Expe
nditu
re1,
166,
027
3,65
1,57
84,
568,
393
5,27
4,45
1C
onsu
mpt
ion
of
Fi
xed
Cap
ital
65,6
8129
0,40
035
4,50
343
7,96
1In
crea
se in
Sto
cks*
40,0
0093
,498
187,
664
132,
927
Indi
rect
Tax
es17
7,35
343
6,54
649
6,33
966
8,48
7
Gro
ss F
ixed
Cap
ital
Less
: Sub
sidi
es9,
141
60,0
3926
,051
84,7
78Fo
rmat
ion
328,
406
1,45
2,00
21,
772,
515
2,18
9,80
5
Expo
rts o
f Goo
ds a
ndSe
rvic
es57
1,19
51,
254,
021
1,50
8,56
51,
729,
033
Impo
rts o
f Goo
ds a
ndSe
rvic
es67
7,67
61,
719,
605
2,46
0,83
02,
765,
283
Gro
ss D
omes
tic
Expe
nditu
re o
n P
rodu
ct1,
636,
037
5,60
4,10
46,
544,
009
7,58
2,37
6G
ross
Dom
estic
Pro
duct
1,63
6,03
75,
604,
104
6,54
4,00
97,
582,
376
* In
clud
es S
tatis
tical
Dis
crep
ancy
Sou
rce
: Dep
artm
ent o
f Cen
sus &
Sta
tistic
s@
Pro
visi
onal
AC
CO
UN
T N
O. 1
- C
ON
SOL
IDA
TE
D A
CC
OU
NT
S FO
R T
HE
NA
TIO
N- G
RO
SS D
OM
EST
IC P
RO
DU
CT
AN
D E
XPE
ND
ITU
RE
77
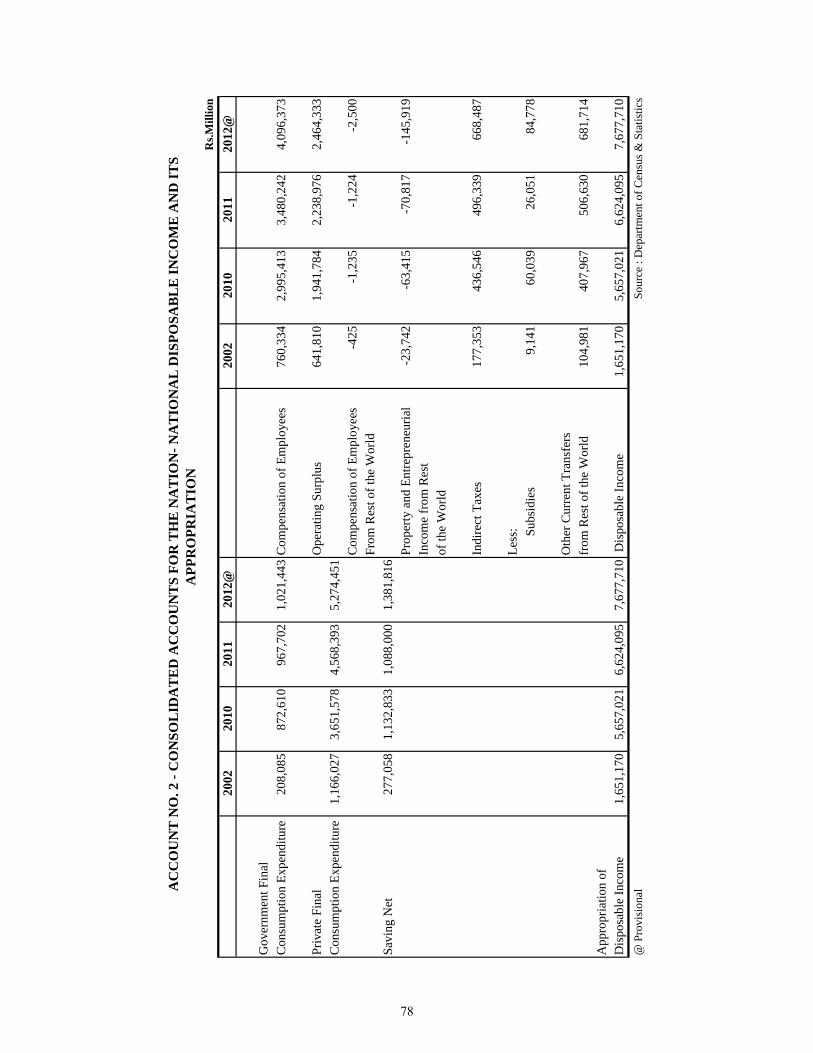
R
s.Mill
ion
2002
2010
2011
2012
@20
0220
1020
1120
12@
Gov
ernm
ent F
inal
C
onsu
mpt
ion
Expe
nditu
re20
8,08
587
2,61
096
7,70
21,
021,
443
Com
pens
atio
n of
Em
ploy
ees
760,
334
2,99
5,41
33,
480,
242
4,09
6,37
3
Priv
ate
Fina
lO
pera
ting
Surp
lus
641,
810
1,94
1,78
42,
238,
976
2,46
4,33
3C
onsu
mpt
ion
Expe
nditu
re1,
166,
027
3,65
1,57
84,
568,
393
5,27
4,45
1
C
ompe
nsat
ion
of E
mpl
oyee
s-4
25-1
,235
-1,2
24-2
,500
From
Res
t of t
he W
orld
Savi
ng N
et27
7,05
81,
132,
833
1,08
8,00
01,
381,
816
Prop
erty
and
Ent
repr
eneu
rial
-23,
742
-63,
415
-70,
817
-145
,919
Inco
me
from
Res
t of
the
Wor
ld
Indi
rect
Tax
es17
7,35
343
6,54
649
6,33
966
8,48
7 Le
ss:
Subs
idie
s9,
141
60,0
3926
,051
84,7
78 O
ther
Cur
rent
Tra
nsfe
rsfr
om R
est o
f the
Wor
ld10
4,98
140
7,96
750
6,63
068
1,71
4A
ppro
pria
tion
ofD
ispo
sabl
e In
com
e1,
651,
170
5,65
7,02
16,
624,
095
7,67
7,71
0 D
ispo
sabl
e In
com
e1,
651,
170
5,65
7,02
16,
624,
095
7,67
7,71
0@
Pro
visi
onal
Sou
rce
: Dep
artm
ent o
f Cen
sus &
Sta
tistic
s
AC
CO
UN
T N
O. 2
- C
ON
SOL
IDA
TE
D A
CC
OU
NT
S FO
R T
HE
NA
TIO
N- N
AT
ION
AL
DIS
POSA
BL
E IN
CO
ME
AN
D IT
S A
PPR
OPR
IAT
ION
78
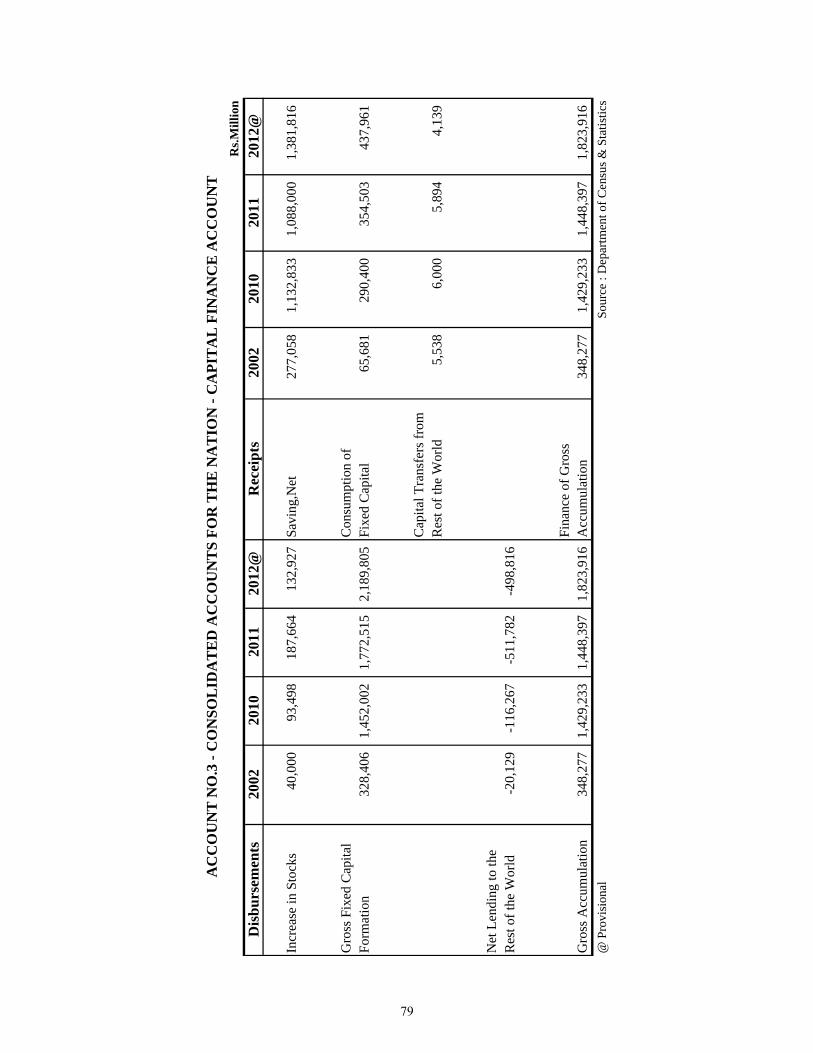
R
s.Mill
ion
Dis
burs
emen
ts20
0220
1020
1120
12@
Rec
eipt
s20
0220
1020
1120
12@
Incr
ease
in S
tock
s40
,000
93,4
9818
7,66
413
2,92
7Sa
ving
,Net
277,
058
1,13
2,83
31,
088,
000
1,38
1,81
6
Gro
ss F
ixed
Cap
ital
Con
sum
ptio
n of
Form
atio
n32
8,40
61,
452,
002
1,77
2,51
52,
189,
805
Fixe
d C
apita
l65
,681
290,
400
354,
503
437,
961
Cap
ital T
rans
fers
from
R
est o
f the
Wor
ld5,
538
6,00
05,
894
4,13
9
N
et L
endi
ng to
the
Res
t of t
he W
orld
-20,
129
-116
,267
-511
,782
-498
,816
Fi
nanc
e of
Gro
ss
Gro
ss A
ccum
ulat
ion
348,
277
1,42
9,23
31,
448,
397
1,82
3,91
6A
ccum
ulat
ion
348,
277
1,42
9,23
31,
448,
397
1,82
3,91
6@
Pro
visi
onal
Sou
rce
: Dep
artm
ent o
f Cen
sus &
Sta
tistic
s
AC
CO
UN
T N
O.3
- C
ON
SOL
IDA
TE
D A
CC
OU
NT
S FO
R T
HE
NA
TIO
N -
CA
PIT
AL
FIN
AN
CE
AC
CO
UN
T
79
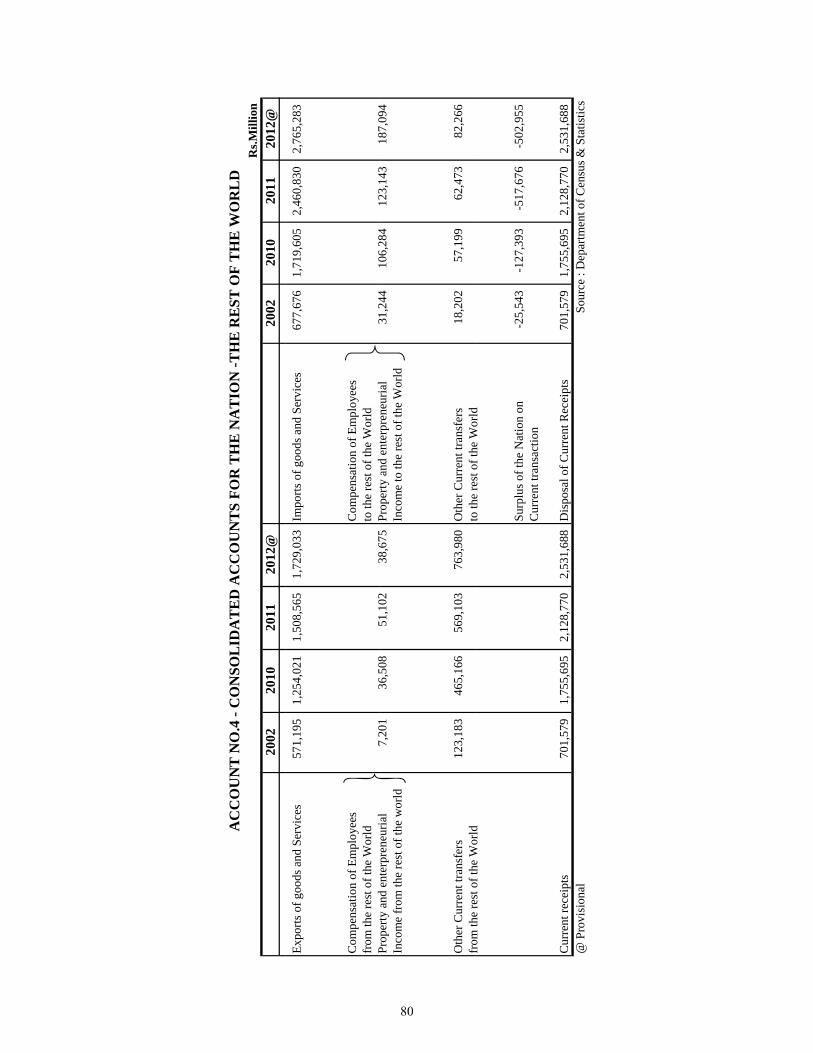
Rs.M
illio
n20
0220
1020
1120
12@
2002
2010
2011
2012
@
AC
CO
UN
T N
O.4
- C
ON
SOL
IDA
TE
D A
CC
OU
NT
S FO
R T
HE
NA
TIO
N -T
HE
RE
ST O
F T
HE
WO
RL
D
Expo
rts o
f goo
ds a
nd S
ervi
ces
571,
195
1,25
4,02
11,
508,
565
1,72
9,03
3Im
ports
of g
oods
and
Ser
vice
s67
7,67
61,
719,
605
2,46
0,83
02,
765,
283
Com
pens
atio
n of
Em
ploy
ees
Com
pens
atio
n of
Em
ploy
ees
fr
om th
e re
st o
f the
Wor
ldto
the
rest
of t
he W
orld
Prop
erty
and
ente
rpre
neur
ial
720
136
508
5110
238
675
Prop
erty
and
ente
rpre
neur
ial
3124
410
628
412
314
318
709
4Pr
oper
ty a
nd e
nter
pren
euria
l7,
201
36,5
0851
,102
38,6
75Pr
oper
ty a
nd e
nter
pren
euria
l31
,244
106,
284
123,
143
187,
094
Inco
me
from
the
rest
of t
he w
orld
Inco
me
to th
e re
st o
f the
Wor
ld
Oth
er C
urre
nt tr
ansf
ers
123,
183
465,
166
569,
103
763,
980
Oth
er C
urre
nt tr
ansf
ers
18,2
0257
,199
62,4
7382
,266
from
the
rest
ofth
eW
orld
toth
ere
stof
the
Wor
ldfr
om th
e re
st o
f the
Wor
ldto
the
rest
of t
he W
orld
Surp
lus o
f the
Nat
ion
on
-25,
543
-127
,393
-517
,676
-502
,955
Cur
rent
tran
sact
ion
Cur
rent
rece
ipts
701,
579
1,75
5,69
52,
128,
770
2,53
1,68
8D
ispo
sal o
f Cur
rent
Rec
eipt
s70
1,57
91,
755,
695
2,12
8,77
02,
531,
688
@ P
rovi
sion
al
S
ourc
e : D
epar
tmen
t of C
ensu
s & S
tatis
tics
80
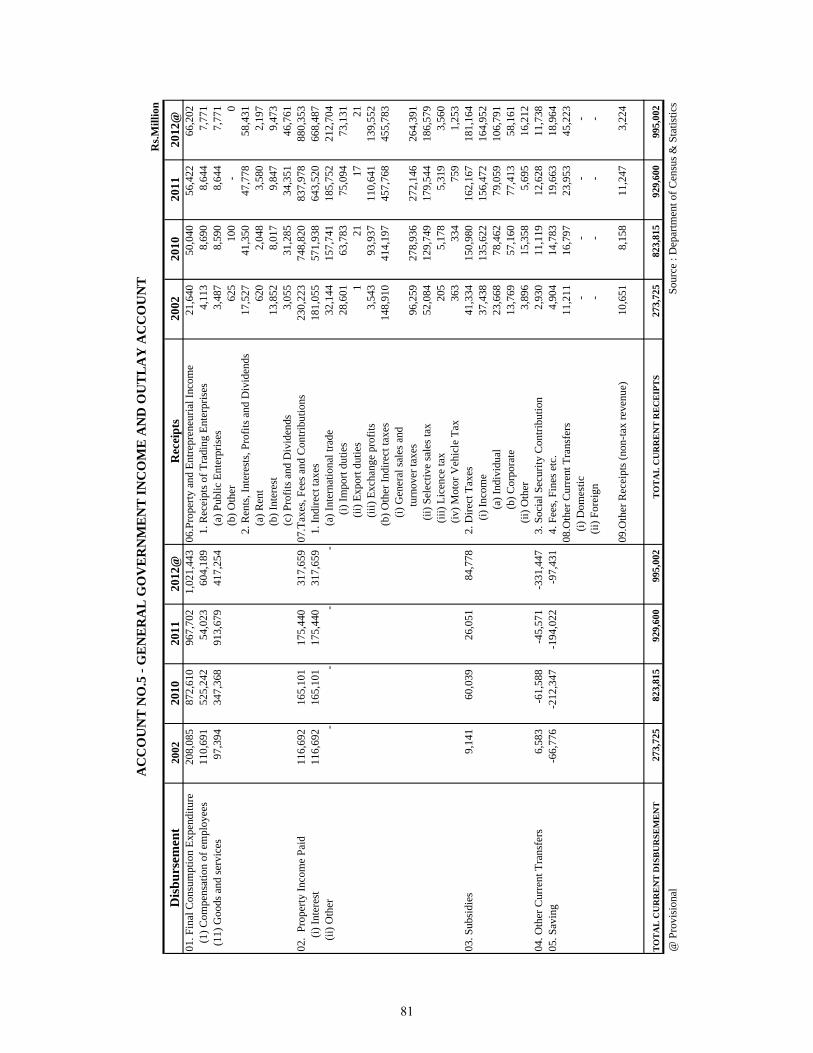
Rs.M
illio
n
Dis
burs
emen
t20
0220
1020
1120
12@
Rec
eipt
s20
0220
1020
1120
12@
01. F
inal
Con
sum
ptio
n Ex
pend
iture
208,
085
872,
610
967,
702
1,02
1,44
306
.Pro
perty
and
Ent
repr
eneu
rial I
ncom
e21
,640
50,0
4056
,422
66,2
02
(1) C
ompe
nsat
ion
of e
mpl
oyee
s11
0,69
152
5,24
2
54,0
23
60
4,18
9
1. R
ecei
pts o
f Tra
ding
Ent
erpr
ises
4,11
38,
690
8,64
47,
771
(11
) Goo
ds a
nd se
rvic
es97
,394
347,
368
913,
679
417,
254
(
a) P
ublic
Ent
erpr
ises
3,48
78,
590
8,
644
7,
771
(b)
Oth
er62
510
0
-
0
2. R
ents
, Int
eres
ts, P
rofit
s and
Div
iden
ds17
,527
41,3
5047
,778
58,4
31
(a)
Ren
t62
02,
048
3,
580
2,
197
(b)
Inte
rest
13,8
528,
017
9,
847
9,
473
(c)
Pro
fits a
nd D
ivid
ends
3,05
531
,285
34,3
51
46
,761
02.
Prop
erty
Inco
me
Pai d
116,
692
165,
101
175,
440
317,
659
07.T
axes
, Fee
s and
Con
tribu
tions
230,
223
748,
820
837,
978
880,
353
(
i) In
tere
st11
6,69
216
5,10
117
5,44
031
7,65
9 1
. Ind
irect
taxe
s18
1,05
557
1,93
864
3,52
066
8,48
7
(ii)
Oth
er-
--
-
(a)
Inte
rnat
iona
l tra
de32
,144
157,
741
185,
752
212,
704
(i)
Impo
rt du
ties
28,6
0163
,783
75,0
94
73
,131
(ii)
Exp
ort d
utie
s1
21
17
21
(
iii) E
xcha
nge
prof
its3,
543
93,9
37
11
0,64
1
139,
552
(b)
Oth
er In
dire
ct ta
xes
148,
910
414,
197
457,
768
455,
783
(i)
Gen
eral
sale
s and
turn
over
taxe
s96
,259
278,
936
27
2,14
6
264,
391
(i
i) Se
lect
ive
sale
s tax
52,0
8412
9,74
9
179,
544
18
6,57
9
(iii)
Lice
nce
tax
205
5,17
8
5,31
9
3,56
0
(iv) M
otor
Veh
icle
Tax
363
334
759
1,25
3
03. S
ubsi
dies
9,14
160
,039
26,0
5184
,778
2. D
irect
Tax
es41
,334
150,
980
162,
167
181,
164
(i
) Inc
ome
37,4
3813
5,62
215
6,47
216
4,95
2
(a)
Indi
vidu
al23
,668
78,4
62
79
,059
106,
791
(b)
Cor
pora
te13
,769
57,1
60
77
,413
58,1
61
(ii
) Oth
er3,
896
15,3
58
5,
695
16
,212
04. O
ther
Cur
rent
Tra
nsfe
rs6,
583
-61,
588
-45,
571
-331
,447
3. S
ocia
l Sec
urity
Con
tribu
tion
2,93
011
,119
12,6
28
11
,738
05. S
avin
g-6
6,77
6-2
12,3
47-1
94,0
22-9
7,43
1 4
. Fee
s, Fi
nes e
tc.
4,90
414
,783
19,6
63
18
,964
08.O
ther
Cur
rent
Tra
nsfe
rs11
,211
16,7
97
23
,953
45,2
23
(i) D
omes
tic-
-
-
-
(
ii) F
orei
gn-
-
-
-
09.O
ther
Rec
eipt
s (no
n-ta
x re
venu
e)10
,651
8,15
8
11,2
47
3,
224
TO
TA
L C
UR
RE
NT
DIS
BU
RSE
ME
NT
273,
725
823,
815
929,
600
995,
002
T
OT
AL
CU
RR
EN
T R
EC
EIP
TS
273,
725
823,
815
929,
600
995,
002
@ P
rovi
sion
al
S
ourc
e : D
epar
tmen
t of C
ensu
s & S
tatis
tics
AC
CO
UN
T N
O.5
- G
EN
ER
AL
GO
VE
RN
ME
NT
INC
OM
E A
ND
OU
TL
AY
AC
CO
UN
T
81
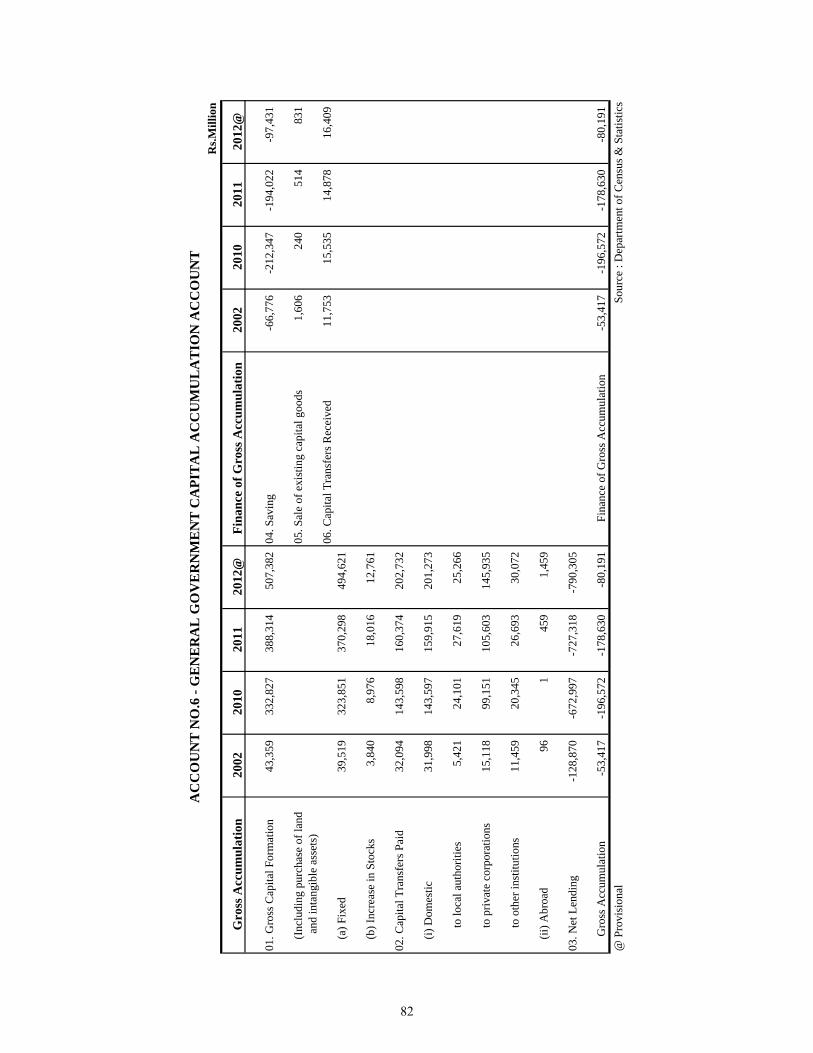
R
s.Mill
ion
Gro
ss A
ccum
ulat
ion
2002
2010
2011
2012
@Fi
nanc
e of
Gro
ss A
ccum
ulat
ion
2002
2010
2011
2012
@
01. G
ross
Cap
ital F
orm
atio
n43
,359
332,
827
388,
314
507,
382
04. S
avin
g-6
6,77
6-2
12,3
47-1
94,0
22-9
7,43
1
(I
nclu
ding
pur
chas
e of
land
05. S
ale
of e
xist
ing
capi
tal g
oods
1,60
624
051
483
1
an
d in
tang
ible
ass
ets)
06
. Cap
ital T
rans
fers
Rec
eive
d11
,753
15,5
35
14,8
78
16,4
09
(a
) Fix
ed39
,519
323,
851
370,
298
494,
621
(b) I
ncre
ase
in S
tock
s3,
840
8,97
618
,016
12,7
61
02. C
apita
l Tra
nsfe
rs P
aid
32,0
9414
3,59
816
0,37
420
2,73
2
(i
) Dom
estic
31,9
9814
3,59
715
9,91
520
1,27
3
to
loca
l aut
horit
ies
5,42
124
,101
27,6
1925
,266
to
priv
ate
corp
orat
ions
15,1
1899
,151
105,
603
145,
935
to
othe
r ins
titut
ions
11,4
5920
,345
26,6
9330
,072
(i
i) A
broa
d96
145
91,
459
03. N
et L
endi
ng-1
28,8
70-6
72,9
97-7
27,3
18-7
90,3
05
G
ross
Acc
umul
atio
n-5
3,41
7-1
96,5
72-1
78,6
30-8
0,19
1Fi
nanc
e of
Gro
ss A
ccum
ulat
ion
-53,
417
-196
,572
-178
,630
-80,
191
@ P
rovi
sion
al
S
ourc
e : D
epar
tmen
t of C
ensu
s & S
tatis
tics
AC
CO
UN
T N
O.6
- G
EN
ER
AL
GO
VE
RN
ME
NT
CA
PIT
AL
AC
CU
MU
LA
TIO
N A
CC
OU
NT
82
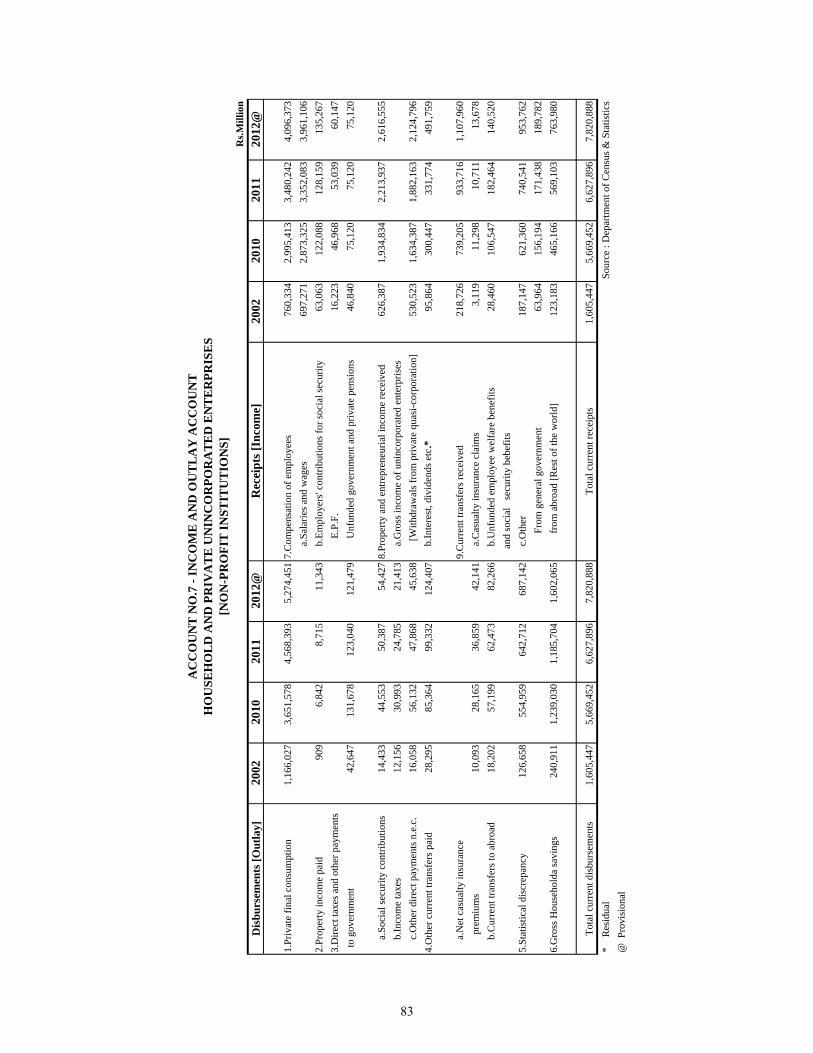
Rs.M
illio
nD
isbu
rsem
ents
[Out
lay]
2002
2010
2011
2012
@R
ecei
pts [
Inco
me]
2002
2010
2011
2012
@
1.Pr
ivat
e fin
al c
onsu
mpt
ion
1,16
6,02
73,
651,
578
4,56
8,39
35,
274,
451
7.C
ompe
nsat
ion
of e
mpl
oyee
s76
0,33
42,
995,
413
3,48
0,24
24,
096,
373
a
.Sal
arie
s and
wag
es69
7,27
12,
873,
325
3,35
2,08
33,
961,
106
2.Pr
oper
ty in
com
e pa
id90
96,
842
8,71
511
,343
b
.Em
ploy
ers'
cont
ribut
ions
for s
ocia
l sec
urity
63,0
6312
2,08
812
8,15
913
5,26
73.
Dire
ct ta
xes a
nd o
ther
pay
men
ts
E.P
.F.
16,2
2346
,968
53,0
3960
,147
to
gove
rnm
ent
42,6
4713
1,67
812
3,04
012
1,47
9
U
nfun
ded
gove
rnm
ent a
nd p
rivat
e pe
nsio
ns46
,840
75,1
2075
,120
75,1
20
a
.Soc
ial s
ecur
ity c
ontri
butio
ns14
,433
44,5
5350
,387
54,4
278.
Prop
erty
and
ent
repr
eneu
rial i
ncom
e re
ceiv
ed62
6,38
71,
934,
834
2,21
3,93
72,
616,
555
b
.Inco
me
taxe
s12
,156
30,9
9324
,785
21,4
13
a.G
ross
inco
me
of u
ninc
orpo
rate
d en
terp
rises
c
.Oth
er d
irect
pay
men
ts n
.e.c
.16
,058
56,1
3247
,868
45,6
38
[W
ithdr
awal
s fro
m p
rivat
e qu
asi-c
orpo
ratio
n]53
0,52
31,
634,
387
1,88
2,16
32,
124,
796
4.O
ther
cur
rent
tran
sfer
s pai
d28
,295
85,3
6499
,332
124,
407
b
.Inte
rest
, div
iden
ds e
tc.*
95,8
6430
0,44
733
1,77
449
1,75
9
a
.Net
cas
ualty
insu
ranc
e 9.
Cur
rent
tran
sfer
s rec
eive
d21
8,72
673
9,20
593
3,71
61,
107,
960
pre
miu
ms
10,0
9328
,165
36,8
5942
,141
a
.Cas
ualty
insu
ranc
e cl
aim
s3,
119
11,2
9810
,711
13,6
78
b.C
urre
nt tr
ansf
ers t
o ab
road
18,2
0257
,199
62,4
7382
,266
b
.Unf
unde
d em
ploy
ee w
elfa
re b
enef
its
28,4
6010
6,54
718
2,46
414
0,52
0
and
soci
al
secu
rity
bebe
fits
5.St
atis
tical
dis
crep
ancy
126,
658
554,
959
642,
712
687,
142
c
.Oth
er18
7,14
762
1,36
074
0,54
195
3,76
2
Fro
m g
ener
al g
over
nmen
t63
,964
156,
194
171,
438
189,
782
6.G
ross
Hou
seho
lda
savi
ngs
240,
911
1,23
9,03
01,
185,
704
1,60
2,06
5
from
abr
oad
[Res
t of t
he w
orld
]12
3,18
346
5,16
656
9,10
376
3,98
0
Tota
l cur
rent
dis
burs
emen
ts1,
605,
447
5,66
9,45
26,
627,
896
7,82
0,88
8To
tal c
urre
nt re
ceip
ts1,
605,
447
5,66
9,45
26,
627,
896
7,82
0,88
8*
R
esid
ual
Sou
rce
: Dep
artm
ent o
f Cen
sus &
Sta
tistic
s@
Pro
visi
onal
AC
CO
UN
T N
O.7
- IN
CO
ME
AN
D O
UT
LA
Y A
CC
OU
NT
HO
USE
HO
LD
AN
D P
RIV
AT
E U
NIN
CO
RPO
RA
TE
D E
NT
ER
PRIS
ES
[NO
N-P
RO
FIT
INST
ITU
TIO
NS]
83
PRODUCTION ACCOUNTS
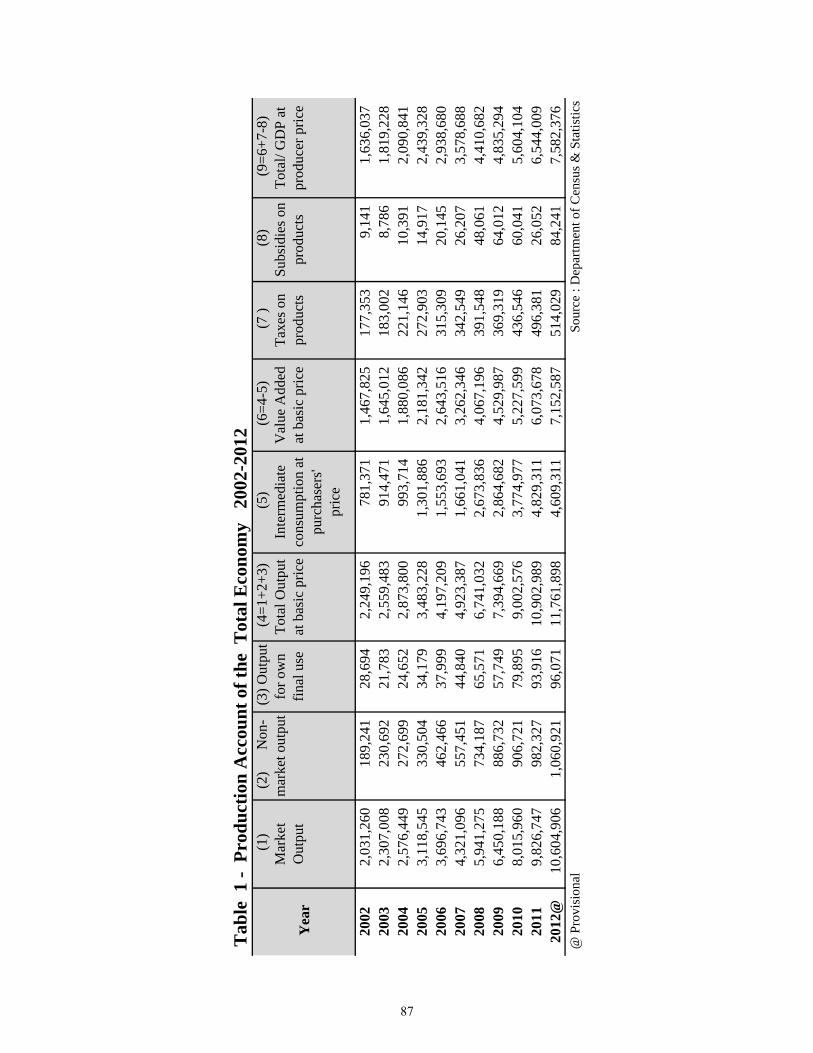
Yea
r
(1)
Mar
ket
Out
put
(2)
N
on-
mar
ket o
utpu
t (3
) Out
put
for o
wn
final
use
(4=1
+2+3
) To
tal O
utpu
t at
bas
ic p
rice
(5)
Inte
rmed
iate
co
nsum
ptio
n at
pu
rcha
sers
' pr
ice
(6=4
-5)
Val
ue A
dded
at
bas
ic p
rice
(7 )
Taxe
s on
prod
ucts
(8)
Su
bsid
ies o
n pr
oduc
ts
(9=6
+7-8
) To
tal/
GD
P at
pr
oduc
er p
rice
2002
2,03
1,26
0
18
9,24
1
28,6
94
2,
249,
196
781,
371
1,46
7,82
5
17
7,35
3
9,
141
1,63
6,03
7
2003
2,30
7,00
8
23
0,69
2
21,7
83
2,
559,
483
914,
471
1,64
5,01
2
18
3,00
2
8,
786
1,81
9,22
8
2004
2,57
6,44
9
27
2,69
9
24,6
52
2,
873,
800
993,
714
1,88
0,08
6
22
1,14
6
10
,391
2,
090,
841
20
053,
118,
545
330,
504
34
,179
3,48
3,22
8
1,
301,
886
2,
181,
342
272,
903
14,9
17
2,43
9,32
8
2006
3,69
6,74
3
46
2,46
6
37,9
99
4,
197,
209
1,55
3,69
3
2,64
3,51
6
31
5,30
9
20
,145
2,
938,
680
20
074,
321,
096
557,
451
44
,840
4,92
3,38
7
1,
661,
041
3,
262,
346
342,
549
26,2
07
3,57
8,68
8
2008
5,94
1,27
5
73
4,18
7
65,5
71
6,
741,
032
2,67
3,83
6
4,06
7,19
6
39
1,54
8
48
,061
4,
410,
682
20
096,
450,
188
886,
732
57
,749
7,39
4,66
9
2,
864,
682
4,
529,
987
369,
319
64,0
12
4,83
5,29
4
2010
8,01
5,96
0
90
6,72
1
79,8
95
9,
002,
576
3,77
4,97
7
5,22
7,59
9
43
6,54
6
60
,041
5,
604,
104
20
119,
826,
747
982,
327
93
,916
10,9
02,9
89
4,82
9,31
1
6,07
3,67
8
49
6,38
1
26
,052
6,
544,
009
20
12@
10,6
04,9
06
1,06
0,92
1
96
,071
11,7
61,8
98
4,60
9,31
1
7,15
2,58
7
51
4,02
9
84
,241
7,
582,
376
@
Pro
visi
onal
Sou
rce
: Dep
artm
ent o
f Cen
sus &
Sta
tistic
s
Tab
le 1
- P
rodu
ctio
n A
ccou
nt o
f the
Tot
al E
cono
my
200
2-20
12
87

(1)
(2)
(3)
(4 =
1+2
+3)
(5)
(6 =
4-5
)(7
)(8
)(9
= 6
+7-8
)
Sec
tor
Mar
ket O
utpu
t N
on-m
arke
t ou
tput
O
utpu
t for
ow
n fin
al u
se
Tota
l Out
put a
t ba
sic
pric
e In
term
edia
te
cons
umpt
ion
at
purc
hase
rs'
pric
e
Tot
al a
t bas
ic
pric
e T
axes
on
prod
ucts
S
ubsi
dies
on
prod
ucts
T
otal
/ GD
P at
pr
oduc
er p
rice
Non
- Fin
anci
al C
orpo
ratio
ns6,
899,
639
-
-
6,
899,
639
3,
248,
524
3,
651,
115
47
3,22
3
8,
175
4,
116,
163
Fi
nanc
ial C
orpo
ratio
ns89
9,75
6
-
-
89
9,75
6
21
3,84
6
68
5,91
0
21
,070
-
70
6,98
0
G
ener
al G
over
nmen
t36
2,73
4
98
2,32
7
-
1,
345,
061
69
0,97
2
65
4,08
8
15
7,
975
64
6,12
8
H
ouse
hold
s1,
573,
453
-
93
,916
1,
667,
368
61
9,39
6
1,
047,
972
2,
073
9,
902
1,
040,
143
N
PISH
s91
,166
-
-
91
,166
56
,573
34
,593
-
-
34
,593
T
otal
Eco
nom
y49
6,38
1
26
,052
47
0,32
9
T
otal
/GD
P9,
826,
747
98
2,32
7
93
,916
10
,902
,989
4,82
9,31
1
6,07
3,67
8
496,
381
26,0
52
6,54
4,00
9
Sou
rce
: Dep
artm
ent o
f Cen
sus &
Sta
tistic
s
(1)
(2)
(3)
(4 =
1+2
+3)
(5)
(6 =
4-5
)(7
)(8
)(9
= 6
+7-8
)
Sec
tor
Mar
ket O
utpu
t N
on-m
arke
t ou
tput
O
utpu
t for
ow
n fin
al u
se
Tota
l Out
put a
t ba
sic
pric
e In
term
edia
te
cons
umpt
ion
at
purc
hase
rs'
pric
e
Tot
al a
t bas
ic
pric
e T
axes
on
prod
ucts
S
ubsi
dies
on
prod
ucts
T
otal
/ GD
P at
pr
oduc
er p
rice
1.
Agr
icul
ture
, For
estr
y an
d Fi
shin
g1,
014,
736
-
93
,916
1,
108,
651
30
5,51
6
80
3,13
5
-
10
,678
79
2,45
7
2.
M
inin
g an
d Q
uarr
ying
128,
382
-
-
128,
382
15,9
97
112,
386
-
-
112,
386
3.
Man
ufac
turi
ng2,
967,
332
-
-
2,
967,
332
1,
832,
108
1,
135,
224
56
,747
39
2
1,
191,
579
4.
E
lect
rici
ty, G
as a
nd W
ater
174,
355
-
-
174,
355
33,5
01
140,
854
625
5
14
1,47
4
5.
C
onst
ruct
ion
1,11
3,56
7
-
-
1,11
3,56
7
607,
414
506,
153
5,07
5
8
51
1,22
0
6.
T
rade
and
Hot
el &
Res
taur
ents
1,52
3,92
0
-
-
1,52
3,92
0
442,
773
1,08
1,14
7
320,
770
1
1,
401,
916
7.
T
rans
port
& C
omm
unic
atio
n 1,
642,
189
-
-
1,
642,
189
84
6,98
6
79
5,20
3
30
,568
7,
385
81
8,38
6
8.
B
anki
ng ,
Insu
ranc
e an
d R
eal E
stat
e90
4,94
2
-
-
90
4,94
2
21
7,34
9
68
7,59
3
21
,722
-
70
9,31
5
9.
O
wne
rshi
p of
Dw
ellin
gs25
4,71
1
-
-
25
4,71
1
65
,442
18
9,26
9
-
-
18
9,26
9
10
. Gov
ernm
ent S
ervi
ces
-
975,
270
-
975,
270
435,
247
540,
023
15
7,58
3
532,
455
11. P
riva
te S
ervi
ces
102,
613
7,05
7
-
109,
670
26,9
78
82,6
92
60,8
59
-
143,
551
Tot
al E
cono
my
496,
381
26,0
52
470,
329
Tot
al/G
DP
9,82
6,74
7
982,
327
93,9
16
10,9
02,9
89
4,
829,
311
6,
073,
678
49
6,38
1
26
,052
6,
544,
009
S
ourc
e : D
epar
tmen
t of C
ensu
s & S
tatis
tics
Tab
le 2
.1 -
Pro
duct
ion
Acc
ount
of t
he T
otal
Eco
nom
y, b
y In
stitu
tiona
l Sec
tors
- 20
11
Tab
le 2
.2 -
Pro
duct
ion
Acc
ount
of t
he T
otal
Eco
nom
y, b
y E
cono
mic
act
iviti
es -
2011
88
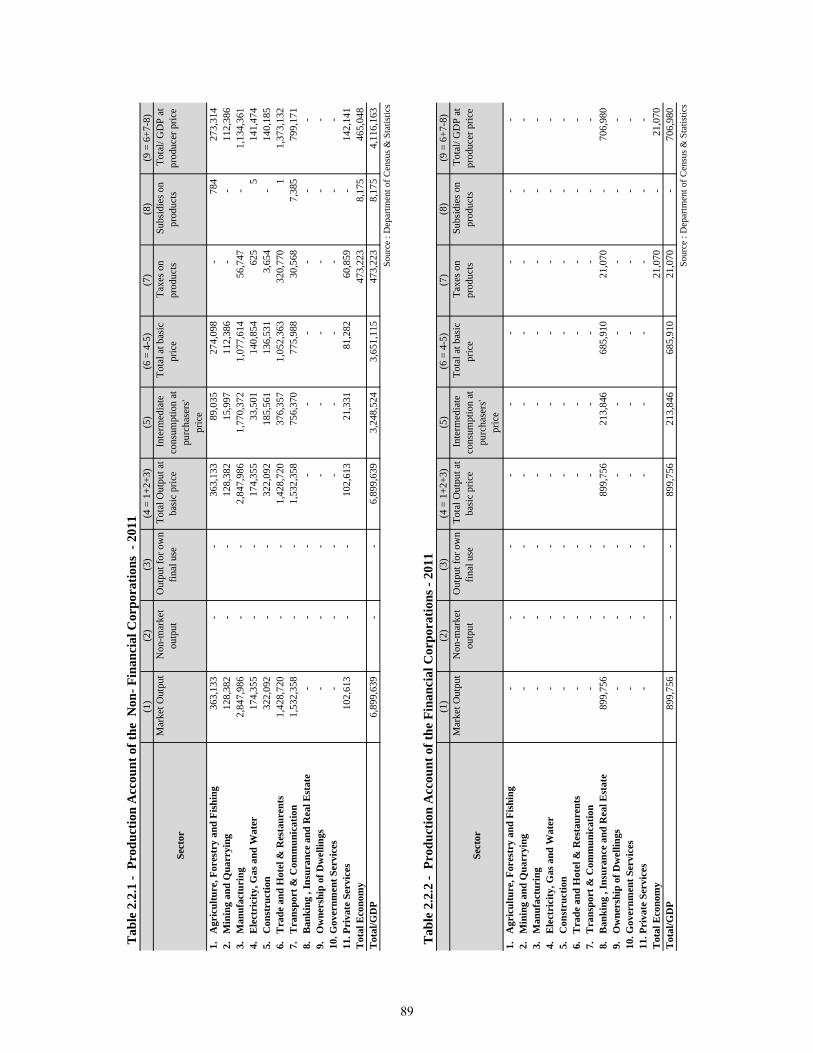
(1)
(2)
(3)
(4 =
1+2
+3)
(5)
(6 =
4-5
)(7
)(8
)(9
= 6
+7-8
)
Sec
tor
Mar
ket O
utpu
t N
on-m
arke
t ou
tput
O
utpu
t for
ow
n fin
al u
se
Tota
l Out
put a
t ba
sic
pric
e In
term
edia
te
cons
umpt
ion
at
purc
hase
rs'
pric
e
Tot
al a
t bas
ic
pric
e T
axes
on
prod
ucts
S
ubsi
dies
on
prod
ucts
T
otal
/ GD
P at
pr
oduc
er p
rice
1.
Agr
icul
ture
, For
estr
y an
d Fi
shin
g36
3,13
3
-
-
36
3,13
3
89
,035
27
4,09
8
-
78
4
27
3,31
4
2.
M
inin
g an
d Q
uarr
ying
128,
382
-
-
128,
382
15,9
97
112,
386
-
-
112,
386
3.
Man
ufac
turi
ng2,
847,
986
-
-
2,
847,
986
1,
770,
372
1,
077,
614
56
,747
-
1,
134,
361
4.
E
lect
rici
ty, G
as a
nd W
ater
174,
355
-
-
174,
355
33,5
01
140,
854
625
5
14
1,47
4
5.
C
onst
ruct
ion
322,
092
-
-
322,
092
185,
561
136,
531
3,65
4
-
140,
185
6.
Tra
de a
nd H
otel
& R
esta
uren
ts1,
428,
720
-
-
1,
428,
720
37
6,35
7
1,
052,
363
32
0,77
0
1
1,37
3,13
2
7.
Tra
nspo
rt &
Com
mun
icat
ion
1,53
2,35
8
-
-
1,53
2,35
8
756,
370
775,
988
30,5
68
7,38
5
799,
171
8.
Ban
king
, In
sura
nce
and
Rea
l Est
ate
-
-
-
-
-
-
-
-
-
9.
Ow
ners
hip
of D
wel
lings
-
-
-
-
-
-
-
-
-
10. G
over
nmen
t Ser
vice
s -
-
-
-
-
-
-
-
-
11
. Pri
vate
Ser
vice
s10
2,61
3
-
-
10
2,61
3
21
,331
81
,282
60
,859
-
14
2,14
1
T
otal
Eco
nom
y47
3,22
3
8,
175
46
5,04
8
T
otal
/GD
P6,
899,
639
-
-
6,
899,
639
3,
248,
524
3,
651,
115
47
3,22
3
8,
175
4,
116,
163
S
ourc
e : D
epar
tmen
t of C
ensu
s & S
tatis
tics
(1)
(2)
(3)
(4 =
1+2
+3)
(5)
(6 =
4-5
)(7
)(8
)(9
= 6
+7-8
)
Sec
tor
Mar
ket O
utpu
t N
on-m
arke
t ou
tput
O
utpu
t for
ow
n fin
al u
se
Tota
l Out
put a
t ba
sic
pric
e In
term
edia
te
cons
umpt
ion
at
purc
hase
rs'
pric
e
Tot
al a
t bas
ic
pric
e T
axes
on
prod
ucts
S
ubsi
dies
on
prod
ucts
T
otal
/ GD
P at
pr
oduc
er p
rice
1.
Agr
icul
ture
, For
estr
y an
d Fi
shin
g-
-
-
-
-
-
-
-
-
2.
M
inin
g an
d Q
uarr
ying
-
-
-
-
-
-
-
-
-
3.
Man
ufac
turi
ng-
-
-
-
-
-
-
-
-
4.
E
lect
rici
ty, G
as a
nd W
ater
-
-
-
-
-
-
-
-
-
5.
Con
stru
ctio
n -
-
-
-
-
-
-
-
-
6.
T
rade
and
Hot
el &
Res
taur
ents
-
-
-
-
-
-
-
-
-
7.
Tra
nspo
rt &
Com
mun
icat
ion
-
-
-
-
-
-
-
-
-
8.
Ban
king
, In
sura
nce
and
Rea
l Est
ate
899,
756
-
-
899,
756
213,
846
685,
910
21,0
70
-
706,
980
9.
Ow
ners
hip
of D
wel
lings
-
-
-
-
-
-
-
-
-
10. G
over
nmen
t Ser
vice
s -
-
-
-
-
-
-
-
-
11
. Pri
vate
Ser
vice
s-
-
-
-
-
-
-
-
-
T
otal
Eco
nom
y21
,070
-
21
,070
T
otal
/GD
P89
9,75
6
-
-
89
9,75
6
21
3,84
6
68
5,91
0
21
,070
-
70
6,98
0
S
ourc
e : D
epar
tmen
t of C
ensu
s & S
tatis
tics
Tab
le 2
.2.1
- P
rodu
ctio
n A
ccou
nt o
f the
Non
- Fin
anci
al C
orpo
ratio
ns -
201
1
Tab
le 2
.2.2
- P
rodu
ctio
n A
ccou
nt o
f the
Fin
anci
al C
orpo
ratio
ns -
2011
89
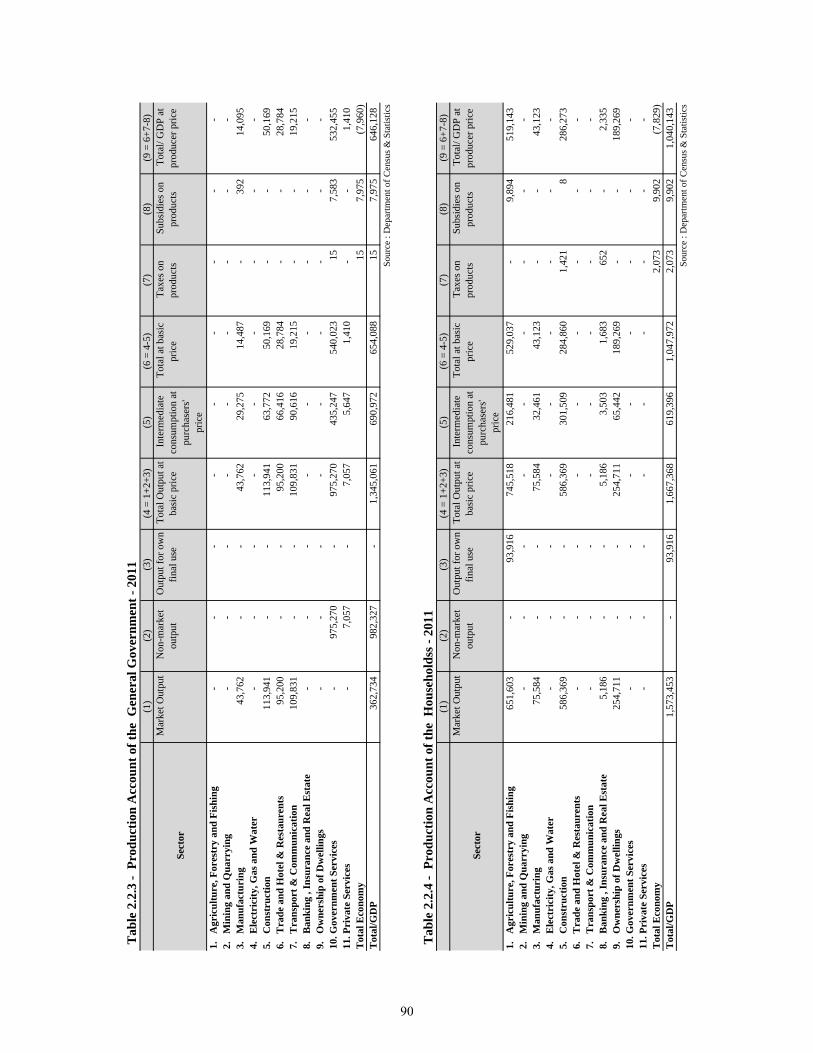
(1)
(2)
(3)
(4 =
1+2
+3)
(5)
(6 =
4-5
)(7
)(8
)(9
= 6
+7-8
)
Sec
tor
Mar
ket O
utpu
t N
on-m
arke
t ou
tput
O
utpu
t for
ow
n fin
al u
se
Tota
l Out
put a
t ba
sic
pric
e In
term
edia
te
cons
umpt
ion
at
purc
hase
rs'
pric
e
Tot
al a
t bas
ic
pric
e T
axes
on
prod
ucts
S
ubsi
dies
on
prod
ucts
T
otal
/ GD
P at
pr
oduc
er p
rice
1.
Agr
icul
ture
, For
estr
y an
d Fi
shin
g-
-
-
-
-
-
-
-
-
2.
M
inin
g an
d Q
uarr
ying
-
-
-
-
-
-
-
-
-
3.
Man
ufac
turi
ng43
,762
-
-
43
,762
29
,275
14
,487
-
39
2
14
,095
4.
E
lect
rici
ty, G
as a
nd W
ater
-
-
-
-
-
-
-
-
-
5.
Con
stru
ctio
n 11
3,94
1
-
-
11
3,94
1
63
,772
50
,169
-
-
50
,169
6.
T
rade
and
Hot
el &
Res
taur
ents
95,2
00
-
-
95,2
00
66,4
16
28,7
84
-
-
28,7
84
7.
Tra
nspo
rt &
Com
mun
icat
ion
109,
831
-
-
109,
831
90,6
16
19,2
15
-
-
19,2
15
8.
Ban
king
, In
sura
nce
and
Rea
l Est
ate
-
-
-
-
-
-
-
-
-
9.
Ow
ners
hip
of D
wel
lings
-
-
-
-
-
-
-
-
-
10. G
over
nmen
t Ser
vice
s -
97
5,27
0
-
97
5,27
0
43
5,24
7
54
0,02
3
15
7,
583
53
2,45
5
11
. Pri
vate
Ser
vice
s-
7,
057
-
7,
057
5,
647
1,
410
-
-
1,
410
T
otal
Eco
nom
y15
7,
975
(7
,960
)
Tot
al/G
DP
362,
734
982,
327
-
1,34
5,06
1
690,
972
654,
088
15
7,97
5
646,
128
Sou
rce
: Dep
artm
ent o
f Cen
sus &
Sta
tistic
s
(1)
(2)
(3)
(4 =
1+2
+3)
(5)
(6 =
4-5
)(7
)(8
)(9
= 6
+7-8
)
Sec
tor
Mar
ket O
utpu
t N
on-m
arke
t ou
tput
O
utpu
t for
ow
n fin
al u
se
Tota
l Out
put a
t ba
sic
pric
e In
term
edia
te
cons
umpt
ion
at
purc
hase
rs'
pric
e
Tot
al a
t bas
ic
pric
e T
axes
on
prod
ucts
S
ubsi
dies
on
prod
ucts
T
otal
/ GD
P at
pr
oduc
er p
rice
1.
Agr
icul
ture
, For
estr
y an
d Fi
shin
g65
1,60
3
-
93
,916
74
5,51
8
21
6,48
1
52
9,03
7
-
9,
894
51
9,14
3
2.
M
inin
g an
d Q
uarr
ying
-
-
-
-
-
-
-
-
-
3.
Man
ufac
turi
ng75
,584
-
-
75
,584
32
,461
43
,123
-
-
43
,123
4.
E
lect
rici
ty, G
as a
nd W
ater
-
-
-
-
-
-
-
-
-
5.
Con
stru
ctio
n 58
6,36
9
-
-
58
6,36
9
30
1,50
9
28
4,86
0
1,
421
8
286,
273
6.
Tra
de a
nd H
otel
& R
esta
uren
ts-
-
-
-
-
-
-
-
-
7.
T
rans
port
& C
omm
unic
atio
n -
-
-
-
-
-
-
-
-
8.
B
anki
ng ,
Insu
ranc
e an
d R
eal E
stat
e5,
186
-
-
5,
186
3,
503
1,
683
65
2
-
2,
335
9.
O
wne
rshi
p of
Dw
ellin
gs25
4,71
1
-
-
25
4,71
1
65
,442
18
9,26
9
-
-
18
9,26
9
10
. Gov
ernm
ent S
ervi
ces
-
-
-
-
-
-
-
-
-
11. P
riva
te S
ervi
ces
-
-
-
-
-
-
-
-
-
Tot
al E
cono
my
2,07
3
9,90
2
(7,8
29)
T
otal
/GD
P1,
573,
453
-
93
,916
1,
667,
368
61
9,39
6
1,
047,
972
2,
073
9,
902
1,
040,
143
S
ourc
e : D
epar
tmen
t of C
ensu
s & S
tatis
tics
Tab
le 2
.2.3
- P
rodu
ctio
n A
ccou
nt o
f the
Gen
eral
Gov
ernm
ent -
201
1
Tab
le 2
.2.4
- P
rodu
ctio
n A
ccou
nt o
f the
Hou
seho
ldss
- 20
11
90
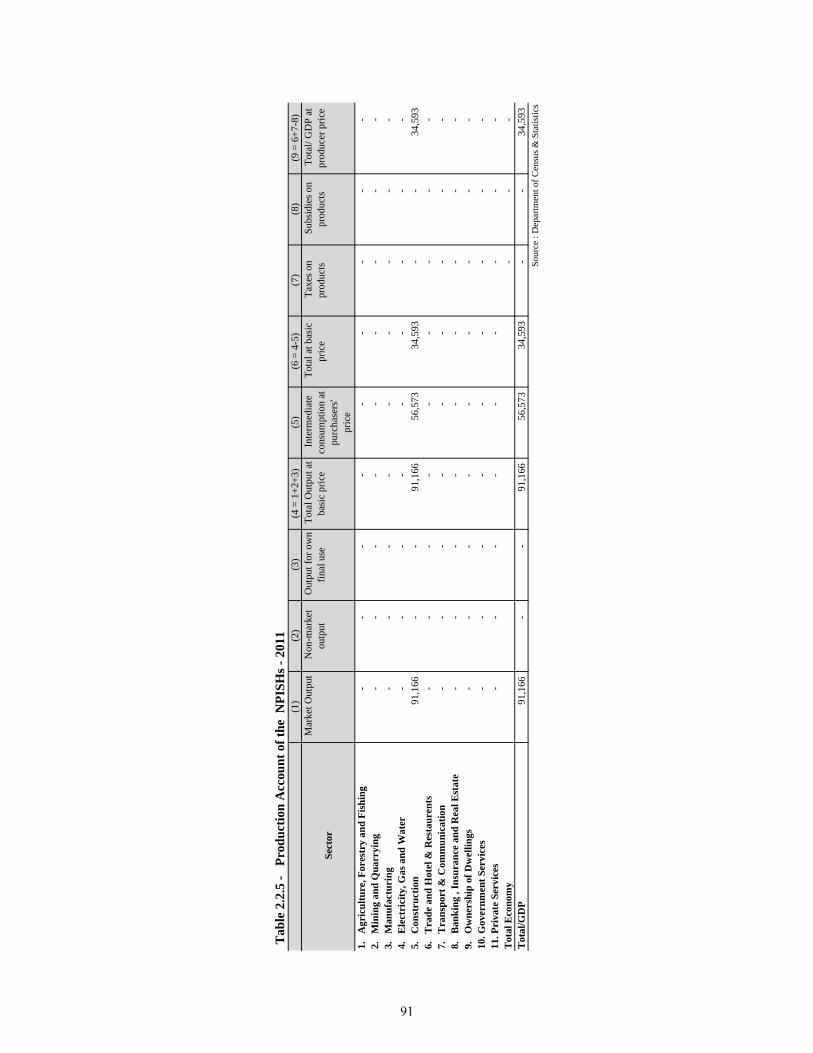
(1)
(2)
(3)
(4 =
1+2
+3)
(5)
(6 =
4-5
)(7
)(8
)(9
= 6
+7-8
)
Sec
tor
Mar
ket O
utpu
t N
on-m
arke
t ou
tput
O
utpu
t for
ow
n fin
al u
se
Tota
l Out
put a
t ba
sic
pric
e In
term
edia
te
cons
umpt
ion
at
purc
hase
rs'
pric
e
Tot
al a
t bas
ic
pric
e T
axes
on
prod
ucts
S
ubsi
dies
on
prod
ucts
T
otal
/ GD
P at
pr
oduc
er p
rice
1.
Agr
icul
ture
, For
estr
y an
d Fi
shin
g-
-
-
-
-
-
-
-
-
2.
M
inin
g an
d Q
uarr
ying
-
-
-
-
-
-
-
-
-
3.
Man
ufac
turi
ng-
-
-
-
-
-
-
-
-
4.
E
lect
rici
ty, G
as a
nd W
ater
-
-
-
-
-
-
-
-
-
5.
Con
stru
ctio
n 91
,166
-
-
91
,166
56
,573
34
,593
-
-
34
,593
6.
T
rade
and
Hot
el &
Res
taur
ents
-
-
-
-
-
-
-
-
-
7.
Tra
nspo
rt &
Com
mun
icat
ion
-
-
-
-
-
-
-
-
-
8.
Ban
king
, In
sura
nce
and
Rea
l Est
ate
-
-
-
-
-
-
-
-
-
9.
Ow
ners
hip
of D
wel
lings
-
-
-
-
-
-
-
-
-
10. G
over
nmen
t Ser
vice
s -
-
-
-
-
-
-
-
-
11
. Pri
vate
Ser
vice
s-
-
-
-
-
-
-
-
-
T
otal
Eco
nom
y-
-
-
T
otal
/GD
P91
,166
-
-
91
,166
56
,573
34
,593
-
-
34
,593
S
ourc
e : D
epar
tmen
t of C
ensu
s & S
tatis
tics
Tab
le 2
.2.5
- P
rodu
ctio
n A
ccou
nt o
f the
NPI
SHs -
201
1
91
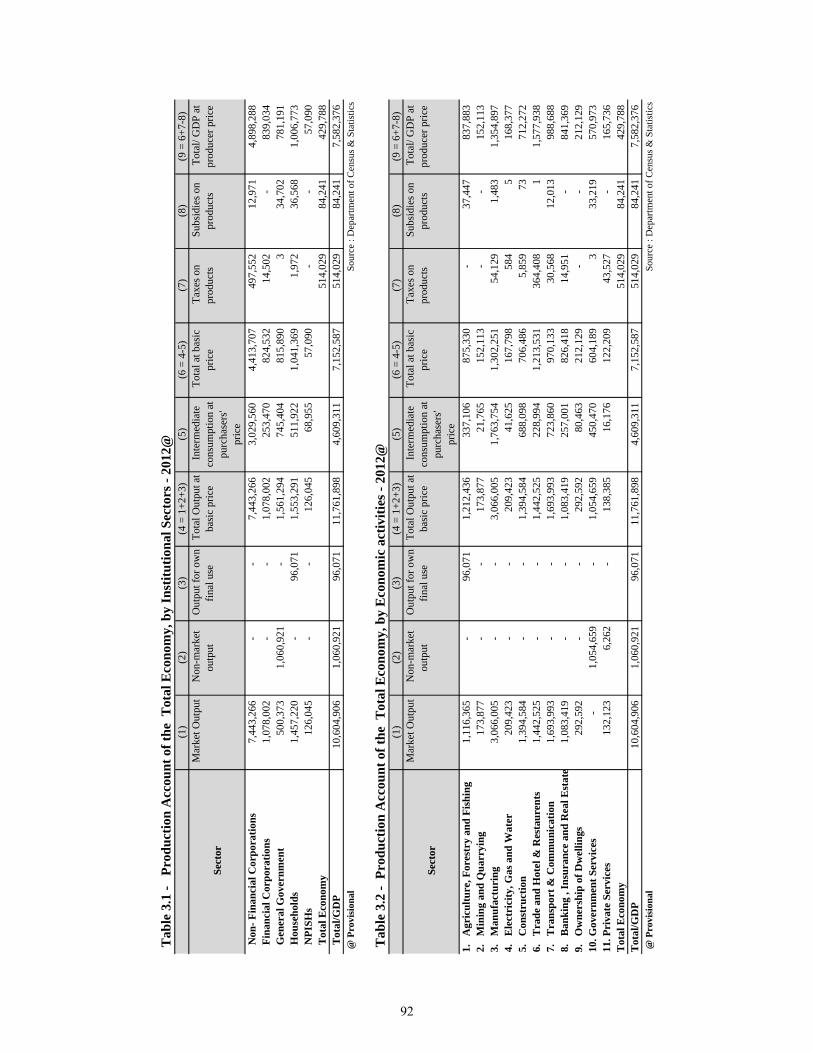
(1)
(2)
(3)
(4 =
1+2
+3)
(5)
(6 =
4-5
)(7
)(8
)(9
= 6
+7-8
)
Sec
tor
Mar
ket O
utpu
t N
on-m
arke
t ou
tput
O
utpu
t for
ow
n fin
al u
se
Tota
l Out
put a
t ba
sic
pric
e In
term
edia
te
cons
umpt
ion
at
purc
hase
rs'
pric
e
Tot
al a
t bas
ic
pric
e T
axes
on
prod
ucts
S
ubsi
dies
on
prod
ucts
T
otal
/ GD
P at
pr
oduc
er p
rice
Non
- Fin
anci
al C
orpo
ratio
ns7,
443,
266
-
-
7,
443,
266
3,
029,
560
4,
413,
707
49
7,55
2
12
,971
4,
898,
288
Fi
nanc
ial C
orpo
ratio
ns1,
078,
002
-
-
1,
078,
002
25
3,47
0
82
4,53
2
14
,502
-
83
9,03
4
G
ener
al G
over
nmen
t50
0,37
3
1,
060,
921
-
1,
561,
294
74
5,40
4
81
5,89
0
3
34,7
02
781,
191
Hou
seho
lds
1,45
7,22
0
-
96,0
71
1,55
3,29
1
511,
922
1,04
1,36
9
1,97
2
36,5
68
1,00
6,77
3
NPI
SHs
126,
045
-
-
126,
045
68,9
55
57,0
90
-
-
57,0
90
Tot
al E
cono
my
514,
029
84,2
41
429,
788
Tot
al/G
DP
10,6
04,9
06
1,
060,
921
96
,071
11
,761
,898
4,60
9,31
1
7,15
2,58
7
514,
029
84,2
41
7,58
2,37
6
@ P
rovi
sion
al
S
ourc
e : D
epar
tmen
t of C
ensu
s & S
tatis
tics
(1)
(2)
(3)
(4 =
1+2
+3)
(5)
(6 =
4-5
)(7
)(8
)(9
= 6
+7-8
)
Sec
tor
Mar
ket O
utpu
t N
on-m
arke
t ou
tput
O
utpu
t for
ow
n fin
al u
se
Tota
l Out
put a
t ba
sic
pric
e In
term
edia
te
cons
umpt
ion
at
purc
hase
rs'
pric
e
Tot
al a
t bas
ic
pric
e T
axes
on
prod
ucts
S
ubsi
dies
on
prod
ucts
T
otal
/ GD
P at
pr
oduc
er p
rice
1.
Agr
icul
ture
, For
estr
y an
d Fi
shin
g1,
116,
365
-
96
,071
1,
212,
436
33
7,10
6
87
5,33
0
-
37
,447
83
7,88
3
2.
M
inin
g an
d Q
uarr
ying
173,
877
-
-
173,
877
21,7
65
152,
113
-
-
152,
113
3.
Man
ufac
turi
ng3,
066,
005
-
-
3,
066,
005
1,
763,
754
1,
302,
251
54
,129
1,
483
1,
354,
897
4.
E
lect
rici
ty, G
as a
nd W
ater
209,
423
-
-
209,
423
41,6
25
167,
798
584
5
16
8,37
7
5.
C
onst
ruct
ion
1,39
4,58
4
-
-
1,39
4,58
4
688,
098
706,
486
5,85
9
73
712,
272
6.
Tra
de a
nd H
otel
& R
esta
uren
ts1,
442,
525
-
-
1,
442,
525
22
8,99
4
1,
213,
531
36
4,40
8
1
1,57
7,93
8
7.
Tra
nspo
rt &
Com
mun
icat
ion
1,69
3,99
3
-
-
1,69
3,99
3
723,
860
970,
133
30,5
68
12,0
13
988,
688
8.
Ban
king
, In
sura
nce
and
Rea
l Est
ate
1,08
3,41
9
-
-
1,08
3,41
9
257,
001
826,
418
14,9
51
-
841,
369
9.
Ow
ners
hip
of D
wel
lings
292,
592
-
-
292,
592
80,4
63
212,
129
-
-
212,
129
10. G
over
nmen
t Ser
vice
s -
1,
054,
659
-
1,
054,
659
45
0,47
0
60
4,18
9
3
33,2
19
570,
973
11. P
riva
te S
ervi
ces
132,
123
6,26
2
-
138,
385
16,1
76
122,
209
43,5
27
-
165,
736
Tot
al E
cono
my
514,
029
84,2
41
429,
788
Tot
al/G
DP
10,6
04,9
06
1,
060,
921
96
,071
11
,761
,898
4,60
9,31
1
7,15
2,58
7
514,
029
84,2
41
7,58
2,37
6
@ P
rovi
sion
al
S
ourc
e : D
epar
tmen
t of C
ensu
s & S
tatis
tics
Tab
le 3
.1 -
Pro
duct
ion
Acc
ount
of t
he T
otal
Eco
nom
y, b
y In
stitu
tiona
l Sec
tors
- 20
12@
Tab
le 3
.2 -
Pro
duct
ion
Acc
ount
of t
he T
otal
Eco
nom
y, b
y E
cono
mic
act
iviti
es -
2012
@
92
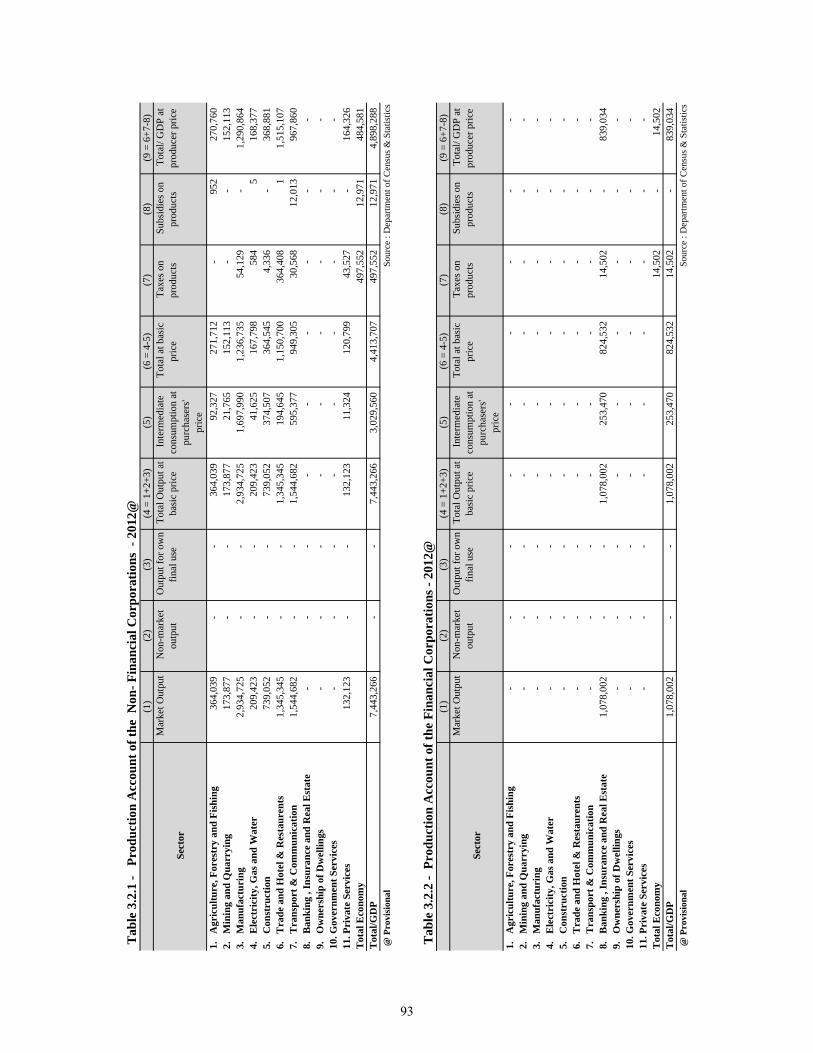
(1)
(2)
(3)
(4 =
1+2
+3)
(5)
(6 =
4-5
)(7
)(8
)(9
= 6
+7-8
)
Sec
tor
Mar
ket O
utpu
t N
on-m
arke
t ou
tput
O
utpu
t for
ow
n fin
al u
se
Tota
l Out
put a
t ba
sic
pric
e In
term
edia
te
cons
umpt
ion
at
purc
hase
rs'
pric
e
Tot
al a
t bas
ic
pric
e T
axes
on
prod
ucts
S
ubsi
dies
on
prod
ucts
T
otal
/ GD
P at
pr
oduc
er p
rice
1.
Agr
icul
ture
, For
estr
y an
d Fi
shin
g36
4,03
9
-
-
36
4,03
9
92
,327
27
1,71
2
-
95
2
27
0,76
0
2.
M
inin
g an
d Q
uarr
ying
173,
877
-
-
173,
877
21,7
65
152,
113
-
-
152,
113
3.
Man
ufac
turi
ng2,
934,
725
-
-
2,
934,
725
1,
697,
990
1,
236,
735
54
,129
-
1,
290,
864
4.
E
lect
rici
ty, G
as a
nd W
ater
209,
423
-
-
209,
423
41,6
25
167,
798
584
5
16
8,37
7
5.
C
onst
ruct
ion
739,
052
-
-
739,
052
374,
507
364,
545
4,33
6
-
368,
881
6.
Tra
de a
nd H
otel
& R
esta
uren
ts1,
345,
345
-
-
1,
345,
345
19
4,64
5
1,
150,
700
36
4,40
8
1
1,51
5,10
7
7.
Tra
nspo
rt &
Com
mun
icat
ion
1,54
4,68
2
-
-
1,54
4,68
2
595,
377
949,
305
30,5
68
12,0
13
967,
860
8.
Ban
king
, In
sura
nce
and
Rea
l Est
ate
-
-
-
-
-
-
-
-
-
9.
Ow
ners
hip
of D
wel
lings
-
-
-
-
-
-
-
-
-
10. G
over
nmen
t Ser
vice
s -
-
-
-
-
-
-
-
-
11
. Pri
vate
Ser
vice
s13
2,12
3
-
-
13
2,12
3
11
,324
12
0,79
9
43
,527
-
16
4,32
6
T
otal
Eco
nom
y49
7,55
2
12
,971
48
4,58
1
T
otal
/GD
P7,
443,
266
-
-
7,
443,
266
3,
029,
560
4,
413,
707
49
7,55
2
12
,971
4,
898,
288
@
Pro
visi
onal
Sou
rce
: Dep
artm
ent o
f Cen
sus &
Sta
tistic
s
(1)
(2)
(3)
(4 =
1+2
+3)
(5)
(6 =
4-5
)(7
)(8
)(9
= 6
+7-8
)
Sec
tor
Mar
ket O
utpu
t N
on-m
arke
t ou
tput
O
utpu
t for
ow
n fin
al u
se
Tota
l Out
put a
t ba
sic
pric
e In
term
edia
te
cons
umpt
ion
at
purc
hase
rs'
pric
e
Tot
al a
t bas
ic
pric
e T
axes
on
prod
ucts
S
ubsi
dies
on
prod
ucts
T
otal
/ GD
P at
pr
oduc
er p
rice
1.
Agr
icul
ture
, For
estr
y an
d Fi
shin
g-
-
-
-
-
-
-
-
-
2.
M
inin
g an
d Q
uarr
ying
-
-
-
-
-
-
-
-
-
3.
Man
ufac
turi
ng-
-
-
-
-
-
-
-
-
4.
E
lect
rici
ty, G
as a
nd W
ater
-
-
-
-
-
-
-
-
-
5.
Con
stru
ctio
n -
-
-
-
-
-
-
-
-
6.
T
rade
and
Hot
el &
Res
taur
ents
-
-
-
-
-
-
-
-
-
7.
Tra
nspo
rt &
Com
mun
icat
ion
-
-
-
-
-
-
-
-
-
8.
Ban
king
, In
sura
nce
and
Rea
l Est
ate
1,07
8,00
2
-
-
1,07
8,00
2
253,
470
824,
532
14,5
02
-
839,
034
9.
Ow
ners
hip
of D
wel
lings
-
-
-
-
-
-
-
-
-
10. G
over
nmen
t Ser
vice
s -
-
-
-
-
-
-
-
-
11
. Pri
vate
Ser
vice
s-
-
-
-
-
-
-
-
-
T
otal
Eco
nom
y14
,502
-
14
,502
T
otal
/GD
P1,
078,
002
-
-
1,
078,
002
25
3,47
0
82
4,53
2
14
,502
-
83
9,03
4
@
Pro
visi
onal
Sou
rce
: Dep
artm
ent o
f Cen
sus &
Sta
tistic
s
Tab
le 3
.2.1
- P
rodu
ctio
n A
ccou
nt o
f the
Non
- Fin
anci
al C
orpo
ratio
ns -
201
2@
Tab
le 3
.2.2
- P
rodu
ctio
n A
ccou
nt o
f the
Fin
anci
al C
orpo
ratio
ns -
2012
@
93
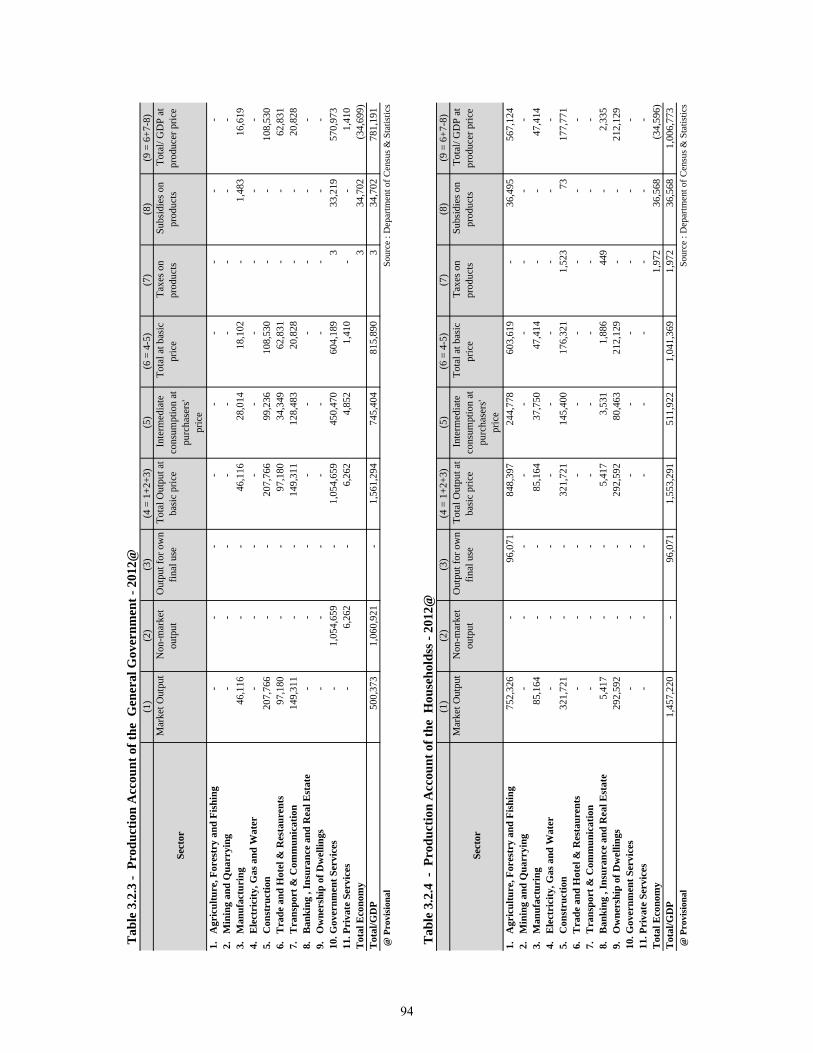
(1)
(2)
(3)
(4 =
1+2
+3)
(5)
(6 =
4-5
)(7
)(8
)(9
= 6
+7-8
)
Sec
tor
Mar
ket O
utpu
t N
on-m
arke
t ou
tput
O
utpu
t for
ow
n fin
al u
se
Tota
l Out
put a
t ba
sic
pric
e In
term
edia
te
cons
umpt
ion
at
purc
hase
rs'
pric
e
Tot
al a
t bas
ic
pric
e T
axes
on
prod
ucts
S
ubsi
dies
on
prod
ucts
T
otal
/ GD
P at
pr
oduc
er p
rice
1.
Agr
icul
ture
, For
estr
y an
d Fi
shin
g-
-
-
-
-
-
-
-
-
2.
M
inin
g an
d Q
uarr
ying
-
-
-
-
-
-
-
-
-
3.
Man
ufac
turi
ng46
,116
-
-
46
,116
28
,014
18
,102
-
1,
483
16
,619
4.
E
lect
rici
ty, G
as a
nd W
ater
-
-
-
-
-
-
-
-
-
5.
Con
stru
ctio
n 20
7,76
6
-
-
20
7,76
6
99
,236
10
8,53
0
-
-
10
8,53
0
6.
T
rade
and
Hot
el &
Res
taur
ents
97,1
80
-
-
97,1
80
34,3
49
62,8
31
-
-
62,8
31
7.
Tra
nspo
rt &
Com
mun
icat
ion
149,
311
-
-
149,
311
128,
483
20,8
28
-
-
20,8
28
8.
Ban
king
, In
sura
nce
and
Rea
l Est
ate
-
-
-
-
-
-
-
-
-
9.
Ow
ners
hip
of D
wel
lings
-
-
-
-
-
-
-
-
-
10. G
over
nmen
t Ser
vice
s -
1,
054,
659
-
1,
054,
659
45
0,47
0
60
4,18
9
3
33,2
19
570,
973
11. P
riva
te S
ervi
ces
-
6,26
2
-
6,26
2
4,85
2
1,41
0
-
-
1,41
0
Tot
al E
cono
my
3
34
,702
(3
4,69
9)
T
otal
/GD
P50
0,37
3
1,
060,
921
-
1,
561,
294
74
5,40
4
81
5,89
0
3
34,7
02
781,
191
@ P
rovi
sion
al
S
ourc
e : D
epar
tmen
t of C
ensu
s & S
tatis
tics
(1)
(2)
(3)
(4 =
1+2
+3)
(5)
(6 =
4-5
)(7
)(8
)(9
= 6
+7-8
)
Sec
tor
Mar
ket O
utpu
t N
on-m
arke
t ou
tput
O
utpu
t for
ow
n fin
al u
se
Tota
l Out
put a
t ba
sic
pric
e In
term
edia
te
cons
umpt
ion
at
purc
hase
rs'
pric
e
Tot
al a
t bas
ic
pric
e T
axes
on
prod
ucts
S
ubsi
dies
on
prod
ucts
T
otal
/ GD
P at
pr
oduc
er p
rice
1.
Agr
icul
ture
, For
estr
y an
d Fi
shin
g75
2,32
6
-
96
,071
84
8,39
7
24
4,77
8
60
3,61
9
-
36
,495
56
7,12
4
2.
M
inin
g an
d Q
uarr
ying
-
-
-
-
-
-
-
-
-
3.
Man
ufac
turi
ng85
,164
-
-
85
,164
37
,750
47
,414
-
-
47
,414
4.
E
lect
rici
ty, G
as a
nd W
ater
-
-
-
-
-
-
-
-
-
5.
Con
stru
ctio
n 32
1,72
1
-
-
32
1,72
1
14
5,40
0
17
6,32
1
1,
523
73
17
7,77
1
6.
T
rade
and
Hot
el &
Res
taur
ents
-
-
-
-
-
-
-
-
-
7.
Tra
nspo
rt &
Com
mun
icat
ion
-
-
-
-
-
-
-
-
-
8.
Ban
king
, In
sura
nce
and
Rea
l Est
ate
5,41
7
-
-
5,41
7
3,53
1
1,88
6
449
-
2,33
5
9.
Ow
ners
hip
of D
wel
lings
292,
592
-
-
292,
592
80,4
63
212,
129
-
-
212,
129
10. G
over
nmen
t Ser
vice
s -
-
-
-
-
-
-
-
-
11
. Pri
vate
Ser
vice
s-
-
-
-
-
-
-
-
-
T
otal
Eco
nom
y1,
972
36
,568
(3
4,59
6)
T
otal
/GD
P1,
457,
220
-
96
,071
1,
553,
291
51
1,92
2
1,
041,
369
1,
972
36
,568
1,
006,
773
@
Pro
visi
onal
Sou
rce
: Dep
artm
ent o
f Cen
sus &
Sta
tistic
s
Tab
le 3
.2.3
- P
rodu
ctio
n A
ccou
nt o
f the
Gen
eral
Gov
ernm
ent -
201
2@
Tab
le 3
.2.4
- P
rodu
ctio
n A
ccou
nt o
f the
Hou
seho
ldss
- 20
12@
94

(1)
(2)
(3)
(4 =
1+2
+3)
(5)
(6 =
4-5
)(7
)(8
)(9
= 6
+7-8
)
Sec
tor
Mar
ket O
utpu
t N
on-m
arke
t ou
tput
O
utpu
t for
ow
n fin
al u
se
Tota
l Out
put a
t ba
sic
pric
e In
term
edia
te
cons
umpt
ion
at
purc
hase
rs'
pric
e
Tot
al a
t bas
ic
pric
e T
axes
on
prod
ucts
S
ubsi
dies
on
prod
ucts
T
otal
/ GD
P at
pr
oduc
er p
rice
1.
Agr
icul
ture
, For
estr
y an
d Fi
shin
g-
-
-
-
-
-
-
-
-
2.
M
inin
g an
d Q
uarr
ying
-
-
-
-
-
-
-
-
-
3.
Man
ufac
turi
ng-
-
-
-
-
-
-
-
-
4.
E
lect
rici
ty, G
as a
nd W
ater
-
-
-
-
-
-
-
-
-
5.
Con
stru
ctio
n 12
6,04
5
-
-
12
6,04
5
68
,955
57
,090
-
-
57
,090
6.
T
rade
and
Hot
el &
Res
taur
ents
-
-
-
-
-
-
-
-
-
7.
Tra
nspo
rt &
Com
mun
icat
ion
-
-
-
-
-
-
-
-
-
8.
Ban
king
, In
sura
nce
and
Rea
l Est
ate
-
-
-
-
-
-
-
-
-
9.
Ow
ners
hip
of D
wel
lings
-
-
-
-
-
-
-
-
-
10. G
over
nmen
t Ser
vice
s -
-
-
-
-
-
-
-
-
11
. Pri
vate
Ser
vice
s-
-
-
-
-
-
-
-
-
T
otal
Eco
nom
y-
-
-
T
otal
/GD
P12
6,04
5
-
-
12
6,04
5
68
,955
57
,090
-
-
57
,090
@
Pro
visi
onal
Sou
rce
: Dep
artm
ent o
f Cen
sus &
Sta
tistic
s
Tab
le 3
.2.5
- P
rodu
ctio
n A
ccou
nt o
f the
NPI
SHs -
201
2@
95
SPECIAL APPENDIX
TABLES
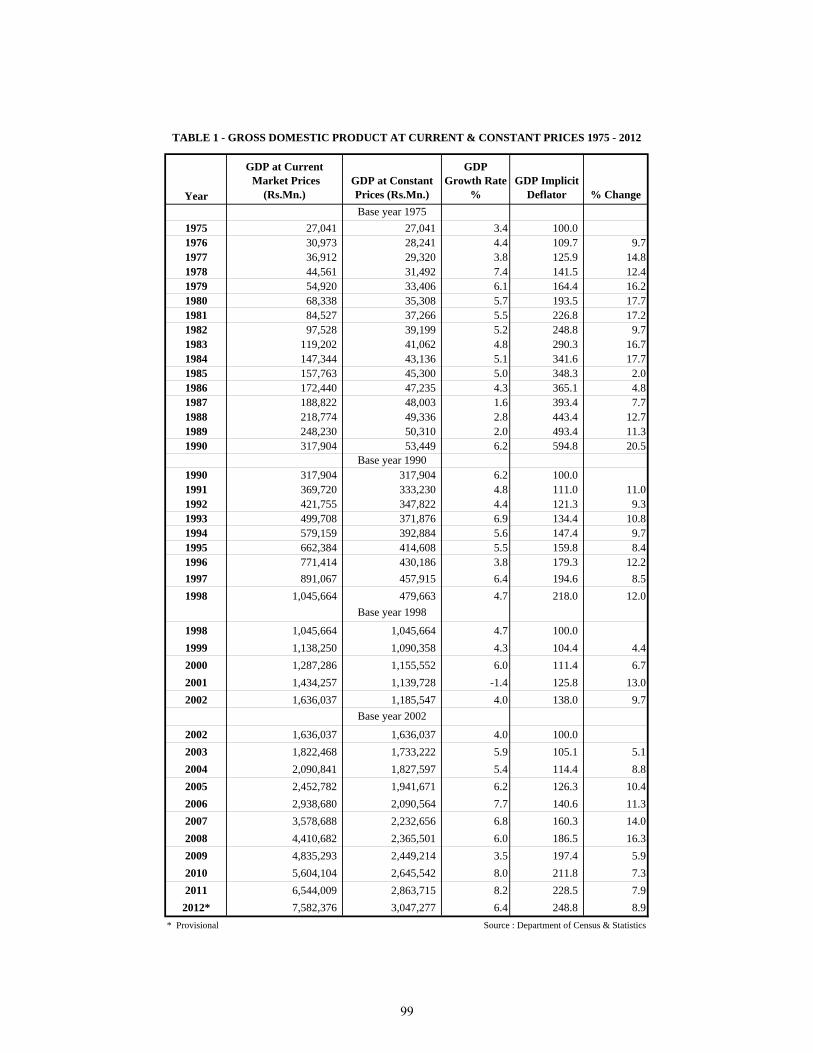
Year
GDP at Current Market Prices
(Rs.Mn.)GDP at Constant Prices (Rs.Mn.)
GDP Growth Rate
%GDP Implicit
Deflator % ChangeBase year 1975
1975 27,041 27,041 3.4 100.0 1976 30,973 28,241 4.4 109.7 9.71977 36,912 29,320 3.8 125.9 14.81978 44,561 31,492 7.4 141.5 12.41979 54,920 33,406 6.1 164.4 16.21980 68,338 35,308 5.7 193.5 17.71981 84,527 37,266 5.5 226.8 17.21982 97,528 39,199 5.2 248.8 9.71983 119,202 41,062 4.8 290.3 16.71984 147,344 43,136 5.1 341.6 17.71985 157,763 45,300 5.0 348.3 2.01986 172,440 47,235 4.3 365.1 4.81987 188,822 48,003 1.6 393.4 7.71988 218,774 49,336 2.8 443.4 12.71989 248,230 50,310 2.0 493.4 11.31990 317,904 53,449 6.2 594.8 20.5
Base year 19901990 317,904 317,904 6.2 100.0 1991 369,720 333,230 4.8 111.0 11.01992 421,755 347,822 4.4 121.3 9.31993 499,708 371,876 6.9 134.4 10.81994 579,159 392,884 5.6 147.4 9.71995 662,384 414,608 5.5 159.8 8.41996 771,414 430,186 3.8 179.3 12.21997 891,067 457,915 6.4 194.6 8.51998 1,045,664 479,663 4.7 218.0 12.0
Base year 1998
1998 1,045,664 1,045,664 4.7 100.0 1999 1,138,250 1,090,358 4.3 104.4 4.42000 1,287,286 1,155,552 6.0 111.4 6.72001 1,434,257 1,139,728 -1.4 125.8 13.02002 1,636,037 1,185,547 4.0 138.0 9.7
Base year 2002
2002 1,636,037 1,636,037 4.0 100.0 2003 1,822,468 1,733,222 5.9 105.1 5.12004 2,090,841 1,827,597 5.4 114.4 8.82005 2,452,782 1,941,671 6.2 126.3 10.42006 2,938,680 2,090,564 7.7 140.6 11.32007 3,578,688 2,232,656 6.8 160.3 14.02008 4,410,682 2,365,501 6.0 186.5 16.32009 4,835,293 2,449,214 3.5 197.4 5.92010 5,604,104 2,645,542 8.0 211.8 7.32011 6,544,009 2,863,715 8.2 228.5 7.92012* 7,582,376 3,047,277 6.4 248.8 8.9
* Provisional Source : Department of Census & Statistics
TABLE 1 - GROSS DOMESTIC PRODUCT AT CURRENT & CONSTANT PRICES 1975 - 2012
99
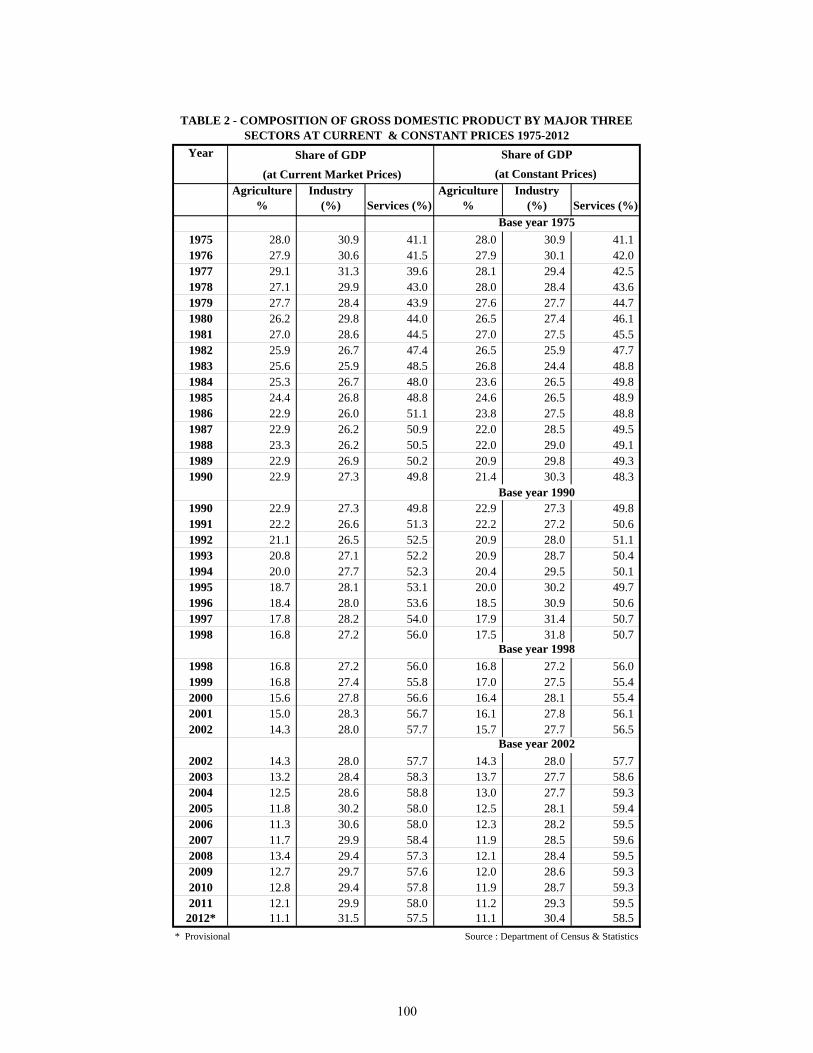
Agriculture %
Industry (%) Services (%)
Agriculture %
Industry (%) Services (%)
1975 28.0 30.9 41.1 28.0 30.9 41.1 1976 27.9 30.6 41.5 27.9 30.1 42.0 1977 29.1 31.3 39.6 28.1 29.4 42.5 1978 27.1 29.9 43.0 28.0 28.4 43.6 1979 27.7 28.4 43.9 27.6 27.7 44.7 1980 26.2 29.8 44.0 26.5 27.4 46.1 1981 27.0 28.6 44.5 27.0 27.5 45.5 1982 25.9 26.7 47.4 26.5 25.9 47.7 1983 25.6 25.9 48.5 26.8 24.4 48.8 1984 25.3 26.7 48.0 23.6 26.5 49.8 1985 24.4 26.8 48.8 24.6 26.5 48.9 1986 22.9 26.0 51.1 23.8 27.5 48.8 1987 22.9 26.2 50.9 22.0 28.5 49.5 1988 23.3 26.2 50.5 22.0 29.0 49.1 1989 22.9 26.9 50.2 20.9 29.8 49.3 1990 22.9 27.3 49.8 21.4 30.3 48.3
1990 22.9 27.3 49.8 22.9 27.3 49.8 1991 22.2 26.6 51.3 22.2 27.2 50.6 1992 21.1 26.5 52.5 20.9 28.0 51.1 1993 20.8 27.1 52.2 20.9 28.7 50.4 1994 20.0 27.7 52.3 20.4 29.5 50.1 1995 18.7 28.1 53.1 20.0 30.2 49.7 1996 18.4 28.0 53.6 18.5 30.9 50.6 1997 17.8 28.2 54.0 17.9 31.4 50.7 1998 16.8 27.2 56.0 17.5 31.8 50.7
1998 16.8 27.2 56.0 16.8 27.2 56.0 1999 16.8 27.4 55.8 17.0 27.5 55.4 2000 15.6 27.8 56.6 16.4 28.1 55.4 2001 15.0 28.3 56.7 16.1 27.8 56.1 2002 14.3 28.0 57.7 15.7 27.7 56.5
2002 14.3 28.0 57.7 14.3 28.0 57.7 2003 13.2 28.4 58.3 13.7 27.7 58.6 2004 12.5 28.6 58.8 13.0 27.7 59.3 2005 11.8 30.2 58.0 12.5 28.1 59.4 2006 11.3 30.6 58.0 12.3 28.2 59.5 2007 11.7 29.9 58.4 11.9 28.5 59.6 2008 13.4 29.4 57.3 12.1 28.4 59.5 2009 12.7 29.7 57.6 12.0 28.6 59.3 2010 12.8 29.4 57.8 11.9 28.7 59.3 2011 12.1 29.9 58.0 11.2 29.3 59.5 2012* 11.1 31.5 57.5 11.1 30.4 58.5
* Provisional Source : Department of Census & Statistics
(at Current Market Prices)
Year
TABLE 2 - COMPOSITION OF GROSS DOMESTIC PRODUCT BY MAJOR THREE SECTORS AT CURRENT & CONSTANT PRICES 1975-2012
Base year 1975
Base year 1990
Base year 1998
Base year 2002
Share of GDP Share of GDP (at Constant Prices)
100
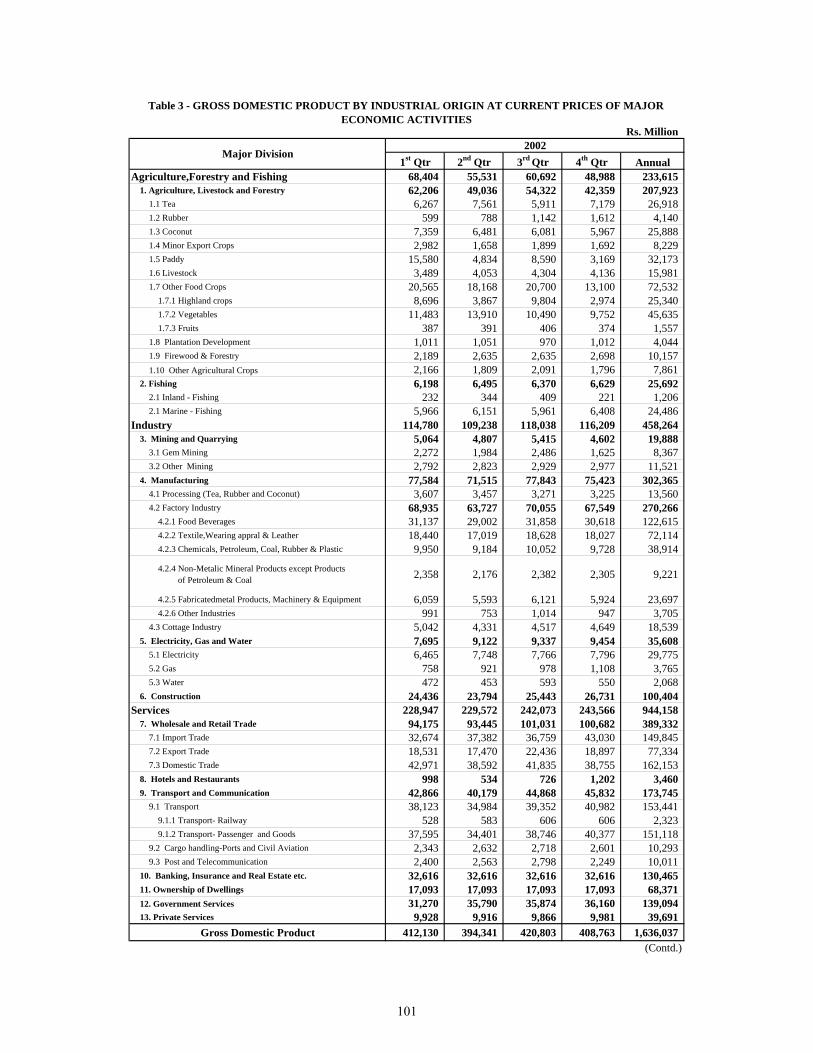
1st Qtr 2nd Qtr 3rd Qtr 4th Qtr AnnualAgriculture,Forestry and Fishing 68,404 55,531 60,692 48,988 233,615
1. Agriculture, Livestock and Forestry 62,206 49,036 54,322 42,359 207,923 1.1 Tea 6,267 7,561 5,911 7,179 26,918 1.2 Rubber 599 788 1,142 1,612 4,140 1.3 Coconut 7,359 6,481 6,081 5,967 25,888 1.4 Minor Export Crops 2,982 1,658 1,899 1,692 8,229 1.5 Paddy 15,580 4,834 8,590 3,169 32,173 1.6 Livestock 3,489 4,053 4,304 4,136 15,981 1.7 Other Food Crops 20,565 18,168 20,700 13,100 72,532
1.7.1 Highland crops 8,696 3,867 9,804 2,974 25,340 1.7.2 Vegetables 11,483 13,910 10,490 9,752 45,635 1.7.3 Fruits 387 391 406 374 1,557
1.8 Plantation Development 1,011 1,051 970 1,012 4,044 1.9 Firewood & Forestry 2,189 2,635 2,635 2,698 10,157 1.10 Other Agricultural Crops 2,166 1,809 2,091 1,796 7,861
2. Fishing 6,198 6,495 6,370 6,629 25,692 2.1 Inland - Fishing 232 344 409 221 1,206 2.1 Marine - Fishing 5,966 6,151 5,961 6,408 24,486
Industry 114,780 109,238 118,038 116,209 458,264 3. Mining and Quarrying 5,064 4,807 5,415 4,602 19,888
3.1 Gem Mining 2,272 1,984 2,486 1,625 8,367 3.2 Other Mining 2,792 2,823 2,929 2,977 11,521
4. Manufacturing 77,584 71,515 77,843 75,423 302,365 4.1 Processing (Tea, Rubber and Coconut) 3,607 3,457 3,271 3,225 13,560 4.2 Factory Industry 68,935 63,727 70,055 67,549 270,266
4.2.1 Food Beverages 31,137 29,002 31,858 30,618 122,615 4.2.2 Textile,Wearing appral & Leather 18,440 17,019 18,628 18,027 72,114 4.2.3 Chemicals, Petroleum, Coal, Rubber & Plastic 9,950 9,184 10,052 9,728 38,914
4.2.4 Non-Metalic Mineral Products except Products of Petroleum & Coal 2,358 2,176 2,382 2,305 9,221
4.2.5 Fabricatedmetal Products, Machinery & Equipment 6,059 5,593 6,121 5,924 23,697 4.2.6 Other Industries 991 753 1,014 947 3,705
4.3 Cottage Industry 5,042 4,331 4,517 4,649 18,539 5. Electricity, Gas and Water 7,695 9,122 9,337 9,454 35,608
5.1 Electricity 6,465 7,748 7,766 7,796 29,775 5.2 Gas 758 921 978 1,108 3,765 5.3 Water 472 453 593 550 2,068
6. Construction 24,436 23,794 25,443 26,731 100,404 Services 228,947 229,572 242,073 243,566 944,158
7. Wholesale and Retail Trade 94,175 93,445 101,031 100,682 389,332 7.1 Import Trade 32,674 37,382 36,759 43,030 149,845 7.2 Export Trade 18,531 17,470 22,436 18,897 77,334 7.3 Domestic Trade 42,971 38,592 41,835 38,755 162,153
8. Hotels and Restaurants 998 534 726 1,202 3,460 9. Transport and Communication 42,866 40,179 44,868 45,832 173,745
9.1 Transport 38,123 34,984 39,352 40,982 153,441 9.1.1 Transport- Railway 528 583 606 606 2,323 9.1.2 Transport- Passenger and Goods 37,595 34,401 38,746 40,377 151,118
9.2 Cargo handling-Ports and Civil Aviation 2,343 2,632 2,718 2,601 10,293 9.3 Post and Telecommunication 2,400 2,563 2,798 2,249 10,011
10. Banking, Insurance and Real Estate etc. 32,616 32,616 32,616 32,616 130,465 11. Ownership of Dwellings 17,093 17,093 17,093 17,093 68,371 12. Government Services 31,270 35,790 35,874 36,160 139,094 13. Private Services 9,928 9,916 9,866 9,981 39,691
Gross Domestic Product 412,130 394,341 420,803 408,763 1,636,037 (Contd.)
Table 3 - GROSS DOMESTIC PRODUCT BY INDUSTRIAL ORIGIN AT CURRENT PRICES OF MAJOR ECONOMIC ACTIVITIES
Rs. Million
Major Division2002
101
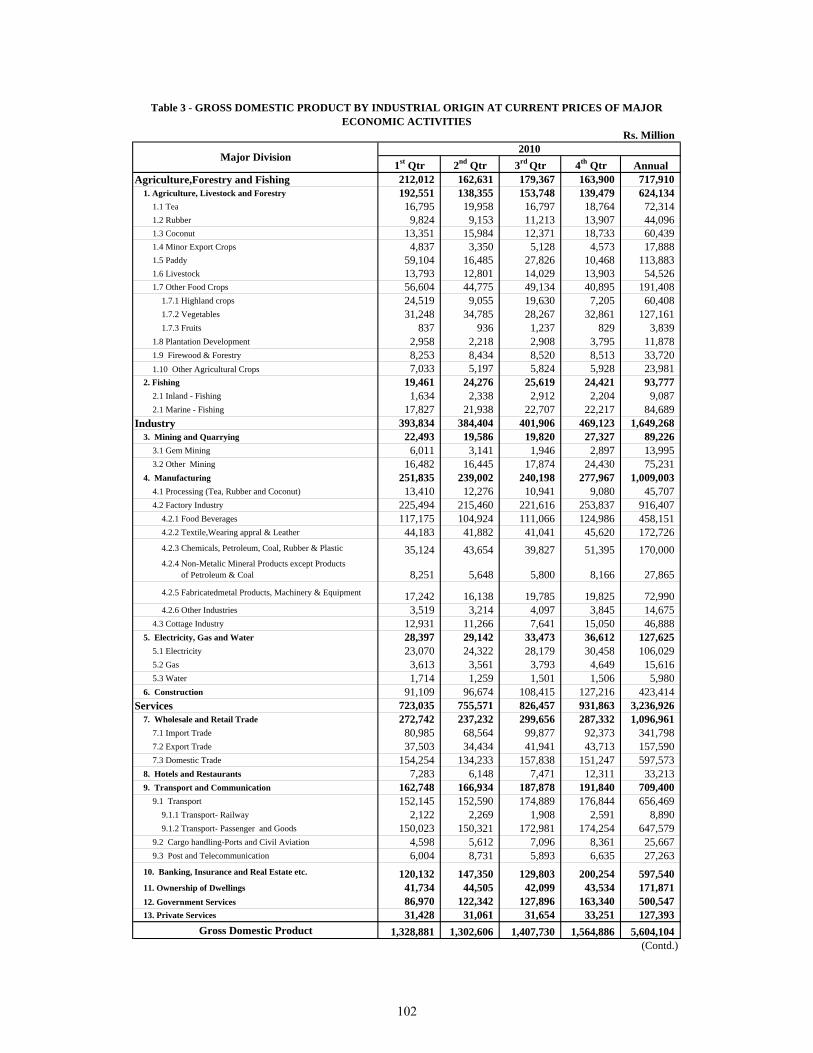
1st Qtr 2nd Qtr 3rd Qtr 4th Qtr AnnualAgriculture,Forestry and Fishing 212,012 162,631 179,367 163,900 717,910
1. Agriculture, Livestock and Forestry 192,551 138,355 153,748 139,479 624,134 1.1 Tea 16,795 19,958 16,797 18,764 72,314 1.2 Rubber 9,824 9,153 11,213 13,907 44,096 1.3 Coconut 13,351 15,984 12,371 18,733 60,439 1.4 Minor Export Crops 4,837 3,350 5,128 4,573 17,888 1.5 Paddy 59,104 16,485 27,826 10,468 113,883 1.6 Livestock 13,793 12,801 14,029 13,903 54,526 1.7 Other Food Crops 56,604 44,775 49,134 40,895 191,408
1.7.1 Highland crops 24,519 9,055 19,630 7,205 60,408 1.7.2 Vegetables 31,248 34,785 28,267 32,861 127,161 1.7.3 Fruits 837 936 1,237 829 3,839
1.8 Plantation Development 2,958 2,218 2,908 3,795 11,878 1.9 Firewood & Forestry 8,253 8,434 8,520 8,513 33,720 1.10 Other Agricultural Crops 7,033 5,197 5,824 5,928 23,981
2. Fishing 19,461 24,276 25,619 24,421 93,777 2.1 Inland - Fishing 1,634 2,338 2,912 2,204 9,087 2.1 Marine - Fishing 17,827 21,938 22,707 22,217 84,689
Industry 393,834 384,404 401,906 469,123 1,649,268 3. Mining and Quarrying 22,493 19,586 19,820 27,327 89,226
3.1 Gem Mining 6,011 3,141 1,946 2,897 13,995 3.2 Other Mining 16,482 16,445 17,874 24,430 75,231
4. Manufacturing 251,835 239,002 240,198 277,967 1,009,003 4.1 Processing (Tea, Rubber and Coconut) 13,410 12,276 10,941 9,080 45,707 4.2 Factory Industry 225,494 215,460 221,616 253,837 916,407
4.2.1 Food Beverages 117,175 104,924 111,066 124,986 458,151 4.2.2 Textile,Wearing appral & Leather 44,183 41,882 41,041 45,620 172,726 4.2.3 Chemicals, Petroleum, Coal, Rubber & Plastic 35,124 43,654 39,827 51,395 170,000 4.2.4 Non-Metalic Mineral Products except Products of Petroleum & Coal 8,251 5,648 5,800 8,166 27,865 4.2.5 Fabricatedmetal Products, Machinery & Equipment 17,242 16,138 19,785 19,825 72,990 4.2.6 Other Industries 3,519 3,214 4,097 3,845 14,675
4.3 Cottage Industry 12,931 11,266 7,641 15,050 46,888 5. Electricity, Gas and Water 28,397 29,142 33,473 36,612 127,625
5.1 Electricity 23,070 24,322 28,179 30,458 106,029 5.2 Gas 3,613 3,561 3,793 4,649 15,616 5.3 Water 1,714 1,259 1,501 1,506 5,980
6. Construction 91,109 96,674 108,415 127,216 423,414 Services 723,035 755,571 826,457 931,863 3,236,926
7. Wholesale and Retail Trade 272,742 237,232 299,656 287,332 1,096,961 7.1 Import Trade 80,985 68,564 99,877 92,373 341,798 7.2 Export Trade 37,503 34,434 41,941 43,713 157,590 7.3 Domestic Trade 154,254 134,233 157,838 151,247 597,573
8. Hotels and Restaurants 7,283 6,148 7,471 12,311 33,213 9. Transport and Communication 162,748 166,934 187,878 191,840 709,400
9.1 Transport 152,145 152,590 174,889 176,844 656,469 9.1.1 Transport- Railway 2,122 2,269 1,908 2,591 8,890 9.1.2 Transport- Passenger and Goods 150,023 150,321 172,981 174,254 647,579
9.2 Cargo handling-Ports and Civil Aviation 4,598 5,612 7,096 8,361 25,667 9.3 Post and Telecommunication 6,004 8,731 5,893 6,635 27,263
10. Banking, Insurance and Real Estate etc. 120,132 147,350 129,803 200,254 597,540 11. Ownership of Dwellings 41,734 44,505 42,099 43,534 171,871 12. Government Services 86,970 122,342 127,896 163,340 500,547 13. Private Services 31,428 31,061 31,654 33,251 127,393
Gross Domestic Product 1,328,881 1,302,606 1,407,730 1,564,886 5,604,104 (Contd.)
Table 3 - GROSS DOMESTIC PRODUCT BY INDUSTRIAL ORIGIN AT CURRENT PRICES OF MAJOR ECONOMIC ACTIVITIES
Rs. Million
Major Division2010
102
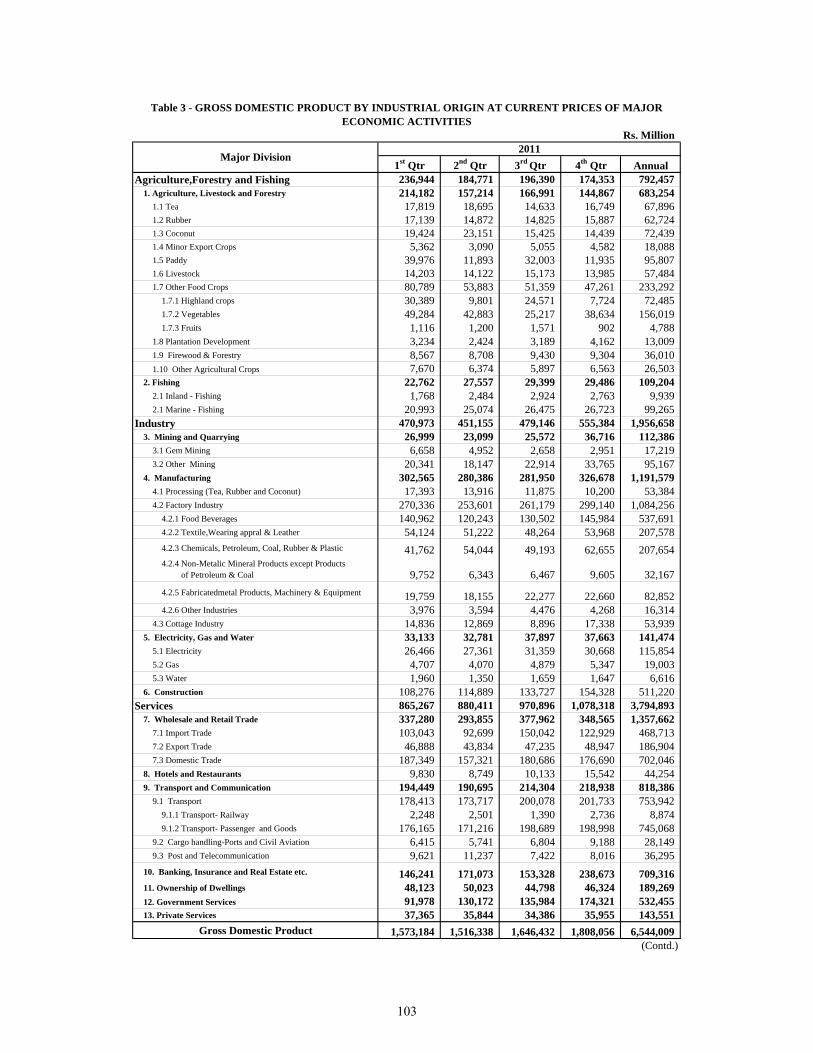
1st Qtr 2nd Qtr 3rd Qtr 4th Qtr AnnualAgriculture,Forestry and Fishing 236,944 184,771 196,390 174,353 792,457
1. Agriculture, Livestock and Forestry 214,182 157,214 166,991 144,867 683,254 1.1 Tea 17,819 18,695 14,633 16,749 67,896 1.2 Rubber 17,139 14,872 14,825 15,887 62,724 1.3 Coconut 19,424 23,151 15,425 14,439 72,439 1.4 Minor Export Crops 5,362 3,090 5,055 4,582 18,088 1.5 Paddy 39,976 11,893 32,003 11,935 95,807 1.6 Livestock 14,203 14,122 15,173 13,985 57,484 1.7 Other Food Crops 80,789 53,883 51,359 47,261 233,292
1.7.1 Highland crops 30,389 9,801 24,571 7,724 72,485 1.7.2 Vegetables 49,284 42,883 25,217 38,634 156,019 1.7.3 Fruits 1,116 1,200 1,571 902 4,788
1.8 Plantation Development 3,234 2,424 3,189 4,162 13,009 1.9 Firewood & Forestry 8,567 8,708 9,430 9,304 36,010 1.10 Other Agricultural Crops 7,670 6,374 5,897 6,563 26,503
2. Fishing 22,762 27,557 29,399 29,486 109,204 2.1 Inland - Fishing 1,768 2,484 2,924 2,763 9,939 2.1 Marine - Fishing 20,993 25,074 26,475 26,723 99,265
Industry 470,973 451,155 479,146 555,384 1,956,658 3. Mining and Quarrying 26,999 23,099 25,572 36,716 112,386
3.1 Gem Mining 6,658 4,952 2,658 2,951 17,219 3.2 Other Mining 20,341 18,147 22,914 33,765 95,167
4. Manufacturing 302,565 280,386 281,950 326,678 1,191,579 4.1 Processing (Tea, Rubber and Coconut) 17,393 13,916 11,875 10,200 53,384 4.2 Factory Industry 270,336 253,601 261,179 299,140 1,084,256
4.2.1 Food Beverages 140,962 120,243 130,502 145,984 537,691 4.2.2 Textile,Wearing appral & Leather 54,124 51,222 48,264 53,968 207,578 4.2.3 Chemicals, Petroleum, Coal, Rubber & Plastic 41,762 54,044 49,193 62,655 207,654 4.2.4 Non-Metalic Mineral Products except Products of Petroleum & Coal 9,752 6,343 6,467 9,605 32,167 4.2.5 Fabricatedmetal Products, Machinery & Equipment 19,759 18,155 22,277 22,660 82,852 4.2.6 Other Industries 3,976 3,594 4,476 4,268 16,314
4.3 Cottage Industry 14,836 12,869 8,896 17,338 53,939 5. Electricity, Gas and Water 33,133 32,781 37,897 37,663 141,474
5.1 Electricity 26,466 27,361 31,359 30,668 115,854 5.2 Gas 4,707 4,070 4,879 5,347 19,003 5.3 Water 1,960 1,350 1,659 1,647 6,616
6. Construction 108,276 114,889 133,727 154,328 511,220 Services 865,267 880,411 970,896 1,078,318 3,794,893
7. Wholesale and Retail Trade 337,280 293,855 377,962 348,565 1,357,662 7.1 Import Trade 103,043 92,699 150,042 122,929 468,713 7.2 Export Trade 46,888 43,834 47,235 48,947 186,904 7.3 Domestic Trade 187,349 157,321 180,686 176,690 702,046
8. Hotels and Restaurants 9,830 8,749 10,133 15,542 44,254 9. Transport and Communication 194,449 190,695 214,304 218,938 818,386
9.1 Transport 178,413 173,717 200,078 201,733 753,942 9.1.1 Transport- Railway 2,248 2,501 1,390 2,736 8,874 9.1.2 Transport- Passenger and Goods 176,165 171,216 198,689 198,998 745,068
9.2 Cargo handling-Ports and Civil Aviation 6,415 5,741 6,804 9,188 28,149 9.3 Post and Telecommunication 9,621 11,237 7,422 8,016 36,295
10. Banking, Insurance and Real Estate etc. 146,241 171,073 153,328 238,673 709,316 11. Ownership of Dwellings 48,123 50,023 44,798 46,324 189,269 12. Government Services 91,978 130,172 135,984 174,321 532,455 13. Private Services 37,365 35,844 34,386 35,955 143,551
Gross Domestic Product 1,573,184 1,516,338 1,646,432 1,808,056 6,544,009 (Contd.)
Table 3 - GROSS DOMESTIC PRODUCT BY INDUSTRIAL ORIGIN AT CURRENT PRICES OF MAJOR ECONOMIC ACTIVITIES
Rs. Million
Major Division2011
103
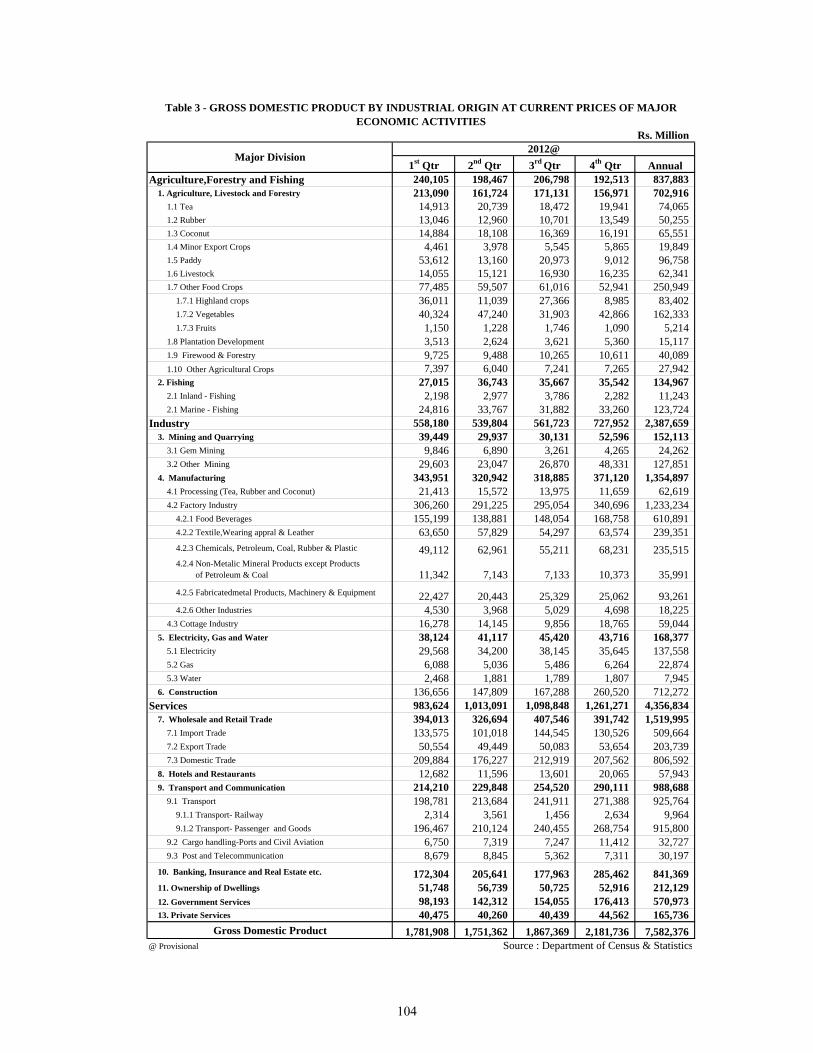
1st Qtr 2nd Qtr 3rd Qtr 4th Qtr AnnualAgriculture,Forestry and Fishing 240,105 198,467 206,798 192,513 837,883
1. Agriculture, Livestock and Forestry 213,090 161,724 171,131 156,971 702,916 1.1 Tea 14,913 20,739 18,472 19,941 74,065 1.2 Rubber 13,046 12,960 10,701 13,549 50,255 1.3 Coconut 14,884 18,108 16,369 16,191 65,551 1.4 Minor Export Crops 4,461 3,978 5,545 5,865 19,849 1.5 Paddy 53,612 13,160 20,973 9,012 96,758 1.6 Livestock 14,055 15,121 16,930 16,235 62,341 1.7 Other Food Crops 77,485 59,507 61,016 52,941 250,949
1.7.1 Highland crops 36,011 11,039 27,366 8,985 83,402 1.7.2 Vegetables 40,324 47,240 31,903 42,866 162,333 1.7.3 Fruits 1,150 1,228 1,746 1,090 5,214
1.8 Plantation Development 3,513 2,624 3,621 5,360 15,117 1.9 Firewood & Forestry 9,725 9,488 10,265 10,611 40,089 1.10 Other Agricultural Crops 7,397 6,040 7,241 7,265 27,942
2. Fishing 27,015 36,743 35,667 35,542 134,967 2.1 Inland - Fishing 2,198 2,977 3,786 2,282 11,243 2.1 Marine - Fishing 24,816 33,767 31,882 33,260 123,724
Industry 558,180 539,804 561,723 727,952 2,387,659 3. Mining and Quarrying 39,449 29,937 30,131 52,596 152,113
3.1 Gem Mining 9,846 6,890 3,261 4,265 24,262 3.2 Other Mining 29,603 23,047 26,870 48,331 127,851
4. Manufacturing 343,951 320,942 318,885 371,120 1,354,897 4.1 Processing (Tea, Rubber and Coconut) 21,413 15,572 13,975 11,659 62,619 4.2 Factory Industry 306,260 291,225 295,054 340,696 1,233,234
4.2.1 Food Beverages 155,199 138,881 148,054 168,758 610,891 4.2.2 Textile,Wearing appral & Leather 63,650 57,829 54,297 63,574 239,351 4.2.3 Chemicals, Petroleum, Coal, Rubber & Plastic 49,112 62,961 55,211 68,231 235,515 4.2.4 Non-Metalic Mineral Products except Products of Petroleum & Coal 11,342 7,143 7,133 10,373 35,991 4.2.5 Fabricatedmetal Products, Machinery & Equipment 22,427 20,443 25,329 25,062 93,261 4.2.6 Other Industries 4,530 3,968 5,029 4,698 18,225
4.3 Cottage Industry 16,278 14,145 9,856 18,765 59,044 5. Electricity, Gas and Water 38,124 41,117 45,420 43,716 168,377
5.1 Electricity 29,568 34,200 38,145 35,645 137,558 5.2 Gas 6,088 5,036 5,486 6,264 22,874 5.3 Water 2,468 1,881 1,789 1,807 7,945
6. Construction 136,656 147,809 167,288 260,520 712,272 Services 983,624 1,013,091 1,098,848 1,261,271 4,356,834
7. Wholesale and Retail Trade 394,013 326,694 407,546 391,742 1,519,995 7.1 Import Trade 133,575 101,018 144,545 130,526 509,664 7.2 Export Trade 50,554 49,449 50,083 53,654 203,739 7.3 Domestic Trade 209,884 176,227 212,919 207,562 806,592
8. Hotels and Restaurants 12,682 11,596 13,601 20,065 57,943 9. Transport and Communication 214,210 229,848 254,520 290,111 988,688
9.1 Transport 198,781 213,684 241,911 271,388 925,764 9.1.1 Transport- Railway 2,314 3,561 1,456 2,634 9,964 9.1.2 Transport- Passenger and Goods 196,467 210,124 240,455 268,754 915,800
9.2 Cargo handling-Ports and Civil Aviation 6,750 7,319 7,247 11,412 32,727 9.3 Post and Telecommunication 8,679 8,845 5,362 7,311 30,197
10. Banking, Insurance and Real Estate etc. 172,304 205,641 177,963 285,462 841,369 11. Ownership of Dwellings 51,748 56,739 50,725 52,916 212,129 12. Government Services 98,193 142,312 154,055 176,413 570,973 13. Private Services 40,475 40,260 40,439 44,562 165,736
Gross Domestic Product 1,781,908 1,751,362 1,867,369 2,181,736 7,582,376 Source : Department of Census & Statistics@ Provisional
Table 3 - GROSS DOMESTIC PRODUCT BY INDUSTRIAL ORIGIN AT CURRENT PRICES OF MAJOR ECONOMIC ACTIVITIES
Rs. Million
Major Division2012@
104
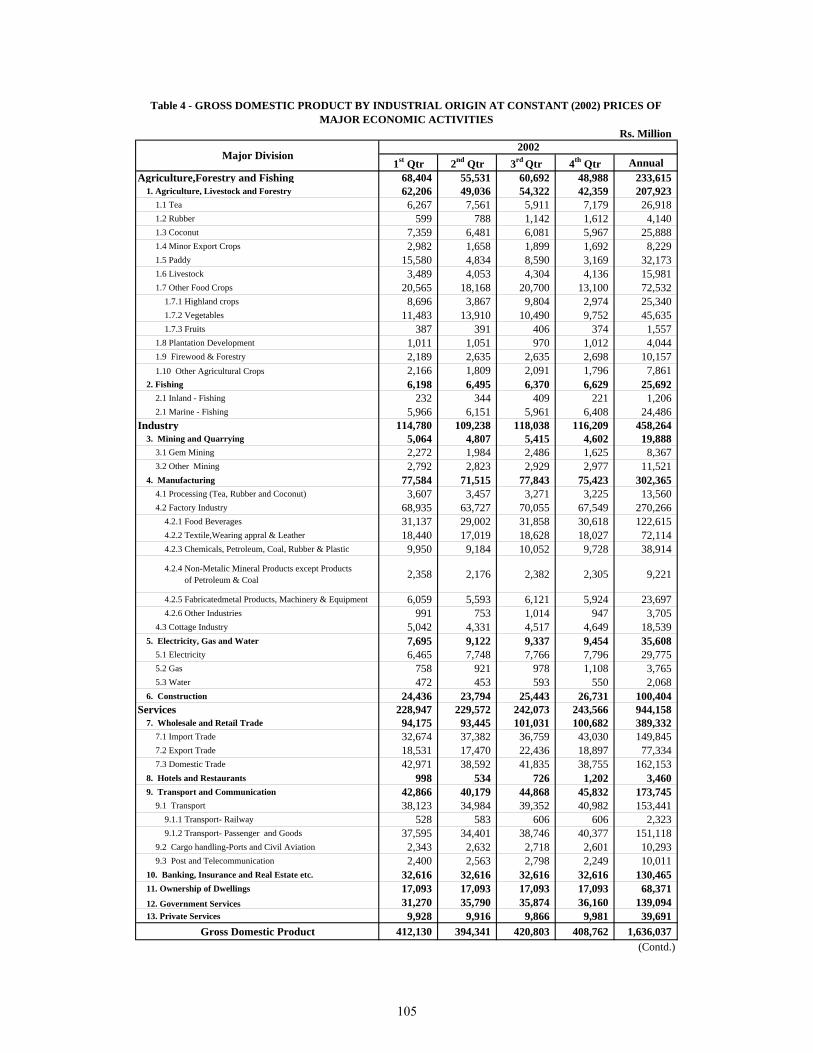
1st Qtr 2nd Qtr 3rd Qtr 4th Qtr AnnualAgriculture,Forestry and Fishing 68,404 55,531 60,692 48,988 233,615
1. Agriculture, Livestock and Forestry 62,206 49,036 54,322 42,359 207,923 1.1 Tea 6,267 7,561 5,911 7,179 26,918 1.2 Rubber 599 788 1,142 1,612 4,140 1.3 Coconut 7,359 6,481 6,081 5,967 25,888 1.4 Minor Export Crops 2,982 1,658 1,899 1,692 8,229 1.5 Paddy 15,580 4,834 8,590 3,169 32,173 1.6 Livestock 3,489 4,053 4,304 4,136 15,981 1.7 Other Food Crops 20,565 18,168 20,700 13,100 72,532
1.7.1 Highland crops 8,696 3,867 9,804 2,974 25,340 1.7.2 Vegetables 11,483 13,910 10,490 9,752 45,635 1.7.3 Fruits 387 391 406 374 1,557
1.8 Plantation Development 1,011 1,051 970 1,012 4,044 1.9 Firewood & Forestry 2,189 2,635 2,635 2,698 10,157 1.10 Other Agricultural Crops 2,166 1,809 2,091 1,796 7,861
2. Fishing 6,198 6,495 6,370 6,629 25,692 2.1 Inland - Fishing 232 344 409 221 1,206 2.1 Marine - Fishing 5,966 6,151 5,961 6,408 24,486
Industry 114,780 109,238 118,038 116,209 458,264 3. Mining and Quarrying 5,064 4,807 5,415 4,602 19,888
3.1 Gem Mining 2,272 1,984 2,486 1,625 8,367 3.2 Other Mining 2,792 2,823 2,929 2,977 11,521
4. Manufacturing 77,584 71,515 77,843 75,423 302,365 4.1 Processing (Tea, Rubber and Coconut) 3,607 3,457 3,271 3,225 13,560 4.2 Factory Industry 68,935 63,727 70,055 67,549 270,266
4.2.1 Food Beverages 31,137 29,002 31,858 30,618 122,615 4.2.2 Textile,Wearing appral & Leather 18,440 17,019 18,628 18,027 72,114 4.2.3 Chemicals, Petroleum, Coal, Rubber & Plastic 9,950 9,184 10,052 9,728 38,914
4.2.4 Non-Metalic Mineral Products except Products of Petroleum & Coal 2,358 2,176 2,382 2,305 9,221
4.2.5 Fabricatedmetal Products, Machinery & Equipment 6,059 5,593 6,121 5,924 23,697 4.2.6 Other Industries 991 753 1,014 947 3,705
4.3 Cottage Industry 5,042 4,331 4,517 4,649 18,539 5. Electricity, Gas and Water 7,695 9,122 9,337 9,454 35,608
5.1 Electricity 6,465 7,748 7,766 7,796 29,775 5.2 Gas 758 921 978 1,108 3,765 5.3 Water 472 453 593 550 2,068
6. Construction 24,436 23,794 25,443 26,731 100,404 Services 228,947 229,572 242,073 243,566 944,158
7. Wholesale and Retail Trade 94,175 93,445 101,031 100,682 389,332 7.1 Import Trade 32,674 37,382 36,759 43,030 149,845 7.2 Export Trade 18,531 17,470 22,436 18,897 77,334 7.3 Domestic Trade 42,971 38,592 41,835 38,755 162,153
8. Hotels and Restaurants 998 534 726 1,202 3,460 9. Transport and Communication 42,866 40,179 44,868 45,832 173,745
9.1 Transport 38,123 34,984 39,352 40,982 153,441 9.1.1 Transport- Railway 528 583 606 606 2,323 9.1.2 Transport- Passenger and Goods 37,595 34,401 38,746 40,377 151,118
9.2 Cargo handling-Ports and Civil Aviation 2,343 2,632 2,718 2,601 10,293 9.3 Post and Telecommunication 2,400 2,563 2,798 2,249 10,011
10. Banking, Insurance and Real Estate etc. 32,616 32,616 32,616 32,616 130,465 11. Ownership of Dwellings 17,093 17,093 17,093 17,093 68,371 12. Government Services 31,270 35,790 35,874 36,160 139,094 13. Private Services 9,928 9,916 9,866 9,981 39,691
Gross Domestic Product 412,130 394,341 420,803 408,762 1,636,037 (Contd.)
Table 4 - GROSS DOMESTIC PRODUCT BY INDUSTRIAL ORIGIN AT CONSTANT (2002) PRICES OF MAJOR ECONOMIC ACTIVITIES
Rs. Million
Major Division2002
105
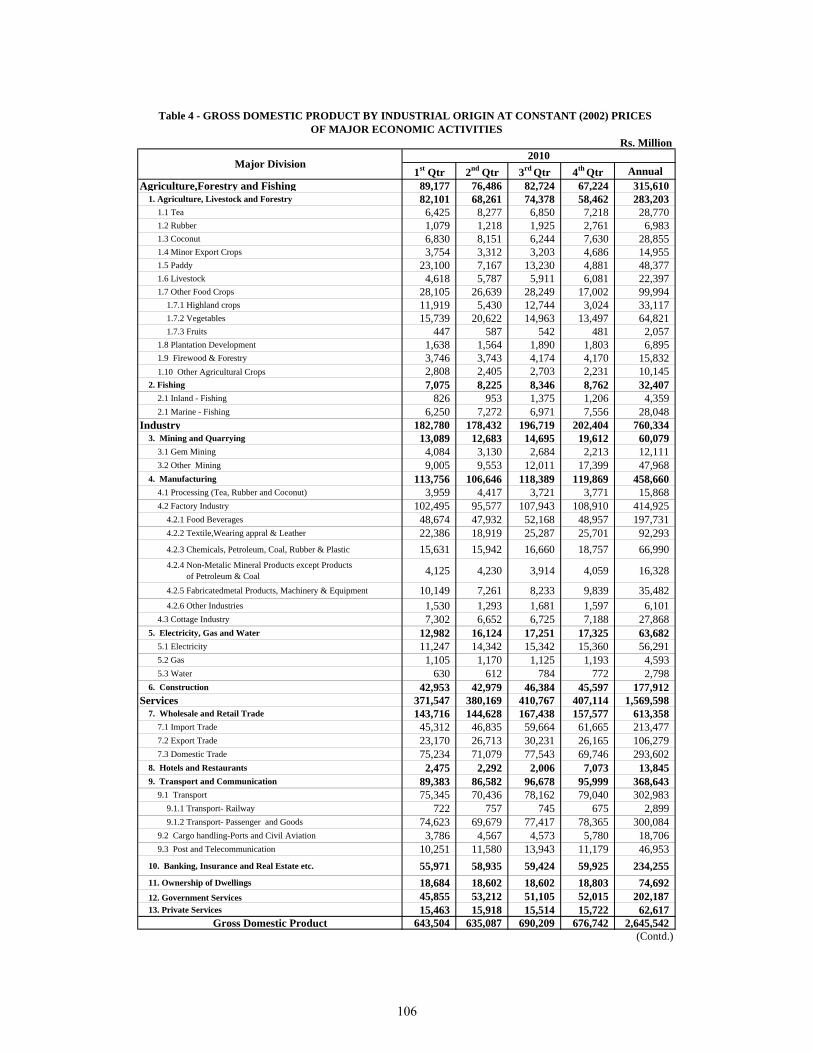
Rs. Million
1st Qtr 2nd Qtr 3rd Qtr 4th Qtr AnnualAgriculture,Forestry and Fishing 89,177 76,486 82,724 67,224 315,610
1. Agriculture, Livestock and Forestry 82,101 68,261 74,378 58,462 283,203 1.1 Tea 6,425 8,277 6,850 7,218 28,770 1.2 Rubber 1,079 1,218 1,925 2,761 6,983 1.3 Coconut 6,830 8,151 6,244 7,630 28,855 1.4 Minor Export Crops 3,754 3,312 3,203 4,686 14,955 1.5 Paddy 23,100 7,167 13,230 4,881 48,377 1.6 Livestock 4,618 5,787 5,911 6,081 22,397 1.7 Other Food Crops 28,105 26,639 28,249 17,002 99,994
1.7.1 Highland crops 11,919 5,430 12,744 3,024 33,117 1.7.2 Vegetables 15,739 20,622 14,963 13,497 64,821 1.7.3 Fruits 447 587 542 481 2,057
1.8 Plantation Development 1,638 1,564 1,890 1,803 6,895 1.9 Firewood & Forestry 3,746 3,743 4,174 4,170 15,832 1.10 Other Agricultural Crops 2,808 2,405 2,703 2,231 10,145
2. Fishing 7,075 8,225 8,346 8,762 32,407 2.1 Inland - Fishing 826 953 1,375 1,206 4,359 2.1 Marine - Fishing 6,250 7,272 6,971 7,556 28,048
Industry 182,780 178,432 196,719 202,404 760,334 3. Mining and Quarrying 13,089 12,683 14,695 19,612 60,079
3.1 Gem Mining 4,084 3,130 2,684 2,213 12,111 3.2 Other Mining 9,005 9,553 12,011 17,399 47,968
4. Manufacturing 113,756 106,646 118,389 119,869 458,660 4.1 Processing (Tea, Rubber and Coconut) 3,959 4,417 3,721 3,771 15,868 4.2 Factory Industry 102,495 95,577 107,943 108,910 414,925
4.2.1 Food Beverages 48,674 47,932 52,168 48,957 197,731 4.2.2 Textile,Wearing appral & Leather 22,386 18,919 25,287 25,701 92,293 4.2.3 Chemicals, Petroleum, Coal, Rubber & Plastic 15,631 15,942 16,660 18,757 66,990 4.2.4 Non-Metalic Mineral Products except Products of Petroleum & Coal 4,125 4,230 3,914 4,059 16,328
4.2.5 Fabricatedmetal Products, Machinery & Equipment 10,149 7,261 8,233 9,839 35,482 4.2.6 Other Industries 1,530 1,293 1,681 1,597 6,101
4.3 Cottage Industry 7,302 6,652 6,725 7,188 27,868 5. Electricity, Gas and Water 12,982 16,124 17,251 17,325 63,682
5.1 Electricity 11,247 14,342 15,342 15,360 56,291 5.2 Gas 1,105 1,170 1,125 1,193 4,593 5.3 Water 630 612 784 772 2,798
6. Construction 42,953 42,979 46,384 45,597 177,912 Services 371,547 380,169 410,767 407,114 1,569,598
7. Wholesale and Retail Trade 143,716 144,628 167,438 157,577 613,358 7.1 Import Trade 45,312 46,835 59,664 61,665 213,477 7.2 Export Trade 23,170 26,713 30,231 26,165 106,279 7.3 Domestic Trade 75,234 71,079 77,543 69,746 293,602
8. Hotels and Restaurants 2,475 2,292 2,006 7,073 13,845 9. Transport and Communication 89,383 86,582 96,678 95,999 368,643
9.1 Transport 75,345 70,436 78,162 79,040 302,983 9.1.1 Transport- Railway 722 757 745 675 2,899 9.1.2 Transport- Passenger and Goods 74,623 69,679 77,417 78,365 300,084
9.2 Cargo handling-Ports and Civil Aviation 3,786 4,567 4,573 5,780 18,706 9.3 Post and Telecommunication 10,251 11,580 13,943 11,179 46,953
10. Banking, Insurance and Real Estate etc. 55,971 58,935 59,424 59,925 234,255 11. Ownership of Dwellings 18,684 18,602 18,602 18,803 74,692 12. Government Services 45,855 53,212 51,105 52,015 202,187 13. Private Services 15,463 15,918 15,514 15,722 62,617
Gross Domestic Product 643,504 635,087 690,209 676,742 2,645,542 (Contd.)
Table 4 - GROSS DOMESTIC PRODUCT BY INDUSTRIAL ORIGIN AT CONSTANT (2002) PRICES OF MAJOR ECONOMIC ACTIVITIES
Major Division2010
106
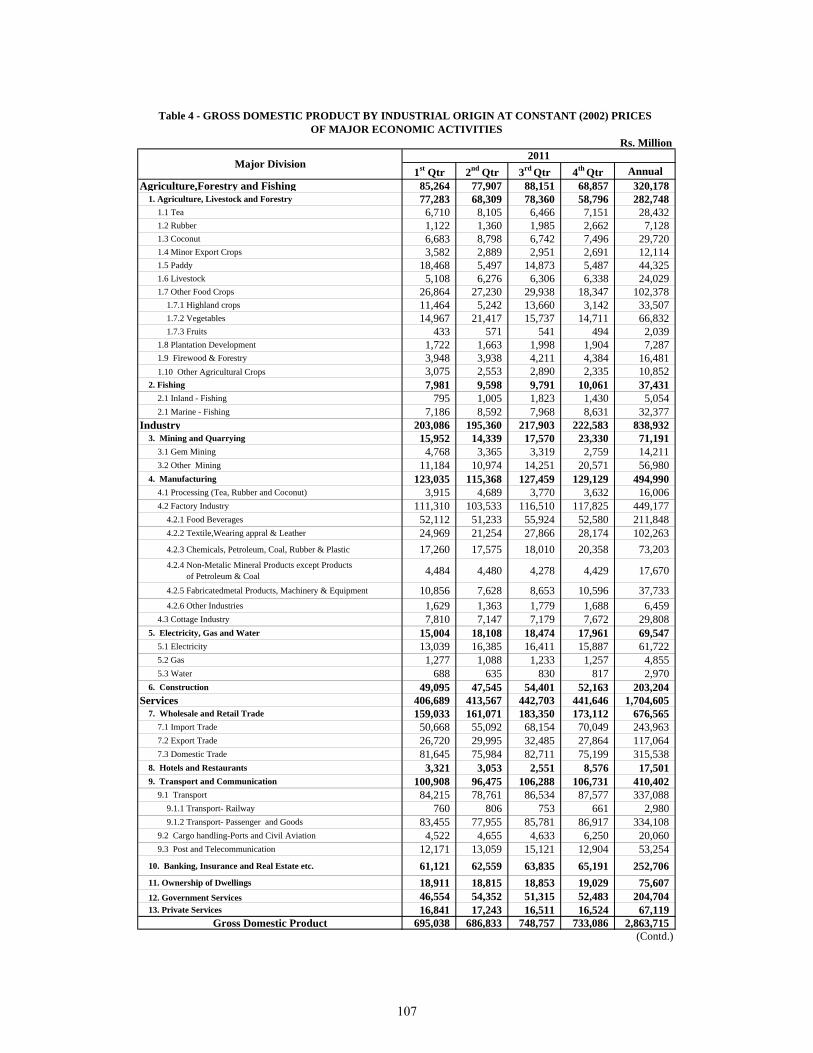
Rs. Million
1st Qtr 2nd Qtr 3rd Qtr 4th Qtr AnnualAgriculture,Forestry and Fishing 85,264 77,907 88,151 68,857 320,178
1. Agriculture, Livestock and Forestry 77,283 68,309 78,360 58,796 282,748 1.1 Tea 6,710 8,105 6,466 7,151 28,432 1.2 Rubber 1,122 1,360 1,985 2,662 7,128 1.3 Coconut 6,683 8,798 6,742 7,496 29,720 1.4 Minor Export Crops 3,582 2,889 2,951 2,691 12,114 1.5 Paddy 18,468 5,497 14,873 5,487 44,325 1.6 Livestock 5,108 6,276 6,306 6,338 24,029 1.7 Other Food Crops 26,864 27,230 29,938 18,347 102,378
1.7.1 Highland crops 11,464 5,242 13,660 3,142 33,507 1.7.2 Vegetables 14,967 21,417 15,737 14,711 66,832 1.7.3 Fruits 433 571 541 494 2,039
1.8 Plantation Development 1,722 1,663 1,998 1,904 7,287 1.9 Firewood & Forestry 3,948 3,938 4,211 4,384 16,481 1.10 Other Agricultural Crops 3,075 2,553 2,890 2,335 10,852
2. Fishing 7,981 9,598 9,791 10,061 37,431 2.1 Inland - Fishing 795 1,005 1,823 1,430 5,054 2.1 Marine - Fishing 7,186 8,592 7,968 8,631 32,377
Industry 203,086 195,360 217,903 222,583 838,932 3. Mining and Quarrying 15,952 14,339 17,570 23,330 71,191
3.1 Gem Mining 4,768 3,365 3,319 2,759 14,211 3.2 Other Mining 11,184 10,974 14,251 20,571 56,980
4. Manufacturing 123,035 115,368 127,459 129,129 494,990 4.1 Processing (Tea, Rubber and Coconut) 3,915 4,689 3,770 3,632 16,006 4.2 Factory Industry 111,310 103,533 116,510 117,825 449,177
4.2.1 Food Beverages 52,112 51,233 55,924 52,580 211,848 4.2.2 Textile,Wearing appral & Leather 24,969 21,254 27,866 28,174 102,263 4.2.3 Chemicals, Petroleum, Coal, Rubber & Plastic 17,260 17,575 18,010 20,358 73,203 4.2.4 Non-Metalic Mineral Products except Products of Petroleum & Coal 4,484 4,480 4,278 4,429 17,670
4.2.5 Fabricatedmetal Products, Machinery & Equipment 10,856 7,628 8,653 10,596 37,733 4.2.6 Other Industries 1,629 1,363 1,779 1,688 6,459
4.3 Cottage Industry 7,810 7,147 7,179 7,672 29,808 5. Electricity, Gas and Water 15,004 18,108 18,474 17,961 69,547
5.1 Electricity 13,039 16,385 16,411 15,887 61,722 5.2 Gas 1,277 1,088 1,233 1,257 4,855 5.3 Water 688 635 830 817 2,970
6. Construction 49,095 47,545 54,401 52,163 203,204 Services 406,689 413,567 442,703 441,646 1,704,605
7. Wholesale and Retail Trade 159,033 161,071 183,350 173,112 676,565 7.1 Import Trade 50,668 55,092 68,154 70,049 243,963 7.2 Export Trade 26,720 29,995 32,485 27,864 117,064 7.3 Domestic Trade 81,645 75,984 82,711 75,199 315,538
8. Hotels and Restaurants 3,321 3,053 2,551 8,576 17,501 9. Transport and Communication 100,908 96,475 106,288 106,731 410,402
9.1 Transport 84,215 78,761 86,534 87,577 337,088 9.1.1 Transport- Railway 760 806 753 661 2,980 9.1.2 Transport- Passenger and Goods 83,455 77,955 85,781 86,917 334,108
9.2 Cargo handling-Ports and Civil Aviation 4,522 4,655 4,633 6,250 20,060 9.3 Post and Telecommunication 12,171 13,059 15,121 12,904 53,254
10. Banking, Insurance and Real Estate etc. 61,121 62,559 63,835 65,191 252,706 11. Ownership of Dwellings 18,911 18,815 18,853 19,029 75,607 12. Government Services 46,554 54,352 51,315 52,483 204,704 13. Private Services 16,841 17,243 16,511 16,524 67,119
Gross Domestic Product 695,038 686,833 748,757 733,086 2,863,715 (Contd.)
Table 4 - GROSS DOMESTIC PRODUCT BY INDUSTRIAL ORIGIN AT CONSTANT (2002) PRICES OF MAJOR ECONOMIC ACTIVITIES
Major Division2011
107
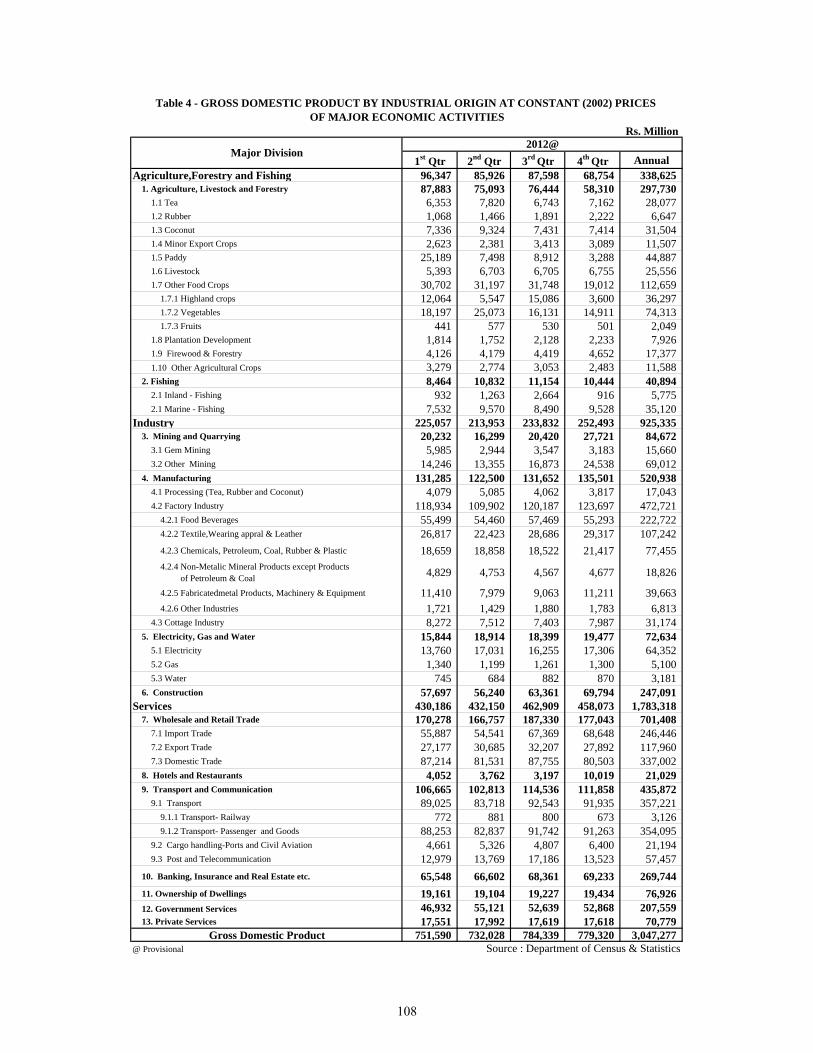
Rs. Million
1st Qtr 2nd Qtr 3rd Qtr 4th Qtr AnnualAgriculture,Forestry and Fishing 96,347 85,926 87,598 68,754 338,625
1. Agriculture, Livestock and Forestry 87,883 75,093 76,444 58,310 297,730 1.1 Tea 6,353 7,820 6,743 7,162 28,077 1.2 Rubber 1,068 1,466 1,891 2,222 6,647 1.3 Coconut 7,336 9,324 7,431 7,414 31,504 1.4 Minor Export Crops 2,623 2,381 3,413 3,089 11,507 1.5 Paddy 25,189 7,498 8,912 3,288 44,887 1.6 Livestock 5,393 6,703 6,705 6,755 25,556 1.7 Other Food Crops 30,702 31,197 31,748 19,012 112,659
1.7.1 Highland crops 12,064 5,547 15,086 3,600 36,297 1.7.2 Vegetables 18,197 25,073 16,131 14,911 74,313 1.7.3 Fruits 441 577 530 501 2,049
1.8 Plantation Development 1,814 1,752 2,128 2,233 7,926 1.9 Firewood & Forestry 4,126 4,179 4,419 4,652 17,377 1.10 Other Agricultural Crops 3,279 2,774 3,053 2,483 11,588
2. Fishing 8,464 10,832 11,154 10,444 40,894 2.1 Inland - Fishing 932 1,263 2,664 916 5,775 2.1 Marine - Fishing 7,532 9,570 8,490 9,528 35,120
Industry 225,057 213,953 233,832 252,493 925,335 3. Mining and Quarrying 20,232 16,299 20,420 27,721 84,672
3.1 Gem Mining 5,985 2,944 3,547 3,183 15,660 3.2 Other Mining 14,246 13,355 16,873 24,538 69,012
4. Manufacturing 131,285 122,500 131,652 135,501 520,938 4.1 Processing (Tea, Rubber and Coconut) 4,079 5,085 4,062 3,817 17,043 4.2 Factory Industry 118,934 109,902 120,187 123,697 472,721
4.2.1 Food Beverages 55,499 54,460 57,469 55,293 222,722 4.2.2 Textile,Wearing appral & Leather 26,817 22,423 28,686 29,317 107,242 4.2.3 Chemicals, Petroleum, Coal, Rubber & Plastic 18,659 18,858 18,522 21,417 77,455 4.2.4 Non-Metalic Mineral Products except Products of Petroleum & Coal 4,829 4,753 4,567 4,677 18,826
4.2.5 Fabricatedmetal Products, Machinery & Equipment 11,410 7,979 9,063 11,211 39,663 4.2.6 Other Industries 1,721 1,429 1,880 1,783 6,813
4.3 Cottage Industry 8,272 7,512 7,403 7,987 31,174 5. Electricity, Gas and Water 15,844 18,914 18,399 19,477 72,634
5.1 Electricity 13,760 17,031 16,255 17,306 64,352 5.2 Gas 1,340 1,199 1,261 1,300 5,100 5.3 Water 745 684 882 870 3,181
6. Construction 57,697 56,240 63,361 69,794 247,091 Services 430,186 432,150 462,909 458,073 1,783,318
7. Wholesale and Retail Trade 170,278 166,757 187,330 177,043 701,408 7.1 Import Trade 55,887 54,541 67,369 68,648 246,446 7.2 Export Trade 27,177 30,685 32,207 27,892 117,960 7.3 Domestic Trade 87,214 81,531 87,755 80,503 337,002
8. Hotels and Restaurants 4,052 3,762 3,197 10,019 21,029 9. Transport and Communication 106,665 102,813 114,536 111,858 435,872
9.1 Transport 89,025 83,718 92,543 91,935 357,221 9.1.1 Transport- Railway 772 881 800 673 3,126 9.1.2 Transport- Passenger and Goods 88,253 82,837 91,742 91,263 354,095
9.2 Cargo handling-Ports and Civil Aviation 4,661 5,326 4,807 6,400 21,194 9.3 Post and Telecommunication 12,979 13,769 17,186 13,523 57,457
10. Banking, Insurance and Real Estate etc. 65,548 66,602 68,361 69,233 269,744 11. Ownership of Dwellings 19,161 19,104 19,227 19,434 76,926 12. Government Services 46,932 55,121 52,639 52,868 207,559 13. Private Services 17,551 17,992 17,619 17,618 70,779
Gross Domestic Product 751,590 732,028 784,339 779,320 3,047,277 Source : Department of Census & Statistics@ Provisional
Table 4 - GROSS DOMESTIC PRODUCT BY INDUSTRIAL ORIGIN AT CONSTANT (2002) PRICES OF MAJOR ECONOMIC ACTIVITIES
Major Division2012@
108
APPENDIX
SUPPORTING TABLES
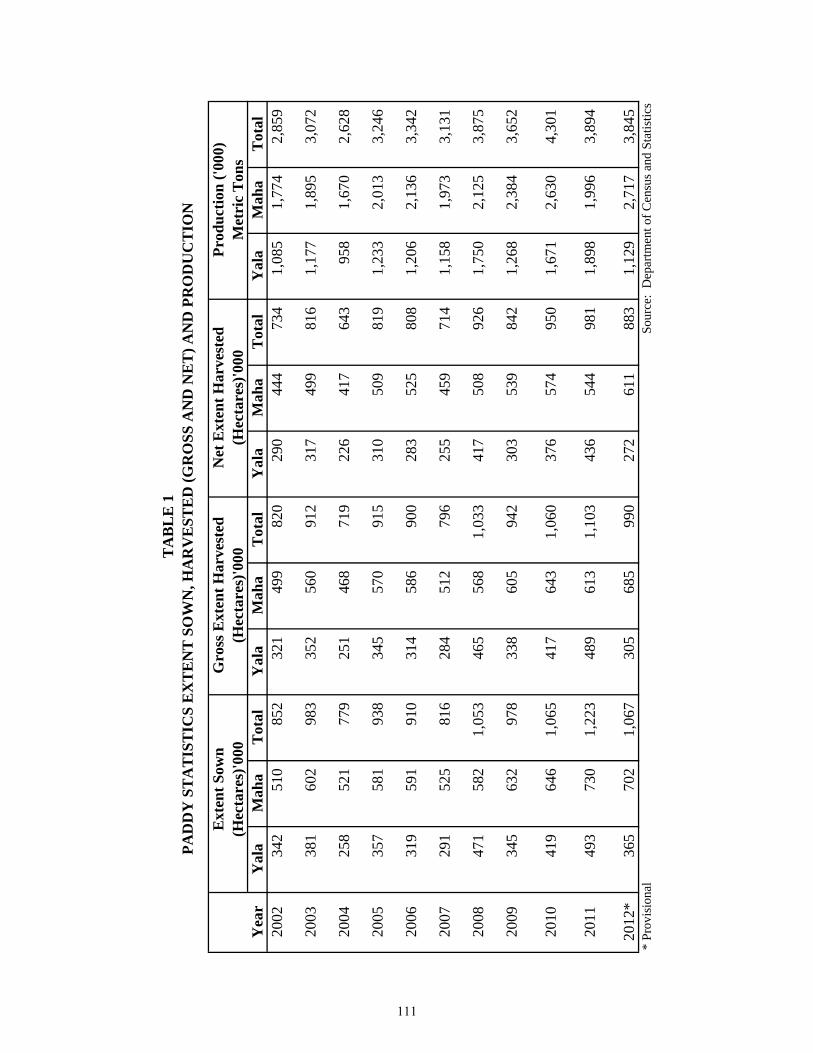
Yal
aM
aha
Tot
alY
ala
Mah
aT
otal
Yal
aM
aha
Tot
alY
ala
Mah
aT
otal
2002
342
51
0
852
32
1
499
82
0
290
44
4
734
1,
085
1,77
4
2,
859
2003
381
60
2
983
35
2
560
91
2
317
49
9
816
1,
177
1,89
5
3,
072
2004
258
52
1
779
25
1
468
71
9
226
41
7
643
95
8
1,67
0
2,
628
2005
357
58
1
938
34
5
570
91
5
310
50
9
819
1,
233
2,01
3
3,
246
2006
319
59
1
910
31
4
586
90
0
283
52
5
808
1,
206
2,13
6
3,
342
2007
291
52
5
816
28
4
512
79
6
255
45
9
714
1,
158
1,97
3
3,
131
2008
471
58
2
1,05
3
46
5
568
1,
033
417
50
8
926
1,
750
2,12
5
3,
875
2009
345
63
2
978
33
8
605
94
2
303
53
9
842
1,
268
2,38
4
3,
652
2010
419
64
6
1,06
5
41
7
643
1,
060
376
57
4
950
1,
671
2,63
0
4,
301
2011
493
73
0
1,22
3
48
9
613
1,
103
436
54
4
981
1,
898
1,99
6
3,
894
2012
*36
5
702
1,
067
305
68
5
990
27
2
611
88
3
1,12
9
2,
717
3,84
5
*
Prov
isio
nal
Sour
ce:
Dep
artm
ent o
f Cen
sus a
nd S
tatis
tics
(Hec
tare
s)'0
00G
ross
Ext
ent H
arve
sted
(Hec
tare
s)'0
00TA
BL
E 1
PAD
DY
ST
AT
IST
ICS
EX
TE
NT
SO
WN
, HA
RV
EST
ED
(GR
OSS
AN
D N
ET
) AN
D P
RO
DU
CT
ION
(H
ecta
res)
'000
Yea
r
Prod
uctio
n ('0
00)
Met
ric
Ton
sN
et E
xten
t Har
vest
ed E
xten
t Sow
n
111
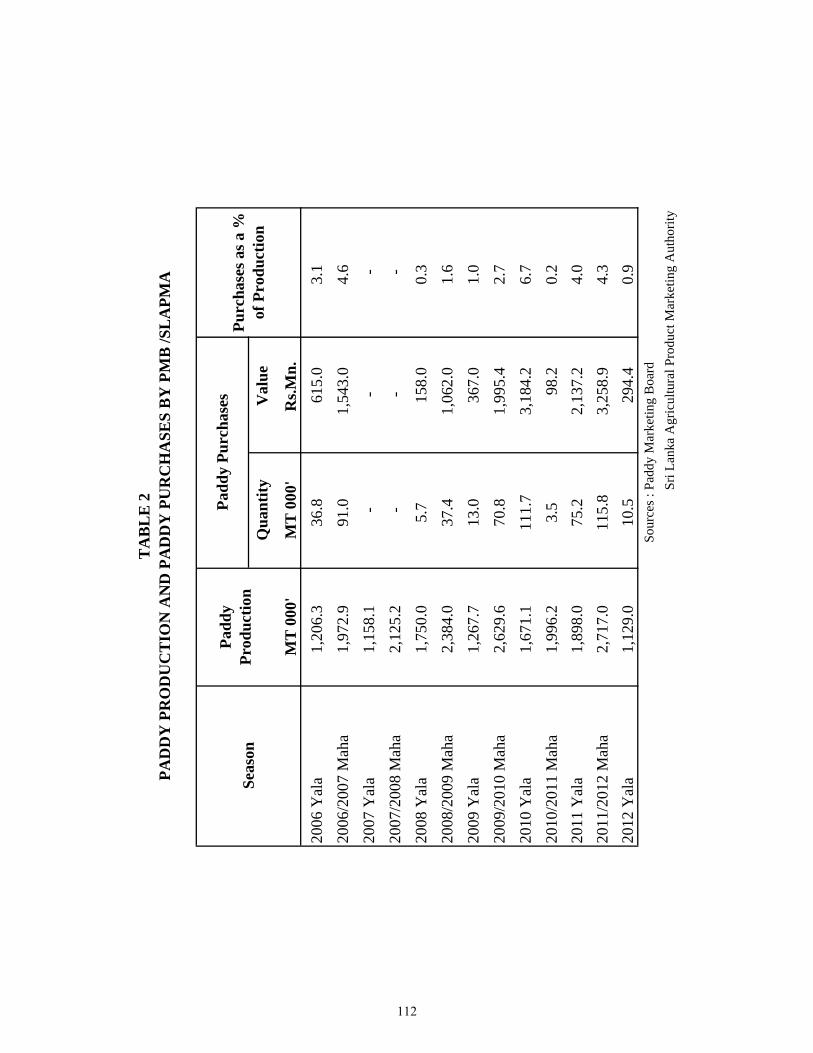
Qua
ntity
Val
ue
MT
000
'M
T 0
00'
Rs.M
n.20
06 Y
ala
1,20
6.3
36.8
615.
03.
120
06/2
007
Mah
a1,
972.
991
.01,
543.
04.
620
07 Y
ala
1,15
8.1
--
-20
07/2
008
Mah
a2,
125.
2-
--
2008
Yal
a1,
750.
05.
715
8.0
0.3
2008
/200
9 M
aha
2,38
4.0
37.4
1,06
2.0
1.6
2009
Yal
a1,
267.
713
.036
7.0
1.0
2009
/201
0 M
aha
2,62
9.6
70.8
1,99
5.4
2.7
2010
Yal
a1,
671.
111
1.7
3,18
4.2
6.7
2010
/201
1 M
aha
1,99
6.2
3.5
98.2
0.2
2011
Yal
a1,
898.
075
.22,
137.
24.
020
11/2
012
Mah
a2,
717.
011
5.8
3,25
8.9
4.3
2012
Yal
a1,
129.
010
.529
4.4
0.9
TA
BL
E 2
PAD
DY
PR
OD
UC
TIO
N A
ND
PA
DD
Y P
UR
CH
ASE
S B
Y P
MB
/SL
APM
A
Padd
y Pu
rcha
ses
Sou
rces
: Pa
ddy
Mar
ketin
g B
oard
Sri L
anka
Agr
icul
tura
l Pro
duct
Mar
ketin
g A
utho
rity
Seas
onPa
ddy
Prod
uctio
nPu
rcha
ses a
s a %
of
Pro
duct
ion
112
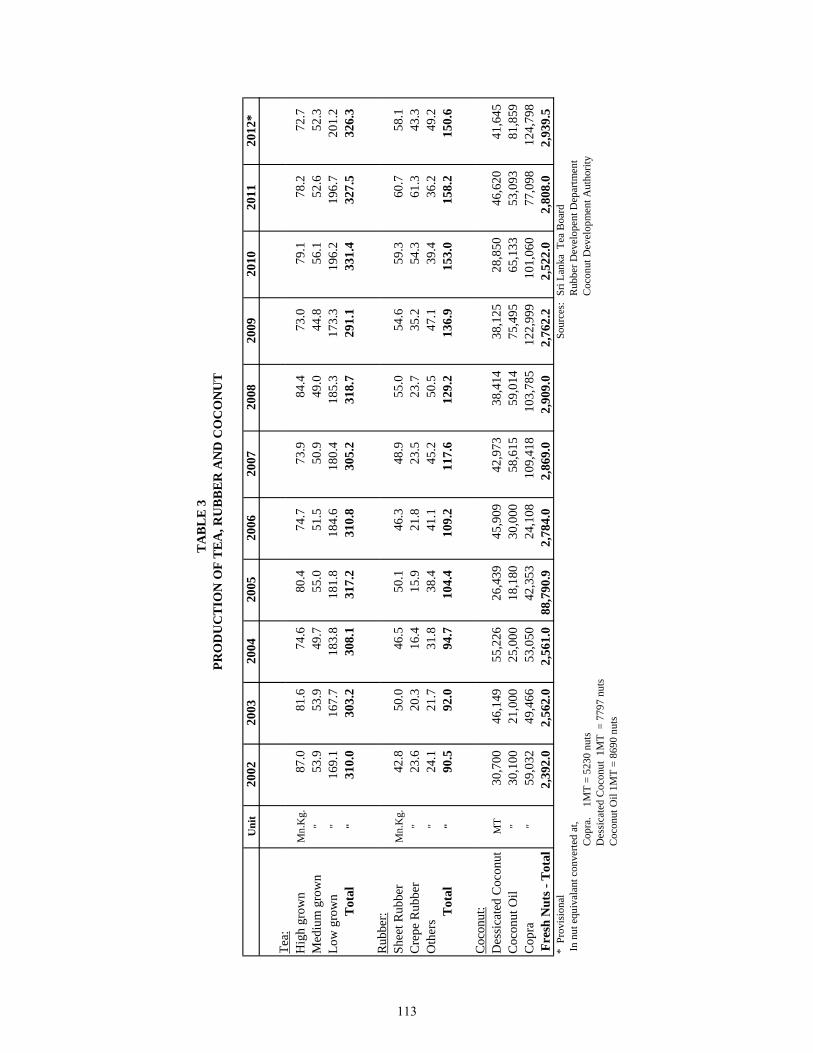
Uni
t20
0220
0320
0420
0520
0620
0720
0820
0920
1020
1120
12*
Tea:
TA
BL
E 3
PR
OD
UC
TIO
N O
F T
EA
, RU
BB
ER
AN
D C
OC
ON
UT
Tea:
Hig
h gr
own
Mn.
Kg.
87.0
81
.6
74.6
80
.474
.773
.984
.473
.079
.178
.272
.7M
ediu
m g
row
n"
53.9
53
.9
49.7
55
.051
.550
.949
.044
.856
.152
.652
.3Lo
w g
row
n"
169.
1
167.
7
183.
8
181.
818
4.6
180.
418
5.3
173.
319
6.2
196.
720
1.2
Tot
al"
310.
0
303.
2
308.
1
317.
231
0.8
305.
231
8.7
291.
133
1.4
327.
532
6.3
Rub
ber:
Rub
ber:
Shee
t Rub
ber
Mn.
Kg.
42.8
50
.0
46.5
50
.146
.348
.955
.054
.659
.360
.758
.1C
repe
Rub
ber
"23
.6
20.3
16
.4
15.9
21.8
23.5
23.7
35.2
54.3
61.3
43.3
Oth
ers
"24
.1
21.7
31
.8
38.4
41.1
45.2
50.5
47.1
39.4
36.2
49.2
Tot
al"
90.5
92
.0
94.7
10
4.4
109.
211
7.6
129.
213
6.9
153.
015
8.2
150.
6
CCoc
onut
:D
essi
cate
d C
ocon
utM
T30
,700
46,1
49
55
,226
26,4
39
45,9
09
42,9
73
38
,414
38,1
25
28
,850
46,6
20
41
,645
Coc
onut
Oil
"30
,100
21,0
00
25
,000
18,1
80
30,0
00
58,6
15
59
,014
75,4
95
65
,133
53,0
93
81
,859
Cop
ra"
59,0
32
49
,466
53,0
50
42
,353
24
,108
10
9,41
8
103,
785
12
2,99
9
101,
060
77
,098
124,
798
Fr
esh
Nut
s - T
otal
2,39
2.0
2,56
2.0
2,56
1.0
88,7
90.9
2,78
4.0
2,86
9.0
2,90
9.0
2,76
2.2
2,52
2.0
2,80
8.0
2,93
9.5
* P
rovi
sion
alSo
urce
s: S
ri La
nka
Tea
Boa
rdI
ti
lt
td
tR
bbD
ltD
tt
In n
ut e
quiv
alan
t con
verte
d at
,
R
ubbe
r Dev
elop
ent D
epar
tmen
t
Cop
ra.
1M
T =
5230
nut
s
C
ocon
ut D
evel
opm
ent A
utho
rity
D
essi
cate
d C
ocon
ut 1
MT
= 7
797
nuts
Coc
onut
Oil
1MT
= 86
90 n
uts
113
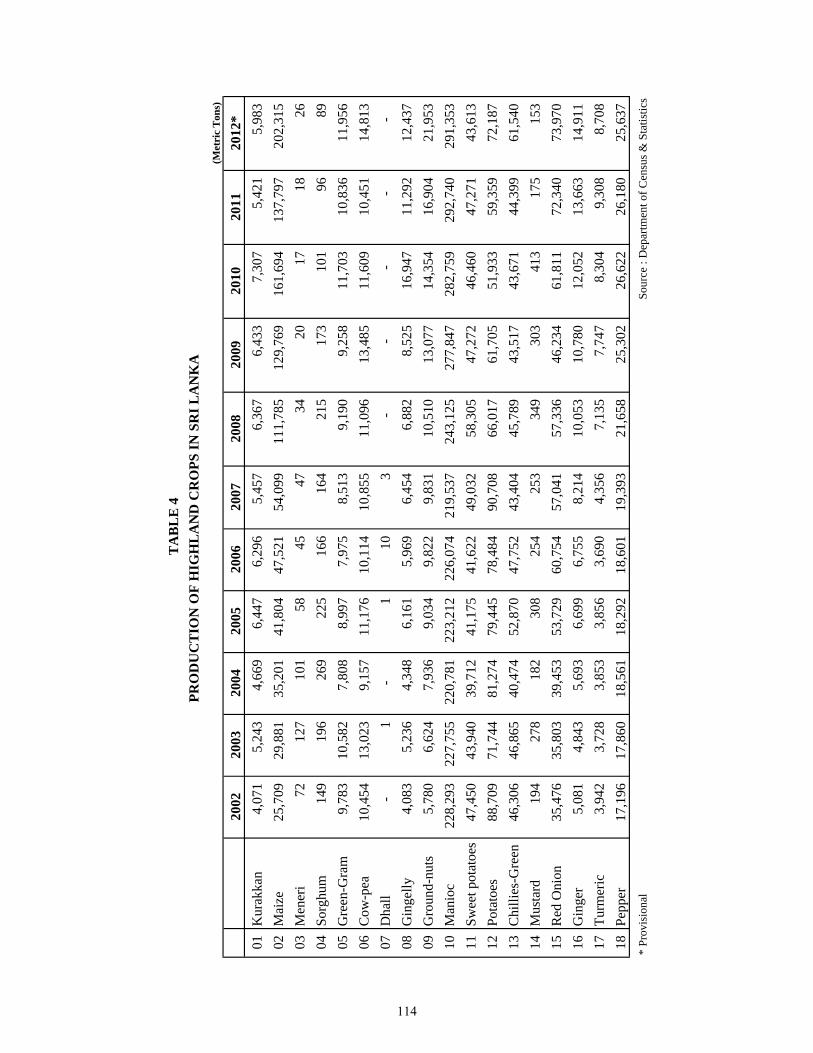
(Met
ric
Ton
s)
2002
2003
2004
2005
2006
2007
2008
2009
2010
2011
2012
*01
Kur
akka
n4,
071
5,24
3
4,
669
6,44
7
6,
296
5,45
7
6,
367
6,
433
7,
307
5,
421
5,
983
02
Mai
ze25
,709
29
,881
35
,201
41
,804
47
,521
54
,099
111,
785
129,
769
161,
694
137,
797
202,
315
03M
ener
i72
127
10
1
58
45
47
34
20
17
18
26
04
Sorg
hum
149
19
6
269
22
5
166
16
4
215
173
101
96
89
05G
reen
-Gra
m9,
783
10,5
82
7,80
8
8,
997
7,97
5
8,
513
9,19
0
9,25
8
11,7
03
10,8
36
11,9
56
06C
ow-p
ea10
,454
13
,023
9,
157
11,1
76
10,1
14
10,8
55
11
,096
13
,485
11
,609
10
,451
14
,813
07
Dha
ll-
1
-1
10
3
-
-
-
-
-
08G
inge
lly4,
083
5,23
6
4,
348
6,16
1
5,
969
6,45
4
6,
882
8,
525
16
,947
11
,292
12
,437
09
Gro
und-
nuts
5,78
0
6,
624
7,93
6
9,
034
9,82
2
9,
831
10,5
10
13,0
77
14,3
54
16,9
04
21,9
53
10M
anio
c22
8,29
3
227,
755
22
0,78
1
223,
212
22
6,07
4
219,
537
24
3,12
5
27
7,84
7
28
2,75
9
29
2,74
0
29
1,35
3
11
Swee
t pot
atoe
s47
,450
43
,940
39
,712
41
,175
41
,622
49
,032
58,3
05
47,2
72
46,4
60
47,2
71
43,6
13
12Po
tato
es88
,709
71
,744
81
,274
79
,445
78
,484
90
,708
66,0
17
61,7
05
51,9
33
59,3
59
72,1
87
13C
hilli
es-G
reen
46,3
06
46,8
65
40,4
74
52,8
70
47,7
52
43,4
04
45
,789
43
,517
43
,671
44
,399
61
,540
14
Mus
tard
194
27
8
182
30
8
254
25
3
349
303
413
175
153
15R
ed O
nion
35,4
76
35,8
03
39,4
53
53,7
29
60,7
54
57,0
41
57
,336
46
,234
61
,811
72
,340
73
,970
16
Gin
ger
5,08
1
4,
843
5,69
3
6,
699
6,75
5
8,
214
10,0
53
10,7
80
12,0
52
13,6
63
14,9
11
17Tu
rmer
ic3,
942
3,72
8
3,
853
3,85
6
3,
690
4,35
6
7,
135
7,
747
8,
304
9,
308
8,
708
18
Pepp
er17
,196
17
,860
18
,561
18
,292
18
,601
19
,393
21,6
58
25,3
02
26,6
22
26,1
80
25,6
37
* Pr
ovis
iona
l
TA
BL
E 4
PRO
DU
CT
ION
OF
HIG
HL
AN
D C
RO
PS IN
SR
I LA
NK
A
Sour
ce :
Dep
artm
ent o
f Cen
sus &
Sta
tistic
s
114
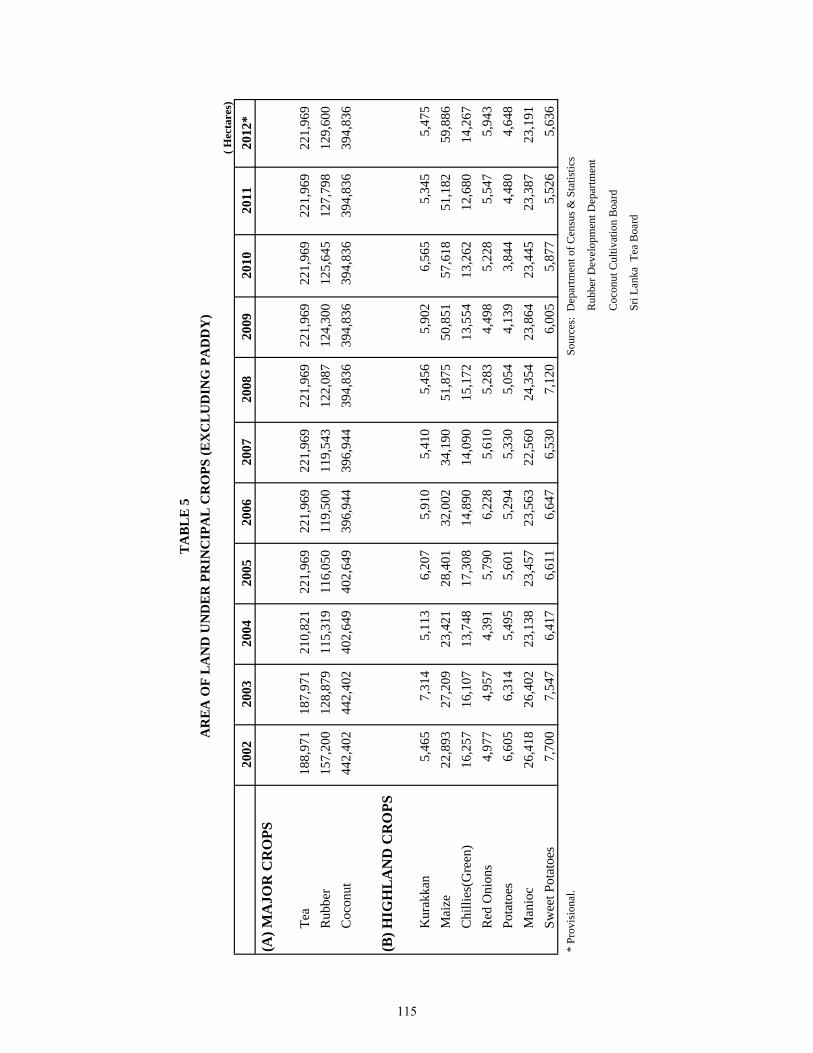
( H
ecta
res)
2002
2003
2004
2005
2006
2007
2008
2009
2010
2011
2012
*(A
) MA
JOR
CR
OPS
Tea
188,
971
18
7,97
1
210,
821
22
1,96
9
221,
969
22
1,96
9
221,
969
22
1,96
9
221,
969
22
1,96
9
22
1,96
9
R
ubbe
r15
7,20
0
128,
879
11
5,31
9
116,
050
11
9,50
0
119,
543
12
2,08
7
124,
300
12
5,64
5
127,
798
129,
600
Coc
onut
442,
402
44
2,40
2
402,
649
40
2,64
9
396,
944
39
6,94
4
394,
836
39
4,83
6
394,
836
39
4,83
6
39
4,83
6
(B) H
IGH
LA
ND
CR
OPS
Kur
akka
n5,
465
7,31
4
5,
113
6,20
7
5,
910
5,41
0
5,
456
5,
902
6,56
5
5,
345
5,
475
M
aize
22,8
93
27
,209
23,4
21
28
,401
32,0
02
34
,190
51,8
75
50
,851
57,6
18
51
,182
59,8
86
C
hilli
es(G
reen
)16
,257
16,1
07
13
,748
17,3
08
14
,890
14,0
90
15
,172
13,5
54
13
,262
12,6
80
14
,267
Red
Oni
ons
4,97
7
4,
957
4,39
1
5,
790
6,22
8
5,
610
5,28
3
4,49
8
5,
228
5,54
7
5,94
3
Pot
atoe
s6,
605
6,31
4
5,
495
5,60
1
5,
294
5,33
0
5,
054
4,
139
3,84
4
4,
480
4,
648
M
anio
c26
,418
26,4
02
23
,138
23,4
57
23
,563
22,5
60
24
,354
23,8
64
23
,445
23,3
87
23
,191
Sw
eet P
otat
oes
7,70
0
7,
547
6,41
7
6,
611
6,64
7
6,
530
7,12
0
6,00
5
5,
877
5,52
6
5,63
6
* Pr
ovis
iona
l.So
urce
s: D
epar
tmen
t of C
ensu
s & S
tatis
tics
R
ubbe
r Dev
elop
men
t Dep
artm
ent
C
ocon
ut C
ultiv
atio
n B
oard
S
ri La
nka
Tea
Boa
rd
AR
EA
OF
LA
ND
UN
DE
R P
RIN
CIP
AL
CR
OPS
(EX
CL
UD
ING
PA
DD
Y)
TA
BL
E 5
115
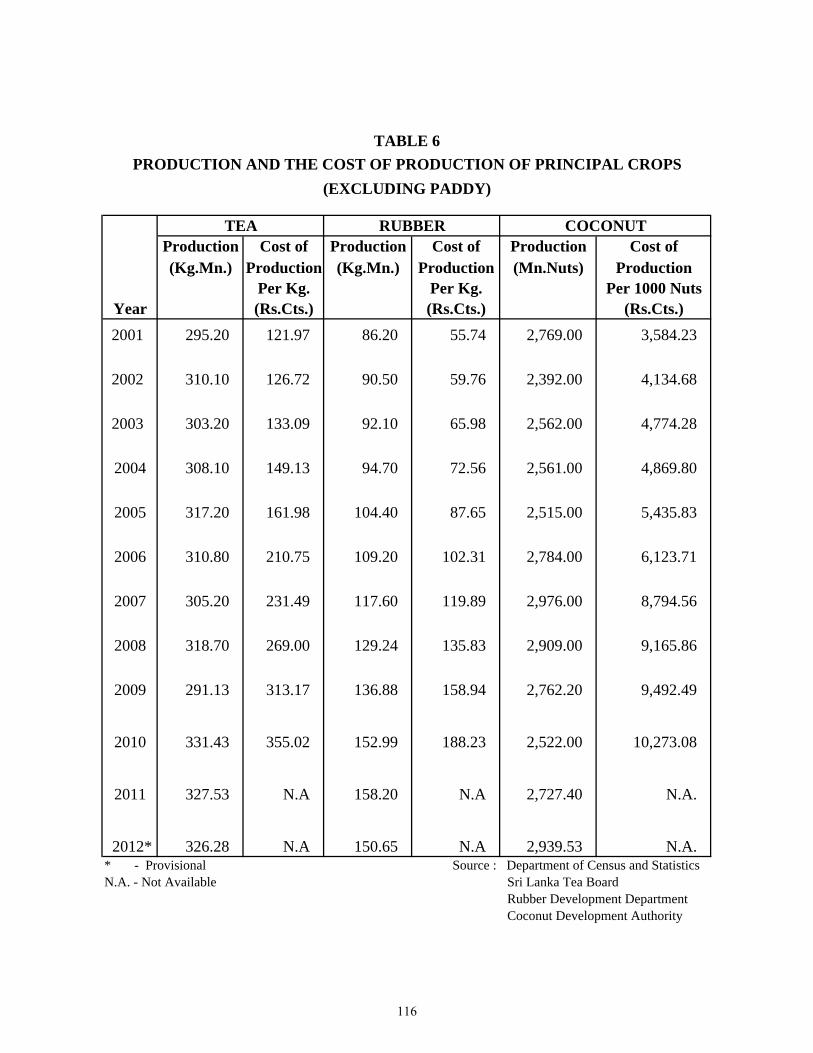
Production Cost of Production Cost of Production Cost of(Kg.Mn.) Production (Kg.Mn.) Production (Mn.Nuts) Production
Per Kg. Per Kg. Per 1000 Nuts(Rs.Cts.) (Rs.Cts.) (Rs.Cts.)
2001 295.20 121.97 86.20 55.74 2,769.00 3,584.23
2002 310.10 126.72 90.50 59.76 2,392.00 4,134.68
2003 303.20 133.09 92.10 65.98 2,562.00 4,774.28
2004 308.10 149.13 94.70 72.56 2,561.00 4,869.80
2005 317.20 161.98 104.40 87.65 2,515.00 5,435.83
2006 310.80 210.75 109.20 102.31 2,784.00 6,123.71
2007 305.20 231.49 117.60 119.89 2,976.00 8,794.56
2008 318.70 269.00 129.24 135.83 2,909.00 9,165.86
2009 291.13 313.17 136.88 158.94 2,762.20 9,492.49
2010 331.43 355.02 152.99 188.23 2,522.00 10,273.08
2011 327.53 N.A 158.20 N.A 2,727.40 N.A.
2012* 326.28 N.A 150.65 N.A 2,939.53 N.A.* - Provisional Source : Department of Census and StatisticsN.A. - Not Available Sri Lanka Tea Board
Rubber Development Department Coconut Development Authority
TABLE 6
TEA RUBBER COCONUT
(EXCLUDING PADDY)
Year
PRODUCTION AND THE COST OF PRODUCTION OF PRINCIPAL CROPS
116
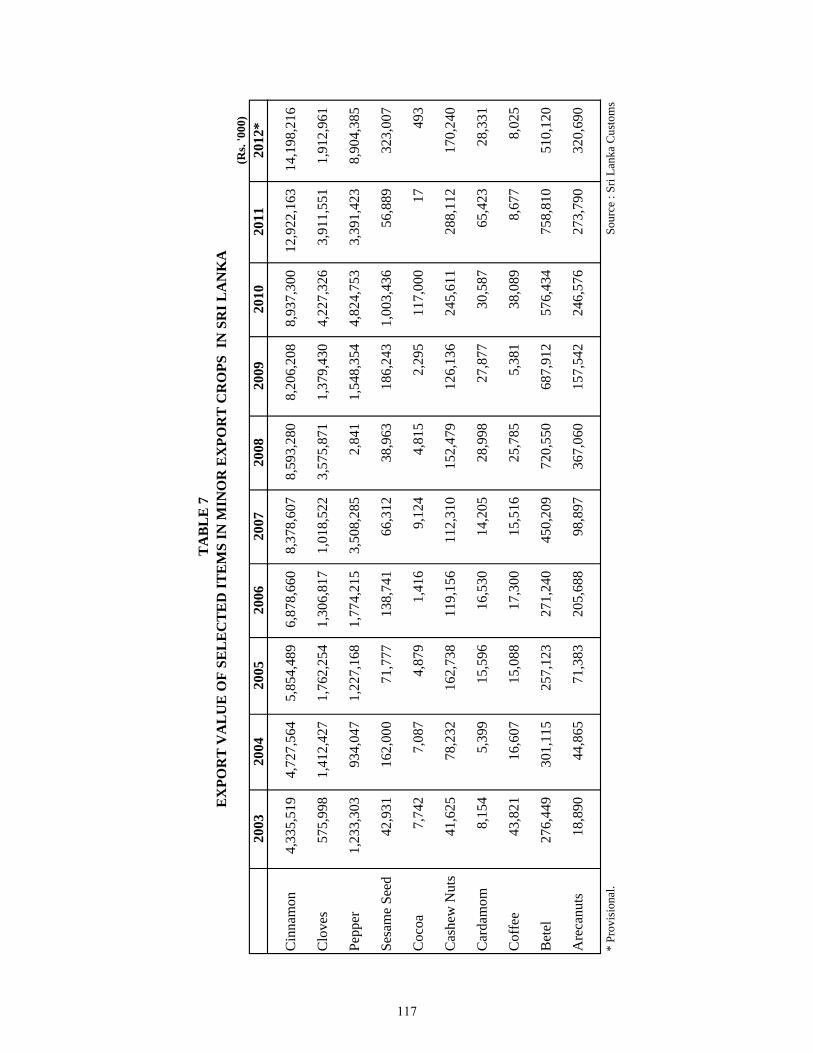
(Rs.
'000
)20
0320
0420
0520
0620
0720
0820
0920
1020
1120
12*
Cin
nam
on4,
335,
519
4,
727,
564
5,
854,
489
6,
878,
660
8,
378,
607
8,
593,
280
8,
206,
208
8,
937,
300
12
,922
,163
14
,198
,216
Clo
ves
575,
998
1,41
2,42
7
1,76
2,25
4
1,30
6,81
7
1,01
8,52
2
3,57
5,87
1
1,37
9,43
0
4,22
7,32
6
3,91
1,55
1
1,91
2,96
1
Pepp
er1,
233,
303
93
4,04
7
1,
227,
168
1,
774,
215
3,
508,
285
2,
841
1,
548,
354
4,
824,
753
3,
391,
423
8,
904,
385
Sesa
me
Seed
42,9
31
162,
000
71,7
77
138,
741
66,3
12
38
,963
186,
243
1,00
3,43
6
56,8
89
323,
007
Coc
oa7,
742
7,08
7
4,87
9
1,41
6
9,12
4
4,81
5
2,29
5
11
7,00
0
17
49
3
Cas
hew
Nut
s41
,625
78
,232
16
2,73
8
11
9,15
6
11
2,31
0
15
2,47
9
12
6,13
6
24
5,61
1
28
8,11
2
17
0,24
0
Car
dam
om8,
154
5,39
9
15,5
96
16,5
30
14
,205
28,9
98
27
,877
30
,587
65,4
23
28,3
31
Cof
fee
43,8
21
16,6
07
15,0
88
17,3
00
15
,516
25,7
85
5,
381
38,0
89
8,
677
8,02
5
Bet
el27
6,44
9
30
1,11
5
25
7,12
3
27
1,24
0
45
0,20
9
72
0,55
0
68
7,91
2
57
6,43
4
75
8,81
0
51
0,12
0
Are
canu
ts18
,890
44
,865
71
,383
20
5,68
8
98
,897
367,
060
157,
542
246,
576
273,
790
320,
690
* Pr
ovis
iona
l. S
ourc
e : S
ri La
nka
Cus
tom
s
TA
BL
E 7
EX
POR
T V
AL
UE
OF
SEL
EC
TE
D IT
EM
S IN
MIN
OR
EX
POR
T C
RO
PS I
N S
RI L
AN
KA
117
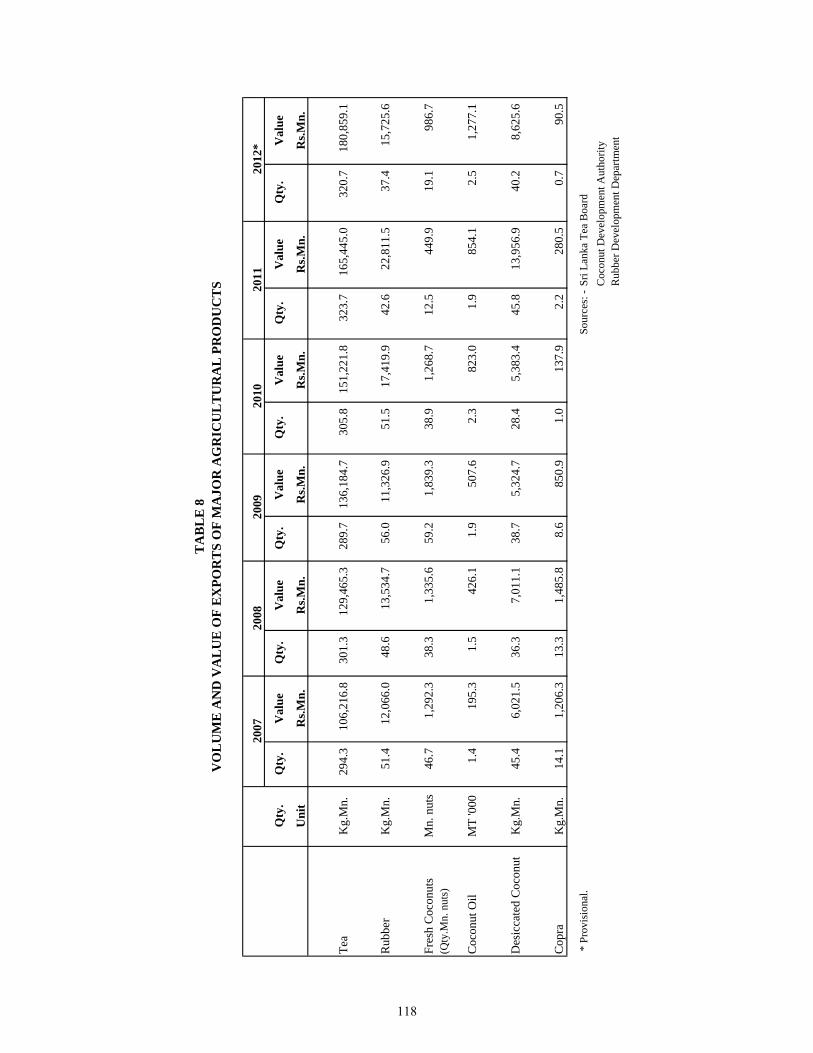
Qty
.Q
ty.
Val
ueQ
ty.
Val
ueQ
ty.
Val
ueQ
ty.
Val
ueQ
ty.
Val
ueQ
ty.
Val
ue
Uni
tR
s.Mn.
Rs.M
n.R
s.Mn.
Rs.M
n.R
s.Mn.
Rs.M
n.
Tea
Kg.
Mn.
294.
3
106,
216.
8
301.
3
129,
465.
3
289.
7
136,
184.
7
305.
8
15
1,22
1.8
32
3.7
165,
445.
0
320.
7
18
0,85
9.1
Rub
ber
Kg.
Mn.
51.4
12,0
66.0
48.6
13,5
34.7
56.0
11,3
26.9
51
.5
17,4
19.9
42
.6
22
,811
.5
37
.4
15,7
25.6
Fres
h C
ocon
uts
Mn.
nut
s46
.7
1,
292.
3
38
.3
1,
335.
6
59.2
1,83
9.3
38.9
1,
268.
7
12
.5
44
9.9
19.1
98
6.7
(Qty
.Mn.
nut
s)
Coc
onut
Oil
MT
'000
1.4
195.
3
1.5
42
6.1
1.9
507.
6
2.3
82
3.0
1.
9
854.
1
2.
5
1,
277.
1
Des
icca
ted
Coc
onut
Kg.
Mn.
45.4
6,02
1.5
36.3
7,01
1.1
38
.7
5,
324.
7
28
.4
5,38
3.4
45.8
13,9
56.9
40.2
8,
625.
6
Cop
raK
g.M
n.14
.1
1,
206.
3
13
.3
1,
485.
8
8.6
850.
9
1.0
13
7.9
2.
2
280.
5
0.
7
90
.5
* P
rovi
sion
al.
Sou
rces
: -Sr
i Lan
ka T
ea B
oard
Coc
onut
Dev
elop
men
t Aut
horit
yR
ubbe
r Dev
elop
men
t Dep
artm
ent
2012
*
TA
BL
E 8
VO
LU
ME
AN
D V
AL
UE
OF
EX
POR
TS
OF
MA
JOR
AG
RIC
UL
TU
RA
L P
RO
DU
CT
S 2011
2010
2009
2008
2007
118
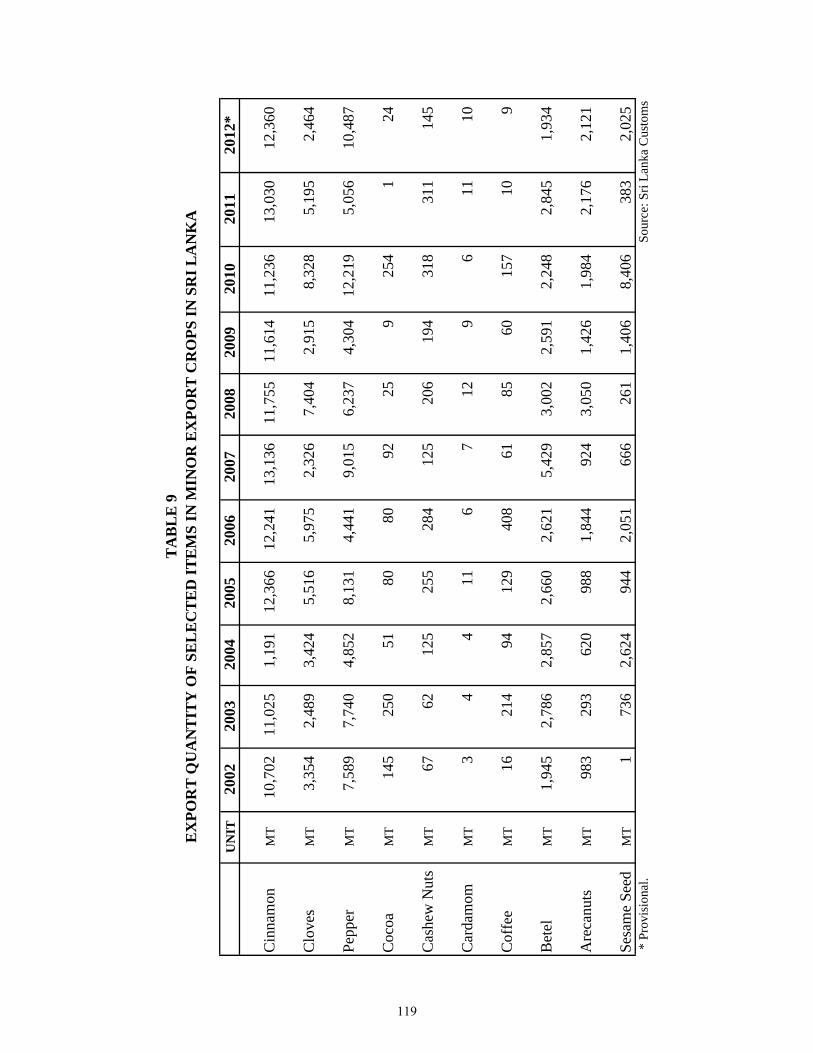
UN
IT20
0220
0320
0420
0520
0620
0720
0820
0920
1020
1120
12*
Cin
nam
onM
T10
,702
11,0
25
1,19
1
12,3
66
12,2
41
13,1
36
11,7
55
11,6
14
11,2
36
13,0
30
12
,360
C
love
sM
T3,
354
2,48
9
3,
424
5,
516
5,97
5
2,
326
7,40
4
2,91
5
8,32
8
5,
195
2,
464
Pepp
erM
T7,
589
7,74
0
4,
852
8,
131
4,44
1
9,
015
6,23
7
4,30
4
12,2
19
5,05
6
10,4
87
Coc
oaM
T14
525
0
51
80
80
92
25
9
25
4
1
24
Cas
hew
Nut
sM
T67
62
125
255
28
4
125
20
6
19
4
31
8
311
145
C
arda
mom
MT
34
4
11
6
7
12
9
6
11
10
Cof
fee
MT
16
214
94
12
9
408
61
85
60
15
7
10
9
Bet
elM
T1,
945
2,78
6
2,
857
2,
660
2,62
1
5,
429
3,00
2
2,59
1
2,24
8
2,
845
1,
934
Are
canu
tsM
T98
329
3
620
988
1,
844
924
3,
050
1,
426
1,
984
2,17
6
2,12
1
Sesa
me
Seed
MT
1
73
6
2,62
4
944
2,
051
666
26
1
1,
406
8,
406
383
2,02
5
* P
rovi
sion
al.
Sour
ce: S
ri La
nka
Cus
tom
s
TA
BL
E 9
EX
POR
T Q
UA
NT
ITY
OF
SEL
EC
TE
D IT
EM
S IN
MIN
OR
EX
POR
T C
RO
PS IN
SR
I LA
NK
A
119
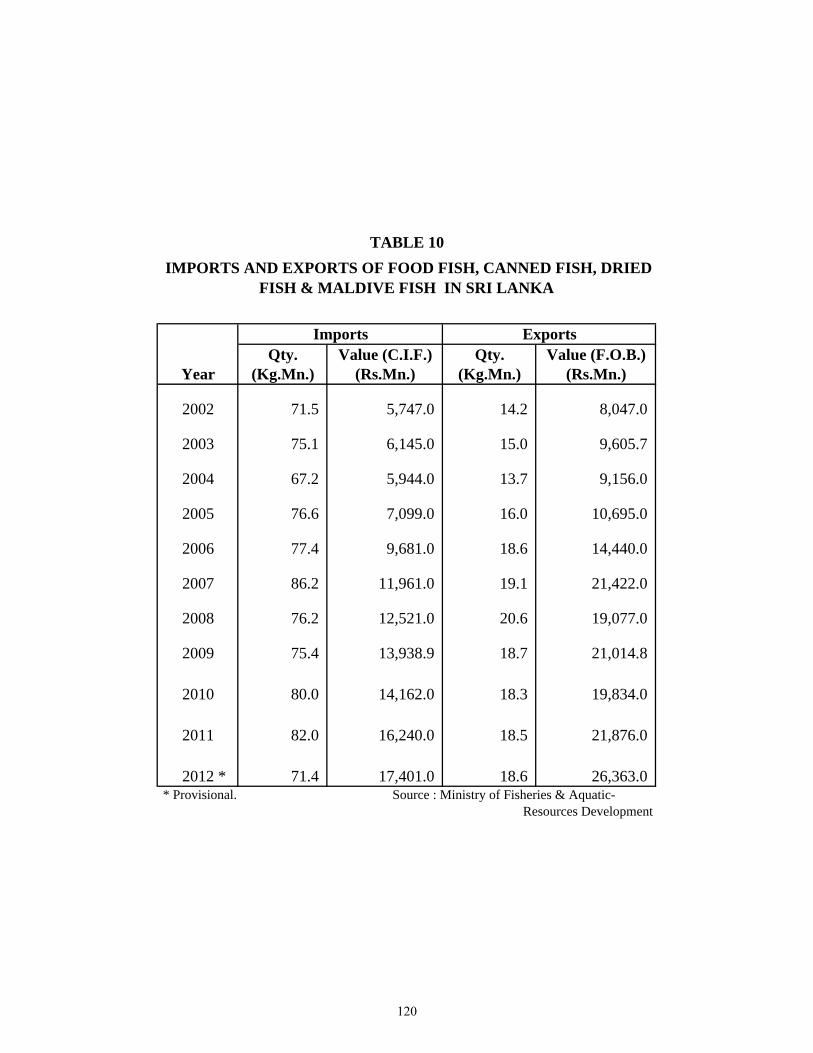
Qty. Value (C.I.F.) Qty. Value (F.O.B.)(Kg.Mn.) (Rs.Mn.) (Kg.Mn.) (Rs.Mn.)
2002 71.5 5,747.0 14.2 8,047.0
2003 75.1 6,145.0 15.0 9,605.7
2004 67.2 5,944.0 13.7 9,156.0
2005 76.6 7,099.0 16.0 10,695.0
2006 77.4 9,681.0 18.6 14,440.0
2007 86.2 11,961.0 19.1 21,422.0
2008 76.2 12,521.0 20.6 19,077.0
2009 75.4 13,938.9 18.7 21,014.8
2010 80.0 14,162.0 18.3 19,834.0
2011 82.0 16,240.0 18.5 21,876.0
2012 * 71.4 17,401.0 18.6 26,363.0 * Provisional. Source : Ministry of Fisheries & Aquatic-
Imports Exports
TABLE 10 IMPORTS AND EXPORTS OF FOOD FISH, CANNED FISH, DRIED
FISH & MALDIVE FISH IN SRI LANKA
Year
Resources Development
120
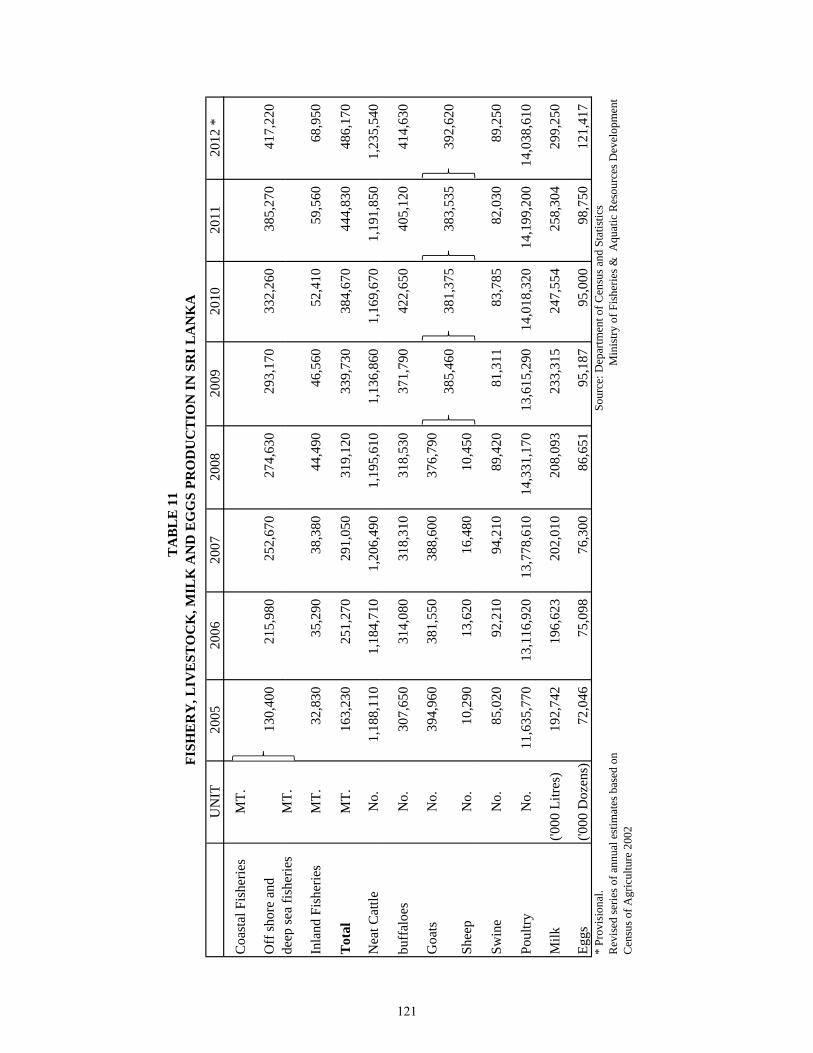
TA
BL
E 1
1FI
SHE
RY
LIV
EST
OC
KM
ILK
AN
DE
GG
SPR
OD
UC
TIO
NIN
SRIL
AN
KA
UN
IT20
0520
0620
0720
0820
0920
1020
1120
12 *
Coa
stal
Fis
herie
sM
T.
Off
shor
e an
d13
0,40
0
215,
980
25
2,67
0
274,
630
29
3,17
0
332,
260
38
5,27
0
417,
220
de
epse
afis
herie
sM
T
FISH
ER
Y, L
IVE
STO
CK
, MIL
K A
ND
EG
GS
PRO
DU
CT
ION
IN S
RI L
AN
KA
deep
sea
fishe
ries
MT.
Inla
nd F
ishe
ries
MT.
32,8
30
35,2
90
38
,380
44
,490
46
,560
52,4
10
59,5
60
68,9
50
T
otal
MT.
163,
230
25
1,27
0
291,
050
31
9,12
0
339,
730
38
4,67
0
444,
830
48
6,17
0
Nea
t Cat
tleN
o.1,
188,
110
1,18
4,71
0
1,
206,
490
1,
195,
610
1,
136,
860
1,16
9,67
0
1,19
1,85
0
1,23
5,54
0
buff
aloe
sN
o.30
7,65
0
314,
080
31
8,31
0
318,
530
37
1,79
0
422,
650
40
5,12
0
414,
630
Goa
tsN
o.39
4,96
0
381,
550
38
8,60
0
376,
790
38
5,46
0
381,
375
383,
535
392,
620
Shee
pN
o.10
,290
13
,620
16,4
80
10,4
50
Swin
eN
o.85
,020
92
,210
94,2
10
89,4
20
81,3
11
83
,785
82
,030
89
,250
Poul
tryN
o.11
,635
,770
13
,116
,920
13,7
78,6
10
14,3
31,1
70
13,6
15,2
90
14,0
18,3
20
14,1
99,2
00
14,0
38,6
10
Milk
('000
Litr
es)
192,
742
19
6,62
3
202,
010
20
8,09
3
233,
315
24
7,55
4
258,
304
29
9,25
0
Eggs
('000
Doz
ens)
72,0
46
75,0
98
76
,300
86
,651
95
,187
95,0
00
98,7
50
121,
417
*
Prov
isio
nal.
Rev
ised
serie
s of a
nnua
l est
imat
es b
ased
on
Cen
sus o
f Agr
icul
ture
200
2
Sou
rce:
Dep
artm
ent o
f Cen
sus a
nd S
tatis
tics
M
inis
try o
f Fis
herie
s & A
quat
ic R
esou
rces
Dev
elop
men
t
121
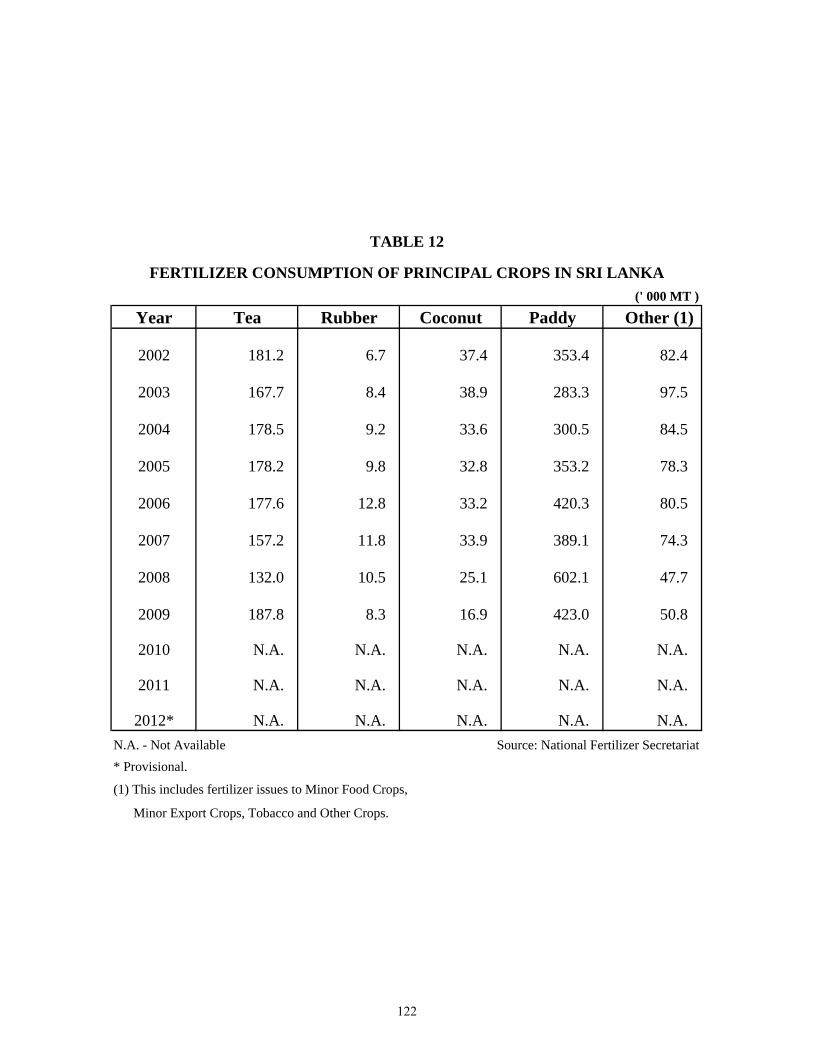
(' 000 MT )
Year Tea Rubber Coconut Paddy Other (1)
2002 181.2 6.7 37.4 353.4 82.4
2003 167.7 8.4 38.9 283.3 97.5
2004 178.5 9.2 33.6 300.5 84.5
2005 178.2 9.8 32.8 353.2 78.3
2006 177.6 12.8 33.2 420.3 80.5
2007 157.2 11.8 33.9 389.1 74.3
2008 132.0 10.5 25.1 602.1 47.7
2009 187.8 8.3 16.9 423.0 50.8
2010 N.A. N.A. N.A. N.A. N.A.
2011 N.A. N.A. N.A. N.A. N.A.
2012* N.A. N.A. N.A. N.A. N.A.N.A. - Not Available* Provisional.
(1) This includes fertilizer issues to Minor Food Crops,
Minor Export Crops, Tobacco and Other Crops.
TABLE 12
FERTILIZER CONSUMPTION OF PRINCIPAL CROPS IN SRI LANKA
Source: National Fertilizer Secretariat
122
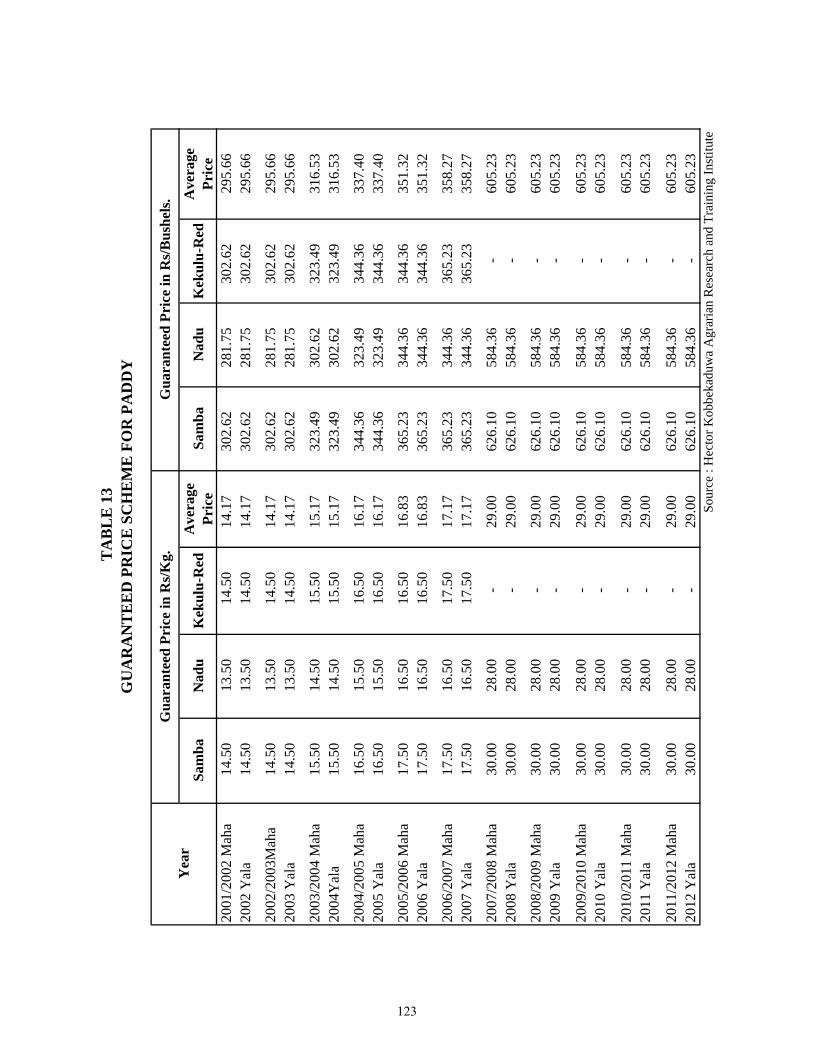
Sam
baN
adu
Kek
ulu-
Red
Ave
rage
Pr
ice
Sam
baN
adu
Kek
ulu-
Red
Ave
rage
Pr
ice
2001
/200
2 M
aha
14.5
013
.50
14.5
014
.17
302.
6228
1.75
302.
6229
5.66
2002
Yal
a14
.50
13.5
014
.50
14.1
730
2.62
281.
7530
2.62
295.
66
2002
/200
3Mah
a14
.50
13.5
014
.50
14.1
730
2.62
281.
7530
2.62
295.
6620
03 Y
ala
14.5
013
.50
14.5
014
.17
302.
6228
1.75
302.
6229
5.66
2003
/200
4 M
aha
15.5
014
.50
15.5
015
.17
323.
4930
2.62
323.
4931
6.53
2004
Yal
a15
.50
14.5
015
.50
15.1
732
3.49
302.
6232
3.49
316.
53
2004
/200
5 M
aha
16.5
015
.50
16.5
016
.17
344.
3632
3.49
344.
3633
7.40
2005
Yal
a16
.50
15.5
016
.50
16.1
734
4.36
323.
4934
4.36
337.
40
2005
/200
6 M
aha
17.5
016
.50
16.5
016
.83
365.
2334
4.36
344.
3635
1.32
2006
Yal
a17
.50
16.5
016
.50
16.8
336
5.23
344.
3634
4.36
351.
32
2006
/200
7 M
aha
17.5
016
.50
17.5
017
.17
365.
2334
4.36
365.
2335
8.27
2007
Yal
a17
.50
16.5
017
.50
17.1
736
5.23
344.
3636
5.23
358.
27
2007
/200
8 M
aha
30.0
028
.00
-29
.00
626.
1058
4.36
-60
5.23
2008
Yal
a30
.00
28.0
0-
29.0
062
6.10
584.
36-
605.
23
2008
/200
9 M
aha
30.0
028
.00
-29
.00
626.
1058
4.36
-60
5.23
2009
Yal
a30
.00
28.0
0-
29.0
062
6.10
584.
36-
605.
23
2009
/201
0 M
aha
30.0
028
.00
-29
.00
626.
1058
4.36
-60
5.23
2010
Yal
a30
.00
28.0
0-
29.0
062
6.10
584.
36-
605.
23
2010
/201
1 M
aha
30.0
028
.00
-29
.00
626.
1058
4.36
-60
5.23
2011
Yal
a30
.00
28.0
0-
29.0
062
6.10
584.
36-
605.
23
2011
/201
2 M
aha
30.0
028
.00
-29
.00
626.
1058
4.36
-60
5.23
2012
Yal
a30
.00
28.0
0-
29.0
062
6.10
584.
36-
605.
23So
urce
: H
ecto
r Kob
beka
duw
a A
grar
ian
Res
earc
h an
d Tr
aini
ng In
stitu
te
Yea
rG
uara
ntee
d Pr
ice
in R
s/K
g.G
uara
ntee
d Pr
ice
in R
s/B
ushe
ls.
TA
BL
E 1
3G
UA
RA
NT
EE
D P
RIC
E S
CH
EM
E F
OR
PA
DD
Y
123
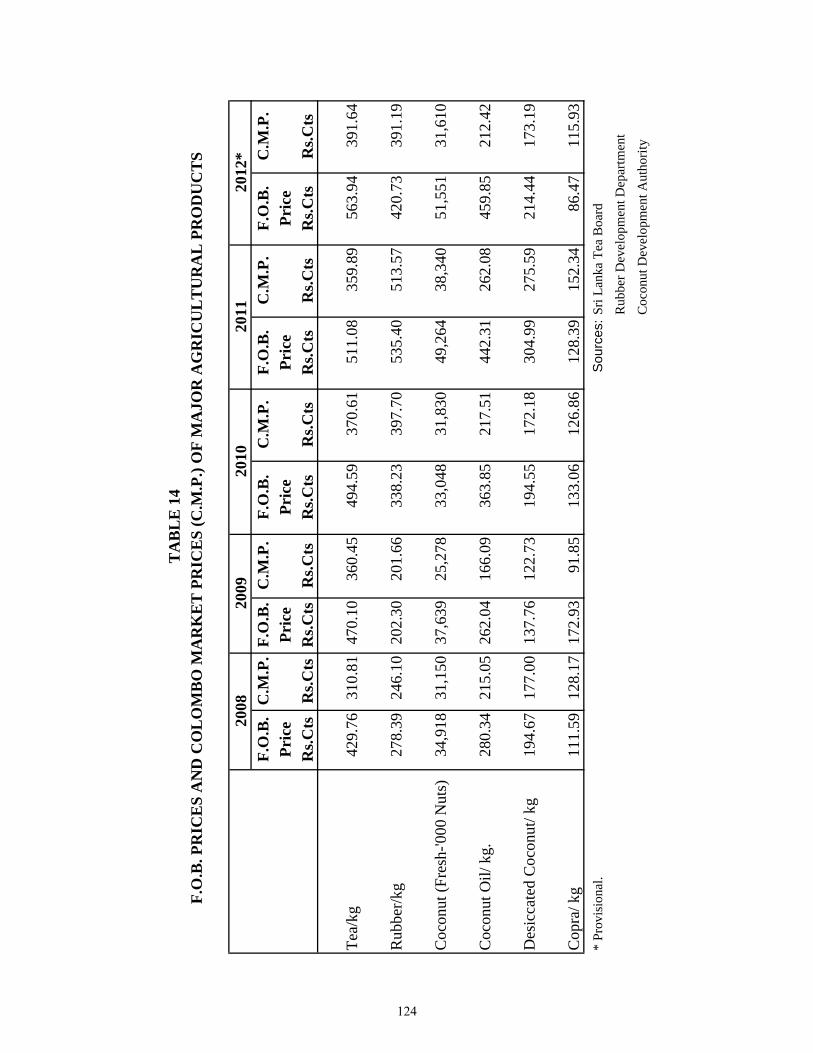
F.O
.B.
C.M
.P.
F.O
.B.
C.M
.P.
F.O
.B.
C.M
.P.
F.O
.B.
C.M
.P.
F.O
.B.
C.M
.P.
Pric
e
Pric
e
Pric
e
Pric
e
Pric
e
Rs.C
tsR
s.Cts
Rs.C
tsR
s.Cts
Rs.C
tsR
s.Cts
Rs.C
tsR
s.Cts
Rs.C
tsR
s.Cts
Tea/
kg42
9.76
310.
8147
0.10
360.
4549
4.59
370.
6151
1.08
359.
8956
3.94
391.
64
Rub
ber/k
g27
8.39
246.
1020
2.30
201.
6633
8.23
397.
7053
5.40
513.
5742
0.73
391.
19
Coc
onut
(Fre
sh-'0
00 N
uts)
34,9
1831
,150
37,6
3925
,278
33,0
4831
,830
49,2
6438
,340
51,5
5131
,610
Coc
onut
Oil/
kg.
280.
3421
5.05
262.
0416
6.09
363.
8521
7.51
442.
3126
2.08
459.
8521
2.42
Des
icca
ted
Coc
onut
/ kg
194.
6717
7.00
137.
7612
2.73
194.
5517
2.18
304.
9927
5.59
214.
4417
3.19
Cop
ra/ k
g11
1.59
128.
1717
2.93
91.8
513
3.06
126.
8612
8.39
152.
3486
.47
115.
93*
Prov
isio
nal.
Sou
rces
:Sri
Lank
a Te
a B
oard
Rub
ber D
evel
opm
ent D
epar
tmen
t
Coc
onut
Dev
elop
men
t Aut
horit
y
2009
2012
*
TA
BL
E 1
4F.
O.B
. PR
ICE
S A
ND
CO
LO
MB
O M
AR
KE
T P
RIC
ES
(C.M
.P.)
OF
MA
JOR
AG
RIC
UL
TU
RA
L P
RO
DU
CT
S
2010
2011
2008
124
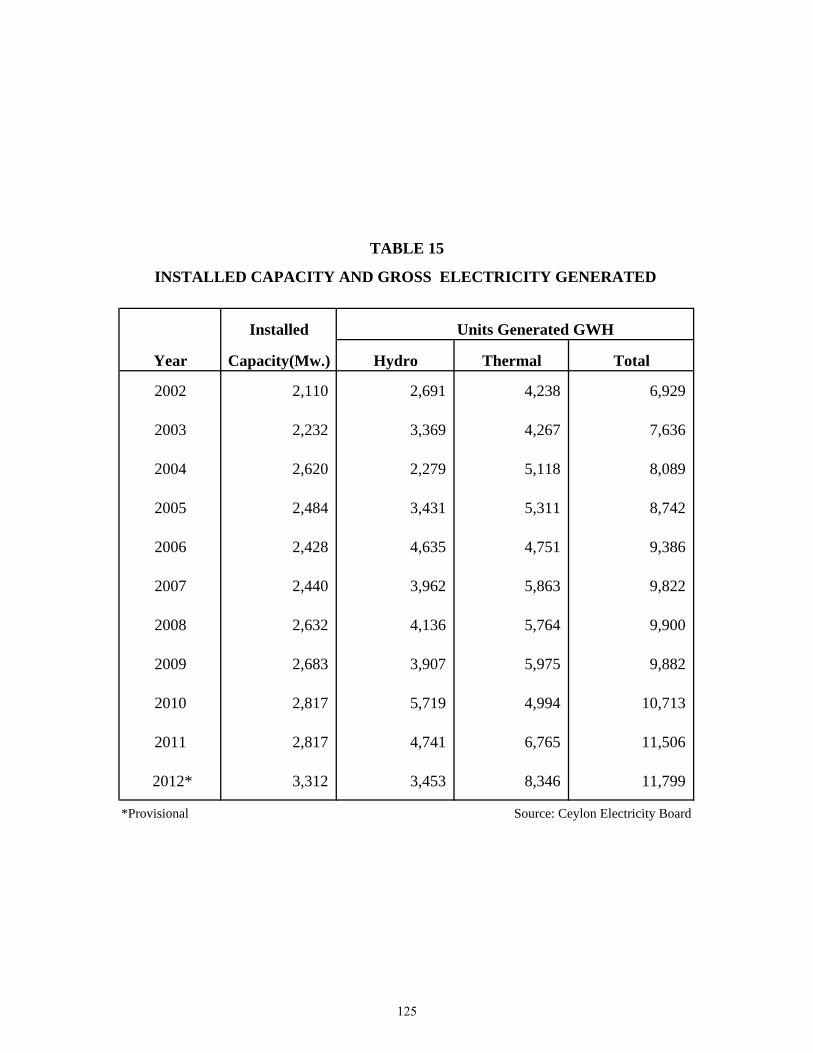
Installed
Capacity(Mw.) Hydro Thermal Total
2002 2,110 2,691 4,238 6,929
2003 2,232 3,369 4,267 7,636
2004 2,620 2,279 5,118 8,089
2005 2,484 3,431 5,311 8,742
2006 2,428 4,635 4,751 9,386
2007 2,440 3,962 5,863 9,822
2008 2,632 4,136 5,764 9,900
2009 2,683 3,907 5,975 9,882
2010 2,817 5,719 4,994 10,713
2011 2,817 4,741 6,765 11,506
2012* 3,312 3,453 8,346 11,799
*Provisional
TABLE 15
Year
Units Generated GWH
INSTALLED CAPACITY AND GROSS ELECTRICITY GENERATED
Source: Ceylon Electricity Board
125
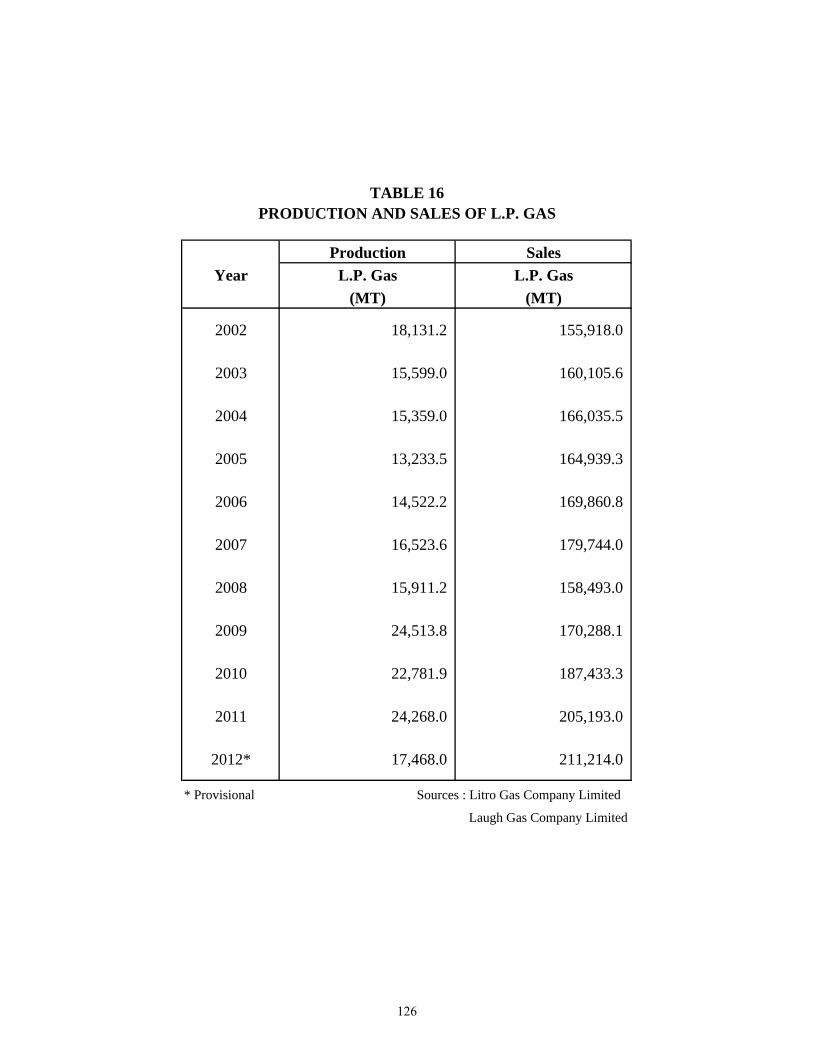
SalesYear L.P. Gas L.P. Gas
(MT) (MT)
2002 18,131.2 155,918.0
2003 15,599.0 160,105.6
2004 15,359.0 166,035.5
2005 13,233.5 164,939.3
2006 14,522.2 169,860.8
2007 16,523.6 179,744.0
2008 15,911.2 158,493.0
2009 24,513.8 170,288.1
2010 22,781.9 187,433.3
2011 24,268.0 205,193.0
2012* 17,468.0 211,214.0
* Provisional
Production
PRODUCTION AND SALES OF L.P. GASTABLE 16
Sources : Litro Gas Company Limited
Laugh Gas Company Limited
126
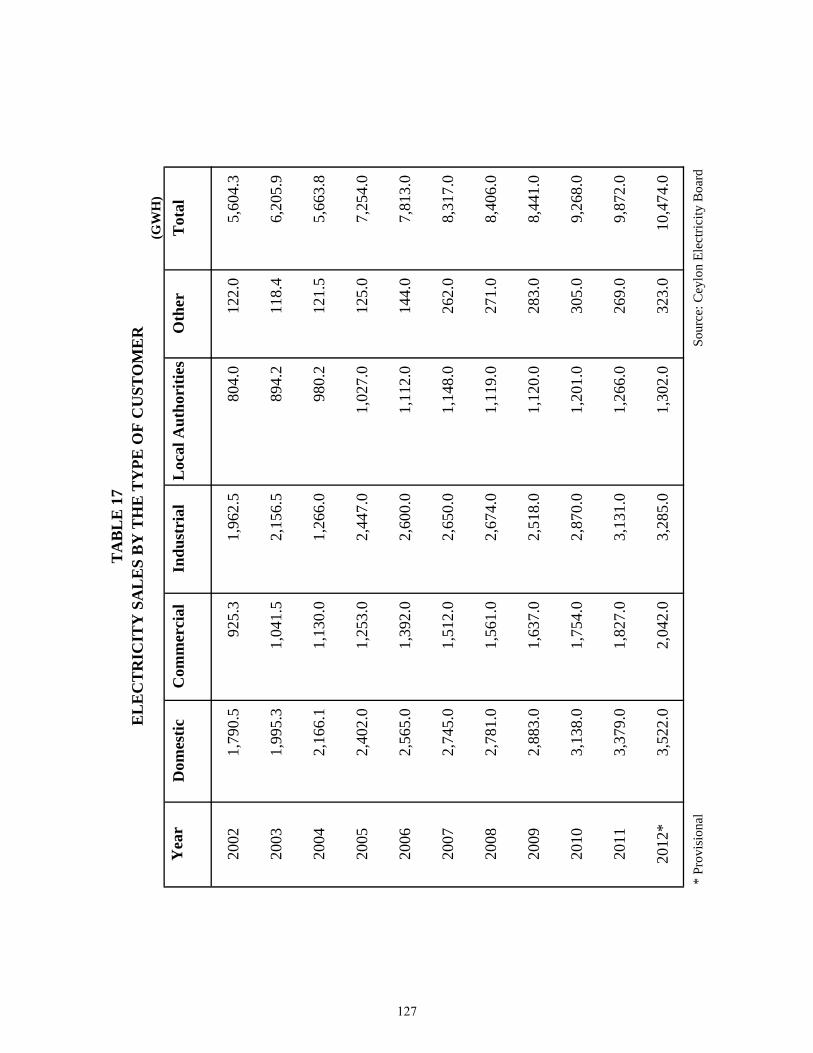
(GW
H)
Yea
rD
omes
ticC
omm
erci
alIn
dust
rial
Loc
al A
utho
ritie
sO
ther
Tot
al
2002
1,79
0.5
925.
3
1,96
2.5
804.
0
122.
0
5,
604.
3
2003
1,99
5.3
1,04
1.5
2,15
6.5
894.
2
118.
4
6,
205.
9
2004
2,16
6.1
1,13
0.0
1,26
6.0
980.
2
121.
5
5,
663.
8
2005
2,40
2.0
1,25
3.0
2,44
7.0
1,02
7.0
125.
0
7,
254.
0
2006
2,56
5.0
1,39
2.0
2,60
0.0
1,11
2.0
144.
0
7,
813.
0
2007
2,74
5.0
1,51
2.0
2,65
0.0
1,14
8.0
262.
0
8,
317.
0
2008
2,78
1.0
1,56
1.0
2,67
4.0
1,11
9.0
271.
0
8,
406.
0
2009
2,88
3.0
1,63
7.0
2,51
8.0
1,12
0.0
283.
0
8,
441.
0
2010
3,13
8.0
1,75
4.0
2,87
0.0
1,20
1.0
305.
0
9,
268.
0
2011
3,37
9.0
1,82
7.0
3,13
1.0
1,26
6.0
269.
0
9,
872.
0
2012
*3,
522.
0
2,
042.
0
3,
285.
0
1,
302.
0
32
3.0
10,4
74.0
* Pr
ovis
iona
l
EL
EC
TR
ICIT
Y S
AL
ES
BY
TH
E T
YPE
OF
CU
STO
ME
RT
AB
LE
17
Sour
ce: C
eylo
n El
ectri
city
Boa
rd
127
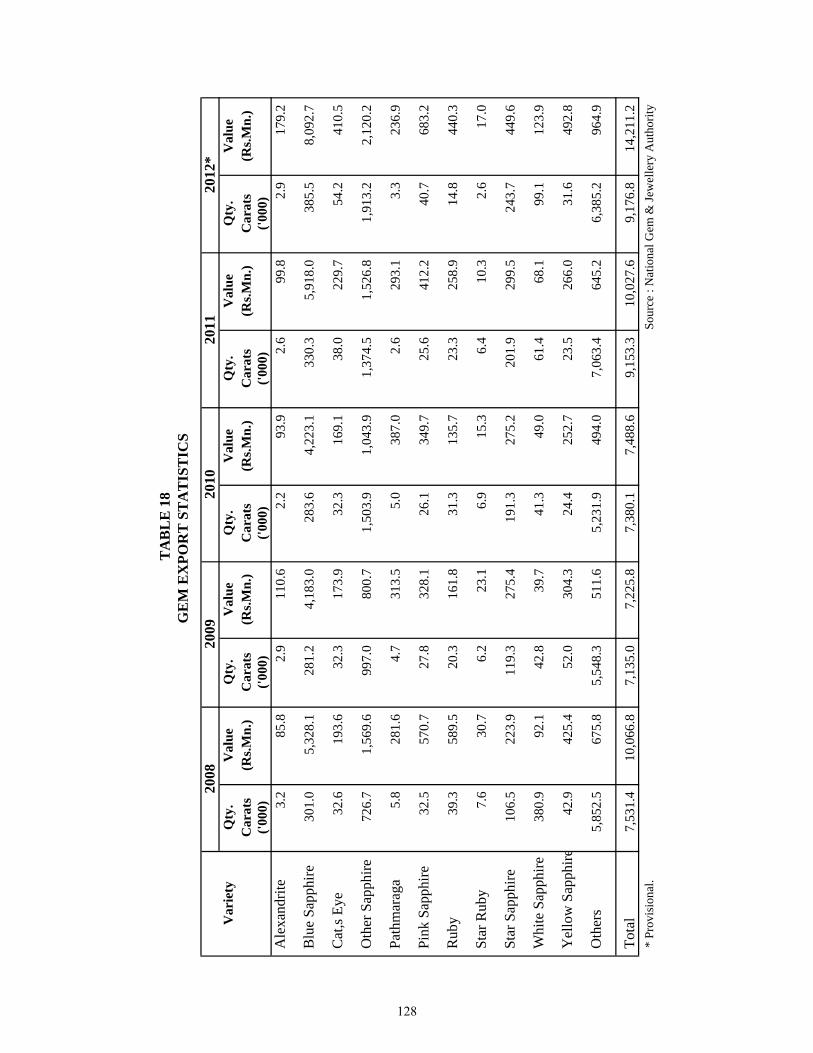
Var
iety
Qty
.V
alue
Qty
.V
alue
Qty
.V
alue
Qty
.V
alue
Qty
.V
alue
Car
ats
(Rs.M
n.)
Car
ats
(Rs.M
n.)
Car
ats
(Rs.M
n.)
Car
ats
(Rs.M
n.)
Car
ats
(Rs.M
n.)
('000
)('0
00)
('000
)('0
00)
('000
)A
lexa
ndrit
e3.
2
85
.8
2.9
110.
6
2.
2
93.9
2.
6
99.8
2.
9
179.
2
Blu
e Sa
pphi
re30
1.0
5,
328.
1
281.
2
4,18
3.0
28
3.6
4,22
3.1
33
0.3
5,91
8.0
38
5.5
8,09
2.7
Cat
,s Ey
e32
.6
193.
6
32
.3
17
3.9
32.3
169.
1
38
.0
229.
7
54
.2
410.
5
Oth
er S
apph
ire72
6.7
1,
569.
6
997.
0
800.
7
1,
503.
9
1,04
3.9
1,
374.
5
1,52
6.8
1,
913.
2
2,12
0.2
Path
mar
aga
5.8
281.
6
4.
7
31
3.5
5.0
38
7.0
2.6
29
3.1
3.3
23
6.9
Pink
Sap
phire
32.5
57
0.7
27.8
328.
1
26
.1
34
9.7
25.6
41
2.2
40.7
68
3.2
Rub
y39
.3
589.
5
20
.3
16
1.8
31.3
135.
7
23
.3
258.
9
14
.8
440.
3
Star
Rub
y7.
6
30
.7
6.2
23.1
6.9
15
.3
6.4
10
.3
2.6
17
.0
Star
Sap
phire
106.
5
223.
9
11
9.3
27
5.4
191.
3
27
5.2
201.
9
29
9.5
243.
7
44
9.6
Whi
te S
apph
ire38
0.9
92
.1
42.8
39.7
41.3
49.0
61
.4
68.1
99
.1
123.
9
Yel
low
Sap
phire
42.9
42
5.4
52.0
304.
3
24
.4
25
2.7
23.5
26
6.0
31.6
49
2.8
Oth
ers
5,85
2.5
675.
8
5,
548.
3
51
1.6
5,23
1.9
49
4.0
7,06
3.4
64
5.2
6,38
5.2
96
4.9
Tota
l7,
531.
4
10
,066
.8
7,
135.
0
7,
225.
8
7,38
0.1
7,
488.
6
9,15
3.3
10
,027
.6
9,
176.
8
14,2
11.2
* P
rovi
sion
al.
2011
2012
*
S
ourc
e : N
atio
nal G
em &
Jew
elle
ry A
utho
rity
TA
BL
E 1
8G
EM
EX
POR
T S
TA
TIS
TIC
S
2010
2009
2008
128
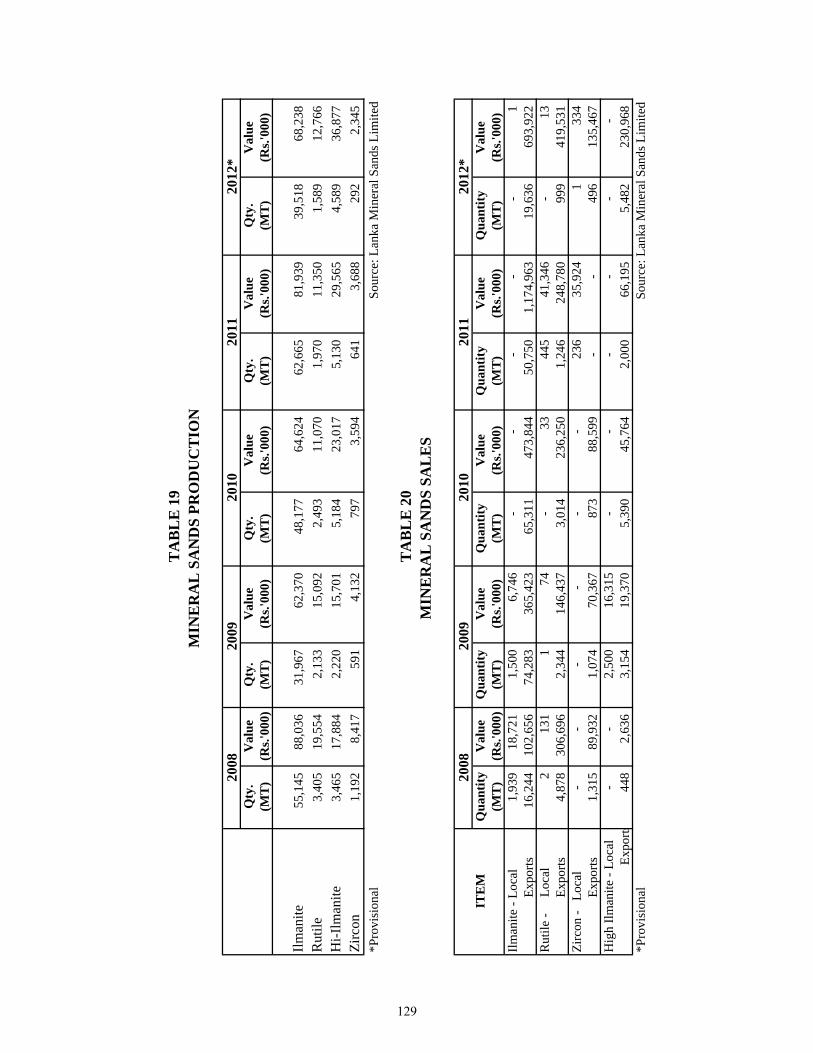
Qty
.V
alue
Qty
.V
alue
Qty
.V
alue
Qty
.V
alue
Qty
.V
alue
(MT
)(R
s.'00
0)(M
T)
(Rs.'
000)
(MT
)(R
s.'00
0)(M
T)
(Rs.'
000)
(MT
)(R
s.'00
0)
Ilman
ite55
,145
88,0
36
31
,967
62,3
70
48,1
77
64,6
24
62
,665
81
,939
39,5
18
68
,238
Rut
ile3,
405
19
,554
2,13
3
15,0
92
2,49
3
11
,070
1,97
0
11
,350
1,58
9
12
,766
Hi-I
lman
ite3,
465
17
,884
2,22
0
15,7
01
5,18
4
23
,017
5,13
0
29
,565
4,58
9
36
,877
Zirc
on1,
192
8,
417
591
4,13
2
79
7
3,59
4
641
3,
688
292
2,
345
*Pro
visi
onal
ITE
MQ
uant
ityV
alue
Qua
ntity
Val
ueQ
uant
ityV
alue
Qua
ntity
Val
ueQ
uant
ityV
alue
(MT
)(R
s.'00
0)(M
T)
(Rs.'
000)
(MT
)(R
s.'00
0)(M
T)
(Rs.'
000)
(MT
)(R
s.'00
0)Ilm
anite
- Lo
cal
1,93
9
18,7
21
1,
500
6,
746
-
-
-
-
-
1
E
xpor
ts16
,244
102,
656
74
,283
365,
423
65
,311
47
3,84
4
50,7
50
1,17
4,96
3
19
,636
693,
922
R
utile
-
Loc
al
2
131
1
74
-
33
44
5
41,3
46
-
13
E
xpor
ts4,
878
30
6,69
6
2,34
4
146,
437
3,
014
236,
250
1,
246
248,
780
99
9
419,
531
Zi
rcon
- L
ocal
-
-
-
-
-
-
236
35
,924
1
33
4
E
xpor
ts1,
315
89
,932
1,07
4
70,3
67
873
88
,599
-
-
496
13
5,46
7
Hig
h Ilm
anite
- Lo
cal
-
-
2,
500
16
,315
-
-
-
-
-
-
Ex
port s
448
2,63
6
3,
154
19
,370
5,
390
45,7
64
2,
000
66,1
95
5,
482
230,
968
*P
rovi
sion
al
2008
2008
2010
2010
MIN
ER
AL
SA
ND
S SA
LE
S
2012
*20
09
Sour
ce: L
anka
Min
eral
San
ds L
imite
d
TA
BL
E 2
0
2012
*
TA
BL
E 1
9M
INE
RA
L S
AN
DS
PRO
DU
CT
ION
Sour
ce: L
anka
Min
eral
San
ds L
imite
d
2009
2011
2011
129
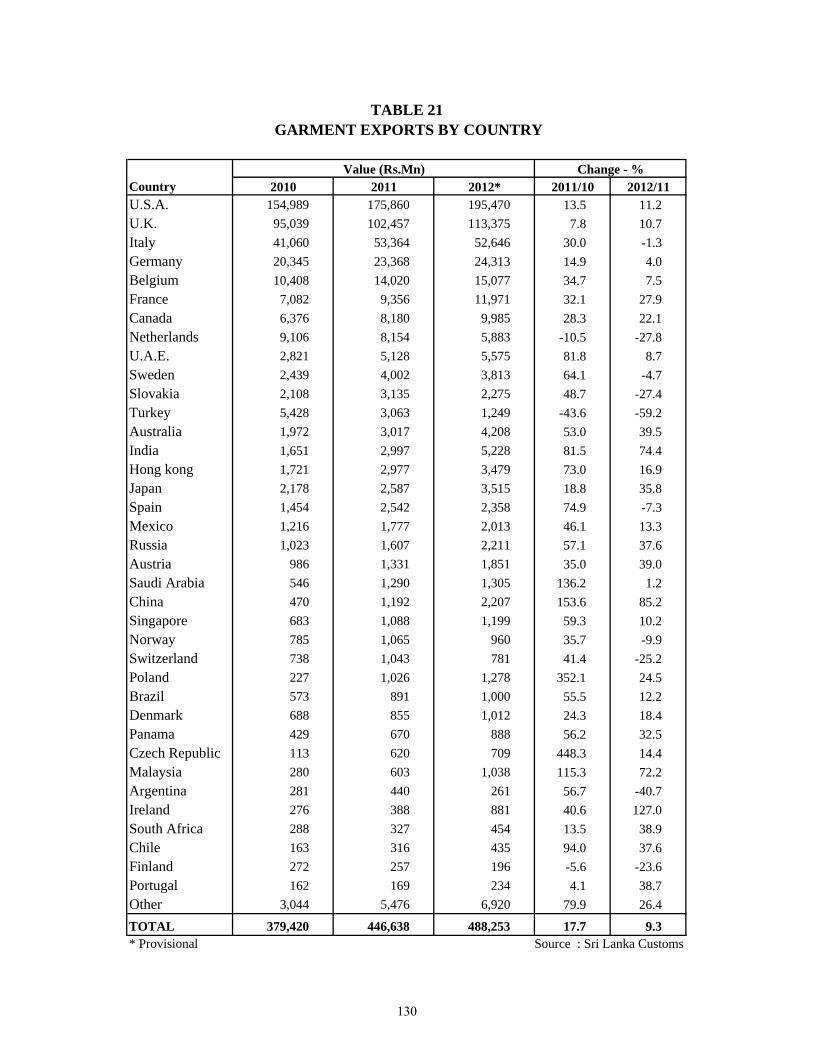
Country 2010 2011 2012* 2011/10 2012/11U.S.A. 154,989 175,860 195,470 13.5 11.2U.K. 95,039 102,457 113,375 7.8 10.7Italy 41,060 53,364 52,646 30.0 -1.3Germany 20,345 23,368 24,313 14.9 4.0Belgium 10,408 14,020 15,077 34.7 7.5France 7,082 9,356 11,971 32.1 27.9Canada 6,376 8,180 9,985 28.3 22.1Netherlands 9,106 8,154 5,883 -10.5 -27.8U.A.E. 2,821 5,128 5,575 81.8 8.7Sweden 2,439 4,002 3,813 64.1 -4.7Slovakia 2,108 3,135 2,275 48.7 -27.4Turkey 5,428 3,063 1,249 -43.6 -59.2Australia 1,972 3,017 4,208 53.0 39.5India 1,651 2,997 5,228 81.5 74.4Hong kong 1,721 2,977 3,479 73.0 16.9Japan 2,178 2,587 3,515 18.8 35.8Spain 1,454 2,542 2,358 74.9 -7.3Mexico 1,216 1,777 2,013 46.1 13.3Russia 1,023 1,607 2,211 57.1 37.6Austria 986 1,331 1,851 35.0 39.0Saudi Arabia 546 1,290 1,305 136.2 1.2China 470 1,192 2,207 153.6 85.2Singapore 683 1,088 1,199 59.3 10.2Norway 785 1,065 960 35.7 -9.9Switzerland 738 1,043 781 41.4 -25.2Poland 227 1,026 1,278 352.1 24.5Brazil 573 891 1,000 55.5 12.2Denmark 688 855 1,012 24.3 18.4Panama 429 670 888 56.2 32.5Czech Republic 113 620 709 448.3 14.4Malaysia 280 603 1,038 115.3 72.2Argentina 281 440 261 56.7 -40.7Ireland 276 388 881 40.6 127.0South Africa 288 327 454 13.5 38.9Chile 163 316 435 94.0 37.6Finland 272 257 196 -5.6 -23.6Portugal 162 169 234 4.1 38.7Other 3,044 5,476 6,920 79.9 26.4
TOTAL 379,420 446,638 488,253 17.7 9.3* Provisional
Change - %
GARMENT EXPORTS BY COUNTRYTABLE 21
Source : Sri Lanka Customs
Value (Rs.Mn)
130
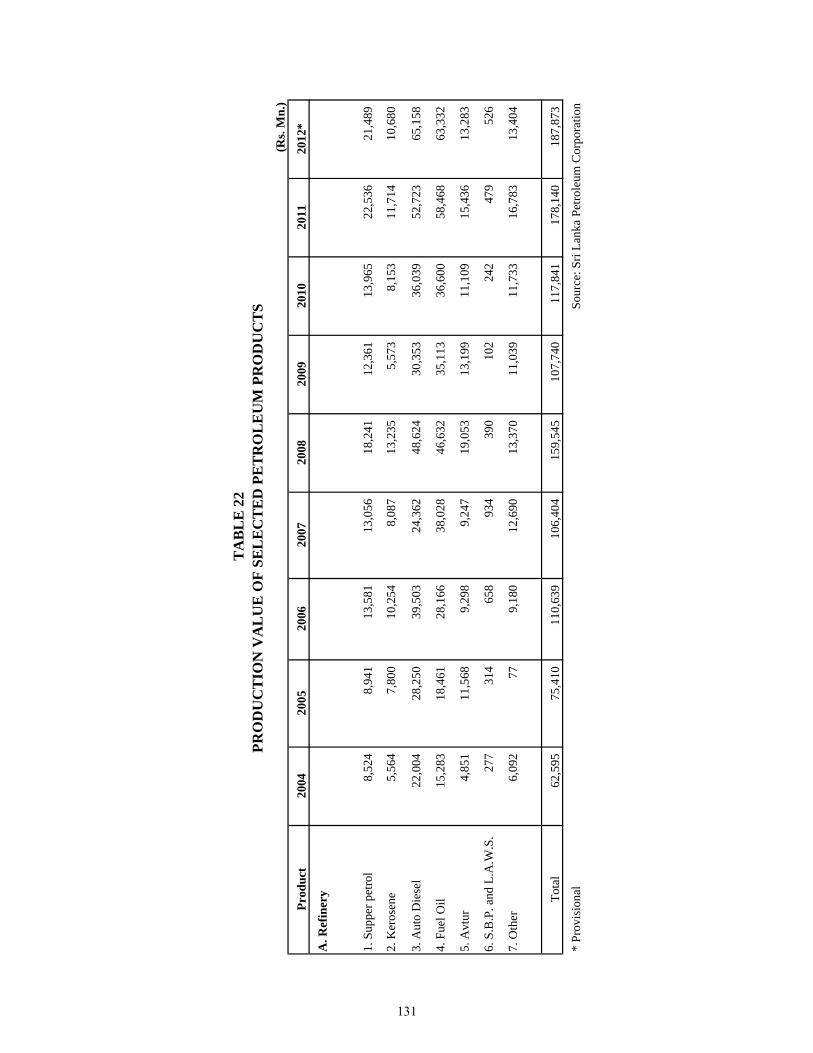
(Rs.
Mn.
)
Prod
uct
2004
2005
2006
2007
2008
2009
2010
2011
2012
*
A. R
efin
ery
1. S
uppe
r pet
rol
8,52
48,
941
13,5
8113
,056
18,2
4112
,361
13,9
6522
,536
21,4
89
2. K
eros
ene
5,56
47,
800
10,2
548,
087
13,2
355,
573
8,15
311
,714
10,6
80
3. A
uto
Die
sel
22,0
0428
,250
39,5
0324
,362
48,6
2430
,353
36,0
3952
,723
65,1
58
4. F
uel O
il15
,283
18,4
6128
,166
38,0
2846
,632
35,1
1336
,600
58,4
6863
,332
5. A
vtur
4,85
111
,568
9,29
89,
247
19,0
5313
,199
11,1
0915
,436
13,2
83
6. S
.B.P
. and
L.A
.W.S
.27
731
465
893
439
010
224
247
952
6
7. O
ther
6,09
277
9,
180
12
,690
13
,370
11,0
39
11
,733
16,7
83
13
,404
Tota
l62
,595
75,4
1011
0,63
910
6,40
415
9,54
510
7,74
011
7,84
117
8,14
018
7,87
3
* Pr
ovis
iona
l
So
urce
: Sri
Lank
a Pe
trole
um C
orpo
ratio
n
TA
BL
E 2
2PR
OD
UC
TIO
N V
AL
UE
OF
SEL
EC
TE
D P
ET
RO
LE
UM
PR
OD
UC
TS
131
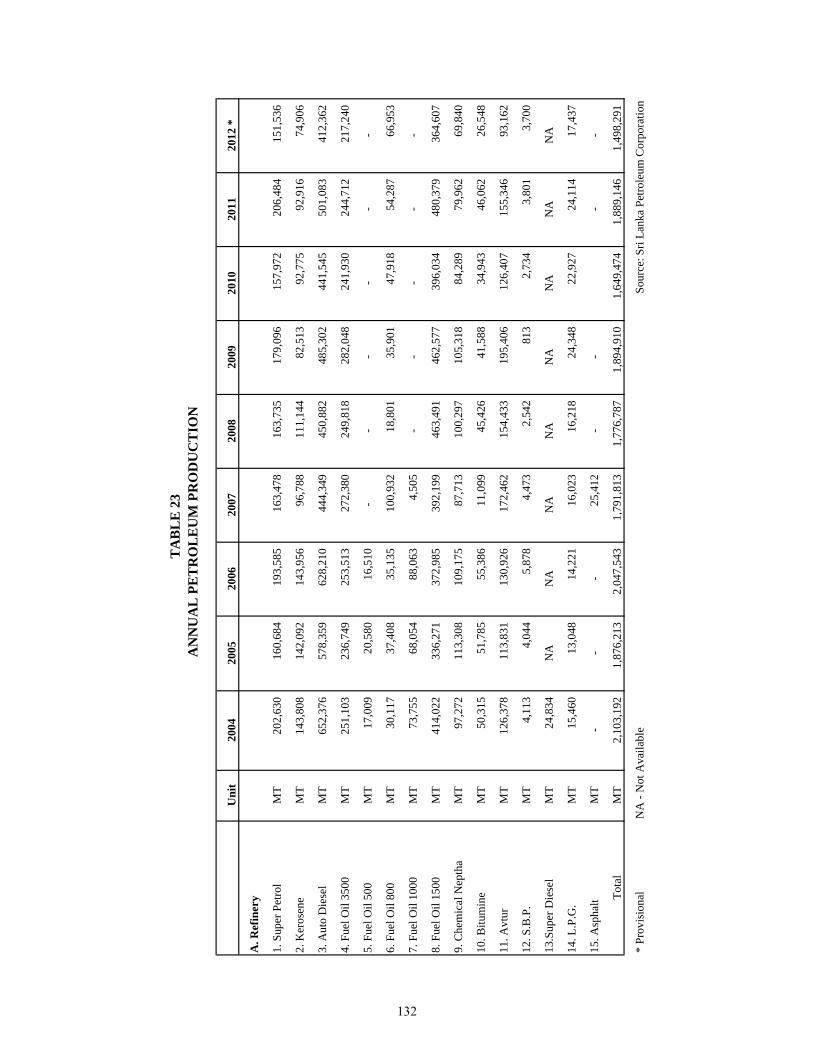
Uni
t20
0420
0520
0620
0720
0820
0920
1020
1120
12 *
A. R
efin
ery
1. S
uper
Pet
rol
MT
202,
630
160,
684
193,
585
163,
478
163,
735
179,
096
157,
972
206,
484
151,
536
2. K
eros
ene
MT
143,
808
142,
092
143,
956
96,7
8811
1,14
482
,513
92,7
7592
,916
74,9
06
3. A
uto
Die
sel
MT
652,
376
578,
359
628,
210
444,
349
450,
882
485,
302
441,
545
501,
083
412,
362
4. F
uel O
il 35
00M
T25
1,10
323
6,74
925
3,51
327
2,38
024
9,81
828
2,04
824
1,93
024
4,71
221
7,24
0
5. F
uel O
il 50
0M
T17
,009
20,5
8016
,510
--
--
--
6. F
uel O
il 80
0M
T30
,117
37,4
0835
,135
100,
932
18,8
0135
,901
47,9
1854
,287
66,9
53
7. F
uel O
il 10
00M
T73
,755
68,0
5488
,063
4,50
5-
--
--
8. F
uel O
il 15
00M
T41
4,02
233
6,27
137
2,98
539
2,19
946
3,49
146
2,57
739
6,03
448
0,37
936
4,60
7
9. C
hem
ical
Nep
tha
MT
97,2
7211
3,30
810
9,17
587
,713
100,
297
105,
318
84,2
8979
,962
69,8
40
10. B
itum
ine
MT
50,3
1551
,785
55,3
8611
,099
45,4
26
41
,588
34,9
43
46
,062
26,5
48
11. A
vtur
MT
126,
378
113,
831
130,
926
172,
462
154,
433
195,
406
126,
407
155,
346
93,1
62
12. S
.B.P
.M
T4,
113
4,04
45,
878
4,47
32,
542
813
2,73
43,
801
3,70
0
13.S
uper
Die
sel
MT
24,8
34N
AN
AN
AN
AN
AN
AN
AN
A
14. L
.P.G
.M
T15
,460
13,0
4814
,221
16,0
2316
,218
24,3
4822
,927
24,1
1417
,437
15. A
spha
ltM
T-
--
25,4
12-
--
--
Tota
lM
T2,
103,
192
1,87
6,21
32,
047,
543
1,79
1,81
31,
776,
787
1,89
4,91
01,
649,
474
1,88
9,14
61,
498,
291
* Pr
ovis
iona
lN
A -
Not
Ava
ilabl
e
S
ourc
e: S
ri La
nka
Petro
leum
Cor
pora
tion
TA
BL
E 2
3A
NN
UA
L P
ET
RO
LE
UM
PR
OD
UC
TIO
N
132
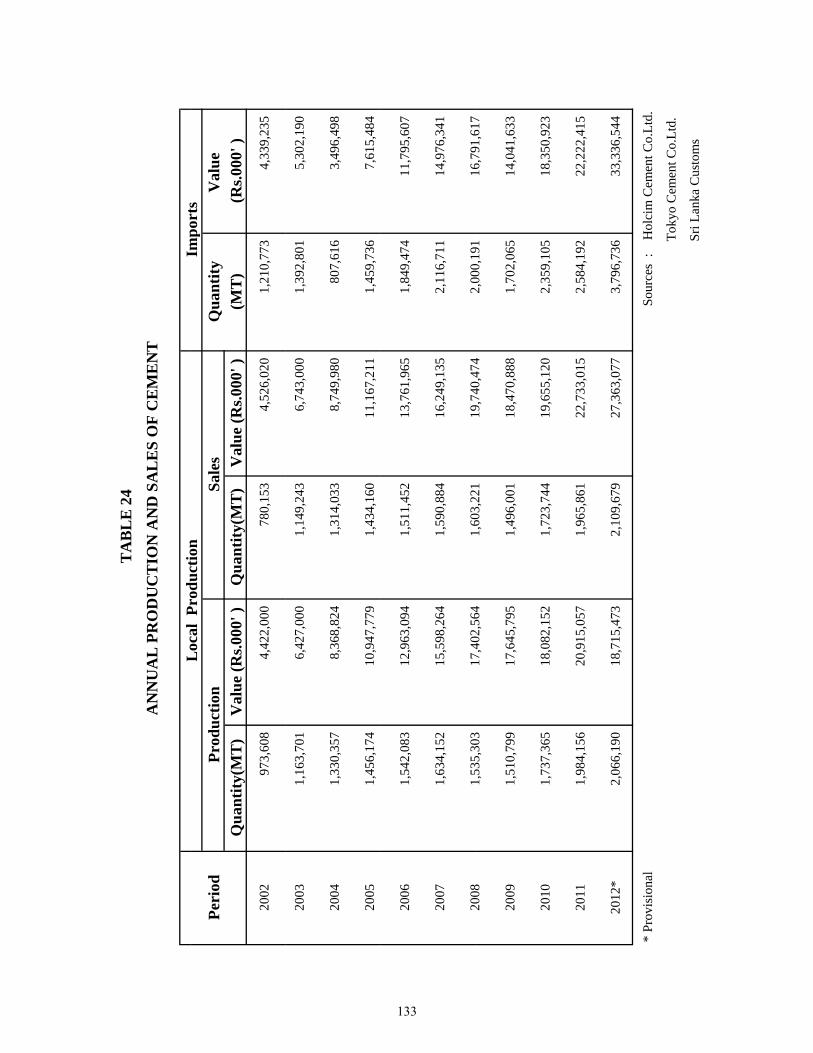
TA
BL
E 2
4A
NN
UA
L P
RO
DU
CT
ION
AN
D S
AL
ES
OF
CE
ME
NT
Loc
alPr
oduc
tion
Impo
rts
Peri
odQ
uant
ityV
alue
Q
uant
ity(M
T)
Val
ue (R
s.000
' )Q
uant
ity(M
T)
Val
ue (R
s.000
' )(M
T)
(Rs.0
00' )
2002
973,
608
4,42
2,00
078
0,15
34,
526,
020
1,21
0,77
34,
339,
235
Loc
al P
rodu
ctio
nPr
oduc
tion
Sale
sIm
port
s
2003
1,16
3,70
16,
427,
000
1,14
9,24
36,
743,
000
1,39
2,80
15,
302,
190
2004
1,33
0,35
78,
368,
824
1,31
4,03
38,
749,
980
807,
616
3,49
6,49
8
2005
1,45
6,17
410
,947
,779
1,43
4,16
011
,167
,211
1,45
9,73
67,
615,
484
2006
1,54
2,08
312
,963
,094
1,51
1,45
213
,761
,965
1,84
9,47
411
,795
,607
2007
1,63
4,15
215
,598
,264
1,59
0,88
416
,249
,135
2,11
6,71
114
,976
,341
2008
153
530
317
402
564
160
322
119
740
474
200
019
116
791
617
2008
1,53
5,30
317
,402
,564
1,60
3,22
119
,740
,474
2,00
0,19
116
,791
,617
2009
1,51
0,79
917
,645
,795
1,49
6,00
118
,470
,888
1,70
2,06
514
,041
,633
2010
1,73
7,36
518
,082
,152
1,72
3,74
419
,655
,120
2,35
9,10
518
,350
,923
2011
1,98
4,15
620
,915
,057
1,96
5,86
122
,733
,015
2,58
4,19
222
,222
,415
2012
*2,
066,
190
18,7
15,4
732,
109,
679
27,3
63,0
773,
796,
736
33,3
36,5
44
* Pr
ovis
iona
l
S
ourc
es :
H
olci
m C
emen
t Co.
Ltd.
Tok
yo C
emen
t Co.
Ltd.
Sri
Lank
a C
usto
ms
133
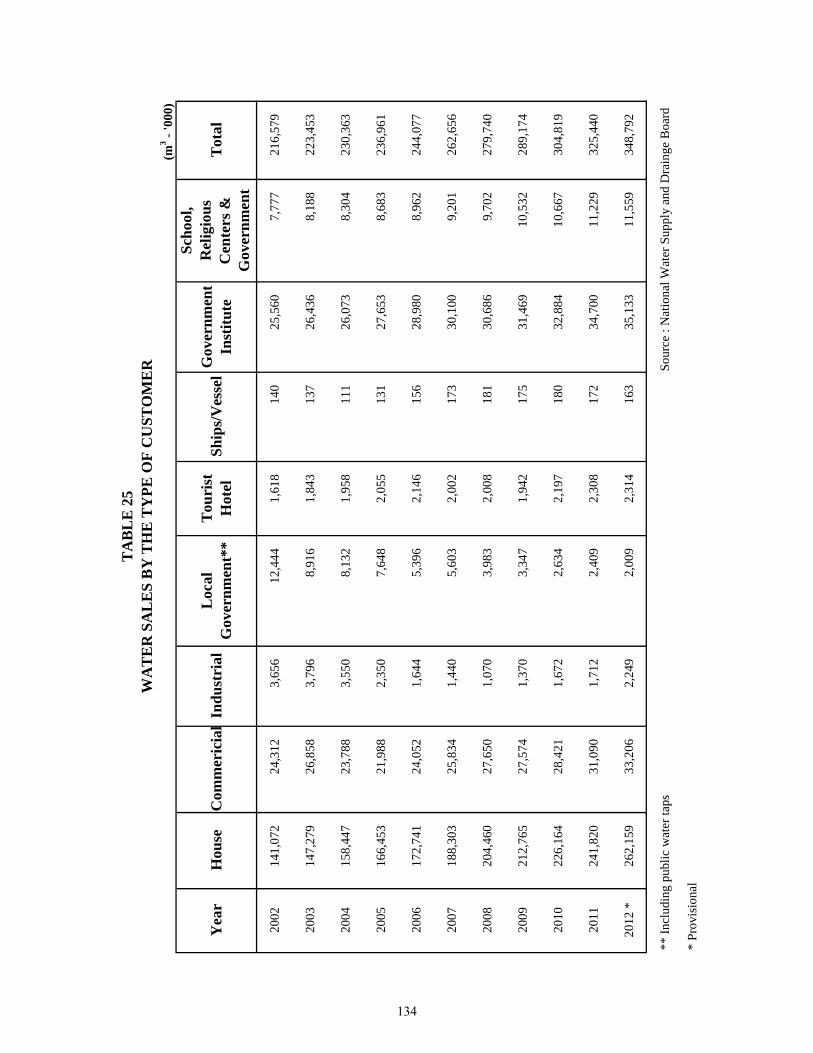
(m3 -
'000
)
2002
141,
072
24,3
123,
656
12,4
441,
618
140
25,5
607,
777
216,
579
2003
147,
279
26,8
583,
796
8,91
61,
843
137
26,4
368,
188
223,
453
2004
158,
447
23,7
883,
550
8,13
21,
958
111
26,0
738,
304
230,
363
2005
166,
453
21,9
882,
350
7,64
82,
055
131
27,6
538,
683
236,
961
2006
172,
741
24,0
521,
644
5,39
62,
146
156
28,9
808,
962
244,
077
2007
188,
303
25,8
341,
440
5,60
32,
002
173
30,1
009,
201
262,
656
2008
204,
460
27,6
501,
070
3,98
32,
008
181
30,6
869,
702
279,
740
2009
212,
765
27,5
741,
370
3,34
71,
942
175
31,4
6910
,532
289,
174
2010
226,
164
28,4
211,
672
2,63
42,
197
180
32,8
8410
,667
304,
819
2011
241,
820
31,0
901,
712
2,40
92,
308
172
34,7
0011
,229
325,
440
2012
*26
2,15
933
,206
2,24
92,
009
2,31
416
335
,133
11,5
5934
8,79
2
** In
clud
ing
publ
ic w
ater
taps
* Pr
ovis
iona
l
Gov
ernm
ent
Inst
itute
Loc
al
Gov
ernm
ent*
*T
ouri
st
Hot
elSh
ips/
Ves
sel
Indu
stri
alC
omm
eric
ial
Hou
seY
ear
S
ourc
e : N
atio
nal W
ater
Sup
ply
and
Dra
inge
Boa
rd
TA
BL
E 2
5W
AT
ER
SA
LE
S B
Y T
HE
TY
PE O
F C
UST
OM
ER
Scho
ol,
Rel
igio
us
Cen
ters
&
Gov
ernm
ent
Tot
al
134
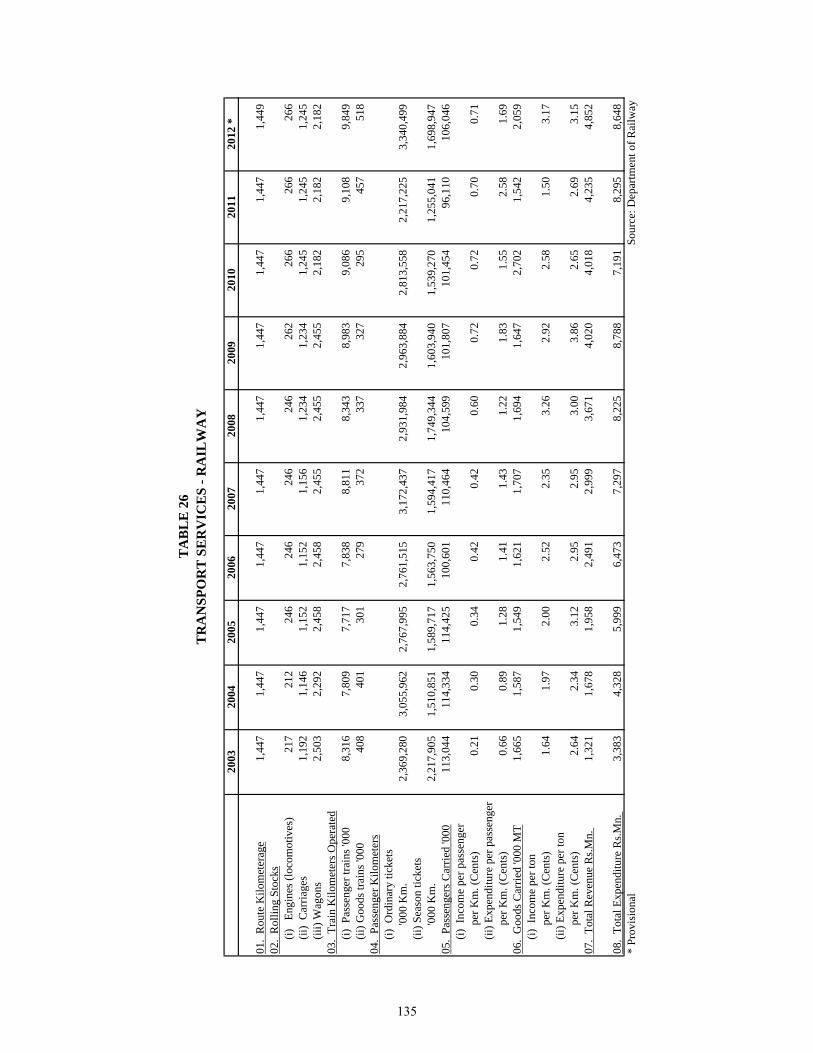
2003
2004
2005
2006
2007
2008
2009
2010
2011
2012
*
01.
Rou
te K
ilom
eter
age
1,44
7
1,
447
1,44
7
1,
447
1,44
7
1,44
7
1,44
7
1,44
7
1,44
7
1,44
9
02.
Rol
ling
Stoc
ks
(i)
Eng
ines
(loc
omot
ives
)21
7
212
24
6
246
24
6
24
6
26
2
26
6
26
6
26
6
(ii)
Car
riage
s1,
192
1,14
6
1,
152
1,15
2
1,
156
1,
234
1,
234
1,
245
1,
245
1,
245
(iii
) Wag
ons
2,50
3
2,
292
2,45
8
2,
458
2,45
5
2,45
5
2,45
5
2,18
2
2,18
2
2,18
2
03.
Trai
n K
ilom
eter
s Ope
rate
d
(i)
Pas
seng
er tr
ains
'000
8,31
6
7,
809
7,71
7
7,
838
8,81
1
8,34
3
8,98
3
9,08
6
9,10
8
9,84
9
(
ii) G
oods
trai
ns '0
0040
8
401
30
1
279
37
2
33
7
32
7
29
5
45
7
51
8
04
. Pa
ssen
ger K
ilom
eter
s
(i)
Ord
inar
y tic
kets
'0
00 K
m.
2,36
9,28
0
3,05
5,96
2
2,76
7,99
5
2,76
1,51
5
3,17
2,43
7
2,
931,
984
2,96
3,88
4
2,
813,
558
2,21
7,22
5
3,
340,
499
(
ii) S
easo
n tic
kets
'0
00 K
m.
2,21
7,90
5
1,51
0,85
1
1,58
9,71
7
1,56
3,75
0
1,59
4,41
7
1,
749,
344
1,60
3,94
0
1,
539,
270
1,25
5,04
1
1,
698,
947
05.
Pass
enge
rs C
arrie
d '0
0011
3,04
4
11
4,33
4
11
4,42
5
10
0,60
1
11
0,46
4
104,
599
10
1,80
7
101,
454
96
,110
106,
046
(i)
Inco
me
per p
asse
nger
p
er K
m. (
Cen
ts)
0.21
0.30
0.34
0.42
0.42
0.
60
0.72
0.
72
0.70
0.
71
(
ii) E
xpen
ditu
re p
er p
asse
nger
p
er K
m. (
Cen
ts)
0.66
0.89
1.28
1.41
1.43
1.
22
1.83
1.
55
2.58
1.
69
06.
Goo
ds C
arrie
d '0
00 M
T1,
665
1,58
7
1,
549
1,62
1
1,
707
1,
694
1,
647
2,
702
1,
542
2,
059
(i)
Inco
me
per t
on
per
Km
. (C
ents
)1.
64
1.
97
2.
00
2.
52
2.
35
3.26
2.
92
2.58
1.
50
3.17
(ii)
Exp
endi
ture
per
ton
p
er K
m. (
Cen
ts)
2.64
2.34
3.12
2.95
2.95
3.
00
3.86
2.
65
2.69
3.
15
07.
Tota
l Rev
enue
Rs.M
n.
1,32
1
1,
678
1,95
8
2,
491
2,99
9
3,67
1
4,02
0
4,01
8
4,23
5
4,85
2
08.
Tota
l Exp
endi
ture
Rs.M
n.
3,38
3
4,
328
5,99
9
6,
473
7,29
7
8,22
5
8,78
8
7,19
1
8,29
5
8,64
8
* Pr
ovis
iona
l
TA
BL
E 2
6T
RA
NSP
OR
T S
ER
VIC
ES
- RA
ILW
AY
S
ourc
e: D
epar
tmen
t of R
ailw
ay
135
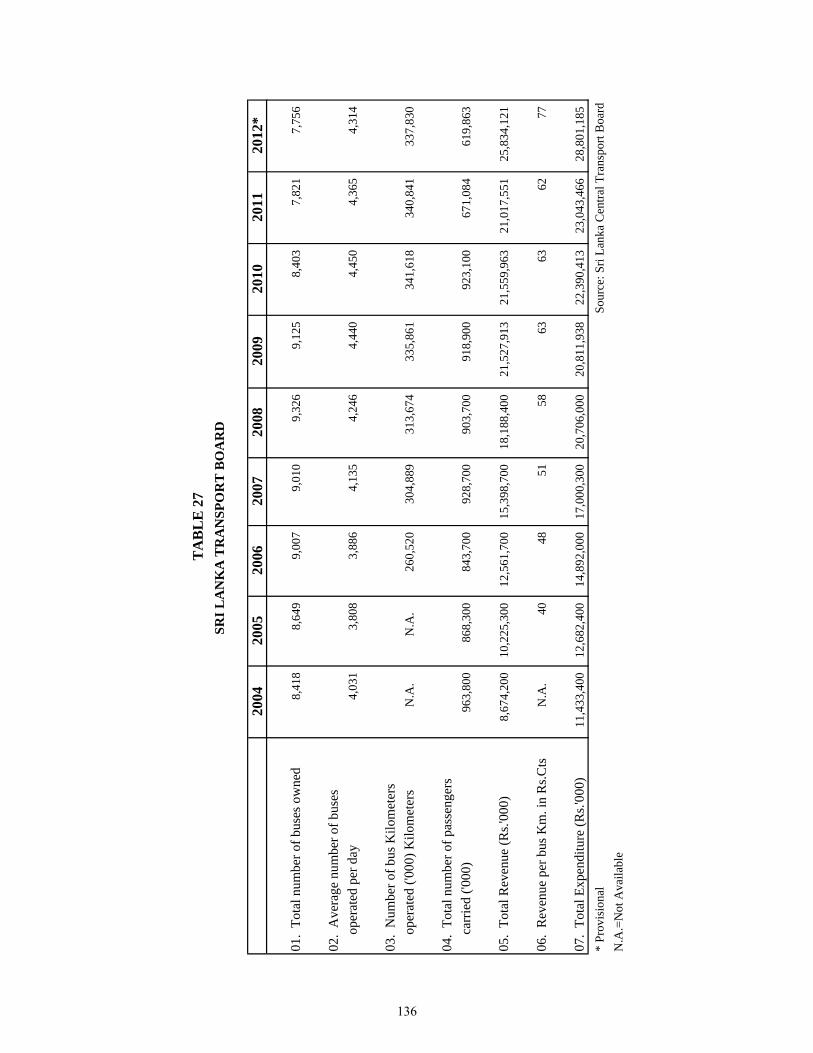
2004
2005
2006
2007
2008
2009
2010
2011
2012
*
01.
Tota
l num
ber o
f bus
es o
wne
d8,
418
8,64
9
9,
007
9,01
0
9,
326
9,12
5
8,
403
7,82
1
7,
756
02.
Ave
rage
num
ber o
f bus
es
o
pera
ted
per d
ay4,
031
3,80
8
3,
886
4,13
5
4,
246
4,44
0
4,
450
4,36
5
4,
314
03.
Num
ber o
f bus
Kilo
met
ers
o
pera
ted
('000
) Kilo
met
ers
N
.A.
N
.A.
260,
520
30
4,88
9
31
3,67
4
33
5,86
1
341,
618
34
0,84
1
337,
830
04.
Tota
l num
ber o
f pas
seng
ers
c
arrie
d ('0
00)
963,
800
86
8,30
0
84
3,70
0
928,
700
903,
700
918,
900
92
3,10
0
671,
084
61
9,86
3
05.
Tota
l Rev
enue
(Rs.'
000)
8,67
4,20
0
10
,225
,300
12
,561
,700
15
,398
,700
18
,188
,400
21
,527
,913
21
,559
,963
21
,017
,551
25
,834
,121
06.
Rev
enue
per
bus
Km
. in
Rs.C
ts
N.A
.40
48
51
58
63
63
62
77
07.
Tota
l Exp
endi
ture
(Rs.'
000)
11,4
33,4
00
12,6
82,4
00
14,8
92,0
00
17,0
00,3
00
20,7
06,0
00
20,8
11,9
38
22,3
90,4
13
23,0
43,4
66
28,8
01,1
85
* Pr
ovis
iona
lSo
urce
: Sri
Lank
a C
entra
l Tra
nspo
rt B
oard
N.A
.=N
ot A
vaila
ble
TA
BL
E 2
7SR
I LA
NK
A T
RA
NSP
OR
T B
OA
RD
136
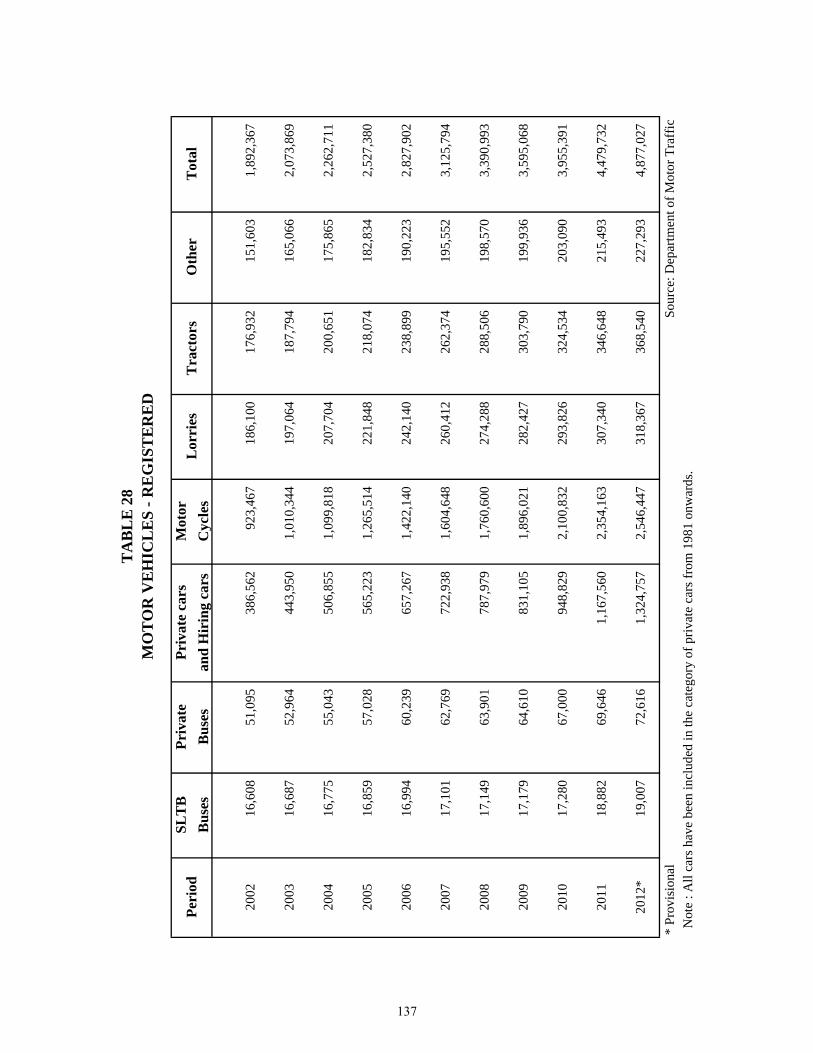
SLT
BPr
ivat
ePr
ivat
e ca
rsM
otor
Bus
esB
uses
and
Hir
ing
cars
Cyc
les
Stoc
ks a
s at
2002
16,6
0851
,095
386,
562
923,
467
186,
100
176,
932
151,
603
1,89
2,36
7
2003
16,6
8752
,964
443,
950
1,01
0,34
419
7,06
418
7,79
416
5,06
62,
073,
869
2004
16,7
7555
,043
506,
855
1,09
9,81
820
7,70
420
0,65
117
5,86
52,
262,
711
2005
16,8
5957
,028
565,
223
1,26
5,51
422
1,84
821
8,07
418
2,83
42,
527,
380
2006
16,9
9460
,239
657,
267
1,42
2,14
024
2,14
023
8,89
919
0,22
32,
827,
902
2007
17,1
0162
,769
722,
938
1,60
4,64
826
0,41
226
2,37
419
5,55
23,
125,
794
2008
17,1
4963
,901
787,
979
1,76
0,60
027
4,28
828
8,50
619
8,57
03,
390,
993
2009
17,1
7964
,610
831,
105
1,89
6,02
128
2,42
730
3,79
019
9,93
63,
595,
068
2010
17,2
8067
,000
948,
829
2,10
0,83
229
3,82
632
4,53
420
3,09
03,
955,
391
2011
18,8
8269
,646
1,16
7,56
02,
354,
163
307,
340
346,
648
215,
493
4,47
9,73
2
2012
*19
,007
72,6
161,
324,
757
2,54
6,44
731
8,36
736
8,54
022
7,29
34,
877,
027
* Pr
ovis
iona
l N
ote
: All
cars
hav
e be
en in
clud
ed in
the
cate
gory
of p
rivat
e ca
rs fr
om 1
981
onw
ards
.
TA
BL
E 2
8M
OT
OR
VE
HIC
LE
S - R
EG
IST
ER
ED
So
urce
: Dep
artm
ent o
f Mot
or T
raff
ic
Peri
odL
orri
esT
ract
ors
Oth
erT
otal
137
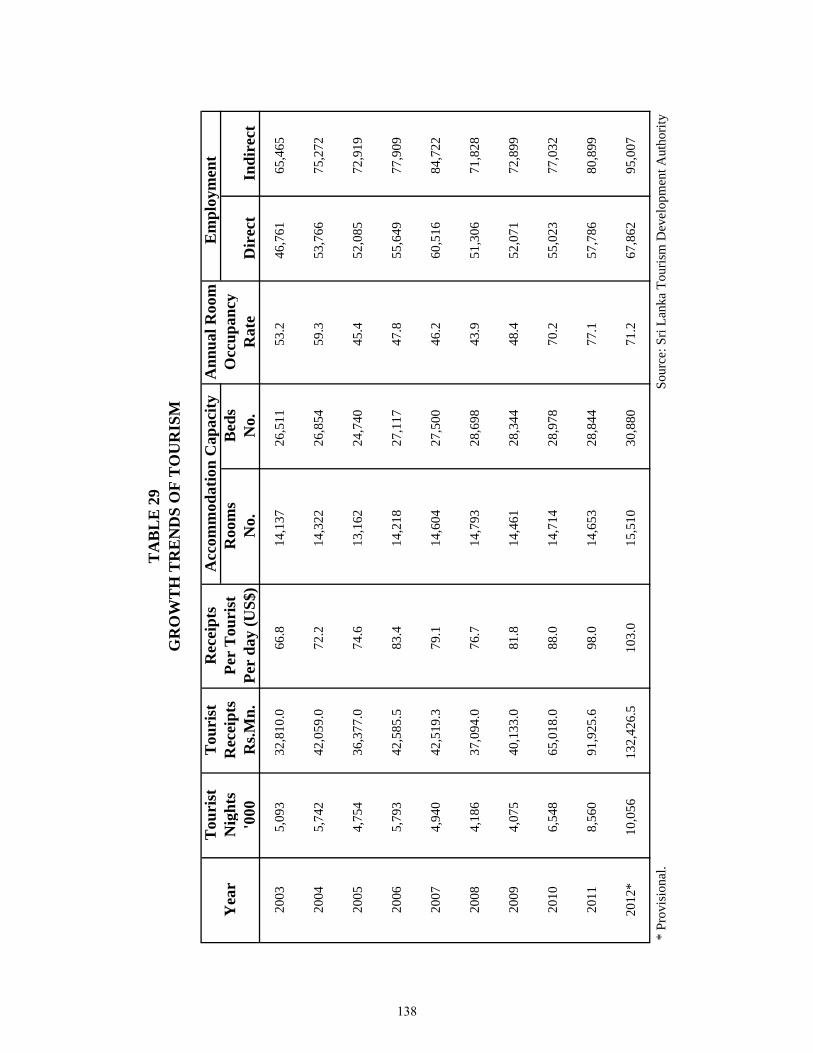
Tou
rist
Tou
rist
Rec
eipt
sA
nnua
l Roo
m
Em
ploy
men
tY
ear
Ni g
hts
Rec
eipt
sPe
r T
ouri
stR
oom
sB
eds
Occ
upan
cy'0
00R
s.Mn.
Per
day
(US$
)N
o.N
o.R
ate
Dir
ect
Indi
rect
2003
5,09
332
,810
.066
.814
,137
26,5
1153
.246
,761
65,4
65
2004
5,74
242
,059
.072
.214
,322
26,8
5459
.353
,766
75,2
72
2005
4,75
436
,377
.074
.613
,162
24,7
4045
.452
,085
72,9
19
2006
5,79
342
,585
.583
.414
,218
27,1
1747
.855
,649
77,9
09
2007
4,94
042
,519
.379
.114
,604
27,5
0046
.260
,516
84,7
22
2008
4,18
637
,094
.076
.714
,793
28,6
9843
.951
,306
71,8
28
2009
4,07
540
,133
.081
.814
,461
28,3
4448
.452
,071
72,8
99
2010
6,54
865
,018
.088
.014
,714
28,9
7870
.255
,023
77,0
32
2011
8,56
091
,925
.698
.014
,653
28,8
4477
.157
,786
80,8
99
2012
*10
,056
132,
426.
510
3.0
15,5
1030
,880
71.2
67,8
6295
,007
* Pr
ovis
iona
l.
TA
BL
E 2
9G
RO
WT
H T
RE
ND
S O
F T
OU
RIS
M
Acc
omm
odat
ion
Cap
acity
So
urce
: Sri
Lank
a To
uris
m D
evel
opm
ent A
utho
rity
138
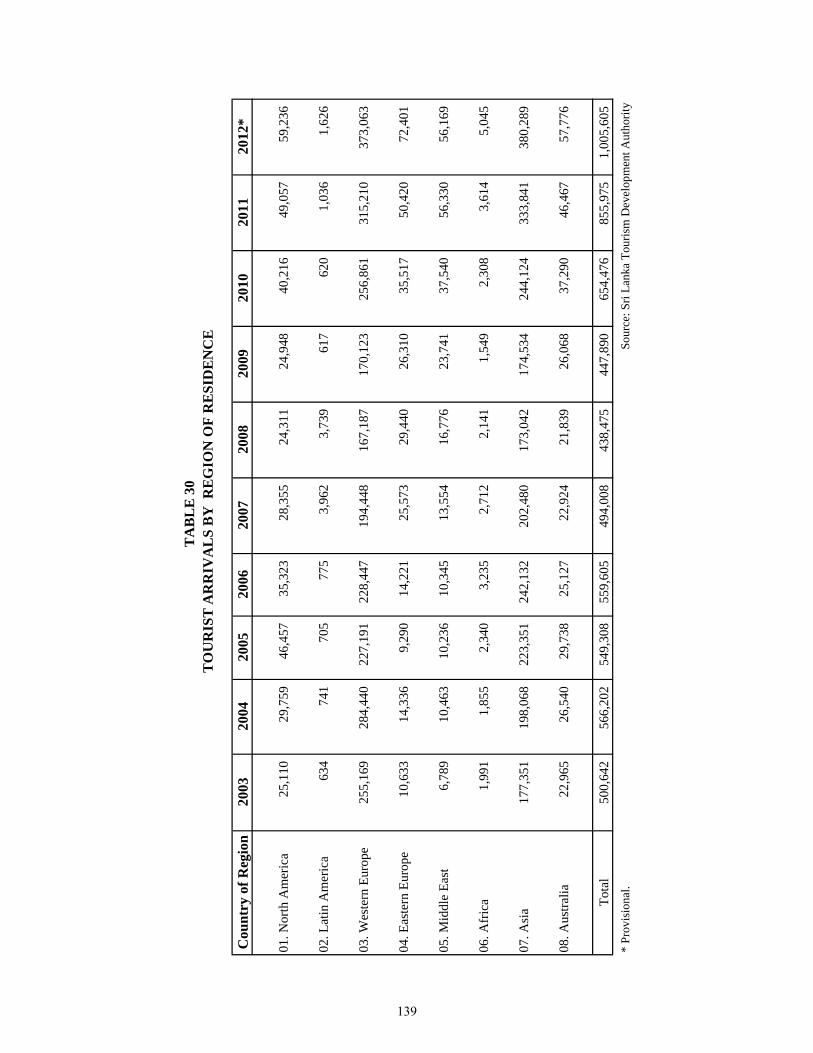
Cou
ntry
of R
egio
n20
0320
0420
0520
0620
0720
0820
0920
1020
1120
12*
01. N
orth
Am
eric
a25
,110
29
,759
46
,457
35,3
23
28
,355
24
,311
24
,948
40
,216
49
,057
59
,236
02. L
atin
Am
eric
a63
4
741
70
5
77
5
3,
962
3,73
9
61
7
620
1,
036
1,62
6
03. W
este
rn E
urop
e25
5,16
9
284,
440
227,
191
22
8,44
7
194,
448
16
7,18
7
170,
123
25
6,86
1
315,
210
37
3,06
3
04. E
aste
rn E
urop
e10
,633
14
,336
9,
290
14
,221
25,5
73
29,4
40
26,3
10
35,5
17
50,4
20
72,4
01
05. M
iddl
e Ea
st6,
789
10,4
63
10,2
36
10
,345
13,5
54
16,7
76
23,7
41
37,5
40
56,3
30
56,1
69
06. A
fric
a1,
991
1,85
5
2,
340
3,
235
2,
712
2,14
1
1,
549
2,30
8
3,
614
5,04
5
07. A
sia
177,
351
19
8,06
8
22
3,35
1
242,
132
20
2,48
0
173,
042
17
4,53
4
244,
124
33
3,84
1
380,
289
08. A
ustra
lia22
,965
26
,540
29
,738
25,1
27
22
,924
21
,839
26
,068
37
,290
46
,467
57
,776
Tota
l50
0,64
2
566,
202
549,
308
55
9,60
5
494,
008
43
8,47
5
447,
890
65
4,47
6
855,
975
1,
005,
605
* Pr
ovis
iona
l.
Sour
ce: S
ri La
nka
Tour
ism
Dev
elop
men
t Aut
horit
y
TA
BL
E 3
0
T
OU
RIS
T A
RR
IVA
LS
BY
RE
GIO
N O
F R
ESI
DE
NC
E
139
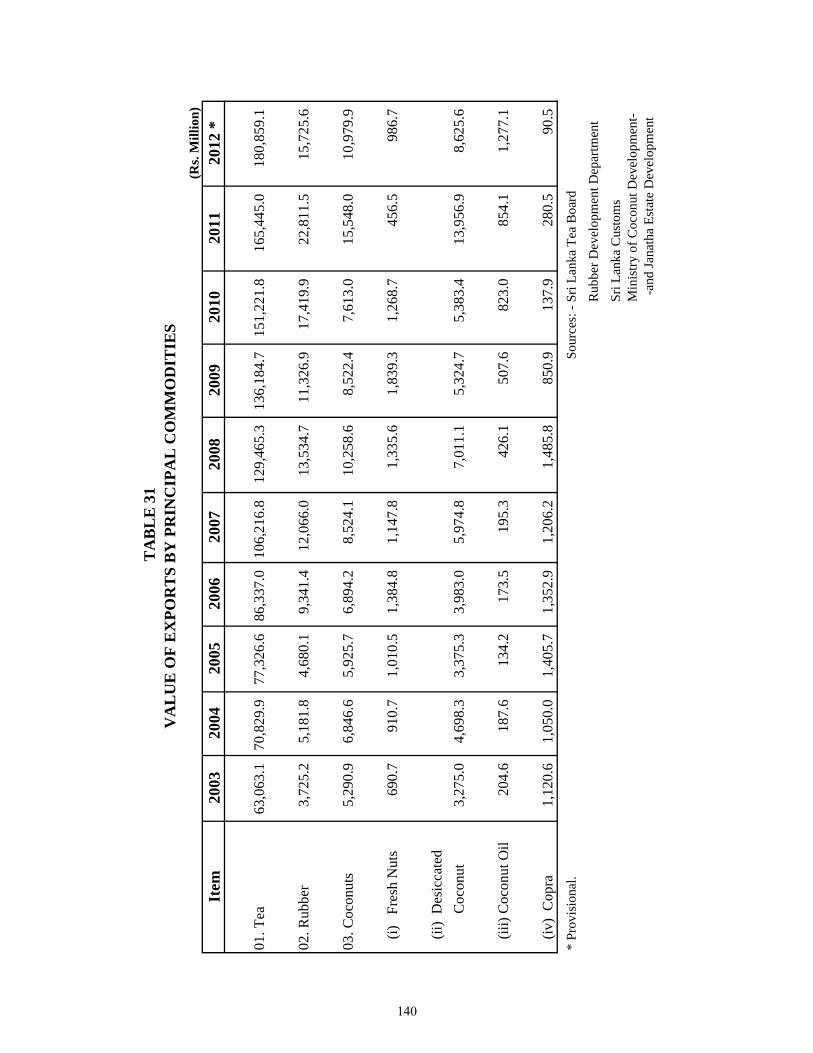
(Rs.
Mill
ion)
Item
2003
2004
2005
2006
2007
2008
2009
2010
2011
2012
*
01. T
ea63
,063
.170
,829
.977
,326
.686
,337
.010
6,21
6.8
129,
465.
313
6,18
4.7
151,
221.
816
5,44
5.0
180,
859.
1
02. R
ubbe
r3,
725.
25,
181.
84,
680.
19,
341.
412
,066
.013
,534
.711
,326
.917
,419
.922
,811
.515
,725
.6
03. C
ocon
uts
5,29
0.9
6,84
6.6
5,92
5.7
6,89
4.2
8,52
4.1
10,2
58.6
8,52
2.4
7,61
3.0
15,5
48.0
10,9
79.9
(i)
Fr
esh
Nut
s69
0.7
910.
71,
010.
51,
384.
81,
147.
81,
335.
61,
839.
31,
268.
745
6.5
986.
7
(ii
) D
esic
cate
d
Coc
onut
3,27
5.0
4,69
8.3
3,37
5.3
3,98
3.0
5,97
4.8
7,01
1.1
5,32
4.7
5,38
3.4
13,9
56.9
8,62
5.6
(ii
i) C
ocon
ut O
il20
4.6
187.
613
4.2
173.
519
5.3
426.
150
7.6
823.
085
4.1
1,27
7.1
(iv
) C
opra
1,12
0.6
1,05
0.0
1,40
5.7
1,35
2.9
1,20
6.2
1,48
5.8
850.
913
7.9
280.
590
.5*
Prov
isio
nal.
Rub
ber D
evel
opm
ent D
epar
tmen
t
Sri L
anka
Cus
tom
s
TA
BL
E 3
1V
AL
UE
OF
EX
POR
TS
BY
PR
INC
IPA
L C
OM
MO
DIT
IES
Sou
rces
: - S
ri La
nka
Tea
Boa
rd
Min
istry
of C
ocon
ut D
evel
opm
ent-
-an
d Ja
nath
a Es
tate
Dev
elop
men
t
140
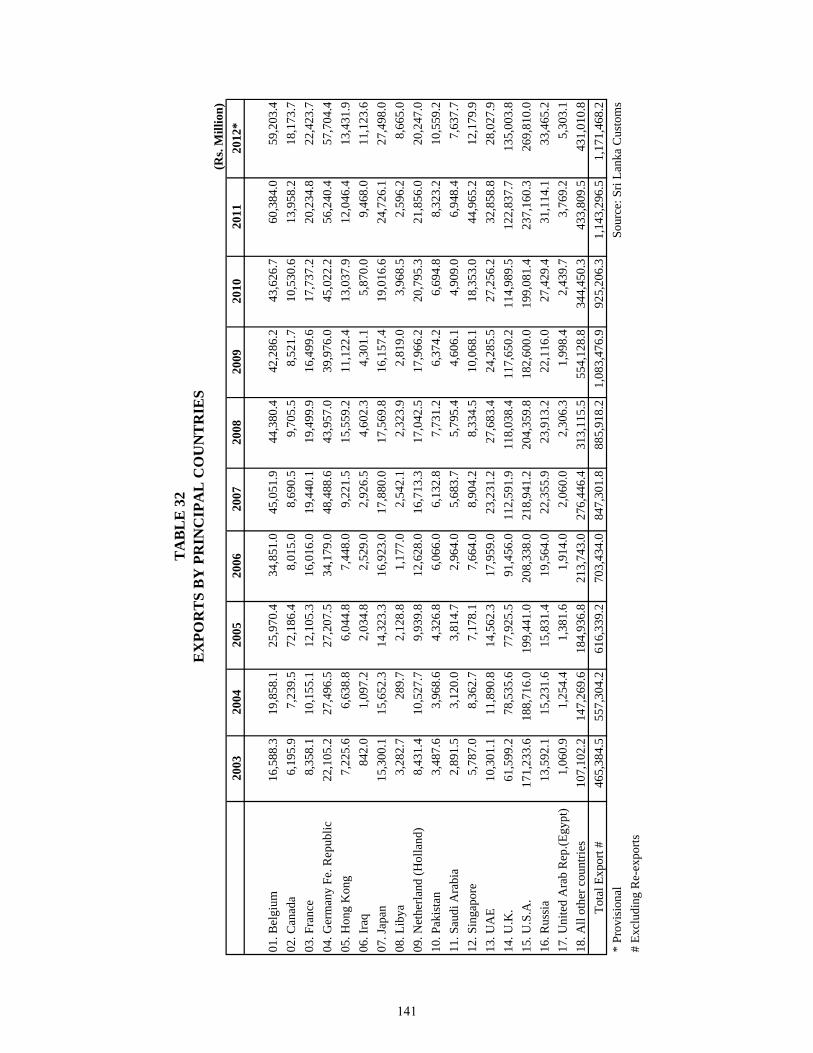
(Rs.
Mill
ion)
2003
2004
2005
2006
2007
2008
2009
2010
2011
2012
*
01. B
elgi
um16
,588
.319
,858
.125
,970
.434
,851
.045
,051
.944
,380
.442
,286
.243
,626
.760
,384
.059
,203
.402
. Can
ada
6,19
5.9
7,23
9.5
72,1
86.4
8,01
5.0
8,69
0.5
9,70
5.5
8,52
1.7
10,5
30.6
13,9
58.2
18,1
73.7
03. F
ranc
e8,
358.
110
,155
.112
,105
.316
,016
.019
,440
.119
,499
.916
,499
.617
,737
.220
,234
.822
,423
.704
. Ger
man
y Fe
. Rep
ublic
22,1
05.2
27,4
96.5
27,2
07.5
34,1
79.0
48,4
88.6
43,9
57.0
39,9
76.0
45,0
22.2
56,2
40.4
57,7
04.4
05. H
ong
Kon
g7,
225.
66,
638.
86,
044.
87,
448.
09,
221.
515
,559
.211
,122
.413
,037
.912
,046
.413
,431
.906
. Ira
q84
2.0
1,09
7.2
2,03
4.8
2,52
9.0
2,92
6.5
4,60
2.3
4,30
1.1
5,87
0.0
9,46
8.0
11,1
23.6
07. J
apan
15,3
00.1
15,6
52.3
14,3
23.3
16,9
23.0
17,8
80.0
17,5
69.8
16,1
57.4
19,0
16.6
24,7
26.1
27,4
98.0
08. L
ibya
3,28
2.7
289.
72,
128.
81,
177.
02,
542.
12,
323.
92,
819.
03,
968.
52,
596.
28,
665.
009
. Net
herla
nd (H
olla
nd)
8,43
1.4
10,5
27.7
9,93
9.8
12,6
28.0
16,7
13.3
17,0
42.5
17,9
66.2
20,7
95.3
21,8
56.0
20,2
47.0
10. P
akis
tan
3,48
7.6
3,96
8.6
4,32
6.8
6,06
6.0
6,13
2.8
7,73
1.2
6,37
4.2
6,69
4.8
8,32
3.2
10,5
59.2
11. S
audi
Ara
bia
2,89
1.5
3,12
0.0
3,81
4.7
2,96
4.0
5,68
3.7
5,79
5.4
4,60
6.1
4,90
9.0
6,94
8.4
7,63
7.7
12. S
inga
pore
5,78
7.0
8,36
2.7
7,17
8.1
7,66
4.0
8,90
4.2
8,33
4.5
10,0
68.1
18,3
53.0
44,9
65.2
12,1
79.9
13. U
AE
10,3
01.1
11,8
90.8
14,5
62.3
17,9
59.0
23,2
31.2
27,6
83.4
24,2
85.5
27,2
56.2
32,8
58.8
28,0
27.9
14. U
.K.
61,5
99.2
78,5
35.6
77,9
25.5
91,4
56.0
112,
591.
911
8,03
8.4
117,
650.
211
4,98
9.5
122,
837.
713
5,00
3.8
15. U
.S.A
.17
1,23
3.6
188,
716.
019
9,44
1.0
208,
338.
021
8,94
1.2
204,
359.
818
2,60
0.0
199,
081.
423
7,16
0.3
269,
810.
016
. Rus
sia
13,5
92.1
15,2
31.6
15,8
31.4
19,5
64.0
22,3
55.9
23,9
13.2
22,1
16.0
27,4
29.4
31,1
14.1
33,4
65.2
17. U
nite
d A
rab
Rep
.(Egy
pt)
1,06
0.9
1,25
4.4
1,38
1.6
1,91
4.0
2,06
0.0
2,30
6.3
1,99
8.4
2,43
9.7
3,76
9.2
5,30
3.1
18. A
ll ot
her c
ount
ries
107,
102.
214
7,26
9.6
184,
936.
821
3,74
3.0
276,
446.
431
3,11
5.5
554,
128.
834
4,45
0.3
433,
809.
543
1,01
0.8
Tota
l Exp
ort #
465,
384.
555
7,30
4.2
616,
339.
270
3,43
4.0
847,
301.
888
5,91
8.2
1,08
3,47
6.9
925,
206.
31,
143,
296.
51,
171,
468.
2*
Prov
isio
nal
S
ourc
e: S
ri La
nka
Cus
tom
s#
Excl
udin
g R
e-ex
ports
TA
BL
E 3
2E
XPO
RT
S B
Y P
RIN
CIP
AL
CO
UN
TR
IES
141
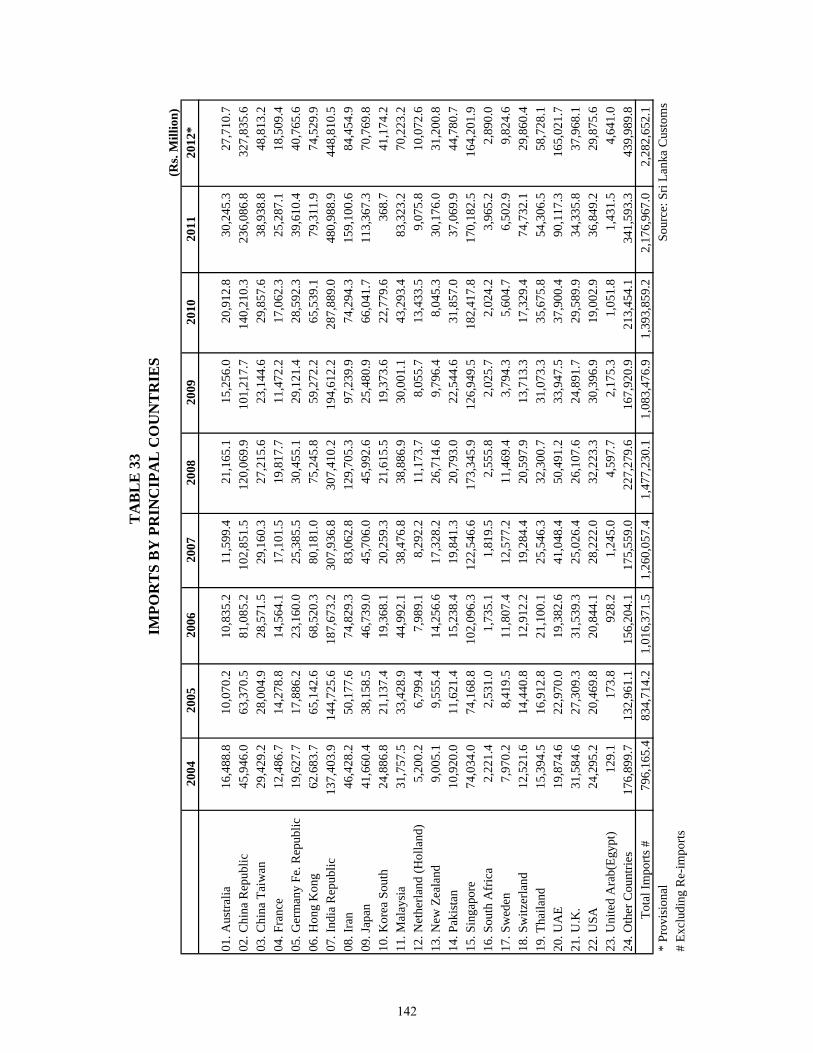
(Rs.
Mill
ion)
2004
2005
2006
2007
2008
2009
2010
2011
2012
*
01. A
ustra
lia16
,488
.8
10
,070
.210
,835
.211
,599
.421
,165
.115
,256
.020
,912
.830
,245
.327
,710
.702
. Chi
na R
epub
lic45
,946
.0
63
,370
.581
,085
.210
2,85
1.5
120,
069.
910
1,21
7.7
140,
210.
323
6,08
6.8
327,
835.
603
. Chi
na T
aiw
an29
,429
.2
28
,004
.928
,571
.529
,160
.327
,215
.623
,144
.629
,857
.638
,938
.848
,813
.204
. Fra
nce
12,4
86.7
14,2
78.8
14,5
64.1
17,1
01.5
19,8
17.7
11,4
72.2
17,0
62.3
25,2
87.1
18,5
09.4
05. G
erm
any
Fe. R
epub
lic19
,627
.7
17
,886
.223
,160
.025
,385
.530
,455
.129
,121
.428
,592
.339
,610
.440
,765
.606
. Hon
g K
ong
62.6
83.7
65,1
42.6
68,5
20.3
80,1
81.0
75,2
45.8
59,2
72.2
65,5
39.1
79,3
11.9
74,5
29.9
07. I
ndia
Rep
ublic
137,
403.
9
144,
725.
618
7,67
3.2
307,
936.
830
7,41
0.2
194,
612.
228
7,88
9.0
480,
988.
944
8,81
0.5
08. I
ran
46,4
28.2
50,1
77.6
74,8
29.3
83,0
62.8
129,
705.
397
,239
.974
,294
.315
9,10
0.6
84,4
54.9
09. J
apan
41,6
60.4
38,1
58.5
46,7
39.0
45,7
06.0
45,9
92.6
25,4
80.9
66,0
41.7
113,
367.
370
,769
.810
. Kor
ea S
outh
24,8
86.8
21,1
37.4
19,3
68.1
20,2
59.3
21,6
15.5
19,3
73.6
22,7
79.6
368.
741
,174
.211
. Mal
aysi
a31
,757
.5
33
,428
.944
,992
.138
,476
.838
,886
.930
,001
.143
,293
.483
,323
.270
,223
.212
. Net
herla
nd (H
olla
nd)
5,20
0.2
6,
799.
47,
989.
18,
292.
211
,173
.78,
055.
713
,433
.59,
075.
810
,072
.613
. New
Zea
land
9,00
5.1
9,
555.
414
,256
.617
,328
.226
,714
.69,
796.
48,
045.
330
,176
.031
,200
.814
. Pak
ista
n10
,920
.0
11
,621
.415
,238
.419
,841
.320
,793
.022
,544
.631
,857
.037
,069
.944
,780
.715
. Sin
gapo
re74
,034
.0
74
,168
.810
2,09
6.3
122,
546.
617
3,34
5.9
126,
949.
518
2,41
7.8
170,
182.
516
4,20
1.9
16. S
outh
Afr
ica
2,22
1.4
2,
531.
01,
735.
11,
819.
52,
555.
82,
025.
72,
024.
23,
965.
22,
890.
017
. Sw
eden
7,97
0.2
8,
419.
511
,807
.412
,577
.211
,469
.43,
794.
35,
604.
76,
502.
99,
824.
618
. Sw
itzer
land
12,5
21.6
14,4
40.8
12,9
12.2
19,2
84.4
20,5
97.9
13,7
13.3
17,3
29.4
74,7
32.1
29,8
60.4
19. T
haila
nd15
,394
.5
16
,912
.821
,100
.125
,546
.332
,300
.731
,073
.335
,675
.854
,306
.558
,728
.120
. UA
E19
,874
.6
22
,970
.019
,382
.641
,048
.450
,491
.233
,947
.537
,900
.490
,117
.316
5,02
1.7
21. U
.K.
31,5
84.6
27,3
09.3
31,5
39.3
25,0
26.4
26,1
07.6
24,8
91.7
29,5
89.9
34,3
35.8
37,9
68.1
22. U
SA24
,295
.2
20
,469
.820
,844
.128
,222
.032
,223
.330
,396
.919
,002
.936
,849
.229
,875
.623
. Uni
ted
Ara
b(Eg
ypt)
129.
1
17
3.8
928.
21,
245.
04,
597.
72,
175.
31,
051.
81,
431.
54,
641.
024
. Oth
er C
ount
ries
176,
899.
7
132,
961.
115
6,20
4.1
175,
559.
022
7,27
9.6
167,
920.
921
3,45
4.1
341,
593.
343
9,98
9.8
Tot
al Im
ports
#79
6,16
5.4
834,
714.
21,
016,
371.
51,
260,
057.
41,
477,
230.
11,
083,
476.
91,
393,
859.
22,
176,
967.
02,
282,
652.
1*
Prov
isio
nal
# Ex
clud
ing
Re-
impo
rts
S
ourc
e: S
ri La
nka
Cus
tom
s
TA
BL
E 3
3
IMPO
RT
S B
Y P
RIN
CIP
AL
CO
UN
TR
IES
142
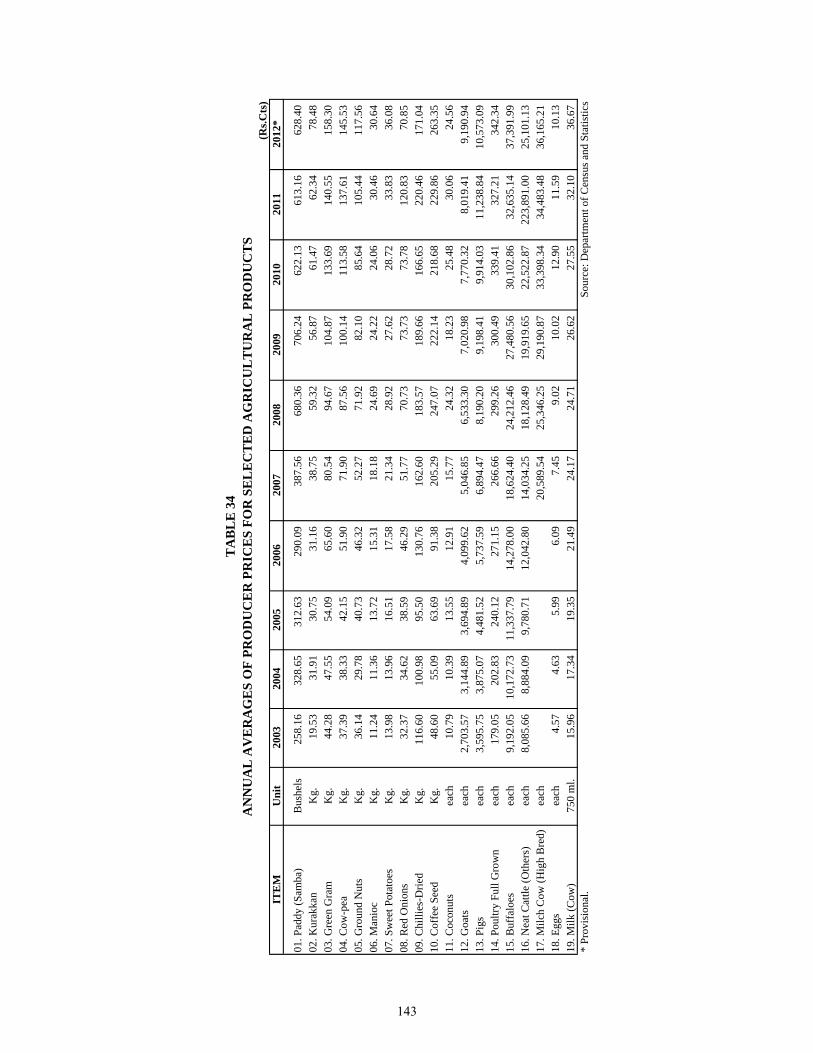
(Rs.C
ts)
ITE
MU
nit
2003
2004
2005
2006
2007
2008
2009
2010
2011
2012
*
01. P
addy
(Sam
ba)
Bus
hels
258.
16
328.
65
312.
63
290.
09
38
7.56
680.
36
70
6.24
622.
13
61
3.16
628.
40
02
. Kur
akka
n K
g.19
.53
31
.91
30
.75
31
.16
38
.75
59
.32
56
.87
61
.47
62
.34
78
.48
03
. Gre
en G
ram
Kg.
44.2
8
47.5
5
54.0
9
65.6
0
80.5
4
94.6
7
104.
87
13
3.69
140.
55
15
8.30
04. C
ow-p
eaK
g.37
.39
38
.33
42
.15
51
.90
71
.90
87
.56
10
0.14
113.
58
13
7.61
145.
53
05
. Gro
und
Nut
sK
g.36
.14
29
.78
40
.73
46
.32
52
.27
71
.92
82
.10
85
.64
10
5.44
117.
56
06
. Man
ioc
Kg.
11.2
4
11.3
6
13.7
2
15.3
1
18.1
8
24.6
9
24.2
2
24.0
6
30.4
6
30.6
4
07. S
wee
t Pot
atoe
sK
g.13
.98
13
.96
16
.51
17
.58
21
.34
28
.92
27
.62
28
.72
33
.83
36
.08
08
. Red
Oni
ons
Kg.
32.3
7
34.6
2
38.5
9
46.2
9
51.7
7
70.7
3
73.7
3
73.7
8
120.
83
70
.85
09
. Chi
llies
-Drie
dK
g.11
6.60
10
0.98
95
.50
13
0.76
162.
60
18
3.57
189.
66
16
6.65
220.
46
17
1.04
10. C
offe
e Se
edK
g.48
.60
55
.09
63
.69
91
.38
20
5.29
247.
07
22
2.14
218.
68
22
9.86
263.
35
11
. Coc
onut
sea
ch10
.79
10
.39
13
.55
12
.91
15
.77
24
.32
18
.23
25
.48
30
.06
24
.56
12
. Goa
tsea
ch2,
703.
57
3,
144.
89
3,
694.
89
4,
099.
62
5,04
6.85
6,
533.
30
7,02
0.98
7,
770.
32
8,01
9.41
9,
190.
94
13. P
igs
each
3,59
5.75
3,87
5.07
4,48
1.52
5,73
7.59
6,
894.
47
8,19
0.20
9,
198.
41
9,91
4.03
11
,238
.84
10,5
73.0
9
14
. Pou
ltry
Full
Gro
wn
each
179.
05
202.
83
240.
12
271.
15
26
6.66
299.
26
30
0.49
339.
41
32
7.21
342.
34
15
. Buf
falo
esea
ch9,
192.
05
10
,172
.73
11
,337
.79
14
,278
.00
18,6
24.4
0
24
,212
.46
27,4
80.5
6
30
,102
.86
32,6
35.1
4
37
,391
.99
16. N
eat C
attle
(Oth
ers)
each
8,08
5.66
8,88
4.09
9,78
0.71
12,0
42.8
0
14
,034
.25
18,1
28.4
9
19
,919
.65
22,5
22.8
7
22
3,89
1.00
25,1
01.1
3
17
. Milc
h C
ow (H
igh
Bre
d)ea
ch20
,589
.54
25,3
46.2
5
29
,190
.87
33,3
98.3
4
34
,483
.48
36,1
65.2
1
18
. Egg
sea
ch4.
57
4.
63
5.
99
6.
09
7.45
9.
02
10.0
2
12.9
0
11.5
9
10.1
3
19. M
ilk (C
ow)
750
ml.
15.9
6
17.3
4
19.3
5
21.4
9
24.1
7
24.7
1
26.6
2
27.5
5
32.1
0
36.6
7
* Pr
ovis
iona
l.
Sour
ce: D
epar
tmen
t of C
ensu
s and
Sta
tistic
s
TA
BL
E 3
4A
NN
UA
L A
VE
RA
GE
S O
F PR
OD
UC
ER
PR
ICE
S FO
R S
EL
EC
TE
D A
GR
ICU
LT
UR
AL
PR
OD
UC
TS
143
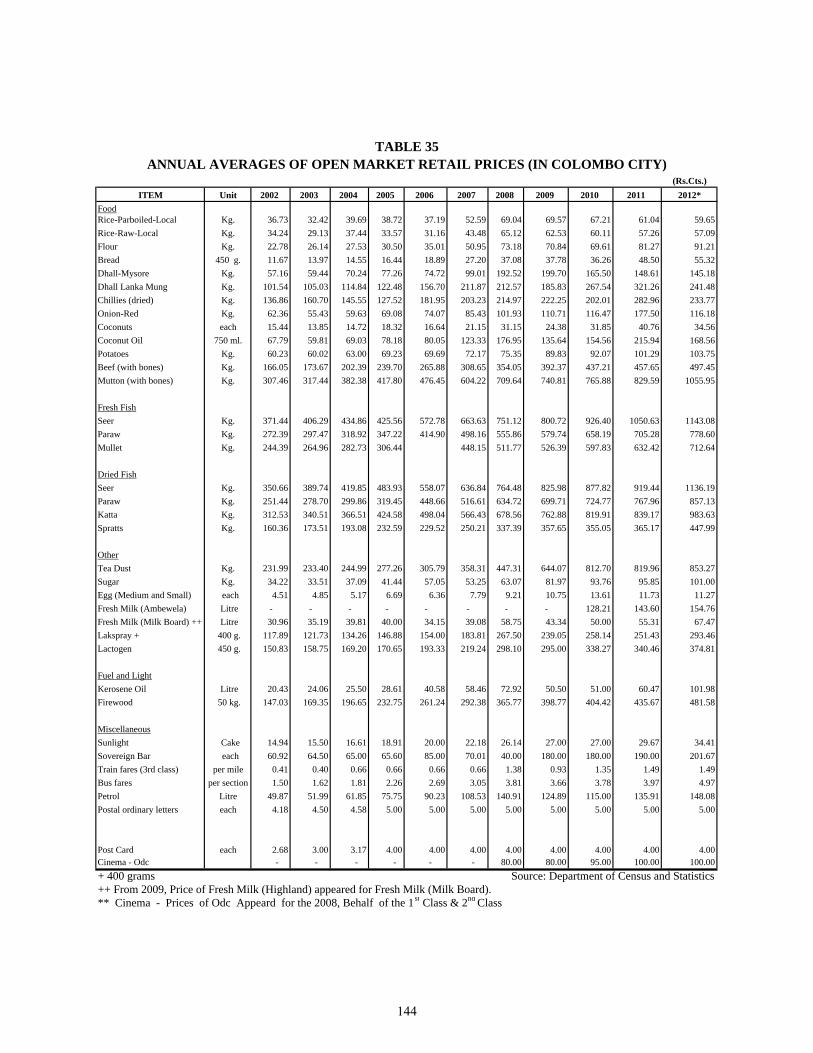
(Rs.Cts.)ITEM Unit 2002 2003 2004 2005 2006 2007 2008 2009 2010 2011 2012*
FoodRice-Parboiled-Local Kg. 36.73 32.42 39.69 38.72 37.19 52.59 69.04 69.57 67.21 61.04 59.65Rice-Raw-Local Kg. 34.24 29.13 37.44 33.57 31.16 43.48 65.12 62.53 60.11 57.26 57.09Flour Kg. 22.78 26.14 27.53 30.50 35.01 50.95 73.18 70.84 69.61 81.27 91.21Bread 450 g. 11.67 13.97 14.55 16.44 18.89 27.20 37.08 37.78 36.26 48.50 55.32Dhall-Mysore Kg. 57.16 59.44 70.24 77.26 74.72 99.01 192.52 199.70 165.50 148.61 145.18Dhall Lanka Mung Kg. 101.54 105.03 114.84 122.48 156.70 211.87 212.57 185.83 267.54 321.26 241.48Chillies (dried) Kg. 136.86 160.70 145.55 127.52 181.95 203.23 214.97 222.25 202.01 282.96 233.77Onion-Red Kg. 62.36 55.43 59.63 69.08 74.07 85.43 101.93 110.71 116.47 177.50 116.18Coconuts each 15.44 13.85 14.72 18.32 16.64 21.15 31.15 24.38 31.85 40.76 34.56Coconut Oil 750 ml. 67.79 59.81 69.03 78.18 80.05 123.33 176.95 135.64 154.56 215.94 168.56Potatoes Kg. 60.23 60.02 63.00 69.23 69.69 72.17 75.35 89.83 92.07 101.29 103.75Beef (with bones) Kg. 166.05 173.67 202.39 239.70 265.88 308.65 354.05 392.37 437.21 457.65 497.45Mutton (with bones) Kg. 307.46 317.44 382.38 417.80 476.45 604.22 709.64 740.81 765.88 829.59 1055.95
Fresh Fish Seer Kg. 371.44 406.29 434.86 425.56 572.78 663.63 751.12 800.72 926.40 1050.63 1143.08Paraw Kg. 272.39 297.47 318.92 347.22 414.90 498.16 555.86 579.74 658.19 705.28 778.60Mullet Kg. 244.39 264.96 282.73 306.44 448.15 511.77 526.39 597.83 632.42 712.64
Dried Fish Seer Kg. 350.66 389.74 419.85 483.93 558.07 636.84 764.48 825.98 877.82 919.44 1136.19Paraw Kg. 251.44 278.70 299.86 319.45 448.66 516.61 634.72 699.71 724.77 767.96 857.13Katta Kg. 312.53 340.51 366.51 424.58 498.04 566.43 678.56 762.88 819.91 839.17 983.63Spratts Kg. 160.36 173.51 193.08 232.59 229.52 250.21 337.39 357.65 355.05 365.17 447.99
OtherTea Dust Kg. 231.99 233.40 244.99 277.26 305.79 358.31 447.31 644.07 812.70 819.96 853.27Sugar Kg. 34.22 33.51 37.09 41.44 57.05 53.25 63.07 81.97 93.76 95.85 101.00Egg (Medium and Small) each 4.51 4.85 5.17 6.69 6.36 7.79 9.21 10.75 13.61 11.73 11.27Fresh Milk (Ambewela) Litre - - - - - - - - 128.21 143.60 154.76Fresh Milk (Milk Board) ++ Litre 30.96 35.19 39.81 40.00 34.15 39.08 58.75 43.34 50.00 55.31 67.47Lakspray + 400 g. 117.89 121.73 134.26 146.88 154.00 183.81 267.50 239.05 258.14 251.43 293.46Lactogen 450 g. 150.83 158.75 169.20 170.65 193.33 219.24 298.10 295.00 338.27 340.46 374.81
Fuel and LightKerosene Oil Litre 20.43 24.06 25.50 28.61 40.58 58.46 72.92 50.50 51.00 60.47 101.98Firewood 50 kg. 147.03 169.35 196.65 232.75 261.24 292.38 365.77 398.77 404.42 435.67 481.58
MiscellaneousSunlight Cake 14.94 15.50 16.61 18.91 20.00 22.18 26.14 27.00 27.00 29.67 34.41Sovereign Bar each 60.92 64.50 65.00 65.60 85.00 70.01 40.00 180.00 180.00 190.00 201.67Train fares (3rd class) per mile 0.41 0.40 0.66 0.66 0.66 0.66 1.38 0.93 1.35 1.49 1.49Bus fares per section 1.50 1.62 1.81 2.26 2.69 3.05 3.81 3.66 3.78 3.97 4.97Petrol Litre 49.87 51.99 61.85 75.75 90.23 108.53 140.91 124.89 115.00 135.91 148.08Postal ordinary letters each 4.18 4.50 4.58 5.00 5.00 5.00 5.00 5.00 5.00 5.00 5.00
Post Card each 2.68 3.00 3.17 4.00 4.00 4.00 4.00 4.00 4.00 4.00 4.00Cinema - Odc - - - - - - 80.00 80.00 95.00 100.00 100.00+ 400 grams Source: Department of Census and Statistics++ From 2009, Price of Fresh Milk (Highland) appeared for Fresh Milk (Milk Board). ** Cinema - Prices of Odc Appeard for the 2008, Behalf of the 1st Class & 2nd Class
TABLE 35ANNUAL AVERAGES OF OPEN MARKET RETAIL PRICES (IN COLOMBO CITY)
144
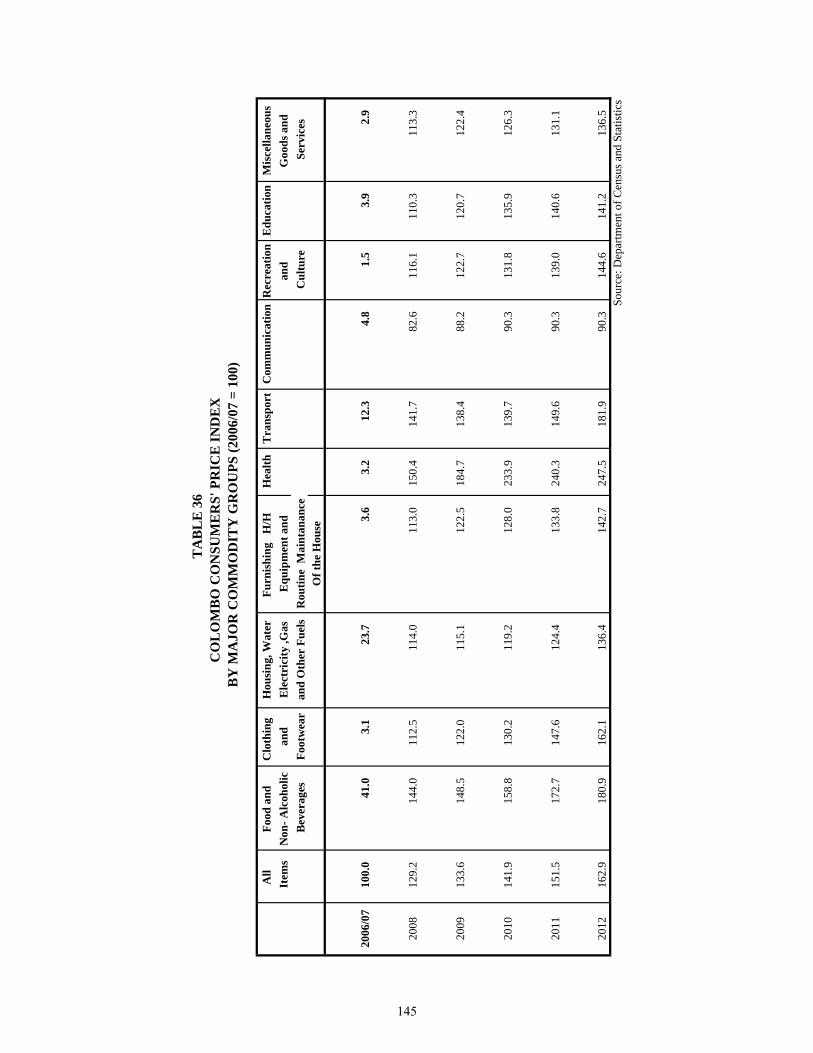
All
Food
and
C
loth
ing
H
ousi
ng, W
ater
Furn
ishi
ng
H/H
H
ealth
Tra
nspo
rtC
omm
unic
atio
nR
ecre
atio
n E
duca
tion
Mis
cella
neou
s It
ems
Non
- Alc
ohol
ic
and
Ele
ctri
city
,Gas
Equ
ipm
ent a
ndan
d G
oods
and
B
ever
ages
Foot
wea
ran
d O
ther
Fue
ls R
outin
e M
aint
anan
ce
Cul
ture
Serv
ices
Of t
he H
ouse
2006
/07
100.
041
.03.
123
.73.
63.
212
.34.
81.
53.
92.
9
2008
129.
214
4.0
112.
511
4.0
113.
015
0.4
141.
782
.611
6.1
110.
311
3.3
2009
133.
614
8.5
122.
011
5.1
122.
518
4.7
138.
488
.212
2.7
120.
712
2.4
2010
141.
915
8.8
130.
211
9.2
128.
023
3.9
139.
790
.313
1.8
135.
912
6.3
2011
151.
517
2.7
147.
612
4.4
133.
824
0.3
149.
690
.313
9.0
140.
613
1.1
2012
162.
918
0.9
162.
113
6.4
142.
724
7.5
181.
990
.314
4.6
141.
213
6.5
Sour
ce: D
epar
tmen
t of C
ensu
s and
Sta
tistic
s
TA
BL
E 3
6C
OL
OM
BO
CO
NSU
ME
RS'
PR
ICE
IND
EX
B
Y M
AJO
R C
OM
MO
DIT
Y G
RO
UPS
(200
6/07
= 1
00)
145
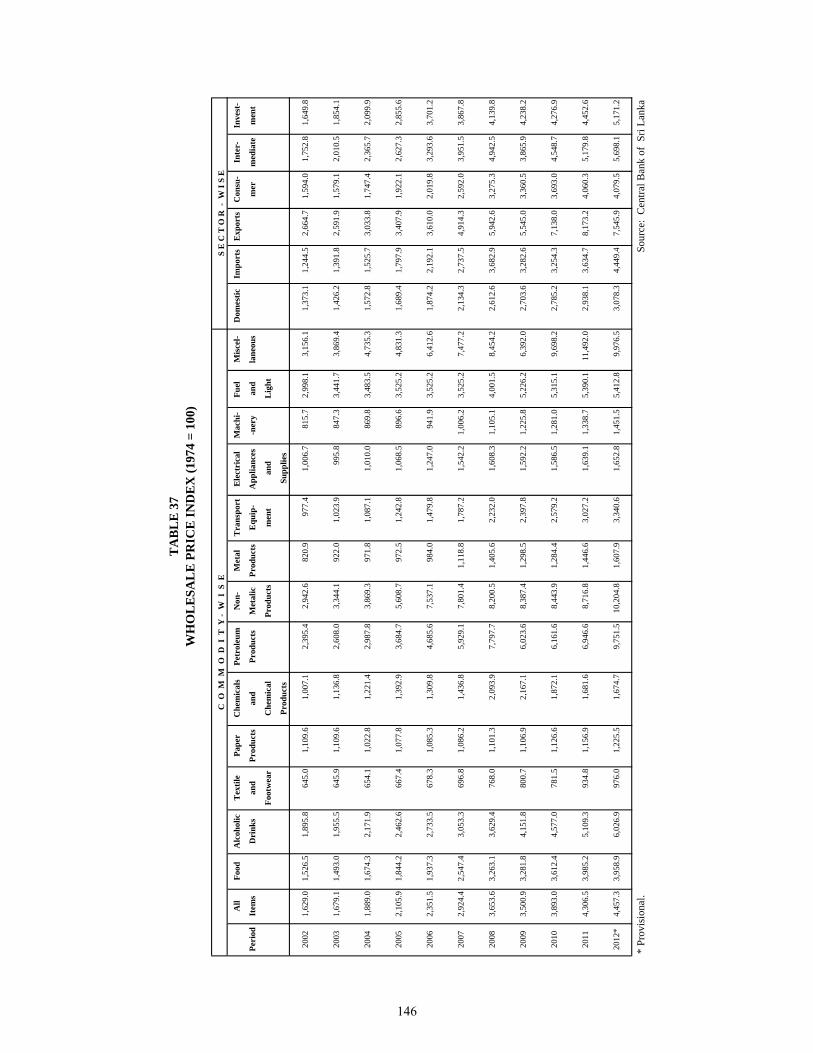
All
Food
Alc
ohol
icT
extil
ePa
per
Che
mic
als
Petr
oleu
mN
on-
Met
alT
rans
port
Ele
ctri
cal
Mac
hi-
Fuel
M
isce
l-D
omes
ticIm
port
sE
xpor
tsC
onsu
-In
ter-
Inve
st-
Peri
odIt
ems
Dri
nks
and
Prod
ucts
and
Prod
ucts
Met
alic
Prod
ucts
Equ
ip-
App
lianc
es-n
ery
and
lane
ous
mer
med
iate
men
t
Foot
wea
rC
hem
ical
Prod
ucts
men
t a
ndL
ight
Prod
ucts
Sup
plie
s
2002
1,62
9.0
1,52
6.5
1,89
5.8
645.
01,
109.
61,
007.
12,
395.
42,
942.
682
0.9
977.
41,
006.
781
5.7
2,99
8.1
3,15
6.1
1,37
3.1
1,24
4.5
2,66
4.7
1,59
4.0
1,75
2.8
1,64
9.8
2003
1,67
9.1
1,49
3.0
1,95
5.5
645.
91,
109.
61,
136.
82,
608.
03,
344.
192
2.0
1,02
3.9
995.
884
7.3
3,44
1.7
3,86
9.4
1,42
6.2
1,39
1.8
2,59
1.9
1,57
9.1
2,01
0.5
1,85
4.1
2004
1,88
9.0
1,67
4.3
2,17
1.9
654.
11,
022.
81,
221.
42,
987.
83,
869.
397
1.8
1,08
7.1
1,01
0.0
869.
83,
483.
54,
735.
31,
572.
81,
525.
73,
033.
81,
747.
42,
365.
72,
099.
9
2005
2,10
5.9
1,84
4.2
2,46
2.6
667.
41,
077.
81,
392.
93,
684.
75,
608.
797
2.5
1,24
2.8
1,06
8.5
896.
63,
525.
24,
831.
31,
689.
41,
797.
93,
407.
91,
922.
12,
627.
32,
855.
6
2006
2,35
1.5
1,93
7.3
2,73
3.5
678.
31,
085.
31,
309.
84,
685.
67,
537.
198
4.0
1,47
9.8
1,24
7.0
941.
93,
525.
26,
412.
61,
874.
22,
192.
13,
610.
02,
019.
83,
293.
63,
701.
2
2007
2,92
4.4
2,54
7.4
3,05
3.3
696.
81,
086.
21,
436.
85,
929.
17,
801.
41,
118.
81,
787.
21,
542.
21,
006.
23,
525.
27,
477.
22,
134.
32,
737.
54,
914.
32,
592.
03,
951.
53,
867.
8
2008
3,65
3.6
3,26
3.1
3,62
9.4
768.
01,
101.
32,
093.
97,
797.
78,
200.
51,
405.
62,
232.
01,
608.
31,
105.
14,
001.
58,
454.
22,
612.
63,
682.
95,
942.
63,
275.
34,
942.
54,
139.
8
2009
3,50
0.9
3,28
1.8
4,15
1.8
800.
71,
106.
92,
167.
16,
023.
68,
387.
41,
298.
52,
397.
81,
592.
21,
225.
85,
226.
26,
392.
02,
703.
63,
282.
65,
545.
03,
360.
53,
865.
94,
238.
2
2010
3,89
3.0
3,61
2.4
4,57
7.0
781.
51,
126.
61,
872.
16,
161.
68,
443.
91,
284.
42,
579.
21,
586.
51,
281.
05,
315.
19,
698.
22,
785.
23,
254.
37,
138.
03,
693.
04,
548.
74,
276.
9
2011
4,30
6.5
3,98
5.2
5,10
9.3
934.
81,
156.
91,
681.
66,
946.
68,
716.
81,
446.
63,
027.
21,
639.
11,
338.
75,
390.
111
,492
.02,
938.
13,
634.
78,
173.
24,
060.
35,
179.
84,
452.
6
2012
*4,
457.
33,
958.
96,
026.
997
6.0
1,22
5.5
1,67
4.7
9,75
1.5
10,2
04.8
1,60
7.9
3,34
0.6
1,65
2.8
1,45
1.5
5,41
2.8
9,97
6.5
3,07
8.3
4,44
9.4
7,54
5.9
4,07
9.5
5,69
8.1
5,17
1.2
* Pr
ovis
iona
l.
TA
BL
E 3
7W
HO
LE
SAL
E P
RIC
E IN
DE
X (1
974
= 10
0)
S E
C T
O R
- W
I S
EC
O M
M O
D I
T Y
- W
I S
E
Sour
ce:
Cen
tral B
ank
of S
ri La
nka
146
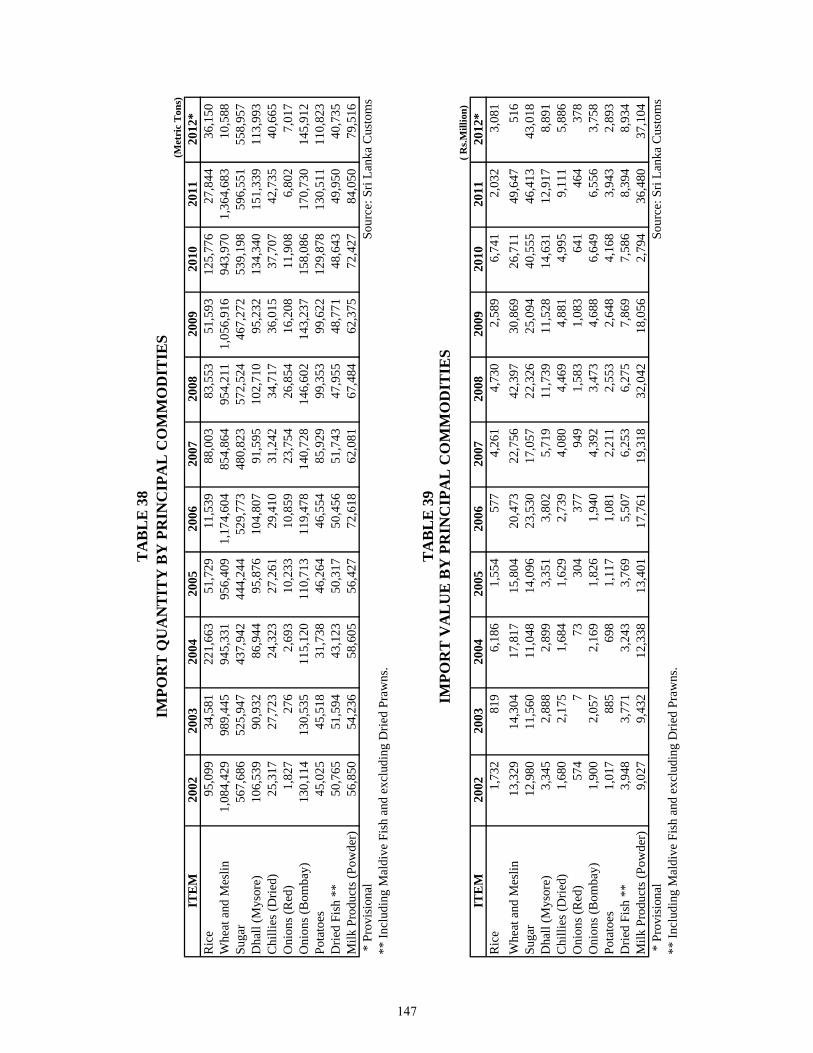
(Met
ric
Ton
s)IT
EM
2002
2003
2004
2005
2006
2007
2008
2009
2010
2011
2012
*R
ice
95,0
99
34,5
81
221,
663
51,7
29
11
,539
88,0
03
83
,553
51,5
93
12
5,77
6
27
,844
36,1
50
W
heat
and
Mes
lin1,
084,
429
98
9,44
5
94
5,33
1
95
6,40
9
1,
174,
604
85
4,86
4
95
4,21
1
1,
056,
916
94
3,97
0
1,
364,
683
10
,588
Suga
r56
7,68
6
52
5,94
7
43
7,94
2
44
4,24
4
52
9,77
3
48
0,82
3
57
2,52
4
46
7,27
2
53
9,19
8
59
6,55
1
55
8,95
7
D
hall
(Mys
ore)
106,
539
90,9
32
86,9
44
95,8
76
10
4,80
7
91
,595
102,
710
95,2
32
13
4,34
0
15
1,33
9
11
3,99
3
C
hilli
es (D
ried)
25,3
17
27,7
23
24,3
23
27,2
61
29
,410
31,2
42
34
,717
36,0
15
37
,707
42,7
35
40
,665
Oni
ons (
Red
)1,
827
276
2,69
3
10
,233
10,8
59
23
,754
26,8
54
16
,208
11,9
08
6,
802
7,
017
O
nion
s (B
omba
y)13
0,11
4
13
0,53
5
11
5,12
0
11
0,71
3
11
9,47
8
14
0,72
8
14
6,60
2
14
3,23
7
15
8,08
6
17
0,73
0
14
5,91
2
Po
tato
es45
,025
45
,518
31
,738
46
,264
46,5
54
85
,929
99,3
53
99
,622
129,
878
130,
511
110,
823
Drie
d Fi
sh *
*50
,765
51
,594
43
,123
50
,317
50,4
56
51
,743
47,9
55
48
,771
48,6
43
49
,950
40,7
35
M
ilk P
rodu
cts (
Pow
der)
56,8
50
54,2
36
58,6
05
56,4
27
72
,618
62,0
81
67
,484
62,3
75
72
,427
84,0
50
79
,516
* P
rovi
sion
al
Sou
rce:
Sri
Lank
a C
usto
ms
** In
clud
ing
Mal
dive
Fis
h an
d ex
clud
ing
Drie
d Pr
awns
.
( Rs.M
illio
n)IT
EM
2002
2003
2004
2005
2006
2007
2008
2009
2010
2011
2012
*R
ice
1,73
2
81
9
6,
186
1,55
4
577
4,26
1
4,73
0
2,58
9
6,74
1
2,03
2
3,08
1
Whe
at a
nd M
eslin
13,3
29
14,3
04
17,8
17
15,8
04
20
,473
22,7
56
42
,397
30,8
69
26
,711
49,6
47
51
6
Su
gar
12,9
80
11,5
60
11,0
48
14,0
96
23
,530
17,0
57
22
,326
25,0
94
40
,555
46,4
13
43
,018
Dha
ll (M
ysor
e)3,
345
2,88
8
2,89
9
3,
351
3,
802
5,
719
11
,739
11,5
28
14
,631
12,9
17
8,
891
C
hilli
es (D
ried)
1,68
0
2,
175
1,
684
1,62
9
2,73
9
4,08
0
4,46
9
4,88
1
4,99
5
9,11
1
5,88
6
Oni
ons (
Red
)57
4
7
73
30
4
37
7
94
9
1,
583
1,
083
64
1
46
4
37
8
O
nion
s (B
omba
y)1,
900
2,05
7
2,16
9
1,
826
1,
940
4,
392
3,
473
4,
688
6,
649
6,
556
3,
758
Po
tato
es1,
017
885
698
1,
117
1,
081
2,
211
2,
553
2,
648
4,
168
3,
943
2,
893
D
ried
Fish
**
3,94
8
3,
771
3,
243
3,76
9
5,50
7
6,25
3
6,27
5
7,86
9
7,58
6
8,39
4
8,93
4
Milk
Pro
duct
s (Po
wde
r)9,
027
9,43
2
12,3
38
13,4
01
17
,761
19,3
18
32
,042
18,0
56
2,
794
36
,480
37,1
04
*
Pro
visi
onal
Sour
ce: S
ri La
nka
Cus
tom
s**
Incl
udin
g M
aldi
ve F
ish
and
excl
udin
g D
ried
Praw
ns.
TA
BL
E 3
9IM
POR
T V
AL
UE
BY
PR
INC
IPA
L C
OM
MO
DIT
IES
TA
BL
E 3
8IM
POR
T Q
UA
NT
ITY
BY
PR
INC
IPA
L C
OM
MO
DIT
IES
147
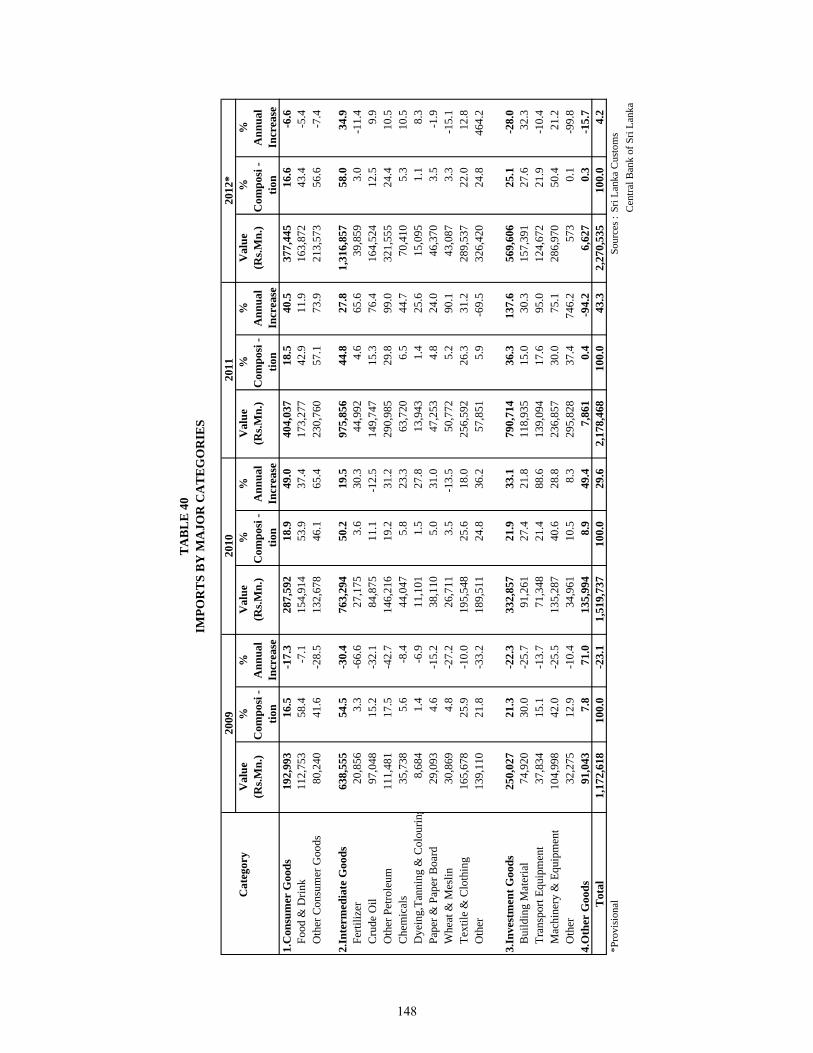
Cat
egor
yV
alue
%%
Val
ue%
%V
alue
%%
Val
ue%
%(R
s.Mn.
)C
ompo
si -
Ann
ual
(Rs.M
n.)
Com
posi
-A
nnua
l(R
s.Mn.
)C
ompo
si -
Ann
ual
(Rs.M
n.)
Com
posi
-A
nnua
ltio
nIn
crea
setio
nIn
crea
setio
nIn
crea
setio
nIn
crea
se1.
Con
sum
er G
oods
192,
993
16.5
-17.
328
7,59
218
.949
.040
4,03
718
.540
.537
7,44
516
.6-6
.6
Food
& D
rink
112,
753
58.4
-7.1
154,
914
53.9
37.4
173,
277
42.9
11.9
163,
872
43.4
-5.4
O
ther
Con
sum
er G
oods
80,2
4041
.6-2
8.5
132,
678
46.1
65.4
230,
760
57.1
73.9
213,
573
56.6
-7.4
2.In
term
edia
te G
oods
638,
555
54.5
-30.
476
3,29
450
.219
.597
5,85
644
.827
.81,
316,
857
58.0
34.9
Fe
rtiliz
er20
,856
3.3
-66.
627
,175
3.6
30.3
44,9
924.
665
.639
,859
3.0
-11.
4
Cru
de O
il97
,048
15.2
-32.
184
,875
11.1
-12.
514
9,74
715
.376
.416
4,52
412
.59.
9
Oth
er P
etro
leum
111,
481
17.5
-42.
714
6,21
619
.231
.229
0,98
529
.899
.032
1,55
524
.410
.5
Che
mic
als
35,7
385.
6-8
.444
,047
5.8
23.3
63,7
206.
544
.770
,410
5.3
10.5
D
yein
g,Ta
nnin
g &
Col
ourin
g8,
684
1.4
-6.9
11,1
011.
527
.813
,943
1.4
25.6
15,0
951.
18.
3
Pape
r & P
aper
Boa
rd29
,093
4.6
-15.
238
,110
5.0
31.0
47,2
534.
824
.046
,370
3.5
-1.9
W
heat
& M
eslin
30,8
694.
8-2
7.2
26,7
113.
5-1
3.5
50,7
725.
290
.143
,087
3.3
-15.
1
Text
ile &
Clo
thin
g16
5,67
825
.9-1
0.0
195,
548
25.6
18.0
256,
592
26.3
31.2
289,
537
22.0
12.8
O
ther
13
9,11
021
.8-3
3.2
189,
511
24.8
36.2
57,8
515.
9-6
9.5
326,
420
24.8
464.
2
3.In
vest
men
t Goo
ds25
0,02
721
.3-2
2.3
332,
857
21.9
33.1
790,
714
36.3
137.
656
9,60
625
.1-2
8.0
B
uild
ing
Mat
eria
l74
,920
30.0
-25.
791
,261
27.4
21.8
118,
935
15.0
30.3
157,
391
27.6
32.3
Tr
ansp
ort E
quip
men
t37
,834
15.1
-13.
771
,348
21.4
88.6
139,
094
17.6
95.0
124,
672
21.9
-10.
4
Mac
hine
ry &
Equ
ipm
ent
104,
998
42.0
-25.
513
5,28
740
.628
.823
6,85
730
.075
.128
6,97
050
.421
.2
Oth
er
32,2
7512
.9-1
0.4
34,9
6110
.58.
329
5,82
837
.474
6.2
573
0.1
-99.
84.
Oth
er G
oods
91,0
437.
871
.013
5,99
48.
949
.47,
861
0.4
-94.
26,
627
0.3
-15.
7
Tot
al1,
172,
618
100.
0-2
3.1
1,51
9,73
710
0.0
29.6
2,17
8,46
810
0.0
43.3
2,27
0,53
510
0.0
4.2
*Pro
visi
onal
Sour
ces :
Sri L
anka
Cus
tom
sC
entra
l Ban
k of
Sri
Lank
a
2009
TA
BL
E 4
0IM
POR
TS
BY
MA
JOR
CA
TE
GO
RIE
S
2012
*20
1120
10
148
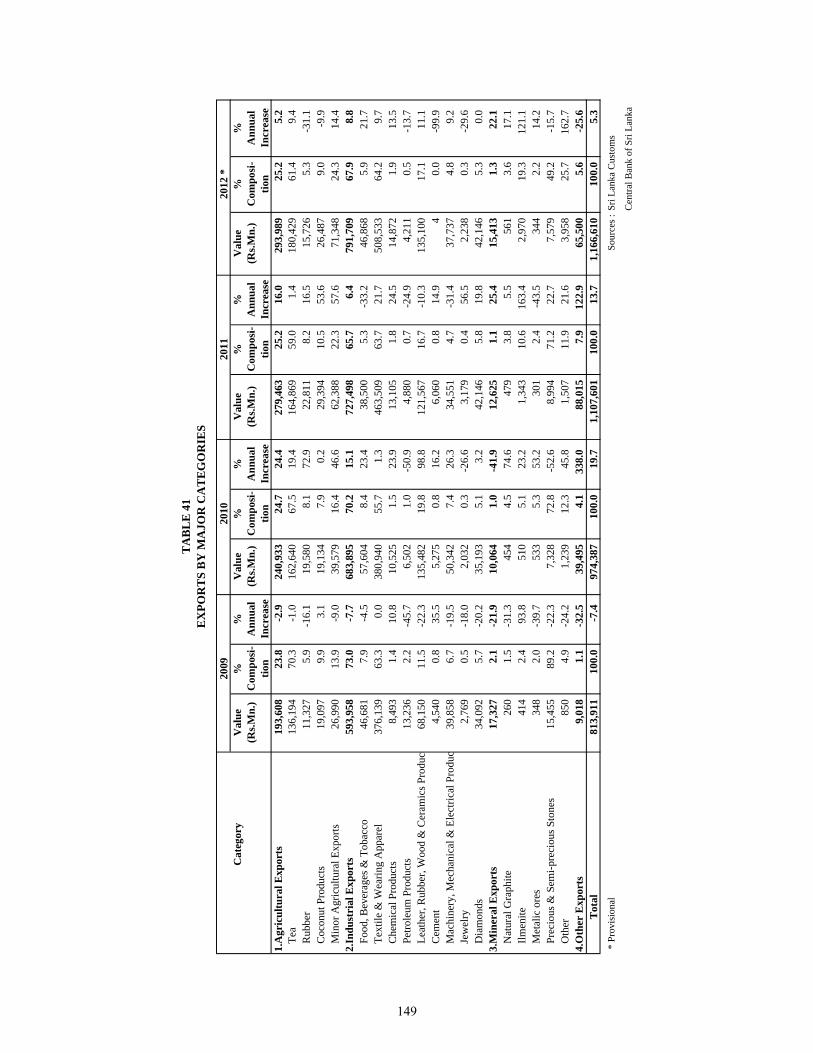
2009
2010
2011
2012
*
C
ateg
ory
Val
ue%
%V
alue
%%
Val
ue%
%V
alue
%%
(Rs.M
n.)
Com
posi
-A
nnua
l(R
s.Mn.
)C
ompo
si-
Ann
ual
(Rs.M
n.)
Com
posi
-A
nnua
l(R
s.Mn.
)C
ompo
si-
Ann
ual
tion
Incr
ease
tion
Incr
ease
tion
Incr
ease
tion
Incr
ease
1.A
gric
ultu
ral E
xpor
ts19
3,60
8
23
.8
-2.9
240,
933
24.7
24
.427
9,46
3
25.2
16
.029
3,98
9
25.2
5.2
Te
a13
6,19
4
70
.3
-1.0
162,
640
67.5
19
.416
4,86
9
59.0
1.
418
0,42
9
61.4
9.4
R
ubbe
r11
,327
5.
9
-1
6.1
19,5
80
8.
1
72
.922
,811
8.2
16.5
15,7
26
5.3
-31.
1
Coc
onut
Pro
duct
s19
,097
9.
9
3.
119
,134
7.9
0.2
29,3
94
10
.5
53.6
26,4
87
9.0
-9.9
M
inor
Agr
icul
tura
l Exp
orts
26,9
90
13.9
-9
.039
,579
16.4
46
.662
,388
22.3
57
.671
,348
24
.3
14
.42.
Indu
stri
al E
xpor
ts59
3,95
8
73
.0
-7.7
683,
895
70.2
15
.172
7,49
8
65.7
6.
479
1,70
9
67.9
8.8
Fo
od, B
ever
ages
& T
obac
co46
,681
7.
9
-4
.557
,604
8.4
23.4
38,5
00
5.
3
-3
3.2
46,8
68
5.9
21.7
Te
xtile
& W
earin
g A
ppar
el37
6,13
9
63
.3
0.0
380,
940
55.7
1.
346
3,50
9
63.7
21
.750
8,53
3
64.2
9.7
C
hem
ical
Pro
duct
s8,
493
1.
4
10
.810
,525
1.5
23.9
13,1
05
1.
8
24
.514
,872
1.
9
13
.5
Petro
leum
Pro
duct
s13
,236
2.
2
-4
5.7
6,50
2
1.0
-50.
94,
880
0.7
-24.
94,
211
0.5
-13.
7
Leat
her,
Rub
ber,
Woo
d &
Cer
amic
s Pro
duc t
68,1
50
11.5
-2
2.3
135,
482
19.8
98
.812
1,56
7
16.7
-1
0.3
135,
100
17
.1
11
.1
Cem
ent
4,54
0
0.8
35.5
5,27
5
0.8
16.2
6,06
0
0.
8
14
.94
0.0
-99.
9
Mac
hine
ry, M
echa
nica
l & E
lect
rical
Pro
duc
39,8
58
6.7
-19.
550
,342
7.4
26.3
34,5
51
4.
7
-3
1.4
37,7
37
4.8
9.2
Je
wel
ry2,
769
0.
5
-1
8.0
2,03
2
0.3
-26.
63,
179
0.4
56.5
2,23
8
0.
3
-2
9.6
D
iam
onds
34,0
92
5.7
-20.
235
,193
5.1
3.2
42,1
46
5.
8
19
.842
,146
5.
3
0.
03.
Min
eral
Exp
orts
17,3
27
2.1
-21.
910
,064
1.0
-41.
912
,625
1.1
25.4
15,4
13
1.3
22.1
N
atur
al G
raph
ite26
0
1.
5
-3
1.3
454
4.5
74.6
479
3.
8
5.
556
1
3.6
17.1
Ilm
enite
414
2.4
93.8
510
5.1
23.2
1,34
3
10
.6
163.
42,
970
19.3
121.
1
Met
alic
ore
s34
8
2.
0
-3
9.7
533
5.3
53.2
301
2.
4
-4
3.5
344
2.
2
14
.2
Prec
ious
& S
emi-p
reci
ous S
tone
s 15
,455
89
.2
-22.
37,
328
72
.8
-52.
68,
994
71.2
22
.77,
579
49.2
-15.
7
Oth
er85
0
4.
9
-2
4.2
1,23
9
12.3
45
.81,
507
11.9
21
.63,
958
25.7
162.
74.
Oth
er E
xpor
ts9,
018
1.
1
-3
2.5
39,4
95
4.
1
33
8.0
88,0
15
7.
9
12
2.9
65,5
00
5.6
-25.
6
T
otal
813,
911
100.
0
-7
.497
4,38
7
10
0.0
19.7
1,10
7,60
1
10
0.0
13.7
1,16
6,61
0
10
0.0
5.
3 *
Pro
visi
onal
Sour
ces :
Sri L
anka
Cus
tom
s
Cen
tral B
ank
of S
ri La
nka
TA
BL
E 4
1E
XPO
RT
S B
Y M
AJO
R C
AT
EG
OR
IES
149
Recommended