Embed Size (px)
Citation preview

CHILD HEALTH ACCOUNTS: BANGLADESH & SRI LANKA
Draft dated March 31, 2006
Institute for Health Policy Sri Lanka*
Data International Bangladesh
Correspondence to: Ravi P. Rannan-Eliya at Institute for Health Policy 72 Park Street Colombo 2 Sri Lanka


Table of Contents
1. Introduction................................................................................................5
2. Country Situations.....................................................................................6 2.1 Health and population status......................................................................... 6 2.2 Health Systems ............................................................................................... 7
Bangladesh.......................................................................................................... 8 Sri Lanka.............................................................................................................. 8
3. Methods ....................................................................................................10 3.1 Objectives ...................................................................................................... 10 3.2 Concepts........................................................................................................ 10
Health expenditure scope .................................................................................. 10 Child health expenditure boundary .................................................................... 10 Child health services.......................................................................................... 11
3.3 Health accounts framework ......................................................................... 13 OECD System of Health Accounts .................................................................... 13 Comparability of Bangladesh and Sri Lanka health accounts estimates ........... 13
3.4 Estimation strategy....................................................................................... 14 3.5 Limitations of analysis ................................................................................. 16
Limitations on account of resource limitations ................................................... 16 Limitations on account of conceptual limitations................................................ 18
4. Country specific data and methods .......................................................20 4.1 Bangladesh.................................................................................................... 20
Health accounts ................................................................................................. 20 Household survey data ...................................................................................... 20 Apportionment rules........................................................................................... 21
4.2 Sri Lanka ........................................................................................................ 24 Health Accounts................................................................................................. 24 Apportionment rules........................................................................................... 24 Household survey data ...................................................................................... 25
5. Results......................................................................................................32 5.1 Total expenditures for child health ............................................................. 32 5.2 Financing of child health services .............................................................. 32 5.3 Functional use of child health spending .................................................... 33 5.4 Policy implications........................................................................................ 34
6. Implementation experience.....................................................................36 6.1 Feasibility....................................................................................................... 36
Specific issues ................................................................................................... 37 6.2 Methodological recommendations.............................................................. 38
Appendix: Child Health Accounts Tables..................................................39
Bibliography.................................................................................................54
Institute for Health Policy & Data International March 2006 1

Tables
Table 2.1 General indicators for Bangladesh and Sri Lanka in 2003.......................... 6 Table 2.2 Background information on the national health systems of Bangladesh and
Sri Lanka, 2000.................................................................................................... 7 Table 4.1: Apportionment rules applied to expenditures in Bangladesh health
accounts to estimate child health spending ....................................................... 22 Table 4.2: Apportionment rules applied to expenditures in Sri Lanka health accounts
to estimate child health spending ...................................................................... 27 Table A.1: Child Health Expenditures, Bangladesh 1996/97 – 2001/02 ................... 40 Table A.2: Child Health Expenditures, Sri Lanka 1990 – 2003 ................................. 41 Table B.1: Child health expenditure by source, Bangladesh 1996/97 – 2001/02 (Taka
million) ............................................................................................................... 42 Table B.2: Child health expenditure by source, Bangladesh 1996/97 – 2001/02 (%)42 Table B.3: Child health expenditure by source, Sri Lanka 1990 – 2003 (Rupees
million) ............................................................................................................... 44 Table B.4: Child health expenditure by source, Sri Lanka 1990 – 2003 (%)............. 44 Table C.1: Child health expenditure by function, Bangladesh 1996/97 – 2001/02
(Taka million) ..................................................................................................... 45 Table C.2: Child health expenditure by function, Bangladesh 1999/00 – 2001/02 (%)
........................................................................................................................... 46 Table C.3: Child health expenditure by function, Sri Lanka 1990 – 2003 (Rupees
million) ............................................................................................................... 47 Table C.4: Child health expenditure by function, Sri Lanka 1990 – 2003 (%)........... 48 Table D.1: Total child health expenditures by source and function, Bangladesh
1999/2000 (Taka million) ................................................................................... 49 Table D.2: Total child health expenditures by source and function, Sri Lanka 2000
(Rupees million)................................................................................................. 50 Table E.1: Child health expenditure by provider, Sri Lanka 1990 – 2003 (Rupees
million) ............................................................................................................... 51 Table E.2: Child health expenditure by provider, Sri Lanka 1990 – 2003 (Rupees
million) ............................................................................................................... 51 Table F.1: Total child health expenditures by source and provider, Bangladesh
1999/2000 (Taka million) ................................................................................... 52 Table F.2: Total child health expenditures by source and provider, Sri Lanka 2000
(Rupees million)................................................................................................. 53
Figures Figure 2.1 Trends in infant mortality rates in Bangladesh and Sri Lanka.................... 7 Figure 5.1: Child share of population versus child share of current expenditure,
Bangladesh and Sri Lanka, c. 2000................................................................... 32 Figure 5.2: Sources of financing for child health services (% of total), Bangladesh
and Sri Lanka, c. 2000....................................................................................... 33 Figure 5.3: Composition of child health expenditure by function (%), Bangladesh and
Sri Lanka, c. 2000.............................................................................................. 34
Institute for Health Policy & Data International March 2006 2

Abbreviations AIDS Acquired Immune Deficiency Syndrome AMP Assistant Medical Practitioner ARV Anti Retro virus BNHA Bangladesh National Health Accounts CD Central Dispensaries CH Child Health CHA Child Health Accounts DHS Demographic and Health Survey ESP Essential Service Package FHB Family Health Bureau GDP Gross Domestic Product GOB Government Of Bangladesh HEB Health Education Bureau HESC Health Expenditure Survey Committee HNP Health, Nutrition and Population IHP Institute for Health Policy IMR Infant Mortality Rate ITN Insecticide Treated Nets LG Local Governments MCH Maternal and Child Health MDG Millennium Development Goals MO Medical Officer MOH Ministry of Health MOOH Medical Officers Of Health MOHFW Ministry of Health and Family Welfare NGO Non Governmental Organisation NHA National Health Accounts NHE National Health Expenditure NPISH Non Profit Institutions Serving Households OECD Organization for Economic Corporation and Development OOP Out Of Pocket PC Provincial councils PDHS Provincial Director of Health Services RMP Registered Medical Practitioners SLNHA Sri Lanka National Health Accounts STD Sexually Transmitted Diseases TEH Total Expenditure on Health UN United Nations WHO World Health Organisation
Institute for Health Policy & Data International March 2006 3
Key Words
health accounts, expenditure, child health, Bangladesh, Sri Lanka
Responsibilities
Any opinions expressed, or recommendations made in this report are those of the authors alone, and not necessarily those of the Institute for Health Policy or the World Health Organization. This study was carried out by a research team based at Data International, led by Dr. Ghulam Rabbani and also comprising Dr. Najmul Hossain, Khairul Abrar and A. K. M. Shoab, and by a research team based at the Institute for Health Policy comprising Tharanga Fernando, Aparnaa Somanathan and Ravi P. Rannan-Eliya. Overall direction of the study was provided by Dr. Ravi P. Rannan-Eliya with the assistance of Tharanga Fernando. Funding for this study was provided by the World Health Organization, Geneva, Switzerland.
Acknowledgments
The two research teams wish to acknowledge the support and input of many colleagues for this work, and in particular officials of the two health ministries in Bangladesh and Sri Lanka. This help was especially invaluable in determining the share of expenditures by government that was child health. They are in no particular order for Sri Lanka, Dr. H.S.B. Tennakoon (Deputy Director General, Planning, MOH), Dr. S.M. Samarage (Director, Organisation Development, MOH), Dr. A.T.P.L. Abeykoon (Director, Population Division, MOH), Dr. Vineetha Karunaratne (Director, Family Health Bureau, MOH), Mr. P.A.P. Pathiratne (Director Finance (Planning), MOH, Dr. Thushara Fernando (WHO), Dr. Reggie Perera (IHP), Mr. M. Balasubramaniam (IHP), Peter Christian (IHP), Chamikara Perera (IHP), Herath Jayasundara (IHP), Dr. (Mrs.) C. Sarukkali (Tuberculosis Prevention Programme), Dr. Siyambalagoda (Malaria Prevention Programme), Dr. Thilaka Liyanage (Director, National Programme to Eliminate Lymphatic Filariasis), Dr. Kanthi Ariyaratne (Actg. Director, Health Education Bureau), Dr. Nihal Abeysinghe (Director, Epidemiology Unit), Dr. Sunil Settinayake (Director, Anti Leprosy Campaign), Dr. Lakshmi De Silva (Dengue Programme), Dr. C.K. Shanmugarajah (Director, Environmental and Occupational Health), Mr. Lalith Weeratunga (Secretary to H.E. the President), Mrs. Chitra Athurugiriya (Secretary to the President’s Fund), Dr. U. Indrasiri (PDHS Western Province), Dr. S.W. Pattinayake (PDHS Southern Province), Dr. C.D. Pathiraja (MO Galle), P.P.A. Priyantha and H.K. Hemalatha (PDHS office, Southern Province), Mr. Aruna Rabel of the Durdens Hospital and all the other Provincial Directors and all the DDHSs who helped in providing data, the many public health nursing sisters, midwives and the Public Health Inspector of the Habaraduwa MOOH. The Bangladeshi team would like to thank their leader Dr. Ghulam Rabbani for his untiring efforts.
Institute for Health Policy & Data International March 2006 4

1. INTRODUCTION
This paper presents the findings and work of a study commissioned by WHO to estimate child health expenditures in Bangladesh and Sri Lanka, using a health accounts approach. The study itself was conducted with a small budget, but it was successful in demonstrating that it is feasible and practical to use such an approach to generate reliable and useful statistics on child health expenditures at the country level. The report is structured in three parts. The first part provides a brief introduction and overview to the health system and health conditions in the two countries. The second part reviews and discusses the methodological approach used. This is followed by a section, which gives additional information on the data and methods used in each country analysis. After this the findings and conclusions are presented, with the detailed tables of results presented in the Appendix to the report. The main conclusions of this report are: (i) Child health spending in Bangladesh and Sri Lanka was US$ 11 and US$ 16
per child in 2000. Half to two-thirds of this financing comes from households and other private sources in the two countries.
(ii) The level of child health spending itself does not appear to be the main barrier to improving child survival in Bangladesh, as the time series data show that Sri Lanka was achieving far better results in the early 1990s, despite having lower levels of total and public sector spending on child health. The results underline the need to think more about the role of technical efficiency in health systems in order to achieve better outcomes in child survival.
(iii) The existence of health accounts systems adhering to the WHO-recommended OECD SHA statistical standard substantially facilitates the task of estimating child health expenditures, and producing comparable statistics for different countries. In particular, the classification of expenditures by function in the SHA is of fundamental importance and benefit for this type of work.
(iv) Investment in health accounts capacity building in developing countries would have the additional benefit of reducing the cost and increasing the feasibility of producing regular estimates of child health resource flows at the country level.
Institute for Health Policy & Data International March 2006 5

2. COUNTRY SITUATIONS
2.1 Health and population status
Bangladesh is a low-income country with health and population indicators that are characteristic of much of South Asia. In 2003, infant and child mortality rates were 46 per thousand and 69 per thousand respectively. Life expectancy at birth was under 65 years for both men and women. Sri Lanka, with a per capita income nearly three times that of Bangladesh and health and population indicators that are more akin to those of high-income countries presents a marked contrast to the rest of South Asia. Infant and under-five mortality rates are less than one-third of those in Bangladesh. Sri Lankans live ten years or more on average than Bangladeshis and have lower fertility rates. Literacy rates average around 90% for both men and women in Sri Lanka, in contrast to 40% in Bangladesh.
Table 2.1 General indicators for Bangladesh and Sri Lanka in 2003 Bangladesh Sri Lanka Population (millions) 138 19.2 % of population aged 0-14 35.47 25.10 GDP per capita (constant 2000 US$) 381 921 Population living below the poverty line (%)(a)
PPP $1 36.0 7.6 PPP $2 82.8 50.7
Gini index (a) 31.8 33.2 Literacy rates (%)(b)
Males 31.4 88.6 Females 50.3 92.2
Population living in rural areas (%) 81 78 Health status indicators Life expectancy at birth
Males 63.1 68.1 Females 61.8 76.6
Infant mortality rate (per 1000 live births) 46.0 13.0 Under-5 mortality rate (per 1000) 69.0 15.0
Demographic indicators Total fertility rate 2.9 2.0 Crude birth rate 27.5 18.9 Crude death rate 8.1 5.9
Notes: (a) Data for 2000 (b) Data for 2001 Source: World Development Indicators (2005), and unpublished life table estimates for Sri Lanka commissioned by IHP from Prof. Indralal de Silva of Colombo University. The two countries have also experienced substantially different rates of improvements over time as trends in infant mortality rates in Figure 2.1 illustrates. Infant mortality rates in Sri Lanka in the early 1940s were comparable to those in Bangladesh in the late 1950s. However, the subsequent rate of decline in infant mortality in Sri Lanka was far more rapid than in Bangladesh. Sri Lanka’s better health performance relative to Bangladesh may be largely attributed to this faster pace of change throughout the second half of the last century, rather than any significant difference in the initial health status levels.
Institute for Health Policy & Data International March 2006 6

Figure 2.1 Trends in infant mortality rates in Bangladesh and Sri Lanka
0
20
40
60
80
100
120
140
160
1945
1947
1949
1951
1953
1955
1957
1959
1961
1963
1965
1967
1969
1971
1973
1975
1977
1979
1981
1983
1985
1987
1989
1991
1993
1995
1997
1999
2001
2003
IMR
per
10
00
liv
e b
irth
s
Bangladesh Sri Lanka Source: IHP databases, WDI (2005)
2.2 Health Systems
The national health systems in both countries are superficially quite similar in that they both place government finance and provision of services at the centre of overall national health policy. Government services are generally tax-financed in each case, with no contribution from social insurance, and with a very limited role for public sector user fees. Private sector financing and provision of medical services is permitted in the two countries, with the general government taking a laissez-faire attitude towards the former’s operations. The private sector accounts for a substantial share of overall ambulatory provision, but a fairly small share of inpatient care provision. In general Sri Lanka is characterized by a greater degree of state involvement in both financing and provision than Bangladesh. Table 2.2 provides a brief overview of each country’s health systems.
Table 2.2 Background information on the national health systems of Bangladesh and Sri Lanka, 2000
Bangladesh Sri Lanka Health spending
Total health expenditures as a % of GDP 3.1 3.5 Per capita health expenditure (current US$) 11.2 31.5 Public health expenditures as a % of GDP 1.0 1.5
Composition of health expenditures Public (%) 34 42 Private (%) 66 58
Health service provision and utilization(a) Public sector beds per 1000 capita 0.24 3.08 Private sector beds per 1000 capita 0.06 0.13 Admissions per 100 capita in the public sector <1 18 Physician contacts per capita 2.0 4.5
Sources: Central Bank of Sri Lanka Annual Report (1998), IHP Sri Lanka National Health Accounts Estimates 2005 revision, Bangladesh Health Information Bulletin 1997 and Bangladesh National Health Accounts 2003 revision.
Institute for Health Policy & Data International March 2006 7

Bangladesh
Total national health expenditures in Bangladesh were estimated to be around 3.1% of GDP in 2003. Of this, 34% were from public sources including external resources. A notable feature of health financing in Bangladesh is the substantial contribution made by donors through government financing channels. Ministry of Health and Family Welfare (MOHFW) spending is concentrated on the funding of the Essential Services Package (ESP), which includes reproductive and child health care, communicable disease control, limited curative care and behavioral change programs. NGO financing accounts for 5% of total health expenditures and is targeted at public health programs. Private expenditures comprise the largest share (61%) of overall health financing in Bangladesh. Health insurance, either through private or employer schemes, is negligible. Household spending therefore accounts for almost all private financing of health care. The large out-of-pocket burden for health care inevitably affects access to health services and makes households vulnerable to unexpected, excessively large health expenditure requirements. Income-poor Bangladeshi households have been found to be more vulnerable to catastrophic health spending and account for a significantly lower share of formal health service use than comparable households in Sri Lanka and some states in India (O'Donnell et al., 2005; van Doorslaer et al., 2005). Little is known about the impact of high levels of out-of-pocket financing on children’s use of services. DHS data on vaccinations and use of services for major childhood diseases provide evidence of high levels of inequality in utilization of formal health services by poor children relative to the rich in Bangladesh (Gwatkin et al., 2000). MOHFW is responsible for the provision of almost all government health services has two distinct divisions: health and family planning. Inpatient and outpatient curative care services are provided through a network of hospitals (teaching, specialized and district) and thana health complexes. Union and upazila health and family planning clinics, along with thana health complexes provide the bulk of public health and family planning services. MOHFW also operates key vertical programs for immunization and disease control. Private sector providers range from unregistered medical providers with little or no formal medical training, village-based traditional care providers and registered private doctors. Private clinics and hospitals, located mostly in the capital also provide curative care.
Sri Lanka
Total health expenditures in Sri Lanka were estimated to be 3.6% of GDP in 2003. Government and private sources each account for roughly half of overall health financing. Donor expenditures, including those channeled through the government budget account for a relatively small share of total spending. Health insurance financing is not significant in Sri Lanka and contributes to less than 2% of total health expenditures. Households account for about 45-50% of total health expenditures. Universal access to health care in the public sector, particularly for more expensive components such as inpatient curative care and the absence of user fees mean that poor households are relatively well protected against excessively large health expenditures in Sri Lanka (van Doorslaer et al., 2005). The distribution of public health subsidies is relatively pro-poor in Sri Lanka, comparable to those in Malaysia and Hong Kong (O'Donnell et al., 2005). DHS data for Sri Lanka indicate that the distribution of child health care use and immunization is highly equitable in Sri Lanka (Somanathan, Rannan-Eliya, and Jayawardena, Forthcoming).
Institute for Health Policy & Data International March 2006 8

The provision of government health services is the responsibility of the central Ministry of Health and eight provincial councils. The provincial councils are responsible for the management of provincial level health facilities and programs, while the central ministry is responsible for the management of national facilities, purchase and distribution of medical supplies and vertical programs. The government operates an extensive network of facilities throughout the island, which are officially organized into a multi-tiered referral system of facilities ranging from maternity homes and dispensaries to teaching and specialized hospitals. The Family Health Bureau, a central unit within MOH, is responsible for family planning programs, EPI and a range of other maternal and child health services. Private provision of services is composed largely of ambulatory care services delivered by government doctors in their private practice and 700-900 full-time private general practitioners. In addition, there are approximately 100 private hospitals in the country, mostly concentrated in the more urbanized and prosperous Western Province. There are approximately 10,000 traditional practitioners, mostly ayurvedic doctors who see vastly fewer patients in total than allopathic doctors.
Institute for Health Policy & Data International March 2006 9

3. METHODS
3.1 Objectives
The primary objectives of this study were: 1. To test the feasibility of extending existing sets of health accounts estimates
to track child health expenditures at low cost. 2. To estimate in a standardized and comparable manner health expenditures
for children in Bangladesh and Sri Lanka. A key concern of this study was to ensure comparability and reproducibility of the work. A reproducible method should be one that uses clearly defined and unambiguous definitions and procedures. Comparability at an international level requires that definitions and methods used be consistent across countries, and data sources are comparable to the extent feasible. The study exploits the availability of health accounts estimates in Bangladesh and Sri Lanka that are standardized according to international standards, and the existence of technical capacity in the two countries to undertake health accounts-related analyses. The underlying approach involves taking these existing health accounts estimates of national health expenditures, and applying a variety of methods to disaggregate each element of expenditure into the portions that benefit children and those which do not. This study was undertaken with minimal resources, as the total budget for both countries combined was US$ 10,000. A concern of the study was therefore to investigate what was feasible within this budget envelope, and to determine whether it is feasible to generate child health expenditures at low cost.
3.2 Concepts
In order to ensure comparability of the results between the two countries and other countries for which such estimates might be developed, it is important to apply consistent definitions of the expenditures to be measured.
Health expenditure scope
The scope of health expenditures considered in this study was defined as being those expenditures for goods and services, which are categorized as health expenditures according to the International Classification for Health Accounts (ICHA) functional classification (ICHA-HC), and which are included in the scope of the OECD SHA’s Total Expenditures for Health (TEH) aggregate, i.e., categories HC.1 to HC.7 and HC.R.1. The ICHA classification systems are set-out and defined in OECD (2000).
Child health expenditure boundary
Within the scope provided by the TEH aggregate, child health expenditures are defined using the guidelines agreed as part of the overall WHO-led study, of which this is a part.
Institute for Health Policy & Data International March 2006 10
For the purpose of this study, child health expenditures constitute current expenditures within the TEH scope that are for child health services. Consequently, child health expenditures can be functionally divided into:
1. Hospital inpatient/outpatient care 2. Ambulatory care 3. Rehabilitative care 4. Ancillary services to health care 5. Medical goods dispensed to outpatients 6. Preventive and public Health services 7. Health program administration and health insurance
These functional categories map to the ICHA-HC categories HC.1 to HC.7. All the totals for these categories are routinely estimated during health accounts compilation in Bangladesh and Sri Lanka. Note - In addition to the above functional categories, the Bangladesh health accounts could also support analysis of child expenditures in the following health-related functional categories:
• Education and training • Research
Child health services
Child health services are defined as any health services benefiting children, where children are defined as individuals between the ages of 0 and 5 years. Within these broad parameters, the larger WHO-led study, of which this is a part, refined the definition further in a number of ways. These are presented below.
Age boundaries
While there could be measurement issues to separate out neonatal expenditures (usually included as part of neonatal-maternal or RH accounts, because they are usually associated with child delivery services), these expenditures are considered important from a morbidity and mortality perspective, as well as highly relevant from a budget perspective as they are expected to grow as share of expenditures in many countries especially with the advocacy generated by the Lancet series. Thus they are to be included. Therefore, the lower age bound for this analysis is set at birth At the upper end, adolescent health raises many issues (teen-age pregnancies, STIs, HIV prevention interventions, etc.), and requires a larger and more inclusive perspective. As the MDGs are considered of urgent importance, the consensus decision within this WHO-led study was to start with <5 years age-group in the first round of studies, and later develop child/youth accounts for <15 or <20 years. Consequently, the agreed upper cut-off was below 5 years in this study.
Intervention boundaries
Age Two options, namely (i) interventions delivered directly to the child, and (ii) interventions delivered to the child or the mother, with the primary aim of benefiting the health of the child (tetanus toxoid to the pregnant woman, PMTCT, antenatal screening interventions) were discussed by study investigators, and the group agreed on the first one. The second option could be utilized for the larger child health
Institute for Health Policy & Data International March 2006 11

accounts, where appropriate and relevant. Operationalizing this, under PMTCT, the anti-retroviral drugs given to the newborn child and replacement feeding would be included under Option 1. All of PMTCT, the preceding plus ARVs given to the mother pre/during delivery would be included under Option 2. Also note that Option 1 will also include all expenditures on childhood immunization, including hepatitis B, which will only yield benefits during adulthood. Levels of care Includes all levels - hospital based, primary care, and community-based delivery (including expenditures for accessing traditional healers, drug sellers, community programs for neonatal care). These are for public as well as private facilities. Issues relating to specific interventions
Nutrition The following expenditures are included: o Clinical care of severely malnourished children (already included in inpatient care
in the case of Sri Lanka) o Zinc treatment during diarrhea episodes (not applicable to Sri Lanka or
Bangladesh) o Targeted food supplementation to malnourished children (Thriposha program in
Sri Lanka) o Counseling for exclusive breast feeding and promotion of complementary feeding o Micronutrient supplementation given directly in pure form (vitamin A and zinc
supplementation) to under-fives o Micronutrient fortification, which includes the costs associated with national
programs to promote fortification (costs borne by e.g. MoH in Sri Lanka), but excluding costs in commercial sector of producing and distributing fortified product.
Orphan care Is considered outside the boundary, as costs are difficult to measure and capture. Insecticide treated nets (ITNs) To be included on prorated basis when given to households. Water and Sanitation Excluded unless interventions targeted to eliminate water borne diseases. For example, distribution of chlorine tablets, promotion of UV (sunlight) disinfection, etc. are to be included under memorandum items. Birth spacing Not included. Education Not included. Capital formation It was proposed to estimate the child health specific portion of capital formation and below-the-line items (i.e., the memorandum items). However, it was clearly observed in the case of Sri Lanka and Bangladesh that identifying capital formation for child specific activities is nearly impossible, since health service infrastructure is used for
Institute for Health Policy & Data International March 2006 12

both child and adult services, and likewise for other items that are below the line, and it is not possible to make meaningful apportionments of these capital investments to child health or not. Therefore, in this study these expenses are not further disaggregated into child and non-child health expenditures.
3.3 Health accounts framework
OECD System of Health Accounts
The analysis in this study adheres to the statistical framework of the OECD System of Health Accounts or OECD SHA (OECD, 2000). WHO, World Bank, OECD and Eurostat have all endorsed use of this framework for the purposes of international and regional reporting (World Health Organization, 2003; OECD, 2005). The SHA requires that health expenditures be classified according to three dimensions: sources, providers and functions. The categorization of expenditures by function is central to the SHA’s definition of what constitutes health expenditures. This analysis exploits the fact that expenditures are already coded in the standard SHA framework by functional category, allowing the primary focus of the analysis to be to further apportion these expenditures in individual functions categories into whether they benefit children or not. The use of the OECD SHA framework provides other benefits. The requirement of that expenditure estimates must be disaggregated by functional purpose according to the ICHA-HC classification enables more rigorous comparison of the composition of expenditures between countries at the level of functions. The increasing adoption of the OECD SHA framework for health accounts reporting at the international level means that there is an increasing number of countries in both the developed and developing world which have SHA-based health accounts statistics. This implies that the methods used in this study are likely to have wide relevance to a larger group of countries, and will be amenable to replication in other national settings. Finally, the use of the OECD SHA by international organizations, such as WHO and OECD, for the purposes of reporting national health expenditures ensures that the results obtained in this study for child spending are fully compatible with the statistics reported by international agencies for total health spending in these two countries.
Comparability of Bangladesh and Sri Lanka health accounts estimates
Both Bangladesh and Sri Lanka have their own national frameworks for reporting of health expenditures. These differ and so expenditures reported using these two frameworks would not be strictly comparable. However, in both countries, health accounts teams also report health expenditures using the OECD SHA format, primarily for the purpose of international reporting and comparison. This practice of dual reporting – reporting using a national framework and also using the OECD SHA framework – is facilitated by the design of the national frameworks in both countries being based on the OECD SHA framework. This makes it relatively easy to translate the national estimates into the OECD SHA format. In the case of Sri Lanka, this is made even more straightforward as each of the functional and provider categories used in its national classification system directly and uniquely map to SHA categories. All expenditure data in Sri Lanka’s health accounts database are dual coded at the level of functions into both the national and SHA ICHA categories. Since
Institute for Health Policy & Data International March 2006 13
both countries use the OECD SHA estimates for this study, the estimates presented are comparable at the level of scope and general definitions. Although both countries can report expenditures using a common OECD SHA-based format, this only ensures that the estimates are comparable at the level of definitions and boundaries. The other major source of potential inconsistency or incomparability between national estimates lies in the area of data estimation methods, particularly the estimation of household expenditures (Rannan-Eliya, 2005). Fortunately, the estimates for each country are more comparable with each other than is often the case. Government expenditure estimates for both countries are based on audited budgetary reports of the government. In the case of Bangladesh, the annual financial reports and some databases held by the health ministry are used, whilst in the case of Sri Lanka the main data source is the electronic financial accounts system of the government, from which the published annual financial reports of the government are themselves prepared. The SHA requires that government expenditures are further disaggregated by functional purpose. In both cases, the composition of non-facility expenditures is estimated by analysis of individual programs, and facility expenditures are disaggregated by purpose using facility-costing studies. The facility costing data used for this purpose are as comparable for the two countries as it is possible to be. The analysis in the health accounts of government hospital and ambulatory facility expenditures in Sri Lanka is currently based on cost estimates produced in two nationally-representative facility costing surveys of 150-250 public facilities conducted in 1991 (Samarasinghe and Akin, 1995; Somanathan, 1998) and 1997 (Somanathan et al., 2000). The design of the 1997 study was based on the earlier 1991 study, although there were substantial modifications, so the estimates are comparable over time. The analysis of expenditures at government facilities in Bangladesh is based on the results of the 1997 national facility costing study of 110 facilities (Rannan-Eliya and Somanathan, 2003); the design for this survey were based on the Sri Lankan survey in the same year, and the instruments were deliberately designed so as to ensure that the cost estimates were comparable across the two countries. In both countries, private health expenditures in the health accounts are estimated using the integrative approach recommended by Rannan-Eliya (2005) and the Eurostat guidelines for implementing SHA-based accounts (Office for National Statistics, 2004). The integrative approach relies on combining data sources from both the purchasing and production sides of relevant transactions. In the case of Bangladesh, several of the household expenditure components in its health accounts are estimated using production-side data sources, including surveys of private hospital and NGO revenues, and industry estimates of retail pharmaceutical sales. In Sri Lanka, health accountants have traditionally relied on surveys of private hospital revenues, ad-hoc surveys of private clinics and industry estimates of retail pharmaceutical sales. In both countries, these production-side data sources are then reconciled with available national surveys of household consumption.
3.4 Estimation strategy
The starting points for the estimates in each country were the existing health accounts estimates as mapped to the OECD SHA format. These estimates were then analyzed component-by-component to determine whether they contained expenditures meeting the child health expenditure definition (see above). If they did contain such expenditures, the item was apportioned to child health and non-child
Institute for Health Policy & Data International March 2006 14
health purposes. In this way, the distribution of all expenditures was made to either a child health purpose or a non-child health purpose The choice of component that was subject to analysis varied, depending on a number of considerations, including granularity of the estimates, the underlying data sources and the potential for imputation. So for example, in some cases the component analyzed consisted of all expenditures at a particular type of provider, whilst in other instances it consisted of expenditures by a particular source of financing for a particular set of functional purposes. In a few cases, the assignation was straightforward, and they could be classified as being zero or 100% child health expenditures. However, for the bulk of expenditures, an additional step of analysis was necessary. In these instances, methods were developed to allocate expenditures to children or other beneficiaries. These methods varied, but were of the following general types:
(i) Distribution of expenditures according to distribution of utilization: Where expenditures could not be directly attributable by demographic group, they were distributed according to the distribution of utilization. For example, for patient treatment in the public sector, the government expenditures were distributed by demographic groups using standard benefit incidence analysis techniques, which impute the share of expenditures according to the share in overall utilization based on other survey data.
(ii) Distribution of expenditures according to actual distribution of expenditures by demographic group: Where data existed to do this, they were used to determine the share of expenditures. For example, in Bangladesh survey data existed which links out-of-pocket expenditure to the age and sex of the patient, and these data were used to distribute the health accounts estimates of spending.
(iii) Allocation according to arbitrary ratios: Where data did not exist, the allocation of expenditures by demographic group was made by applying guesstimates of what the proportions might be. Where possible, these ratios were obtained through a process of consultation of key experts and informants. Where such arbitrary allocations were made, these are noted in the text.
It should be noted that this study was conducted using a very limited budget – US$ 5,000 for each country analysis (equivalent to US$ 500 per single country-year of final estimates). Consequently, substantial primary data collection for this study was not feasible, and efforts were made to use existing secondary data wherever possible. The few items of primary data collection that were undertaken included field visits to four provincial council departments of health in Sri Lanka to collect additional accounting records to enable more accurate estimation of provincial government health expenditures. This particular data collection not only improved the accuracy of the Sri Lankan estimates, but also contributed to strengthening the accuracy of the overall Sri Lanka health accounts estimates. Nevertheless, the lack of financial resources did limit the analysis in a number of ways, which is discussed below. Despite this limitation, the study does demonstrate that only limited financial resources are required to generate meaningful estimates of child health expenditure in a country, if that country is already producing OECD SHA-compatible health accounts estimates, and has domestic health accounts expertise. Specific details of the methods and apportionment rules used are given below in the section dealing with details of methods. In general, the methods used were fairly standard, and are consistent with those used by other authors in similar such
Institute for Health Policy & Data International March 2006 15

exercises. The reader is referred to the earlier study of reproductive health expenditures in Egypt and Sri Lanka using a health accounts framework (Rannan-Eliya et al., 2000), and the recent estimates of expenditures by age, sex and disease for Australia (Australian Institute of Health and Welfare, 2005) for illustrative examples.
3.5 Limitations of analysis
Limitations on account of resource limitations
As indicated already, the limited budget prevented the research teams from undertaking substantial new primary data collection, and it also did not permit substantial reanalysis of existing primary data sets (chiefly household survey data sets), where this would have required significant amounts of staff time for computational work. This resource limitation restricted the estimations in a number of areas. These are summarized below:
(i) Analysis of child expenditures by financing sources (FS)
Both the Bangladesh and Sri Lankan health accounts systems are designed to be compatible with the OECD System of Health Accounts framework, although they both incorporate deviations in their classifications and expenditure boundaries for specific national purposes. These deviations are designed in such a way as to facilitate mapping the national results back to the correct SHA format, when this is required for international reporting purposes. The choice of the OECD SHA framework as the reference standard by the respective national authorities was made in recognition (i) that this framework is being widely adopted by both developed and developing countries, and (ii) the endorsement of this framework for the purpose of international reporting by WHO in its NHA Producers Guide (World Health Organization, 2003), which is a practical implementation manual for health accountants. Consequently and in accordance with the OECD SHA framework, both Bangladesh and Sri Lanka health accounts estimate and report expenditures by what OECD SHA terms sources of funding (HF), providers (HP) and functions (HC). All three terms and the same nomenclature are used in the two countries’ national health accounts publications. At the same time, WHO in its NHA Producers Guide has proposed an additional classification of expenditures according to financing sources (FS), while at the same time relabeling what the OECD SHA terms “sources of funding” (=HF) as “financing agents” (HF). For the purpose of this WHO-coordinated study, this report therefore refers to sources of funding (=HF) as “financing agents”, although it is emphasized that in the respective national documents, the terms “sources of funding” or “funding sources” are used to refer to the financing agent (HF) concept (Ministry of Health and Institute of Policy Studies, 2002; Data International, 2003). At the current time, as no such decision has been made by respective national authorities, neither Bangladesh or Sri Lanka estimate health expenditures by what WHO has proposed as “financing sources” (FS). Thus estimates of expenditure by FS are not currently available for both countries. In practice, this is not a major issue, since the only areas in which a FS analysis would differ from the existing HF analysis are donor funding and private commercial insurance funding (neither country has social insurance).
Institute for Health Policy & Data International March 2006 16

Although an FS analysis was an objective of this child health accounts study, it proved impossible to compile estimates of child health expenditures by “financing source” within the resources available to this study. The main reason for this was that it would have required substantial new data collection and analysis to compile this additional dimension for the health accounts. In the case of analyzing donor expenditures, the following problems were encountered:
(i) The central strategy in the current donor support to Bangladesh’s health sector is the adoption of the sector-wide approach (SWAp). The logic of this approach is that donor funding will be programmed consistent with government priorities and spending, instead of funding separate projects. A considerable fraction of donor financing is now effectively pooled with Government of Bangladesh funding to support the Essential Services Package (ESP), much of which benefits children. Consequently, in the current set of Bangladesh health accounts, most donor funding is reported within the total for government spending, i.e., they use the HF concept. Without detailed analysis of procurement records, it was found to be not feasible to use the data available to estimate the ultimate child share of the donor funding contributed to child health, i.e., to estimate the FS concept. However, to illustrate the approximate distribution of donor spending, the team simply pro-rated donor spending by provider type according to the fraction of spending at each provider type which was for child health. This approximation assumes that the child share of donor spending for a particular recipient is the same as overall spending from all sources at that recipient. By doing this, it was possible to generate an analysis of donor spending by provider type for child health. The results of this analysis is given in Table F.1, which is the standard OECD SHA financing agent by provider table, except that the donor money channeled to Bangladeshi government and NGOs is shown in the rest of the world column, making it a quasi-financing sources (FS) by provider matrix. However, it should be noted that these results are only illustrative and are not considered to be reliable.
(ii) In Sri Lanka, almost all external financing is channeled through the central government. Provincial governments and health ministry facilities are not permitted under the constitution or under applicable treasury regulations to receive foreign funding directly, and donor funding to NGOs is small; note that the situation changes in 2005 onwards owing to the influx of tsunami recovery funds. In the current health accounts system in Sri Lanka, the published reports do not show donor funding separately, as this is included in the total that is reported for government expenditure (some small amounts of donor funding that are paid directly to NGOs are currently not measured owing to lack of data and since this is not considered a high policy priority). This treatment is consistent with the HF concept. The WHO FS concept would require that the government financing as currently shown in SLNHA be disaggregated into government and donor funding. As it turns out, this donor funding is reported as a source of financing in the government’s financial reports separately from general revenue funding, which is channeled from the consolidated fund, so it is possible to count the amount of this funding. Such donor funding that is reported includes not only cash payments to the government, but also contributions in kind which are counted at value. However, as the accounting system is currently structured, the accounting records do not indicate how this donor funding is actually spent, since the expenditure reports analyze the use of only the combined donor and government
Institute for Health Policy & Data International March 2006 17

consolidated fund expenditures. For this reason, it is not possible to use the existing health accounts database and treasury financial reporting system to estimate the child proportion of donor spending. However, this might be estimated by collecting information from each donor source as to purposes of their spending, and then inferring the intended use of the donor funds. However, a survey would be required, and this was found not to be feasible within the resources available to the study team. In addition, the expected effort required for a survey would have been more than in a normal year, as most local donor offices in Sri Lanka are currently very busy owing to the large volume of tsunami reconstruction activities being undertaken in the country.
The second area of expenditures that would have required new analysis for estimating child health spending by financing source (FS) was private commercial health insurance expenditures. This would have required new data collection and analysis to find out (i) what proportion of current medical insurance premiums are paid by households and what proportion are paid by firms, (ii) the proportion of medical insurance claims expenditures that are incurred for children, and (iii) whether such proportions differ between group and individual insurance policy claims. In both countries, most insurance premiums are for group policies, and so can be assumed to be paid by firms. However, not all individual policies are paid for by households, as in both countries, it is know that firms sometimes purchase individual policies on behalf of high value employees. Ultimately, it was decided not to pursue this issue further, as insurance expenditures are small (<2% of TEH in Sri Lanka, and <0.1% in Bangladesh), and so knowing the separate household and enterprise contributions to private health insurance funding of child health is essentially immaterial.
(ii) Analysis of child expenditures by providers
The top-level Sri Lanka health accounts database consists of records for different items of expenditure, each of which is coded by financing agent (HF), provider and function. In estimating child health spending, each record was separately analyzed as described elsewhere in the report, so it was possible to produce estimates of child health spending by provider and by function. However, in Bangladesh, the health accounts database is not structured in this way, where all items of expenditure are ultimately coded by both provider and by function. The analysis of child health spending thus had to be done manually. When it came to analyze child health spending by providers, the team found that this could in most cases only be done by pro-rating expenditures, as they lacked sufficient data to determine the actual distribution by child and non-child health for specific providers. For example, the household surveys they were using to distribute expenditures by function did not differentiate the providers in adequate detail. Consequently, it was decided that it was not possible to produce a reliable set of child health accounts by provider for Bangladesh, and these are not reported here by year. Nevertheless, just to illustrate the likely distribution of child health spending by provider, an experimental table is provided for purposes only of illustration as Table F.1.
Limitations on account of conceptual limitations
In addition to the data problems encountered in estimating child health spending by financing source (FS), it was found that this type of analysis presents considerable conceptual problems, for which there appear no ready solution. In the case of most of the financial flows from financing sources (FS) to financing agents (HF) in the two countries, funds are pooled from the different sources at the level of financing
Institute for Health Policy & Data International March 2006 18

agents. So for example, private health insurance companies pool the premiums they receive from households and from enterprises in one revenue account. Once the funds have co-mingled in this manner, it is not possible to then identify which monies are from which particular source. This is also true of the public sector in Sri Lanka, and some instances of donor financing in Bangladesh. In fact, the only situation where we would expect this not to be the case would be if financing agents were to adopt fund accounting principles in their accounting systems, which except for a few non-profit institutions is generally not the case. In order to then ascribe a provider and function to an item of expenditure, these monies must actually be spent. However, at the point at which the expenditure takes place (i.e., is spent by the financing agent), it is not possible to identify the financing source (FS). Since the monies are co-mingled, the only way in which this could be done is by applying an arbitrary accounting rule as to how such disaggregations should be treated. However, no such rules to our knowledge have been established, and to do so would almost certainly require considerable debate and discussion given the inevitable arbitrariness of such an exercise. Given the lack of such accounting rules, it was found that it was not a practical or even meaningful exercise to attempt to estimate financing sources by function (FSxF) and financing sources by provider matrices (FSxP). Moreover, it was not clear that such matrices would serve any critical policy need. It is certainly recognized that there is a demand to know how much donor spending is occurring and this may not be met by the standard OECD SHA tables. However, such a need can be more directly met by simply estimating and presenting an analysis of how donor spending is distributed, instead of attempting to estimate a system wide health accounts table involving financing source, function and provider dimensions, which necessarily requires analysis of all financing sources, including those, such as private health insurance, of little policy interest in Bangladesh and Sri Lanka.
Institute for Health Policy & Data International March 2006 19

4. COUNTRY SPECIFIC DATA AND METHODS
This section gives details of the specific data and apportionment methods used to derive the estimates for each country.
4.1 Bangladesh
Health accounts
The base estimates of national health expenditure used are those produced in the second round of national health accounts estimates in Bangladesh (Data International, 2003), and the associated databases, which are maintained at Data International. These estimates are organized according to the Bangladesh national health accounts framework, which was itself based on the OECD SHA framework. Because of this linkage, the national estimates can be relatively easily mapped to meet OECD SHA requirements. In addition to estimating health accounts for 1999-2001, the second phase of health accounts work revised the earlier estimates produced in the first round in order to make them comparable with the definitions and framework used in the second round. In particular, this ensured that the revised estimates for the first round, which were for years 1996/1997, were compatible with the OECD SHA-based framework that was used in the second round. The first NHA round estimates relate to the single year 1996-97, and was somewhat restricted in scope. The second NHA was more comprehensive and covered all health care providers in the country - public providers, NGO and other private providers including both traditional and modern. The types of providers covered by the NHA 1999-2002 estimates are identified below. Public providers Public providers include MOHFW with its countrywide facility network, and facilities of other ministries, including Defense, Transport and Communication, Autonomous Corporations, Local Bodies, and Public Health Research and Training institutes. Private providers These consist of NGO providers, which include non-government providers working at the grass root and in urban areas, for-profit providers, which include ambulatory providers, diagnostic and imaging service providers, dental service providers, clinics and hospitals, business firms, traditional healers including ayurveds, unanani practitioners, homeopaths, and traditional birth attendants.
Household survey data
Household surveys were used intensively to apportion specific items of expenditure in the overall health accounts to child and non-child activities. The following are the major surveys used in the Bangladesh analysis.
Health and Demographic Survey
The Health and Demographic Survey (HDS) is a nationwide stratified random sample household survey of around 11,000 households covering both rural and urban areas,
Institute for Health Policy & Data International March 2006 20
Institute for Health Policy & Data International March 2006 21
conducted in fiscal year 1999-2000. The executing organization is the Bangladesh Bureau of Statistics. The survey instrument collected data on whether respondents had used any medical care or incurred any medical expenses in the previous time period, and collected information both on the type of provider as well as the associated expense. It classified treatment into chronic care (reference period of 90 days prior to the date of interview) and acute care (reference period of 15 days period to the date of interview). The availability of health care data by age of the individual household members was a big advantage, and it allowed direct allocation of costs by inpatient and out- patient care by providers. The main benefit of the HDS was that it permits the disaggregation of household out-of-pocket expenditure by age and sex, for different types of provider. Data limitations in the HDS particularly with respect to family planning and child health care service established the feasibility of the functional classification in the child health care account. All functions could not be filled out for want of data in the HDS. Also the rule that expenditure not included in the NHA should not be included in the child health account was found to be very useful in developing the child health account. The compiled accounts show that the various elements in the child health services are not of equal importance from the policy perspective. Apart from the prescribed medicines, which dominate the expenditures, immunization, though small in amount, is a key element in child health care in Bangladesh and appears to be the main factor behind the observed decline in infant and child mortality in the country. The dearth of appropriate information did not permit further refinement in classifying the data. Time series estimates on total expenditure on health by source and by functions, as well as total child health expenditure by source and by function are provided in Tables B.1, B.2, C.1, C.2 and D.1 below. Estimates are derived by ratio method (using 1999-2000 as base) except for MCH, capital formation, education and training and research, which are based on ratios derived through expert consultation.
Apportionment rules
A detailed table of the apportionment rules used to estimate the child specific health expenditures from the NHA tables by service function and source of finance is given in Table 4.1.

Table 4.1: Apportionment rules applied to expenditures in Bangladesh health accounts to estimate child health spending ICHA-HC
Code Function category Apportionment method
1 Personal Health care 1.1 Hospital services
1.1.1 Hospital inpatient care
o Inpatient care by providers and age groups was distributed using HDS 1999/2000 data, which contains data on health care utilization and out-of-pocket expenditure by type of provider and individual. These ratios were then applied to all years.
o Public sector inpatient expenditures distributed according to distribution of utilization measured in terms of admissions as in-patients.
o Private sector inpatient expenditures distributed according to distribution of out-of-pocket payments, which included operation charges, rental fees and accompanying persons’ food and other expenses.
o NGO inpatient care was assumed to be zero, since NGO care is directed overwhelmingly to outpatient care and child immunization.
1.1.2 Hospital outpatient care
o Outpatient care by providers and age groups was distributed using HDS 1999/2000 data, which contains data on health care utilization and out-of-pocket expenditure by type of provider and individual. These ratios were then applied to all years. However, HDS data do not permit disaggregation of private use by for-profit and non-profit providers in the case of private hospital care.
o Outpatient care provided to 0-4 years by private hospitals was assumed to be zero o Outpatient care provided by MOHFW facilities to age group 0-4 years distributed according to
the distribution of visits made to public sector facilities in the HDS data
1.2 Ambulatory health care services
Medical practitioners o This category of expenditure comprises only private sector providers paid out-of-pocket, and
include practicing modern and traditional physicians, and homeopaths. o Expenditures distributed by age according to the HDS 1999/2000 data.
2 Diagnostic and imaging services
o Included are household out-of-pocket expenditures reported in HDS 1999/2000 on diagnostic and imaging services
o Expenditures distributed by age according to the HDS 1999/2000 data 3 Medicine and other medical o Included are household out-of-pocket expenditures reported in HDS 1999/2000 on medicines
Institute for Health Policy & Data International March 2006 22

Health Policy & Data International March 2006 23
ICHA-HC Code Function category Apportionment method
goods and other medical goods o Expenditures distributed by age according to the HDS 1999/2000 data
4 Collective Health care o
4.1 Family planning including maternal and child health care services.
o 5% of these expenditures (that relate primarily to birth-related expenditures) allocated to child health – this share is based on expert consultation.
o Note that total number of births in hospitals is small (less than 10% of all births) 4.2 School health services o Zero expenditure (0%) is assumed as 0-4 years age group does not attend school
4.3 Prevention of communicable disease - immunizations
o All expenditures (100%) by MOFW and NGOs in this functional category were ascribed to immunization of children of age 0-4 years.
5 Health administration and health insurance
o Private health insurance is very limited, and no social insurance in Bangladesh. Share for child health was assumed to be zero since private health insurance is mostly to cover workers in a few companies, and only public health administration cost was considered.
o Expenditures for public sector health administration were distributed to child health by pro-rating according to distribution of all other public sector expenditures
6 Capital formation o 5% of the total expenditure allocated to child health determined on the basis of expert consultation.
7 Education and training o 5% of the total expenditure allocated to CH on the basis of expert consultation.
8 Research o 10% of the total expenditure allocated to CH on the basis of expert consultation.
Institute for
Child Health Accounts – Bangladesh & Sri Lanka
4.2 Sri Lanka
Health Accounts
This study uses the estimates from the third phase of health accounts compilation in Sri Lanka. Sri Lanka’s health accounts are structured according to a Sri Lankan national framework, which was itself based on the OECD SHA 2000 standard. The first estimates were published in 2001 and covered the period 1990-1999. These estimates have been updated in two subsequent phases of work, and this study uses the third phase estimates and associated databases, which are being produced by the Institute for Health Policy in collaboration with the Ministry of Health – these estimates currently cover the period 1990-2004. For the purpose of this study, the 2004 estimates have not been used as they remain provisional and subject to a major revision in 2006. The current Sri Lanka health accounts database is maintained as an electronic database, which codes all covered expenditures by year, source of funds, function, provider and provincial location of spending. The source, function and provider are coded according to the classifications of the Sri Lanka national framework for health accounts, but the relevant keys are also cross-mapped in the database to the OECD ICHA classification codes, thus ensuring that all items in the database are simultaneously coded according to the OECD ICHA. The database currently contains more than 25,000 individual data elements relating to expenditures during 1990-2003. This dual coding of the database items permits production of tables according to both the Sri Lanka national health accounts framework and the OECD SHA framework. To produce the estimates of child health expenditure for Sri Lanka, the method of analysis was similar to that used in Bangladesh, but with one major difference in the process of computation. In the Sri Lanka study, the analyses yielded a number of apportionment rules for handling different items of expenditure, just as in Bangladesh. However, these rules were not applied to individual cells in the SHA tables of health expenditure as in Bangladesh, but were instead used to develop an algorithm to apply to the individual data records contained in the health accounts database. This algorithm was written in the form of a Stata 9.0 software routine, and used to process all the data records in the health accounts database, producing a second database consisting of records giving the estimated amount of child health expenditure that was computed for each of the records in the primary database. The source, function and provider codes for each of these new records remained unchanged from the original coding. New tables were then generated from the second database to show the classification of expenditure by source and function, and related cross-tabulations.
Apportionment rules
The apportionment rules, used in this analysis, were developed by the study team, in consultation with the Ministry of Health. A technical advisory committee was set up, headed by the Deputy Director-General of Planning, MOH and other directors of the MOH, WHO Sri Lanka office and IHP. The committee met several times to review work progress and agree the proportions to be allocated to specific functions as child specific expenditures. Public sector expenditures Public sector expenditures are already disaggregated in considerable detail in the Sri Lanka health accounts database. However, additional disaggregation was still necessary in order to determine the child share of most expenditure items.
Institute for Health Policy & Data International March 2006 24

Child Health Accounts – Bangladesh & Sri Lanka
Apportionment of most curative care expenditures was done using household survey data. However, for public sector administration and preventive health programs, it was necessary to analyze each program separately to make a determination. To do this, the directors of almost all the MOH preventive health programs, directors of several provincial health departments, a few midwives and public health inspectors were interviewed to obtain a better understanding of their respective child related health activities and expenditure. It must be noted that most MOH programs do not keep accounting records in such a manner that it is conveniently demarcated for children’s expenses, so a considerable amount of triangulation and expert estimation was required. In several instances, only an informed guesstimate was possible. The apportionment of most items of curative care expenditure mainly relied on using data on utilization and expenditure collected in the Central Bank Consumer Finance Surveys of various years and the Sri Lanka Household Health Survey conducted in 1991. In certain instances, where the functions seem general, the population proportion of children in that year was used to allocate child specific expenditure proportions.
Household survey data
Household surveys were used intensively to apportion specific items of expenditure in the overall health accounts to child and non-child activities. The following are the major surveys used in the Sri Lanka analysis.
Central Bank Consumer Finance Surveys
The Central Bank Consumer Finance and Socioeconomic Surveys are a series of nationally representative, large household surveys that are conducted every 5 to ten years in Sri Lanka by the Central Bank of Sri Lanka. The first survey was conducted in 1953, and subsequent surveys were fielded in 1963, 1973, 1978, 1981, 1996 and 2003. The typical sample seizes for each survey have ranged from 25,000 to 50,000 individuals. The most recent surveys have all taken samples throughout a minimum twelve-month period in order to control for any seasonal variations. The surveys provide information on the distribution and level of basic socio-economic characteristics at the household and individual level. Additionally, starting with the 1978 survey, there has been an additional module asking about illness in the previous 14 days, and any use of medical providers. However, unlike the surveys used in Bangladesh, the survey does not ask for medical expenditures associated with the reported visits by specific individuals, and expenditure data are only collected at the household level. For this study, data from the 1996/97 and 2003/04 surveys were used. Both surveys were nationally representative, although coverage of the 1996/97 was limited in the eastern and northern parts of Sri Lanka, owing to security conditions. The 1996/97 survey sample comprised 39,000 individuals, and the 2003/04 survey comprised 50,000 individuals. Sri Lanka Household Health Survey 1991 This was a large 9,000 household survey carried out by Ministry of Health with IDA funding-support in 1991 in four representative districts of Sri Lanka (Colombo, Galle, Matale and Polonnaruwa). The survey instrument collected detailed information on the use of health care providers and expenditures, obtaining data on up to two provider visits per sickness episode. The recall period was one month for both inpatient and
Institute for Health Policy & Data International March 2006 25

Child Health Accounts – Bangladesh & Sri Lanka
Institute for Health Policy & Data International March 2006 26
outpatient visits. It also contained a special module that enquired from all adult women the use of family planning and MCH services. A detailed table of the apportionment rules used to estimate the child specific health expenditures from the NHA tables by service function and source of finance is given in Table 4.2.

Child Health Accounts – Bangladesh & Sri Lanka
Table 4.2: Apportionment rules applied to expenditures in Sri Lanka health accounts to estimate child health spending Item No
Funding source Functional item
ICHA-HC code Spending units Apportionment rule
1 Public sector Hospital inpatient care HC 1.1
MOH, PCs and other Government Departments
Spending apportioned according to the child share of public sector non-Ayurvedic IP admissions in the CB CFS surveys of 1996/97 and 2003/04, with linear interpolation of ratio for the intervening years, and flat extrapolation for years prior to 1996
2 Public sector Hospital outpatient care HC 1.3
MOH, PCs and other Government Departments
Spending apportioned according to the child share of public sector non-Ayurvedic outpatient visits in the CB CFS surveys of 1996/97 and 2003/04, with linear interpolation of ratio for the intervening years, and flat extrapolation for years prior to 1996
3 Public sector Ayurvedic hospital inpatient care HC 1.1 MOH
Spending apportioned according to the child share of public sector Ayurvedic IP admissions in the CB CFS surveys of 1996/97 and 2003/04, with linear interpolation of ratio for the intervening years, and flat extrapolation for years prior to 1996
4 Public sector Ayurvedic hospital outpatient care HC 1.3 MOH
Spending apportioned according to the child share of public sector Ayurvedic outpatient visits in the CB CFS surveys of 1996/97 and 2003/04, with linear interpolation of ratio for the intervening years, and flat extrapolation for years prior to 1996
5 Public sector Ambulatory care HC.1.3 LGs and other Government Departments
Spending apportioned according to the child share of public sector outpatient visits in the CB CFS surveys of 1996/97 and 2003/04, with linear interpolation of ratio for the intervening years, and flat extrapolation for years prior to 1996
7 Public sector Inpatient rehabilitative care HC.2.1 MOH Estimate of proportion based on expert opinion - consultation with the Director, Ragama Rehabilitation Hospital (28.8%)
8 Public sector Outpatient rehabilitative care HC.2.3 MOH Estimate of proportion based on expert opinion - consultation with the Director, Ragama Rehabilitation Hospital (28.8%)
9 Public sector Other services of rehabilitative care n.e.c HC.2.9 MOH Estimate of proportion based on expert opinion - consultation
with the Director, Ragama Rehabilitation Hospital (28.8%)
10 Public sector Clinical laboratories HC 4.1 MOH Estimate of proportion based on expert opinions – consultation with MOH managers (10%)
11 Public sector Patient transport and emergency rescue HC.4.3 MOH Pro-rated according to share of child health spending in the
curative expenditures of MOH as estimated
Institute for Health Policy & Data International March 2006 27
Child Health Accounts – Bangladesh & Sri Lanka
Item No
Funding source
ICHA-Functional item Spending units Apportionment rule HC code
12 Public sector Medical goods dispensed to outpatients HC.5
MOH, LGs and Other Government Departments
(i) MOH component consists of spending through SL Red Cross and so assumed to be 0% for child care; (ii) for all other public sources a pro rated share of child expenses from the curative care sections above is applied
13 Public sector Pharmaceuticals and other medical non-durables HC.5.1
National Blood Transfusion and PCs
(i) NBT proportion based on expert opinion at private hospital (3.2%); (ii) share for PC spending based on outpatient proportion estimated based on the <5 utilization rates of the CB CFS surveys of 1996/97 and 2003/04 with linear interpolation for the intervening years.
14 Public sector Glasses and other vision aids HC.5.2.1 PCs Expert opinion (MOH managers) – 1%
15 Public sector Preventive and public health services HC.6 MOH and LGs
Distributed according to the proportion of children <5 in the general population. Source for data is set of demographic projections commissioned by IHP from Professor of Demography, Colombo University (forthcoming publication)
16 Public sector Family planning and reproductive health services HC.6.1 MOH Prorated based on ratio of child expenditure to total expenditure
in maternal health and infant care (below) by MOH
17 Public sector Maternal health HC.6.1 MOH, PCs and LGs
(i) MOH share based on assumption that 50% of expenditure would be children under 5 as this is generally the pattern of MOOH unit expenses; (ii) share at PCs and LGs based on individual PC data on MOOH staff salary allocations
18 Public sector Infant and child care HC.6.1 MOH, PCs and LGs
(i) MOH share assuming that in general 100% of expenditure would be children under 5 as this is generally the MOOH unit expense pattern; (ii) PCs and LGs share based on individual PC data on MOOH staff salary allocations
19 Public sector Prevention and management of communicable diseases HC.6.3 MOH, PCs and
LGs
Proportions allocated based on consultation with programme directors for MOH expenses and Individual PC data on MOOH staff salary allocation to be used for total expenditure allocation
20 Public sector Immunization HC.6.3 MOH Expert opinion (MOH managers) – 90%
21 Public sector Health program administration and health insurance HC.7
LGs and Other Government Departments
(i) LG services proportion prorated according to total share of child expenditure in other curative services; (ii) other government departments found to have no involvement in child health services – 0%
Institute for Health Policy & Data International March 2006 28

Child Health Accounts – Bangladesh & Sri Lanka
Item No
Funding source
ICHA-Functional item Spending units Apportionment rule HC code
22 Public sector General government administration of health HC.7.1
MOH, PCs, LGs and Other Government Departments
(i) MOH Epidemiology Unit shares were allocated based on expenditure numbers from the unit’s financial reports (see item 31); (ii) other units (DOHS, Dept. of Ayurveda, MOH HQ, central support services, SJP and WK hospitals) prorated according to total share of child expenditure in other curative services; (iii) PCs, LGs and LG dispensaries shares prorated according child share in other curative services
23 Public sector Health related expenditures HC.R.1-9 All sources Apportionment of this item was found to be impractical as it is not meaningful to allocate most capital expenditures. Ignored in analysis as discussed in text.
24 Public sector Prevention and management of communicable diseases HC.6.3 TB Campaign Based on the child patient proportion obtained from the TB
Campaign (0.2%)
25 Public sector Prevention and management of communicable diseases HC.6.3 Malaria
Campaign Based on the child patient proportion obtained from the Malaria Campaign (21%)
26 Public sector Prevention and management of communicable diseases HC.6.3 Filaria Campaign
Distributed according to the proportion of children <5 in the general population, since all age groups benefit from filaria prevention. Source for data is set of demographic projections commissioned by IHP from Professor of Demography, Colombo University (forthcoming publication)
27 Public sector Prevention and management of communicable diseases HC.6.3 Rabies program No information on child incidence, therefore assumed as 0%
28 Public sector Prevention and management of communicable diseases HC.6.3 CNAPT Based on the child patient proportion obtained from the TB
Campaign (0.2%)
29 Public sector Prevention and management of communicable diseases HC.6.3
Central government public health services
Distributed according to the proportion of children <5 in the general population, since all activities are targeted at whole population. Source for data is set of demographic projections commissioned by IHP from Professor of Demography, Colombo University (forthcoming publication)
30 Public sector Prevention and management of communicable diseases HC.6.3 Health Education
Bureau
Distributed according to the proportion of children <5 in the general population, since all activities are targeted at whole population. Source for data is set of demographic projections commissioned by IHP from Professor of Demography, Colombo University (forthcoming publication)
Institute for Health Policy & Data International March 2006 29
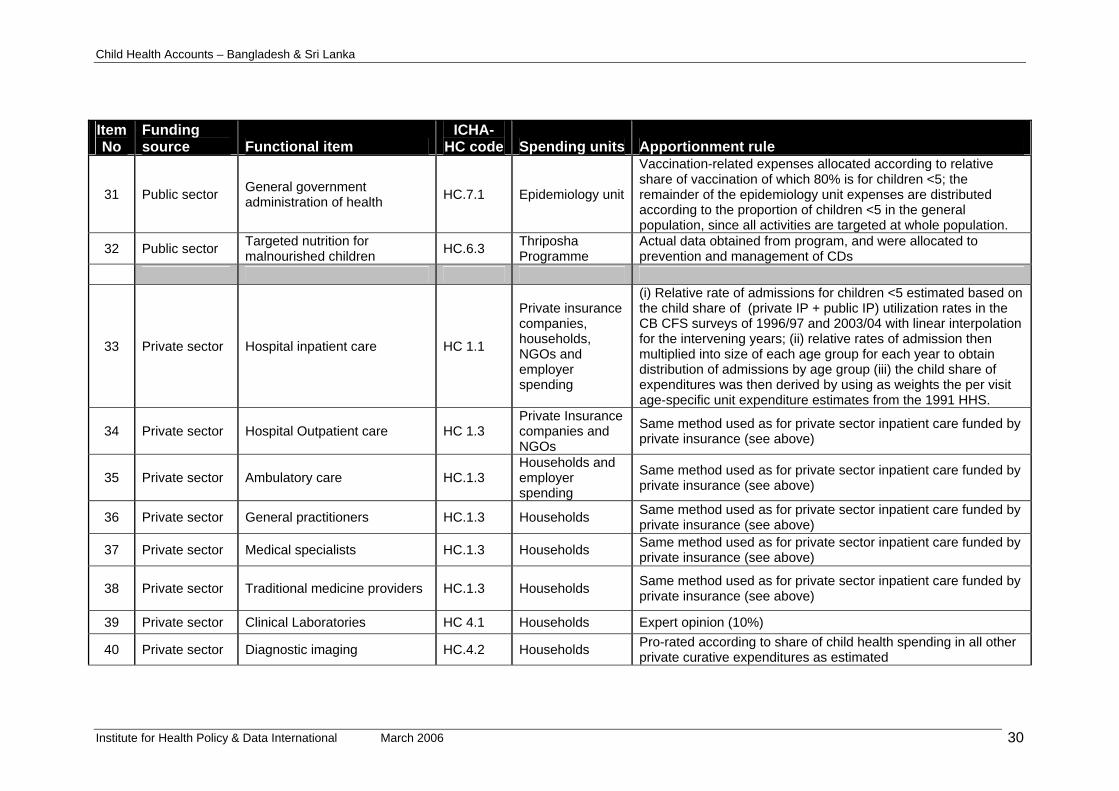
Child Health Accounts – Bangladesh & Sri Lanka
Item No
Funding source
ICHA-Functional item Spending units Apportionment rule HC code
31 Public sector General government administration of health HC.7.1 Epidemiology unit
Vaccination-related expenses allocated according to relative share of vaccination of which 80% is for children <5; the remainder of the epidemiology unit expenses are distributed according to the proportion of children <5 in the general population, since all activities are targeted at whole population.
32 Public sector Targeted nutrition for malnourished children HC.6.3 Thriposha
Programme Actual data obtained from program, and were allocated to prevention and management of CDs
33 Private sector Hospital inpatient care HC 1.1
Private insurance companies, households, NGOs and employer spending
(i) Relative rate of admissions for children <5 estimated based on the child share of (private IP + public IP) utilization rates in the CB CFS surveys of 1996/97 and 2003/04 with linear interpolation for the intervening years; (ii) relative rates of admission then multiplied into size of each age group for each year to obtain distribution of admissions by age group (iii) the child share of expenditures was then derived by using as weights the per visit age-specific unit expenditure estimates from the 1991 HHS.
34 Private sector Hospital Outpatient care HC 1.3 Private Insurance companies and NGOs
Same method used as for private sector inpatient care funded by private insurance (see above)
35 Private sector Ambulatory care HC.1.3 Households and employer spending
Same method used as for private sector inpatient care funded by private insurance (see above)
36 Private sector General practitioners HC.1.3 Households Same method used as for private sector inpatient care funded by private insurance (see above)
37 Private sector Medical specialists HC.1.3 Households Same method used as for private sector inpatient care funded by private insurance (see above)
38 Private sector Traditional medicine providers HC.1.3 Households Same method used as for private sector inpatient care funded by private insurance (see above)
39 Private sector Clinical Laboratories HC 4.1 Households Expert opinion (10%)
40 Private sector Diagnostic imaging HC.4.2 Households Pro-rated according to share of child health spending in all other private curative expenditures as estimated
Institute for Health Policy & Data International March 2006 30
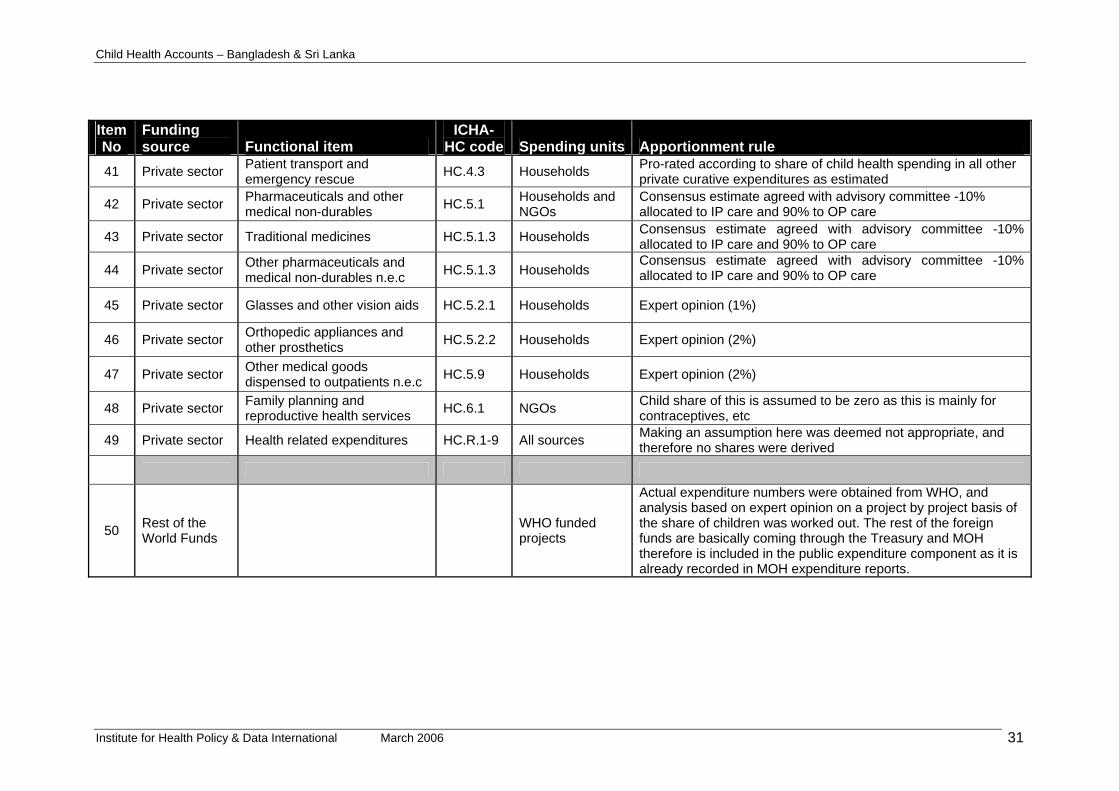
d Health Accounts – Bangladesh & Sri Lanka
Institute for Health Policy & Data International March 2006 31
Apportionment rule Spending units Item No
Funding source Functional item
ICHA-HC code
41 Private sector Patient transport and emergency rescue HC.4.3 Households Pro-rated according to share of child health spending in all other
private curative expenditures as estimated
42 Private sector Pharmaceuticals and other medical non-durables HC.5.1 Households and
NGOs Consensus estimate agreed with advisory committee -10% allocated to IP care and 90% to OP care
43 Private sector Traditional medicines HC.5.1.3 Households Consensus estimate agreed with advisory committee -10% allocated to IP care and 90% to OP care
44 Private sector Other pharmaceuticals and medical non-durables n.e.c HC.5.1.3 Households
Consensus estimate agreed with advisory committee -10% allocated to IP care and 90% to OP care
45 Private sector Glasses and other vision aids HC.5.2.1 Households Expert opinion (1%)
46 Private sector Orthopedic appliances and other prosthetics HC.5.2.2 Households Expert opinion (2%)
47 Private sector Other medical goods dispensed to outpatients n.e.c HC.5.9 Households Expert opinion (2%)
48 Private sector Family planning and reproductive health services HC.6.1 NGOs Child share of this is assumed to be zero as this is mainly for
contraceptives, etc
49 Private sector Health related expenditures HC.R.1-9 All sources Making an assumption here was deemed not appropriate, and therefore no shares were derived
50 Rest of the World Funds WHO funded
projects
Actual expenditure numbers were obtained from WHO, and analysis based on expert opinion on a project by project basis of the share of children was worked out. The rest of the foreign funds are basically coming through the Treasury and MOH therefore is included in the public expenditure component as it is already recorded in MOH expenditure reports.
Chil

Child Health Accounts – Bangladesh & Sri Lanka
5. RESULTS
5.1 Total expenditures for child health
Total spending on child health in Bangladesh in 1999/2000 was 8,640 Taka millions (Table A.1), or 13% of total current expenditure on health (TCHE). In Sri Lanka in 2000, child health spending totaled Rs. 1,662 millions (Table A.2), or 4.3% of total current expenditure on health. Per child health expenditure levels were US$ 10.5 in Bangladesh in 1999/2000, and US$ 13.7 in Sri Lanka in 2000. It should be noted that per capita income is almost three times higher in Sri Lanka, so expenditures in Bangladesh represent a much higher share of national resources than in Sri Lanka. During the period 1996/97 – 2001/02, per child health expenditures in Bangladesh increased from US$ 9.8 to US$ 10.7, which would have represented a small decline in constant dollar terms. In Sri Lanka during the period 1990 – 2003, per child expenditures increased substantially from US$ 7.3 to US$ 16.1. This increase was due partly to increasing spending in line with per capita income growth, and partly to declining numbers of children in the population. In Bangladesh’s case although total spending did increase in the period reviewed, it was only sufficient to keep pace with overall growth in child population numbers. In relation to the child share of the population, Bangladesh spent about as much of its total national health expenditure (12.9% share of population versus 12.1%), but Sri Lanka spent proportionately less than half (8.6% versus 4.3%), as illustrated in Figure 5.1. Figure 5.1: Child share of population versus child share of current expenditure,
Bangladesh and Sri Lanka, c. 2000
0%
2%
4%
6%
8%
10%
12%
14%
Bangladesh Sri Lanka
Population Current Expenditure
5.2 Financing of child health services
In both countries, more than half of child health spending is financed by private sources, mostly household out-of-pocket spending (Tables B.1 – B.4). The private share in 2000 is higher in Bangladesh (66%) than in Sri Lanka (60%). In Bangladesh
Institute for Health Policy & Data International March 2006 32
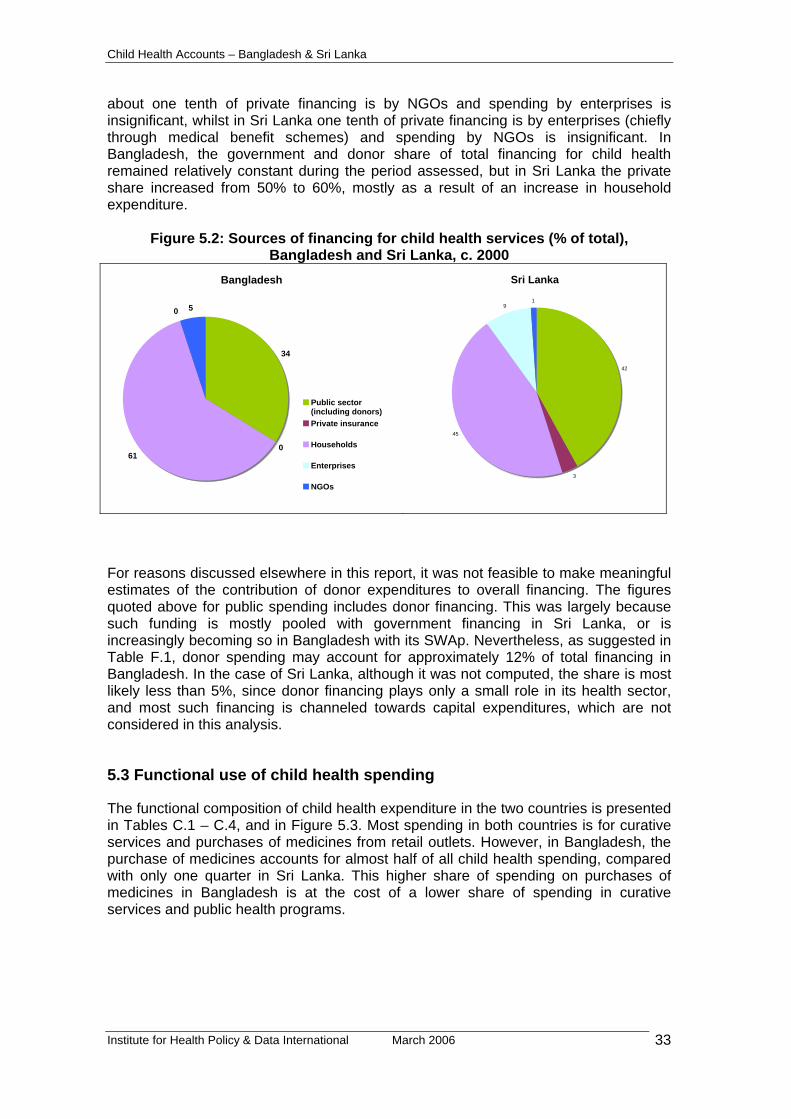
Child Health Accounts – Bangladesh & Sri Lanka
about one tenth of private financing is by NGOs and spending by enterprises is insignificant, whilst in Sri Lanka one tenth of private financing is by enterprises (chiefly through medical benefit schemes) and spending by NGOs is insignificant. In Bangladesh, the government and donor share of total financing for child health remained relatively constant during the period assessed, but in Sri Lanka the private share increased from 50% to 60%, mostly as a result of an increase in household expenditure.
Figure 5.2: Sources of financing for child health services (% of total), Bangladesh and Sri Lanka, c. 2000
Bangladesh
34
061
0 5
Public sector(including donors)Private insurance
Households
Enterprises
NGOs
Sri Lanka
42
3
45
91
For reasons discussed elsewhere in this report, it was not feasible to make meaningful estimates of the contribution of donor expenditures to overall financing. The figures quoted above for public spending includes donor financing. This was largely because such funding is mostly pooled with government financing in Sri Lanka, or is increasingly becoming so in Bangladesh with its SWAp. Nevertheless, as suggested in Table F.1, donor spending may account for approximately 12% of total financing in Bangladesh. In the case of Sri Lanka, although it was not computed, the share is most likely less than 5%, since donor financing plays only a small role in its health sector, and most such financing is channeled towards capital expenditures, which are not considered in this analysis.
5.3 Functional use of child health spending
The functional composition of child health expenditure in the two countries is presented in Tables C.1 – C.4, and in Figure 5.3. Most spending in both countries is for curative services and purchases of medicines from retail outlets. However, in Bangladesh, the purchase of medicines accounts for almost half of all child health spending, compared with only one quarter in Sri Lanka. This higher share of spending on purchases of medicines in Bangladesh is at the cost of a lower share of spending in curative services and public health programs.
Institute for Health Policy & Data International March 2006 33
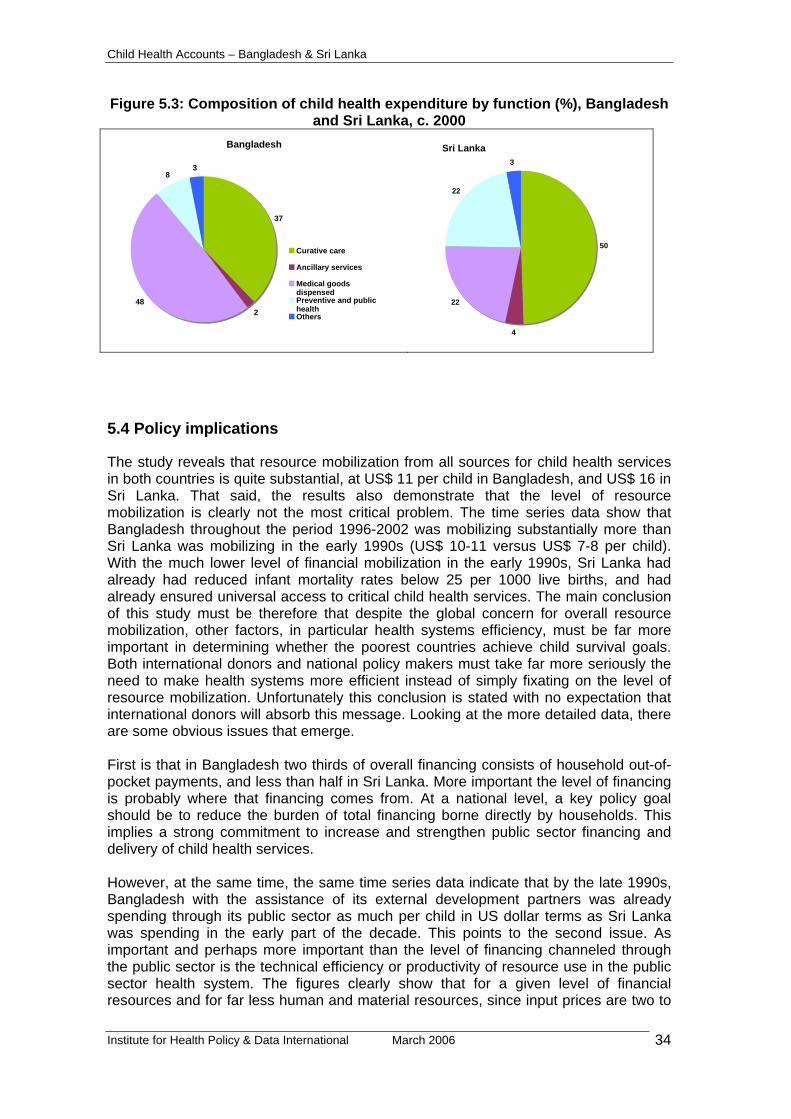
Child Health Accounts – Bangladesh & Sri Lanka
Figure 5.3: Composition of child health expenditure by function (%), Bangladesh and Sri Lanka, c. 2000
Bangladesh
37
248
83
Curative care
Ancillary services
Medical goodsdispensedPreventive and publichealthOthers
Sri Lanka
50
4
22
22
3
5.4 Policy implications
The study reveals that resource mobilization from all sources for child health services in both countries is quite substantial, at US$ 11 per child in Bangladesh, and US$ 16 in Sri Lanka. That said, the results also demonstrate that the level of resource mobilization is clearly not the most critical problem. The time series data show that Bangladesh throughout the period 1996-2002 was mobilizing substantially more than Sri Lanka was mobilizing in the early 1990s (US$ 10-11 versus US$ 7-8 per child). With the much lower level of financial mobilization in the early 1990s, Sri Lanka had already had reduced infant mortality rates below 25 per 1000 live births, and had already ensured universal access to critical child health services. The main conclusion of this study must be therefore that despite the global concern for overall resource mobilization, other factors, in particular health systems efficiency, must be far more important in determining whether the poorest countries achieve child survival goals. Both international donors and national policy makers must take far more seriously the need to make health systems more efficient instead of simply fixating on the level of resource mobilization. Unfortunately this conclusion is stated with no expectation that international donors will absorb this message. Looking at the more detailed data, there are some obvious issues that emerge. First is that in Bangladesh two thirds of overall financing consists of household out-of-pocket payments, and less than half in Sri Lanka. More important the level of financing is probably where that financing comes from. At a national level, a key policy goal should be to reduce the burden of total financing borne directly by households. This implies a strong commitment to increase and strengthen public sector financing and delivery of child health services. However, at the same time, the same time series data indicate that by the late 1990s, Bangladesh with the assistance of its external development partners was already spending through its public sector as much per child in US dollar terms as Sri Lanka was spending in the early part of the decade. This points to the second issue. As important and perhaps more important than the level of financing channeled through the public sector is the technical efficiency or productivity of resource use in the public sector health system. The figures clearly show that for a given level of financial resources and for far less human and material resources, since input prices are two to
Institute for Health Policy & Data International March 2006 34

Child Health Accounts – Bangladesh & Sri Lanka
three times higher in Sri Lanka, Bangladesh is not able to provide the same level of child health care provision as Sri Lanka. This finding, which merely confirms that of previous studies (Rannan-Eliya and Somanathan, 2003), underlines that there remains a key gap in current international thinking about the barriers to accelerated child mortality reduction. This gap concerns the technical efficiency of government health service provision in countries such as Bangladesh, and the need to learn lessons from countries such as Sri Lanka how public sector efficiency can be improved. To date the debate in Bangladesh has largely ducked this issue by attempting to cope with public sector inefficiency by contracting out services to the private sector. However, Sri Lanka contracts out no health services provision in its public sector, and uses none of the current management fads (such as performance-based payment, financial incentives, facility autonomy, etc.), and yet still achieves high levels of public sector productivity. How Sri Lanka (and other success stories in child survival such as Malaysia, Thailand and others) does this should the highest priority for future research and policy debate, and not simply whether international donors are spending enough.
Institute for Health Policy & Data International March 2006 35
Child Health Accounts – Bangladesh & Sri Lanka
6. IMPLEMENTATION EXPERIENCE
6.1 Feasibility
As mentioned, this was study was conducted in both countries with minimal resources. The total budget for each country team was only US$ 5,000. This limited budget necessitated use of methods that relied primarily on exploiting the existing health accounts estimates and available secondary data. Funding was much less than adequate to initiate any primary data collection, or to support extensive new analyses of available large data sets. The research team had to emphasize simplicity in methods, make the best use of any available data, and tolerate a considerable level of guesstimation and imprecision in final estimates. Despite this, the efforts were successful in producing estimates for the two countries covering a span of 6 years in Bangladesh (1996/97-2001/02) and 14 years in SrI Lanka (1990-2003). At the methodological and standards level, these estimates are fully consistent with the WHO-endorsed OECD SHA statistical framework, and thus consistent with the overall SHA-based health accounts estimates for each country, as well as being comparable between the two countries. The success in being able to produce these estimates despite limited resources was primarily due to the following:
(i) Both countries had pre-existing health accounts estimates compatible with the OECD SHA framework. It was not necessary to estimate expenditures anew in this study, and instead the focus was on apportioning the known expenditures to child health.
(ii) Both countries had some health accounts technical capacity. In particular, the skills required to find and develop methods to apportion items of expenditure by specific purpose were critical and central to the analysis. These are skills that are integral to the process of estimating functional disaggregations that are required for OECD SHA compatible health accounts.
(iii) Both countries had access to a minimum level of household survey data, which could be used to analyze patterns of utilization (and in some instances expenditures) by age group. That is not to say that the household data was abundant and comprehensive– they were not. The extent of data availability varied, and the two limitations encountered related to the periodicity of the survey data and whether the surveys collected data expenditures by individual household member. The Sri Lankan analysis was able to rely on two different rounds of the same survey conducted seven years apart to obtain a fix on trends in spending, but the Bangladeshi analysis had to rely on only one survey during the period covered. On the other hand, the Sri Lankan survey data did not contain information on health spending by individual household member, unlike the case in Bangladesh. Nevertheless by making assumptions and extrapolating where necessary it was possible to extend the available household survey data to the all the years assessed.
Given this experience, it can be concluded that if the pre-conditions implied are met are met, it is certainly feasible to produce meaningful estimates of the level, pattern and general trend in child health expenditures within a framework meeting international standards in the developing country context. This can also be done with limited resources. This study would suggest for example that regular updates of child health spending could be produced every two to three years as an extension of the existing
Institute for Health Policy & Data International March 2006 36

Child Health Accounts – Bangladesh & Sri Lanka
health accounts process in each of the two countries at an annual cost of US$ 3-5,000 each.
Specific issues
World Health Survey
The World Health Survey dataset for Sri Lanka was made available to the research team for this study. However, it was not possible to make use of this survey for the analysis. It was noted that whilst the utilization modules in the survey are very detailed they suffer from a serious deficiency, which makes it impossible to estimate period utilization rates for health care services. Unlike other surveys which typically asks for information for any visits (or the first or last visit) made in a specific time period, the WHS collects data only for the last visit made in any time period by an adult and by a child member of the household. Since the time period is not fixed, this means that it is not possible to compute a period utilization rate. It is noted that this makes it impossible to use the WHS for other similar analyses, such as examining the targeting of government health spending using benefit incidence analysis. For these reasons, the research teams found that the existing household surveys conducted by national agencies in Bangladesh and Sri Lanka were more useful for this type of analysis, as well as for general health accounts estimation purposes.
Financing sources analysis
As discussed elsewhere in this report, it was found to be conceptually and empirically difficult to estimate child health expenditures according to financing sources (FS). The main reason for this is that expenditure flows from financing sources to financing agents are often not identifiable by a specific function or provider. This problem cannot be overcome without specifying some arbitrary rules for how such expenditures should be allocated to specific functions and providers. It is not clear what the meaning of such results would be, given their necessarily artificial nature. It was also noted that the main issue of concern is likely to be the use of donor spending, and this can be presented more simply by a sub-analysis instead of attempting to estimate financing sources by functions matrices. However, it was also noted that attempting to identify the use of donor funding by specific end-purpose is likely to run counter to the philosophy behind the shift in donor funding to funding mechanisms such as SWAps and budget support.
Database design
The Sri Lankan team found it much easier to compile correct and internally consistent child health accounts tables than the Bangladeshi team, even though the same approach was used. This was because the Sri Lankan health accounts database consists of records of expenditures, where each item of spending is already coded by source of funds, provider and function. It was thus possible to substantially automate in Sri Lanka the process of applying the apportionment rules to obtain estimates of child spending. On the other hand, the Bangladeshi team faced some challenges in compiling the final results and in ensuring internal consistency between different tables. This experience indicates that there would be much benefit if the database approach used in health accounts work in Sri Lanka (and other countries such as the Netherlands, Hong Kong and Australia) is more widely disseminated and adopted.
Institute for Health Policy & Data International March 2006 37

Child Health Accounts – Bangladesh & Sri Lanka
6.2 Methodological recommendations
This study has demonstrated that under certain conditions, it is feasible at very low cost to generate informative estimates of child health expenditure in the poorest countries. This however does require some preconditions, such as existing health accounts capacity and available health accounts estimates. On the basis of our experience in this study, the following recommendations are made for future work in this area:
1. The benefits for child health analyses and child health resource tracking of being able to exploit existing and internationally comparable health accounts estimates of total national health spending have been unequivocally demonstrated. It should be a high priority to support development of health accounts capacity in developing countries, and to encourage use of the OECD SHA, which is the WHO-recommended statistical standard for international reporting. The existence of such capacity will substantially reduce the costs involved in generating routine estimates of resource flows for child health at the country level.
2. If the global interest requires that child health resource flows be tracked on a regular basis, this should be done ensuring that child health accounts generation is incorporated as part of the routine work of national health accounts agencies. If this is done, so that such agencies know that they must produce such estimates every one or two years, then the cost of updating such estimates will be substantially reduced.
3. The utility of incorporating a financing sources (FS) dimension in this type of analysis should be reviewed more carefully. Child health expenditure tracking requires the identification of expenditures by functional purpose. Such identification makes sense when expenses are incurred by financing agents, but is conceptually not so simple when attempted at the level of financing sources to financing agent financial flows. If it is necessary to track donor financing, this can be done more usefully as a sub-analysis, instead of using the FS approach. If the FS approach is to be used for these types of disease/condition based sub-accounts, then there remains a major need to better define and establish the required accounting rules to support such analyses.
Institute for Health Policy & Data International March 2006 38
Child Health Accounts – Bangladesh & Sri Lanka
Institute for Health Policy & Data International March 2006 39
APPENDIX: CHILD HEALTH ACCOUNTS TABLES
Table A.1: Child Health Expenditures, Bangladesh 1996/97 – 2001/02 ...................... 40 Table A.2: Child Health Expenditures, Sri Lanka 1990 – 2003 .................................... 41 Table B.1: Child health expenditure by source, Bangladesh 1996/97 – 2001/02 (Taka
million) .................................................................................................................. 42 Table B.2: Child health expenditure by source, Bangladesh 1996/97 – 2001/02 (%).. 42 Table B.3: Child health expenditure by source, Sri Lanka 1990 – 2003 (Rupees million)
.............................................................................................................................. 44 Table B.4: Child health expenditure by source, Sri Lanka 1990 – 2003 (%)................ 44 Table C.1: Child health expenditure by function, Bangladesh 1996/97 – 2001/02 (Taka
million) .................................................................................................................. 45 Table C.2: Child health expenditure by function, Bangladesh 1999/00 – 2001/02 (%) 46 Table C.3: Child health expenditure by function, Sri Lanka 1990 – 2003 (Rupees
million) .................................................................................................................. 47 Table C.4: Child health expenditure by function, Sri Lanka 1990 – 2003 (%).............. 48 Table D.1: Total child health expenditures by source and function, Bangladesh
1999/2000 (Taka million) ...................................................................................... 49 Table D.2: Total child health expenditures by source and function, Sri Lanka 2000
(Rupees million) .................................................................................................... 50 Table E.1: Child health expenditure by provider, Sri Lanka 1990 – 2003 (Rupees
million) .................................................................................................................. 51 Table E.2: Child health expenditure by provider, Sri Lanka 1990 – 2003 (Rupees
million) .................................................................................................................. 51 Table F.1: Total child health expenditures by source and provider, Bangladesh
1999/2000 (Taka million) ...................................................................................... 52 Table F.2: Total child health expenditures by source and provider, Sri Lanka 2000
(Rupees million) .................................................................................................... 53

Child Health Accounts – Bangladesh & Sri Lanka
Table A.1: Child Health Expenditures, Bangladesh 1996/97 – 2001/02 Fiscal Year 1996/97 1997/98 1998/99 1999/00 2000/01 2001/02
Totals (Taka million)Child Health Expenditure (CHE) 6,318 7,072 7,839 8,640 9,482 10,429Total Current Expenditure on Health (TCHE) 50,749 57,043 63,337 69,877 75,158 82,881Total Expenditure on Health (TEH) 53,037 59,438 65,838 72,485 78,225 85,301
RatiosChild Health Expenditure (% of TCHE) 12.4% 12.4% 12.4% 12.4% 12.6% 12.6%Child Health Expenditure (% of TEH) 11.9% 11.9% 11.9% 11.9% 12.1% 12.2%
Child Health Expenditures per childTaka 403 444 485 527 566 610US dollars 9.8 9.8 10.1 10.5 10.5 10.7
Child Health Expenditures per capitaTaka 51 56 62 67 73 79US dollars 1.2 1.2 1.3 1.3 1.4 1.4
GeneralPopulation (millions) 124.3 125.5 126.3 128.1 129.9 131.6Child population < 5 years (millions) 15.7 15.9 16.2 16.4 16.8 17.1Child population < 5 years (%) 12.6 12.7 12.8 12.8 12.9 13.0GDP current market price (Taka billion) 1,807 2,002 2,197 2,371 2,535 2,732GDP per capita (US dollars) 494 547 583 614 686 754
Memorandum item Exchange rate (Taka per US$) 41.1 45.3 48.1 50.3 54.0 57.0
Institute for Health Policy & Data International March 2006 40

Child Health Accounts – Bangladesh & Sri Lanka
Table A.2: Child Health Expenditures, Sri Lanka 1990 – 2003
1990 1991 1992 1993 1994 1995 1996 1997 1998 1999 2000 2001 2002 2003
Totals (Rupees million)Child Health Expenditure (CHE) 480 472 543 637 632 776 917 1,040 1,237 1,301 1,662 1,845 2,220 2,469Total Current Expenditure on Health (TCHE 8,742 10,061 11,615 13,206 15,768 19,089 21,948 25,457 29,016 32,981 38,546 44,122 51,337 55,650Total Expenditure on Health (TEH) 10,563 11,348 13,802 14,883 17,506 21,554 25,127 28,699 35,106 38,584 44,030 49,573 56,133 62,811
RatiosChild Health Expenditure (% of TCHE) 5.5% 4.7% 4.7% 4.8% 4.0% 4.1% 4.2% 4.1% 4.3% 3.9% 4.3% 4.2% 4.3% 4.4%Child Health Expenditure (% of TEH) 4.5% 4.2% 3.9% 4.3% 3.6% 3.6% 3.7% 3.6% 3.5% 3.4% 3.8% 3.7% 4.0% 3.9%
Child Health Expenditures per childRupees 294 289 333 392 390 479 568 646 771 812 1,041 1,158 1,394 1,551US dollars 7.3 7.0 7.6 8.1 7.9 9.4 10.3 10.9 11.9 11.5 13.7 13.0 14.6 16.1
Child Health Expenditures per capitaRupees 30 29 33 38 37 45 52 59 69 71 90 98 117 128US dollars 0.7 0.7 0.7 0.8 0.7 0.9 0.9 1.0 1.1 1.0 1.2 1.1 1.2 1.3
GeneralPopulation (millions) 16.267 16.448 16.631 16.850 17.089 17.280 17.490 17.702 17.935 18.208 18.467 18.732 19.007 19.252Child population < 5 years (millions) 1.635 1.636 1.632 1.627 1.623 1.619 1.615 1.610 1.606 1.602 1.597 1.593 1.592 1.592Child population < 5 years (%) 10.1% 9.9% 9.8% 9.7% 9.5% 9.4% 9.2% 9.1% 9.0% 8.8% 8.6% 8.5% 8.4% 8.3%GDP (Rupees million) 321,784 372,345 425,283 499,565 579,084 667,772 768,128 890,272 1,017,986 1,105,963 1,257,636 1,407,398 1,582,655 1,760,280GDP per capita (US dollars) 494 547 583 614 686 754 795 853 879 863 899 841 870 947
Memorandum itemExchange rate 40.06 41.37 43.83 48.25 49.42 51.25 55.27 58.99 64.59 70.39 75.77 89.36 95.66 96.52
Institute for Health Policy & Data International March 2006 41
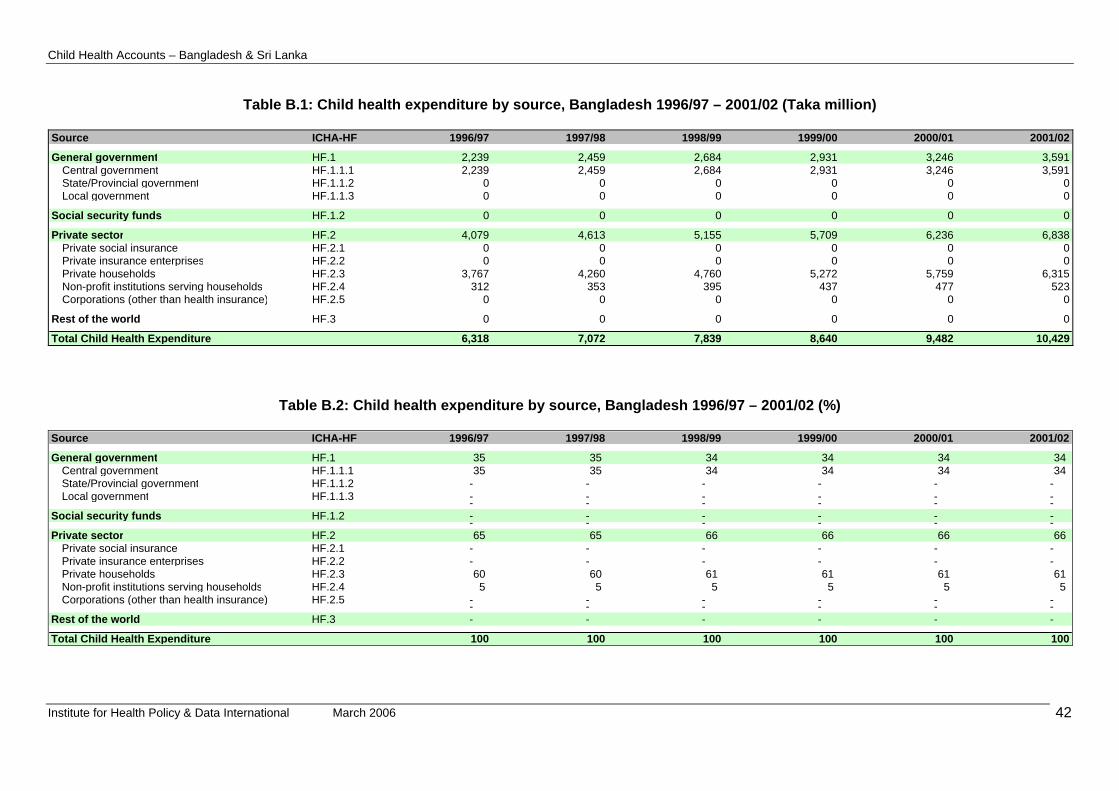
Child Health Accounts – Bangladesh & Sri Lanka
Table B.1: Child health expenditure by source, Bangladesh 1996/97 – 2001/02 (Taka million)
Source ICHA-HF 1996/97 1997/98 1998/99 1999/00 2000/01 2001/02
General government HF.1 2,239 2,459 2,684 2,931 3,246 3,591Central government HF.1.1.1 2,239 2,459 2,684 2,931 3,246 3,591State/Provincial government HF.1.1.2 0 0 0 0 0 0Local government HF.1.1.3 0 0 0 0 0 0
Social security funds HF.1.2 0 0 0 0 0 0
Private sector HF.2 4,079 4,613 5,155 5,709 6,236 6,838Private social insurance HF.2.1 0 0 0 0 0 0Private insurance enterprises HF.2.2 0 0 0 0 0 0Private households HF.2.3 3,767 4,260 4,760 5,272 5,759 6,315Non-profit institutions serving households HF.2.4 312 353 395 437 477 523Corporations (other than health insurance) HF.2.5 0 0 0 0 0 0
Rest of the world HF.3 0 0 0 0 0 0
Total Child Health Expenditure 6,318 7,072 7,839 8,640 9,482 10,429
Table B.2: Child health expenditure by source, Bangladesh 1996/97 – 2001/02 (%)
Source ICHA-HF 1996/97 1997/98 1998/99 1999/00 2000/01 2001/02
General government HF.1 35 35 34 34 34 34 Central government HF.1.1.1 35 35 34 34 34 34 State/Provincial government HF.1.1.2 - - - - - - Local government HF.1.1.3 - - - - - - - - - - - -
Social security funds HF.1.2 - - - - - - - - - - - - Private sector HF.2 65 65 66 66 66 66
Private social insurance HF.2.1 - - - - - - Private insurance enterprises HF.2.2 - - - - - - Private households HF.2.3 60 60 61 61 61 61 Non-profit institutions serving households HF.2.4 5 5 5 5 5 5 Corporations (other than health insurance) HF.2.5 - - - - - - - - - - - -
Rest of the world HF.3 - - - - - -
Total Child Health Expenditure 100 100 100 100 100 100
Institute for Health Policy & Data International March 2006 42

Child Health Accounts – Bangladesh & Sri Lanka
Institute for Health Policy & Data International March 2006 43

Child Health Accounts – Bangladesh & Sri Lanka
Table B.3: Child health expenditure by source, Sri Lanka 1990 – 2003 (Rupees million) Source ICHA-HF 1990 1991 1992 1993 1994 1995 1996 1997 1998 1999 2000 2001 2002 2003
General government HF.1 249 195 233 279 230 307 374 416 499 455 700 732 923 1,021Central government HF.1.1.1 119 60 80 100 30 93 137 168 190 137 334 320 379 305State/Provincial government HF.1.1.2 127 131 148 174 194 207 227 240 294 303 342 385 512 679Local government HF.1.1.3 3 4 4 5 6 7 9 8 14 15 24 28 32 37
Social security funds HF.1.2 0 0 0 0 0 0 0 0 0 0 0 0 0 0
Private sector HF.2 231 277 310 358 403 468 543 624 739 846 963 1,113 1,297 1,448Private social insurance HF.2.1 0 0 0 0 0 0 0 0 0 0 0 0 0 0Private insurance enterprises HF.2.2 4 5 6 8 10 12 17 19 20 38 53 49 51 53Private households HF.2.3 177 213 240 274 306 359 417 501 604 647 749 890 1,093 1,236Non-profit institutions serving households HF.2.4 2 3 3 3 4 4 5 6 7 7 8 10 11 12Corporations (other than health insurance) HF.2.5 48 56 62 73 82 93 104 98 108 153 153 164 142 148
Rest of the world HF.3 0 0 0 0 0 0 0 0 0 0 0 0 0 0
480 472 543 637 632 776 917 1,040 1,237 1,301 1,662 1,845 2,220 2,469TOTAL CHILD HEALTH EXPENDITURE
Table B.4: Child health expenditure by source, Sri Lanka 1990 – 2003 (%) Source ICHA-HF 1990 1991 1992 1993 1994 1995 1996 1997 1998 1999 2000 2001 2002 2003
General government HF.1 52 41 43 44 36 40 41 40 40 35 42 40 42 41 Central government HF.1.1.1 25 13 15 16 5 12 15 16 15 11 20 17 17 12 State/Provincial government HF.1.1.2 26 28 27 27 31 27 25 23 24 23 21 21 23 28 Local government HF.1.1.3 1 1 1 1 1 1 1 1 1 1 1 1 1 1
Social security funds HF.1.2 - - - - - - - - - - - - - -
Private sector HF.2 48 59 57 56 64 60 59 60 60 65 58 60 58 59 Private social insurance HF.2.1 - - - - - - - - - - - - - - Private insurance enterprises HF.2.2 1 1 1 1 2 2 2 2 2 3 3 3 2 2 Private households HF.2.3 37 45 44 43 48 46 45 48 49 50 45 48 49 50 Non-profit institutions serving households HF.2.4 0 1 1 1 1 1 1 1 1 1 0 1 0 0 Corporations (other than health insurance) HF.2.5 10 12 11 11 13 12 11 9 9 12 9 9 6 6
Rest of the world HF.3 - - - - - - - - - - - - - -
100 100 100 100 100 100 100 100 100 100 100 100 100 100 TOTAL CHILD HEALTH EXPENDITURE Institute for Health Policy & Data International March 2006 44
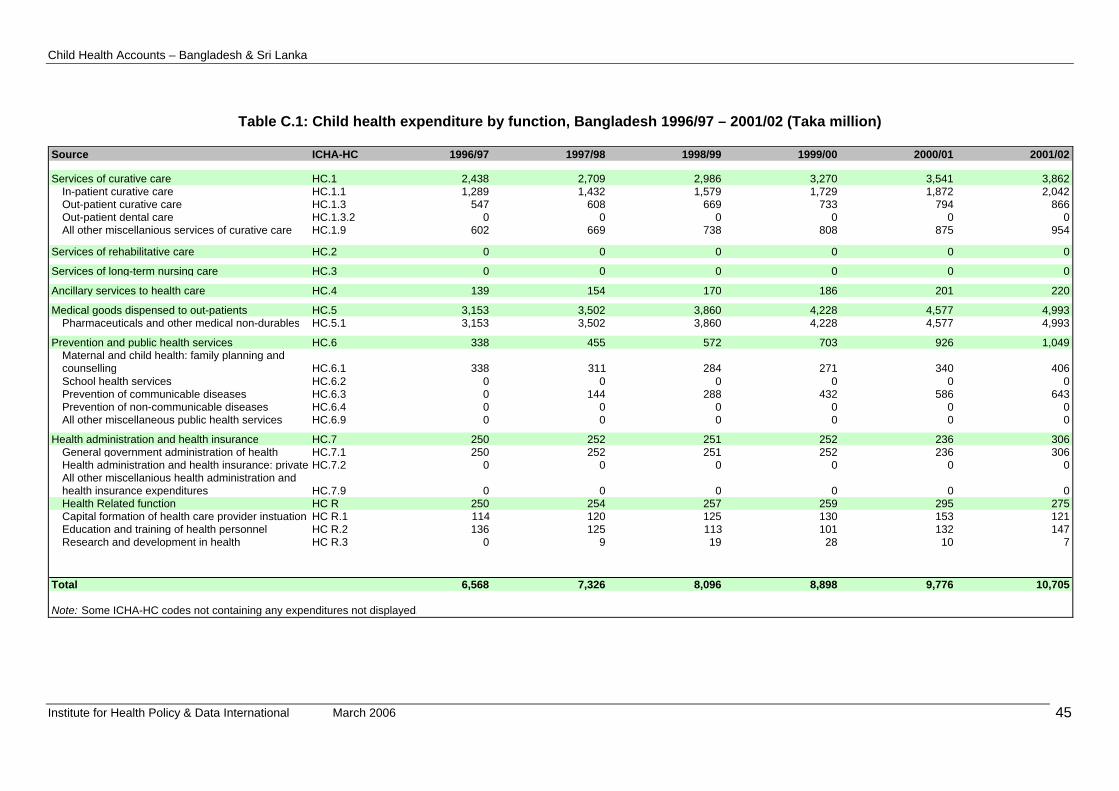
Child Health Accounts – Bangladesh & Sri Lanka
Table C.1: Child health expenditure by function, Bangladesh 1996/97 – 2001/02 (Taka million)
Source ICHA-HC 1996/97 1997/98 1998/99 1999/00 2000/01 2001/02
Services of curative care HC.1 2,438 2,709 2,986 3,270 3,541 3,862In-patient curative care HC.1.1 1,289 1,432 1,579 1,729 1,872 2,042Out-patient curative care HC.1.3 547 608 669 733 794 866Out-patient dental care HC.1.3.2 0 0 0 0 0 0All other miscellanious services of curative care HC.1.9 602 669 738 808 875 954
Services of rehabilitative care HC.2 0 0 0 0 0 0
Services of long-term nursing care HC.3 0 0 0 0 0 0
Ancillary services to health care HC.4 139 154 170 186 201 220
Medical goods dispensed to out-patients HC.5 3,153 3,502 3,860 4,228 4,577 4,993Pharmaceuticals and other medical non-durables HC.5.1 3,153 3,502 3,860 4,228 4,577 4,993
Prevention and public health services HC.6 338 455 572 703 926 1,049Maternal and child health: family planning and counselling HC.6.1 338 311 284 271 340 406School health services HC.6.2 0 0 0 0 0 0Prevention of communicable diseases HC.6.3 0 144 288 432 586 643Prevention of non-communicable diseases HC.6.4 0 0 0 0 0 0All other miscellaneous public health services HC.6.9 0 0 0 0 0 0
Health administration and health insurance HC.7 250 252 251 252 236 306General government administration of health HC.7.1 250 252 251 252 236 306Health administration and health insurance: private HC.7.2 0 0 0 0 0 0All other miscellanious health administration and health insurance expenditures HC.7.9 0 0 0 0 0 0Health Related function HC R 250 254 257 259 295 275Capital formation of health care provider instuation HC R.1 114 120 125 130 153 121Education and training of health personnel HC R.2 136 125 113 101 132 147Research and development in health HC R.3 0 9 19 28 10 7
Total 6,568 7,326 8,096 8,898 9,776 10,705
Note: Some ICHA-HC codes not containing any expenditures not displayed.
Institute for Health Policy & Data International March 2006 45

Child Health Accounts – Bangladesh & Sri Lanka
Table C.2: Child health expenditure by function, Bangladesh 1999/00 – 2001/02 (%) Source ICHA-HC 1996/97 1997/98 1998/99 1999/00 2000/01 2001/02
Services of curative care HC.1 37 37 37 37 36 36In-patient curative care HC.1.1 20 20 20 19 19 19Out-patient curative care HC.1.3 8 8 8 8 8 8Out-patient dental care HC.1.3.2 0 0 0 0 0 0All other miscellanious services of curative care HC.1.9 9 9 9 9 9 9
Services of rehabilitative care HC.2 0 0 0 0 0 0
Services of long-term nursing care HC.3 0 0 0 0 0 0
Ancillary services to health care HC.4 2 2 2 2 2 2
Medical goods dispensed to out-patients HC.5 48 48 48 48 47 47Pharmaceuticals and other medical non-durables HC.5.1 48 48 48 48 47 47
Prevention and public health services HC.6 5 6 7 8 9 10Maternal and child health: family planning and counselling HC.6.1 5 4 4 3 3 4School health services HC.6.2 0 0 0 0 0 0Prevention of communicable diseases HC.6.3 0 2 4 5 6 6Prevention of non-communicable diseases HC.6.4 0 0 0 0 0 0All other miscellaneous public health services HC.6.9 0 0 0 0 0 0
Health administration and health insurance HC.7 4 3 3 3 2 3General government administration of health HC.7.1 4 3 3 3 2 3Health administration and health insurance: private HC.7.2 0 0 0 0 0 0All other miscellanious health administration and health insurance expenditures HC.7.9 0 0 0 0 0 0Health Related function HC R 4 3 3 3 3 3Capital formation of health care provider instuation HC R.1 2 2 2 1 2 1Education and training of health personnel HC R.2 2 2 1 1 1 1Research and development in health HC R.3 0 0 0 0 0 0
Total 100 100 100 100 100 100
Notes: Some ICHA-HC codes not containing any expenditures not displayed. Some columns may not add upto 100 owing to rounding
Institute for Health Policy & Data International March 2006 46

Child Health Accounts – Bangladesh & Sri Lanka
Table C.3: Child health expenditure by function, Sri Lanka 1990 – 2003 (Rupees million)
Source ICHA-HC
Services of curative care HC.1In-patient curative care HC.1.1Out-patient curative care HC.1.3
Services of rehabilitative care HC.2In-patient rehabilitative care HC.2.1Out-patient rehabilitative care HC.2.3Services of rehabilitative home care HC.2.4All other miscellanious services of rehabilitative care HC.2.9
Services of long-term nursing care HC.3
Ancillary services to health care HC.4Clinical laboratory HC.4.1Diagnostic imaging HC.4.2Patient transport and emergency rescue HC.4.3
Medical goods dispensed to out-patients HC.5Pharmaceuticals and other medical non- HC.5.1Glasses and other vision products HC.5.2.1Orthopaedic appliances and other prosthetics HC.5.2.2All other miscellanious medical goods dispensed to outpatients HC.5.9
Prevention and public health services HC.6Maternal and child health: family planning and counselling HC.6.1School health services HC.6.2Prevention of communicable diseases HC.6.3Prevention of non-communicable diseases HC.6.4All other miscellaneous public health services HC.6.9
Health administration and health insurance HC.7General government administration of health HC.7.1Health administration and health insurance: private HC.7.2All other miscellanious health administration and health insurance expenditures HC.7.9
Total
Note: Some ICHA-HC codes not containing any expenditures no
1990 1991 1992 1993 1994 1995 1996 1997 1998 1999 2000 2001 2002 2003
219 242 285 323 371 442 502 572 700 771 825 940 1,087 1,13466 80 97 111 135 168 195 237 285 335 383 421 470 517
153 161 188 212 237 275 308 334 414 436 442 518 617 617
3 3 3 3 5 5 6 7 6 8 8 11 13 153 3 3 3 5 5 6 6 6 8 8 11 13 150 0 0 0 0 0 0 0 0 0 0 0 0 00 0 0 0 0 0 0 0 0 0 0 0 0 0
0 0 0 0 0 0 0 0 0 0 0 0 0 0
0 0 0 0 0 0 0 0 0 0 0 0 0 0
15 20 19 19 12 27 33 38 45 54 62 74 86 9913 17 17 17 10 22 27 30 36 43 49 59 68 78
2 2 2 3 2 3 4 5 6 7 8 10 12 130 0 0 0 0 1 2 2 3 3 4 5 7 8
75 95 108 123 152 172 195 226 248 288 358 417 506 55970 88 97 111 138 154 177 204 225 264 329 387 471 524
1 1 1 2 2 2 3 3 3 4 4 5 6 60 0 0 0 0 0 0 0 1 1 1 1 1 1
4 6 9 10 12 15 15 18 19 20 24 25 28 28
165 109 124 131 84 122 170 177 226 153 366 341 466 602
110 24 37 17 48 75 102 133 175 71 302 297 367 5150 0 0 0 0 0 0 0 0 0 0 0 0 0
54 84 84 111 35 38 65 40 47 78 64 43 98 860 0 0 0 0 0 0 0 0 0 0 0 0 02 2 3 3 1 8 3 5 4 3 1 1 1 1
4 4 4 38 7 7 10 20 13 26 43 63 61 604 3 4 37 7 6 10 20 13 25 43 63 61 59
0 0 0 0 0 0 0 0 0 0 0 0 0 0
0 0 0 0 0 0 0 0 0 0 0 0 0 0
480 472 543 637 632 776 917 1,040 1,237 1,301 1,662 1,845 2,220 2,469
ot displayed
Institute for Health Policy & Data International March 2006 47

Child Health Accounts – Bangladesh & Sri Lanka
Table C.4: Child health expenditure by function, Sri Lanka 1990 – 2003 (%) Source ICHA-HC
Services of curative care HC.1In-patient curative care HC.1.1Out-patient curative care HC.1.3
Services of rehabilitative care HC.2In-patient rehabilitative care HC.2.1Out-patient rehabilitative care HC.2.3Services of rehabilitative home care HC.2.4All other miscellanious services of rehabilitative care HC.2.9
Services of long-term nursing care HC.3
Ancillary services to health care HC.4Clinical laboratory HC.4.1Diagnostic imaging HC.4.2Patient transport and emergency rescue HC.4.3
Medical goods dispensed to out-patients HC.5Pharmaceuticals and other medical non- HC.5.1Glasses and other vision products HC.5.2.1Orthopaedic appliances and other prosthetics HC.5.2.2All other miscellanious medical goods dispensed to outpatients HC.5.9
Prevention and public health services HC.6Maternal and child health: family planning and counselling HC.6.1School health services HC.6.2Prevention of communicable diseases HC.6.3Prevention of non-communicable diseases HC.6.4All other miscellaneous public health services HC.6.9
Health administration and health insurance HC.7General government administration of health HC.7.1Health administration and health insurance: private HC.7.2All other miscellanious health administration and health insurance expenditures HC.7.9
Total
Note: Some ICHA-HC codes not containing any expenditures no
1990 1991 1992 1993 1994 1995 1996 1997 1998 1999 2000 2001 2002 2003
46 51 53 51 59 57 55 55 57 59 50 51 49 4614 17 18 17 21 22 21 23 23 26 23 23 21 2132 34 35 33 37 35 34 32 33 34 27 28 28 25
1 1 1 1 1 1 1 1 1 1 0 1 1 11 1 1 1 1 1 1 1 1 1 0 1 1 10 0 0 0 0 0 0 0 0 0 0 0 0 00 0 0 0 0 0 0 0 0 0 0 0 0 0
0 0 0 0 0 0 0 0 0 0 0 0 0 0
0 0 0 0 0 0 0 0 0 0 0 0 0 0
3 4 3 3 2 4 4 4 4 4 4 4 4 43 4 3 3 2 3 3 3 3 3 3 3 3 30 1 0 0 0 0 0 0 1 1 0 1 1 10 0 0 0 0 0 0 0 0 0 0 0 0 0
16 20 20 19 24 22 21 22 20 22 22 23 23 2314 19 18 17 22 20 19 20 18 20 20 21 21 21
0 0 0 0 0 0 0 0 0 0 0 0 0 00 0 0 0 0 0 0 0 0 0 0 0 0 0
1 1 2 2 2 2 2 2 2 2 1 1 1 1
34 23 23 21 13 16 19 17 18 12 22 18 21 24
23 5 7 3 8 10 11 13 14 5 18 16 17 210 0 0 0 0 0 0 0 0 0 0 0 0 0
11 18 15 17 6 5 7 4 4 6 4 2 4 30 0 0 0 0 0 0 0 0 0 0 0 0 00 0 1 0 0 1 0 0 0 0 0 0 0 0
1 1 1 6 1 1 1 2 1 2 3 3 3 21 1 1 6 1 1 1 2 1 2 3 3 3 2
0 0 0 0 0 0 0 0 0 0 0 0 0 0
0 0 0 0 0 0 0 0 0 0 0 0 0 0
100 100 100 100 100 100 100 100 100 100 100 100 100 100
ot displayed
Institute for Health Policy & Data International March 2006 48

Child Health Accounts – Bangladesh & Sri Lanka
Table D.1: Total child health expenditures by source and function, Bangladesh 1999/2000 (Taka million)
HF.1 HF.1.1 HF.1.2 HF.2 HF.2.3 HF.2.4 HF.2.5HF.2.1 HF.2.2
Private social insurance schemes
Other private insurance
Services of curative and rehabilitative care HC.1-HC.2 3,270 2,324 2,324 - 946 - 858 88 Services of long-term nursing care HC.3 - - - - - - - Ancillary services to health care HC.4 186 - - 186 - 186 - Medical goods dispensed to out-patients HC.5 4,228 - - 4,228 - 4,228 -
HC.5.1 4,228 - - 4,228 - 4,228 -
HC.5.2 - - - - - - - Personal health care services and goods HC.1 - HC.5 7,684 2,324 2,324 - 5,360 - 5,272 88
- - - - - Prevention and public health services HC.6 703 354 354 349 - - 349 Health administration and health insurance HC.7 252 252 252 - - - - Total Current Expenditure on health 8,639 2,930 2,930 - 5,709 - - - 5,272 437 - Gross capital formation HC R.1 130 130 130 - - - - Total Expenditure on health 8,769 3,060 3,060 - 5,709 - - - 5,272 437 -
- - - - - Memorandum items: Further health related functions - - - - - Education and training of health personnel HC R.2 101 101 101 - - - - Research and development in health HC R.3 28 28 28 - - - - Food, Hygiene and drinking water control HC R.4 - - - - - - - Environmental health HC R.5 - - - - - - -
HC R.6 - - - - - - - Administration and provision of health - related cash HC R.7 - - - - - - -
Total National Health Expenditure 8,898 3,189 3,189 - 5,709 - 5,272 437
Therapeutic appliances and other medical durables
Pharmaceuticals and other medical non-durables
Private household
out-of-pocket payments
Non-profit institutions (other than
social insurance)
Total expenditure
HF.2.1 + HF.2.2
General government
General government (excl. social
security)
Social security funds
Corporations (other than
health insurance)
Administration and provision of social services in kind to assist living with disease and impairment
Private sector
Private insurance
Institute for Health Policy & Data International March 2006 49
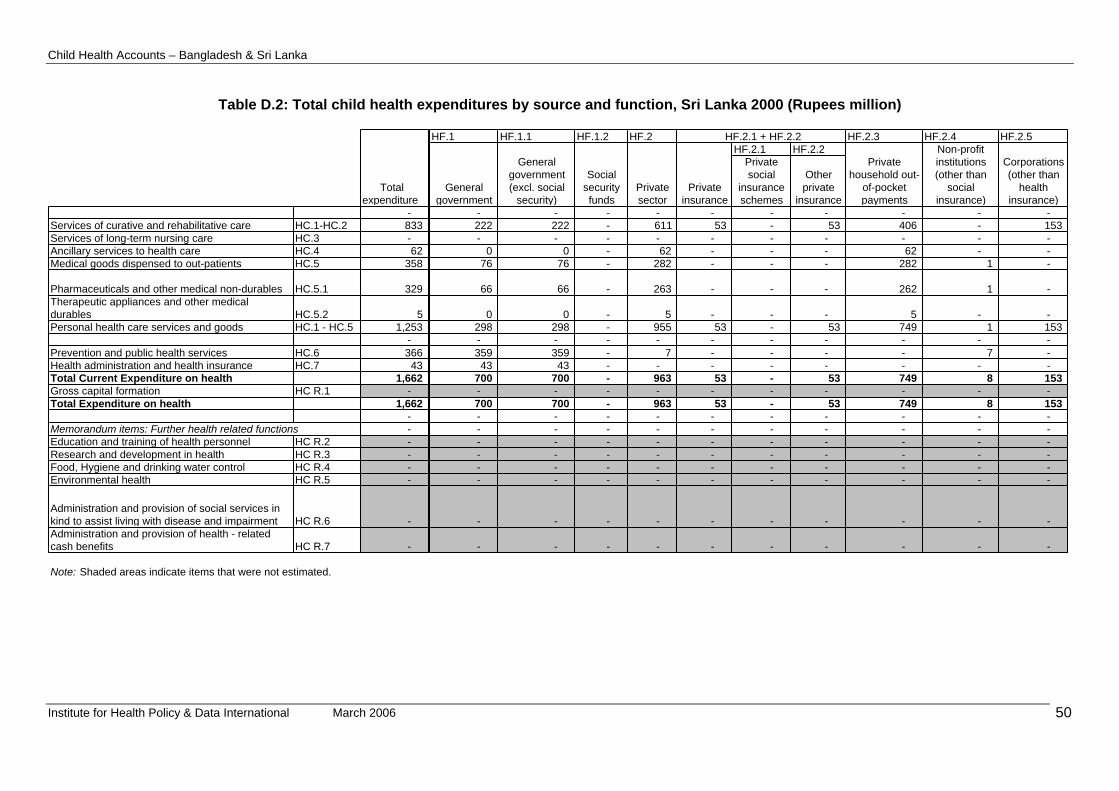
Child Health Accounts – Bangladesh & Sri Lanka
Table D.2: Total child health expenditures by source and function, Sri Lanka 2000 (Rupees million)
- Services of curative and rehabilitative care HC.1-HC.2 833 Services of long-term nursing care HC.3 - Ancillary services to health care HC.4 62 Medical goods dispensed to out-patients HC.5 358
HC.5.1 329
HC.5.2 5 Personal health care services and goods HC.1 - HC.5 1,253
- Prevention and public health services HC.6 366 Health administration and health insurance HC.7 43 Total Current Expenditure on health 1,662 Gross capital formation HC R.1 - Total Expenditure on health 1,662
- Memorandum items: Further health related functions - Education and training of health personnel HC R.2 - Research and development in health HC R.3 - Food, Hygiene and drinking water control HC R.4 - Environmental health HC R.5 -
HC R.6 -
HC R.7 -
Note: Shaded areas indicate items that were not estimated.
Administration and provision of health - related cash benefits
Total expenditure
Administration and provision of social services in kind to assist living with disease and impairment
Pharmaceuticals and other medical non-durablesTherapeutic appliances and other medical durables
HF.1 HF.1.1 HF.1.2 HF.2 HF.2.3 HF.2.4 HF.2.5HF.2.1 HF.2.2
Private social
insurance schemes
Other private
insurance- - - - - - - - - - 222 222 - 611 53 - 53 406 - 153 - - - - - - - - - -
0 0 - 62 - - - 62 - - 76 76 - 282 - - - 282 1 -
66 66 - 263 - - - 262 1 -
0 0 - 5 - - - 5 - - 298 298 - 955 53 - 53 749 1 153 - - - - - - - - - - 359 359 - 7 - - - - 7 - 43 43 - - - - - - - -
700 700 - 963 53 - 53 749 8 153 - - - - - - - - - - 700 700 - 963 53 - 53 749 8 153 - - - - - - - - - - - - - - - - - - - - - - - - - - - - - - - - - - - - - - - - - - - - - - - - - - - - - - - - - - - -
- - - - - - - - - -
- - - - - - - - - -
HF.2.1 + HF.2.2
General government
General government (excl. social
security)
Social security funds
Private sector
Private insurance
Private household out-
of-pocket payments
Non-profit institutions (other than
social insurance)
Corporations (other than
health insurance)
Institute for Health Policy & Data International March 2006 50

Child Health Accounts – Bangladesh & Sri Lanka
Table E.1: Child health expenditure by provider, Sri Lanka 1990 – 2003 (Rupees million) Provider ICHA-HP
Hospitals HP.1Nursing and residential care facilities HP.2Providers of ambulatory health care HP.3Retail sale and other providers of medical goods HP.4Provision and administration of public health programmes HP.5General health administration and insurance HP.6Other industries HP.7Rest of the world HP.9
Total
1990 1991 1992 1993 1994 1995 1996 1997 1998 1999 2000 2001 2002 2003
115 128 154 170 207 264 300 350 428 475 516 579 667 6873 3 3 3 5 5 6 7 6 8 8 11 13 15
138 94 109 121 131 181 224 273 327 287 458 503 580 638
73 86 96 111 129 142 165 186 218 248 282 354 434 476
62 69 71 95 16 32 56 38 49 54 142 90 121 92
85 87 99 124 130 135 154 171 193 212 237 288 383 5414 4 10 11 12 16 12 14 16 16 18 18 20 190 0 1 1 1 1 0 1 0 0 1 1 2 1
480 472 543 637 632 776 917 1,040 1,237 1,301 1,662 1,845 2,220 2,469
Table E.2: Child health expenditure by provider, Sri Lanka 1990 – 2003 (Rupees million) Provider ICHA-HP
Hospitals HP.1Nursing and residential care facilities HP.2Providers of ambulatory health care HP.3Retail sale and other providers of medical goods HP.4Provision and administration of public health programmes HP.5General health administration and insurance HP.6Other industries HP.7Rest of the world HP.9
Total
1990 1991 1992 1993 1994 1995 1996 1997 1998 1999 2000 2001 2002 2003
24 27 28 27 33 34 33 34 35 37 31 31 30 281 1 1 1 1 1 1 1 1 1 0 1 1 1
29 20 20 19 21 23 24 26 26 22 28 27 26 26
15 18 18 17 20 18 18 18 18 19 17 19 20 19
13 15 13 15 3 4 6 4 4 4 9 5 5 4
18 19 18 19 21 17 17 16 16 16 14 16 17 221 1 2 2 2 2 1 1 1 1 1 1 1 10 0 0 0 0 0 0 0 0 0 0 0 0 0
100 100 100 100 100 100 100 100 100 100 100 100 100 100
Institute for Health Policy & Data International March 2006 51

ccounts – Bangladesh & Sri Lanka
Institute for Health Policy & Data International March 2006 52
Hospitals 1,200Nursing and residential care facilities
Providers of ambulatory health careOffices of physiciansOffices of dentistsOffices of other health practitioners - Out-patient care centresMedical and diagnostic laboratories - Providers of home health care servicesOther providers of ambulatory health
Retail sale and other providers of medical Dispensing chemists - All other sales of medical goods
Provision and administration of public health programmes
General health administration and insurance 32Government (excluding social insurance) 32Social security fundsOther social insuranceOther (private) insuranceAll other providers of health
Other industries (rest of the economy)Occupational health carePrivate householdsAll other secondary producers
Rest of the world
Health care goods and services by provider industry
Table F.1: Total child health expenditures by source and provider, Bangladesh 1999/2000 (Taka million)
TotalHF.1 HF.1.1 HF.1.2 HF.2 HF.2.1 + HF.2.2 HF.2.3 HF.2.4 HF.2.5 HF.3
current General Private HF.2.1 HF.2.2expenditure
on healthgovernment General
government (excl. social
security)
Social security funds
sector Private insurance
Private social
insurance
Other private
insurance
Private household out-
of-pocket payments
Non-profit organisations
(other than social ins.)
Corporations (other than
health insurance)
Rest of the world
HP.1 3,424 2,174 2,174 50 - 50 - HP.2
- - - - HP.3 994 - 994 - 994 HP.3.1 - - - - HP.3.2 - - - - HP.3.3 808 - 808 - 808 - HP.3.4 - - - - HP.3.5 186 - 186 - 186 - HP.3.6 - - - - HP.3.9 - - - - HP.4 4,228 - 4,228 - 4,228 HP.4.1 4,228 - 4,228 - 4,228 - HP.4.2-4.9 - - - - HP.5
- - - - HP.6 252 220 220 - - HP.6.1 252 220 220 - - - - HP.6.2 - - - - HP.6.3 - - - - HP.6.4 - - - - HP.6.9 - - - - HP.7 - - - - HP.7.1 - - - - HP.7.2 - - - - HP.7.9
- - - - HP.9 - - - -
Child Health A

ccounts – Bangladesh & Sri Lanka
Institute for Health Policy & Data International March 2006 53
Hospitals - Nursing and residential care facilities
- Providers of ambulatory health care -
Offices of physicians - Offices of dentists - Offices of other health practitioners - Out-patient care centres - Medical and diagnostic laboratories - Providers of home health care services - Other providers of ambulatory health -
Retail sale and other providers of medical - Dispensing chemists - All other sales of medical goods -
Provision and administration of public health programmes
- General health administration and insurance -
Government (excluding social insurance) - Social security funds - Other social insurance - Other (private) insurance - All other providers of health -
Other industries (rest of the economy) - Occupational health care - Private households - All other secondary producers
- Rest of the world -
Health care goods and services by provider industry
Table F.2: Total child health expenditures by source and provider, Sri Lanka 2000 (Rupees million)
TotalHF.1 HF.1.1 HF.1.2 HF.2 HF.2.1 + HF.2.2 HF.2.3 HF.2.4 HF.2.5 HF.3
current General Private HF.2.1 HF.2.2expenditure
on healthgovernment General
government (excl. social
security)
Social security funds
sector Private insurance
Private social
insurance
Other private
insurance
Private household out-
of-pocket payments
Non-profit organisations
(other than social ins.)
Corporations (other than
health insurance)
Rest of the world
HP.1 516 264 264 - 252 - - - 118 - 134 HP.2
8 8 8 - - - - - - - - HP.3 458 37 37 - 421 - - - 403 - 18 HP.3.1 359 - - - 359 - - - 341 - 18 HP.3.2 - - - - - - - - - - - HP.3.3 - - - - - - - - - - - HP.3.4 31 31 31 - - - - - - - - HP.3.5 - - - - - - - - - - - HP.3.6 - - - - - - - - - - - HP.3.9 11 7 7 - 4 - - - 4 - - HP.4 282 - - - 282 - - - 282 - - HP.4.1 263 - - - 263 - - - 263 - - HP.4.2-4.9 19 - - - 19 - - - 19 - - HP.5
142 142 142 - - - - - - - - HP.6 237 238 238 - 1- 53 - 53 53- - - HP.6.1 238 238 238 - - - - - - - - HP.6.2 1- - - - 1- - - - 1- - - HP.6.3 - - - - - - - - - - - HP.6.4 - - - - - 53 - 53 53- - - HP.6.9 - - - - - - - - - - - HP.7 18 10 10 - 8 - - - - 8 - HP.7.1 - - - - - - - - - - - HP.7.2 - - - - - - - - - - - HP.7.9
18 10 10 - 8 - - - - 8 - HP.9 1 1 1 - - - - - - - -
Child Health A

Child Health Accounts – Bangladesh & Sri Lanka
BIBLIOGRAPHY
Australian Institute of Health and Welfare. 2005. Health system expenditure on disease and injury in Australia, 2000-01. Second ed. Health and Welfare Expenditure Series. Number 21. Canberra, Australia: Australian Institute of Health and Welfare.
Data International. 2003. Bangladesh National Health Accounts, 1999-2001. Dhaka, Bangladesh: Health Economics Unit, Ministry of Health and Family Welfare.
Gwatkin, Davidson R., Shea Rutstein, Kiersten Johnson, Rohini Pande, and Adam Wagstaff. 2000. Socio-economic Differences in Health, Nutrition, and Population. Washington, D.C., USA: World Bank, HPN/Poverty Thematic Group.
Ministry of Health, and Institute of Policy Studies. 2002. Sri Lanka National Health Accounts: National Health Expenditures 1990-1999. Colombo: Ministry of Health and Institute of Policy Studies.
O'Donnell, Owen, Eddy van Doorslaer, Ravi P. Rannan-Eliya, Aparnaa Somanathan, Shiva Raj Adhikari, Deni Harbianto, Charu C. Garg, Piya Hanvoravongchai, Mohammed N. Huq, Anup Karan, Gabriel M. Leung, Chiu Wan Ng, Badri Raj Pande, Keith Tin, Kanjana Tisayaticom, Laksono Trisnantoro, Yuhui Zhang, and Yuxin Zhao. 2005. Who benefits from public spending on health care in Asia? Equitap Working Paper Number 3. May 2005. Colombo, Sri Lanka: Equitap Project.
OECD. 2000. A System of Health Accounts. Paris, France: Organisation for Economic Co-operation and Development.
OECD. 2005. Proposal for Procedures and Scope of SHA Data Collection under the Co-operation beween OECD, Eurostat and WHO. DELSA/HEA/HA(2005)1. Report presented to the 7th Meeting of Health Accounts Experts and Correspondents for Health Expenditure Data, held at the Chateau de la Muette, Paris, 29-30 September 2005. 20 September 2005. Paris, France: OECD.
Office for National Statistics. 2004. SHA Guidelines: Practical guidance for implementing A System of Health Accounts in the EU. London, UK: Office for National Statistics and Eurostat. [www.icon-statistics.net/Phare2002/ documents/SHA%20Guidelines1.pdf].
Rannan-Eliya, Ravi P. 2005. National Health Accounts Estimation Methods: Household Out-of-pocket Spending in Private Expenditure. Unpublished monograph prepared for WHO NHA Unit. Draft dated 22 August 2005. Geneva, Switzerland: WHO.
Rannan-Eliya, Ravi P., Peter Berman, Eltigani E. Eltigani, W. Indralal de Silva, Aparnaa Somanathan, and Varuni Sumathiratne. 2000. Expenditures for Reproductive Health Services in Egypt and Sri Lanka. June 2000. Washington, D.C., USA: The POLICY Project, The Futures Group International, Inc.
Rannan-Eliya, Ravi P., and Aparnaa Somanathan. 2003. The Bangladesh Health Facility Efficiency Study. In Health Policy Research in Asia: Guiding Reforms and Building Capacity, edited by A. S. Yazbeck and D. H. Peters. Washington, DC, USA: World Bank.
Samarasinghe, Daya, and John Akin. 1995. Report of the Health Strategy and Financing Study. Unpublished draft report for study undertaken at the request of the Ministry of Health, Sri Lanka with the support of the World Bank. Colombo, Sri Lanka: World Bank.
Somanathan, Aparnaa. 1998. Unit Cost Analysis of Public and Private Health Facilities in Sri Lanka in 1992. IPS HPP Occasional Papers No. 6. Colombo, Sri Lanka: Institute of Policy Studies.
Somanathan, Aparnaa, Kara Hanson, Tamara Dorabawila, and Bilesha Perera. 2000. Operating Efficiency in Public Sector Health Facilities in Sri Lanka:
Institute for Health Policy & Data International March 2006 54

Child Health Accounts – Bangladesh & Sri Lanka
Measurement and Institutional Determinants of Performance. Small Applied Research Paper No. 12. August 2000. Bethesda, MD, USA: Partnerships for Health Reform, Abt Associates Inc.
Somanathan, Aparnaa, Ravi P. Rannan-Eliya, and Priyanka Jayawardena. Forthcoming. Distribution of maternal and child health services in Sri Lanka. Equitap Working Paper. Forthcoming. Colombo, Sri Lanka: Equitap Project.
van Doorslaer, Eddy, Owen O'Donnell, Aparnaa Somanathan, Ravi P. Rannan-Eliya, Charu C. Garg, Piya Hanvoravongchai, Alejandro N. Herrin, Mohammed Nazmul Huq, Gabriel M. Leung, Jui-fen Rachel Lu, Badri Pande, Rachel Racelis, Sihai Tao, Keith Tin, Chitpranee Visasvid, Bong-Min Yang, and Yuxin Zhao. 2005. Paying for health care in Asia: Catastrophic and poverty impact. Equitap Working Paper Number 2. Colombo, Sri Lanka: Equitap Project.
World Health Organization. 2003. Guide to producing national health accounts: with special applications for low-income and middle-income countries. Geneva, Switzerland: World Health Organization.
Institute for Health Policy & Data International March 2006 55