Embed Size (px)
Citation preview

41
COUNTRY STUDIES ON BANGLADESH, NEPAL AND SRI LANKA
Chapter 3CONCLUSION
The three national studies on Bangladesh, Nepal and Sri Lanka covering plasticsindustry, agro-industry (coffee and ginger products) and industrial rubber and
electronics products sectors strongly emphasized that SMEs in South Asia, despitehaving tremendous potential for growth and employment creation, were still ina precarious situation. Perennial problems such as a lack of financing, inadequateinfrastructures, inaccessibility of public services and inadequate market intelligencewere still major constraints hindering SMEs in South Asia. Such problems were furtheraggravated due to a lack of information on the markets, technological backwardness,inadequacy of human resources (both managerial and technical) and an intensecompetition coming from large domestic and foreign enterprises as a result of opennessand economic liberalization measures.
The studies emphasize changing global and regional economic scenarios,showing the emergence of growing networks of industrial production processes. Thesenational and international industrial production networks, which are typically controlledby transnational corporations (TNCs), have offered SMEs from different countries andproduct groups an opportunity to form global (and regional) value chains. However,to capitalize on such opportunity, SMEs would require strong support from theGovernments as well as SME-related institutions. The studies further emphasize thatindividual firms seeking to establish partnerships in global value chains shouldunderstand the governance of specific value chain processes and structures. Asinternational trade is largely undertaken by global firms and since the leading firms,often TNCs are the key decision makers managing the global production systems andtrade, they should be the ones influencing the participation of smaller firms in globalvalue chains. It is most desirable that the structure of a specific value chain andcharacteristics of lead firms are fully understood.
It is an established fact that a product’s quality and value depends not onlyon innovations in production process but also on other improvements, such as creatingnew products, developing marketing skills to serve different customers and variousmarkets, and increasing capacity to introduce new products into international anddomestic markets. To reach these goals, SMEs should be provided with support frompublic agencies and industry associations. In the absence of such support, SMEs inSouth Asia would not be able to establish effective value chain connections at local,regional and global levels. Therefore, the studies focused on the Governments’ leading

42
STUDIES IN TRADE AND INVESTMENT 70
role in facilitating SMEs’ growth by providing the necessary support for export-orientedSMEs in forming strong partnerships in global value chains.
Similarly, to help a subregional action programme succesful, some backgroundstudies should be undertaken and the required technical assistance should be provided.It is expected that national Governments would initiate actions as soon as possible.10
The regional actions could be undertaken by various multilateral and regional donorsinterested in promoting trade and helping South Asian nations in economicdevelopment and poverty reduction efforts. Well-articulated and thorough action planswould still go a long way in the developing and promoting the products considered inthis publication. The challenges to action plan implementation include managing therequired resources, creating synergies among stakeholders, government agencies, civilsociety and private sector and coordinating and harmonizing development partners’support.
As a conclusion, the authors would like to suggest two main points. First, basedon the studies and action plans the participating Governments should take the lead inengaging independent market development facilitators who understand targetedforeign markets and international marketing, which are not fully covered by thispublication, to formulate sector-specific policies, outline an intervention scheme andimplement both. Second, the global value chain approach should also be used for otherproducts/sectors with export potential in South Asia and in other developing subregionsin Asia and the Pacific (e.g., Central Asia and the Greater Mekong Subregion11), whereSMEs could play a greater role in economic development than they presently do.
10 In this connection, the Government of Bangladesh recognized a potential of the plastics industry,which provides opportunities for backward- and forward-linkages as well as for exports and foreigncurrency earnings. As suggested in the national study, the industry was included in the nationalindustrial policy as one of the 18 thrust sectors (DCCI 2009).11 The Greater Mekong Subregion comprises Cambodia, Lao People’s Democratic Republic,Myanmar, Thailand, Viet Nam and two provinces of China (Yunnan and Guangxi).

43
COUNTRY STUDIES ON BANGLADESH, NEPAL AND SRI LANKA
Annex I
Country Study on Bangladeshusing Global Value Chain Analysis:
THE PLASTICS INDUSTRY

44
STUDIES IN TRADE AND INVESTMENT 70

45
COUNTRY STUDIES ON BANGLADESH, NEPAL AND SRI LANKA
Contents
Page
List of figures ............................................................................................................................. 46
List of tables ............................................................................................................................... 46
List of boxes ............................................................................................................................... 46
1. Introduction ................................................................................................................... 471.1. Objectives of the study .................................................................................... 481.2. Methodology ....................................................................................................... 481.3. Data collection and data sources ................................................................. 491.4. Limitations ............................................................................................................ 50
2. An Overview of the Plastics Industry ................................................................. 502.1. Global plastics industry .................................................................................. 502.2. The plastics industry in Bangladesh ............................................................ 522.3. Import trends ...................................................................................................... 532.4. Export trends ....................................................................................................... 55
3. Value Chain Dynamics in the Plastics Industry ............................................. 573.1. An outline of the plastics industry value chain ....................................... 573.2. Current state of the plastics industry value chain .................................. 593.3. Raw materials and modules ........................................................................... 593.4. Additives ............................................................................................................... 613.5. Mould making ..................................................................................................... 613.6. Manufacturing .................................................................................................... 623.7. Technology and efficiency .............................................................................. 653.8. Potential for upgrading and challenges .................................................... 663.9. Quality parameters ............................................................................................ 673.10. Markets and marketing.................................................................................... 673.11. Market access ...................................................................................................... 693.12. Distribution channels ....................................................................................... 703.13. Promotional activities ...................................................................................... 703.14. Value chain governance .................................................................................. 71
4. Competitiveness of the Plastics Industry in Bangladesh ......................... 724.1. Support industries/services ........................................................................... 724.2. Access to financing............................................................................................ 764.3. Human resources ............................................................................................... 774.4. Standards and certification ............................................................................ 784.5. Policy and regulatory framework ................................................................. 804.6. Infrastructures and utilities ............................................................................ 82

46
STUDIES IN TRADE AND INVESTMENT 70
5. Strategic Analyses ....................................................................................................... 845.1. SWOT analysis ..................................................................................................... 845.2. Triple triangle framework analysis ............................................................... 87
6. Business Competitiveness Action Plan ............................................................. 896.1. Addressing the firm level factors ................................................................. 896.2. Addressing the industry level factors ......................................................... 906.3. Addressing macro-level factors .................................................................... 91
Annex Note 1.1 ......................................................................................................................... 102
Annex Note 1.2 ......................................................................................................................... 104
List of figures
1. Triple triangle framework ........................................................................................... 492. Global production of plastic products ................................................................... 513. Market share of global plastic production in 2009 ............................................ 514. Value chain of the plastics industry in Bangladesh ........................................... 585. Value chain dynamics of the plastics industry in Bangladesh ....................... 596. Value chain governance for small contractual manufacturers ..................... 717. Large manufacturers’ control of value chains ...................................................... 728. Plastic recycling process in Bangladesh ................................................................ 759. Dhaka City Map .............................................................................................................. 83
List of tables
1. Per capita consumption (kg/year) of plastic products in differentregions of the world ...................................................................................................... 52
2. Overview of the plastics industry in Bangladesh (2006/2007) ...................... 523. Raw materials imported for plastic production in Bangladesh) ................... 534. Top 10 raw materials imported for plastic production in Bangladesh
(in millions of dollars) ................................................................................................... 545. Major export markets for plastic products of Bangladesh in 2007
(in millions of dollars) ................................................................................................... 556. Top 10 plastic export items of Bangladesh in 2003-2007
(in thousands of dollars) .............................................................................................. 567. Plastic manufacturing firms by category and location .................................... 638. Profiles of small, medium and large manufacturers ......................................... 639. Business competitiveness action plan for the plastics sector in
Bangladesh ...................................................................................................................... 95
List of boxes
1. RFL plastics – a success story ..................................................................................... 652. Institutional framework for promotion of the plastics industry in
Bangladesh ...................................................................................................................... 81
Contents (continued)Page

47
COUNTRY STUDIES ON BANGLADESH, NEPAL AND SRI LANKA
1. Introduction
Plastic-based products currently represent a sizeable subsector in the chemicalindustry in Bangladesh. Starting as a backward linkage industry, manufacturing ofplastic and plastic-based products is making significant contributions to the economyand has become an important segment of the manufacturing industry of the country.The plastics sector has approximately 3,000 manufacturing units providing anemployment to more than one million people (Islam 2008; Sakib et al. 2004; Yousuf2003). In the fiscal year 2006-2007, the industry manufactured various types of plasticproducts: approximately $714 million worth of varied quality products for the domesticmarket and $234 million worth of high-quality products for the global market (BPGMEA2009). Despite this fact, per capita consumption of plastics and plastic-based productsis still low in Bangladesh, estimated at two kg per person per year. The estimate is ratherlow compared to the global average consumption of 20.4 kg per capita per annum andthe developed country consumption of 80.0 kg per capita per annum. This indicatesthat the consumption of plastic products in Bangladesh is expected to rise as theeconomy develops (Shaheen and Maksudur 2001).
Plastic recycling has also developed into a sizeable component of the plasticsindustry with major recycling centres in and around Dhaka. Availability of river water(used in cleaning) and low transportation costs have made recycling units locatedaround Dhaka economically attractive. Current recycling of plastic wastes saves importcosts for the industry and helps improve overall waste management situation. The smallunits were estimated to recycle nearly 60 per cent of plastic waste, which savedapproximately $44 million worth of imports in raw materials in 2005 (BPGMEA 2009).Many other support and ancillary industrial service providers, such as small machine/equipment makers, distributors, printing and packaging firms and additives importers,have also grown significantly.
Although the plastics industry in Bangladesh has made remarkable progressover the years, it still lacks a well-designed approach and a strategic direction forachieving long-term, sustainable growth. Without having such strategic approach anddistinctive competitive strengths, Bangladeshi plastic products find it difficult tocompete in the global market. The void, if sustained over time, may also lead todifficulties in the domestic market as internationally competitive suppliers will likelybid for the fast growing Bangladesh market demand. Thus, to achieve globalcompetitiveness, the plastics sector needs to have a national strategic action plan forensuring growth and sustainability through distinctive competencies. But unlike theapparel and textile sector, the plastic sector in Bangladesh is yet to see any long-termpolicy guideline specifically designed for the development of this burgeoning industry.The sector is presently governed by the general industrial and trade policies applicableto all industries. A decade ago, the Government agreed to develop a special industrialpark for the plastics sector and successive governments ‘continue to work on that’.

48
STUDIES IN TRADE AND INVESTMENT 70
1.1. OBJECTIVES OF THE STUDY
The broad objective of the study on plastics industry in Bangladesh is to analyzethe competitive context in which enterprises (especially SMEs) operate and explore thegrowth potential of the sector within global value chains. Based on the findings,a national strategic action plan is prepared for enhancing value added in the plasticsindustry in Bangladesh.
The objectives of the study are presented below.
● Analysing the plastics industry in Bangladesh, taking into consideration:– business prospects and economic impact, including export potential;– current supply chain networks;– supply-side capacity, including human resources, product
development, standards and certificates and producers’ associations;– policy and regulatory framework;– infrastructure and logistics systems (e.g., transportation); and– marketing, including brand development, distribution channels and
quality requirements.
● Developing a national action plan.
1.2. METHODOLOGY
In order to analyse the competitiveness potential of the plastics industry inBangladesh, the authors have chosen the global value chain approach. After the valuechain analysis and the assessment of growth potentials and competitiveness, SWOT andtriple triangle framework (TTF) techniques were used to synthesize the findings and todevise a strategic plan of action. While SWOT analysis is a widely used tool, TTF isa new tool developed and used in the analysis of market development interventionsand policies.
TTF uses three triangles, each summarizing the factors that affect businesscompetitiveness at different levels. The inner triangle – with each of the three sidessymbolizing either capacity, or capital or culture – explains the internal, largelycontrollable dynamics of firms. The middle triangle – with each of its three sidessymbolizing either a customer, or a competitor or a collaborator – describes theimmediate, industry-level context in which firms work. The outer triangle – with eachof the three sides symbolizing either technology, or state or society and global forces –presents the macro environment, a largely non-controllable setting in which firms haveto operate. Figure 1 below illustrates the TTF.

49
COUNTRY STUDIES ON BANGLADESH, NEPAL AND SRI LANKA
1.3. DATA COLLECTION AND DATA SOURCES
Data were drawn both from primary and secondary sources. Primary data werecollected through extensive field visits, interviews with key informants and focusedgroup dialogue. The research team visited SME plastic manufacturing cluster in Dhaka.Interviews and discussions were held with major industry players, including RFL Plastics,Partex Plastics and Luna Plastics, involved in different stages of the plastics industryvalue chain. Representatives of plastics sector associations, such as Bangladesh PlasticGoods Manufacturers and Exporters Association (BPGMEA) and Bangladesh PlasticImporters Association (BPIA) were consulted and interviewed.
The Government of Bangladesh, Dhaka Chamber of Commerce and Industries(DCCI) and the Ministry of Industries have organized a national workshop deliberatingon the draft study report and obtaining additional information from the stakeholders.There were over 60 participants from the government agencies, businesses, universities,mass media and the plastics industry sector. The draft study was further enriched withadditional perspectives provided by plastic goods manufacturers, wholesalers, retailers,importers of raw materials and machineries and plastic recycling businesses.
An extensive review of available studies provided the details on the history andevolution of the industry, global trade, industry practices, government policies andregulations governing the sector. Extensive literature survey was undertaken using theInternet and the archives of BPGMEA, Dhaka Chamber of Commerce and Industries(DCCI) and newspapers. Reports and publications were provided by Bangladesh Bureauof Statistics (BBS) for trade and related data and some additional information by ExportPromotion Bureau (EPB). Trade database of the United Nations, UNIDO and UNCTADwere also explored.
Figure 1: Triple triangle framework
Source: Jahan (2008a).
Macro Level Factors
Industry Level Factors
Firm Level Factors
Capacity
Customers
State and Society
Culture
Colla
borat
ors
Tech
nolo
gy
CapitalCom
petitors
Globalization and International Forces

50
STUDIES IN TRADE AND INVESTMENT 70
1.4. LIMITATIONS
Although the draft study provided an extensive research using qualitativeresearch instruments, no enterprise-specific survey could be done due to time andresource constraints. Access to certain trade databases, such as the World Trade Analyzer(WTA),12 was not possible. However, despite severe time and resource constraints, theuse of multiple primary research instruments (e.g., field visits, depth interviews with keyinformants and focused group discussions) helped gain very effective and meaningfulindustry assessments.
2. An Overview of the Plastics Industry
The plastics industry can be viewed from the three perspectives, including:(a) end-user/market; (b) production technology; and (c) support industry. The end-usersand markets of the plastics industry can be classified into five categories: automotive;construction; packaging; medical supplies; and (v) consumer products. Based on thetechnology platform being used in plastics production, plastic products can be classifiedas: thermoformers; injection moulders; pipe, profile and tubing extruders; rotationalmoulders; film and sheet manufacturers; and blow moulders. Notable support industryplayers are: raw material suppliers; machinery importers; mould makers; additive/chemical suppliers; and plastic products recyclers.
2.1. GLOBAL PLASTICS INDUSTRY
In the modern world life without plastic products would be difficult, if notimpossible. Ranging between kitchenware and medical supplies, construction materialsand automotive supplies, safety and security devices and packaging materials and,finally, home decorations – plastic products are widely used in almost every facet ofmodern life.
Consumers choose plastic products for their versatility, durability, lightness andexcellent insulating properties. Manufacturers like to produce plastic goods becauseof low production costs and energy-efficient production processes. Driven by theseforces, the global production and consumption of plastic goods have significantlyincreased from a mere 1.5 million tonnes in 1950 to 230 million tonnes in 2009 (PlasticEurope 2009). Figure 2 depicts this exponential growth trend in global plasticproduction over the last 60 years.
Global production of plastic products is dominated by developed nations, withthe European Union producing about 24 per cent and North America producing about23 per cent of total global plastic production in 2009. The plastics industry is rankedas the third largest manufacturing industry in the United States of America. Incomparison, China as the largest manufacturer of plastic goods among developing
12 The World Trade Analyzer (WTA) is a trade database that contains trade data on United Nationsmember countries. Statistics Canada created it from the data reported by member countries to theUnited Nations Statistical Office. See some more details at http://www.statcan.gc.ca/dli-ild/data-donnees/ftp/worldtrade-commerce_mondial-eng.htm.

51
COUNTRY STUDIES ON BANGLADESH, NEPAL AND SRI LANKA
countries, contributed about 15 per cent to the world’s total plastic production in 2009.Other large plastic manufacturing countries in Asia are India and Thailand. Recently,developed nations have opened their markets for plastic products from developingnations, such as Bangladesh. One of the reasons for this shift is the low cost ofproduction in developing countries due to cheap labour and low transportation costs.As developing countries are increasingly moving towards accelerated industrialization,the plastics sector becomes an important backward linkage industry in manufacturing.For example, over the past two decades, the apparel sector in Bangladesh hasincreasingly relied on the local sources not only for cost advantages but also for‘flexibility’ and ‘lead time’ factors. As a result, the country’s reliance on importedpackaging materials and other plastic-based accessories have decreased. Figure 3shows the global market share (2009) of plastic production for different countries.
Figure 2: Global production of plastic products
Source: Plastic Europe (2010).
300300
250
200
150
100
50
Mill
ion
to
nn
e
1950 1960 1970 1980 1990 2000 2010
1950: 1.51976: 50
1989: 100
2002: 2002009: 230
2009: 55
1985: 25
World Europe
Figure 3: Market share of global plastic production in 2009
Source: Plastic Europe (2010).
Rest of Asia16.5%
China15.0%
Japan5.5%
Latin America4.0%
NAFTA23.0%
Middle East, Africa8.0%
CIS, 3.0%
Other EU 27 + N, CH4.0%
Benelus, 4.5%
France, 3.0%Italy, 2.0%
Germany7.5% Spain, 1.5%
UK, 1.5%
Europe (WE + CE) 24.0%, 55 milion tonne
230million tonne

52
STUDIES IN TRADE AND INVESTMENT 70
Table 1 presents the past, current and estimated future plastic consumption insome major economic regions of the world. As one can notice, developed countriesfar outweigh the developing and the least developed countries in plastic per capitaconsumption and use.
Table 1: Per capita consumption (kg/year) of plastic products in different regionsof the world
Regions/Countries 1980 2005 2015 (estimated)
North America 46 105 139Western Europe 40 99 136Central Europe + CIS 9 24 48Latin America 7 21 32Middle East/Africa 3 10 16Japan 50 89 108Asia (excl. Japan) 2 20 36World 11 30 45
Source: Plastic Europe (2009).
2.2. THE PLASTICS INDUSTRY IN BANGLADESH
Plastic products were introduced in Bangladesh in the later half of the 1940s.However, significant commercial growth in plastic production took place much later,in the early 1980s. The industry experienced gradual growth as large numbers ofinjection grade and film grade plastic companies were set up during the 1980s (Hasan2008). Initially, processing technologies and equipments came from India and later fromThailand, the Republic of Korea, Japan, China, Singapore and some of the Europeancountries.
Table 2: Overview of the plastics industry in Bangladesh (2006/2007)
Domestic plastic use Approximately $714 million worth of plastic goods.
Per capita plastic consumption Two kg per year
Export earnings $234 million, of which 41.6 per cent came from directexports and 58.4 per cent came from deemed exports.
Number of manufacturing units Approximately 3,000 small, medium and large plasticmanufacturing units operate across the country.
Growth The industry expanded its output by over 20 per cent perannum during the 1990s.
Employment About half a million workers are directly employed in thesector.
Plastic waste recycling sector There are 300 small units in and around Dhaka city, whichrecycle about 138 tonnes/day of plastic waste.
Sources: BPGMEA (2009); Hasan (2008).

53
COUNTRY STUDIES ON BANGLADESH, NEPAL AND SRI LANKA
Currently, the industry adopted relatively modern manufacturing processes,such as using several types of extrusion materials, injection and blow moulding,rotational moulding and thermosetting conversions. The country also produces a widerange of products, such as PVC pipes, shopping bags, woven bags, PET/PE bottles,laminated packages, rigid sheets, garment accessories, household products andmedicine packs (BPGMEA 2009). Table 2 gives an overview of the plastics industry inBangladesh in 2006-2007.
2.3. IMPORT TRENDS
Value creation in plastic products starts with the import of polymers. Since thecountry does not have polyolefin production, nearly 100 per cent of its requiredpolymers are imported (BPGMEA 2009). According to BPGMEA, in the fiscal year 2001-2002 approximately $138 million worth of plastic raw materials were imported, whichincreased at a compound average growth rate of 27.1 per cent and reached $458 millionin the fiscal year 2006-2007. Over the same period, the volume compound average growthrate was around 8.0 per cent, with imports rising from 196,000 metric tonnes in the fiscalyear 2001-2002 to 288,000 metric tonnes in the fiscal year 2006-2007. Table 3 illustratesthe growth trend in raw materials import in both volume and value terms.
Table 3: Raw materials imported for plastic production in Bangladesh
Volume 2001- 2002- 2003- 2004- 2005- 2006-CAGR*
(in million tonnes) 2002 2003 2004 2005 2006 2007(in per cent)
Bonded Category 74 637 60 606 57 477 85 365 80 628 103 853 6.8Non-Bonded Category 121 532 126 571 157 053 295 168 193 246 184 611 8.7Grand Total 196 169 187 177 214 530 380 532 273 874 288 464 8.0
Value 2001- 2002- 2003- 2004- 2005- 2006-CAGR
(in million US$) 2002 2003 2004 2005 2006 2007(in per cent)
Bonded Category 43 40 43 92 96 153 28.6Non-Bonded Category 95 143 143 175 287 305 26.4Grand Total 138 182 187 267 382 458 27.1
Source: BPGMEA (2009).Notes: 1) Bonded import implies the type of import where a bank provides a guarantee for thepayment of raw materials in case the importer fails to make the payment for the shipment. In thecase of non-bonded import no such guarantee is required; 2) CAGR is a compound average growthrate.
According to the United Nations Commodity Trade Database, the total value ofraw materials imported for plastic production13 in Bangladesh amounted to $574.6million in 2007. It has grown at a steady growth rate of 26.0 per cent from 2003 to 2007.Commodity-wise, polymers of polyethylene, propylene and polyacetal are the three
13 Fifteen broad categories of materials in primary form (HS Code -3901 to 3915) were consideredas raw materials for plastic production.

54
STUDIES IN TRADE AND INVESTMENT 70
largest imported resins. The polyacetal resin had the highest import growth rate of37.4 per cent from 2003 to 2007. Overall, all imported items demonstrate a steadypositive growth rate. Table 4 summarizes the top 10 raw materials for plastic production(in terms of import value) imported in Bangladesh.
Table 4: Top 10 raw materials imported for plastic production in Bangladesh(in millions of dollars)
Commodity 2003 2004 2005 2006 2007
Per-HS centage
Code Share(2007)
3901 Polymers of ethylene 59.6 67.8 79.9 105.1 147.8 25.7
3902 Polymers of 56.2 53.7 64.8 122.0 144.7 25.2propylene or of otherolefins
3907 Polyacetal, and other 30.1 46.2 67.5 78.9 107.2 18.7polyether andepoxide resins
3904 Polymers of vinyl 31.1 42.0 55.4 55.0 62.9 11.0chloride or of otherhalogenated olefins
3903 Polymers of styrene 14.2 10.8 14.1 25.4 31.5 5.5
3909 Amino-resins, 9.0 11.1 14.4 21.8 28.7 5.0phenolic resins andpolyurethanes
3906 Acrylic polymers 7.8 9.9 12.8 17.2 18.2 3.2
3905 Polymers of vinyl 5.9 6.2 7.6 7.8 9.6 1.7acetate or of other vinyl esters
3912 Cellulose and its 3.7 5.1 5.8 6.9 7.5 1.3chemical derivatives
3908 Polyamides 4.6 7.8 8.7 5.6 6.3 1.1
3901- Total Raw Materials 227.6 267.1 337.9 455.3 574.6 100.03915 Imported
Source: BPGMEA (2009); BBS (2007).

55
COUNTRY STUDIES ON BANGLADESH, NEPAL AND SRI LANKA
2.4. EXPORT TRENDS
The plastic sector is gradually emerging as an important source of exportearnings in Bangladesh. During the fiscal year 2006-2007, total export earnings fromthe industry stood at $234 million, of which 41.6 per cent came from direct exports and58.4 per cent came from deemed exports.14 Major export items constitute poly bags,polyethylene sheets, plastic hangers, toys, toothbrushes and ballpoint pens. Directexport earnings from the plastic sector demonstrate a remarkable increase of over 300per cent in its total GDP share – rising from 0.25 per cent of GDP in the fiscal year 2002-2003 to 1.07 per cent in the fiscal year 2006-2007 (BPGMEA 2009).
Currently, Bangladesh exports plastic products to 23 countries in North America,Europe, Asia and the Pacific and the Middle East. Major export countries are China, India,Germany and Poland (Table 5). In South Asia, Bangladesh is exporting plastic productsto India, Sri Lanka and Nepal (BPGMEA 2009). Seven eastern states in India represent
14 Direct exports mean exports of finished plastic products. Examples are – plastic kitchenwareand utensils including crockery, plastic furniture, toys, garbage bags, oven sacs, industrial films, PVCpipes, polyethylene sheets, belts, tableware, toothbrushes, ball pens, artificial flowers, electricswitches, computer accessories and so on. Deemed exports mean plastic products as embeddedparts of other exports. Examples are – buttons, hangers Used in ready-made garment industry,packaging materials and plastic accessories used virtually in all industries (BPGMEA 2009).
Table 5: Major export markets for plastic products of Bangladesh in 2007(in millions of dollars)
Country 2006-2007 2005-2006Per cent Per centGrowth Share
China 8 550 8 101 5.5 29.5India 4 116 4 391 -6.3 14.2Germany 2 615 2 142 22.1 9.0Poland 2 280 2 165 5.3 7.9Belgium 1 426 1 792 -20.4 4.9United Kingdom 1 340 1 653 -18.9 4.6Ukraine 1 196 1 401 -14.6 4.1United Arab Emirates 908 19 4 690.4 3.1Greece 898 543 65.3 3.1Netherlands 887 332 167.4 3.1France 800 957 -16.5 2.8Tunisia 633 138 357.7 2.2Others 427 33 1 177.1 1.8Viet Nam 421 40 959.8 1.5
Spain 345 340 1.5 1.2
United States of America 306 205 49.6 1.1
Source: BPGMEA (2009).

56
STUDIES IN TRADE AND INVESTMENT 70
a major market for Bangladeshi plastic goods. Bangladesh has a cost advantage inexporting plastic products to these areas as Indian manufacturers from central andwestern parts of India have higher transportation costs delivering their products in theseareas.
Table 6 below summarizes top 10 plastic items exported from Bangladeshover the period of 2003-2007. The largest export earner, plastic articles for packaginggoods, constitutes about 48.8 per cent of the total export volume in 2007. This deemedexport is mainly driven by the strong ready-made garment industry (RMG) demand ininternational markets.
Table 6: Top 10 plastic export items of Bangladesh in 2003-2007 (in thousands ofdollars)
HS Code Article Description 2007 2006 2005 2004 2003
3923 Articles for the 23 993 20 665 19 052 13 615 6 448conveyance orpackaging of goods,of plastics
3915 Waste, parings and 10 391 6 585 8 249 6 418 600scrap, of plastics
3926 Other articles of plastics 8 467 11 099 9 717 4 564 1 508and articles of othermaterials
3917 Tubes, pipes and hoses 1 977 170 210 176 56and fittings
3920 Other plates, sheets, 1 713 458 478 88 39film, foil and strip, ofplastics
3906 Acrylic polymers in 900 1 121 1 059 626 12primary forms
3904 Polymers of vinyl 614 71 8 40 0chloride
3924 Tableware, kitchenware, 195 159 473 491 564other household articlesand toilet articles
3916 Monofilament of which 162 116 521 452 402any cross-sectionaldimension exceeds1 mm
3902 Polymers of propylene 139 562 182 94 41or of other olefins,in primary forms
Total exports 49 145 41 719 49 382 28 141 10 127
Source: UNCOMTRADE (2009).

57
COUNTRY STUDIES ON BANGLADESH, NEPAL AND SRI LANKA
3. Value Chain Dynamics in the Plastics Industry
This section provides value chain analysis of the plastics industry in Bangladesh.The analysis helps identify major opportunities and obstacles for the development ofthe plastics industry. Various measures for improving competitiveness in theinternational markets are suggested on the basis of value chain analysis and an actionplan is formulated.
3.1. AN OUTLINE OF THE PLASTICS INDUSTRY VALUE CHAIN
Raw Materials: The value chain for plastic industry begins with raw materialsselection. Two major types of raw materials used for plastic products are granules(commonly known as resin and locally as ‘dana’) and additives. There are two sourcesof granules: virgin and recycled. Virgin granules are mainly imported from the MiddleEast, while the recycled raw materials are both imported and locally produced.
Production: Factories vary according to the types of machines they use, i.e.,injection, extrusion or blow machines. Injection moulding machines produce solidplastic goods, such as buttons and furniture. Blow machines produce such goods asbottles and polythene. Moulds used in these machines are usually imported, thoughthere are some exceptions. It takes approximately seven days to produce a new mouldlocally and more than two weeks to import it. A mould with plastic granules is placedinside the injection (or blow) moulding machine to produce a finished product, whichtakes a maximum of three minutes per item. However, a machine takes half an hour towarm up to its full production capacity. One machine would engage two to fourworkers, depending on their skills and the type of the machine. After the productionis complete, some finishing work (e.g., polishing the surface of the product) is requiredbefore the product is ready for the market.
Marketing: The Mitford Market (in Old Dhaka) and the New Market (close to OldDhaka) are considered the two largest wholesale markets for plastic products in thecountry. These markets are used by ‘sub-wholesalers’/retailers, who then resell theseproducts locally to final consumers. Although most of retail sales occur through retailoutlets, a certain portion is sold or exchanged for used utensils by door-to-door vendors,especially in rural areas. Business-to-business (B2B) sales and distribution rely oncorresponding contracts. Major B2B transaction parties include: RMG; pharmaceuticalcompanies; real estate companies; and construction firms. Most of RMG transactionsare treated as deemed export. While large manufacturers and intermediaries areinvolved in direct exports only, SMEs are usually not.
Recycling: In case of recycled materials value chains work in a different way.After customers dispose of used plastic products, street garbage collectors gather thosewastes and sell them to larger collectors. These waste collectors also get plastic wastesfrom another group of waste collectors called hawkers, who collect the disposables fromhouses. The larger collecting groups wash and prepare used plastic products to be usedas raw materials for recycling. After recycling, recycled granules are produced and sentto the wholesale market to be sold to SMEs as raw materials for plastic products. Suchraw materials are used mostly to produce cheap plastic products (e.g., toys, waste bagsand household items).

58
STUDIES IN TRADE AND INVESTMENT 70
Input Suppliers
Granules Importers & Wholesalers
Additives (Colours, etc.)
Importers/Wholesalers
Moulds Importers/Suppliers
MachinesImporters/Suppliers
Manufacturers
SME(Contract
Manufacturers)
SME(Own Account
Manufacturers)
Large (Own Brand
Manufacturers)
Principal-Wholesalers/
Retailers
Marketers
Wholesalers/Retailers
Independent Distributors
(company managed)
Company-Owned Showrooms,
Sales Centres
Buyers
B2C/Household(National)
B2B/Institutional
(National)
DeemedExport
DirectExport
Recyclers
Recycling Sub-sector (Collection of waste is unorganized as disposal is unorganized;
processing is somewhat organized with many players involved in different stages; marketing is relatively better organized as output goes to granules wholesalers.)
Figure.4 below shows a comprehensive value chain for the plastics industry inBangladesh.
Figure 4: Value chain of the plastics industry in Bangladesh

59
COUNTRY STUDIES ON BANGLADESH, NEPAL AND SRI LANKA
3.2. CURRENT STATE OF THE PLASTICS INDUSTRY VALUE CHAIN
The current state of the plastics industry value chain in Bangladesh is brieflysummarized in figure 5.
Figure 5: Value chain dynamics of the plastics industry in Bangladesh
RawMaterials &
MouldSupply
ManufacturingMarketing, Sales and
DistributionMarkets
✓ Two types – virgin (imported) and recycled (local and imported)
✓ Sixty per cent of raw materials used by SMEs are recycled materials.
✓ Fluctuation in raw material price affects SMEs the most.
✓ 100 per cent bank guarantee requirement affects small raw material importers.
✓ Second-hand modules are mostly used. Moulds are mainly imported from China; low quality local moulds are also available
✓ Around 3,000 manufacturing units; 98 per cent are SMEs (biggest cluster – Islampur, Old Dhaka)
✓ Technological platform: injection moulding, blow moulding and extrusion.
✓ Machineries are imported from China and Germany and moulds from China.
✓ Lacks expertise in machine and mould maintenance.
✓ Product design and mould making facilities are largely absent locally.
✓ Power blackouts affects production schedule enormously.
✓ In B2C market, own account manufacturing SMEs sell their output to wholesalers, mostly on credit. Retailers buy from these wholesalers, mostly in cash. Only larger players have proper distribution channels.
✓ On the other hand, the contract manufacturing firms do not get engaged in such kind of marketing, as they rely on relationship to get work orders from their principals.
✓ In B2B market, goods are delivered directly to client locations.
✓ Promotion: lifetime warranty, trade fair, customer relationship development
✓ Domestic market size is US$ 714 million; growing very fast.
✓ Export market is US$ 234 million: deemed export (58 per cent) and direct export (42 per cent)
✓ Local B2C market: low and middle income households (kitchen utensils), and middle income group (furniture)
✓ Local B2B market: RMG (matured), pharmaceuticals, food processing, real estate, agriculture (emerging)
3.3. RAW MATERIALS AND MOULDS
Oil-based resins are mainly manufactured in oil-producing countries, particularlyin the Middle East. Resins are produced in two forms: (i) virgin resins (come directlyfrom petroleum processing), and (ii) recycled resins (come from recycling of used plasticproducts). Though specific types of resins should be used for different quality andfunctional requirements, SME manufacturers in Bangladesh use only resins such as

60
STUDIES IN TRADE AND INVESTMENT 70
polyvinyl chloride (PVC), polypropylene (PP) and polystyrene (PS) for all the productsthey manufacture.15 Few large manufacturers are exceptions to this practice.
Virgin resins: Virgin resins are imported mostly from the Middle East. Theseresins are of better quality and food grade plastic products are made only from suchvirgin resins. Since virgin raw materials are expensive, recycled raw materials are oftenused for products serving the low-end market. However, SME manufacturers inBangladesh sometimes mix virgin resins with recycled ones to make quality and costadjustments. Large manufacturers use recycled raw materials too; but those recycledresins are produced from the residual plastic waste generated by their ownmanufacturing process. Such recycled resins are as good as virgin resins since they donot get contaminated or mixed with any other materials.
The price of resins in the local market was around $1,200 per tonne in 2007.But during the past few years prices started to fluctuate between $700 and $3,000 pertonne. This happened because the price of resin is directly correlated with the price ofcrude oil and as the price of crude oil varies depending on the stage of business cycle,so does the price of resins. For example, at the end of 2008, the global recession madethe oil price drop from $150 to $50 per barrel, causing a simultaneous drop in the priceof virgin resins to about $700 per tonne.
Recycled resins: Recycled raw materials are imported as well as produced locally.The import chain of recycled resins does not vary much from that of virgin resins. Inthe case of locally recycled resins, most of producers and suppliers are located in andaround Dhaka. The demand for recycled resin is increasing because of the attractiveprice16 and availability, and so is the number of recyclers. Currently, recycled rawmaterials account for almost 60 per cent of the total raw materials used by SMEs inBangladesh, and this trend is upward.
Value added potential: In the case of virgin raw materials, there is hardly anyvalue added potential since the plastics industry in Bangladesh has always been using
15 Major types of resins are: i) polyethylene (PE) with a wide range of uses and a low cost advantage;ii) polypropylene (PP) used for food containers and kitchen appliances; iii) polystyrene (PS) used forpackaging foam, food containers, disposable cups, plates and cutlery; iv) polyethylene terephthalate(PETE) used in producing beverage containers; v) polyamide (PA) (nylon) widely used in producingfibers, toothbrush bristles and fishing line; vi) polyester, popular in producing garment accessorieslike fibers and textiles; vii) polyvinyl chloride (PVC) widely used in plumbing pipes, flooring andclothing; viii) polycarbonate (PC) used for compact discs, eyeglasses, etc.; ix) acrylonitrile butadienestyrene (ABS) used widely in producing electronic equipment cases (e.g. housing for computermonitors, printers and keyboards); and x) polyvinylidene chloride (PVDC) (saran) for food packaging.Some special purpose plastics are: i) polytetrafluoroethylene (PTFE) (teflon) for heat resistant andlow-friction coatings, used in frying pans and water slides; ii) bakelite used in insulating parts inelectrical fixtures, a thermosetting plastic, a.k.a. phenol formaldehyde or phenolic resin that can bemoulded by heat and pressure when mixed with a filler-like wood flour or can be cast in its unfilledliquid form; and iii) polylactic acid: biodegradable, thermoplastic, aliphatic polyester derived fromlactic acid which in turn can be made by fermentation of various agricultural products such as cornstarch.16 The price of recycled raw materials, including the imported materials, is only half the price ofvirgin raw materials.

61
COUNTRY STUDIES ON BANGLADESH, NEPAL AND SRI LANKA
the best possible virgin raw materials. However, recycled raw materials remain a majorpossible value upgrading area as nearly 60 per cent of raw materials used by SMEs inthe plastics industry come from low-quality recycled material. It is worth mentioningthat the substitution of virgin resins by recycled ones could reach 100 per cent in certaincases, provided that the recycled resins are of very good quality.
Raw material suppliers: Usually SMEs producing for independent contractors getraw materials directly from them. In Bangladesh, SMEs marketing their own productsbuy the raw materials directly from the local market, i.e., from importers and wholesalers.Most large firms import directly from abroad. Some of the major problems related tothe import of raw materials are as follows:
● Delays at ports. The most common problem is unnecessary delays andhassles at the ports. Because of operational inefficiency and politicalunrest, containers tend to be stuck at the port warehouses, causing rentalcosts and delayed delivery. Consequently, the price of virgin plasticgranules increases. However, recently the Government has initiated variousmeasures to solve these problems.
● Pre-shipment inspection (PSI) procedure. The PSI procedure, involvesa government appointed agent inspecting imported raw materials.Importers made several complaints against the agency regarding it beinginadequately staffed and not being client-oriented, resulting in long leadtime in import and distribution procedures.
To address this and related issues virgin plastic granule importers haveorganized Bangladesh Plastic Importers Association, which is mandated to negotiatewith the Government on policy matters.
3.4. ADDITIVES
Additives are used with plastic granules to alter and improve mechanical,physical or chemical properties of the final product and protect it from the degradingeffects of light, heat or bacteria as well as improve product value through enhanceddurability, smoother surface and overall better look. However, the smart use of suchadditives is still restricted only to large manufacturers.
For colouring of plastic products, powdered colours were used until the 1980s.However, master batches (colour granules) made their way into the market ever since.Different types of master batches and chemicals are imported from abroad, mainly fromGermany and China. Of course, China is the leading exporter in the Bangladesh marketdue to its low price offer.
3.5. MOULD MAKING
Since the introduction of handmade local moulds, technological change of anysignificance has yet to come to mould manufacturing in Bangladesh. Largemanufacturers mainly import moulds directly from China and Thailand, whereas SMEsrely on local sources. However, the locally manufactured moulds are quite substandard

62
STUDIES IN TRADE AND INVESTMENT 70
and produce products of poor quality. The nascent light engineering sector of thecountry has come up with some solutions but the initiatives are very far from what theburgeoning plastics sector requires in terms of quality. Neither the light engineeringsector SMEs nor the plastics sector firms are capable, both financially and technically,of making any significant progress in this venture. However, knowing the fact that eachof the large manufacturers requires almost 50 moulds a year, made a couple of largeplayers contemplate on it.17 But again, confidence is running low due to uncertaintiesregarding government policy directions, inadequate infrastructural development(particularly gas and electricity supply), and perceived market risks in the absence ofproper market intelligence. However, the availability of Chinese and Thai moulds makesthe plastics sector players somewhat complacent and prevents the sector fromachieving long-term competitiveness. The absence of such a vital manufacturinglinkage could preclude research and development in product design and otherinnovative solutions.
In the absence of sound mould making facilities, the capital constrained SMEsare forced to use locally made, low-quality moulds and end up producing low qualityplastic products with poor finishing, serving the low-end segment of the market. Suchproducts, lacking the desirable precision and fine finishing result in poor profits for SMEs.Low quality product excludes local SMEs from joining the export market. Thus, thevicious circle of industrial backwardness continues.
However, the situation might offer an opportunity for technology upgrading bydeveloping local mould making facilities. Seizing this opportunity could help theplastics sector not only serve the domestic market better (particularly by fighting offimports), but also enter the export markets, which is crucial for long term industrycompetitiveness.
3.6. MANUFACTURING
The plastics industry sector in Bangladesh displays a significant diversity ofenterprises ranging from large ‘integrated ’ players to very small ‘specialized ’manufacturing units. According to BPGMEA, of the 3,000 plastic manufacturing firms66 per cent fall into ‘small’ enterprise category, 1.7 per cent into ‘large’ enterprisecategory and the rest belong to medium enterprises as defined by the BangladeshBureau of Statistics. Large firms are mostly located in major cities of the country. Someof the large players are RFL Plastics, Bengal Plastics, Navana Plastics, Gazi Tanks,Boss Plastic Industries, Leos Plastic, Bismillah Plastics and N. Mohd. Plastics. Smalland medium manufacturing firms consist of highly fragmented clusters scatteredaround the country with the largest cluster being the Lalbagh-Islambagh cluster inDhaka. Table 7 provides information on plastic manufacturing firms.
17 One such plant is expected to be in place by 2011.

63
COUNTRY STUDIES ON BANGLADESH, NEPAL AND SRI LANKA
The common characteristics in each category of the plastics producers aresummarized in Table 8.
Table 7: Plastic manufacturing firms by category and location
Category Small Medium Large
Definition18 Less than 10 workers. More than 10 workers More than 50 workersand less than 50 workers.
Numbers 1,965 (65.6 per cent) 980 (32.7 per cent) 52 (1.7 per cent)
Location Dhaka City (Old Dhaka), Dhaka City, Tongi, Dhaka City, Tongi,Keranigonj, Gazipur, Savar, Gazipur, Savar,Narayangonj, Khulna, Munshiganj, Narayangonj, ChittagongChittagong Chittagong, Khulna
Sources: BPGMEA (2009); BBS (2007).
Table 8: Profiles of small, medium and large manufacturers
Small Manufacturers Medium Manufacturers Large Manufacturers
Business Subcontracting and low Both subcontracting and Own accountmodel quality own account own account manufacturing
manufacturing manufacturing
Control over In subcontract Raw materials are Manufacturersraw material manufacturing raw bought from importers. themselves import raw
materials are supplied material.by the principal.
Types of raw Sometimes low quality Imported raw materials Recycled raw materialsmaterials recycled raw materials are preferred. are never used.used are used.
Types of Semi-automated Semi-automated Automated injectionmachines injection and blow injection and blow and blow machinesused machines machines
Types of Unskilled and Unskilled and Trained (in-houselabour semi-skilled semi- killed training)
Types of Local moulds of Local moulds used in Imported mouldsmoulds low quality most cases. Someused imported moulds
Channels and Sold to a wholesaler. Have own wholesale Use own channels anddistribution shops. distribution.
Export Do not export Hardly ever export Majority of exports arefrom this segment ofmanufacturing units
18 The definitions of SMEs and large enterprises in the plastics sector in Bangladesh are differentfrom those in existing literature (cf. section A, chapter 1). However, the co-existence of differentSME definitions in a developing county is not unusual in Asia and the Pacific (AMMO 2007; ESCAP2009b).

64
STUDIES IN TRADE AND INVESTMENT 70
Most firms in the micro- and small manufacturer categories are run by a soleproprietor, which is an indication of the dominance of such single owner-managed unitsin SME category. According to industry sources, the amount of start-up equity capitalvaries, on average, from $14,000 for micro firms to $578,000 for large firms. SMEsentrepreneurs have to rely on equity financing and other forms of non-institutionalloans. However, there is little information on term structure of non-institutional loanarrangements that SMEs entrepreneurs may use. The larger tier firms use bank loansto meet their financing needs.
In general, manufacturing units in the plastics sector follow either Own AccountManufacturing (OAM) or Contract Manufacturing (CM) business models. Own accountmanufacturers produce their own products, market them and have the full authorityover the process. In the local plastics industry most manufacturers operate their ownaccounts. Own account manufacturers are actively involved in every stage of a productlife-cycle, i.e., conceiving business idea, making business plan, setting up productionunit, buying raw materials, accessing finance, planning batch production, determiningcosts and marketing the final product. Larger manufacturers predominantly rely on theOAM business model and market goods under their own brand names.
Contract manufacturing is another business model in which smallmanufacturers essentially work as third party subcontractors without taking the risk offinding buyers and facing much of uncertainties arising from sales and distributionprocesses. Under this business model, a CM firm requires a machine and a small placeto house that machine, while the principal (i.e., a contractor, who markets the finalproduct) provides moulds and granules. Recently, the industry has experienceda significant rise in this type of business practice as more and more SMEs are acceptingthis business model as it requires small start-up capital and represents low risk exposure.However, businesses using CM model usually do not enjoy the economies of scale andhave little control over the industry value chain. Until CM model firms become bigenough to switch to OAM model firms or form alliances establishing common platformsof shared business goals, it is very unlikely that they would enjoy any greater controlover the plastics industry value chain.
Although most CM firms produce low-end products using recycled granulessupplied by the principals, some CM firms are switching to higher-end productcategories. However, as most CM units use relatively low-quality machines, it is difficultto get into the high-end product segment unless they upgrade the equipment.
Location Mainly located in Mainly located in Different, depending onOld Dhaka (Lalbagh- Old Dhaka (Lalbagh- corporateIslambagh cluster) Islambagh cluster) and considerations
Mirpur area.
Source: Primary (interviews, discussions, etc.).
Table 8: (continued)
Small Manufacturers Medium Manufacturers Large Manufacturers

65
COUNTRY STUDIES ON BANGLADESH, NEPAL AND SRI LANKA
3.7. TECHNOLOGY AND EFFICIENCY
At an earlier stage of the plastics industry development in Bangladesh, handmoulding was the standard practice. However, recently machine moulding has largelyreplaced hand moulding, as it is cheaper and makes superior product. In most cases,mould machines are imported from China, Germany and Taiwan Province of China.Reconditioned machines are also in demand because of a low cost and a quick paybackperiod.
In terms of design, small players usually copy the patterns from largermanufactures’ plastic products. SMEs order local mould manufacturers to make mouldsreplicating the products of large manufacturers. Even large manufacturers often copydesign patterns from other manufacturers or imported products. Manufacturers givesample products to mould makers located outside the country (usually in China) andorder the necessary number of moulds required.
Box 1: RFL plastics – a success story
RFL Plastics Limited is one of the leading manufacturers of moulded householdand furniture products in Bangladesh. The company started the operation in 2003, focusingon manufacturing and marketing plastic household products and furniture at an affordableprice. It produces more than 300 items of reasonably high quality and superior design. Inthe manufacturing process the company uses fully automated injection mouldingmachines, operated by skilled and experienced local and foreign technicians. Due tosuperior quality, innovative design and product variety, RFL has been established as oneof the most preferred brands in the plastics sector in Bangladesh. Recently, RFL has alsostarted exporting its plastic products.
The manufacturing plant is located at Ghorashal, Narshingdhi, in the outskirts ofDhaka, and is equipped with more than 70 injection mould machines operated by 3,000workers under the supervision of more than 100 technical experts. The company has itsown R and D facilities, creating new product design and making simpler moulds. Drivenby its success, RFL is currently planning an expansion but is unsure of additional utilities(gas and electricity) supply – ‘the most significant obstacle’ faced by the industry in general.
Bangladesh is experiencing substantial infrastructure and logistics challenges,particularly in Dhaka, where there is the biggest concentration of CM firms. Poweroutage is rampant and, because of narrow streets, transportation is a major problem.The Government is currently contemplating on setting up an industrial park for theplastics sector SMEs that will include the required infrastructure, utility services andlogistic support as well as some other fiscal and financial incentives. It is expected thatSMEs of Old Dhaka area will eventually move their facilities to the park. If that happens,positive externalities, including business and technical knowledge spillover, will beenormous. Also, it will be easier for the Government to support SMEs with, among otherthings, preferential utility supply, the lack of which is a major obstacle for improvingproductivity and competitiveness of SMEs.

66
STUDIES IN TRADE AND INVESTMENT 70
Presently, capacity utilization of the plastics industry, particularly of SMEs, issuboptimal. A number of factors are contributing to the inefficient operation. The mostprominent of the factors are: frequent power failures (locally known as “load shedding”);semi- or unskilled labour; frequent breakdowns of machines; and a severe shortage oftechnical personnel for maintenance.
The situation is particularly bad in the Dhaka area, where the largest clusters ofthe plastics sector SMEs are located. Frequently, particularly in summer, the firmsexperience five to six hours of ‘load shedding.’ Productivity is badly affected by sharpfluctuations in power supply and frequent energy shortages. However, large firms relyon generators (primarily gas-based) to ensure uninterrupted power supply and henceenjoy higher productivity. Since early 2009, even large firms have experienceddifficulties with their planned expansion projects as the Government stopped providingnew gas supply connections.
In most SMEs, workers are hired untrained and placed under the supervision ofan experienced worker for about a year before they can start working independently.The productivity of such labourers is rather low as they are not adequately trained andfrequently rely on trial and error in their work. Unfortunately, unskilled workersconstitute a significant portion of the total workforce of SMEs. As soon as the workmenacquire the skills, they leave for higher salaries in larger enterprises. As a result, SMEscontinue to suffer due to a lack of skilled workers. The situation contributes to constantlow productivity and low capacity utilization in most of the smaller production units.
Since SMEs in the local plastics sector usually use reconditioned machines(typically five to 10 years old), the technological production level is pretty low. Asa result, frequent breakdown of machines is a common phenomenon. Butunfortunately, the sector suffers from a severe shortage of technical personnel for repairand maintenance. Sometimes it takes days and even weeks to get a broken machinerepaired, which keeps the machine idle and leads to low capacity utilization.
3.8. POTENTIAL FOR UPGRADING AND CHALLENGES
The plastics sector in Bangladesh has an enormous potential for upgradingmachinery and making quality improvements in mould manufacturing. Only a handfulof manufacturers use new machines mostly imported from China. Machines fromGermany are considered expensive and require long payback periods. All long-terminvestment decisions are considered risky and full of uncertainties. Entrepreneurs arereluctant to invest in costly technology because of the low confidence in theGovernment policies and regulations. For example, in the early 2000s the Governmentabruptly banned thin plastic shopping bags. While the rationale for the Governmentdecision could be explained, its hasty implementation was highly detrimental for thesector as many SMEs suddenly went bankrupt, losing their source of revenue. Suchrushed Government decisions make entrepreneurs feel uneasy when they contemplatesubstantial investment by purchasing brand new machines required for producinghigh-end products to compete in premium market segment. Other major negativeimpacts are the shortages in electricity and gas supply, the unavailability of skilledlabour and a lack of access to capital.

67
COUNTRY STUDIES ON BANGLADESH, NEPAL AND SRI LANKA
3.9. QUALITY PARAMETERS
Maintaining quality of plastic products requires a presence of certain factors thatare elaborated upon below.
● Raw materials: Low quality raw materials make products fragile. Productsmade from low quality recycled raw materials become inferior qualityproducts and break down easily. Another problem with recycled rawmaterials is the loss of elasticity during recycling. As a result, productsmade of recycled raw materials often fail the load test, a major qualityparameter for such products as plastic furniture.19 For this reason, producersof high-end goods do not use recycled raw materials.
● Additives: Poor quality chemicals and additives reduce the smoothnessattribute of a product. Chemicals imported from Germany are of superiorquality though rather expensive. Chinese additives are cheaper but theydo not provide as much smoothness as the German additives do.
● Design: Customers look for products with superior design, wide variety andhigh quality finishing. However, local SMEs fail not only to produceinnovative designs but also to come up with nice finishing. Nevertheless,though plastic products of larger firms are a better quality, large firms’production capacity at present is insufficient to cover the market demand.
● Machinery: Use of reconditioned machines affects product quality. Toprotect the premium segment of domestic market from foreigncompetition and to capture the export market, manufacturers need to usenew, state-of-the-art machines.
● Workforce: Machine-operating skills are important for producing smoothand well-finished products. Workers with such skills are not readilyavailable in Bangladesh and, therefore, SMEs are particularly affected bythe situation because, unlike large manufacturers, they cannot providein-house training or employ formally trained technicians.20 Consequently,SMEs have to rely on whatever labour force is available in the job marketand train them through informal apprenticeship. An untrained workforcecosts SMEs dearly in terms of consistency in product quality.
3.10. MARKETS AND MARKETING
The plastics market in Bangladesh can broadly be divided into two segments:domestic market and export market. Both the domestic and the export market canfurther be subdivided into two segments: business to households/customers (B2C)market and business-to-business (B2B) market. B2C market carries no specifics:household customers irrespective of their age and sex use plastic products. However,the desired product quality varies according to customer income and social status. All
19 Usually extra amounts of raw materials are added to offset the lack of elasticity.20 Large manufacturers occasionally hire technical experts from abroad, mainly from India to trainlocal staff.

68
STUDIES IN TRADE AND INVESTMENT 70
B2C transactions are made at the retail level. In contrast, B2B customers buy directlyfrom producers: they buy wholesale and receive a discount that reduces the cost. Manyof them call for competitive bids, known as ‘tenders’, asking the interested parties toquote prices against a given specification. The manufacturers submit price quotes. TheB2B buyers then select the party that meets both the technical and the financial criteria.Such competitive bidding is popular among B2B clients from sectors such as edible oil,RMG and fast moving consumer goods. However, once a trustworthy relationship isestablished with a B2B client, the client relies on the same producer and place repeatorders. Popular B2B products include office furniture, pharmaceutical accessories, RMGaccessories, containers, PET bottles, packaging materials, construction pipes andwristwatch bodies. However, the RMG sector has been the largest B2B market segmentthat essentially drives up the deemed export of plastic.
The domestic market for plastic products in Bangladesh is likely to grow forseveral reasons. First, given a large number of population and, therefore, a big domesticmarket21 for mass consumer goods, the plastics sector in Bangladesh could enjoy highgrowth potential. Second, Bangladesh so far has very low per capita consumption ofplastic products. Third, further economic growth and development in Bangladesh aswell as in the region are expected to continue in the coming years, which would resultin an increased demand for plastic products. Fourth, new types of plastic productsshould be introduced in the market and consumers are most likely to purchase thesenew products for their usefullness, cost, durability, functionality and design Manydomestic entrepreneurs are considering expansion to take advantage of the unfoldingopportunities in the plastics industry development.
Domestic business consumers/markets for plastic products can be classified intosubsectors such as packaging, construction, pharmaceutical, consumer products,agriculture, transportation and other industries. The packaging industry has been understrict regulation after the ban on the use of thin polythene shopping bags in 2001. Boththe local and export markets for packaging materials are growing steadily. The RMGsector continues to be the largest consumer of packaging materials while the growthin packaged food market has led to a surge in the demand for food grade packaging.In the pharmaceutical industry, there is also a huge demand for high quality food gradepackaging materials. So far, only a few manufacturers have managed to enter thepharmaceuticals market and than only in packaging products for insecticides andpesticides. The agricultural sector is also becoming a major consumer of plasticproducts as plastic pipes are used extensively for irrigation purposes. Also, farmers arenow using plastic film for shedding crops. Plastic containers, boxes and cartons aregaining popularity for bulk packaging and transportation of agricultural products. Inthe construction sector PVC pipes, plastic fittings, plastic doors and other products arethe major items consumed. In the consumer goods category major items constitutedomestic utensils, kitchen and tableware, toys and plastic furniture.
The current scenario of the plastics sector in Bangladesh could be seen as botha mine of opportunities and threats. On one hand, impressive growth is highly likely
21 Export market was discussed in detail in section B of this chapter.

69
COUNTRY STUDIES ON BANGLADESH, NEPAL AND SRI LANKA
even if the sector is driven only by the domestic market. Of course, the emerging exporttrend indicates numerous market opportunities abroad as well thanks to theBangladeshi advantage of low-cost labour. On the other hand, the plastics sector couldface fierce competition from other Asia-Pacific countries both at home and abroad, asinternational trade barriers are eroding fast. Domestic market for the plastics industryin Bangladesh is quite large and, according to industry players, demand far outweighssupply.22 As a consequence of persistent supply shortages, a great volume of plasticproducts (particularly for B2C market) is imported, mainly from China. Although themarket for plastic products have grown quite rapidly, Bangladeshi entrepreneurs areyet to avail themselves of these opportunities as customers find the imported items tobe of better quality and lower priced.
3.11. MARKET ACCESS
SME manufacturers are facing significant difficulties in accessing the marketwhile large manufacturers are in a better position in overcoming such difficulties andgetting an access into the plastic markets. The difference between large companiesand SMEs lies in the former financial strengths, entrepreneurial capabilities and vision,marketing wisdom and fair business model. SME manufacturers, typically non-brandmanufacturers, often have to sell their products at a 100 per cent credit to wholesalersbecause they have no other distribution channel for their non-brand products. Largecompanies sell their products for a 100 per cent advance cash payment. They havecreated brand names for their products over the years through promotional campaigns,dedicated sales force and consistently good quality product. Unfortunately, this is notthe case for most SMEs, which constitute more than 98 per cent of all manufacturingunits in Bangladesh. As these manufacturing SMEs fail to control a value chain, theyare unable to create value for themselves and all the benefits go to other players alongthe industry value chain. Thus, sadly for SME manufacturers, the vicious circle continues.
As for the export market, SMEs are not present there because of the obviousconstraints already discussed. Large manufacturers are also facing problems inaccessing export markets. Their problem is rooted in market intelligence, tradenegotiation capability and quality perception associated with the label ‘made inBangladesh.’ Large firms in Bangladesh have neither sound international businessnetwork nor an access to a well-researched market information bank. There are noprofessionally trained negotiators to conduct business talks. Bangladesh missionsabroad and the related ministries cannot support export promotion and bilateral tradenegotiations. Bangladesh Standard and Testing Institution (BSTI), the only qualitycertifying authority in the country, is not adequately equipped with either laboratoryfacilities or skilled personnel. As a result, their quality testing process tends to be lengthyand lacks the required credibility.
22 Although no verified data on import of final plastic goods is found, industry insiders unanimouslyconfirmed the fact of a huge demand-supply gap.

70
STUDIES IN TRADE AND INVESTMENT 70
3.12. DISTRIBUTION CHANNELS
There are several types of independent market intermediaries, such as importer,wholesaler, retailer and hawker.23 These intermediaries usually deal with importedproducts and the products of SMEs (having either OAM or CM arrangements). Largemanufacturers have their own distribution channels – of varying nature and depth –to cover the whole national market. The usual channel is a distributor-dealer-retailernetwork, which is nurtured by a manufacturer in-house sales and distribution teams.These intermediaries are independent business entities working closely withmanufacturing companies acting as real partners in the business. Some of the largecompanies run their own showrooms in important locations all over the country. Also,in case of B2B, products are delivered directly to the client firms.
Small manufacturers search for the wholesalers to sell their products. Mediummanufacturers typically use the same marketing channel as small manufacturers(i.e., wholesalers); however, some of them sell goods in their own names and have theirown shops in major wholesale markets. Large players employ distributors for marketingtheir products. For example, RFL Plastics, the biggest consumer plastic products makerin Bangladesh, has (approximately) 1,500 dealers around the country. These dealersdeliver the products to retailers.
3.13. PROMOTIONAL ACTIVITIES
Trade fairs have so far been a major collective promotional tool for Bangladeshiplastic manufacturers. This initiative is helpful in gaining an access to the export market.Although deemed export constitutes a major portion in the export of plastic productsfrom Bangladesh, some large manufacturers have embarked upon identifying the waysof accessing the global market through direct export of plastic products. Recently,a number of plastic manufacturers from Bangladesh participated in international tradefairs abroad, particularly in developed countries, and received orders from newcustomers. Participation in foreign trade fairs and exhibitions is an effective tool inexploring the new markets and strengthening trade relationships in the old markets.Similar and related activities, serving the same purposes include trade missions, buyer-seller meetings and new product launching events.
Trade fairs have also been arranged in Bangladesh. Some of these fairs aregeneral trade fairs, open to all industries, and some are industry-specific fairs. One ofthe largest trade fairs is Dhaka International Trade Fair (DITF), which is held every winterand it lasts a full month (usually January). The plastics sector industry in Bangladeshorganizes industry fairs regularly and plans to have them more frequently. Such tradefairs provide the local plastics industry with an opportunity of presenting their productsto both the local and global markets.
Mass media, such as television and print media have helped large manufacturersto promote their plastic products to domestic market audience. But advertising issomething SMEs cannot afford.
23 A small, door-to-door, retailer.

71
COUNTRY STUDIES ON BANGLADESH, NEPAL AND SRI LANKA
Some companies offer warranties for their products. For instance, Tanin and RFLPlastics (two very popular names in the plastic furniture market) offer ‘life time warranty’for their products. This mechanism allows customers to pay only half of the originalprice of the damaged product and obtain a replacement. Such promotional offers areincreasing as the industry matures.
Relationship marketing has been another vital element particularly used for B2Bmarkets. Entrepreneurs hire skilled marketing professionals to find potential corporatebuyers and develop long-term relationships with these corporate clients. Sometimesentrepreneurs develop personal contacts with corporate buyers to procure large orstrategically significant orders. Good and long-term business relationships withcorporate buyers help manufacturers secure an uninterrupted order flow for many years.
3.14. VALUE CHAIN GOVERNANCE
Governance of a value chain (i.e., a degree of control by an agency over an entirevalue chain, supply chain or production network) in the plastics sector in Bangladeshvaries, depending on the size of a manufacturer and the business model (CM and/orOAM) used. With small contractual (CM) production, the contract principal (a wholesaleror a corporate buyer) supplies raw materials and necessary mould/s to SMEmanufacturer. The manufacturer’s role is limited to final product manufacturing asrequired by the principal. In most cases the principal would even make transportarrangements for delivering raw materials and moulds and picking up the finishedgoods as it guarantees full adherence to the schedule. In this case, the value chain isfully governed by the principal who only pays the CM unit for labour and productionfacilities and utilities costs plus the margin. Such principals control the entire valuechain. However, there are uncertainties still faced by value chain players, such as theinternational market price fluctuation, lead-times and so on. The value chaingovernance is further illustrated in figure 6.
Figure 6: Value chain governance for small contractual manufacturers
Raw Material Importers, Vendors,
Principals
Distributors/Wholesalers,
Retailers
Raw Materials
Supply
Mould & Chemical
Supply
Production Marketing
Mould Makers, Chemical Suppliers
Controlled by principalsControlled by contract manufacturers

72
STUDIES IN TRADE AND INVESTMENT 70
Large manufacturers usually import raw materials themselves. They also importmoulds and produce plastic goods on their own account. They mainly use their ownbrand name and market their products in Bangladesh through either their owndistribution channels or through designated agents or some kind of hybridarrangement. Large manufacturers are mostly vertically integrated companies andtherefore govern the majority of their value chains. However, manufacturers who donot import raw materials directly are dependent, to some extent, on raw materialsimporters. The balance of governance in the latter case depends, among other things,on the fluctuation of raw materials prices in the international market, purchase volumeand timing. The value chain governance for large firms is illustrated in Figure 7.
Figure 7: Large manufacturers’ control of value chains
Occasionally controlled by manufacturers
Largely controlled by manufacturers
Minimally control by manufacturers
Raw material Importers, Vendors
Raw MaterialSupply
Retailers
Mould & Chemical
Supply
ProductionWholesale
Distri-bution
RetailSales
Mould makers, Chemical Suppliers
4. Competitiveness of the Plastics Industry in Bangladesh
The competitiveness of any industry depends on several key factors, includingthe availability of support industries/services, access to finance, human resources,quality standards and certifications, policy and regulatory framework andinfrastructures. If any of these factors are missing, the industry may loose itscompetitiveness. Several key factors, determining the competitiveness of the plasticsindustry in Bangladesh, are presented below.
4.1. SUPPORT INDUSTRIES/SERVICES
Support industries play an important role in the plastics sector in Bangladesh.That is particularly true of equipment suppliers and recyclers, two important supportplayers, as the quality and, in turn, the competitiveness of plastic products largelydepends on them.
73
COUNTRY STUDIES ON BANGLADESH, NEPAL AND SRI LANKA
Mould making industry
Besides the presence of the skilled workforce and plastic granules and additivesfine attributes, the quality of final plastic products depends on the quality of moulds.However, the mould making industry in Bangladesh is still at its nascent stage and highquality moulds are largely imported from foreign countries. Many local mould makersin Bangladesh work using traditional methods. Only a few of them have modern mouldmaking equipment such as EDM, pantographs and CNC milling machines.
There are mainly two types of customers using moulds in the plastic goodsmanufacturing industry in Bangladesh; (i) small and medium plastic goodsmanufacturers; and (ii) large plastic goods manufacturers.
Small and medium plastic goods manufacturers depend on moulds suppliedby local mould makers – directly in the OAM model and indirectly (i.e., throughprincipals) in the CM model. Made of low quality steel,24 using traditional trial and errorproduction method, these moulds cannot provide precision and quality required forcertain types of plastic products.
However, as large manufacturers aim to produce export-quality product madewith high precision, they depend mainly on imported moulds, which are more reliableand longer lasting than the local ones. Before a large plastic goods manufacturerintroduces a newly designed product in the market, the firm sends a sample productdesign to a foreign mould maker, who produces the mould in accordance with thesample. Most new moulds are imported from China and India. It is a known fact thatChinese moulds have advantages over the Indian ones both in quality and cost.
The sizes and shapes of imported moulds vary from small (used for productionof household items) to large (used for production of furniture). Prices for moulds alsovary from $2,890 (small size mould) to $72,254 (large size mould). However, importedmoulds include problems such as longer lead times, higher costs and the absence ofafter sales services. Local manufacturers cannot change product designs rapidly usingimported moulds.
SME manufacturers repair moulds (and machines) hiring technicians who arenot readily available locally. Large manufacturers normally have in-house engineers andtechnicians for repair and maintenance work. Large manufacturers’ expert techniciansusually receive their technical training (in most cases facilitated and funded by theiremployers) in China. Some of technicians come from other machine exporting countriesto Bangladesh.
Machine importers generally offer three years of replacement warranty for bothelectronic and hydraulic brand new mould machineries imported from China. They alsooffer one-year free service that is provided by Chinese producers and can be extendedto up to five years at their expense, creating goodwill in the market.
24 Scrap metal from old vessels.

74
STUDIES IN TRADE AND INVESTMENT 70
Recycling
Recycling is a crucial support industry for the plastics industry all over the worldand it is one of the most important factors for the long-term growth and survival ofthe plastics industry. As large numbers of manufacturers, especially in the SME segment,are using recycled raw materials, recycling carries a lot of economic (besidesenvironmental) importance. By using recycled granules manufacturers can cut the costof raw materials by almost half. Although there are ample examples of good practicesin plastic recycling around the world, Bangladesh is yet to learn from such cases.Recycling in Bangladesh is hindered by poor waste disposal and management cultureand the use of primitive processing technologies.
There are three technical/operational aspects involving recycling that determine thequality of recycled granules. These aspects are the following:
● Proper washing of contaminated plastics;
● Manual or mechanized sorting; and
● Quality of processing equipment.
In addition, there are some significant compliance issues, including:
● Health and safety of plastic collectors, sorters and recycling factory workers;
● Environmental consequences of recycling process; and
● Rules and regulations involving use of recycled granules.
Unfortunately, the recycling subsector in Bangladesh demonstrates poorcompliance on most of these issues. Although, on the environmental issue the recyclingsubsector, to some extent, is keeping the plastics industry afloat by reducing the likelyenvironmental damage and this is in spite of the fact that plastic waste disposal andrecycling system are yet to be standardized and modernized, which pose a tremendousthreat to the economy. The recycling subsector deserves an immediate attention fromall parties concerned, particularly from the Government of Bangladesh.
The recycling practice in Bangladesh is still highly dependent on manualprocessing. The process can be broken down to a number of steps. Figure 8 presentsthe flow diagram of a typical recycling process of plastic waste in Bangladesh.
In developed countries wastes are disposed of and collected in accordance withdifferent categories. This means different types of waste are disposed of separately. InBangladesh, all types of waste – starting from kitchen waste to paper waste to plasticwaste to metal waste – are disposed of and collected together. Plastic wastes aregenerally collected from households by hawkers and from waste disposal bins by streetcollectors.
After plastic waste is collected, it is sorted out manually according to categories,which is very time consuming and inefficient. Plastic wastes are sorted out by thedegree of cleanliness (dirty or clean), by plastics type (thermoplastic or thermoses), bycategory (PP, PE, PS, PVC), by colour and by product type (bottles, bags, films and sheets).

75
COUNTRY STUDIES ON BANGLADESH, NEPAL AND SRI LANKA
In Bangladesh, labourers who sort the plastic wastes do not often have adequateknowledge on the plastic type and category. They sort out wastes by product type(e.g., plastic bottles and plastic packs). They can not differentiate among materials ofwhich similar types of products are made. For example, different plastic bottles aremade of different types of plastics. As a result of this type of sorting, different types ofplastic materials stay together, which affects the quality of recycled granules.
After sorting according to types, plastic waste is sent to a mechanical recyclerfor cleaning and drying. Plastic waste is washed with the water coming from the nearbywater sources, such as rivers, canals and ponds. Drying is done naturally by exposingthe washed plastic waste to the sunlight. However, substances like dust, germs andother contaminated materials remain on plastic waste after poor and inadequatewashing.
After the drying, plastic waste goes through shredding and extrusion and isprepared for palletizing. Shredding can be done by scissors, shears, saws and so on.Shredding is done for the following reasons:
● To reduce larger plastic waste to smaller fraction sizes that could bemanaged by smaller machines;
● To make storage and transportation easier; and
● To prepare plastic waste for further processing.
After shredding the plastic waste goes through palletizing, the final step inrecycle process. Here the shredded materials are melted in a palletizing machine andtransferred into recycled plastic granules.
Figure 8: Plastic recycling process in Bangladesh
Collection of Disposed Plastic Waste
(from households, dustbins, landfills, rivers,
and street)
Wholesale CollectionSorting of Procured
Plastic Waste
Palletizing Shredding & Extrusion Cleaning & Drying of Procured Plastic Waste
Mechanical Recycling (Granules Production)
Wholesaling of Recycled Granules

76
STUDIES IN TRADE AND INVESTMENT 70
However, the recycling process, as discussed above, does not produce high-quality recycled granules. The reason for that is the absence of automated sorting andcleaning. The existing practice of plastic waste processing yields granules of inferiorquality (compared to imported recycled granules). Inferior quality recycled granulesalso mean inferior quality finished products. That is why locally recycled granules areused mainly by SMEs producing non-branded, low quality products.
Nearly all the equipment used by recycling sector SMEs in Bangladesh is madelocally. Since the recycling equipment is not technologically complex and the recyclingsubindustry is at its nascent stage, locally made machineries have so far proved to begood enough to support the recycling SMEs. However, as the plastics industry maturesand waste management culture improves the demand for better recycling machineriesis expected to grow. And, this is another area of potential technology upgrading.
4.2. ACCESS TO FINANCING
Like any other SMEs, the plastics sector SMEs are facing severe constraints when it comesto access to financing. Bank loans that could have been the main source of financingare extremely hard to obtain. There are a number of reasons for this, including:
(i) Banks’ reluctancy to provide loans to SMEs;
a. Loan sizes are too small to deal with. Given the fixed interest rates,the profit received from such a small loan is not attractive enough. On theother hand, banks cannot charge a higher interest rate both for market andnon-market reasons. The market reason — a higher price would result inlow demand — and the non-market reason – numerous requirements andformalities would have to be complied with.
b. The perceived risk is quite high. SMEs hardly possess the collateralsrequired by the banks as security.
c. Accounting practice is poor. Proper financial documentation andaccounting are not part of the SMEs business culture. Most of SMEsfollow the traditional way of bookkeeping, writing down all the entries ina notebook and performing some simple computations at the end ofa certain period.
(ii) SMEs’ reluctancy to ask banks for loans.
a. Banking environment is too complex for SME entrepreneurs. SMEs perceivebanks as inaccessible and banking officials as unapproachable.
b. The low educational level of SME entrepreneurs is a major obstacle. Lackof education prevents them from becoming accustomed to officialrequirements and formalities of the bank.
Although there are state-owned commercial banks mandated to finance SMEs,their performance is rather poor. However, there are some positive developments. Forexample, BRAC Bank, a local commercial bank, is aggressively marketing SME loanschemes. For the past four decades the bank has successfully managed one of the

77
COUNTRY STUDIES ON BANGLADESH, NEPAL AND SRI LANKA
world’s largest micro-finance institutions. Seeing BRAC Bank’s apparent success withSME loan schemes, more commercial banks are moving in this direction. This shift isalso triggered by policy interventions and incentive schemes recently declared by theGovernment. For example, the central bank of the country provides commercial bankswith low rate funds to be offered to SMEs as loans at an interest rate of 10 per cent(as opposed to the regular rate between 14 per cent and 16 per cent). However, thereis a ceiling on SME loan amount – it cannot exceed $15,000, which is consideredinsufficient to make a serious investment. Furthermore, small enterprises are findingeven such loan programmes difficult to access for the reasons mentioned earlier.Consequently, the government policy interventions and incentives have remainedineffective.
4.3. HUMAN RESOURCES
Like the SMEs in any other sectors, the plastics sector SMEs are constrained bythe shortage of skilled workforce in many important areas, including technical,entrepreneurial and business management. Although the country has an old-fashionedvocational/technical education system, the number of graduates is small and the qualityof education is poor compared to the real market demand for skilled manpower bothat home and abroad.25 Of course, some SME sectors enjoy good specialized traininginstitutions. These sectors are: glass and ceramic industry; leather industry; textileindustry; and garment industry.
The plastics sector does not have any formal training institution and has to dealwith unskilled (and, in the case of SMEs, uneducated) workforce. Only a few largeenterprises can afford to invite expatriate trainers (primarily from India) to offer in-housetechnical training. SMEs have to place their unskilled employee under a supervision ofan experienced worker for on-the-job training hoping that the new employee, oncetrained, will continue to work for them. Sometimes SMEs are lucky, but most of thetime they are not. Many SME workers, after acquiring the necessary skills, tend to leavethe firm and join larger companies at higher salaries that SMEs cannot afford to pay.As a result, SMEs have hardly any return on their investment in human developmentstruggle with the low productivity of unskilled workers.
25 Two major factors contributing to this dismal scenario are capacity constraints and systemicfailures. With regards to capacity, the country has a significantly smaller amount of technical/vocational institutes than it requires. Moreover, most of the technical/ vocational institutes areconstrained by either its physical infrastructure or human resources or both. With regards to systemicfailure, there are at least two issues that need immediate attention. First, the system has largely failedto attract potential students to the vocational/technical training stream. Second, the macro levelfailure in the reduction of the widespread poverty has resulted in low educational attainmentbecoming a bottleneck to demand-driven education and training. The search of means for survivalforces most of the students of these vocational/technical institutes look for any kind of job – be ita low paid job or an easy, less costly certificate or degree. Ironically, the good news for SMEs is thatthese young people can be hired for a low wage but the bad news that comes together is that thesenew recruits are not skilled/educated or, at best, ‘inappropriately educated’ (in areas that has norelevance to the work where s/he is put in).

78
STUDIES IN TRADE AND INVESTMENT 70
There is no specialized institution for entrepreneurship development trainingin the country. Although there has been a burgeoning growth in the number ofbusiness schools since the 1990s, their contribution to entrepreneurship developmentis insignificant, if existing at all, particularly regarding entrepreneurship training for theplastics sector. Though there are graduates in business administration coming from over50 business schools but the plastics sector SMEs cannot hire them as SME salaries aretoo low.
Under such circumstances, the plastics sector SMEs is severely constrained inbuilding up its competitive strength. All the constraints hinder market access for SMEsboth domestically and internationally.
4.4. STANDARDS AND CERTIFICATION
Standardization and industrial certification are mandatory requirements forSMEs willing to become globally competitive. SMEs in Bangladesh, mainly serving thelocal markets, however, have yet to become seriously involved in the standardizationand certification processes. The Bangladeshi plastics industry needs to adopt adequatestandardization system and obtain international industrial certification in line withquality improvement. Currently, no international standard certification (such as ISO) isadopted in the local plastics sector, except for some large enterprises. Also, consumersare unaware of quality certification issues.
National
Appropriate standardization techniques for plastic products are yet to bedeveloped in Bangladesh. Bangladesh Standards and Testing Institution (BSTI) isresponsible for certifying product standards in Bangladesh. BSTI is incorporated underthe law entitled “The Bangladesh Standards and Testing Institution Ordinance,No. XXXVII of 1985.” Tasks of BSTI include preparation of standards for all articles,products, methods and services. To protect consumer rights, BSTI often comes up witha mandatory certification scheme under which certain products need approval fromBSTI before they are marketed. Food items, chemicals and jute-related products aremostly certified under this scheme. Unfortunately no standardization benchmark hasbeen set to measure the quality of plastic products in Bangladesh. Only one product,namely “table wear made of melamine plastic” is brought under mandatory certificationunder BDS (Business Development Services) code 1425:1993.
International
Some trade organizations have come up with standards for plastic products. In1988, Society of the Plastics Industry (SPI) developed resin identification code (RIC)system, identifying six thermoplastic resins most commonly used in manufacturingbottles and containers, in order to facilitate sorting during recycling process.26 The resintypes, identified in the SPI system, are as follows (PackagingLaw.com):
26 Society of the Plastics Industries (SPI): SPI is a body for monitoring and developing codes andstandards for the plastics industry at a global level. SPI is a United States-based trade association,

79
COUNTRY STUDIES ON BANGLADESH, NEPAL AND SRI LANKA
● Polyethylene terephthalate (PETE)● High density polyethylene (HDPE)● Polyvinyl chloride (PVC or vinyl)● Low density polyethylene (LDPE)● Polypropylene (PP)● Polystyrene (PS), etc.
SPI is working with the American Society for Testing and Standards (ASTS)International to adapt the RIC system to international standards for the universalapplication. ASTS has been developing standards for marking plastic products basedupon the RIC system developed by SPI in the 1980s. The proposed new standardWK20632 “Practice for Marking Plastic Products for Identification in Reuse and Recycling”is intended to facilitate the recycling of plastic articles through increasing the numberof recyclable materials while expanding the types of covered products to other resintypes.
It is clear that developed countries, such as the United States of America andthe European Union countries are adopting standards mainly for sorting and recyclingpurposes. If sorting is not done according to the resin type and the recycling processcontinues regardless of the type of plastics, the quality of the recycled resins willdegrade. Unfortunately, Bangladesh has not yet developed such standards to sortvarious types of plastic wastes properly. Therefore, locally recycled plastic granules arenot on par with international standards and, as a result, most of small and mediummanufacturers are losing export competitiveness.
Compliance
Bangladesh lacks resin identification code (RIC) system for efficient recyclingand, so far, no steps have been taken to develop this standard. Global standards ofrecycling practices should be adopted to ensure the long-term sustainability of thesector. Many manufacturers are unaware of the requirements of such standards thatwould ensure environmental protection.
It should be noted that full compliance with environmental and healthregulations is a serious concern for the plastics sector because of the very nature of theplastic products. Poor waste disposal and management system and the harmful impactcaused by the inefficient and improper treatment of plastic wastes are two other seriousissues. The health effect on both consumers and workers, particularly in the recyclingsegment, is a major source of concern. Many research studies and advocacy campaignshave been conducted to ensure occupational safety and good working conditions for
with headquarters located in Washington DC. SPI’s member companies include the entire plasticsindustry supply chain: processors, machinery and equipment manufacturers and raw materialssuppliers (www.plasticsindustry.org). SPI’s activities include alerting its members about code andstandard based issues that may impact plastic industries, ensuring that the members express theiropinions in code and standard making processes. It also cooperates with the WTO in implementingregulations, codes and policies for plastic industries. Bangladeshi manufacturers are still not veryaware of all those provisions of SPI.

80
STUDIES IN TRADE AND INVESTMENT 70
the garment industry workers, but little attention has been paid to those working inthe plastics sector. Although the country’s labour laws are applicable to the plasticssector as well, awareness is depressingly low, and enforcement of the laws is severelyweak.
4.5. POLICY AND REGULATORY FRAMEWORK
The plastics industry in Bangladesh, operating under regulatory and institutionalframework encouraged by the Government, is promoted through various incentives.Achieving global value chain competitiveness largely depends on how the frameworkfacilitates and promotes the future development of the plastics industry.
Bangladesh Investment Regime
To promote investment, the Government of Bangladesh has liberalized itsindustrial and investment policies over the past couple of decades by introducing pro-business policies, reducing administrative control and opening up many areas for privatesector investment. Major incentives for all kinds of industrial enterprises are as follows:
● Tax exemptions: Generally five to seven years. However, for powergeneration, exemption is allowed for 15 years.
● Export/Import Duties: No import duty on raw materials (and in some casesmachinery) for export-oriented industries. For other industries it is at fiveper cent ad valorem.
● Tax law: Double taxation can be avoided when foreign investors operateon the basis of bilateral agreements.
● Exemption of income tax: Up to three years for the expatriate employeesin industries specified in the relevant schedule of income tax ordinance.
● Remittance: Facilities for the full repatriation of invested capital, profit anddividend.
● Exit: An investor can wind up an investment either through a decision ofan annual general meeting (AGM) or an extraordinary general meeting(EGM). Once the foreign investor completes the formalities to exit thecountry, he can repatriate the sales proceeds after securing a properauthorization from the central bank.
● Ownership: A foreign investor can set up a venture either as a whollyowned operation or as a joint collaboration with local partners.
SME Policy Strategies
Bangladesh aims to create a market-based economy with a level playing fieldfor all enterprises, where SMEs can aspire to grow and create wealth using their ownendowments, diligence, innovation and management. Some of the key objectives ofthe current SME policy include:
● Accept SMEs as indispensable players in growth acceleration and povertyreduction;

81
COUNTRY STUDIES ON BANGLADESH, NEPAL AND SRI LANKA
● Encourage and induce SME development and promote the growth of FDI,develop code of ethics and establish good governance, ICT-basedknowledge management and customer supremacy in the market;
● Identify and establish an appropriate physical and ICT network ofinfrastructure and institutional delivery mechanism that facilitate thepromotion of SMEs;
● Reorient the existing fiscal and regulatory framework and governmentsupport institutions towards facilitating the achievement of SMEs policygoals;
● Nurture and partner civil society institution(s) with credible managementteams providing the required services, leadership, initiation, counseling,mentoring and tutoring;
● Create innovative and meritocratic arrangements so that small enterpriseswith the proven entrepreneurial track record and/or promise could beoffered financial incentives;
● Help implement dispute settlement procedures that proactively shieldsmall enterprises, especially from the high legal costs and insidiousharassment;
● Take measures to create possibility of providing credit without collaterals;and
● Systematically accord precedence to small enterprises over mediumenterprises, especially with regards to limited government resources.
While SMEs development policies and strategies in Bangladesh are sound andprogressive, the implementation mechanism and institutions, responsible for enactingthese policies, require further strengthening in terms of resources, including humanresources and financing.
Box 2: Institutional framework for promotion of the plastics industry in Bangladesh
(i) Bangladesh Plastic Goods Manufacturers and Exporters Association (BPGMEA):
BPGMEA is a leading private sector association for all plastic goods manufacturersin Bangladesh responsible for safeguarding the interests of the plastics sector in Bangladeshand developing trade opportunities both nationally and internationally. It deals withmatters relating to government regulations, patent rights and import and exportregulations. The association also serves as a contact point for overseas companies whowant to buy or sell Bangladeshi plastic products.
(ii) Dhaka Chamber of Commerce and Industry (DCCI):
DCCI is the largest and most active Chamber of Commerce and Industry in thecountry for SMEs. It was established in 1958 and serves as a nonprofit, service-orientedorganization. DCCI basic functions include promotion and development of trade,commerce and industry. DCCI provides market-oriented inputs to the Government in theformulation and implementation of policies regarding import, export, industry, investment,banking, insurance, fiscal measures and annual budget. DCCI also liaises with other
82
STUDIES IN TRADE AND INVESTMENT 70
international trade related organizations and frameworks, such as WTO, UNCTAD, SAPTA,SAFTA and BIMST-EC. DCCI is an important stakeholder in the plastics industry and othermajor industries in Bangladesh.
(iii) Small and Medium-sized Enterprises Foundation (SMEF):
SMEF is created as an independent centre for the betterment of SMEs inBangladesh, under the auspices of the Ministry of Industries (MOI), the Government ofBangladesh. The main objective of the foundation is to promote, support, strengthen andencourage the growth and development of SMEs in all productive sectors of the economyand to plan, programme and finance private sector organizations, including chambers,associations, trade bodies and research and development institutions. It is mandated tofacilitate SMEs access to finance by creating and supporting appropriate strategies andinstitutions. The foundation assists the plastics sector development along with 11 otherindustrial sectors outlined in SME Policy Strategies 2005 as thrust areas.
(iv) Bangladesh Small and Cottage Industries Corporation (BSCIC):
BSCIC is the prime mover organization entrusted with development of small and cottageindustries (SCI) in Bangladesh. It is an autonomous corporation that was established in1957 by an Act of the Parliament, and it operates under the auspices of the Ministry ofIndustries. It is the successor organization of East Pakistan Small and Cottage IndustriesCorporation (EPSCIC). BSCIC is mandated to provide: pre-investment counselling, post-investment extension services, technical information, design and prototype of handicrafts,industrial profiles and fact sheets, marketing information, infrastructural facilities, skilldevelopment training, entrepreneurship development training, in-plant advisory servicesand credit facilities to various industrial enterprises, including the SMEs in the plastics sector.
4.6. INFRASTRUCTURES AND UTILITIES
Adequate provision of infrastructural facilities and the supply of basic utilitiesfor the industries are considered a primary requirement for the industrial promotionand growth. As the plastics industry is maturing, becoming one of the key exportsectors in Bangladesh, it is most desirable that it be adequately supplied with therequired infrastructure for future development. Such key infrastructure, including thetransportation and public utilities systems are essential for facilitating effective businessactivities.
Bangladeshi plastics sector, however, is constrained with constant electric powercrisis, as well as insufficient gas and water supply. Currently, electricity is the majorhurdle for the accelerated industrial growth in Bangladesh. The plastics industry ishighly automated compared to many other industries in Bangladesh, including SMEssector, and requires stable and constant electricity supply without which the productionis impossible. The situation becomes worse in the hot season when electricity demandreaches its peak. Due to the lack of adequate supply of electricity, larger plastic goodsmanufacturers often run their factories on gas generators. However, due to a heavyload shedding of electricity and an interrupted supply of gas (both of which causefrequent generator shutdowns), plastic producing units have low capacity utilization.

83
COUNTRY STUDIES ON BANGLADESH, NEPAL AND SRI LANKA
Besides electricity problem, SMEs have to deal with irregular water supply andsevere congestion of transport infrastructure. As most of the plastic procuring andproduction units are located in Dhaka area (figure 9) and Dhaka area has densepopulation, narrow roads, poor traffic management system, outdated and overusedwater supply system and old building structures, the plastics industry enterprises areexperiencing difficulties in developing efficient production and distribution systems.Incidentally, except for the plastics recycling subindustry, water is not a direct elementof production process of plastic goods, and therefore the water supply shortage is notsuch a serious a problem as the crisis of power supply. But if the plastics sector is tothrive at the backdrop of recycling industry, for both economic and environmental
Figure 9: Dhaka City Map
Source: www.banglapedia.org.

84
STUDIES IN TRADE AND INVESTMENT 70
reasons, and at the backdrop of other industries, such as light engineering, it must haveaccess to all necessary infrastructural support required for its core operations as wellas for its support industries. This very fact makes a strong the case for a developmentof an independent special industrial park for the plastics sector (along with its corelinkage industries).
5. Strategic Analyses
This section of the study presents SWOT and triple triangle framework (TTF)analyses and identifies major impediments to the growth of the plastics sector inBangladesh. Both types of analyses create a basis for business competitiveness actionplan proposed in the next section.
5.1. SWOT ANALYSIS
Strengths
The major strengths of the plastics industry in Bangladesh include, among otherthings, a large pool of entrepreneurs, simple technology and trusted collaborationamong value chain partners.
● One of the main reasons the plastics industry in Bangladesh is developingat both the small and medium levels is the availability of cheap labour. Ingeneral, SME entrepreneurs in Bangladesh work with relatively low profitmargins and low wages compared to not only developed countries but alsoto many developing countries in Asia and the Pacific, particularly India andChina.
● The number of SME plastic manufacturers in Bangladesh is as high as threethousand. In addition, many other industries SMEs are engaged at variouslevels of the plastics industry value chain. Altogether, this presents anindication of enormous entrepreneurial interests within the plasticsindustry in Bangladesh.
● Increasing trust and collaboration among value chain partners andcompetitors has resulted in smooth operation within the sector. Also, thereis a growing dependence on value chain partners, particularly among SMEs.
● Increasing exposure to external markets has allowed large industry playersto benefit from international exposure contributing to deeperunderstanding of global market dynamics and helping to establish a long-term strategy for export marketing.
● Large fast growing domestic market and domestic demand for low-endplastic products has facilitated the development of local plastic industry,particularly the SME sector. It should be noted that low priced items arein huge demand compared to the existing supply capacity. Also thedemand for higher end domestic plastic utensils is increasing and most oflarge players are expanding their existing projects.
● The plastics industry adopts simpler technologies compared to other heavyindustries. Adoption of less sophisticated technologies has led to a growth

85
COUNTRY STUDIES ON BANGLADESH, NEPAL AND SRI LANKA
of plastic products used by other sectors, such as light engineering sectorin Bangladesh.
● A large amount of export earnings (deemed export) from the plastic goodssector comes from RMG export. As the RMG industry in Bangladesh is amature sector and is expected to grow further, the plastics industry shouldbenefit strongly from the trend.
Weaknesses
Major weaknesses of the plastics industry include weak backward linkages(particularly mould-making facilities), lack of skilled manpower and rudimentaryrecycling practices. These and other difficulties are elaborated on below.
● Absence of equipment and machinery manufacturing facilities, particularlymould-making units, puts Bangladesh at a disadvantage, as reliance onexports from China and India is pretty costly. This weakness remainsa serious one as entrepreneurs are reluctant to invest in equipment/machinery in an uncertain environment of long-term prospects forgas/electricity supply and the Government policy direction.
● There is a serious shortage of skilled labour in the plastics industry. Thesituation worsens when it comes to equipment repair and maintenance.The problem is particularly serious for small and medium-sized enterprisesbecause (i) they cannot afford in-house professional training for theirworkers and (ii) trained labourers leave SMEs to join larger firms to gethigher salaries and compensation packages.
● Relying on outdated and traditional technologies makes plastic recyclingprocess unclean and inefficient. The problem gets exacerbated withthe existing waste disposal and management system that is notenvironmentally friendly. As a result, the quality of recycled raw materialsremains low.
● The industry lacks uniform quality standards and modern quality controlpractices, particularly as it relates to the use of raw materials and labellingof material codes. As a result, the absence of level playing field affects faircompetition.
● Thare is a lack of long-term vision among entrepreneurs. Most ofentrepreneurs in the SME segment of the plastics industry are satisfied withthe current level of earnings. They do not actively seek new markets orproduct diversification. They do not think of exporting their products sincethe domestic market is large enough for survival. When the local marketgets competitive, only then they might look for new markets for survival.This attitude is prevalent in small and medium sized units.
Opportunities
The plastics industry in Bangladesh has good potential for development in bothdomestic market and export markets. If these opportunities could be capitalized onthrough policy reforms and other support services, the plastics industry in Bangladesh

86
STUDIES IN TRADE AND INVESTMENT 70
could achieve significant growth in the future. The opportunities in domestic marketand international markets are described below:
● There are still good prospects in the domestic markets where plasticmanufacturers can enter profitably. In the household segment, moreexpensive wood-based products can be replaced by less costly plasticproducts. For instance, in the recent years the local market has seen anexponential growth in the demand for plastic furniture. There are otherareas where manufacturers can explore the needs and expand the market.
● Presently, Bangladesh produces mainly basic plastic products andpossesses a nominal share in the global production. Therefore, there isa huge potential to compete in the international market through productdiversification and quality improvements. It should be noted that plasticproducts global demand has been growing steadily at around 20 per centa year (in the period between 2003 and 2007). Moreover, deemed export(along with RMG, pharmaceuticals and other products) is also growing ata steady rate. In fact, the growth is seen mostly at the deemed exportcategory. The fact that the developed world is moving away from suchexport category (particularly in the low-value segment) is creatingopportunities for countries such as Bangladesh. The cost advantage intransportation to the eastern India is also a big opportunity to expand theexport market in that region.
● Deemed export of plastic goods, influenced by the growth of the RMGsector,is becoming very important over time. The fact that the plasticsindustry is now working as a backward linkage industry for many localindustries, especially the RMG and pharmaceuticals, has created a lot ofopportunities for value added within the country. If more forward linkageindustries such as food processing, agriculture, electrical and electronicsdevelop and mature, the plastics sector will experience a robust growth.Conversely, if the plastics sector becomes competitive, these forwardlinkage industries will enjoy cost advantage.
● During the period of July 2007 – January 2008, Bangladesh exported plasticwastes amounted to $6 million. Despite huge demand for recycled rawmaterials inside the country, these products were exported because ofa lack of proper technology for waste recycling in Bangladesh. This alsoforces the industry to raise the quality of recycled raw materials.Introduction of better technology would not only save the environmentbut also create huge opportunities for recycling these productsdomestically and would significantly reduce the reliance on plastic rawmaterials imported from abroad at high prices.
Threats
The plastics sector in Bangladesh faces threats that constrain its growth. Themost immediate threats that should to be addressed are presented below.

87
COUNTRY STUDIES ON BANGLADESH, NEPAL AND SRI LANKA
● The principal constraint for the growth of the plastics sector in Bangladeshis the recurring energy crisis and frequent electricity blackouts. Despitehuge market potential and unsatisfied demand, the industry is unable toproduce and expand due to its inability to utilize the existing capacity asthe supply of energy has been limited and uncertain. Many SME units areactually finding it difficult to survive because of constant power failures thatthey experience four to six times a day. Though large manufacturers dealwith daily power disruptions by installing power generators, SMEs are notin a position to do so.
● Many of the government policies and practices do not provide enoughsupport to domestic plastic producers. For example, while somegovernment institutions (such as Ministry of Defense) offer purchasetenders, importers of finished products usually get an advantage over thelocal producers due to a requirement to pay 15 per cent VAT in addition toimport tariffs on imported raw materials. Enterprises producing packagingmaterials for the pharmaceutical industry are facing similar problems. Suchpolicies have a negative impact on the growth of domestic enterprises.
● Bangladesh does not have a proper waste disposal for the used plasticsproducts similar to that of developed countries. As a result, plastic wastesget mixed with other wastes making it difficult to use for recycling. Plasticwaste, if not collected and recycled properly, could pose a serious threatto environment and health.
● Since plastic granules price is directly correlated with crude oil prices, a hikein crude oil prices affects SMEs greatly and puts them at a disadvantage inimport competition compared to large enterprises.
● The industry might face embargo at any time on the grounds of social andenvironmental incompliance. The threat is significant for SMEs involvedin direct or deemed exports.
5.2. TRIPLE TRIANGLE FRAMEWORK ANALYSIS
The SWOT analysis could be further structured using the elements of the tripletriangle framework (TTF), which was mentioned earlier in the introduction (Figure 3.1).The framework focuses on the factors affecting business environment at three differentlevels. The first level deals with firm’s internal factors, i.e., micro-level factors that affectsome of the firms more than the others. The second tier deals with industry-level factors,which affect all the firms across the industry. The third tier deals with macro-level factorswhich include, among other things, the required policy and infrastructural framework.
Firm’s internal or micro-level factors
The factors that constrain growth and expansion of firms, include: i) lack oftrained and experienced human resources, particularly mould makers, machineoperators, and skilled technicians for the repair and maintenance of machines; ii) limitedaccess to formal institutional loans and a requirement of bank guarantee for bondedimport of raw materials; and iii) limited current operational activities aimed at survival,lack of plans for future expansion and growth.

88
STUDIES IN TRADE AND INVESTMENT 70
Industry-level factors
Competition and non-branded products: Currently, except for some largemanufacturers, many plastic sector SMEs in Bangladesh are producing non-brandeditems. As the local demand is very high, most producers are not concerned withcreating a brand name and improving the product quality. Although presently plasticssector SMEs do not experience any problems in the domestic market, they cannotcompete at the global level due to a lack of brand names as well as low product quality.The growth could have been much faster and robust, including in the global market,had SMEs put more efforts in product quality improvements and creating brand names.
Collaboration and quality certification: Due to a lack of proper standardizationand quality certification facilities, plastic products in Bangladesh are unable to attainrecognition in international markets. Though there are institutions willing to assist inquality improvements and certification, but due to the absence of formal collaborativelong-term arrangements, the possibilities are yet to be explored.
Improved recycling practices: Poor collection of waste materials and improperrecycling practices has been responsible for the poor quality of recycled materials andhence poor quality products. This in turn forces the plastics industry SMEs to rely onexpensive virgin raw materials raising the cost of production.
Innovation in production and marketing: There is a huge opportunity to createnew demand in the domestic market by introducing new plastic products. Also, largeB2B customer segments could be captured if plastic items that are currently importedcould be produced locally. Likewise, the role of the country’s foreign missions, topromote Bangladeshi products through economic diplomacy, need to be strengthened.Of course, some of government agencies (e.g., Export Promotion Bureau) dooccasionally arrange trade fairs and exhibitions abroad to attract foreign buyers; yetthese efforts are limited compared to what needs to be done to enter foreign marketsand capture the untapped export opportunities.
Technological upgrading: Technology transfer and technology upgrading arenecessary to maintain and promote competitiveness. There are enormous technologicallags in mould making and recycling in Bangladesh.
Macro-level factors
Macro-level factors affecting the company emerge from a complexinterrelationship among the factors that are beyond the control of any specific industryor its constituent firms. The outcome of this interplay influences all the firms in theindustry. These factors – mainly linked to governance and state support, globalizationdynamics and the interaction of international forces – are the major determinants ofthe macroeconomic environment in which the industry and its constituent firmsoperate.
State support: Although Bangladesh offers a predictable policy directioninvolving the role of market vis-à-vis state (Jahan 2008b), the plastics industry needsa comprehensive and consistent policy guideline from the government to keep up and

89
COUNTRY STUDIES ON BANGLADESH, NEPAL AND SRI LANKA
accelerate the existing rate of growth. The plastics industry needs a proper governmentarrangement of an uninterrupted power supply,, the single most important obstacleaffecting industry growth. Furthermore, the government should introduce favourabletax policy, establish of specialized industrial zones and increase government purchase.These initiatives would certainly give a huge boost to growth in this sector.
Although the plastics sector is in the list of thrust sectors, it is not included inthe first list of Highest Prioritized Export Development Sectors declared by ExportPromotion Bureau. As a result, the industry fails to receive such benefits as taxconcessions, better access to institutional credit and other preferential facilities awardedto the industries included in the first list of Highest Prioritized Export DevelopmentSectors.27
To compete globally, local manufacturers must be proficient in understandingforeign market dynamics and the issue of compliance to international mandates andrequirements. Lack of skill and knowledge in these areas makes the plastics industryless competitive globally. Most of entrepreneurs are completely unaware of the relevantprovisions in international trade treaties of which Bangladesh is a party. They hardlysee any relevance of regional agreements and facilities such as SAPTA, BIMSTEC,EU-GSP, etc. Many of entrepreneurs are unaware of many specific requirements andbenefits under the provision of multilateral trade system, particularly the World TradeOrganization.
6. Business Competitiveness Action Plan
To accelerate the growth of the plastics industry in Bangladesh, the obstaclesdiscussed above should be removed or minimized and the strengths should be furtheraugmented. To reach this aim, the following actions should be initiated.
6.1. ADDRESSING THE FIRM LEVEL FACTORS
Capacity building
● Skills development programme: To meet the immediate need for theskilled workforce, plastics industry specific training and skills developmentprogramme should be initiated, particularly focusing on:a. Plastics industry machines operation and maintenance;b. Plastics engineering;c. Heat treatment;d. Quality control;e. Mould design and making;f. Product design;g. Work safety issues;h. Waste management; andi. Standardization and quality control.
27 The benefits are granted to the sectors that are included in the official list of Highest PrioritizedExport Development Sectors as decided by the Government of Bangladesh from time to time.

90
STUDIES IN TRADE AND INVESTMENT 70
Although firm-level actions are required in most of these cases, capacity-building efforts should be launched primarily on a basis of public-private partnerships.BPGMEA, BSCIC, DCCI, SMEF and Ministry of Industries could act as collaboratingpartners. Special SMEs requirements should be assessed and priority programmesshould be organized with the Government support in a cost-effective manner.
If experts are needed from the developing economies having advanced plasticssectors such as China, India, Taiwan Province of China and Thailand, such experts shouldbe hired to organize workshops to provide hands-on training to the local employees.In addition, business visits to those economies can help entrepreneurs get an idea ofmodern plastics industry practices and assess their applicability in Bangladesh thusimproving the local industry practices. In the long-term, a separate department/institute, like the ones already existing in textile engineering, leather engineering orfashion design should be established to facilitate product development, standardizationof production, innovation and market research. The project should be undertaken aseither a public sector project or as a public private partnership (PPP).
Capital: access to finance
● Access to credit and availability of financing should improve significantlyfor the plastics industry SMEs. It could prove beneficial to reduce collateralrequirements, educational qualifications and technical conditions so thatenterprise growth potential could be the only basis for financing SMEs. Inthis case the Government could guarantee such loans to SMEs perhapsthrough public loan guarantee scheme.
● Dialogue could be organized to ensure credit at a lower rate for the plasticsindustry SMEs. Implementation partners for this project could be Ministryof Finance, Ministry of Industries, Ministry of Commerce, Bangladesh Bank,Commercial Banks, EPB, SMEF, BPC, FBCCI and DCCI, as well as trade bodies,professional associations and Chambers.
● In case of raw materials import, bank guarantee requirement for bondedimport should be reduced to facilitate working capital to SMEsmanufacturers.
6.2. ADDRESSING THE INDUSTRY LEVEL FACTORS
Industry-wide customer oriented fair competition and strategic collaborationwith value chain partners and other stakeholders are critical success factors shapingthe sector’s competitiveness. These factors are discussed below.
Customer and market access
● Capacity of plastics sector SMEs in Bangladesh should include a wide rangeof products for domestic and international markets. Creation of newproduct categories has proven to be a key to success. Some of examplesinclude wood furniture substituted with plastic furniture and metal pipessubstituted with PVC pipes. These examples demonstrate the willingnessof the local market to accept new products that makes good economicsense.

91
COUNTRY STUDIES ON BANGLADESH, NEPAL AND SRI LANKA
● Encouraging local industries and institutions (i.e., B2B clients) to use locallymade intermediate and finished plastic goods is a smart way of enlargingthe market size.28 Although this is a pure business proposal, theGovernment has a big role to play in this plan. For example, theGovernment could facilitate this plan by ensuring, among other things,a level-playing non-discriminatory tax regime.
● Campaigns to identify new and enter the existing export markets shouldbe undertaken under a strategic framework. Campaigns should besupported by extensive market research and should be conducted with thehelp of private sector firm(s). BPGMEA, DCCI, EPB and the Chambers shouldtake the lead in this regard.
● Trade-fairs and exhibitions at national and international levels should bearranged reach new markets and expand the existing ones. Industry-specific fairs for plastic products should be arranged more frequentlydomestically and internationally. DCCI, SMEF, BPGMEA, Ministry ofCommerce and Ministry of Industries ought to collaborate in arrangingsuch events.
Competition and branding
● Efforts should be taken to create a level-playing field for fair competitionfor the plastics industry in Bangladesh, particularly addressing the issuesof quality, standards and competitive international prices. Such driveshould be led by BPGMEA, the main industry association of the plasticssector.
● Establishment of national brands – individually at a firm level andcollectively at a national level (“Made in Bangladesh”) – is crucial topromote competition domestically and internationally.
6.3. ADDRESSING MACRO-LEVEL FACTORS
Macro level factors, such as technological level, government policies and accessto information have an impact on all industries operating within an economy. This isparticularly important for the plastics industry, as the sector is emerging as one of themost promising manufacturing sectors in Bangladesh.
Technological support
● Mould making technology: Proper mould preparation and maintenanceshould be achieved in the mould-making industry. Feasibility study of localhigh-quality mould making industry should done to minimize costs.Institutions such as Bangladesh University of Engineering and Technologyshould be asked to participate in the study together with plastics industryrepresentatives.
28 It should be mentioned that, besides the RMG industry, the pharmaceutical industry has recentlystarted procuring locally made plastic packaging materials. Although scores of challenges still exist,the general picture is quite encouraging.

92
STUDIES IN TRADE AND INVESTMENT 70
● Recycling technology: Introduction of better technology in the recyclingindustry has become essential for the long-term sustainability of the plasticindustry. Proper workshops and training should be arranged todisseminate the technological know- how of quality recycling procedures.
● Product design technology: Training services on the use of CAD/CAM anddesigning software should be arranged to improve product design andinnovation. A central research and development cell in BPGMEA shouldbe established to provide support to SME manufacturers.
● Quality and standardization: BSTI should be equipped with modernamenities and trained professionals in order to facilitate standardizationand quality improvement measures. In the Export Policy 2009-2012, theGovernment promised to establish proper laboratory facilities and meansfor standardization (EPB 2009). This factor has a high priority.
State support: policy, infrastructure and institution
● Uninterrupted energy supply: The Government should undertake everyeffort to ensure uninterrupted power and energy supply for at least eightto twelve hours a day. This is a must in order to minimize labour and rawmaterial waste. The industry should have the facility of getting prioritypower connection and gas supply. Uninterrupted power supply could beachieved by establishing separate power plants – Common CommercialPower Plants – for industrial clusters.
● Industrial parks: Establishment of industrial parks for the plastics industryhas become a must for several reasons, including: i) ensuring properinfrastructure; ii) nurturing SME producers; iii) providing specialuninterrupted utility services; iv) avoiding environmental hazards; andv) ensuring compliance. The decision regarding the establishment of suchcluster park should be implemented without delays.
● Tax regime: The government should introduce consistent, coherent andpro-business tax regime. It should follow a procurement system (for its ownagencies) that ensures level-playing field for all types of industry players.To make the local plastics industry more competitive, the Governmentcould consider offering certain incentives for the firms that are the plasticssector’s B2B clients from other industries and that use locally made plasticintermediate goods. Such incentives could be provided in the form ofreduced corporate income tax, and/or in any other way that do not conflictwith international trade treaties and obligations.
● Plastic waste disposal: The Government, in collaboration with otherstakeholders, should support public awareness campaigns in order tochange the negative attitude that people have about plastic and to educatepeople about the proper use and disposal of plastic products. Thecampaigns should be backed by an introduction of an innovative plasticwaste disposal-collection-recycling mechanism.
● Research-based database: A nationwide sample survey should beconducted in order to create a database for taking informed policy

93
COUNTRY STUDIES ON BANGLADESH, NEPAL AND SRI LANKA
decisions and providing priority assistance.
● Sector-specific policy: There is hardly any coordinated sector-wide policyavailable for the plastics industry in Bangladesh. Given the sector’spotential, the Government should formulate sector-specific industry policyto ensure all-out support for the growth of this burgeoning sector.
● Certification process: Registration and other related requirements andprocesses should be simplified. Currently SMEs are required to have30 different registration documents, such as registration certificate, tradelicense, BSTI certification, VAT registration, fire license, boiler license,environmental clearance certificate, etc. from different governmentalbodies. SMEs documentation process should be brought under oneumbrella in order to reduce the cost of doing business.
International dimension: compliance and beyond
● Compliance: Institutional arrangements for foreign markets complianceand requirements should be provided to make local manufacturers awareof the global market mandates and multilateral trade systems. Suchcounseling should focus on: i) compliance issues; ii) certificationrequirements; and iii) global business practices.
● Trade and commercial diplomacy: Trade and economic sections ofBangladesh’s foreign missions should be staffed with business professionalswho could represent and protect the country’s business interests inbilateral and multilateral trade negotiations and treaties. The trademissions should be backed by proper research-driven market intelligenceand sound strategic framework.
National action plan
Table 3.9 presents a comprehensive business competitiveness action plan forthe plastics sector in Bangladesh. It outlines strategic goals, objectives, current scenario,actions recommended and parties involved. The Government in collaboration withdevelopment partners (e.g., UNESCAP, UNIDO, ADB, etc.) and industry associations(e.g., BPGMEA) should take actions strengthening the value chain competitiveness inthe plastics industry and making it a prominent export-earning source.
To reach this goal, a few critical areas that require immediate attention areidentified and presented below.
(a) Help SMEs attain cost competitiveness, particularly by ensuring properinfrastructural support through creating industrial parks and providinguninterrupted electricity supply, as well as by undertaking a businessfeasibility study on mould making in line with public-private partnership.
(b) Ensure sustainable competitive advantage by designing and launchinga sound, strategic campaign promoting ‘green plastic’ in collaboration withother stakeholders.

94
STUDIES IN TRADE AND INVESTMENT 70
(c) Develop human resources engaged in manufacturing activities byproviding technical skill development programmes. Special trainingprogrammes for SMEs entrepreneurship development, masteringmanagerial and marketing as well as accounting techniques should alsobe organized.

95
COUNTRY STUDIES ON BANGLADESH, NEPAL AND SRI LANKA
Tab
le 9
: B
usi
nes
s co
mp
etit
iven
ess
acti
on
pla
n fo
r th
e p
last
ics
sect
or
in B
ang
lad
esh
To b
eco
me
a g
lob
al m
ark
et p
laye
r in
the
pla
stic
s in
du
stry
rea
chin
g a
ma
rket
siz
e o
f USD
two
bill
ion
by
2015
an
d U
SD fo
ur
bill
ion
by
2020
fro
m th
e cu
rren
t lev
el o
f USD
on
e b
illio
n th
r ou
gh
su
sta
ina
ble
co
mp
etit
ive
ad
van
tag
e.
Stra
teg
ic G
oal
sSt
rate
gic
Ob
ject
ives
Cu
rren
t Sc
enar
ioSt
rate
gic
Act
ion
sA
gen
cies
Invo
lved
Go
al #
1Ac
hiev
ing
the
plas
tics i
ndus
try
sust
aina
bilit
y
Dev
elop
ing
back
war
dlin
kage
cap
abili
ty in
mou
ld m
akin
g
●So
me
smal
l SM
E m
ould
mak
ing
fact
orie
s ar
e cu
rren
tlypr
oduc
ing
low
qua
lity
mou
lds.
Thes
e m
ould
s ar
e pr
imar
ilybe
ing
used
to p
rodu
ce lo
w-e
ndpl
astic
pro
duct
s fr
om re
cycl
edgr
anul
es. A
ll bi
g pl
ayer
s ar
eim
port
ing
mou
lds
from
abr
oad.
This
, in
turn
, cau
ses
the
pric
e of
end
prod
ucts
to g
o up
as
impo
rted
mou
lds
are
cost
ly.
●In
itiat
e a
feas
ibili
ty s
tudy
for
deve
lopi
ng a
mou
ld m
akin
gfa
cilit
y to
cat
er to
the
mid
- and
high
-end
mar
ket (
Expl
ore
publ
ic p
rivat
e pa
rtne
rshi
p or
FDI j
oint
ven
ture
opt
ions
for
esta
blis
hing
a c
entr
al m
ould
mak
ing
faci
lity)
.
●A
rran
ge tr
aini
ng p
rogr
amm
esto
dev
elop
cap
able
mou
ldm
anuf
actu
ring
wor
kfor
ce
●Ta
ke im
med
iate
act
ions
toin
crea
se p
ower
gen
erat
ion
and
indu
stria
l gas
sup
ply.
Initi
atio
n: G
oB, J
ICA
ESC
AP,
BPG
MEA
Actio
n: I
BA, B
SCIC
, bus
ines
sas
soci
atio
ns
●Po
wer
bla
ckou
t is
ram
pant
: it
happ
ens
four
to s
ix ti
mes
a d
ayla
stin
g on
e ho
ur o
r so
and
ham
pers
SM
Es p
rodu
ctio
nsc
hedu
les.
●Bi
g pl
ayer
s ar
e no
t get
ting
gas
supp
ly fo
r ext
ensi
on p
roje
cts.
●Bu
sine
sses
hav
e no
kno
wle
dge
of th
e G
over
nmen
t’s fu
ture
polic
y di
rect
ion
and,
ther
efor
e,pr
efer
sho
rt-t
erm
inve
stm
ent
proj
ects
to lo
ng-t
erm
one
s,de
priv
ing
them
selv
es o
f the
bene
fits
of e
cono
mie
s of
sca
le.
Gua
rant
eein
g sm
ooth
supp
ly o
f ele
ctric
ity/g
asG
oal
#2
Crea
ting
favo
urab
lebu
sine
ssen
viro
nmen
t for
low
-cos
tco
mpe
titiv
ead
vant
age
GoB
and
/or
GoB
-pat
roni
zed
priv
ate
sect
or(t
hrou
gh P
PP a
rran
gem
ent w
ithth
e su
ppor
t fro
m o
rgan
ized
non
-re
side
nt B
angl
ades
his
(NRB
s) a
ndca
pita
l mar
kets
Ensu
ring
polic
yco
nsis
tenc
y an
dpr
ovid
ing
a lo
ng-t
erm
polic
y di
rect
ion
●D
evis
e an
d st
ick
to th
e lo
ng-
term
pol
icy
dire
ctio
n,pa
rtic
ular
ly in
the
fisca
l (ta
xre
gim
e) a
nd in
dust
rial p
olic
yis
sues
.
Initi
atio
n: G
oB, B
PGM
EA
Actio
n: M
arke
t dev
elop
men
tex
pert
s/po
licy
anal
ysts

96
STUDIES IN TRADE AND INVESTMENT 70
Rem
ovin
g an
ti-pr
oduc
tion
(and
pro
-impo
rt) t
ariff
bia
s●
Alth
ough
the
offic
ial t
ariff
on
finis
hed
prod
ucts
is h
ighe
rth
an o
n in
term
edia
te g
oods
and
raw
mat
eria
ls,
gove
rnm
ent p
urch
ase
clau
seof
ten
favo
urs
impo
rts
over
loca
l pro
duct
ion,
as
the
latt
eris
sub
ject
ed to
a 1
5 pe
r cen
tVA
T.
●G
over
nmen
t pur
chas
ede
cisi
ons
and
supp
ort t
o ot
her
indu
strie
s (e
.g.,
phar
mac
eutic
als)
sho
uld
not
adve
rsel
y im
pact
loca
l pla
stic
prod
uctio
n.
●Ra
tiona
lizat
ion
of ta
riff
stru
ctur
e cr
eatin
g a
non-
disc
rimin
ator
y le
vel p
layi
ngfie
ld fo
r dom
estic
pro
duce
rsan
d im
port
ers.
●Se
nsiti
zatio
n ca
mpa
ign
shou
ldbe
des
igne
d an
d ru
n to
impr
ove
the
situ
atio
n.
MoF
,G
over
nmen
t Age
ncie
s,BP
GM
EA
Initi
atio
n: B
PGM
EA &
MoI
/GoB
Actio
n: P
rofe
ssio
nals
/priv
ate
firm
s
●G
over
nmen
t offi
cial
s ha
vene
gativ
e at
titud
e to
bus
ines
san
d de
mon
stra
te re
nt-s
eeki
ngbe
havi
our.
●A
lthou
gh th
e G
over
nmen
t is
impa
ctin
g th
is s
ecto
r thr
ough
num
erou
s po
licy
inte
rven
tions
, the
re is
no
com
preh
ensi
ve p
last
ics
indu
stry
pol
icy.
●Pe
ople
are
not
aw
are
of p
rope
rw
aste
dis
posa
l and
no
soun
dw
aste
man
agem
ent
mec
hani
sm e
xist
s.
Prom
otin
g pr
o-bu
sine
ssgo
vern
men
t mac
hine
ries
Form
ulat
ing
dedi
cate
dpl
astic
s in
dust
ry p
olic
y●
Giv
en th
e se
ctor
’s en
orm
ous
pote
ntia
l the
Gov
ernm
ent
shou
ld d
ecla
re it
as
a st
rate
gic
sect
or a
nd m
ake
it a
part
of
the
bigg
er e
xpor
t-or
ient
edin
dust
rializ
atio
n (E
OI)
stra
tegy
.
●Sp
ecia
lized
pla
stic
was
tem
anag
emen
t sys
tem
MU
ST b
ede
velo
ped.
●Se
nsiti
zatio
n ca
mpa
igns
shou
ld b
e de
sign
ed a
nd ru
n.
Initi
atio
n: G
oB/E
PB/M
oI
Actio
n: P
rofe
ssio
nals
/priv
ate
firm
s
Initi
atio
n: L
ocal
gov
ernm
ent/
city
corp
orat
ions
/BPG
MEA
/ MoI
/de
velo
pmen
t par
tner
s an
d ot
her
stak
ehol
ders
(med
ia)
Actio
n: P
rofe
ssio
nals
/priv
ate
firm
s
Prom
otin
g a
soun
dre
cycl
ing
cultu
reG
oal
#3
Prom
otin
g ‘G
reen
Plas
tic’ f
orsu
stai
nabi
lity
Tab
le 9
: (c
ontin
ued)
Stra
teg
ic G
oal
sSt
rate
gic
Ob
ject
ives
Cu
rren
t Sc
enar
ioSt
rate
gic
Act
ion
sA
gen
cies
Invo
lved

97
COUNTRY STUDIES ON BANGLADESH, NEPAL AND SRI LANKA
●If
such
pra
ctic
e co
ntin
ues,
extr
aord
inar
y pr
essu
re w
illco
me
from
env
ironm
enta
l and
soci
al g
roup
s an
d th
e in
dust
ry’s
sust
aina
bilit
y w
ill b
e at
jeop
ardy
.
●Pe
ople
are
larg
ely
igno
rant
/un
awar
e of
pla
stic
’sco
ntrib
utio
n to
sav
ing
natu
ral
reso
urce
s in
repl
acin
g th
ings
like
woo
d an
d iro
n.
Dev
elop
ing
posi
tive
min
dset
am
ong
stak
ehol
ders
Supp
ortin
g he
alth
and
envi
ronm
enta
lly-fr
iend
lypr
oduc
tion
and
recy
clin
g
●H
ighl
ight
eco
-frie
ndly
asp
ects
of p
last
ic p
rodu
cts.
●Pa
rtne
r with
ant
i-def
ores
tatio
nan
d re
sour
ce c
onse
rvat
ion
cam
paig
ns.
●M
ake
“Raw
Mat
eria
lsId
entif
icat
ion
Code
” leg
ally
bind
ing.
●Su
bsid
ize
busi
ness
ope
ratio
nsth
at p
rom
ote
soun
d di
spos
alof
pla
stic
goo
ds a
nd h
ealth
and
envi
ronm
enta
lly-fr
iend
lyre
cycl
ing.
Initi
atio
n: B
PGM
EA a
nd M
oI
Actio
n: p
rofe
ssio
nals
/priv
ate
firm
s
Initi
atio
n: G
oB m
inis
trie
s (M
oI,
NBR
/MoF
), ci
ty c
orpo
ratio
ns,
BPG
MEA
and
oth
er in
dust
ryas
soci
atio
ns
Actio
n: P
rofe
ssio
nals
/priv
ate
firm
s
●Cu
rren
tly, r
aw m
ater
ial
iden
tific
atio
n co
de is
not
use
din
man
y ca
ses.
As
a re
sult,
recy
clin
g ge
ts in
appr
opria
te.
●A
lso,
due
to im
prop
er d
ispo
sal
syst
em a
nd n
on-a
vaila
bilit
y of
soun
d re
cycl
ing
tech
nolo
gy,
recy
cled
raw
mat
eria
ls a
re n
otof
hig
h qu
ality
and
ther
eby
crea
te h
ealth
and
envi
ronm
enta
l pro
blem
s.
Tab
le 9
: (c
ontin
ued)
Stra
teg
ic G
oal
sSt
rate
gic
Ob
ject
ives
Cu
rren
t Sc
enar
ioSt
rate
gic
Act
ion
sA
gen
cies
Invo
lved

98
STUDIES IN TRADE AND INVESTMENT 70
●SM
Es d
o no
t hav
e ac
cess
toin
stitu
tiona
l loa
ns d
ue t o
colla
tera
l req
uire
men
ts a
nda
lack
of c
apac
ity to
pre
pare
a bu
sine
ss p
lan.
●A
goo
d nu
mbe
r of S
MEs
had
to fa
ce b
ankr
uptc
y ev
en fo
ra
smal
l loa
n.
●Th
e se
ctor
has
sev
ere
shor
tage
of s
kille
d w
orkf
orce
(mac
hine
ope
rato
rs).
Curr
ently
SMEs
hire
uns
kille
d w
orke
rsw
ho le
arn
on th
e jo
b.H
owev
er, g
ood
wor
kers
leav
efo
r big
pla
yers
pay
ing
high
ersa
lary
. So,
SM
Es c
ontin
ue to
suffe
r. Th
e bi
g pl
ayer
s in
gene
ral t
rain
thei
r wor
kfor
cein
vitin
g in
tern
atio
nal t
rain
ers
from
Indi
a/Ch
ina.
Prov
idin
g ea
sy a
cces
s to
finan
ce●
Prov
ide
low
-cos
t SM
E lo
an.
●O
ffer g
over
nmen
t gua
rant
ees
(in li
eu o
f col
late
ral)
for
dese
rvin
g SM
Es.’
Initi
atio
n: G
oB (M
oI),
SMEF
,Ba
ngla
desh
Ban
k
Actio
n: C
omm
erci
al b
anks
Initi
atio
n: B
PGM
EA –
MoE
/Uni
v.G
rant
s Co
mm
issi
on (U
GC)
Tech
nica
l & V
ocat
iona
l and
Educ
atio
n Bo
ard
Actio
n: T
ech
Uni
v. D
epar
tmen
ts,
poly
tech
nic
inst
itute
s/tr
aini
ngin
stitu
tes,
BSC
IC, p
rivat
e fir
ms
etc.
Go
al #
4Su
ppor
ting
SMEs
●Pr
ovid
e te
chni
cal t
rain
ing
for
mac
hine
ope
rato
rs o
nop
erat
ion,
trou
ble
shoo
ting
and
mai
nten
ance
of
mac
hine
ries.
●Pr
ovid
e ad
vanc
ed tr
aini
ng in
mou
ld-m
akin
g in
tech
nica
lun
iver
sitie
s (e
.g.,
BUET
, CU
ET,
KUET
, DU
ET, e
tc.).
●In
dust
ry-U
nive
rsity
colla
bora
tion.
●Se
ek te
chni
cal a
ssis
tanc
e (e
.g.,
from
ESC
AP)
in th
is re
gard
.
●Ex
plor
e a
poss
ibili
ty o
fbr
ingi
ng in
exp
erts
from
deve
lope
d co
untr
ies
topr
ovid
e tr
aini
ng s
ervi
ces.
Supp
lyin
g sk
illed
tech
nica
lw
orkf
orce
Tab
le 9
: (c
ontin
ued)
Stra
teg
ic G
oal
sSt
rate
gic
Ob
ject
ives
Cu
rren
t Sc
enar
ioSt
rate
gic
Act
ion
sA
gen
cies
Invo
lved

99
COUNTRY STUDIES ON BANGLADESH, NEPAL AND SRI LANKA
●M
ost o
f the
ent
repr
eneu
rs a
refir
st-g
ener
atio
n bu
sine
ssm
enan
d ar
e en
trep
rene
urs
bych
ance
. Nea
rly a
ll SM
Een
trep
rene
urs
lack
pro
per
busi
ness
bac
kgro
und.
●M
any
entr
epre
neur
s ar
e ha
ppy
with
wha
teve
r the
y ha
ve a
nddo
not
pla
n th
eir b
usin
esse
s’lo
ng-t
erm
gro
wth
.
●M
ost o
f SM
Es a
re lo
cate
d in
old
Dha
ka th
at is
not
an
indu
stria
lar
ea a
nd la
cks
basi
cin
fras
truc
ture
.
●Th
ere
is n
o ce
ntra
l qua
lity
man
agem
ent m
echa
nism
.
Supp
ortin
gen
trep
rene
ursh
ipde
velo
pmen
t
●Ca
paci
ty b
uild
ing
thro
ugh
busi
ness
dev
elop
men
tw
orks
hops
/tra
inin
g.
●Se
nsiti
zatio
n ca
mpa
ign
for
deve
lopi
ng p
ositi
veen
trep
rene
uria
l min
dset
.
Initi
atio
n: M
oI, E
SCA
P, BP
GM
EA
Actio
n: I
nstit
ute
of B
usin
ess
Adm
inis
trat
ion
(IBA
), U
nive
rsity
of
Dha
ka
Initi
atio
n: G
oB, i
n co
llabo
ratio
nw
ith A
DB,
BPG
MEA
Actio
n: I
BA a
nd B
UET
Prov
idin
g es
sent
ial
phys
ical
and
sof
t-in
fras
truc
ture
●Im
plem
ent p
ropo
sed
SME
indu
stria
l par
k (S
EZ) f
or th
epl
astic
s se
ctor
(and
ligh
ten
gine
erin
g an
d el
ectr
onic
good
s as
wel
l).
●Es
tabl
ish
qual
ity m
anag
emen
tin
stitu
te.
●M
ake
cash
ince
ntiv
es fo
rpl
astic
goo
ds e
xpor
ts.
●Id
entif
y pr
ofita
ble
mar
ket
segm
ents
(thr
ough
mar
ket
rese
arch
/inte
llige
nce)
,pa
rtic
ular
ly in
tern
atio
nal o
ut-
sour
cing
opp
ortu
nitie
s.
●Cu
rren
tly o
nly
PET
bott
lem
anuf
actu
rers
get
10
per c
ent
cash
ince
ntiv
e.
●SM
Es a
re n
ot a
war
e of
inte
rnat
iona
l mar
ket
oppo
rtun
ities
; SM
Es a
nd la
rge
firm
s fa
ce s
ever
info
rmat
ion
insu
ffici
ency
.
Faci
litat
ing
inte
rnat
iona
lm
arke
t acc
ess
and
natio
nal m
arke
ting
ende
avor
s
Initi
atio
n: G
oB (M
oF, E
PB, F
orei
gnM
inis
try)
, BPG
MEA
Actio
n: L
ocal
bus
ines
sde
velo
pmen
t ser
vice
pro
vide
rs(c
onsu
lting
firm
s), a
s ap
plic
able
Tab
le 9
: (c
ontin
ued)
Stra
teg
ic G
oal
sSt
rate
gic
Ob
ject
ives
Cu
rren
t Sc
enar
ioSt
rate
gic
Act
ion
sA
gen
cies
Invo
lved

100
STUDIES IN TRADE AND INVESTMENT 70
Tab
le 9
: (c
ontin
ued)
Stra
teg
ic G
oal
sSt
rate
gic
Ob
ject
ives
Cu
rren
t Sc
enar
ioSt
rate
gic
Act
ion
sA
gen
cies
Invo
lved
●H
elp
SMEs
bui
ld c
apac
ity in
term
s of
hum
an re
sour
ce s
kill
deve
lopm
ent,
tech
nolo
gica
lup
grad
ing,
pro
duct
des
ign
mar
ket i
ntel
ligen
ce a
ndm
arke
ting.
●A
ssis
t bra
nd b
uild
ing
initi
ativ
es (c
apita
lize
on R
MG
’s“m
ade
in B
angl
ades
h” s
ucce
ss).
●A
rran
ge n
atio
nal a
ndin
tern
atio
nal t
rade
fairs
(ITF
s)an
d as
sist
SM
E pa
rtic
ipat
ion
insu
ch fa
irs.
●Im
prov
e tr
ade
dipl
omac
y.
●H
elp
SMEs
ach
ieve
inte
rnat
iona
l qua
lity
stan
dard
s.
●Pr
omot
e en
viro
nmen
tal a
ndso
cial
com
plia
nt e
nter
pris
es.
●In
itiat
e a
stud
y to
exp
lore
expo
rt p
oten
tial o
f pla
stic
prod
ucts
from
Ban
glad
esh
inde
velo
ped
mar
kets
.
Go
al #
5Ac
hiev
ing
high
ersh
are
of g
loba
lpr
oduc
tion
●SM
Es la
ck c
apac
ity in
mee
ting
inte
rnat
iona
l qua
lity
stan
dard
s.
●Ba
ngla
desh
i bus
ines
ses
suffe
rfro
m in
appr
opria
te c
ount
rybr
and
imag
e.
Intr
oduc
e ex
istin
gpr
oduc
ts to
new
mar
kets
,at
bot
h re
gion
al a
ndgl
obal
leve
ls.
GoB
, BPG
MEA
, ESC
AP
(to
prov
ide
with
tech
nica
l ass
ista
nce
toin
itiat
e re
sear
ch)
●A
lthou
gh la
rge
firm
s ar
e re
ady
to a
cces
s in
tern
atio
nal m
arke
tsus
ing
exis
ting
qual
ityst
anda
rds,
SMEs
are
far a
way
from
that
.
●Tr
ade
rela
tions
hips
with
neig
hbou
ring
coun
trie
s ar
eno
t ver
y sm
ooth
, par
ticul
arly
sinc
e th
e ad
vent
of N
TBs.
●Th
ere
is a
lack
of a
war
enes
sam
ong
loca
l man
ufac
ture
rsre
gard
ing
dem
and
and
qual
ityre
quire
men
ts in
the
expo
rtm
arke
t.

101
COUNTRY STUDIES ON BANGLADESH, NEPAL AND SRI LANKA
Tab
le 9
: (c
ontin
ued)
Stra
teg
ic G
oal
sSt
rate
gic
Ob
ject
ives
Cu
rren
t Sc
enar
ioSt
rate
gic
Act
ion
sA
gen
cies
Invo
lved
Acce
ss n
ew m
arke
ts w
ithne
w p
rodu
cts
by ta
rget
ing
pote
ntia
l B2B
seg
men
tsan
d un
expl
ored
B2C
oppo
rtun
ities
.
●Cu
rren
tly R
MG
sec
tor i
s th
epr
ime
B2B
segm
ent s
erve
d by
Bang
lade
shi p
last
ics
indu
stry
.O
ther
s ar
e co
nstr
uctio
n an
dph
arm
aceu
tical
s.
●A
pre
miu
m s
egm
ent o
f the
B2C
segm
ent i
s al
so la
rgel
yun
tapp
ed.
●Ta
rget
B2B
seg
men
ts s
uch
asph
arm
aceu
tical
s, fo
od-
proc
essi
ng a
nd a
gric
ultu
re.
●Ta
rget
hig
h-en
d B2
C se
gmen
tan
d di
vers
ify th
e of
ferin
gba
sket
by
inco
rpor
atin
g th
epr
oduc
ts th
at o
ffer c
ost-
adva
ntag
e.
●O
ffer f
air c
ompe
titio
n to
loca
lfir
ms
over
impo
rts
thro
ugh
polic
y su
ppor
t and
act
ions
.
Initi
atio
n: I
ndus
try
play
ers,
GoB
,de
velo
pmen
t par
tner
s
Actio
n: P
rivat
e fir
ms

102
STUDIES IN TRADE AND INVESTMENT 70
Annex Notes
ANNEX NOTE 1.1
List of Plastic Products
HS 2002Name Description
Code
39
3901
3902
3903
3904
3905
3906
3907
3908
3909
3910
3911
3912
3913
3914
Name: Plastics and articles thereof
Polymers of ethylene, in primaryforms.
Polymers of propylene or of otherolefins, in primary forms.
Polymers of styrene, in primaryforms.
Polymers of vinyl chloride or ofother halogenated olefins, inprimary form...
Polymers of vinyl acetate or ofother vinyl esters, in primary forms
Acrylic polymers in primary forms.
Polyacetals, other polyethers andepoxide resins, in primary forms
Polyamides in primary forms.
Amino-resins, phenolic resins andpolyurethanes, in primary forms.
Silicones in primary forms.
Petroleum resins, coumarone-indene resins, polyterpenes
Cellulose and its chemicalderivatives
Natural polymers and modifiednatural polymers
Ion-exchangers based on polymersof headings 39.01 to 39.13, inprimary for...
Plastics and articles thereof
Polymers of ethylene, in primary forms.
Polymers of propylene or of other olefins, inprimary forms.
Polymers of styrene, in primary forms.
Polymers of vinyl chloride or of otherhalogenated olefins, in primary forms.
Polymers of vinyl acetate or of other vinylesters, in primary forms; other vinylpolymers in primary forms.
Acrylic polymers in primary forms.
Polyacetals, other polyethers and epoxideresins, in primary forms; polycarbonates,alkyd resins, polyallyl esters and otherpolyesters, in primary forms.
Polyamides in primary forms.
Amino-resins, phenolic resins andpolyurethanes, in primary forms.
Silicones in primary forms.
Petroleum resins, coumarone-indene resins,polyterpenes, polysulphides, polysulphones
Cellulose and its chemical derivatives, notelsewhere specified or included, in primaryforms.
Natural polymers (for example, alginic acid)and modified natural polymers (forexample, hardened proteins, chemicalderivatives of natural rubber), notelsewhere specified or included, in primaryforms.
Ion-exchangers based on polymers ofheadings 39.01 to 39.13, in primary forms.

103
COUNTRY STUDIES ON BANGLADESH, NEPAL AND SRI LANKA
HS 2002Name Description
Code
Waste, parings and scrap, ofplastics.
Monofilament of which any cross-sectional dimension exceeds 1 mm
Tubes, pipes and hoses, and fittingstherefore
Floor coverings of plastics in rolls
Self-adhesive plates, sheets, film,foil, tape, strip and other flatshapes...
Other plates, sheets, film, foil andstrip, of plastics
Other plates, sheets, film, foil andstrip, of plastics
Baths, shower-baths, sinks, wash-basins, bidets, lavatory pans
Articles for the conveyance orpacking of goods, of plastics
Tableware, kitchenware, otherhousehold articles and toiletarticles, of pl...
Builders’ ware of plastics, notelsewhere specified or included.
Other articles of plastics andarticles of other materials ofheadings 39.0...
Waste, parings and scrap, of plastics.
Monofilament of which any cross-sectionaldimension exceeds 1 mm, rods, sticks andprofile shapes, whether or not surface-worked but not otherwise worked, ofplastics.
Tubes, pipes and hoses, and fittingstherefore (for example, joints, elbows,flanges), of plastics.
Floor coverings of plastics, whether or notself-adhesive, in rolls or in the form of tiles;wall or ceiling coverings of plastics, asdefined in Note 9 to this Chapter.
Self-adhesive plates, sheets, film, foil, tape,strip and other flat shapes, of plastics,whether or not in rolls.
Other plates, sheets, film, foil and strip, ofplastics, non-cellular and not reinforced,laminated, supported or similarly combinedwith other materials.
Other plates, sheets, film, foil and strip, ofplastics.
Baths, shower-baths, sinks, wash-basins,bidets, lavatory pans, seats and covers,flushing cisterns and similar sanitary ware,of plastics.
Articles for the conveyance or packing ofgoods, of plastics; stoppers, lids, caps andother closures, of plastics.
Tableware, kitchenware, other householdarticles and toilet articles, of plastics.
Builders’ ware of plastics not elsewherespecified or included.
Other articles of plastics and articles ofother materials of headings 39.01 to 39.14.
3915
3916
3917
3918
3919
3920
3921
3922
3923
3924
3925
3926
Source: UNCOMTRADE (2009).

104
STUDIES IN TRADE AND INVESTMENT 70
ANNEX NOTE 1.2
Types of Manufacturers in the Global Plastics Industry
Types Operational Process Products Type
1. ThermoFormers
2. InjectionMoulders
3. Pipe, Profileand TubingExtruders
4. RotationalMoulders
5. Film and SheetManufacturers
6. Blow Moulders
Plastic sheet is heated to a pliableforming temperature, formed toa specific shape in a mould, andtrimmed to create a usable product
Material is fed into a heated barrel,mixed and forced into a mouldcavity where it cools and hardensto the configuration of the mouldcavity
High volume manufacturingprocess in which raw plastic material is melted and formed intoa continuous profile
A high-temperature, low-pressureplastic-forming process that usesheat and biaxial rotation (i.e.,rotation on two axes) to producehollow, one-piece parts
Manufacture of film and sheetsthrough a controlled extrusionprocess
Manufacturing process by whichhollow plastic parts are formed.Three main types of blowmoulding are extrusion blowmoulding (EBM), injection blowmoulding (IBM), and stretch blowmoulding (SBM)
Thin-gauge thermoforming:disposable cups, containers, lids,trays, blisters, clamshells, and otherproducts used as food carriers ormedical appliances
Thick-gauge thermoforming:vehicle doors and dash panels,refrigerator liners, utility vehiclebeds and plastic pallets
Milk cartons, packaging, bottlecaps, automotive dashboards,pocket combs, consumer products,toys, plumbing, packaging and construction materials etc.
Tubes, pipes, rods, rails etc.
Storage tanks, bins and refusecontainers, doll parts, road cones,footballs, helmets, kayak hulls etc.
Trash bags, stretch films, packagingmaterials etc.
EBM: dairy containers, hoses/pipesIBM: medicine containersSBM: pet bottles
Source: Compiled from PlasticsNews.com 2009.

105
COUNTRY STUDIES ON BANGLADESH, NEPAL AND SRI LANKA
Annex II
Country Study on Nepalusing Global Value Chain Analysis:
THE AGRO INDUSTRY (COFFEE AND GINGER PRODUCTS)29
29 The author would like to thank Ms. Neelu Thapa, Programme Coordinator and Mr. Paras Kharel,Senior Programme Officer both of South Asia Watch on Trade, Economics and Environment,Kathmandu, Nepal for research and logistics support.

106
STUDIES IN TRADE AND INVESTMENT 70

107
COUNTRY STUDIES ON BANGLADESH, NEPAL AND SRI LANKA
Contents
Page
List of figures ............................................................................................................................. 108
List of tables ............................................................................................................................... 108
List boxes ..................................................................................................................................... 108
1. Introduction ................................................................................................................... 1091.1. Objectives of the study .................................................................................... 1101.2. Methodology ....................................................................................................... 1101.3. Limitations ............................................................................................................ 111
2. Business Prospects for the Ginger and Coffee Products Sectors inNepal ................................................................................................................................. 1122.1. Overview of major coffee producing countries ...................................... 1122.2. Coffee production in Nepal ............................................................................ 1152.3. Overview of major ginger producing countries ..................................... 1162.4. Ginger production in Nepal ........................................................................... 1172.5. Employment in the coffee and ginger products sectors ..................... 120
3. Export Potential and the Government Policy ................................................ 1203.1. Export potential for coffee products .......................................................... 1213.2. Export potential for ginger products .......................................................... 1263.3. The Government policy ................................................................................... 128
4. Value Chain Analysis .................................................................................................. 1304.1. Analysis of the coffee product value chain ............................................... 1314.2. Value chain analysis of the coffee sector in Nepal ................................. 1334.3. Major constraints on the coffee sector development in Nepal ......... 1364.4. Value chain analysis of the ginger sector in Nepal ................................ 1374.5. Major constraints on the ginger sector development in Nepal ........ 141
5. SWOT Analysis .............................................................................................................. 1425.1. SWOT analysis of the coffee sector .............................................................. 1425.2. SWOT analysis of the ginger sector ............................................................. 144
6. Future Thrust and Business Plans ........................................................................ 1466.1. The coffee sector: future thrust ................................................................... 1466.2. The coffee sector: business plan ................................................................. 1476.3. The ginger sector: future thrust ................................................................... 1506.4. The ginger sector: business plan ................................................................. 151

108
STUDIES IN TRADE AND INVESTMENT 70
List of figures
1. The coffee value chain ................................................................................................. 1322. The coffee sector value chain .................................................................................... 1343. The ginger sector value chain ................................................................................... 139
List of tables
1. World coffee production, 2000/2001-2010/2011 .............................................. 1142. Major coffee producing countries, 2010/2011 .................................................... 1143. Coffee production by coffee bean type (in per cent) ....................................... 1144. Coffee production in Nepal, 1994/1995-2008/2009 ......................................... 1155. District-wise production of coffee in Nepal, 2007/2008 .................................. 1166. Area and production of ginger in the world, 2009 ............................................ 1177. Production of ginger in Nepal, 1998-2009 ........................................................... 1188. Geographical distribution of ginger production in Nepal, 2008 .................. 1189. Coffee exports of Nepal (green beans) .................................................................. 121
10. Export markets for the Nepalese coffee, 2007/2008, (in thousandsof Nepalese Rupees) ..................................................................................................... 121
11. World coffee export from 2000/2001 to 2009/2010 ......................................... 12212. World’s top 10 coffee exporters, 2009 .................................................................... 12213. World’s top 10 coffee importers, 2008 ................................................................... 12314. Market access conditions for the Nepalese coffee in major importing
countries (tariffs in per cent) ...................................................................................... 12315. World export of ginger, 2001-2008 ......................................................................... 12616. Top 10 ginger exporting countries, 2009 .............................................................. 12617. Ginger exports to India (in millions of NRs.) ......................................................... 12718. Top 10 importers of ginger, 2009 ............................................................................. 12719. Value added in the coffee sector value chains (inclusive of profits) ........... 13620. The ginger sector value chain (Phidim, Panchthar), (in NRs./kg) .................. 14121. The coffee sector: business plan ............................................................................. 14722. The ginger sector: business plan ............................................................................. 151
List of box
1. Composition of the Steering Committee of Nepal ............................................ 111
Contents (continued)Page
109
COUNTRY STUDIES ON BANGLADESH, NEPAL AND SRI LANKA
1. Introduction
In developing countries, small and medium-sized enterprises (SMEs) aregenerally considered the engine of economic growth, as well as a means for povertyreduction by virtue of their numbers and their significant economic and socialcontributions. In Nepal, they account for 90 per cent of total enterprises, employ95 per cent of the non-agricultural workforce and contribute 50 per cent of industrialvalue addition (Khatiwada 2001).
Economic liberalization and globalization have significant bearings on theperformance and prospects of SMEs. At the macro-level, trade liberalization couldbenefit the country broadly through improved resource allocation, access to bettertechnology, inputs and intermediate goods, economies of scale and scope, greaterdomestic competition and availability of favourable growth externalities such as transferof know-how. Similarly, globalization can provide better access to markets andinformation, and may also facilitate a new physical or virtual proximity between globalbuyers and local firms (UNCTAD 2004). SMEs could benefit enormously from theseprocesses, provided they improve their competitive strengths.
At the disaggregated and firm levels, at least in the short run, however,globalization may affect domestic firms both positively and negatively throughincreased foreign competition due to lower import tariffs, quotas and other non-tariffmeasures, lower production costs through cheaper imported inputs, increased exportopportunities and reduced availability of local inputs (Tambunan 2008). In addition,the global system of market governance advocates macro policies that largely tend tobe indifferent towards the microeconomic conditions of SMEs.
Thus, it is difficult to have an a priori judgment of the impact of liberalizationand globalization on SMEs. Increased foreign competition in the domestic market mayhurt some inefficient or uncompetitive SMEs while benefiting efficient or competitiveones. Empirical evidences show that in the short run SMEs may lose due to liberalizationas it may work against scale efficiency (Tewari 2001; Tybout 2000). Therefore, it isnecessary that SMEs are supported to upgrade their production capabilities, their accessto human resources and new technology and their ability to improve the quality of theirproducts so as to enable them to expand their base and sustain higher rates of exportgrowth through participation in global and regional value chains (Kaplinsky, Morris andReadman 2002; Roberts 2000; Roberts and Tybout 1996). It means that it is imperativeto improve the competitiveness of SMEs through addressing supply-side constraints andbuilding up national productive capacity, as well as an efficient trading and transportinfrastructure.
The present study, using value chain analysis, proposes national actionplans for the improvement of the business environment for the facilitation of theNepalese SMEs’ access to regional and global markets. In particular, it presents a supplychain network of selected products, their supply capacity, policy and regulatoryframework as well as an infrastructure and logistics system for the selected agroproducts in Nepal.

110
STUDIES IN TRADE AND INVESTMENT 70
1.1. OBJECTIVES OF THE STUDY
The broad objective of the study is to analyze business environment withinwhich Nepalese agro product SMEs, particularly those dealing in coffee and gingerproducts, are operating, and develop national action plan to enhance theircompetitiveness. The study also evaluates production capacity, export potential, supplychain networks, policy and regulatory frameworks and strengths, weaknesses,opportunities, and threats (SWOT analysis) for the coffee and ginger products sectors.
Other objectives of the study included assessing export potentials, identifyingconstraints/bottlenecks to export promotion and the value added and suggestingmeasures for implementing national action plans. To achieve the objectives, value chainand SWOT analyses were carried out.
1.2. METHODOLOGY
The export basket of Nepal contains more than 1100 products at HS 6 digit level,including agricultural and manufacturing products, both primary and processed. Theregular macro-level export promotion strategies and programmes might be unable toaddress the firm- or product-level constraints and conditions for export promotion. Itis neither practical nor feasible to develop export promotion strategies for all exportableproducts. Therefore, the study focuses on two targeted products with a high exportpotential that could contribute significantly to poverty reduction and socialdevelopment of the country.
The following key criteria have been used to identify two out six short-listedproducts, namely: cardamom; ginger; medical plants (herbs) and essential oils;processed leather; tea; and coffee.30
a. Export potentialb. Value addedc. Job creationd. Linkages with other sectorse. Supply capacityf. Impact on gender empowermentg. Accessibilityh. Government priority
Out of these products, ginger and coffee were selected by the SteeringCommittee of Nepal, chaired by the Secretary, Ministry of Commerce and Supplies andcomprised of representatives from the ministries of commerce, industry, finance andagriculture, the private sector and the civil society organizations, including the studyteam (Box 1).
30 ESCAP Mission had initially identified five potential products for consideration, namely:cardamom; ginger;medical plants (herbs) and essential oils; processed leather; and tea based ongovernment priority, domestic value addition and potential for employment creation. The SteeringCommittee of Nepal added coffee to the list.

111
COUNTRY STUDIES ON BANGLADESH, NEPAL AND SRI LANKA
The analysis was conducted through a combination of literature review andfocus group discussions. The required data and information were collected throughdifferent sources, including the government, private sector and internationalorganizations publications. The consultants on the project met and interacted with allpossible value chain agents – farmers, traders, processors, exporters, service providers,international non-governmental organizations and government officials in focus groupdiscussions. The focus group discussions were organized in Kathmandu for the coffeeproducts sector and in Byas Municipality, Tanahu district for the ginger products sector.The events not only helped verify additional information, but also provided criticalinsights into the issues. Subsequently, the study was submitted at a national workshopand a subregional workshop in Kathmandu and Colombo, respectively, where keystakeholders conducted further review. Discussions and comments made at theworkshops were all reflected in the final study.
1.3. LIMITATIONS
The study was conducted within a limited time frame and with little resources,which made it impossible to collect primary information through a structuredquestionnaire from all the actors. Similarly, it was impossible to observe all the processesincluded in the value chain, for example land preparation, farming, harvesting,
Box 1: Composition of the Steering Committee of Nepal
The Steering Committee, chaired by the Secretary, Ministry of Commerce andSupplies was formed to provide policy and operational guidance to the implementationof the project. The composition of the committee included:
Secretary, Ministry of Commerce and Supplies Chairman
Joint-Secretary (Export Promotion, Trade and Transit Member Division), Ministry of Commerce and Supplies
Joint-Secretary (Planning and International Trade MemberCooperation Division), Ministry of Commerceand Supplies
Representative, Ministry of Industry Member
Chief Executive Officer, Trade and Export Promotion Centre Member
Chairman, South Asian Watch on Trade Economics & MemberEnvironment
Representative, Federation of Nepalese Chamber of MemberCommerce and Industry
Representative, Federation of Nepalese Cottage and MemberSmall Industry
Representative, ESCAP Member
Under-Secretary (Planning and International Trade Member SecretaryCooperation Division), Ministry of Commerceand Supplies

112
STUDIES IN TRADE AND INVESTMENT 70
processing and so on. While interactions with stakeholders helped gain insights intothe issues, such insights could not be considered as representing all nation-widestakeholders.
2. Business Prospects for the Ginger and Coffee Products Sectors inNepal
Sandwiched between two neighbours with giant populations—China to thenorth and India to the south, west, and east—Nepal has a population of about27 million. The country is divided into three geographical regions: (i) the Himalayanrange, covered with snow throughout the year; (ii) the valleys and hills; and (iii) the Teraibelt, low and fertile land that borders India. While about 70 per cent of land area inNepal is covered by hills and high mountains, only the remaining 30 per cent of land,found in the Terai belt is suitable for commercial agriculture. Over 56 per cent of thecountry’s population lives in the hills and mountains and relies on subsistence farmingin the absence of other economic activities. Since the Terai belt has highly fertile landcompared to other regions, most economic activities are located there. Because ofa difficult terrain, there is a lack of an efficient transport network in the hilly andmountainous regions.
Agriculture is the backbone of the Nepalese economy, making an importantcontribution to the national income and employment generation. In the 1950s, itcontributed as high as 80 per cent to gross domestic product (GDP) and employed90 per cent of the workforce. However, with a shift in government policy since themid-1950s, its importance as a major contributor to GDP gradually declined and fell to32.8 per cent by 2008/09 (MOF 2009a). Despite the fact, agriculture still providesemployment for 67.1 per cent of the workforce—64.0 per cent in subsistence farmingand 3.1 percent in market agriculture (CBS 2009). The share of manufacturing in GDPremains very small, at 6.8 per cent, while the services sector, largely based in urban areas,contributes about 60 per cent of GDP.
Total cultivated land in Nepal is a little more than three million hectares, butirrigation facilities are available only on one third of the cultivated land. Nepalesefarmers have traditionally produced cereal crops, such as paddy, maize, millet, wheatand barley. However, they have been shifting to the exclusive production of orintercropping with cash crops, such as oilseeds, potato, tobacco, sugarcane, tea, coffee,ginger and horticultural products. The following section introduces coffee and gingerproduction in Nepal.
2.1. OVERVIEW OF MAJOR COFFEE PRODUCING COUNTRIES
Although there are between 25-100 different species of Coffea (coffee trees),the two most important species that are grown and traded internationally—Coffeaarabica (Arabica coffee), which accounts for over 60 per cent of the world productionand Coffea canephora (Robusta coffee). Two other species that are grown on a muchsmaller scale are Coffee liberica (Liberica coffee) and Coffee dewevrei (Excelsa coffee).These major species of coffee have different varieties and cultivars. For example, the

113
COUNTRY STUDIES ON BANGLADESH, NEPAL AND SRI LANKA
best known varieties of Coffea arabica are ‘Typica’ and ‘Bourbon’ but from these twovarieties many different strains and cultivars have been developed, such as Caturra(Brazil, Colombia), Mundo Novo (Brazil), Tico (Central America), the dwarf San Ramonand the Jamaican Blue Mountain. Arabica coffee plants are often susceptible to attacksby pests and diseases.
Coffee is a tropical plant which grows between the latitudes of less than25 degree north and less than 25 degree south of the Ecuator and requires very specificenvironmental conditions for commercial cultivation. Temperature, rainfall, sunlight,wind, and soils are all important but requirements vary according to varieties grown.Ideal average temperatures are 15-24 degrees Celsius for Arabica and 24-30 Celsius forRobusta, which can take hotter and drier conditions. Coffee plants are easily damagedby frost. In general, coffee plants need an annual rainfall of 1,500 to 3,000 mm; Arabicaplants require less moisture than other species. The patterns of rainy and dry periodsare important for growth, budding and flowering. Rainfall requirements depend on theretention properties of the soil, atmospheric humidity and cloud cover as well ascultivation practices.
Arabica coffee plants are best grown at higher altitudes (over 1,000 metres),often in hilly areas and, thus, produce superior quality beans of good flavour andaromatic characteristics. Robusta coffee, on the other hand, can be grown at loweraltitudes (between sea level and about 800 metres), have higher yields and are moreresistant to disease. But they produce beans of inferior taste in comparison with Arabica,usually with a woody, astringent flavour and with double amount of caffeine. As a result,Robusta beans command a lower price and are generally used for producing cheapinstant coffee or to increase a caffeine ‘kick’ in products such as espresso. In terms ofproduction markets, Arabica coffee is grown throughout Latin America, in Central andEast Africa, in India and Nepal, and to some extent in Indonesia; while Robusta coffeeis grown in West and Central Africa, throughout South-East Asia and in certain parts ofBrazil, where it is known as Conillon.
The first coffee plantations were originally established in Ethiopia and theArabian Peninsula. Today it is widely grown throughout topical regions (ITC 2009).Coffee is produced in more than 70 developing countries while 45 countries areresponsible for over 97 per cent of world coffee output. The world production of coffeeis quite volatile and is extremely vulnerable to weather conditions. Global productionduring the period 2000/01 to 2010/08 was recorded in the range of 6.4 million MT to8.0 million MT; however, the production sharply declined by 13.7 per cent in 2003/04,whereas it increased by 8.4 per cent in the crop year 2010/11 (table 1). Most of theworld’s coffee beans are produced in Latin America, which accounts for 61.9 per centof global production; the shares of Asia and Africa are 25.5 per cent and 12.6 per cent,respectively (Roldan-Perez et al 2009). Brazil is the largest producer of coffee followedby Viet Nam, Colombia and Indonesia. In 2008/09 more than half of global coffeeproduction was concentrated in these three countries (table 2).

114
STUDIES IN TRADE AND INVESTMENT 70
Arabica is the dominant variety in coffee production. More than 60 per cent ofcoffee produced worldwide is Arabica, with Brazilian natural being the principal Arabicavariety, though its share has declined in recent years compared to the 1980s and the1990s. The remaining share is Robusta variety (table 3). Arabica is produced inColombia, Kenya, United Republic of Tanzania, the Plurinational State of Bolivia, Burundi,Costa Rica, Cuba, Dominican Republic, Ecuador, El Salvador, Guatemala, Haiti, Honduras,India, Jamaica, Malawi, Mexico, Nicaragua, Panama, Papua New Guinea, Peru, Rwanda,Venezuela, Zambia, Zimbabwe, Brazil, Ethiopia, and Paraguay; whereas Robusta isproduced in Angola, Benin, Cameroon, Central African Republic, Congo, Côte d’Ivoire,Democratic Republic of the Congo, Equatorial Guinea, Gabon, Ghana, Guinea, Indonesia,Liberia, Madagascar, Nigeria, Philippines, Sierra Leone, Sri Lanka, Thailand, Togo, Trinidadand Tobago, Uganda and Viet Nam (ICO 2009).
Table 1: World coffee production,2000/2001-2010/2011
Coffee yearProduction Million Bags
(60 kg)
2000/2001 113.02001/2002 107.72002/2003 123.22003/2004 106.32004/2005 116.22005/2006 111.32006/2007 128.92007/2008 120.02008/2009 128.42009/2010 123.02010/2011 133.3
Source: ICO (2011).
Table 2: Major coffee producingcountries, 2010/2011
CountryProduction Million Bags
(60 kg)
Brazil 48.1Viet Nam 18.5Colombia 9.2Indonesia 8.8Ethiopia 7.5India 5.0Mexico 4.0World 133.3
Source: ICO (2011).
Table 3: Coffee production by coffee bean type (in per cent)
Types of Coffee Beans 2005 2006 2007 2008
Arabicas 61.72 62.27 61.20 61.62Colombian Milds 12.43 10.82 11.56 8.62Other Milds 22.88 21.19 22.90 20.95Brazilian Naturals 26.41 30.26 26.73 32.05Robustas 38.28 37.73 38.80 38.83
Source: ICO (2009).

115
COUNTRY STUDIES ON BANGLADESH, NEPAL AND SRI LANKA
2.2. COFFEE PRODUCTION IN NEPAL
Coffee production does not have a long history in Nepal. A saint, Hira Giri ofGulmi district in western Nepal, is considered to be the pioneer of coffee cultivation inNepal. He bought some coffee seeds from Myanmar and introduced them in Aanpchaurof Gulmi district back in 1938. Gradually, plantations of coffee started spreading toadjoining districts, such as Palpa, Syangja, Kaski and Baglung, and other districts.
As the climate and soil conditions in the mid- and high hills of Nepal are suitablefor Arabica coffee, Nepal grows only the Arabica variety of coffee. Areas under coffeeplantations have increased more than ten-fold between 1994/1995 and 2008/2009. In2008/2009, a total of 557 MT of coffee was produced on 1,531 ha of farmland in Nepal(table 4). The average yield of green beans is about 300 kg per ha. Although theproductivity has increased significantly over the period, it is lower than in major coffeeproducing countries such as Viet Nam and Indonesia. However, through propermanagement, adequate shading and manuring practices, the productivity levelcould go as high as up to 1,550 kg per ha (AEC 2006). Gulmi district produces thehighest amount of coffee followed by Laltipur, Kavrepalanckok, Syangja and Palpa.Lamjung, Gorkha, and Nuwakot districts are other emerging coffee producing districts(table 5).
Table 4: Coffee production in Nepal, 1994/1995-2008/2009
Year Area (ha)Production Dry Productivity (dryCherry (in MT) cherry kg per ha)
1994/1995 135.7 13.0 951995/1996 220.3 29.2 1321996/1997 259.0 37.4 1441997/1998 272.1 55.9 2051998/1999 277.1 44.5 1601999/2000 314.3 72.40 2302000/2001 424.0 88.7 2092001/2002 596.0 139.2 2332002/2003 764.0 187.5 2452003/2004 925.0 217.6 2352004/2005 1 078.0 250.0 2312005/2006 1 285.0 391.0 3042006/2007 1 295.5 270.0* 3472007/2008 1 145.0 265.0* 3862008/2009 1 531.0 334.0* 364
* Parchment, average ratio parchment to dry cherry is about 0.6.Source: NTCDB (2011).

116
STUDIES IN TRADE AND INVESTMENT 70
2.3. OVERVIEW OF MAJOR GINGER PRODUCING COUNTRIES
Ginger, the underground stem, or rhizome, of the plant Zingiber officinale Roscoe,is a medicinal plant that has been widely used in Chinese, Ayurvedic and Tibb-Unaniherbal medicines since antiquity to remedy a wide array of ailments that includedarthritis, rheumatism, sprains, muscular aches, pains, common cold, flu-like symptoms,sore throat, headaches, painful menstrual periods, cramps, constipation, indigestion,vomiting, hypertension, dementia, fever, infectious diseases and helminthiasis. Inaddition to medicinal use, ginger is valued as an important cooking spice.31 Currently,there is a renewed interest in ginger, and several scientific studies have been conductedaimed at identifying ginger’s active constituents and verifying their pharmacologicalproperties in treating ailments and diseases. The main pharmacological characteristics
Table 5: District-wise production of coffee in Nepal, 2007/2008
Districts Area (ha) Production (MT)
Palpa 185.0 25.0Gulmi 110.0 35.0Arghakhangi 74.0 10.0Syangja 205.0 29.5Kaski 70.0 13.5Parbat 40.0 5.0Lamjung 148.0 8.0Gorkha 97.0 5.0Baglung 35.0 5.0Tanahu 45.0 2.0Myagdi 5.0 3.0Sankhuwashava 18.0 3.0Ilam 30.0 15.0Khotang 7.0 2.0Jhapa 2.0 1.0Panchthar 8.0 2.0Udayapur 2.5 2.0Lalitpur 70.0 30.0Sindhupalchok 77.0 17.0Kavrepalanchok 116.5 30.0Nuwakot 58.0 13.0Dhading 16.0 7.0Makawanpur 11.0 3.0Others 20.0 10.0Total 1 450.0 276.0
Source: MAC 2008.
31 New World Encyclopedia. Available at www.newworldencyclopedia.org.

117
COUNTRY STUDIES ON BANGLADESH, NEPAL AND SRI LANKA
of ginger and compounds include immuno-modulatory, anti-tumorigenic,anti-inflammatory, anti-apoptotic, anti-hyperglycemic, anti-lipidemic and anti-emeticactions. Ginger is also a strong anti-oxidant and may either mitigate or preventgeneration of free radicals. It is considered a safe herbal medicine with only a few andinsignificant adverse/side effects (Ali et al. 2008).
Ginger has a long history of medicinal use in the preparation of many Ayurvedicformulations, the traditional medical discipline in India and Nepal. In the United Statesof America and Europe, remedies containing ginger are sold as nutraceuticals or over-the-counter medications for the treatment of nausea, motion sickness and migraine.Ginger is also listed in the German Commission E Monographs as an approvedphytomedicine against dyspepsia and as a preventive remedy against motion sickness(Plotto 2004).
Ginger is cultivated in Nepal, Bhutan, India, China, Japan, Indonesia, Australia,Nigeria and the Pacific islands. India is the largest producer and consumer of ginger in
Table 6: Area and production of ginger inthe world, 2009
YearArea Production(ha) (MT)
1998 312 689 862 8631999 308 409 948 7202000 307 277 948 2352001 318 776 986 2672002 314 064 996 0052003 338 106 1 150 8202004 340 713 1 195 5462005 365 002 1 321 7902006 417 349 1 491 0692007 270 007 1 581 3922008 279 648 1 641 6292009 273 736 1 615 974
Source: FAO 2011.
the world. Out of the total production,about 30 per cent is used dry, while 50per cent is consumed as a freshproduct and the rest as seed material.Table 6 presents total areas undercultivation and production volumes ofginger in the world. It shows that in2009 the area under ginger cultivationin the world was 273,736 ha. India hasthe largest area of ginger cultivation,constituting about 39.7 per cent of thetotal world area under gingercultivation. World production ofginger was 1,615,974 MT in 2009.India had a predominant position inginger production, contributing 23.5per cent of the total world productionin 2009 but productivity was very poorcompared to that of the United Statesof America (FAO 2011).
2.4. GINGER PRODUCTION IN NEPAL
Ginger is an important spice cash crop traditionally grown in the mid-hill areasof Nepal at altitudes of up to 1,500 meters, across the whole east-west length alongthe Siwalik. It can also be grown in the uplands of Terai. The intercropping of gingerwith maize is a traditional method and the two form a suitable crop combination. Somefarmers of Palpa are intercropping ginger with pigeon pea and okra. Ginger is beinggrown in coffee plantations and orange orchards as well (AEC 2006).

118
STUDIES IN TRADE AND INVESTMENT 70
The production of ginger almost doubled in a decade to reach 174,268 MT in2009; however, the growth is attributed more to the area harvested than to the growthyield. The growth yield is 3.0 per cent per year compared to 4.7 per cent of the growthof harvested area during 1998 to 2009. Ginger is produced all over the country excepton high altitudes (table 7). The geographical distribution of ginger production showsits concentration in western mid-hills. Among the development regions, production isthe highest in the eastern development region followed by the western, centralmid-western and far-western regions. However, the productivity seems highest in thefar-western development region followed by the central and mid-western regions.Among the districts, the most important ginger producing districts are Palpa,Nawalparasi, Arghakhanchi, Syangja, Kaski and Tanahu in the western developmentregion, Salyan in the mid-western region, and Ilam in the eastern region (table 8).
Table 7: Production of ginger in Nepal, 1998-2009
YearArea Harvested Yield Production
(ha) (kg/ha) (MT)
1998 8 821 92 508 81 6011999 8 821 92 732 81 7992000 8 314 90 202 74 9942001 8 956 94 201 84 3662002 9 189 95 668 87 9092003 11 830 127 298 150 5932004 11 930 128 000 152 7042005 12 000 128 500 154 2002006 12 994 118 668 154 1972007 13 025 122 000 158 9052008 13 332 132 465 176 6022009 13 808 126 208 174 268
Sources: FAO 2011.
Table 8: Geographical distribution of ginger production inNepal, 2008
Development Area Harvested ProductionRegions (ha) (MT)
Eastern 4 119 51 956Central 1 928 24 791Western 5 136 46 848Mid-Western 1 830 23 452Far-Western 994 14 124
Source: MAC 2008.

119
COUNTRY STUDIES ON BANGLADESH, NEPAL AND SRI LANKA
Ginger is grown in tropical, subtropical and humid climate at an altitude of upto 1,500 metres. A well-distributed (eight to ten months) rainfall (1,500-3,000 mm)during the growing season and dry spells during land preparation and harvesting arerequired for good growth and yield of the crop. Dry weather, with temperatures in therange of 28-30 degree Celsius for about a month before harvesting, is ideal for gingerfarming. High humidity throughout the crop growing period is necessary. Ginger giveshigh yield when planted at a depth of 30 cm in good, light, well-drained, loosely friable,rich in humus garden soil with a slightly acidic character.
Depending on the altitude and rainfall, planting is done from February to April.Farmers believe that early planted ginger escapes hailstorms and results in high yields.Rhizomes are planted in two-three rows in each bed and covered with soil. The spacingbetween rhizomes should be about 15 cm. In most areas, the whole unbroken rhizomeis planted , which increases the recovery of the mother rhizome yield called mauextraction, an ancient practice in Nepal. However, there has been a widespread practiceamong small farmers of intercropping ginger with maize, beans and millets. Whenginger is intercropped with other crops, inter-row distance is generally 60-90 cm.Immediately after planting, beds are covered with mulches consisting of forest leaves,straw, grass and other plant residue up to eight- ten cm. thick. Mulching protectsseedlings from rain, prevents weed growth, keeps soil soft and moist and acceleratesgrowth.
For fresh ginger, the crop should be harvested before full maturity, i.e., whenrhizomes are still tender, with low pungency and fibre content, usually from the fifthmonth after planting. Such fresh and green ginger is used in pickles, candy preparationor cooking. In order to make preserved ginger, harvesting should be done betweenfive and seven months after planting, while for dried spice and oil harvesting is best atfull maturity, i.e., between eight to nine months after planting, when leaves becomeyellow. Rhizomes used as planting material should be harvested when the leavesbecome completely dry. The root and rhizome diseases, particularly bacterial wilt, softrot and yellow are major troubles besides insect pests, such as white grub and shootborer.
After harvesting, the ginger should be stored properly. There are threetraditional methods of seed rhizome storage in Nepal. They are storage in soil pits,storage in a dry and shaded place and in situ storage. Instead of bearing storage costs,many farmers prefer in situ storage (delayed harvest) so that they can supply the productaccording to market demand and allow the rest of rhizomes to remain in the field.However, this method leads to rhizome rotting and rhizome sprouting in the course oftime and also to harbouring insect pests.
After the harvest, the fibrous roots attached to rhizomes should be trimmed offand the soil removed by washing. Rhizomes should be soaked in water overnight andthen cleaned. The skin can be removed by scraping with sharp bamboo splits orwooden splice. Use of metallic knives should be avoided since they will discolour therhizomes. Peeling or scraping reduces drying time, thus minimizing mould growth andfermentation. However, the scraping process tends to remove some of the oil that isconcentrated in the peel. By removing the outside corky skin, the fibre content also

120
STUDIES IN TRADE AND INVESTMENT 70
decreases. After scraping, the rhizomes should be sun dried for a week with frequentturning and hand rubbed to remove outer skin. This process is called unbleachedginger. Mechanical drying is rapid and gives more homogenous and cleaner productover the sun drying method where peeled ginger takes eight to nine days to reachmoisture content of eight to nine per cent. To reduce losses in quality, cleaning anddrying should be done as fast as possible after harvesting. To avoid discolouration, thetemperature should not exceed 60 degree Celsius during mechanical drying. Propercare should be taken during the grading and packaging to supply quality ginger (Yadavet al. 2004).
Farmers in Nepal traditionally cultivate two landraces of ginger, namely, Naserhizome containing more fibers, and Bose rhizome, which is fibreless or with negligiblefibres. Ginger Research Programme, Kapurkot offered another ginger variety namedKapurkot Aduwa-1 in 2001; however, the demand for seeds of this variety of rhizomeamong farmers cannot be satisfied even now (AEC 2006).
2.5. EMPLOYMENT IN THE COFFEE AND GINGER PRODUCTS SECTORS
Coffee and ginger products are highly labour intensive and a large number ofsmall farmers are involved in their production. Generally, small farmers employhousehold labour for production and post-production management; however, mediumand large farmers use hired labour in their post-production and value added activities.Small farmers’ family members do almost all the work – from land preparation toharvesting of the crops. Men generally purchase seeds and do the ploughing whileboth men and women do the hoeing and digging. Sowing, planting, manureapplication and harvesting are done by both men and women. Women do the weeding.While women generally dig out ginger from the field and do cherry picking, its sale islooked after by men.
International Trade Centre (ITC) estimates that ginger production requiresaround 66,600 people for two months per year, which is around 11,000 people asfull-time employees at the current level of production (ITC 2007). Similarly, it isestimated that about 20,000 families are engaged in the production of coffee (Ghimire2009) and that is the equivalent of more than 7,700 full-time employees (ITC 2007). Inaddition to direct employment, a large number of people are employed in differentstages of value addition such as cleaning, packaging, transportation, loading andunloading. The Agro Enterprise Centre (AEC) of the Federation of Nepalese Chambersof Commerce and Industry estimates that promotion and diversification of coffeeproducts into specialty and organic coffee products may engage 75,000 farm families,resulting in 460,000 people as beneficiaries – with 420,000 employment positions goingto farmers’ family members and 40,000 employment positions to processing andmarketing (AEC 2006).
3. Export Potential and the Government Policy
While the total exports of Nepal declined by 0.2 per cent in 2007/08, the exportof coffee and ginger increased by 168 per cent and one per cent, respectively, implyingthe significance of these sectors. The study evaluates the potential for export promotion

121
COUNTRY STUDIES ON BANGLADESH, NEPAL AND SRI LANKA
of coffee and ginger products based on export supply growth, global market situationand market access conditions. Government policies in agriculture and trade promotionare also reviewed.
3.1. EXPORT POTENTIAL FOR COFFEE PRODUCTS
Nepal Coffee Producers Association estimates that about 65 per cent ofthe production of coffee is exported to foreign countries. In 2007/08, a total of112 thousand kg of coffee was exported with total proceeds reaching 107 million NRs.
Table 9: Coffee export of Nepal (greenbeans)
Year Exports
Volume (kg) NRs. Millions
2000/01 3 677 0.672001/02 9 075 2.452002/03 16 861 5.202003/04 25 295 5.942004/05 65 000 1.962005/06 91 500 27.672006/07 100 180 40.112007/08 112 000 107.80
Source: NTCDB (2009).
The trend in the growth of exportboth in volume and value is quiteencouraging. During the last sevenyears export volume increased at anaverage annual growth rate of 71 percent, whereas export value increasedat a growth rate of 264 per centindicating that Nepalese coffeeexporters are getting better prices fortheir products (table 9).
Nepal exports only Arabicagreen beans of two varieties: de-caffeinated (65 per cent) and regular.Destination-wise, export of coffee ispresented in table 10. The majormarket for the Nepalese coffee is Japanfor both decaffeinated (85 per cent)and regular varieties (50 per cent),followed by Germany for the former,Canada for the both, and the Republicof Korea for the latter varieties. Smallervolumes of coffee have also beenexported to the United Kingdom andthe United States of America.
Coffee is the second mosttraded commodity in the world afteroil. It reached $13 billion in inter-national trade and about 80 per centof the coffee’s global productiontrades internationally (ICO 2011).World exports increased at an annualaverage growth rate of 26.4 per cent invalue and 0.7 per cent in volume from
Table 10: Export markets for the Nepalesecoffee, 2007/2008 (in thousands of NepaleseRupees)
Regular De-Countries unroasted caffeinated
unroasted
Canada 1 044 927Germany 140 7 857Japan 8 899 9 242Republic of Korea 185 989United Kingdom 98 –United States 6 –of AmericaTotal 10 372 19 015
Source: TEPC (2008).
2000/2001 to 2009/2010, implying that the prices of coffee in international marketincreased over the period (table 11). As far as the global export market is concerned,the share of Brazil (32.1 per cent in 2009/2010) is the highest, followed by Viet Nam

122
STUDIES IN TRADE AND INVESTMENT 70
(15.5 per cent), Indonesia (8.5 per cent) and Colombia (7.6 per cent) (table 12). Similarly,the United States of America is the largest importer of coffee followed by Germany,France, Italy, Japan, Belgium and Canada. The growth of imports in all major importingcountries during 2004-2008 is quite high for both green bean and roasted coffee.Belgium recorded the highest growth of 34 per cent in the import of green beanswhereas Japan topped the list with an average annual growth rate of 78 per cent forroasted coffee during 2004-2008 (table 13).
Table 11: World coffee export from 2000/2001 to 2009/2010
YearExports Exports Average Price
(US$ billion) Million Bags Cents/lb FOB
2000/2001 6.7 88.0 582001/2002 6.6 85.8 582002/2003 7.6 90.2 642003/2004 9.2 88.0 792004/2005 12.4 89.0 1062005/2006 14.8 88.0 1272006/2007 17.8 98.5 1372007/2008 22.0 94.1 1772008/2009 20.0 95.4 1592009/2010 24.4 94.2 196
Sources: ICO (2011); ITC (2011).Note: One bag contains 60 kg.
Table 12: World’s top 10 coffee exporters, 2009
CountryExports in
thousands of bags
Brazil 30 207Viet Nam 14 591Indonesia 7 990Colombia 7 196India 3 901Guatemala 3 446Honduras 3 161Peru 2 999Ethiopia 2 904Uganda 2 669
Source: ICO (2011).Note: One bag contains 60 kg

123
COUNTRY STUDIES ON BANGLADESH, NEPAL AND SRI LANKA
All major importing countries levy zero duty in the imports of green coffeebeans; therefore, any kind of tariff preference is irrelevant for Nepal. Nonetheless, Nepal,being a least developed country (LDC), enjoys duty-free access for roasted coffee undertrade preference for LDCs in all major coffee importing countries. However, thepreference margin is higher in Japanese markets compared to other markets (table 14).
Table 13: World’s top 10 coffee importers, 2008
CountryImport Growth 2004-2008 (in per cent)
Green Bean Roasted
United States of America 4.256 18.0 4.0Germany 3.329 23.0 30.0France 1.381 29.0 16.0Italy 1.379 26.0 30.0Japan 1.267 24.0 78.0Belgium 1.206 34.0 20.0Spain 0.669 21.0 25.0United Kingdom 0.628 18.0 3.0Austria 0.445 25.0 45.0
Source: ITC (2011).
Value in billionsof dollars
Table 14: Market access conditions for the Nepalese coffee in major importingcountries (tariffs in per cent)
Country
Green Beans Roasted
Most Pre- Pre- Most Pre- Pre-Favored ferential ferential Favored ferential ferentialNation Tariffs Tariffs Nation Tariffs TariffsTariff for GSP for LDCs Tariff for GSP for LDCs
United Statesof America 0 – – 0.0 – -Germany 0 – – 7.5 – 0France 0 – – 7.5 – 0Italy 0 – – 7.5 – 0Japan 0 – – 20.0 10 0Belgium 0 – – 7.5 – 0Spain 0 – – 7.5 – 0United Kingdom 0 – – 7.5 – 0Austria 0 – – 7.5 – 0
Source: ITC (2011).

124
STUDIES IN TRADE AND INVESTMENT 70
The above tables demonstrate that the export of coffee from Nepal has beengrowing significantly and the markets are diversified. The world export market isencouraging and demand in major importing countries recorded double-digit growth.There are no tariff barriers for market access for the Nepalese coffee and the countryenjoys significant tariff preferences in European and Japanese markets. Thus, a majorchallenge for promoting export is export quality for both specialty and organic coffeeand meeting sanitary, phyto-sanitary and other standards.
The quality of coffee is determined by a combination of factors, includingbotanical variety, topographical conditions, weather conditions and care taken duringgrowing, harvesting, storage, export preparation and transport. Botanical variety andtopographical conditions are constants while weather conditions are variable anddifficult to predict. Therefore, growing, harvesting, storage, export preparation andtransport are variables that can affect the quality. Although Nepalese coffee producersand processors are not highly skilled and equipped with adequate expertise, Nepalesecoffee is considered high quality because of suitable and diverse climatic conditions.Nevertheless, Nepalese producers are not that quality conscious and the presence ofOchratoxin A (OTA)32 has been found in Nepalese coffee in recent years (AEC 2006).Moreover, it is disheartening to note that there is no coffee quality standard introducedby any agency, private or public, in Nepal.
The International Coffee Organization (ICO) has adopted resolution 420, whichrecommends voluntary targets for the minimum quality export standards for bothvarieties of coffee, Arabica and Robusta. It calls on producing members to restrict theexport of Arabica coffee with more than 86 defects per 300 g sample or the export ofRobusta coffee with more than 150 defects per 300 g sample. The resolution also callson members to prohibit Arabica or Robusta of any grade to be exported if the moisturelevel of beans is below eight per cent or above 12.5 per cent; it also includes a provisothat this should not affect the established, good and accepted commercial practices.Although specialty coffees that traditionally have high moisture content are exempted,resolution 420 requires all producers to clearly identify on the Certificate of Origin anycoffee that does not reach the recommended standards.
Since consumer awareness on sanitary and phyto-sanitary standards of fooditems has increased, stringent food legislation is being introduced with a potentialimpact on the export of coffee. For example, Hazard Analysis Critical Control Points orHACCP system developed by Codex Alimentarius Commission has become a mandatoryrequirement in the markets of various countries since the 1990s and, particularly, fornon-farm food businesses in the European Union since January 2006.
Despite the fact that coffee is mostly grown organically in Nepal, Nepal has notbeen able to export all the coffee as organic because of the problems with certificationOrganic certification requirements cover not only on the product itself but also theintrinsic part of the production process and procedure. International Federation of
32 Ochratoxin A is one of the most abundant food-contaminating mycotoxins in the world. Studieshave shown that OTA is potentially carcinogenic. Human exposure occurs mainly throughconsumption of improperly stored food products, including coffee.

125
COUNTRY STUDIES ON BANGLADESH, NEPAL AND SRI LANKA
Organic Agriculture Movements (IFOAM) has formulated basic standards for organicproducts. These standards are at the base of the legislation that has been introducedin the European Union (1992), the United States of America (2000), Japan (2001), anda number of other countries, including Argentina, Bolivia, India and Mexico that havecreated national legislation to regulate the market for organic products (ITC 2009).
Besides certifying coffee cultivation, all subsequent steps in production chainalso have to be certified to get an organic product certificate. On-farm processing,storage, transport, drying and hulling, roasting, packaging, distribution and retailing allhave to be certified organic. Contact with conventionally produced coffee should beexcluded. Spraying or fumigation with toxic agents should not be permitted and specialmeasures should be taken to prevent contact with areas where fumigation has takenplace. Adequate records should be kept of incoming and outgoing coffee products sothat the entire product flow could be documented and accounted for, such processreferred to as traceability. All steps in the chain should, therefore, be documented andaccounted for making it possible to trace back the origin of the product from one stepto the next (track and trace), ensuring that no contamination with conventional coffeehas occurred. This traceability minimizes the risk of fraud at all stages and is a veryimportant part of the inspection process by certifying organizations (ITC 2009).
Organic products imported into the European Union must have been producedin accordance with the European Union regulation on organic food (EC 834/2007). Thisregulation provides that a non-European Union country can get an approval if itsproduction system complies with principles and inspection measures equivalent tothose laid down in the European Union regulations. According to such regulations, thefollowing standards must be followed:
● Cultivation of vegetables, green manures or deep-rooting plants in anappropriate multi-annual rotation programme;
● Incorporation in the soil of organic material, organic livestock manure andvermicompost;
● Pests, diseases and weeds to be controlled by using appropriate varieties,rotation programmes, biological pest control, mechanical practices andflame weeding;
● Seeds and propagation materials organically produced;.
● Use of non-organic fertilizers, pesticides and biological pest controlmethods is limited.
In the United States of America, National Organic Program (NOP) has beenestablished under Organic Food Production Act. Organizations that are fully NOP-compliant (certified) may label their products or ingredients as organic, and may usethe ‘USDA Organic Seal’ on organic products in the country, irrespective of whether theyare produced domestically or are imported.
Japanese Agricultural Standard (JAS) for Organic Agricultural Products enteredinto force in April 2002. Enacted by the Ministry of Agriculture, Forestry and Fisheries,JAS regulates the production and labelling of organic food items produced in Japan.

126
STUDIES IN TRADE AND INVESTMENT 70
Although coffee is not grown in Japan, JAS nevertheless also covers organic coffee (andtea) under ‘organic agricultural products.’ Only Ministry-accredited certifying bodies mayissue JAS organic certification for coffee to be imported into Japan.
3.2. EXPORT POTENTIAL FOR GINGER PRODUCTS
World trade in ginger was estimated at $578 million in 2008 and the quantitytraded was 2.223 million tonnes (table 15 and FAO 2011). The growth of world ginger
Table 15: World export of ginger,2001-2008
YearValue in millions
of dollars
2001 123.12002 121.12003 132.42004 286.52005 321.72006 248.02007 264.62008 578.4
Source: ITC (2011).
exports was one per cent in value termsand nine per cent in volume terms duringthe period 2004-2008 (ITC 2011). China isthe major supplier in world gingermarkets followed by Thailand, Nepal andthe Netherlands (table 16). Despite thefact that ginger accounts for just morethan one per cent of national exports,Nepal ranks as the third largest exporterof ginger in terms of volume and the sixthlargest exporter in terms of value in theworld market. The fact implies that theprice Nepal is getting for its exports issubstantially lower than that of the worldaverage.
Table 16: Top 10 ginger exporting countries, 2009
Country Quantity (tonnes)Value (in thousands Unit value
of dollars) (dollars/tonnes)
China 341 388 284 454 833Thailand 49 808 24 932 501Nepal 26 724 5 209 195Netherlands 18 364 25 835 1 407India 12 175 14 279 1 173Ethiopia 10 752 6 531 607Indonesia 7 326 3 391 463Nigeria 4 256 4 431 1 041Brazil 3 952 3 892 985Fiji 1 037 3 270 3 153
Source: FAO (2011).
Nepal’s export market for ginger is primarily India although it has also beenexporting to Japan and the United States of America in smaller quantities (exports ofless than half a million NRs. in 2007/2008). Raw and dry ginger export constitutes abouta half of Nepal’s total export of spices to India. Export of raw ginger constitutes about85 per cent and the remaining percentages of ginger export are divided between semi-

127
COUNTRY STUDIES ON BANGLADESH, NEPAL AND SRI LANKA
processed and dry product, i.e., Suntho. It is reported that more than 60 per cent ofthe total production of ginger is exported to India as fresh or dry product. Ginger exporttrend in terms of value is very erratic. From 2011 to 2008 it has showed an annualgrowth of as high as 75 per cent in 2006/2007 and a decline of 33 per cent in 2004/2005 (table 17). Such volatility in exports could not be explained just by the volatility
Table 17: Ginger export to India(in millions of NRs.)
Year TotalDried Fresh
Ginger Ginger
2001/2002 288.4 80.5 207.92002/2003 423.8 108.4 315.42003/2004 365.1 78.0 287.12004/2005 241.1 80.1 161.02005/2006 337.4 62.2 275.22006/2007 590.9 49.6 541.32007/2008 597.2 54.0 543.22008/2009 403.1 68.0 335.1
Source: MOF (2009b).
in production; it could be explainedpartly by the internal security measures,the political situation and by animposition of sanitary standards by theIndian Government.
Northern Indian markets ofGorakhapur, Varanasi, Lucknow, Kanpur,Patna, Jaipur and Delhi are majordestinations for Nepalese ginger. Indiais a large and dynamic market forNepalese ginger. A number of longestablished markets for Nepalese gingerin India are currently under threat fromthe increased domestic production,especially from the towns of Cochin insouthern India and Bangalore insouth-eastern India (ITC 2007). The major competitors in the Indian markets are China,Nigeria, Myanmar and Ethiopia.
Japan, followed by the United States of America, the United Kingdom andBangladesh, are the major importers of ginger in the world. In these countries,ginger is imported processed rather than fresh. However, in South Asia, in countries
Table 18: Top 10 importers of ginger, 2009
Import value Import growthCountry (in millions (2004-2008)
of dollars) (per cent)
Japan 90.7 -12.0United States 43.2 14.7of AmericaBangladesh 35.6 732.4Pakistan 28.9 23.6Netherlands 24.7 46.2United Kingdom 24.2 41.2United Arab Emirates 22.8 177.0Malaysia 21.0 37.1Germany 15.9 59.9India 12.3 8.5
Source: ITC (2011).
such as India, Pakistan andBangladesh, fresh gingerconstitutes a major chunk ofginger imports. The growthrates of ginger imports arehigh in Bangladesh, theUnited Arab Emirates,Germany, the Netherlands,the United Kingdom, andMalaysia; moderate inPakistan, the United States ofAmerica and India; andnegative in Japan (table 18).
The market accessconditions for the Nepaleseginger in major importingcountries show that Nepalenjoys duty-free access in

128
STUDIES IN TRADE AND INVESTMENT 70
developed economies, such as Japan, the United States of America, the Netherlandsand Germany under the Generalized System of Preferences (GSP) for least developedcountries. Nepal also enjoys a zero duty in the Indian market under a bilateral tradeagreement and the margin of preference for Nepal is higher in India compared to otherSouth Asian least developed countries. Pakistan also provides preferential access forleast developed countries under the Agreement on South Asian Free Trade Area (SAFTA).However, there is no such tariff preference in the Bangladeshi and Saudi Arabian markets(ITC 2011).
The above analysis shows that tariff barrier is not a major constraint for Nepalin promoting exports of ginger. The challenge is in the diversification of the value addedproducts and the markets. Ginger in Nepal is traded in fresh, dry and processed forms.About 85 per cent of ginger is traded fresh and the remaining volume is distributedbetween the dry and a negligible quantity of processed forms. Similarly, more than 99per cent of ginger is exported to India. However, product diversification and valueadded is the precondition for market diversification.
In Asia and the Pacific, most of the consumption of ginger is in the fresh formbut in other countries consumption of processed ginger, such as paste, oil, oleoresin,candy, etc., is on the increase. For example, ginger can be preserved in syrup as in China.Australia has also developed the ginger industry and it exports mostly candied rhizomes,reputed to have ‘superior and consistent quality.’ Ginger oil can be received by steamdistillation of grind paste or dried powdered ginger, which is used as a flavouring agentfor soft drinks and ginger beer and in food preparation. Similarly, ginger oleoresin canbe obtained by extraction from dried ginger pulverized to coarse powder and addedorganic solvents like ethanol or acetone. However, one needs to note that oil obtainedfrom dried rhizomes yields 1.5 per cent to 3.5 per cent on the dry weight basis and0.4 per cent on the green weight basis while oleoresin content ranges from 3.5 to9.5 per cent. With the increasing ginger production, India and Hawaii (the United Statesof America) have started to produce ginger paste as a value added product. However,it is difficult to maintain stability in flavour and quality and preserve ginger paste fora long time.
To enter new markets Nepal needs to diversify processed ginger products. It isimperative for Nepal to explore export potentials in the Asia-Pacific markets for freshginger and in other markets for processed ginger, including organic ginger products.However, exporters need to comply with sanitary and phyto-sanitary standards.
3.3. THE GOVERNMENT POLICY
Agricultural Perspective Plan (APP) launched in 1995, is the Government’s keypolicy document on agricultural and rural development, but it has only been partiallyimplemented. The strategies outlined in the APP were expected to lead to a technology-based green revolution in agriculture, which would raise outputs and incomes throughincreased use of yield increasing inputs (fertilizer, improved seed, reliable irrigation) andpromotion of off-farm activities. The strategy was regionally differentiated between theTerai (focusing on high yielding input-based food grain production) and hilly andmountainous areas (focusing on horticulture and other cash crops, including ginger and

129
COUNTRY STUDIES ON BANGLADESH, NEPAL AND SRI LANKA
coffee, as well as on livestock production in prioritized pocket programmes). The APPenvisaged significant increases in public and private investments and an integratedpackage approach to exploit complementarities between public and privateinvestments and with other sectors such as transport and energy. The APP includedexplicit investment targets focused on four priority inputs: fertilizer, irrigation,technology and infrastructure (HMG/ADB 1995).
National Planning Commission of Nepal adopted a three year interim plan(2007/2008-2009/2010) in which it spelled out one of its strategies for commercialagriculture as establishing and strengthening competitive agriculture value chains onproducts with comparative advantages. The plan also included creating partnershipsamong the Government, cooperatives and the private sector for sustainabledevelopment of commercial agriculture by establishing, developing and strengtheninglarger pocket areas based on geographic, technical and economic feasibilities. The planhas also identified priority agricultural crops and commodities for mission programmesby choosing ginger and coffee products and proposed to accomplish the mission byaddressing various stages of the products’ value chains, among others. To achieve this,the plan has adopted the policy of providing high quality seeds, better irrigationfacilities, agricultural credit, technological development and dissemination, extensionservices, better marketing management system and regulations and human resourcedevelopment (NPC 2007).
Trade Policy 2009 has also identified ginger and coffee as products for exportpromotion. Regarding ginger products, the policies included production expansionbased on providing financial support, technology and quality seeds, establishment ofmarket system, improvement in the quality of production and processing of ginger,introducing quality certification, training farmers during all stages from production tomarketing, value addition and product and market diversification. Regarding coffeeproducts, the document emphasized providing high quality seeds and seedlings,identification of new areas for highland and organic coffee production, adoption of newtechnologies for coffee production, processing and grading and assistance to farmersin the formation of farmers’ cooperatives (MCS 2009). The Government has also enactedCoffee Policy 2003 aiming at increasing the participation of private and cooperativesectors in coffee production, processing and trade, developing coffee sector in asustainable manner, creating income and employment opportunities, reducing povertyand promoting coffee exports. The policy has also identified strategies and policies inproduction and processing, market and market promotion and institutionaldevelopment (MAC 2003). However, it is yet to be implemented because of the absenceof implementing policy regulation.
Direct support to farmers and processors included Government providedinterest subsidies for the loans taken by coffee producers. The budget speech of 2009/2010 has initiated a programme of providing 25 per cent subsidies on the cost ofmachinery and equipment to coffee and ginger processing industries. It has alsointroduced 100 per cent subsidies for the registration of a trademark ‘Nepalese Coffee’in international markets. However, there is no similar support programme designedfor the ginger sector.

130
STUDIES IN TRADE AND INVESTMENT 70
The Government policies on the development of coffee and ginger sectors arepositive and progressive, but in comparison with policies of other Asian coffee andginger producing countries are still inadequate and policies’ implementation is sluggish.There is no government support for planting seeds and seedling, technology adoptionand adaptation, quality upgrading and market development, while governmentinitiatives on product research and development, processing technology and humanresource development are disappointing.
4. Value Chain Analysis
Value chain has been defined by Michael Porter as a tool for analysis that‘disaggregates a firm into its strategically relevant activities in order to understand thebehavior of costs and existing and potential sources of differentiation’ (Porter 1985). Heclaims that value chain allows us to diagnose the competitive advantage of a firm orindustry and to enhance the advantage by tailoring the value chain. However, therehave been significant developments since Porter introduced the concept and a broadapproach to value chain looks at the complex ranges of activities implemented byvarious actors (suppliers, primary producers, processors, traders, service providers, etc.)to deliver raw material to retail market of the final product. The broad value chain startsfrom the production system of raw materials and moves along the linkages betweenenterprises engaged in trading, assembling, processing, etc. This broad approach notonly looks at the activities implemented by a single enterprise but also includes all itsbackward and forward linkages, up until the level at which the raw material producedis linked to the final consumers (Roldan-Prez et al. 2009).
Value chain analysis or commodity chain analysis disaggregates the globalstructure of fabrication, trade and consumption of commodities and allows for theidentification of factors and geographical divisions (Tuvhag 2008). Value chain analysishas been widely adopted by researchers, industry and development practitioners tounderstand the political economy of contemporary global production systems and hasbeen also used as a tool to analyze different aspects of chain coordination andgovernance. Value chain analysis has three key elements: (a) barriers to entry and rent;(b) governance; and (c) systemic efficiency (as opposed to point efficiency, meaning thatthe links of the complex value chain need to be integrated to make them efficient)(Kaplinsky 2000). At the most basic level, it systematically maps the actors participatingin the production, distribution, marketing and sale of a particular product. This mappingassesses the characteristics of actors, profit and cost structures and flows of goodsthroughout the chain, as well as employment characteristics and the destination andvolumes of domestic and foreign sales (Kaplinsky and Morris 2001). Secondly, it canplay a key role in identifying the distribution of benefits to different actors in the chain.It means that, through a value chain, one can determine who benefits from participationin the chain and also assess which actors benefit from the government interventionsor support. Thirdly, it can be used to examine the role of upgrading within the chain,i.e., improvement in quality and product design and identification of productregulations, entry barriers, trade restrictions and standards. Fourthly, it can highlightthe role of governance in the value chain. Governance in a value chain refers to thestructure of relationships and coordination mechanisms that exist between its variousactors. The following analysis focuses on the first two aspects.

131
COUNTRY STUDIES ON BANGLADESH, NEPAL AND SRI LANKA
4.1. ANALYSIS OF THE COFFEE PRODUCT VALUE CHAIN
Coffee product value chain is the sequence of stages involved in deliveringcoffee products to the final consumer. It includes production (cultivation, harvest andinitial processing), roasting, distribution and consumption.
Coffee production takes place in coffee estates and small farms. This stageinvolves planting, growing and harvesting of the coffee cherry and initial processingof separating coffee beans from the skin and pulp of the cherry. The stage is finishedwith the production of green beans.
Since coffee is largely consumed in non-producing countries, it is exported toconsumer mostly in the form of green beans. Several firms may be involved in theinternational trade of coffee including exporters, importers and roasters. The trade canalso occur directly between a grower and a roaster. Moreover, growing and roastingcan be vertically integrated under single ownership and management.
Green beans should be processed to display its aromatic and flavourcharacteristics. This processing is called coffee roasting and consists of heating coffeebeans that transforms the physical and chemical properties of the green beans and turnsthem into roasted coffee beans.
Finally, coffee is ground and brewed for consumption as a hot or cold beverage.Brewing includes the use of a dip brewer, an espresso machine, a French press ora vacuum pot, among other methods. Coffee may be further processed to make instantcoffee, which only requires adding water to consume.
Fitter and Kaplinsky (2001) have mapped the major inter-country input-outputrelations in the coffee value chain presented in figure 1. Various stages of a value chaininclude the following:
● Farmers either pick and dry process or pick and wet process coffee cherries,receiving a farm-gate price.
● The cherries are then dry or wet processed to receive coffee beans atfactory gate price.
● Coffee beans then go to an intermediary for export, reflected in fob prices.
● Coffee beans are shipped to importing countries at cif prices.
● Importers sell coffee beans at wholesale prices.
● Roasters process coffee beans and sell them at factory gate prices.
Retailers sell coffee beans to the public for domestic consumption andrestaurants, caterers and coffee bars for out-of-home consumption at retail prices.
Fitter and Kalinsky (2001) found that not only have coffee producersexperienced declining share of returns, but also a rising share of the total value chainreturns has gone to roasters and retailers in the high income consuming countries, whowere able to protect themselves from competition by introducing product-related

132
STUDIES IN TRADE AND INVESTMENT 70
Figure 1: The coffee value chain33
Wet process:washed parchment
Fresh cherry
Dry process:dry cherry
Unwashed greenbean
Washed greenbeans
Beans for export
Export duty
Freight andinsurance
Import duty
Beans clearedfor market
Dealer
Coffee houseProcessingcompany
Instant coffeeRoasted ground
coffee
Shop retail forhome market
Commercial andcatering
Coffee bar
Farm
Fact
ory
Exp
ort
er
Pro
du
cin
g C
ou
ntr
y
Imp
ort
ag
ents
Fact
ory
Ret
ail
Bar
Co
nsu
min
g C
ou
ntr
y
% retailvalueadded
10/21
US cents/lb(1994)
Farm gate costs: 45/91
Factorydoor costs: 136
FOB: 170
CIF: 180
Wholesalecosts: 214
Factorydoor costs: 343
Retailcosts: 440
Cap-puccinocosts*
20/9
7
4
8
29
22
* Costs variable but very high. Include: overheads, advertising other products (i.e., milk), and the‘experience‘ of the coffee bar. (see breakdown of the price of a cup of coffee)
33 Source: Fitter and Kaplinsky (2001).

133
COUNTRY STUDIES ON BANGLADESH, NEPAL AND SRI LANKA
branding barriers entry. It is estimated that farmers only get 10 per cent of final productprices and total returns in producing countries are less than 40 per cent of the finalproduct prices.
4.2. VALUE CHAIN ANALYSIS OF THE COFFEE SECTOR IN NEPAL
In a simplified model of Nepal’s participation in the global coffee value chain,the first stages include artisanal process of planting and growing coffee plants, thenhand picking and seizing and afterwards drying, washing and cleaning coffee beans.The process requires a farmer’s constant attention, assuring good quality coffee. Localfarmers, sometimes through cooperatives, sell the cherry to pulpers or operators, whoin turn sell them to processors/marketers. After hulling and quality control, it is exportedas roasted or green beans or sold on domestic market after roasting, grinding andpackaging. An exporter channels the coffee either to roasters or to other brokers orintermediaries. About 65 per cent of the total coffee production is exported while35 per cent is consumed domestically. Coffee value chain map is presented in figure 2.
Farmers play an important role in the coffee value chain because they take partin production phase, the first phase in the chain. There are more than 21,000 farmersproducing coffee in 40 districts of mid hills. Lalitpur, Gulmi, Palpa, Syangja, Kaski,Kavrepalanchok, Sindhupalchok, and Arghakhanchi are well-known districts for coffeeproduction and farmers of Baglung, Parbat, Dhading, Gorkha, Lamjung, Tanahu, Rasuwa,Nuwakot, Okhaldhunga, Ramechap and Ilam have also started growing coffee recently.An average coffee farmer belongs to lower middle class and owns 1.4 ha of landconsisting of bari grassland (non-arable land with steep and moderate slopes, proneto soil erosion, which is used for cultivation of maize, millet, beans and mustards) andarable land divided in almost equal parts/segments (AEC 2006). Since coffee farminggives returns only after three to four years of plantation, poor farmers are rarely engagedin coffee farming, as they need immediate returns from their land and labour. Some ofexporting enterprises, e.g., Highland Coffee Promotion Company Limited and PlantecCoffee Estate have also started coffee farming on a large scale by leasing land fromfarmers/government agencies.
All cherries are handpicked by farmers/hired workforce. Farmers often pluckall berries on each branch and do not distinguish between ripe and green cherries. Suchpractice has resulted in quality variation of coffee beans.
The focus group was informed that the expansion of coffee farming is beingcarried out by farmers despite any scientific proof of the suitability of the land andclimate conditions to such type of farming. Pioneers of coffee farming had adoptedthe farming and processing system imported from El Salvador and they have beenmodifying the system on hit-and-trial basis ever since. Some farmers are emulating suchfarming system. There has not been any scientific research on the farming methods inNepal and the appropriate method for coffee farming in terms of attaining optimumyields and better quality and minimizing plant diseases is yet to be found.

134
STUDIES IN TRADE AND INVESTMENT 70
Fig
ure
2:
The
coff
ee s
ecto
r va
lue
chai
n
Per
form
ed b
y fa
rmer
sP
erfo
rmed
by
pu
lper
s/p
roce
sso
rsP
erfo
rmed
by
Mar
kete
rs/E
xpo
rter
s
Inp
uts
an
d L
and
Tr
ansp
ort
atio
n
Lan
d P
rep
arat
ion
Fen
cin
gPu
rch
ase/
tran
spo
rt
of c
off
ee p
lan
tsIr
rig
atio
n s
yste
mPl
anta
tio
n o
f co
ffee
tr
ees
Esta
blis
hm
ent o
f sh
adin
g s
yste
m
Farm
ing
Trim
min
gFe
rtili
zati
on
Pest
icid
es/
Inse
ctic
ides
ap
plic
atio
n
Har
vest
Han
d p
icki
ng
ch
erri
esC
her
ry s
elec
tio
nC
her
ry
tran
spo
rtat
ion
Pro
cess
ing
Dep
ulp
ing
Ferm
enta
tio
nW
ash
ing
Dry
ing
Sort
ing
Sto
rag
e
Hu
llin
g/S
elec
tio
n
Hu
llin
gSe
lect
ion
Pack
ing
Exp
ort
Qu
alit
y C
on
tro
lM
arke
tin
gLo
gis
tics
-Tra
nsp
ort
to
po
st/a
ir b
ou
nd
fr
eig
ht,
ou
t bo
un
d
log
isti
cs
Do
mes
tic
Mar
ket
Roas
tin
gPa
ckag
ing
Reta
ilin
g

135
COUNTRY STUDIES ON BANGLADESH, NEPAL AND SRI LANKA
Initially there were five players/stakeholders in the coffee sector value chain,namely farmers, collectors, pulpers, processors and traders. However, in the past fewyears some collectors have also started pulping ripe cherries and delivering them toprocessors. The process is common in wet processing systems, which covers nearly 80per cent of the market. However, in some places farmers bring ripe cherries/dry cherriesto collectors, who in turn (after drying ripe cherries if needed) take them to processorsdirectly. Such procedure prevails in the dry processing system that accounts for nearly20 per cent of the market share. In both dry and wet processing systems, the processorsact as traders and sell the final product either on domestic and/or international markets.
Coffee farmers sell ripe cherry to pulper operators at pulpers’ gate. The pulpingstage is the crucial stage for determining the quality of coffee. It involves sorting, watersoaking, pulping, fermentation, washing and drying. Pulpers sell parchment toprocessors/marketers. After processing and packaging, processors/marketers sell coffeein domestic or international markets.
Processors or exporting companies often buy parchment from collectors or getcherries from their own farms. Processors are also involved in processing and packagingof coffee in different size packages and putting brand labels.
It was reported in the focus group discussion that there has not been anyresearch on the use of technology in pulping, hulling and drying. Participants in thediscussion complained that the Government does not provide any support for farmingand processing. On the contrary, they view government policies as a bias against thecoffee sector. For example, the import of machinery for pulping, drying, grinding androasting has normal custom duties up to 30 per cent, while other machinery importingindustries have much lower custom duties.
In order to prepare coffee beans for marketing in the domestic market or forexport, marketers/exporters reprocess the coffee collected from processors to meetexport standards and classify the coffee into different quality categories. But even afterreprocessing, the coffee still has many imperfections, due to inadequate technology.The coffee export is often affected by three problems: humidity, black and brokenbeans, and impurities. Additionally, contamination with Ochratoxin A is also seen as aproblem (AEC 2006).
Coffee is exported mostly on fob Kolkata basis. However, some exporters alsoexport by air. Transporting coffee is costly. The extra cost involved in export includesthe movement of fumigated container (for conventional coffee) from Kolkata toKathmandu and back, the cost of ventilated container and a detention charge. Exportersalso have to pay taxes/fees at customs points. Since there is no national agency in Nepalthat certifies both the quality of coffee and the country origin of producer, it has beenreported that imported coffee, mostly coming from India, has been marketed andexported overseas as the Nepalese coffee.
An indicative value added/profit in different supply chains of the coffee sectoris presented in table 19. The table shows that coffee growing is more profitable forfarmers compared to growing alternative crops. Farmers get 150 per cent return on
136
STUDIES IN TRADE AND INVESTMENT 70
their investment. The return in exporting coffee in international market is higher thanthe return in marketing it in domestic market. However, the quality of exported coffeeis also high compared to the quality of coffee sold in domestic market.
In 1990 the farmers of Palpa district established Coffee EntrepreneursAssociation, Palpa for promoting coffee production and distribution. In 2001 theinitiatives of the farmers of Palpa and farmers of other districts resulted in theestablishment of a Federation of Nepalese Coffee Producers Association, an umbrellaorganization of coffee producers, traders and exporters. At present, 14 district-levelcoffee entrepreneurs’ associations, 750 coffee producers’ groups and cooperatives andabout 20,000 farmers are affiliated with the Federation. The objectives of the Federationinclude: improving quality and standards of Nepalese coffee, institutionalizingcommercialization of coffee in a sustainable manner, developing infrastructure for coffeeproduction and distribution and protecting the interests of coffee farmers.
National Tea and Coffee Development Board (NTCB) was established in 1993under Tea and Coffee Development Board Act 1993. Its functions include: formulatingand implementing tea and coffee development policies; identifying problems andproviding recommendations for the development of tea and coffee sectors; providingsupport to enterprises in using tools and equipment for tea and coffee production andprocessing; bringing in technical know-how and skills to farmers, entrepreneurs andrelevant organizations; and networking and cooperating with all stakeholders in tea andcoffee sectors.
4.3. MAJOR CONSTRAINTS TO THE COFFEE SECTOR DEVELOPMENT IN NEPAL
The favourable natural conditions, enjoyed by the coffee industry in Nepal,create an advantage over other coffee exporting countries. These conditions are aproduct of the right altitude, latitude, climate, soil type, the surrounding environmentand default organic farming practices. In spite of being blessed with favourable naturalenvironment, the Nepalese coffee industry has been facing problems in all parts of itsvalue chain, including production, processing and marketing. In addition, there aresome institutional problems too.
Table 19: Value added in the coffee sector supply chains (inclusive of profits)
Stages IndexPercentage of
value added and profits
Cost of production 100.0 –Sale proceeds of growers/farmers 250.0 150.0Sale proceeds of pulpers/operators 322.2 28.8Sale proceeds of processors/marketers 355.5 10.3Sale proceeds of domestic retailers 611.1 71.8Sale proceeds of exporters 648.8 82.5
Source: The author’s calculation based on AEC (2006).

137
COUNTRY STUDIES ON BANGLADESH, NEPAL AND SRI LANKA
As there has not been any research on the suitability of soils for coffeeproduction, coffee tree planting has been done sporadically, all over the mid-hills,without any pocket areas selected for coffee development. As the production is thinlydistributed among small growers, the farmers are not aware of the quality of the coffeeproduced as there is no agency to certify the quality of coffee. Similarly, there has notbeen any research on improving the quality of seeds and seedlings and there is noinstitutional mechanism to provide/distribute quality seeds/seedlings or the requirednutrients/organic fertilizers and pesticides. There is no financial incentive to upscaleproduction such as an easy access to and lower cost of finances. Participants in thefocus group discussion also mentioned that coffee plants were infected by White StemBorer.34 But there were no experts who could advise farmers on how to control the pest.
In processing coffee beans, there is a lack of adequate machines, equipmentand accessories for pulping, washing and drying. There has not been any significantresearch on the suitability of the machines used in coffee processing. There is a lack ofskilled workforce to do the processing and the accredited laboratory to control thequality. After the processing is finished, storage at appropriate temperatures becomesanother problem, which, if not solved, exposes coffee beans to fungus and moulds andthus causes Ochratoxin A.
Exporters and traders are facing a number of problems both in domestic andexport markets. There is no quality and market regulation in the domestic marketresulting in substandard imported products entering the market. Similarly, there is notesting laboratory for certification, including cup testing, to ensure coffee beans quality.In addition, exporters are facing high costs for certification, transportation (includingfulfilling requirements for ventilator containers) and packing materials as well asexperiencing problems with warehousing system. Exporters are also required to paylocal taxes, both formal taxes levied by the state and informal taxes imposed by multipleprivate actors. There is also no institutionalized system providing export marketinformation.
Though the Government has enacted the Coffee Policy 2003, but due to a lackof implementation guidelines the policy is in limbo. During focus group discussion theparticipants complained that National Tea and Coffee Board (NTCB) was preoccupiedby the activities of tea promotion and coffee-related issues were put on the back burner.
4.4. VALUE CHAIN ANALYSIS OF THE GINGER SECTOR IN NEPAL
The ginger produced in Nepal has been traditionally traded domestically as wellas exported to India. Therefore, both Nepalese and Indian functionaries are engagedin creating a value chain map – the Nepalese functionaries are engaged in productionand collection stages and the Indian functionaries in wholesale and retail stages.Though the linkages between the actors are traditionally deeply rooted but the chain
34 A disease caused by an insect Xylotrechus quadripes, that affects the stem and sometimes theroot of Arabica coffee plant. It is one of the most destructive pests affecting Arabica coffee plantsin India, resulting in not only the loss of the current crop but also in uprooting of infested plantsand replacing them with new trees.

138
STUDIES IN TRADE AND INVESTMENT 70
provides more value to the Indian traders and wholesalers than to the Nepaleseproducers (Full Bright Consultancy 2008). The Agri-Business and Trade PromotionMultipurpose Cooperative reports that scientific method of cultivation, improvedvarieties, grading and modern packaging methods are not practiced by farmers as wellas by traders (ABTRACO 2005). Traders reported that because of these problems up to20 per cent of the product was wasted every year and the Nepalese ginger fetcheda comparatively lower price than the ginger produced in the hills of India.
There are three types of farmers engaged in ginger production: (a) small farmerswith subsistence ginger production; (b) small commercial farmers with small productionvolume but still targeting the market; and (c) large-scale commercial production farmers.The produce from the first category of farmers generally does not enter the market orenters in a very limited quantity, targeting local hat-bajar market. Small and large-scalecommercial farmers sell most of their produce to various market intermediaries.
Many farmers clean ginger by removing dirt and soil immediately afterharvesting. About half of the farmers sell ginger immediately after harvesting andthe rest store their produce either inside or under houses in jute bags or in pits. Onlycommercial farmers do sorting and grading of ginger according to product size (AEC2006).
Market information is generally inaccessible to small farmers and they have todepend on the information provided by collectors, while large farmers do useinformation technology such as phones, radios and TVs to get the latest marketinformation.
Small traders and big producers residing in same village would occasionally beinvolved in ginger trading. Local traders generally collect ginger from producers andtransport it to the district-level traders and wholesalers. In addition to the village-levelcollectors, some shopkeepers on highways/roads are also engaged in ginger trading.These traders have a permanent base of regular customers/farmers. Road head tradersare important market functionaries in ginger marketing and a large part of the producedginger flows through them. Farmers deliver ungraded ginger to the road head tradersand it is there, where the preliminary grading is performed. Cut, rotten and spoiledrhizomes are graded out. The grading may be carried out on their premises or whenthe product reaches the district market but in both cases road head traders pay forgrading (labour cost plus weight loss). These traders have limited storage facilities andkeep ginger until they have filled a full truck or tractor load. In many cases the roadhead traders make purchases using the capital provided by big traders as short-termloans. The interest rate is quite high, around two per cent per month (Full BrightConsultancy 2008).
Local traders collect ginger from local collectors and sell them to wholesalers/exporters stationed in bordering cities. These traders deal in big quantities and possesssome sort of storage facilities. However, the storage facilities are not adequate forstoring fresh ginger for a long time and losses are reported to be quite high for delayedshipments.

139
COUNTRY STUDIES ON BANGLADESH, NEPAL AND SRI LANKA
Commission agents play a vital role in marketing channels. Basically allexportable ginger go to various terminal markets in India through commission agentsstationed in border cities in India. The commission agents generally do not own theproduct but arrange sales on behalf of owners/traders, working on commission andbearing no risk. For this service, they charge 10 per cent commission on the total salesvalue. Nepalese exporters do washing, grading and repacking before handing over theshipment to Indian wholesalers.
Unlike coffee farmers, ginger growers are not well organized. Nepal GingerProducers and Traders Association was established in 2005 to promote ginger productin Nepal but its activities cover only the eastern part of Nepal. NGOs/INGOs and othersupport groups have assisted farmers organizing informal groups but these groups aremostly inactive. However, recently ginger farmers started forming cooperatives,although the effectiveness of such cooperatives is negligible compared to cooperativesof vegetable growers.
Figure 3: The ginger sector value chain
Source: Full Bright Consultancy (2008).
Indian wholesalesand
Traders
Retailing
Trading
Trading
Processing
Collection
Production
Local collectors
Indian retail shops
Big District LevelTraders
Nap
ali
Pro
cess
ors
/Tra
der
s
Commission Agents(India)/traders
Ginger Growers
Function Actors Enablers
Road HeadTraders
Cooperatives
Farmers’ Groups
Panchkhal Farm
DADO NGRP
Dis
tric
t C
ham
ber
of
Co
mm
erce
an
d In
du
stri
es
Nat
ion
al F
eder
atio
n o
f G
ing
er
Trad
ers
Ag
ricu
ltu
re D
evel
op
men
t B
ank
Info
rmal
Cre
dit
Su
pp
lier
Gin
ger
an
dC
ard
amo
mD
evel
op
men
tC
entr
e
Mic
ro-C
red
it

140
STUDIES IN TRADE AND INVESTMENT 70
There are only a few ginger producers’ associations at district levels, such as inPalpa and Ilam districts. Some of district chambers of commerce and industries areactive in promoting the ginger business. However, these organizations do not havemeaningful coordination and linkages with the public sector and other supportagencies to enhance the value chain (Full Bright Consultancy 2008).
Department of Agriculture (DOA), Ministry of Agriculture and Cooperatives isentrusted with the task of providing pre-cultivation, cultivation, harvesting and post-harvesting services to farmers. However, due to limited financial and human resourcesthe services are inadequate. Instead, farmers get ‘embedded’ services from inputsuppliers. For example, information and protection measures against pests and plantdiseases are provided by pesticide retailers. Unfortunately such information is biasedand the quality of services is poor.
District Agriculture Development Office (DADO) is also implementing variousactivities on ginger product promotion, such as farmers’ group formation, providingadvice to farmers, training and technology demonstrations. Ginger and CardamomDevelopment Section (Directorate of Vegetable Development within the Departmentof Agriculture) is engaged, among other things, in collection and selection of gingervarieties, technology generation, production and distribution of quality plantingmaterials and providing training and technical know-how to farmers. SpicesDevelopment Centre, Panchkhal and National Ginger Research Programme are publicsector agencies engaged in promotion and development of ginger product.
An indicative value added at different stages of ginger sector value chain, basedon a study in Phidim, Panchthar district in east Nepal, is presented in table 20. The Tableshows that farmers incur major expenditures in the cost of seeds (around 38 per cent),labour (26 per cent), fertilizer (19 per cent) and land rent (13 per cent). A margin receivedby the farmers is about 25 per cent of the wholesale market price in India. Local tradersare generally involved in collecting and transporting ginger to local market centres andtheir margin is about four per cent of the wholesale market price in India. The localtraders and wholesalers are two key players in ginger product marketing and bear thecosts of short-term storages, transportation, washing, grading, packaging, etc. They alsohave to pay taxes, both formal and informal, also, the cost of customs clearance. Themargin at this level of the value chain is reported to be around nine per cent of theIndian wholesale market price. An Indian commission agent stationed in Naxal, a nearbyIndian wholesale market, receives a 10 per cent margin on this nearest Indian marketwholesale price. An important finding, emerging from the analysis, shows that the costsincurred in customs clearance, transportation and tax collection by different groupsmake the marketing cost quite high. Similarly, the losses at the marketing level are alsohigh due to inadequate post-harvest management at the production level. Also, thecommission charged by wholesalers and commission agents is relatively high due to alack of market information among upstream value chain actors.

141
COUNTRY STUDIES ON BANGLADESH, NEPAL AND SRI LANKA
4.5. MAJOR CONSTRAINTS TO THE GINGER SECTOR DEVELOPMENT IN NEPAL
In spite of the fact that ginger is an important cash crop for the Nepalesefarmers, no major breakthrough has been made so far in boosting its production andexport. Since it is a vegetatively propagated crop, a lack of knowledge in selecting high-yield varieties and other mistakes, committed in the past, must have contributed to poorresults. The major constraints to ginger production and export increase are as follows:
Small land holdings. Because of the terrain, the size of land holdings is very smalland farmers are producing many crop varieties on the same piece of land. Therefore,commercialization of crop/variety on a large scale is very difficult unless the Governmentsupports the system of contract/ lease farming;
Table 20: The ginger sector value chain (Phidim, Panchthar), (in NRs. /kg)
Farmers/ Local Traders/ Wholesaler/ Indian CommissionGrowers Collectors Exporters agent
Items Cost Items Cost Items Cost Items Cost
Production Cost Assembling Load/unload 0.19 Commission 4.32Costs
Land rent 1.92 Bag – Short term 0.05storage
Seed 5.39 Grading/ – Transport 1.25Packaging
Labour 3.69 Collection/ 1.50 DDC tax 0.25Transportation
Fertilizer 2.73 Acquisition 25.0 Other local 0.34costs informal taxes
Total production 13.73 – – Customs 1.15cost clearance
Post production – – – Cleaning, 0.89cost grading,
packaging cost(India)
Post harvest 0.47 – – Acquisition cost 28.25transportation
Total Farm level 14.20 Total local trade 26.50 Total Wholesaler/ 32.37costs level cost Exporter cost
Losses – Losses – Losses (8%) 2.58
Margin 25.00 Margin 1.75 Margin 3.93
Farm gate price Assembler level 28.25 Wholesale level 38.88 Price at Indianprice price wholesale
market
Source: Full Bright Consultancy (2008).

142
STUDIES IN TRADE AND INVESTMENT 70
Unavailabilty of quality planting material and other inputs. Although NationalGinger Research Programme is mandated to conduct research on ginger, it hasrecommended so far only one variety of ginger, Kapurkot-1. Good quality, high-yieldingand disease resistant rhizomes are not available to farmers. In addition, inputs likemanure, pesticides and herbicides are rarely used;
Pest infestation. High rainfall and inappropriate storage facilities cause heavyinfestation with weeds, pests and diseases and lead to nutrient leaching;
Lack of funding. Although ginger is one of the major cash crops for rural farmers,farmers are not getting any financial support from the Government to purchase qualityseeds and other inputs. A scheme should be created to provide soft loans to farmers;
Problems in processing and marketing. Succesful ginger growing depends onadequate processing units, marketing and transport facilities. Presently, there are hardlyany cold storage facilities available and a few existing processing units are notfunctioning up to the desired capacity. All ginger producing pockets are not wellconnected to a transport network and the majority of farmers do not get access tocollection centres;
Lack of laboratory testing facilities. The major export market for the Nepaleseginger is India. Indian Quarantine Act requires ginger to be tested in the laboratoryand the quality ensured before importation. There is no such facility in Nepal or at leastnone that fulfills Indian requirements. In order to export ginger to India, exporters arerequired to send a sample to an Indian laboratory and get the laboratory report, whichtakes about three weeks. Moreover, a higher quality standard would be required toexport to developed countries.
5. SWOT Analysis
SWOT analysis is a simple framework for generating strategic alternatives froma situation analysis. It is a strategic planning method used to evaluate the strengths,weaknesses, opportunities and threats involved in a business venture. It involvesidentifying favourable and unfavourable internal and external factors helping to achievethe objectives of a business venture. The strengths and weakness related to thebusiness venture are internal factors whereas the opportunities and threats from theoutside environment are external factors. The results are often presented in the formof a matrix. This section presents the SWOT analysis for the coffee and ginger productsectors.
5.1. SWOT ANALYSIS OF THE COFFEE SECTOR
The favourable climate, the rate of growth in coffee production and export theinterest and passion on the part of the Nepalese coffee farmers and the identificationof coffee as a priority product for development — all point to its potential, emergingas an important enterprise. Therefore, it is necessary to identify and analyse thestrengths, weaknesses, challenges and opportunities of the coffee sector, so that thenecessary steps required for its development are taken out on time. The study hasidentified the following major strengths, weaknesses, opportunities and threats.

143
COUNTRY STUDIES ON BANGLADESH, NEPAL AND SRI LANKA
Strengths
● Availability of favourable climatic and other natural conditions for theproduction of high quality coffee, including specialty coffee, in mostdistricts of the mid-hills.
● Existence of a well-established institutional base, e.g., Federation ofNepalese Coffee Producers Association and Nepal Tea and CoffeeDevelopment Board and the willingness and the ability of all stakeholders,including the Government, the farmers, the private sector, the non-governmental organizations and the donor community to participate incoffee product promotion.
● Availability of numerous cheap workforce for coffee farming andproduction with the farming system being ‘organic’ by default.
● Availability of farmers and processors having basic understanding of coffeeproduction and the gradual emergence of professional pulpers, processorsand roasters.
● Emergence of the Nepalese coffee as a highland organic coffee brand inexport markets and the increased demand for such specialty coffee.
● Possibility of intercropping with other food crops.
● Coffee production as a potent instrument to alleviate poverty in rural areasby creating employment and generating income in marginalized groups.
Weaknesses
● Low export volume.
● Minimum research and development on the suitability of land, seeds andseedlings varieties, farming techniques and processing and roastingtechnologies.
● Lack of skilled manpower.
● Lack of awareness among farmers of the importance of quality resultingin quality variation.
● Lack of supply of quality inputs, such as seeds and seedlings, nutrients,organic fertilizers, insecticides and pesticides.
● Lack of coffee product standardization, quality laboratories, certificationagencies and market regulation.
● Inadequate government support in land acquisition, farming, processing,and marketing.
● Insufficient information on production, processing, marketing, anddomestic market.
● Discontinuity of the initiatives on coffee development by internationalnon-governmental organizations and development partners.
● Insufficient coordination among government agencies and private sectorplayers.

144
STUDIES IN TRADE AND INVESTMENT 70
Opportunities
● High-income elasticity and the growing demand in domestic andinternational markets, although at a slow rate.
● Ample opportunities for entering into new niche markets in the UnitedStates of America, the European Union and the Gulf countries with specialtyand highland organic coffee.
● Favourable climatic conditions and a high potential for growing specialtyand highland organic coffee for the international market.
● Increasing demand and price for specialty and organic coffee.
● Growing interest and activity of producers’ associations both at the districtand national levels and farmers/private sector in coffee production.
Threats
● Increasing migration of the workforce overseas and to urban areas mayresult in a decrease of labour force for coffee farming and an increase inthe wage rate.
● Income elasticity of the coffee sector is positive and greater than one and,thus, any volatility in global economic situation impacts the demand forcoffee.
● Unilateral trade liberalization and tariff reduction under the World TradeOrganization may erode the margin of preference that the Nepalese coffeehas been enjoying in export markets.
● Most coffee exporting countries are promoting coffee with the help ofstrong government intervention and support; hence, lack of resourcesto provide support to the coffee sector may adversely affect thecompetitiveness of the Nepalese coffee.
● Nepal specializes in the production of Arabica variety so the increasedproduction and aggressive marketing of Robusta at the global level mayaffect the demand for Arabica coffee.
● Increasing quality consciousness of the consumer in the export marketsmay pressure governments concerned into adopting unilaterally higherlevel of sanitary and phyto-sanitary standards.
● High variations and unpredictability in quality may be detrimental toacquiring brand status in the international market.
5.2. SWOT ANALYSIS OF THE GINGER SECTOR
Ginger is one of the main cash crops supporting the livelihood and improvingthe economic level of many rural households in Nepal. Its development wouldcontribute in creating employment and raising income and standard of living of ruraldwellers. The following section deals with the strength, weaknesses, opportunities andthreats of the ginger sector in Nepal.

145
COUNTRY STUDIES ON BANGLADESH, NEPAL AND SRI LANKA
Strengths
● The climatic and soil conditions for the production of ginger exist in manydistricts in Nepal and the supply capacity could be enhanced with theappropriate interventions.
● Traditional spices in South Asia include ginger as a major component and,therefore, demand in the domestic and export market is stable. In addition,the medicinal value of ginger has also helped increase the demand.
● It could be traded in raw or semi-raw form without any sophisticatedprocessing.
● Farmers are aware of the production system, and are organized throughcooperatives and district-level associations.
● Most of the ginger producing pockets, e.g., Palpa in the west and Ilam inthe east of Nepal are well connected to the transportation system andmarket network, including domestic retail and wholesale markets as wellas northern Indian markets.
Weaknesses
● Most of ginger produced in Nepal have high fibre content and is consideredinferior in quality compared to ginger produced in South India, but farmersare not aware of the importance of quality.
● The prices farmers receive from collectors are highly volatile and this is adisincentive for ginger farming.
● Farmers are not well organized and transport their produce to thecollection centres on their own, paying high transportation costs.
● Shortage of the minimum essential services required for the farmers,including the inputs such as: seeds and fertilizer, irrigation facilities,marketing services, credit, and market/price information.
● Farmers use traditional farming methods and do not possess the adequateknowledge of and techniques in production, grading, packaging, and post-harvest handling.
● Prevalence of rhizome rot disease causes significant losses during bothgrowing and storing stages.
● Farmers use traditional method of drying (Suntho making) ginger, whichmakes it unacceptable for industrial use.
● Farmers and other entrepreneurs are unaware of ginger processingtechnology and value added secondary ginger products.
Opportunities
● High and increasing demand in northern cities of India for the Nepaleseginger.
● Government has identified ginger as one of priority products fordevelopment and committed to provide facilities/services to farmers/traders.
146
STUDIES IN TRADE AND INVESTMENT 70
● A rate of return in ginger production is higher compared to the rate ofreturn in the production of cereal products.
● Market access condition in export market is favourable for Nepal as itenjoys high tariff preferences in the Indian market.
● Private sector institutions, e.g., Agro Enterprise Centre, provide market/priceinformation to farmers/traders; there is also a well established coordinationmechanism with government agencies, e.g., Agro-business and MarketingDevelopment Directorate.
Threats
● China has been aggressively entering into the ginger market and there isa risk of displacement of Nepalese ginger from the Indian market by anover-supply of better quality cool season products from Tibet of China.
● In order to diversify the product by moving upwards in the value chain,the product has to meet sanitary and phyto-sanitary standards as well asother quality standards.
● Insufficient and interrupted supply of electric power used for gingerprocessing.
6. Future Thrust and Business Plans
6.1. THE COFFEE SECTOR: FUTURE THRUST
Interventions in the followings areas of production, processing and marketingwould go a long way in the promotion and development of coffee product in Nepal,which might eventually reduce costs and improve quality and efficiency.
Survey, analysis and farming model: There is a need for a survey and analysis oflands suitable for coffee growing and the development of area-specific farming systemmodel under a cluster approach.
Introduction, evaluation and improvement: There is a need for research on thevarieties of coffee, their productivity, susceptibility to diseases, cup quality suitable forNepalese climatic situation and soil conditions. Similarly, commercialized nurseries withproper monitoring of the quality of seedlings need to be widely established.
Awareness and skill development: Only producers in the organized sector areaware of the importance of the quality of coffee while small farmers give leastimportance to the quality matters. Therefore, there is a need for creating awareness inthe quality of coffee and training all actors involved in the value chain – farmers, pulpers,and processors – on how to improve, maintain, and preserve the quality of coffee. Also,there is a need for imparting knowledge to the farmers on the farming of coffee.Introduction of a course on coffee in Agricultural Colleges would help to create thetrained workforce for the coffee sector.
Certification of coffee products: The Nepalese coffee is by default organic butdue to the absence of a certifying agency, the bulk of coffee is exported as conventional

147
COUNTRY STUDIES ON BANGLADESH, NEPAL AND SRI LANKA
coffee. The future action should be focused on establishing legal and institutionalframeworks for certification and labelling of coffee. There should be a regularmonitoring of coffee quality marketed in domestic and/or export markets. Similarly,supply of organic fertilizers, pesticides and insecticides should also be ensured and cuptesting laboratories should be widely established. In this regard, support to the farmersin establishing internal control system (ICS) is crucial.
Processing and storage system: Participants in the focus group discussion arguedthat coffee processing system adopted in Nepal was brought in from El Salvador morethan a decade ago and there has been no improvement in the system since then.Research is needed for improving coffee processing system, in particular introducingnew pulping and solar drying methods. Intervention is also required for better storageof coffee so that fungal infection and mould could be reduced.
Reducing transport and transaction costs: The distance between a farm anda processing unit is high in most of the rural areas and, due to a lack of road connections,coffee is transported through portage. In this context, harmonization of the rural roadtransport programme with coffee production sites would go a long way to lowertransportation costs. Traders are required to pay District Development Committee taxeseven for bringing cherry for processing. In addition, they have to pay taxes to non-stateactors as well. An empty ventilated container has to be brought to Kathmandu fromKolkata by exporters and sent back to Kolkata with coffee beans. A proper warehousingfacility is also needed in the airport for air transport.
Institutional development: There is a need for coordination between and amonggovernment agencies such as Ministry of Agriculture and Cooperatives, NationalPlanning Commission, National Tea and Coffee Development Board, District AgricultureDevelopment Office, Federation of Nepalese Chambers of Commerce and Industry,Federation of Nepalese Cottage and Small Industries, Federation of Nepalese CoffeeProducers Association and district-level chambers. There is also a need for theestablishment of a resource centre and institutional support for coffee producers. Thetechnical support for this may be sought from development partners including ESCAPand FAO.
6.2. THE COFFEE SECTOR: BUSINESS PLAN
Table 21: The coffee sector: business plan
Objectives Actions Recommended Responsible Institutions
Increasingproduction of highquality coffee to3,000 MT in10 years’ period
Establishing high level CoffeeDevelopment Committee underthe Chairmanship of Member,National Planning Commission tocoordinate and monitoring theactivities listed below.
Establishing and strengthening ofCoffee Resource Centre foridentification of suitable land,
National Planning Commission
Ministry of Agriculture andCooperatives

148
STUDIES IN TRADE AND INVESTMENT 70
Table 21: (continued)
Objectives Actions Recommended Responsible Institutions
varieties, farming system, collectingand disseminating of coffee-relatedinformation
Establishing commercial nurseriesin major coffee producing pocketsand providing high yielding anddisease resistant varieties
Ministry of Agriculture, NationalAgriculture Research Centre,National Tea and Coffee Board,National Coffee Producer’sAssociation, Coffee ResourceCentre
Ministry of Agriculture andCooperatives, National CoffeeProducers’ Association, Universities,Centre for Technical Education andVocational Training (CTEVT)
Department of Agriculture, DistrictAgriculture Development Office,National Tea and CoffeeDevelopment Board, NationalCoffee Producers’ Association,Federation of Nepalese Chamber ofCommerce and Supplies
Ministry of Agriculture andCooperatives, Federation ofNepalese Chamber of Commerceand Industries, Federation ofNepalese Cottage and SmallIndustries, National CoffeeProducers’ Association
Ministry of Agriculture andCooperatives, Ministry of Finance,Nepal Rastra Bank
Ministry of Agriculture, Federationof Nepalese Chamber of Commerceand Industries, Federation ofNepalese Cottage and SmallIndustries, National CoffeeProducers’ Association
Ministry of Agriculture andCooperatives, National CoffeeProducers’ Association
Ministry of Agriculture andCooperatives, District AgricultureDevelopment Offices, DistrictCoffee Producers’ Association
Developing technical expertise incoffee farming and up scalingextension services
Providing training to farmers,pulpers, and processors, includingorganizing study visits in coffeeproducing countries
Improving existing and introducingnew and appropriate pulping,drying storage, and roastingtechnology
Provisioning of cheap and easyaccess to finance
Creating awareness in specialtycoffee and organic farming andprovisioning of organic fertilizers,pesticides and insecticides
Strengthening of organiccertification system
Supporting farmer groups in theestablishment of Internal ControlSystem

149
COUNTRY STUDIES ON BANGLADESH, NEPAL AND SRI LANKA
Table 21: (continued)
Objectives Actions Recommended Responsible Institutions
Encouraging contract and leasefarming, including leasing ofgovernment land and communityforest
Supporting coffee producers in theestablishment of cup testinglaboratories
Ministry of Agriculture andCooperatives and other Ministries/Agencies
Ministry of Agriculture andCooperatives, District AgricultureDevelopment Offices, National Teaand Coffee Development Board,District Coffee Producer’sAssociations
National Planning Commission,Ministry of Physical Planning,Ministry of Agriculture andCooperatives
Ministry of Agriculture andCooperatives, National Tea andCoffee Board
Linking coffee producing pocketswith rural transport system andpromoting gravity rope way
Establishing Coffee DevelopmentBoard as an exclusive body forcoffee development and marketregulation
Enforcing ImplementingRegulation for Coffee Policy 2003and implementation of coffeedevelopment strategy
Exploring new export markets anddeveloping inventory of sanitaryand phyto-sanitary and otherstandards required in exportmarket
Rationalizing tariffs on the importof machinery and packagingmaterial
Reducing transaction costsincluding abolishing local taxes
Supporting private sector inacquiring appropriate containers
Support in acquiring logo andbrand name for Nepalese coffee
Council of Ministers, Ministry ofAgriculture and Cooperatives
Ministry of Commerce andSupplies, Trade and Exportpromotion Centre, Federation ofNepalese Chamber of Commerceand Industries
Ministry of Finance, Ministry ofAgriculture and Cooperatives
Increasing export tofour per cent oftotal export in 10years period anddiversifying exportmarkets
Ministry of Finance and Ministry oflocal Development
Ministry of Finance, Ministry ofAgriculture and Cooperatives
Department of Industry, Ministry ofAgriculture and Cooperatives,National Coffee Producers’Association
Ministry of Finance, Department ofCustoms
Department of Industry, Federationof Nepalese Chamber of Commerceand Industries
Improving warehouses at majorcustoms points
Promoting FDI

150
STUDIES IN TRADE AND INVESTMENT 70
6.3. THE GINGER SECTOR: FUTURE THRUST
Identified below are the areas where intensive intervention could increaseproduction and productivity in the ginger sector.
Survey, analysis and farming model: There is a need for survey and analysis oflands suitable for ginger growing and the development of area-specific farming systemmodel under a cluster approach.
Introduction, evaluation and improvement: Introduction of indigenous and exotichigh-yielding strains of ginger suitable for Nepalese climatic and soil conditions.Selective breeding should be done for high-yield, better quality varieties with resistanceto biotic and abiotic stresses.
System management research: There is a need to develop micro propagationand other propagation methods for rapid mass multiplication. Use of integrated pestmanagement (IPM) and integrated nutrient management system is required.
Post-harvest management: There is a need to develop quality control measures,adequate packing and storage techniques. Similarly, there is a need for moderntechnology for processing and preservation of value added products.
Establishment of a laboratory for product certification: In the global tradingsystem, non-tariff barriers, such as sanitary and phyto-sanitary, have become the majormarket access constraints after tariff reduction. Therefore, there is an urgent need forthe establishment of a well-equipped laboratory for certification of products. TheGovernment should also initiate the process for concluding Mutual RecognitionAgreements (MRAs) with major importing countries.
Skill development and technology transfer: There is a huge need forstrengthening the extension system for transfer of technologies and providing trainingto farmers.
Emphasis on organic farming: Ginger production in Nepal is organic by defaultas ginger farmers in the country use neither chemical fertilizers nor chemical pesticides.They only use locally available farmyard manures (cow dung, pig manure, poultrymanures, etc.). Considering the increased demand for organic produce in the world,farmers could hope to get better returns for their produce. But first and foremost, theyneed to have proper organic certification for their products.
Diversification of products: Nepal exports ginger mostly in raw or semi-raw formwithout any significant value added. In order to increase export proceeds from gingerproducts, Nepal should focus on both the value added and diversification of productsin its production structure.

151
COUNTRY STUDIES ON BANGLADESH, NEPAL AND SRI LANKA
6.4. THE GINGER SECTOR: BUSINESS PLAN
Table 22: The ginger sector: business plan
Objectives Actions Recommended Responsible Institutions
Creating 200,000full timeemploymentopportunities inrural areas in 10years
Establishing high level GingerDevelopment Committee underthe Chairmanship of Member,National Planning Commission tocoordinate and monitoring theactivities listed below.
Establishing and strengthening ofGinger Resource Centre for theidentification of suitable land,varieties and farming system.
Introducing new exotic highyielding varieties of ginger.
National Planning Commission.
Ministry of Agriculture andCooperatives.
Ministry of Agriculture, NationalAgriculture Research Centre, GingerResource Centre.
Ministry of Agriculture andCooperatives, Centre for TechnicalEducation and Vocational Training(CTEVT).
Department of Agriculture, DistrictAgriculture Development Office,District Ginger Producers’Association and District Chambers.
Ministry of Agriculture andCooperatives, Federation ofNepalese Chamber of Commerceand Industries, Federation ofNepalese Cottage and SmallIndustries, District GingerProducers’ Association,Cooperatives.
Ministry of Agriculture andCooperatives, Ministry of Finance,Nepal Rastra Bank.
Ministry of Agriculture, Federationof Nepalese Chamber of Commerceand Industries, Federation ofNepalese Cottage and SmallIndustries, District GingerProducers’ Association.
Ministry of Agriculture andCooperatives.
Developing technical manpowerand upscaling extension services.
Training farmers in the new ginger.farming system, including thesystem management.
Introducing new processingtechnology and supportingfarmers/cooperatives in theapplication of such technologies.
Providing cheap and easy access tofinance.
Creating awareness in organicfarming and providing organicfertilizers, pesticides andinsecticides.
Strengthening organic certificationsystem.

152
STUDIES IN TRADE AND INVESTMENT 70
Table 22: (continued)
Objectives Actions Recommended Responsible Institutions
Supporting farmer’s cooperativesand agriculture product tradingcentre(s).
Department of Agriculture, DistrictAgriculture Development Office,District Ginger Producers’Association.
Agro Enterprise Centre,Department of Agriculture.
Strengthening ginger marketinformation system andestablishing ginger tradingcentre(s).
Encouraging contract and leasefarming.
Ministry of Agriculture andCooperatives and relevantgovernment Ministries/Departments.
Ministry of Agriculture andCooperatives, Ministry ofCommerce and Supplies, Trade andExport promotion Centre,Federation of Nepalese Chamber ofCommerce and Industries,Federation of Nepalese Cottageand Small Industries.
Ministry of Agriculture andCooperatives, Ministry of Financeand Ministry of Commerce andSupplies
Creating awareness in exportpotential of processed gingerproducts.
Increasing exportof ginger to five percent of total exportthrough increasedexports ofprocessed productsin 10 years.
Expanding and strengtheningquarantine laboratory services atcustoms points and initiatingprocess for mutual recognitionagreement with major importingcountries
Organizing study tour for potentialinvestors to ginger processingcentres.
Ministry of Agriculture andCooperatives, Federation ofNepalese Chamber of Commerceand Industries, Federation ofNepalese Cottage and SmallIndustries.
Ministry of Agriculture andCooperatives, Ministry of Industry,Ministry of Finance.
Trade and Export PromotionCentre, Department of Industry,Federation of Nepalese Chamber ofCommerce and Industries,Federation of Nepalese Cottageand Small Industries.
Providing support/ incentive inproduction of secondary products.
Establishing strategic alliance withginger traders of the South Asiaregion and promoting FDI in gingerprocessing.

153
COUNTRY STUDIES ON BANGLADESH, NEPAL AND SRI LANKA
Annex III
Country Study on Sri Lankausing Global Value Chain Analysis:
THE INDUSTRIAL RUBBER AND ELECTRONIC PRODUCTS SECTORS35
35 The authors acknowledge cooperation extended by the steering committee of Sri Lankaconsisting of officials from Ministry of Enterprise Development and Investment Promotion, Ministryof Industrial Development, Ministry of Plantation Industries, Federation of Chambers of Commerceand Industry of Sri Lanka, Small and Medium Enterprise Developers and Export Development Board.This study would not have been possible without the support of all sector level institutions includingRubber Research Institute of Sri Lanka, Sri Lanka Association of Manufacturers and Exporters ofRubber Products, Sri Lanka Electronic Manufacturers and Exporters Association, which provided thecore data essential for this study.

154
STUDIES IN TRADE AND INVESTMENT 70

155
COUNTRY STUDIES ON BANGLADESH, NEPAL AND SRI LANKA
Contents
Page
List of figures ............................................................................................................................. 156
List of tables ............................................................................................................................... 156
List of boxes ............................................................................................................................... 156
Preface .......................................................................................................................................... 157
The Industrial Rubber Products Sector in Sri Lanka .............................................. 157
1. An Overview of the Natural Rubber Sector in Sri Lanka .......................... 157
2. The Global Rubber Market and Sri Lanka’s Share ........................................ 158
3. Structure of the Rubber Sector Value Chains ................................................ 1633.1. Raw materials and suppliers .......................................................................... 1633.2. Natural rubber production process ............................................................. 1653.3. Marketing environment .................................................................................. 1673.4. Infrastructure and logistics system ............................................................. 168
4. Factors Affecting Comparative Advantage in RubberManufacturing .............................................................................................................. 1694.1. Rubber cultivation, production and costs ................................................ 1694.2. Human resources ............................................................................................... 1724.3. Policies and regulatory framework .............................................................. 172
5. SWOT Analysis .............................................................................................................. 173
6. Action Plan for the Development of the Rubber Industry inSri Lanka .......................................................................................................................... 178
The Electronic Products Sector in Sri Lanka ............................................................... 183
7. Overview of the Global Electronics Industry ................................................. 183
8. Advancement of Asia-Pacific Developing Countries in theElectronics Sector ........................................................................................................ 185
9. Potential for the Development of the Electronics Industry inSri Lanka .......................................................................................................................... 186
10. Access to Major Markets .......................................................................................... 189
11. Value Chains in the Electronics Industry in Sri Lanka ................................ 192
12. SWOT Analysis of the Electronics Industry in Sri Lanka ........................... 196
13. Action Plan for the Development of the Electronics Sector ValueChains in Sri Lanka ...................................................................................................... 198

156
STUDIES IN TRADE AND INVESTMENT 70
List of figures
1. Global natural rubber production in 2008 ........................................................... 1582. Rubber production in Sri Lanka from 1990 to 2008 .......................................... 1593. Global rubber consumption in 2008 ...................................................................... 1604. Competitive factor grid (based on industry expert opinion) ........................ 1605. Natural rubber production, consumption and exports in Sri Lanka ........... 1616. Rubber products export from Sri Lanka, 1999-2008 ......................................... 1627. Export income from value added rubber products .......................................... 1628. Global value chain of rubber products .................................................................. 1649. Natural rubber production cycle .............................................................................. 166
10. Growth of global consumption in natural rubber, 2005-2010(in per cent) ...................................................................................................................... 168
11. Value of input components in the rubber sector ............................................... 16912. Rubber cultivation in 2008 ......................................................................................... 17013. Rubber cultivation, yield and cost of production in Sri Lanka ...................... 17014. Global rubber cultivation, production and yield in 2008 ................................ 17115. Annual average remuneration by rubber product segments ....................... 17216. Comparative percentage price variations ............................................................ 17517. Natural rubber/synthetic rubber relative price ratio ........................................ 17618. Performance of the semiconductor sector, 2001-2010 (actual);
2011 and 2012 (forecast) ............................................................................................. 18519. Total value of inputs and outputs in the electronics sector in Sri Lanka ... 18820. Value chains for electronic components ............................................................... 19421. Value chains for electronic products ...................................................................... 195
List of tables
1. Global rubber production and consumption, 2004-2008(in thousands of MT) ..................................................................................................... 159
2. Competitive factor matrix (based on industry expert opinion) .................... 1603. Types of rubbers ............................................................................................................. 1654. Action plan matrix for the rubber sector in Sri Lanka ...................................... 1795. Apple iPhone 3G’s major components and cost drivers .................................. 1846. Productivity levels across the three sectors in Sri Lanka ................................. 1887. Trade between India and Sri Lanka, 2000-2007 (in millions of dollars) ...... 1908. Action plan matrix for the electronics sector in Sri Lanka .............................. 2009. Sub-activities for the action plan ............................................................................. 202
List of boxes
1. Experience of Malaysia and Taiwan Province of China in thedevelopment of the electronics industry ............................................................. 187
2. An example of the electronics sector FDI in Sri Lanka ..................................... 199
Contents (continued)Page

157
COUNTRY STUDIES ON BANGLADESH, NEPAL AND SRI LANKA
Preface
Rubber and electronic products are two important export-oriented products ofSri Lanka. Rubber, mainly natural rubber industry in Sri Lanka, is based on the
geographical advantage of the country, with its extensive experience in growing rubbertrees, and on foreign investment in advanced technologies in processing andmanufacturing of rubber products. Sri Lanka is now exporting different types ofmanufactured finished rubber products. In view of the increasing global demand fornatural rubber and rubber products and the emerging competitiveness in the rubberindustry, Sri Lanka is enacting various measures to increase and improve rubbercultivation and collection and to enhance the quality of manufactured products.
Electronic products manufacturing relies on the availability of a skilled labourforce and the country’s central transit location particularly for maritime logistics, whichcould facilitate efficient transportation of electronic components for different endproducts, manufactured in other countries. Furthermore, with considerable experiencein producing and exporting electronic components for the local joint ventures and fullyforeign-owned branded electronic products companies, Sri Lanka is now exploring theprospects of developing its own branded products.
The study was conducted with the purpose of enhancing the value added inboth the rubber and electronic products sectors’ SMEs so that the benefits from suchvalue added could be widely distributed. Action plans, detailing national strategies, aswell as some critical regional programmes have been prepared to facilitate cooperationamong countries and enterprises for the products under consideration. The findingsof the initial studies were presented at a national workshop, held in Colombo, and theproposed strategies and recommendations for strengthening the value added in therubber and electronic products sectors were deliberated. Action plans were presentedand further discussed at the subregional workshop also held in Colombo withrepresentatives from participating countries, bilateral and multilateral agencies, involvedin promoting subregional cooperation, and other stakeholders.
The Industrial Rubber Products Sector in Sri Lanka
1. AN OVERVIEW OF THE NATURAL RUBBER SECTOR IN SRI LANKA
The rubber industry in Sri Lanka dates back to 1876 with the first planting ofrubber trees in Henerathgoda Gardens in Gampaha. Rubber cultivation focuses ongrowing rubber trees and producing raw rubber from field latex, while rubbermanufacturing converts the raw rubber into value added products. In 2008 the naturalrubber sector contributed $664 million to the economy (EDB 2009) and createdemployment for approximately 200,000 people, mainly in the rural areas (ASI 2009).Rubber plantations in 2008 extended over 122,000 hectares, accounting for seven percent of the total cultivated land area of Sri Lanka (Central Bank 2008).

158
STUDIES IN TRADE AND INVESTMENT 70
The manufacturing of rubber products began in the 1950s primarily with rubberre-treading and expanded rapidly after the introduction of open trade policies anddevelopment of industry zones in the late 1970s. A tremendous growth of the rubbersector has allowed Sri Lankan rubber manufacturers to compete in regional and globalmarkets at both industrial and consumer levels, offering value added natural rubberproducts such as solid tires, surgical gloves, automotive parts, mats and hoses. Currently,the Government of Sri Lanka and private entrepreneurs are considering the possibilitiesof product diversification and the improvement of domestic and internationalcompetition.
2. THE GLOBAL RUBBER MARKET AND SRI LANKA’S SHARE
The global demand for rubber is satisfied by the supply of both natural andsynthetic rubber each catering to different consumer needs. Global natural rubberproduction in 2008 amounted to 9.88 million MT, of which 93.2 per cent came from Asiaand the Pacific (figure 1). The remaining 4.4 per cent and 2.4 per cent were producedby Africa and Latin America, respectively. The global supply of synthetic rubber mainlycomes from Asia and the Pacific, the United States of America and the European Union.A contribution of Asia and the Pacific in the global synthetic rubber production in 2008was 48.8 per cent, of which 17.3 per cent and 12.3 per cent were from China and Japan,respectively. On a macrolevel, the global natural rubber production has graduallyincreased from 2004 to 2008 while synthetic rubber production experienced a dip in2008 (table 1) due to economic recession in North America and Europe. Increasedpetroleum prices also led to the decrease in production of synthetic rubber during thistime. While there was a further overall decline in production and consumption in 2009,estimates for 2010 indicated an upward trend.
Figure 1: Globa l natura l rubber production in 2008
Source: IRSG (2009).
Africa4.4%
Latin America2.4%
Thailand30.6%
Indonesia27.3%
Malaysia10.6%
India8.7%
Viet Nam6.6%
China5.6%
Sri Lanka1.3%
Other Asia2.5%

159
COUNTRY STUDIES ON BANGLADESH, NEPAL AND SRI LANKA
Sri Lanka ranks as the eighth largest natural rubber producing country in theworld with a production of 129,243 MT in 2008, which represents just a tiny share ofaround 1.3 per cent of the global natural rubber production and 0.6 per cent of theglobal total rubber production (see figure 1). The natural rubber production in Sri Lankadeclined significantly and rapidly during the Asian financial crisis in 1997-1998 due tolow prices for natural rubber in the world market, but rebounded strongly during thenext decade, as shown in figure 2.
Table 1: Globa l rubber production and consumption, 2004-2010* (in thousandsof MT)
2004 2005 2006 2007 2008 2009 2010*
Natural rubber production 8 758 8 906 9 698 9 687 9 877 9 662 10 291Natural rubber consumption 8 701 9 184 9 709 10 230 10 088 9 390 10 671Synthetic rubber production 11 999 12 136 12 690 13 434 12 813 12 087 14 002Synthetic rubber consumption 11 880 11 921 12 692 13 284 12 586 11 754 13 858Per cent of natural rubber in 42.3 43.5 43.3 43.5 44.5 44.4 43.9total rubber consumption
Source: IRSG (2009 and 2011).
Figure 2: Rubber production in Sri Lanka from 1990 to 2008
140
130
120
110
100
90
80
Pro
du
ctio
n ’0
00 M
T
1990
1991
1992
1993
1994
1995
1996
1997
1998
1999
2000
2001
2002
2003
2004
2005
2006
2007
2008
The production of natural rubber in Sri Lanka increased by 36 per cent between2004 and 2008 (figure 2) and is expected to increase even further as rubber plantationprojects have been implemented both by the private or small holding and the largerstate estate (20 acres or more of agricultural land) sectors. Of the total natural rubberproduction in Sri Lanka in 2008, 62 per cent was used for domestic productmanufacturing and the remaining was exported as raw rubber.
Of the global rubber consumption in 2008, China consumed 28.4 per cent whilethe United States of America, the European Union, Japan and India consumed 12.3, 15.8,8.9 and 5.2 per cent, respectively (figure 3). Sri Lanka consumed 0.5 per cent of globalrubber products, of which 0.8 per cent was natural rubber consumption and 0.2 percent synthetic rubber consumption (IRSG 2009).

160
STUDIES IN TRADE AND INVESTMENT 70
With respect to natural rubber production, Sri Lanka has to compete with itsregional neighbours India, Thailand and Indonesia. Except for the human resourcesfactor, these other countries have better competitive advantages as seen in thecompetitive factor analysis presented in table 2 and figure 4 and based on the industryexpert opinion.
Figure 3: Globa l rubber consumption in 2008
Source: IRSG (2009).
USA12.3%
Canada1.3%
Latin America6.5%
Africa1.0%
EU15.8%
Europe5.2%
Thailand2.6%
Indonesia2.5%
China28.4%
Japan8.9%
India5.2%
Malaysia2.6%
Sri Lanka0.5%
Other Asia7.3%
Ta ble 2: Competitive factor matrix (based on industry expert opinion)
India Thailand Indonesia Sri Lanka
Natural resources Strong Strong Strong AverageHuman resources Average Strong Strong StrongMacroeconomic conditions Strong Strong Strong AverageInfrastructure facilities Average Strong Strong AverageManufacturing facility Average Strong Strong Average
Figure 4: Competitive factor grid (based on industry expert opinion)
Naturalresources
Humanresources
Macroeconomicconditions
Infrastructurefacilities
Manufacturingfacility
India
Thailand
Indonesia
Sri Lanka
8
6
4
2
0

161
COUNTRY STUDIES ON BANGLADESH, NEPAL AND SRI LANKA
Market analysis
Sri Lanka produces different natural rubber products such as ribbed smokedsheet (RSS), latex crepe, sole crepe, scrap crepe, technically specified rubber andconcentrated latex. Sheet rubber, which is mainly produced by small enterprises,accounted for 43 per cent, while concentrated latex accounted for 28 per cent of thetotal production in 2008, becoming the second largest type of natural rubber productsin the country (RDD 2009). The production of latex crepe, which is mainly producedfor the export market by the estate sector, accounted for 16 per cent.
Sri Lankan raw natural rubbers and latex are exported mainly to Pakistan; theEuropean Union; India; Japan; the United States of America; Hong Kong, China; andsome other industrially developed countries (EDB 2009). Of those raw rubber exportsin 2008, 35 per cent was high-quality sheet rubber and 32 per cent latex crepe.Currently, 83 per cent of the sole crepe and 73 per cent of the latex crepe are mainlyexported to manufacturers to produce footwear, food and pharmaceutical products.Sri Lanka rubber clones produce pure white latex containing no significant dirt contentand suitable for clear transparent products. Therefore, there is a high demand forSri Lankan natural rubber that has resulted in a gradual increase in the export of rawrubber over time with a slight decline in 2008. Over the years, domestic consumptionof natural rubber has kept on rising, indicating that the fall in the 2008 export wascompensated by the increase in domestic consumption (see figure 5).
Figure 5: Natura l rubber production, consumption and exports in Sri Lanka
Sources: RDD (2009); MPI (2008).
140
120
100
80
60
40
20
0
Volu
me
’000
MT
Production
Exports
DomesticConsumption
2003 2004 2005 2006 2007 2008 2009
Rubber products have been a solid part of country’s economy since the 1980s.All leading solid tire manufacturers — major consumers of natural rubber — haveoperations in Sri Lanka. In the past two decades, Sri Lankan rubber productmanufacturers have entered into regional and global markets for the value addedproducts in both industrial and consumer segments. Although export of rubberproducts from Sri Lanka dropped during the Asian financial crisis of 1997-1998, it hasrecovered significantly during 2002-2003 due to the introduction of a new investmentincentive, growing steadily from $286 million in 2004 to $543 million in 2008 (figure 6).According to statistics, rubber product exports accounted for seven per cent of the total

162
STUDIES IN TRADE AND INVESTMENT 70
export earnings of Sri Lanka, representing 1.4 per cent of its gross domestic productionin 2007 (Central Bank 2008). A total number of 259 players are engaged in the exportof rubber products (EDB 2009).
The number of countries, where Sri Lankan rubber products are exported, hasgrown up to 130 in 2008 and include the major markets such as the United States ofAmerica, the European Union, India, Canada and Australia. The rubber products,exported to those countries, include tires, tubes, articles of unhardened rubber likegloves, apparel clothing accessories, industrial components, biomedical devices andfood packaging materials. It is clear that the export earnings of Sri Lanka from valueadded rubber products are rapidly growing compared to that of raw natural rubber(figure 7). Of the total earnings from the value added rubber products, more than50 per cent is from tires and tubes. The rest is largely distributed among apparelclothing accessories and unhardened rubber products.
Figure 6: Rubber products export from Sri Lanka, 1999-2008
Source: EDB (2009).
1998 2000 2002 2004 2006 2008 2010
350
300
250
200
150
100
50
0
600
500
400
300
200
100
0
No.
of M
arke
ts/E
xpo
rter
s
Exp
ort
val
ue,
US$
mill
ion
s
Markets
ExportersExport Value
Figure 7: Export income from va lue added rubber products
Sources: EDB 2009; RDD 2009.
600
500
400
300
200
100
0
Exp
ort
Inco
me
(US$
mill
iion
)
2003 2004 2005 2006 2007 2008 2009
Tyres and tubes
Total RubberProducts
Articles ofunhardenedrubber
Apparel clothingaccessories
Raw Rubber

163
COUNTRY STUDIES ON BANGLADESH, NEPAL AND SRI LANKA
3. STRUCTURE OF THE RUBBER SECTOR VALUE CHAINS
A global value chain for rubber products (both natural and synthetic) isillustrated in figure 8. The main input to the industry is the different types of rawmaterials: natural rubber, synthetic rubbers, natural and synthetic lattices, chemicalsand other additives. Different natural rubber products are available locally whilesynthetic rubbers, lattices and additives are all imported. Natural rubber originates fromrubber trees and field latex and coagulum are collected by planters. Field latex andcoagulum are converted into raw rubbers and concentrated latex by raw rubbermanufacturers and then used by compound manufacturers and/or by rubber productmanufacturers buying product from rubber traders. Some rubber productmanufacturers collect raw rubber from their own plantations and from other smallersubsidiaries. Rubber product manufacturers sell their products to local customersthrough agents/dealers. Most domestically manufactured high value added rubberproducts are exported to international markets through wholesalers and retailers.Several ministries, trade associations, research institutions and business associationsprovide their assistance and services to planters, traders and manufacturers in therubber industry to improve quality and quantity of the final rubber products.
3.1. Raw materials and suppliers
Different natural rubber products are produced in Sri Lanka of which 60 per centis produced by smallholders. Natural rubber is also imported to meet occasionalshortage on the domestic market. For example, 3,636 MT of natural rubber wasimported in 2008 (DOC 2009); however, this amount is insignificant compared to thedomestic natural rubber consumption of 80,600 MT.
Synthetic rubber is a distinct but integral part of rubber products sector, thoughit is not a complete substitute of natural rubber. Different types of synthetic rubbers,such as SBR, BR, NBR, EPDM, IR, IIR, HIIR and CR (see table 3), and synthetic lattices areimported for specific use in certain industries. 23,500 MT of synthetic rubbers andlattices (IRSG 2009) were imported in 2008, mainly from the United States of America,the Republic of Korea, Malaysia, the European Union, South Africa and some othercountries. Rubber chemicals, such as carbon black, silica, activators, accelerators andprocessing oil, are mostly imported from India. Small volumes of rubber chemicals arealso imported from Thailand, Malaysia and China. A total of 10,660 MT of chemicals(DOC 2009) was imported in 2008. On top of that, steel and nylon fabrics are alsoimported and used especially in the tire manufacturing industry.

164
STUDIES IN TRADE AND INVESTMENT 70
Figu
re 8
: G
loba
l va
lue
chai
n of
rubb
er p
rodu
cts
Fin
ish
edG
oo
ds
Plan
ter/
pla
nta
tio
n
Min
istr
y o
f In
du
stri
esSr
i Lan
ka E
xpo
rt D
evel
op
men
t B
oar
d (E
DB
)In
du
stri
al T
ech
no
log
y In
stit
ute
(ITI
)Sr
i Lan
ka A
sso
ciat
ion
of M
anu
fact
ure
rs
and
Exp
ort
ers
of R
ub
ber
Pro
du
cts
(SLA
MER
P)Th
e SM
E Ru
bb
er M
anu
fact
ure
rs
Ass
oci
atio
nD
ie a
nd
Mo
uld
Man
ufa
ctu
rin
g C
entr
e
Sri L
anka
Sta
nd
ard
s In
stit
ute
(SLS
I)Pl
asti
cs a
nd
Ru
bb
er In
stit
ute
(PRI
)In
du
stri
al D
evel
op
men
t B
oar
d
(IDB
) U
niv
ersi
ty R
esea
rch
Gro
up
s Sr
i Lan
ka N
ano
tech
no
log
y In
stit
ute
(SLI
NTE
C)
Min
istr
y o
f Pla
nta
tio
n
Ind
ust
ries
Rub
ber
Dev
elo
pm
ent
Dep
artm
ent
(RD
D)
The
Sri L
anka
So
ciet
y o
f Ru
bb
er In
du
stry
(SRI
)Ru
bb
er R
esea
rch
Inst
itu
te (R
RI)
Un
iver
sity
Res
earc
h G
rou
ps
Wel
lass
a Ru
bb
er C
om
pan
y
Trad
erR
aw R
ub
ber
M
anu
fact
ure
rC
om
po
un
dM
anu
fact
ure
r
Rub
ber
Pr
od
uct
s M
anu
fact
ure
r (t
ires
an
d
tub
es, d
ipp
ed
pro
du
cts,
foam
s, h
ou
seh
old
p
rod
uct
s, in
du
stri
al
pro
du
cts)
Ag
ent
Cu
sto
mer
Wh
ole
sale
r/A
gen
t
Pro
du
cts
Man
ufa
ctu
rer
Ch
emic
al/
Syn
thet
ic
Rub
ber
/ste
el
and
Nyl
on
fa
bri
c Su
pp
lier
Ag
ent
Mo
uld
Mak
er
Sup
plie
r/M
anu
fact
ure
rPa
ckag
ing
M
ater
ials
Wh
ole
sale
r/A
gen
tRe
taile
rC
ust
om
er
Glo
bal
Nat
ion
al
Plan
ters
Ass
oci
atio
n (P
A)
Glo
bal
Co
lom
bo
Ru
bb
er
Trad
ers
Ass
oci
atio
n
(CRT
A)

165
COUNTRY STUDIES ON BANGLADESH, NEPAL AND SRI LANKA
3.2. Natural rubber production process
Natural raw rubber production starts with the tapping of the field latex fromthe trunk of a rubber tree. The latex is first collected in small containers fitted on thebark of the rubber tree and then transferred into buckets and mixed with anticoagulants.The field latex and field coagulum (cup lump, tree lace and earth scrap) are deliveredto raw rubber manufacturers. Anticoagulated field latex is placed into a centrifuge toproduce concentrated latex that contributes to the rubber value chain at process specificlevel and is used in the manufacturing of foam rubber, dipped products, rubber threadsand caste rubber products. In the ribbed smoked sheet (RSS) and technically specifiedrubber (TSR) manufacturing units, the field latex is blended and coagulated first to formthe soft coagulum. The soft rubber mass is then milled in a two-roller mill with ribbedrollers and the resultant sheets are then dried in a smoke house. These dried sheetsare then packed into bales for transport. The soft rubber mass is also mashed and thendry heated to produce block rubber, which is also called TSR. Some grades of TSR areproduced from field coagulum. Crepe rubber is manufactured from fresh coagulum,field coagulum or cuttings of RSS. In the latex crepe manufacturing units latex istransferred into bulking tanks to separate white and yellow fractions. The two fractionsare taken out from the tanks separately and coagulated separately. The white coagulumis cut and then fed through mills to become mats and then laces. The laces are driedin drying chambers and are either sold as pale crepe or folded and compressed intoblankets called blanket crepe. The yellow coagulum is processed in the same way toproduce laces. In this case, the laces are then made into blankets, which in turn arepassed through a lamination process to form sole crepe. Field coagulum also undergoesthe same processes to produce low-grade rubbers. The production cycles of main rawrubbers are given in Figure 9.
Table 3: Types of rubbers
Rubber AbbreviationUsed mainly to
manufacture
Stirene Butadiene SBR TireButadiene rubber BR TireNitrile Rubber NBR GasketsEthylene propylene EPDMIsoprene rubber IR TireButyl rubber IIR TubesHalobutyl rubber HIIRChloroprene rubber CR

166
STUDIES IN TRADE AND INVESTMENT 70
Rubber product manufacturers and related entities
Manufacturers of rubber products can be classified into two categoriesaccording to the raw materials they use – rubber or latex-based manufacturers. Rubber-based manufacturers produce tires, tubes, belts, hoses, mats, floor coverings, slippers,gaskets, caster wheels, hot water bottles, jar rings, exercise components, automotivecomponents, etc., using natural rubber (RSS, crepe and TSR), synthetic rubbers andchemicals. Latex-based manufacturers produce dipped products including differenttypes of gloves (examination, surgical, household, cotton supported industrial andagricultural gloves), balloons, foam rubber mattresses and other articles of foams, rubberbands and threads, toys and masks, cot sheets, etc., using both natural and syntheticlattices. A total number of 529 rubber enterprises are currently engaged inmanufacturing rubber products; each of these manufacturing units employ from 10 to500 labourers (ASI 2009).
The Government of Sri Lanka has given a priority to improving globalcompetitiveness of the country’s rubber sector initiating the appropriate policy reformsand other support initiatives. In recent years, the development of this sector has beengiven a high priority, particularly in the areas of infrastructure development andimproving access to finance. A large number of agencies, including Ministry ofEnterprise Development and Investment Promotion (MEDIP), Ministry of IndustrialDevelopment (MID), Ministry of Trade and Commerce (MTC) and Ministry of PlantationIndustries (MPI) have launched activities aimed at developing and improving the rubbermanufacturing industry. However, they do not have product-centred strategies orspecific long-term development strategies targeted to the rubber industry.
Figure 9: Natural rubber production cycle
Source: The authors.
Rubber Tree
Field Latex Field Coagulum
Blending &Coagulation Creping
Concentrated Latex
RSS TSR Crepe
167
COUNTRY STUDIES ON BANGLADESH, NEPAL AND SRI LANKA
Rubber industry related government agencies and private sector organizationshave also played key roles in promoting the rubber industry by short-term measures.Rubber Development Department (RDD), Rubber Research Institute (RRI), PlantersAssociation of Ceylon (PA), Wellassa Rubber Company, Sri Lanka Society of RubberIndustry (SRI) and Colombo Rubber Traders’ Association (CRTA) have provided supportto the rubber plantation industry. Sri Lanka Association of Manufacturers and Exportersof Rubber Products (SLAMERP), SME Rubber Manufacturers Association, etc., areresponsible for the rubber products manufacturing industry. All these organizationsare engaged in certain activities individually but their lack of inter-relationship andcoordination has limited the overall growth of the rubber industry. The Sri Lanka ExportDevelopment Board offers a platform for product manufacturers to market theirproducts at international markets; however, such government sponsored exportpromotion activities are quite inadequate.
3.3. Marketing environment
The production and marketing of natural rubber is generally subjected to highlevel intrinsic barriers, which are normal for most commodity systems in developingcountries (Jaffee and Gordon 1992). The geographical distribution and involvement ofa large number of small-scale growers has resulted in the escalation of costs related tocollection of raw materials, transportation, agglomerating, sorting, grading, etc. thatoccur at different locations in the processing of rubber products. Despite a relativelygood system of transportation and relatively short distances, geographical dispersionof rubber plantations has adversely affected the farmers’ ability to receive better pricesfor their products.
Marketing of natural rubber is left in the hands of middle-level dealers,operating in the rubber growing areas of the country, and mostly takes place atColombo rubber auction. Traditionally, these marketing channels have been used forthe low-grade rubber. Sri Lanka has yet to fully utilize Thailand’s model of GroupMarketing Centres, where a group of smallholders form a joint venture, whichcollectively assists in weighing, grading and selling their product (Ali et al. 1997). Thesecentres collect unprocessed rubber from smallholders and decide on the bestprocessing mechanisms that provide better pricing and quality output. Apart fromcreating the necessary infrastructure for such centres, it is important to educate thestakeholders about the advantages of such system for achieving long-termsustainability. Additionally, it is necessary to establish quality standards for theunprocessed rubber that will be purchased through the system. It must also be notedthat Sri Lanka could receive better prices for its rubber if direct links, requiring theGovernment’s intervention, could also be established in global niche markets.
Most of Sri Lanka’s large rubber product manufacturing entities are eitherowned by international brands or established under joint venture partnerships betweenforeign and local investors. This has resulted in product marketing controlled by foreigninvestors. Many small players struggle, trying to find access to international marketsfor their products, because of the existing deficiencies in the overall marketing efforts.Sri Lanka’s rubber products marketing system lacks cohesion due to a variety of reasons,
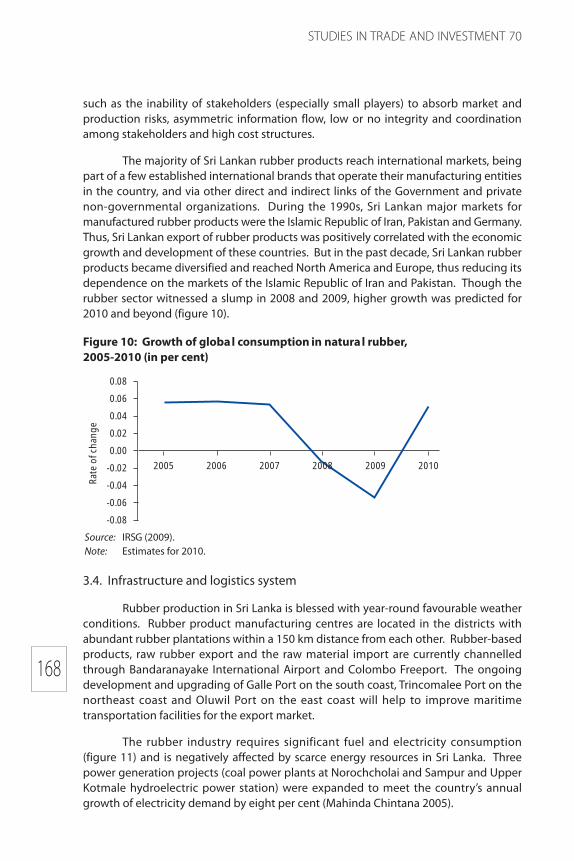
168
STUDIES IN TRADE AND INVESTMENT 70
such as the inability of stakeholders (especially small players) to absorb market andproduction risks, asymmetric information flow, low or no integrity and coordinationamong stakeholders and high cost structures.
The majority of Sri Lankan rubber products reach international markets, beingpart of a few established international brands that operate their manufacturing entitiesin the country, and via other direct and indirect links of the Government and privatenon-governmental organizations. During the 1990s, Sri Lankan major markets formanufactured rubber products were the Islamic Republic of Iran, Pakistan and Germany.Thus, Sri Lankan export of rubber products was positively correlated with the economicgrowth and development of these countries. But in the past decade, Sri Lankan rubberproducts became diversified and reached North America and Europe, thus reducing itsdependence on the markets of the Islamic Republic of Iran and Pakistan. Though therubber sector witnessed a slump in 2008 and 2009, higher growth was predicted for2010 and beyond (figure 10).
Figure 10: Growth of globa l consumption in natura l rubber,2005-2010 (in per cent)
Source: IRSG (2009).Note: Estimates for 2010.
0.08
0.06
0.04
0.02
0.00
-0.02
-0.04
-0.06
-0.08
Rat
e o
f ch
ang
e
2005 2006 2007 2009 20102008
3.4. Infrastructure and logistics system
Rubber production in Sri Lanka is blessed with year-round favourable weatherconditions. Rubber product manufacturing centres are located in the districts withabundant rubber plantations within a 150 km distance from each other. Rubber-basedproducts, raw rubber export and the raw material import are currently channelledthrough Bandaranayake International Airport and Colombo Freeport. The ongoingdevelopment and upgrading of Galle Port on the south coast, Trincomalee Port on thenortheast coast and Oluwil Port on the east coast will help to improve maritimetransportation facilities for the export market.
The rubber industry requires significant fuel and electricity consumption(figure 11) and is negatively affected by scarce energy resources in Sri Lanka. Threepower generation projects (coal power plants at Norochcholai and Sampur and UpperKotmale hydroelectric power station) were expanded to meet the country’s annualgrowth of electricity demand by eight per cent (Mahinda Chintana 2005).

169
COUNTRY STUDIES ON BANGLADESH, NEPAL AND SRI LANKA
4. FACTORS AFFECTING COMPARATIVE ADVANTAGE IN RUBBERMANUFACTURING
As stated earlier, Sri Lanka has a significant comparative advantage in the rubberindustry compared to other countries. However, to sustain its market share and improvecompetitiveness in international markets, Sri Lanka needs to analyze several criticalfactors, affecting such advantage, some of which are presented in the following sections.
4.1. Rubber cultivation, production and costs
Rubber plantations stretch over 13 districts in Sri Lanka the largest of those, withover 20,000 hectares, are in Kegalle, Kalutara and Rathnapura districts, followed byplantations of 7,000-20,000 hectares in Colombo and Galle districts and plantations of1,000-7,000 hectares in Gampaha, Matara, Kurunegala, Kandy and Monaragala districts(figure 12). Matale, Badulla and Hambantota districts have smaller plantation areas of70-1,000 hectares. Of the total plantation areas, nearly 42 per cent is owned by thepublic/estate sector while the remaining 58 per cent is owned by the private/smallholder sector. The major cultivating districts offer the best conditions, in terms ofsoil and weather, for successful rubber cultivation. Since the early 2000s, a positive trendin yield increase has emerged after the stakeholders started to put serious effort inincreasing the rubber production and productivity.
Rubber replanting and new-planting has gradually increased with theimplementation of the Monaragala Rubber Development Programme (MRDP) in 2005by Sri Lanka Society of Rubber Industry (SRI). MRDP aims at replanting of around 40,000hectares by 2016, resulting in an additional annual production of 60,000 MT of rubber(SLRC and USAID 2002).
Rubber plantation areas, yield and cost of production are shown in figure 13.Unlike in Indonesia and Thailand, where considerable areas of land were reserved for
Figure 11: Value of input components in the rubber sector
Source: ASI (2009).
Tyres &tubes, andrebuilding
of tyres
Gloves Productsfrom
naturalrubber
Article ofrubber
products
Otherrubber
products
Imported
Local
FuelWater
ElectricityServices byotehrs
120%90%60%30%
0%
120%
90%60%
30%
0%
% C
ost
of R
awM
ater
ials
% C
ost
of O
ther
Inp
uts

170
STUDIES IN TRADE AND INVESTMENT 70
expansion of rubber plantations in future years, Sri Lanka, over the past decade,experienced a decrease in the areas under rubber cultivation, as these land areas werediverted to other uses, partially due to urbanization of the country. The rubbercultivation in Sri Lanka is mainly centred in the western part of the country, whereassabaragamuwa and the southern provinces have undergone urbanization during thepast two decades. The land values during the past two decades have demonstrateda growing trend, being used for residential and commercial rather than rubbercultivation purposes, and provided the owners with higher financial benefits.
Figure 12: Rubber cultivation in 2008
Source: RDD (2009).
>20,00020,000 - 7,0007,000 - 1,0001,000 - 70
Figure 13: Rubber cultivation, yield and cost of production in Sri Lanka
Sources: MPI (2008); RDD (2009); Central Bank (2008).
1 600
1 400
1 200
1 000
800
600
400
200
0
Yeild
kg
/ha,
are
a h
a, p
rod
uct
ion
‘000
MT
140
120
100
80
60
40
20
0
Co
st o
f pro
du
ctio
n, L
KR/
kg
1998 2000 2002 2004 2006 2008 2010
Production
Yeild
Area
Cost ofproduction

171
COUNTRY STUDIES ON BANGLADESH, NEPAL AND SRI LANKA
2 000
1 600
1 200
800
400
0
Yiel
d, k
g/h
a
Sri L
anka
Thai
lan
k
Vie
t N
am
Mal
aysi
a
Ind
on
esia
Ind
ia
Bra
zil
4 000
3 500
3 000
2 500
2 000
1 500
1 000
500
0
‘000
hec
tare
s/‘0
00 M
T
Ind
on
esia
Thai
lan
d
Mal
aysi
a
Ch
ina*
Ind
ia
Vie
t N
am
Mya
nm
ar*
Nig
eria
Bra
zil
Sri L
anka
Cam
bo
dia
Lib
eria
**
Cô
te d
’lvo
ire*
Land
Production
Cô
te d
’lvo
ire
Sri Lanka recorded an average yield of 1,353 kg/hectare per year in 2008, wellbelow the yield shown by other Asia-Pacific countries, such as India, Malaysia, Thailandand Viet Nam (figure 14). The yield targets under MRDP are above 2,000 kg/hectare(USAID 2008), nearly a 50 per cent increase from the current productivity levels.
Figure 14: Globa l rubber cultivation, production and yield in 2008
Sources: IRSG (2009), values reported in 2008, 2006*, 1999**.
A major feature in the rubber sector is the number of tapping days. A tapperin Sri Lanka can only tap an average of 260 days per year, whereas in other countriesthe tapping exceeds 300 days a year (Ali et al. 1997), the difference being the numberof days lost to rain. A major share of rubber cultivation in Sri Lanka is located in a wetzone, which cause volatility in rubber prices compared to rubber prices in Singapore.36
The proper use of rain guards can increase the tapping days to over 300 days.
Wages is another important component in the overall cost structure of rubberproduction. Figure 15 shows the average remuneration per employee during the year2008. Though rubber glove manufacturing has recorded a high value added, theaverage remuneration remains low due to the labour intensive process involving lowskilled workers. Large-scale manufacturers invest in advanced production facilities andemploy a relatively small number of people with better remuneration packages. Thelabour intensive processes, such as quality inspection and packaging, are generallyoutsourced and the outsourced workforce tends to receive minimal remuneration.
36 Generally, rubber prices are compared to Singapore Commodity Exchange prices. In his speech,the Senior Minister of State for Trade and Industry, Singapore at the World Rubber Summit in 2009estimated that Singapore handled more than 50 per cent of the world’s annual natural rubber tradeand that Singapore has also been recognized as the global pricing centre for the physical trade ofrubber, with more than 80 per cent of global rubber trade priced at the Singapore CommodityExchange (SICOM) prices. Being neither a producer nor a major consumer of natural rubber,Singapore serves as a neutral trading hub that generates financing, procurement and riskmanagement activities. Today the world prices for rubber are not only driven by demand but arealso subject to speculations on the futures markets. Japan and Singapore are two major futuresmarkets for rubber.

172
STUDIES IN TRADE AND INVESTMENT 70
4.2. Human resources
Sri Lanka has low cost semiskilled and disciplined labour force, engaged atdifferent levels of the supply chain, including 23,813 skilled and 9,383 unskilled workersin rubber product manufacturing industry (ASI 2009). Employment of labour in therubber industry is directly supervised by the Government that sets minimum daily wagerates, minimum work hours and other rules.
Over the years government and non-governmental rubber related organizationshave been actively engaged in providing education and training programmes to furtherimprove the competitiveness of the rubber sector labour force. Furthermore,government and non-governmental research bodies, employee federations and unions,farmer associations, owner associations, civil society organizations and many otherstatutory and non-statutory institutions have played pivotal roles in uplifting the rubberindustry by providing short-term and long-term planning for labour force development.Some institutions like Plastic and Rubber Institute of Sri Lanka (PRISL) provide trainingfacilities to workforce engaged in the rubber industry with a financial support frominternational development agencies (e.g., ADB and USAID). All these efforts improvedthe efficiency and further augmented the capabilities of Sri Lankan skilled workforce,ensuring its competitiveness in the coming decades.
4.3. Policies and regulatory framework
There are no export restrictions and no licensing requirements for rubberdealers and exporters; however, the Government imposes duty on the import ofsynthetic rubber and related input materials. At present synthetic rubber imports are
Figure 15: Annua l average remuneration by rubber product segments
Source: ASI (2009).
250
200
150
100
50
0
Ave
rag
e re
mu
ner
atio
n ‘0
00
Tyre
s an
d t
ub
es
Glo
ves
Nat
ura
l ru
bb
erp
rod
uct
s
Art
icle
of r
ub
ber
pro
du
cts
Oth
er ru
bb
erp
rod
uct

173
COUNTRY STUDIES ON BANGLADESH, NEPAL AND SRI LANKA
subjected to a CESS37 of SL Rs 15 per kg, which has led to higher prices for final products.The Government also charges SL Rs 4 per kg as CESS on procurement of natural rubber(EDB 2007), and this has significantly impacted the cost of rubber products. The rubberproducts manufacturing sector could be further encouraged, if the CESS on domesticallyconsumed natural rubber is reduced while the CESS on raw rubber exports is increased,– thus favouring domestic rubber demand without affecting the Government revenue.The changes in CESS policy should aim at natural rubber to become more competitivelocally and to increase export of higher value added rubber products. Although thetotal CESS collection is said to be available for the development of the rubber industryand the long-term production of raw rubber, both the rubber cultivation and rubbermanufacturing sectors complain that the CESS is not utilized for that purpose. However,at present the Government uses the CESS to finance replanting of rubber trees andprovide certain social benefits to smallholders.
The Government also plays a pivotal role in rubber research and development,and by extension, rubber cultivation. However, the industry lacks expertise on productand compound developments, introducing only limited innovations. There is currentlyno centralized rubber- and/or polymer-based product testing facilities, especially theones focused on quality improvements in Sri Lanka. Although polymer-based andcompound material testing facilities exist at several research and academic institutions,cost testing procedures in these institutions do not have official accreditation and theircertification is not internationally recognized to testify the quality of Sri Lankan rubberproducts – an important requirement in the export market. Finally, all rubber productmanufacturers must obtain Environmental Protection License (EPL) from the CentralEnvironmental Authority (CEA), affirming their continuous compliance with minimizingnoise and dust levels to protect the environment.
5. SWOT ANALYSIS
The value chain dynamics in the rubber industry, as discussed above, can bestrengthened by continuous improvements and innovations in production anddistribution processes. To understand the factors, affecting the rubber industry in SriLanka with regards to global value chains, it is essential to: (a) take advantage of theopportunities; (b) mobilize the strengths; (c) manage the possible threats; and(d) assuage the weaknesses, in order to formulate a long-term strategy and strengthenSri Lankan position in the global rubber market.
Strengths
1. The rubber industry is a relatively well-established industry in Sri Lankahaving a comprehensive legal and institutional framework, goodinfrastructures, a strong private sector and well-organized professionalbodies such as SLAMERP and PRISL. The Government has pledged to
37 CESS is a local levy on a commodity/product for special purpose. Objectives of imposing CESSon rubber export/import are to generate funds for developing rubber cultivation in Sri Lanka andto encourage the export of value added rubber products. CESS is computed as a percentage of CIFvalue on imports and LKR 4 per (quantity) kg on exports as per the Gazette issued in 2004.

174
STUDIES IN TRADE AND INVESTMENT 70
support the rubber industry private sector with pro-business policies,infrastructure development and financial help.
2. Sri Lanka’s rubber industry has been successful in supplying foreign nichemarkets (through joint ventures with renowned multinational/world classcompanies) with industrial tires and surgical and household gloves byestablishing high quality/low cost manufacturing facilities.
3. Competitive though limited logistics support and infrastructure facilities(seaport and airport) are available in the country.
4. Sri Lanka is a natural rubber producing country and has an adequate supplyof different grades of centrifuged latex and dry rubber at competitiveprices. Also, there is an easy access to rubber product manufacturers withreadily available raw materials.
5. Sri Lankan crepe rubber is considered to be of the highest quality.
6. Relatively low labour cost compared to the region’s other major laboursupplying countries, except Indonesia.
7. Availability of skilled, trainable competitive labour force, at technical,managerial, and supervisory levels and qualified scientists, technologistsand engineers.
8. Academic programmes, enhancing the knowledge and skills related to therubber industry, are continuously provided by universities and privatetraining institutions.
Weaknesses
1. The return on investment in rubber cultivation and production is relativelylow due to the limited use of fertilizers, outdated technology, low levels ofmechanization, unskilled workforce, financial constraints and inadequateinvestment. An increase in labour costs combined with low productivityhas been a recent trend.
2. Sri Lankan rubber industry experiences high price volatility whencompared to Singapore and other regional markets rubber prices (figure16). The volatility is mainly due to the supply side constraints. For example,during the monsoon season, rubber supply drops sharply and createssignificant price hikes at the rubber auctions.
3. Sri Lanka has a small domestic market compared to other competingcountries such as India and China. Its rubber sector consists of only a fewlarge producers and a relatively large number of small producers/suppliers– resulting in a weak bargaining power as a rubber-producing nation.
4. During the rainy season, the frequency of rubber tapping which is donemanually, decreases and results in fluctuations in the supply of rubber.
5. Rubber production cost tends to be high due to the use of importedmaterials, including synthetic rubber and rubber additives.
6. There is no government or private formally established institution toprovide market information on domestic and international markets. The
175
COUNTRY STUDIES ON BANGLADESH, NEPAL AND SRI LANKA
0.2
0.1
0
-0.1
-0.2
-0.3
-0.4
-0.5
-0.6
Perc
enta
ge p
rice
chan
ge
Sicom
Colombo
Feb.
08
Mar
. 08
Apr
. 08
May
08
Jun
08
Jyl 0
8
Aug
. 08
Sep.
08
Oct
. 08
Nov
. 08
Dec
. 08
Jan.
09
Feb.
09
Mar
. 09
Apr
. 09
May
09
marketing done by the Government through their export promotionbodies such as Export Development Board (EDB) is still at a nascent stage.This unavailability of international marketing research has hinderedattempts to form linkages between local producers and internationalbuyers to advocate product portfolio diversification or withdrawal, whichresulted in failure to reach the expected export volume.
7. A lack of applied research institutions for technological development andinnovations hampers the industry’s ability to launch and promote newrubber products for niche markets. Also, there is no central product testingfacility to cater to the rubber industry. This is a major constraint for large-scale rubber exports from Sri Lanka.
8. Low investment and poor collaboration in research and developmentactivities, especially for product and process developments.
9. A lack of strategic integration and coordination between the existingresearch bodies and rubber product manufacturers.
10. Though Sri Lanka has established a formal polymer education, the industrystill lacks the know-how on compound development aspects. Mostresearch studies in Sri Lanka focuses on local optimizations and very fewstudies have been done on technology acquisition and/or developmentof advance technologies for the new product.
11. Sri Lanka lacks an internal system for quality control and product and/orprocess standardization; only a handful of large export-orientedmanufacturers have focused on quality improvement and standardization(e.g., six-sigma and ISO).
12. Policymaking does not completely address the root causes of issues facedby the rubber industry. Restrictions applied on imported high-quality rawrubber have discouraged key stakeholders from further investment in theindustry.
Figure 16: Comparative percentage price variations
Source: IRSG (2009).

176
STUDIES IN TRADE AND INVESTMENT 70
13. Sri Lanka records the highest energy cost compared to other rubber-producing nations as the rubber industry consumes a relatively highamount of energy compared to other industries. In particular, dry rubberproduction has higher energy content compared to latex production.
Opportunities
1. The global demand for natural rubber-based products has witnessedsubstantial growth over the years and is expected to grow further with theemerging markets in the region, such as China and India.
2. In Sri Lanka, continuous government support is provided to manufacturingby recognizing rubber industry as a “Thrust Industry.”
3. Existence of many regional, unilateral and bilateral trade agreements, suchas Indo-Sri Lanka Free Trade Agreement (ISFTA), South Asian PreferentialTariff Agreement (SAPTA), South Asian Free Trade Agreement (SAFTA) andSri Lanka-Pakistan FTA, provides opportunities to export Sri Lankan rubberproducts at zero duty, along with many other concessions.
4. During the past few years, a declining trend in natural rubber to StireneButadiene Rubber (SBR) price ratio has been observed, which is favourablefor natural rubber. Additionally, global demand for natural rubber showsa positive trend (figure 17).
Figure 17: Natural rubber/synthetic rubber relative price ratio
Source: IRSG (2009).
160
120
80
40
0
Pric
e p
erce
nta
ge
2007 2008 2009
Relative NR/SR price ratio
5. Existence of dedicated industrial parks, with well-designed centraltreatment facilities, would allow manufacturers to consolidate and controlprocessing costs effectively.
6. Projects for new planting (in non-traditional areas) and replanting of rubbertrees have been started by both the Government and private organizationswith the technical and financial support from international developmentagencies.

177
COUNTRY STUDIES ON BANGLADESH, NEPAL AND SRI LANKA
7. Introduction of rubber trees with high yield clones is expected to increasenatural rubber production levels.
8. Plantation companies can form joint ventures with foreign or local productmanufacturers, especially to produce goods based on latex crepe.
9. A Mould and Die Design Centre was established at the University ofMoratuwa to cater to the local rubber product manufacturing industry andthereby reduce high costs associated with the import of expensive dies andmoulds. In addition, vocational training programmes for rubber processingmachine operators are being developed by National Apprentice andIndustrial Training Authority (NAITA) for the implementation at theUniversity of Vocational Technology (UNIVOTEC).
Threats
1. In the absence of a sector-wide comprehensive marketing strategy, rubberproducers in Sri Lanka are dependent on the Government externalmarketing efforts. Any change in the Government’s focus or the withdrawalof donor support could result in the rubber industry’s loss of market share.
2. The growth of Chinese rubber product manufacturing sector with its low(compared to Sri Lanka) production costs, poses a serious threat to SriLankan rubber industry.
3. Expansion of rubber plantation in African countries, such as Nigeria andLiberia, represent future threats.
4. Increasing wage and other labour costs, coupled with low productivitylevels, are becoming serious threats to the rubber industry in Sri Lanka.
Critical issues for consideration
Based on the above strengths, weaknesses, opportunities and threats (SWOT)analysis, Sri Lankan rubber industry requires the following urgent responses:
1. Supply-side constraints have restricted the industry development andevery effort should be made by both the public and private sectors to easethose constraints and help further develop the rubber industry. Particularattention should be paid to further modernization of transport and energyinfrastructures in the rural areas to effectively link urban rubber industriesand rural plantations.
2. The industry’s focus on niche markets has resulted in greater dependenceon the solid-tire export sector. Unsuccessful entries into other internationalmarket niches have hindered the development of the latex sector andattracting FDI.
3. There are no sector-wide marketing efforts for Sri Lankan rubber productsand no marketing research mechanism. A well-designed marketingstrategy could bring huge dividends to the rubber industry.
4. There is no evidence of strategic collaboration among research institutions,statutory bodies, producers and exporters. A well-functioning publicinstitution with adequate resource provisions should be established.

178
STUDIES IN TRADE AND INVESTMENT 70
5. There are no linkages among product development, process developmentand technological capability improvement entities which hinders thegrowth and competitiveness of the rubber industry.
6. There is an urgent need for a full-fledged standardization and qualitycontrol mechanism for Sri Lankan rubber products for both domestic andforeign markets.
6. ACTION PLAN FOR THE DEVELOPMENT OF THE RUBBER INDUSTRY INSRI LANKA
As presented in earlier sections on the value chain and SWOT analysis, Sri Lankacould develop a competitive rubber industry and gain enormous benefits by beingfirmly established in both domestic and international markets. An action plan for thepurpose is formulated and presented below.
Objectives of the action plan
1. Increasing export earnings: to increase export earnings by 50 per cent fromthe current export levels reaching US$ 800 million by 2014.
2. Supply, stability of prices and volume: to increase the supply of naturalrubber by 50 per cent and stabilize the year-round supply of natural rubberby 2014 in order to avoid price volatility.
3. Product portfolio diversification: to diversify current product portfolio andincrease its value added by 20 per cent by 2014; to improve living standardsof workers engaged in the rubber industry by upgrading their skills andraising productivity
Strategic options and critical actions
While specific actions are outlined in the matrix in table 10, some of theimportant measures are emphasized below. Increasing plantation areas, promotingnon-tire and non-traditional rubber products FDI, enhancing research and development,pursuing aggressive marketing and own-brand development are the strategic actions,requiring priority attention. For such actions, the following measures should beimplemented:
1. Establish national market research and trade promotion agency: Sri Lankanrubber products should have an effective access to the regional and globalmarkets through the establishment of a national marketing research andtrade promotion institution.
2. Allow import of raw rubber on a limited scale to meet occasional shortages:permit the controlled import of raw rubber until the sufficient supply ofnatural rubber is fully available within the country.
3. Increase rubber plantation in non-traditional areas along with the measuresfor the increased productivity to meet the domestic demand in natural rubber:ensure a consistent supply of natural rubber to help stabilize rubber prices.

179
COUNTRY STUDIES ON BANGLADESH, NEPAL AND SRI LANKA
Tabl
e 4:
Act
ion
plan
mat
rix
for t
he ru
bber
sec
tor i
n Sr
i Lan
ka
Pre
sen
t st
atu
s/Ta
rget
sA
ctio
ns
Res
po
nsi
ble
inst
itu
tio
nco
nst
rain
ts
Obj
ectiv
e 1:
To
incr
ease
nat
ural
rubb
er s
uppl
y b y
50
per c
ent b
y 20
14 in
ord
er to
ach
ieve
sta
ble
supp
ly a
t low
pric
e vo
latil
ity.
Dec
line
in la
nd a
rea
unde
r rub
ber
culti
vatio
n du
e to
rapi
d ur
bani
zatio
n.
Use
of t
radi
tiona
l raw
rubb
er m
anuf
actu
ring
proc
esse
s.
Incr
ease
nat
ural
rubb
er s
uppl
yat
a c
ompe
titiv
e pr
ice.
Incr
ease
the
yiel
d le
vel o
fna
tura
l rub
ber.
Rela
x re
stric
tions
on
limite
d im
port
of n
atur
al ru
bber
by
intr
oduc
ing
a lic
ensi
ng s
yste
m.
Impl
emen
t sci
entif
ic a
gro-
man
agem
ent p
ract
ices
.
Expa
nd in
trod
uctio
n of
mod
ified
(hig
h-yi
eldi
ng) c
lone
s, an
dbr
ing
dow
n th
e lo
w y
ield
ing
acre
age.
Intr
oduc
e ne
w ta
ppin
g te
chni
ques
(e.g
., to
repl
ace
man
ual
tapp
ing
durin
g ra
iny
seas
on w
ith m
echa
nica
l dev
ices
).
Revi
ew e
xist
ing
rubb
er p
lant
atio
n pr
ogra
mm
es th
roug
h pr
oper
surv
ey.
Dev
elop
new
rubb
er p
lant
atio
ns p
artic
ular
ly in
non
-tra
ditio
nal
area
s (M
oner
agal
a, H
amba
ntot
a an
d to
the
Nor
th E
ast)
.
Laun
ch n
ew in
ter-
crop
ping
pro
gram
mes
to d
iver
sify
the
culti
vatio
n.
Intr
oduc
e co
st e
ffect
ive,
less
labo
ur d
epen
dent
, use
r frie
ndly
,le
ss e
nerg
y, e
nviro
nmen
tal-f
riend
ly ra
w ru
bber
man
ufac
turin
g.
Esta
blis
h ra
w ru
bber
col
lect
ion
cent
res
for c
ost r
educ
tion
and
high
er in
com
e.
Gov
ernm
ent,
SLA
MER
P
RRI,
MPI
, PA
Incr
ease
rubb
er c
ultiv
atio
n.
RRI,
MPI
, PA
RRI,
univ
ersi
ties,
PA
MPI
, Min
istr
y of
Lan
ds
RRI,
MPI
, PA
Incr
ease
nat
ural
rubb
erpr
oduc
tion
by u
pgra
ding
raw
rubb
er m
anuf
actu
ring
proc
esse
s.
Gov
ernm
ent,
busi
ness
asso
ciat
ions
PA, M
PIPr
ovid
e be
tter
pric
ing
to ra
wru
bber
man
ufac
ture
rs.

180
STUDIES IN TRADE AND INVESTMENT 70
Tabl
e 4:
(co
ntin
ued)
Pre
sen
t st
atu
s/Ta
rget
sA
ctio
ns
Res
po
nsi
ble
inst
itu
tio
nco
nst
rain
ts
Obj
ectiv
e 2:
To
incr
ease
rubb
er p
rodu
cts
expo
rt re
venu
e by
50
per c
ent b
y 20
14
Low
val
ue-a
dded
expo
rts
are
popu
lar
amon
g gr
assr
oots
leve
l pro
duce
rs w
holo
ok fo
r qui
ck c
ash.
Impr
ove
rese
arch
and
pro
duct
deve
lopm
ent f
acili
ties.
Expa
nd p
rese
nt c
hara
cter
izat
ion
and
phys
ical
test
ing
faci
litie
s at
rese
arch
inst
itutio
ns a
nd/o
r uni
vers
ities
, and
pro
vide
ser
vice
s to
SMEs
.
Form
a re
sear
ch a
nd d
evel
opm
ent a
ssoc
iatio
n (a
clu
ster
of
rubb
er in
dust
rialis
ts, m
anuf
actu
rers
’ ass
ocia
tions
, res
earc
hers
from
uni
vers
ities
and
rese
arch
inst
itutio
ns).
Laun
ch a
pro
duct
and
pro
cess
dev
elop
men
t cen
tre
(sel
ect a
suita
ble
inst
itutio
n fo
r exp
ansi
on, e
xpan
d ca
paci
ty, p
urch
ase
prod
uct t
estin
g an
d an
alyt
ical
inst
rum
ents
and
lab
scal
epr
oces
sing
equ
ipm
ent)
.
Impr
ove
hum
an re
sour
ces
and
capa
bilit
ies
in R
&D
, pro
duct
deve
lopm
ent a
nd s
peci
ficat
ions
sta
ndar
diza
tion
(ove
rsea
s/lo
cal
trai
ning
)
Esta
blis
h a
cust
om c
ompo
und
faci
lity,
esp
ecia
lly c
ater
ing
toSM
Es
Brin
g ne
cess
ary
chan
ges
to C
ESS
polic
y an
d ot
her l
evie
s an
ddu
ties
on d
omes
tic n
atur
al ru
bber
pro
cure
men
t to
prom
ote
the
valu
e-ad
ded
prod
uct m
anuf
actu
ring.
Rela
x re
stric
tions
on
impo
rts
of s
ynth
etic
and
nat
ural
rubb
eran
d in
put m
ater
ial b
y in
trod
ucin
g lic
ensi
ng m
echa
nism
s.
Esta
blis
h ne
w p
rodu
ctio
n fa
cilit
ies,
espe
cial
ly fo
r cre
pe ru
bber
-ba
sed
prod
ucts
(e.g
., fo
od a
nd m
edic
al c
ompo
nent
s), h
igh
end
valu
e-ad
ded
prod
ucts
(e.g
., au
tom
otiv
e pa
rts)
, and
eco
-frie
ndly
prod
ucts
(e.g
., ru
bber
with
coi
r)
Rese
arch
inst
itutio
ns,
univ
ersi
ties
Uni
vers
ities
, SLR
MER
P, PR
I, RR
I
Gov
t.
Gov
t.
Enha
nce
supp
ly o
f rub
ber
com
poun
d fa
cilit
ies.
Redu
ce ra
w ru
bber
exp
orts
by
enha
ncin
g pr
oduc
tm
anuf
actu
ring.
IDB,
pro
pose
d te
chni
cal
inno
vatio
n ce
ntre
Gov
t., S
LAM
ERP
Gov
t., S
LAM
ERP
SLA
MER
P m
embe
rs, p
ropo
sed
prod
uct a
nd p
roce
ssde
velo
pmen
t cen
tre

181
COUNTRY STUDIES ON BANGLADESH, NEPAL AND SRI LANKA
Tabl
e 4:
(co
ntin
ued)
Pre
sen
t st
atu
s/Ta
rget
sA
ctio
ns
Res
po
nsi
ble
inst
itu
tio
nco
nst
rain
ts
Prod
uce
bett
er q
ualit
ypr
oduc
ts.
Laun
ch q
ualit
y aw
aren
ess
prog
ram
mes
at a
ll le
vels
of e
xpor
tpr
oduc
tion
proc
esse
s, in
clud
ing
calib
ratio
n. D
evel
opin
fras
truc
ture
nec
essi
ty fo
r pro
per m
aint
enan
ce o
f qua
lity.
Esta
blis
h a
natio
nal a
ccre
dita
tion
body
to a
sses
s co
nfor
mity
of
inst
itutio
ns a
nd th
eir i
nfra
stru
ctur
e fo
r qua
lity,
with
pos
sibl
ese
rvic
es e
xten
ded
to o
ther
regi
onal
cou
ntrie
s.
Enco
urag
e an
d as
sist
mor
e te
stin
g co
nduc
ted
by s
ever
alin
stitu
tions
to b
e ac
cred
ited
to in
tern
atio
nal s
tand
ards
.
Cond
uct i
n-ho
use
prog
ram
mes
on
was
te m
inim
izat
ion
and
good
hou
seke
epin
g pr
actic
es. I
ntro
duce
che
aper
alte
rnat
ive
ener
gy s
ourc
es a
nd e
nerg
y ef
ficie
nt te
chni
ques
.
Form
a c
entr
al ru
bber
-rec
yclin
g un
it w
ith n
eces
sary
equ
ipm
ent.
Prov
ide
recy
cled
rubb
er to
indu
stria
lists
at a
redu
ced
cost
and
enco
urag
e in
corp
orat
ing
them
in e
xpor
t-ru
bber
pro
duct
s.
Esta
blis
h pr
omot
ion
sche
mes
for r
ubbe
r-re
late
d SM
Esm
anuf
actu
ring
impo
rt s
ubst
itute
s.
Dev
elop
new
pro
duct
ion
lines
.
Prov
ide
tech
nica
l kno
w h
ow to
SM
Es fo
r man
ufac
turin
g of
new
prod
ucts
.
Esta
blis
h lo
ng-t
erm
pur
chas
e ag
reem
ents
with
maj
or im
port
ers.
SLSI
, ind
ustr
ies,
ITI,
univ
ersi
ties
and
rese
arch
inst
itutio
ns o
rpr
opos
ed p
rodu
ct a
nd p
roce
ssde
velo
pmen
t cen
tre
NCP
C, u
nive
rsiti
es, E
nerg
yAu
thor
ity
Prop
osed
pro
duct
and
pro
cess
deve
lopm
ent c
entr
e
SME
rubb
er a
ssoc
iatio
n, M
ID
IDB,
RRI
, pro
pose
d te
chni
cal
inno
vatio
n ce
ntre
Stat
utor
y bo
dies
, SLA
MER
P
Redu
ce p
rodu
ctio
n co
sts.
Redu
ce ra
w m
ater
ial c
osts
.
Prod
uce
impo
rt s
ubst
itute
s fo
rlo
w p
erfo
rman
ce p
rodu
cts
bySM
Es.
Faci
litat
e ex
port
ers
with
ste
ady
orde
rs.
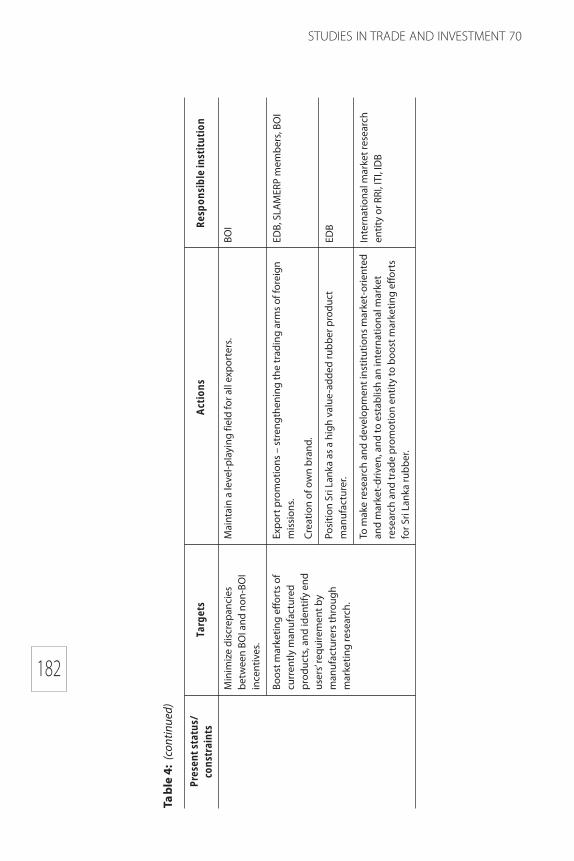
182
STUDIES IN TRADE AND INVESTMENT 70
Tabl
e 4:
(co
ntin
ued)
Pre
sen
t st
atu
s/Ta
rget
sA
ctio
ns
Res
po
nsi
ble
inst
itu
tio
nco
nst
rain
ts
Min
imiz
e di
scre
panc
ies
betw
een
BOI a
nd n
on-B
OI
ince
ntiv
es.
Boos
t mar
ketin
g ef
fort
s of
curr
ently
man
ufac
ture
dpr
oduc
ts, a
nd id
entif
y en
dus
ers’
requ
irem
ent b
ym
anuf
actu
rers
thro
ugh
mar
ketin
g re
sear
ch.
Mai
ntai
n a
leve
l-pla
ying
fiel
d fo
r all
expo
rter
s.
Expo
rt p
rom
otio
ns –
str
engt
heni
ng th
e tr
adin
g ar
ms
of fo
reig
nm
issi
ons.
Crea
tion
of o
wn
bran
d.
Posi
tion
Sri L
anka
as
a hi
gh v
alue
-add
ed ru
bber
pro
duct
man
ufac
ture
r.
To m
ake
rese
arch
and
dev
elop
men
t ins
titut
ions
mar
ket-
orie
nted
and
mar
ket-
driv
en, a
nd to
est
ablis
h an
inte
rnat
iona
l mar
ket
rese
arch
and
trad
e pr
omot
ion
entit
y to
boo
st m
arke
ting
effo
rts
for S
ri La
nka
rubb
er.
BOI
EDB,
SLA
MER
P m
embe
rs, B
OI
EDB
Inte
rnat
iona
l mar
ket r
esea
rch
entit
y or
RRI
, ITI
, ID
B

183
COUNTRY STUDIES ON BANGLADESH, NEPAL AND SRI LANKA
4. Promote research and development, increase testing standards and improveaccreditations facilities: establish research and development facility toenable product- and process- related innovations and enhance testingstandards and international accreditation related to the natural rubberindustry.
5. Attract more latex- and rubber-related FDI: increase manufacturing of thelatex-based and non-traditional rubber-based products.
Action plan matrix for Sri Lankan rubber industry
The action plan (table 4) aims(a) to achieve a 50 per cent increase in theproduction of natural rubber by 2014, and (b) to increase export revenues from rubberproducts by 50 per cent by 2014.
The Electronic Products Sector in Sri Lanka
7. OVERVIEW OF THE GLOBAL ELECTRONICS INDUSTRY
Globally, the electronics industry is a rapidly growing sector of economy thatis expected to grow into a trillion dollar industry in 2011. During the past decade, theindustry that encompasses consumer appliances, ICT, industrial electronics, aerospaceand defense and several other industries has experienced a steady expansion that wereboth demand-and industrial infrastructure-driven. The exponential growth of Internetfor business and personal data collection and management and communications willcontinue to be the driving phenomenon in this decade. Within this context, ICTequipment accounted for roughly two-thirds of global electronic production in 2007,with the increased demand for core components like semiconductors and printed circuitboards.
The growth of the electronics industry is underpinned by transnationalcorporations’ ability to make the production process more efficient. Due to the globalnature of the electronics industry, its production facilities have spread to locations withthe lowest labour and production costs. The production process in most electronicssub-sectors has been organized in such a way that individual parts can be manufacturedat different places and the final product assembled in yet another location thusproviding low costs and high profitability (see table 5).
International electronic manufacturers are increasingly reliant on sales inestablished economies (i.e., the United States of America, the European Union andJapan) and emerging markets (e.g., BRICS: Brazil, the Russian Federation, India, Chinaand South Africa) to increase their revenues. Within this framework, the criteria forchoosing a suitable location for production hubs are crucial in terms of productioneffectiveness and optimal distance to numerous markets.
The main difference between the electronics industry and other manufacturingindustries lies in the fast introduction of technological innovations and adaptations thathas created rapid market expansion over the past 30 years. Presently, electronic productmanufacturing is expanding at an unprecedented scale in the Asia-Pacific region. Many

184
STUDIES IN TRADE AND INVESTMENT 70
countries in the Asia-Pacific region – particularly Japan, Republic of Korea, China, TaiwanProvince of China, Malaysia, Thailand, India and Singapore – have become principalmanufacturing hubs for electronic goods and products. Significantly, China is becomingthe global manufacturing centre of consumer electronic products. In 2002, Asia had41 per cent of the global electronics market share and that has risen to 56 per cent in2009 (Digivity Report 2009).
According to JEITA (2009), global IT production, including electronic equipment,components and devices and information technology, totalled $1.67 trillion in 2005.Global production of electronic equipment, components and devices totalled $1.73trillion in 2005. The annual global growth of the electronics industry was estimated at6.6 per cent. In addition to fast growth, the electronics industry’s value added isconsidered high when compared to the value added of other industrial sectors. Forexample the value added in manufacturing of electronic components ranges from40 to 50 per cent, while the value added in equipment manufacturing ranges from 10to 15 per cent. Since the aggregated data on the global electronics industry is difficultto attain because various sub-sectors are involved and different classifications are used
Ta ble 5: Apple iPhone 3G’s major components and cost drivers
Manufacturer Component Cost (US Dollars)
Toshiba (Japan) Flash Memory $24.00Display Module $19.25Touch Screen $16.00
Samsung (Republic of Korea) Application Processor $14.46SDRAM-Mobile DDR $8.50
Infineon (Germany) Baseband $13.00Camera Module $9.55RF Transceiver $2.80GPS Receiver $2.25Power IC RF Function $1.25
Broadcom (United States of America) Bluetooth/FM/WLAN $5.95
Numonyx (United States of America) Memory MCP $3.65
Murata (Japan) FEM $1.35
Dialog Semiconductor (Germany) Power IC Application $1.30Processor Function
Cirrus Logic (United States of America) Audio Codec $1.15
Rest of Cost of Materials $48.00
Total Cost of Materials $172.46
Manufacturing Costs in China $6.50
Grand Total $178.96
Source: Xing and Detert (2010).

185
COUNTRY STUDIES ON BANGLADESH, NEPAL AND SRI LANKA
350
300
250
200
150
100
50
0
B$
Year numbers mark December of each year
2001 2002 2003 2004 2005 2006 2007 2008 2009 2010 2011 2012
by different nations, a specific electronics sub-sector was chosen to providea quantitative assessment of the growth in the electronics sector in the past decade.
With this in mind, the semiconductor industry38 is widely recognized as the keydriver in the growth of the entire electronics industry, with its dual role as a multiplelever and technology enabler for the electronics value chain. According toSemiconductor Industry Association, total annual sales of semiconductors for 2008amounted to $248.6 billion compared to $255.6 billion in 2007, a decrease of 2.8 percent (SIA Report 2009). Along with the strong growth of Internet use, smartphones,3DTVs and tablet PCs, the global recovery from the recent financial shock will providestrong impetus for sustained growth in the electronics industry (SIA 2011). Withsemiconductors being a vital component in those ICT products/services, strong growthin their sales and manufacturing would indicate strong demand for electronic products(figure 18). Sri Lanka could tap this potentially lucrative market by carefully selectingcertain high value-added electronic products for manufacturing within the country.
Figure 18: Performance of the semiconductor sector, 2001-2010 (actual); 2011and 2012 (forecast)
38 Semiconductors are materials that have conductivity between conductors (general metals) andnonconductors or insulators (such as ceramics) and play a pivotal role in the fabrication of electronicdevices. And even though many electronic devices can be produced using vacuum tube technology,breakthrough in semiconductor technology in the past 50 years has allowed electronic devices tobecome smaller, faster and more reliable (SIA 2011).
Source: WSTS (2011).
8. ADVANCEMENT OF ASIA-PACIFIC DEVELOPING COUNTRIES IN THEELECTRONICS SECTOR
Developing Asia-Pacific nations, such as China, India and ASEAN countries, haveexpanded its production capacity as suppliers of components and manufacturingsystems to major electronic transnational corporations (TNCs) and significantly

186
STUDIES IN TRADE AND INVESTMENT 70
increasing their production facilities throughout the first decade of this millennium.Several notable developments were observed:
a. Many Asia-Pacific producers, mainly from North-East Asia, have successfullytransitioned from technology-followers to technology-leaders in handlinglocal system design and component production. They maintain theadvantage of low labour costs by spreading their operations throughoutthe region.
b. Global value chains for electronics equipment in the region were well-developed, especially in countries of North-East and South-East Asia. Theylinked various levels of production inputs, such as materials, electronicparts and components, technology, production facilities and labour toassemble competitive final products for export.
c. A consolidation of upstream suppliers of value chains in the electronicsindustry occurred when the leading materials and equipment supplycompanies became major global suppliers, developing capabilities forsystem design, such as integrated modules that offered short lead-time andcost reduction (e.g., electronic system manufacturing (EMS)).
d. “Green” manufacturing and environmentally-friendly electronic productsemerged in response to new market demands and technologicaladvancement.
e. Emerging markets in the region e.g., China, India and the RussianFederation have increasingly expanded their share in the global electronicsmarket.
Thus, the trend is obvious that developing countries of Asia and the Pacific havebecome production hubs for electronic products. Following in the steps of otherdeveloping countries, such as China, India and ASEAN countries, Sri Lanka could havedeveloped a potential to become a competitive electronics industry. And in order tofurther gauge this potential in Sri Lanka, a brief overview of the Sri Lankan electronicsindustry is presented below.
9. POTENTIAL FOR THE DEVELOPMENT OF THE ELECTRONICS INDUSTRY INSRI LANKA
Despite the immense global growth of the electronics industry, Sri Lanka hasyet to partake in this sector even though the issues that constrained most developingcountries are not present in Sri Lanka. Sri Lanka has a great potential to procure anddevelop a competitive electronics industry having the low-cost and skilled labour,relatively well developed infrastructure and, most important of all, Indo-Sri Lanka FreeTrade Agreement providing access to the rapidly growing neighbouring market. Withthis being said, the engine that has driven Sri Lanka’s economic growth has beenits apparel industry annually accounting for over 40 per cent of exports since 2000(DOC 2009). Compared to its leading manufacturing sub-sector, apparel manufacturing,the electronics industry in Sri Lanka is rather small.

187
COUNTRY STUDIES ON BANGLADESH, NEPAL AND SRI LANKA
Box 1: Experience of Malaysia and Taiwan Province of China in the development ofthe electronics industry
Malaysia
Malaysian electronics industry has come a long way in the past 40 years, from itsinception in the 1970s to becoming one of the world’s largest exporters of semiconductordevices and ASEAN preeminent leader in electronics manufacturing. The key factor behindthis impressive rise is the Government’s success in attracting electronics targeted FDI. Threemain waves caused the relocation of TNC production facilities to Malaysia: 1) between 1972and 1974, when American and Japanese TNCs relocated some of their electronic assemblyoperations; 2) between 1987 and 1989, as a result of the Plaza Accord of 1985, JapaneseTNCs moved their labour-intensive consumer electronic manufacturing to low labour costnations; and 3) between 1990 and 1994, when American disk drive and computermanufacturers decided to move their production to locations with supplier networks ofkey components. TNCs were attracted to Malaysia because of its relatively moderninfrastructure, efficient bureaucracy, low tariffs and tax incentives, political stability andnon-unionized, low-cost skilled labour.
Source: Rasiah (1999).
Taiwan Province of China
The rise of Taiwan Province of China as one of the global leaders in the electronicsindustry is closely linked to the relentless efforts of the industry stakeholders and thesupport of the Government. First, Taiwan Province of China overcame technology/capitalbarriers using task distribution among SMEs. For example, manufacturing of printed circuitboards (PCB) requires the use of expensive specialized equipment, which SMEs cannotafford. Taiwanese electronics industry solved this problem by establishing specializeddrilling mills that undertake the most capital-intensive part of the PCB production process,thus allowing small PCB imprinting operators to survive and cater to other similar fields.This vertical disintegration of the PCB production process allowed for two things to happen:1) the continual growth of SMEs in niche categories; and 2) capital-intensive producers,such as PCB imprinting, became large independent subcontractors benefiting fromeconomies of scale. Second, Taiwanese firms evolved starting with relatively primitiveelectronic products and then moving to more sophisticated ones through developingadvance production processes and supplier networks. A typical example is notebook PCmanufacturers in the 1970s. Assembling notebook computers is a highly complex taskthat requires deep technological understanding. Taiwanese SMEs overcame technologicalconstraints by relying on an earlier experience of producing calculators. The experience,working with a large number of component suppliers for calculator production, gave thema competitive advantage over their rivals in terms of cost control and work coordination.Third, the success of Taiwanese electronics industry depended on the active participationof the Government. In addition to indicating export processing zones and initiating a seriesof tax and financial incentives, the Taiwanese Government actively supported and fosteredSMEs in the electronics industry by conducting promotional activities, such as organizingtrade fairs and exhibitions that aimed to foster foreign investor and local manufacturerrelationships to attract more electronics related FDI to the island.
Source: Chen and Ku (2002).

188
STUDIES IN TRADE AND INVESTMENT 70
Sri Lanka’s domestic electronics market is still small. In 2008, the electronicsindustry accounted for just 160 of the total 3,309 manufacturing enterprises in Sri Lankaand employed 27,000 people. For example, the apparel industry consists of 564enterprises that employ a whopping 340,000 people. A look into the value of Sri Lankanimports and exports provides a perspective of the current level of the electronicsindustry. In 2008, the electronics industry had $967 million in outputs from the inputsof $531 million. Figure 19 shows the levels of Sri Lankan inputs and outputs between2006 and 2008. As seen, the level of electronics industrial output has remained stable.
Figure 19: Tota l va lue of inputs and outputs in the electronics sector in Sri Lanka
Source: DCS (2011).
1 000
800
600
400
200
0
Mill
ion
s U
S d
olla
rs
2006 2007 2008
Total inputTotal output
The electronics industry shows a great potential as a driver of future economicgrowth. When compared to the apparel and rubber/plastics sectors, the productivitylevel of the electronics industry (both at micro- and macro-levels) is considered highwith the value output per worker being $16,200, which is the highest level among thethree manufacturing sectors. High productivity level is seen as an importantcompetitiveness indicator (table 6). In 2008, the apparel sector had exports valued at$2.98 billion, while the electronics sector exported only one third of this value andemployed only 10 per cent of the apparel sector workforce. The electronics industry,due to its high value added, is more efficient in converting inputs into outputs thanother manufacturing sectors and thus has a much higher productivity level.
Ta ble 6: Productivity levels across the three sectors in Sri Lanka
Indicator ApparelRubber
Electronicsand Plastics
Output/Input Ratio 1.68 1.83 1.82Output/Worker (in dollars) 8 767 20 599 35 972Value Added/Worker (in dollars) 3 540 9 335 16 200Value Added/Input Ratio 0.68 0.83 0.82
Source: Calculated by the authors with the data obtained from DCS (2011).

189
COUNTRY STUDIES ON BANGLADESH, NEPAL AND SRI LANKA
10. ACCESS TO MAJOR MARKETS
As previously mentioned, the electronics industry in Sri Lanka has beenneglected and is underdeveloped even by the standards of lower middle incomenations.39 On average, lower middle income nations had high technology exports shareof 22 per cent in their manufacturing exports from 2001 to 2008 while Sri Lanka onlyhad a paltry 1.6 per cent (World Bank 2011b).
Sri Lanka’s five main export destinations are the European Union, the UnitedStates of America, India, United Arab Emirates and the Russian Federation – with thefirst two having close to 60 per cent share of exports in 2010 (EC 2011a). Andunsurprisingly, Sri Lanka’s leading exports are apparel and clothing accessories. Aftera detailed look into the export data of the four major markets, including the EuropeanUnion, the United States of America, India and China, one can see that there arenegligible exports of electronic products to these markets with the exception of theEuropean Union. And even though the export of electronic goods to the EuropeanUnion increased more than six-fold from $22.5 million to $148.4 million in the periodfrom 2002 to 2007, it still represents only five per cent of Sri Lankan total exports tothe European Union (DOC 2007).
Sri Lanka is well situated in the middle of the main maritime transport corridorthat links Europe to Asia and the Pacific and North America, which provides logisticaccess to key overseas markets such as the European Union, China, Japan, ASEAN andthe United States of America. Sri Lanka, with its supply of relatively skilled workers andlow labour costs, could market its domestic capabilities for manufacturing low-costelectronic components that could easily be exported to overseas assembly hubs (forthe finished products). The following sections will briefly describe potential key exportmarkets for Sri Lankan electronics industry, namely India, ASEAN, the European Unionand the United Sates of America.
India
Sri Lanka’s proximity to India allows it benefit from the Indian economic growthwith its growing demand for electronic products. As more Indians can afford modernluxury and the necessary items such as televisions, refrigerators, personal computers,mobile phones, cars, etc. more opportunities emerge for the electronics industry ofSri Lanka. Sri Lanka stands to benefit from Indo-Sri Lanka Free Trade Agreement, whichwas signed in 2000 with the aim of promoting economic linkages between India andSri Lanka (ISFTA 2007). This agreement allows over 4,000 Sri Lankan goods a duty-freeaccess into India40; included among the list of eligible-products are various electronic
39 The World Bank classifies countries, according to GNI per capita, into four income groups: lowincome, $1,005 or less; lower middle income, $1,006-$3,975; upper middle income, $3,976-$12,275,and high income, $12,276 or more. Sri Lanka is classified as a lower middle income nation with aGNI per capita of $2,290 (World Bank 2011b).40 Conversely, ISFTA also provides preferential tariffs for petroleum, natural gas, steel and other coreinfrastructural products exported from India to Sri Lanka – so that enterprises in Sri Lanka also haveaccess to key manufacturing inputs from India.

190
STUDIES IN TRADE AND INVESTMENT 70
goods: household appliances, printed circuits, semiconductors, electronic integratedcircuits, electrical machinery parts, motor vehicles, televisions, personal computers andtelephones (DOC 2009). The ISFTA has brought about a rapid growth of exports fromSri Lanka to India or a nine-fold increase from $55.7 million to $516.4 million in theperiod from 2000 to 2007 India now represents the third largest export market forSri Lanka (table 7). More than 70 per cent of Sri Lankan exports to India presently fallunder the tariff preferences offered through ISFTA.
Ta ble 7: Trade between India and Sri Lanka, 2000-2007 (va lue in millions ofdollars)
Year Exports to India Imports from India Total Trade
2000 55.7 600.1 655.8
2001 70.1 601.5 671.6
2002 168.9 834.7 1 003.6
2003 241.1 1 076.2 1 317.3
2004 385.5 1 358.0 1 743.5
2005 559.3 1 440.4 1 999.7
2006 494.1 1 822.1 2 316.2
2007 516.4 2 785.0 3 301.4
Source: ISFTA (2007).
The current economic environment fosters the expansion of the Sri Lankanelectronics industry as it has an advantage in supplying low-cost electronics parts andcomponents to the Indian market. Since most electronic products are not manufacturedin India and have to be imported, Sri Lanka could act as a production site for theelectronic components (and finished products) destined for the Indian market.41
Sri Lanka could act as secondary supplier of electronic car parts for Indian automotivemanufacturers (especially small sized). With an investment from Japanese TNCs andan experience in exporting to foreign nations, Sri Lanka has been developing a capacityfor producing products to international standards.42 Despite a growth potential inbilateral trade, the level of exported electronic products to India is minimal at best.
Since the implementation of ISFTA, the growing mutual dependence of SriLankan and Indian economies is obvious (see table 7). Taking into consideration thesupply of skilled workers and low labour costs, there is a golden opportunity for foreigninvestors to invest in the manufacturing of high value added electronic components/products in Sri Lanka and export them to the Indian market.
41 India has attracted FDI in its electronics sector mostly for research and development (R&D)operations rather than manufacturing and production (cf. Ernst 2009).42 Companies such as Toslanka, Kik Group, Nippon Maruchi, Soar Technologies, and FDK Lanka.

191
COUNTRY STUDIES ON BANGLADESH, NEPAL AND SRI LANKA
ASEAN
Association of Southeast Asian Nations (ASEAN) has undergone rapidindustrialization that has transformed it from an agrarian-based economy to the onebased on industry and services. The subregion’s FDI-driven development strategy hasintegrated its industries into global and regional value chains. Next to China, ASEAN(specifically Malaysia and Thailand) has risen to become a global manufacturing centrefor electronic and electrical products. However, rising labour costs are seen as a majorchallenge for South-East Asia, which hamper its future reliance on assemblymanufacturing. A small number of skilled labour in the subregion has limited the typeof manufacturing to assembly manufacturing that has drastically capped the highvalued-added activities. The result is that ASEAN imports the necessary componentsand parts for the final assembly from abroad .
Sri Lanka is in a unique position, due to an abundance of skilled labour and lowlabour costs, to take advantage of the situation in ASEAN. Because of its proximity toASEAN and its low labour, resource and transportation costs, Sri Lanka could marketitself as a low-cost manufacturer of electronic and electrical components for a furtherintegration into the ASEAN electronics value chain. Additionally, Sri Lanka couldproduce computer hardware components and car electronic parts (similar for those itproduces for India) for the ASEAN high tech and auto industries. Since these exportindustries already exist in Sri Lanka (albeit minimally) through affiliation with TNCsubsidiaries, their further development should be relatively straightforward.
The European Union
The European Union (EU) has incorporated the World Trade Organization (WTO)Generalized System of Preferences (GSP)43 into its trade agreement with Sri Lanka andother 175 other developing countries and territories, which provides them witha preferential access to the European market. It achieves this by reducing tariffs44 onover 7,000 products destined for sale in the European market. As an extension to theEuropean GSP, there is a non-reciprocal preferential import regime for developingnations, known as the special incentive arrangement for sustainable development andgood governance (colloquially as GSP plus). The GSP plus provides additionalpreferences to economically vulnerable developing countries, including Sri Lanka, thathave ratified, implemented and maintained international conventions dealing withsustainable development, good governance and human and labour rights (EC 2011b).
43 GSP is a formal exemption mechanism from the WTO provision that requires all WTO membernations to treat imports from all other WTO member nations equally, i.e., by imposing equal tariffson them. Under the GSP, qualifying nations such as Sri Lanka have preferential access, due to loweror non-tariffs, to all WTO member nations (WTO 2011). The aim of the GSP is to contribute to thereduction of poverty and promotion of sustainable development and good governance. Within thisframework, preferential tariff rates for exports to EU markets would enable developing nations toparticipate more fully in international trade and generate export revenue to support its developingindustries, jobs and poverty reduction (EC 2011b).44 The tariff preferences differ according to the sensitivity of products: non-sensitive products enjoyduty-free access to the EU market while sensitive products benefit from a tariff reduction. For specificduties, however, a 30 per cent reduction is the general rule (EC 2011b).

192
STUDIES IN TRADE AND INVESTMENT 70
Driven by GSP plus programme, Sri Lankan exports of electric goods, machinery,sound recorders, televisions, vehicles and parts to the EU increased from $22.5 millionto $148.5 million from 2002 to 2007 (DOC 2009). In 2009, the EU was responsible for5.6 per cent of Sri Lankan electronic exports (EC 2011b). However, in 2010 the EUsuspended Sri Lanka from the GSP plus programme due to its failure to meet threeUnited Nations human rights conventions (EC 2011c).45 Despite this, Sri Lanka stillreceives regular GSP tariff preferences from the EU. This brings uncertainty about thebenefits Sri Lanka may receive in the form of future electronic-related exports to theEuropean Union.
The United States of America
Similar to the European Union GSP, the United States of America (The UnitedStates) has incorporated World Trade Organization GSP into its trade agreements withSri Lanka and other 129 designated countries and territories, which provide preferentialduty-free treatment to over 3,400 products. The purpose of GSP programme is to giveexports from developing nations a competitive edge in the United States market; theUnited States companies, on the other hand, are interested in buying goods throughGSP programme because no tariff is charged on the products’ entry into the UnitedStates.46 GSP programme covers many eligible items and among them are industrialitems and inputs for manufacturing. The total United States import under GSPprogramme in 2006 amounted to $32.6 billion, 20 per cent of which was classified as“machinery, electronics or transportation” product types. Sri Lanka was the 14th top userof US GSP in 2006 with $143.6 million worth of exports and benefitted greatly from theprogramme. For example, the duties for certain electrical transformers exported werereduced by 6.6 per cent (USTR 2007). Despite this, Sri Lankan exports through GSPprogramme accounted for only 6.7 per cent of the total United States imports fromSri Lanka, with electronics export non-existent. As such, there is an immense potentialfor Sri Lanka to utilize the United States GSP programme to market itself to foreigninvestors for manufacturing of electronic components or finished products to bemarketed in the United States.
11. VALUE CHAINS IN THE ELECTRONICS INDUSTRY IN SRI LANKA
One of the major players in the electronics industry value chain are brandowners or own brand manufacturers (OBMs). The OBMs have marketing expertise inidentifying the needs of the user, doing in-house product design (i.e., own designmanufacturers (ODMs)) or ordering it from outside product designers. There area number of players in Sri Lanka that provide contract manufacturing services to theOBMs and to several other support industries such as printed circuit board (PCB)manufacturers, plastic enclosure producers, precision metal parts manufacturers anddie and mould makers. The support industries provide accessories and parts/components needed for the production of electronic goods. However, the contract
45 Those include the International Covenant on Civil and Political Rights, the Convention againstTorture and the Convention on the Rights of the Child.46 Otherwise, the tariffs could range between two per cent and seventeen per cent of theproduct’s cost.

193
COUNTRY STUDIES ON BANGLADESH, NEPAL AND SRI LANKA
manufacturers and support industries provide their services to the OBMs with relativelylow profit margins.
Figure 20 depicts a typical value chain of electronic components, which includesplant developers, process developers, raw material suppliers, electronic componentmanufacturers, distributors and industrial customers. In the production ofsemiconductors, for example, raw materials (such as silicon wafers) are converted intovarious discrete devices and integrated chips. The design of an integrated circuit is anexpensive process and is the key factor that determines the final quality and thus thevalue of the product. Usually designs are protected by patents and copyrights to ensurethat the expenses incurred during the design stage are recovered Thus, productionunder license agreements is practiced by many companies (i.e., licensed manufacturers).The cost of plants and machinery required for integrated circuit manufacturing is alsoconsiderably high. Semiconductors manufactured in large volumes, such asmicroprocessors and memories, are typically marketed under a brand names such asIntel, Motorola, AMD, Samsung and Hitachi.
Figure 21 depicts a value chain of electronic products for which electroniccomponents are major inputs. Laminats are processed chemically into PCBs whileelectronic components are later assembled into PCBs. The assembly process is usuallyoutsourced to contract manufacturers. Plastics and metals are major raw materials usedin the industry to make enclosures and accessories. Die and mould makers provide thedies and moulds needed by the industry while plastic enclosure/component producersand metal fabricators supply the enclosures and accessories. The PCB manufacturers,die and mould makers and enclosure/component producers can be treated as relatedsupport industries for the electronic product manufacturing industry. In addition,design service providers mainly for die and mould, electronic circuit and prototypingassist ODMs and OBMs in engineering and designing electronic products.
Figures 20 and 21 also suggest that certain functions of both the electronicscomponents and electronics products value chains could be developed in Sri Lanka.As far as the local electronics industry is concerned, the raw materials and requiredfacilities (e.g., plant and machinery) are mainly imported at present and such trend couldbe continued for the foreseeable future. At present, the Sri Lankan electronics industrycould be identified as a supporting industry to OBMs and ODMs that provide significantopportunities for Sri Lankan manufacturers to work for contract manufacturing servicesin exporting parts and components for display technologies, entertainment devices,optical storage devices, passive components and telecommunication equipment. TheSri Lankan electronics industry should attract foreign TNCs for local contractmanufacturing during trade fairs organized by the EDB. Foreign direct investment couldincrease the sector’s output and productivity due to the use of advanced manufacturingtechniques and higher productivity capacities of newly constructed plants. However,technological inputs, which play a major role in value added, are expected to beprovided by the leading brand owners. The quality control and marketing of the finalproduct should be done according to TNCs standards.
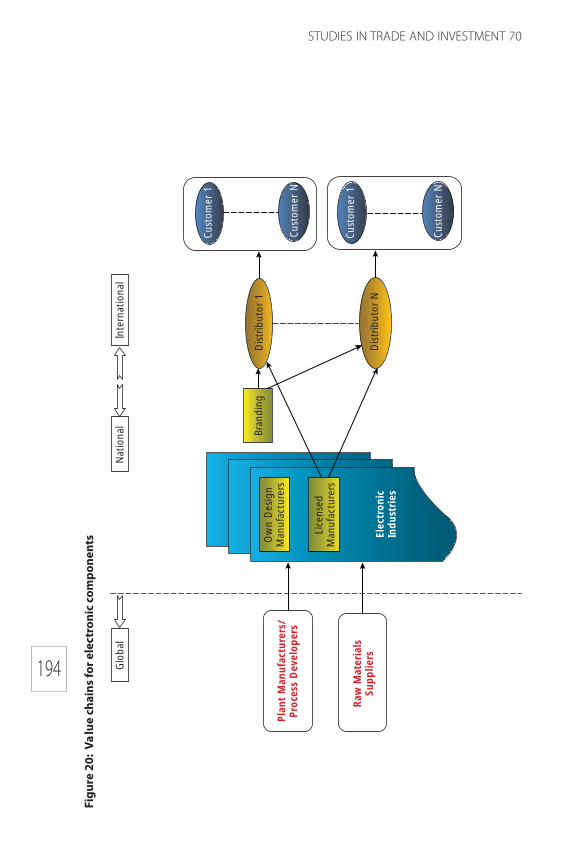
194
STUDIES IN TRADE AND INVESTMENT 70
Figu
re 2
0: V
alu
e ch
ains
for e
lect
roni
c co
mpo
nent
s
Glo
bal
Nat
ion
alIn
tern
atio
nal
Pla
nt
Man
ufa
ctu
rers
/P
roce
ss D
evel
op
ers
Raw
Mat
eria
lsSu
pp
liers
Ow
n D
esig
n
Man
ufa
ctu
rers
Lice
nse
d
Man
ufa
ctu
rers
Elec
tro
nic
In
du
stri
es
Bra
nd
ing
Dis
trib
uto
r 1
Dis
trib
uto
r N
Cu
sto
mer
1
Cu
sto
mer
1
Cu
sto
mer
N
Cu
sto
mer
N

195
COUNTRY STUDIES ON BANGLADESH, NEPAL AND SRI LANKA
Figu
re 2
1: V
alu
e ch
ains
for e
lect
roni
c pr
oduc
ts
Glo
bal
Nat
ion
alIn
tern
atio
nal
Bra
nd
ing
Dis
trib
uto
r 1
Dis
trib
uto
r N
Cust
omer
1
Cust
omer
1
Cust
omer
N
Cust
omer
N
OD
M
OB
M
Bra
nd
ing
Man
ufa
ctu
rers
Sup
plie
rs
Sup
po
rt I
nd
ust
ries
Plas
tic
Encl
osu
re/
Co
mp
on
ents
Man
ufa
ctu
rers
Plas
tic
Met
al
Ch
emic
als
and
Lam
inat
es
Elec
tro
nic
Co
np
on
ents
PCB
Man
ufa
ctu
rers
Met
al P
arts
Fab
rica
tors
Die
Man
ufa
ctu
rers
R&D
Inst
itu
tes
Mo
uld
Man
ufa
ctu
rers
Un
iver
siti
es
Des
ign
Ser
vice
Pro
vid
ers
Elec
tro
nic
Cir
cuit
s D
esig
n
Die
& M
ou
ldD
esig
n
Rap
idPr
oto
typ
ing

196
STUDIES IN TRADE AND INVESTMENT 70
Over time, electronics contract manufacturers in Sri Lanka should attempt tocome up the electronic value chain by providing the finished product to OBMs andODMs as original equipment manufacturers (OEMs) and developing their own brandsby enhancing their engineering and marketing capabilities. The local universities andR and D institutions could provide the required human resources for engineering andmarketing activities. Various suppliers (e.g., raw materials, plastic enclosures/components and metal parts) should be established near such universities andinstitutions to form industry clusters.
As stated earlier, the major strength of the electronics industry in Sri Lanka isthe relatively skilled and adaptable local labour force, which is flexible and is used tofrequent designs changes in the production of electronics components and productsand to quality and delivery requirements of leading electronics manufacturers. On theflip side, the major drawback of contract manufacturing is the low value added for SriLankan industries. And as marketing has not been done to any discernible extent bySri Lankan electronics industries, one could not expect that any Sri Lankan electronicsbrand emerge in the global market in the short term. The second major drawback isthe heavy dependence on imported machinery and raw materials, such as precisionmetal parts required for some electronics products. The third major drawback is a lackof engineering and design activities for the electronic export products in Sri Lanka.
Within this context one key issue that the electronics industry in Sri Lankashould address is the identification of niche markets. Sri Lankan firms engaged ascontract manufacturers could learn from their principal buyers, typically TNC-brandmanufacturers, how to reach the regional and global markets. However, buyers mayresist helping Sri Lankan contract manufacturers, who could become their competitorsover time. The strategy that Sri Lankan contract manufacturers could adopt to overcomethis resistance is to develop products that are not marketed by their customer TNCs.
12. SWOT ANALYSIS OF THE ELECTRONICS INDUSTRY IN SRI LANKA
Strengths
● Availability of low-cost, skilled workforce that is trainable, adaptable andcapable of working in high tech environments.
● Preferential access to major overseas markets, such as the European Union,the United States of America and India, which, by way of reduced or zerotariffs, give Sri Lankan products a competitive advantage.
● Relatively low international transportation costs due to a proximity tomaritime corridors.
● High productivity levels when compared to other key export sectors(i.e., apparel and rubber/plastic industries).
● Ample duty-free supply of natural resources (iron, oil, etc.) from India.
● Foundation of the Government supported microfinance institutionsassisting in funding SME development.

197
COUNTRY STUDIES ON BANGLADESH, NEPAL AND SRI LANKA
● Presence of foreign TNCs subsidiaries, exporting quality electroniccomponents to ASEAN and Japan, and thus displaying the feasibility andsuccess of electronic manufacturing in Sri Lanka.
● Increase of designated industrial parks and export processing zonesequipped with electric power supply, transportation access andinfrastructure for manufacturing operations.
Weaknesses
● Despite relatively modernized urban centres, the rural infrastructureremains underdeveloped with neglected roads and rail lines and unevensupply of electricity, which undermines rural SMEs development.
● High corporate tax rates and convoluted tax regulations are deterrents toforeign investments in Sri Lanka.
● Arcane labour regulations restrict the free flow of labour force and hinderSMEs’ ability to react to market changes.
● Lack of access to institutional credit and high costs of borrowing restrictthe capital needed for SMEs startups and expansion.
● Lack of adequate local auxiliary services (precision engineering, high techtesting and calibration) for electronics goods manufacturing necessitatesthe import of machinery and components.
● Lack of specific training and technological capability-building facility topromote and improve electronic goods manufacturing.
● Lack of an influential electronics industry association.
Opportunities
● Proximity to India allows Sri Lanka to benefit from the growing domesticdemand.
● Low levels of electronic goods exports and the electronics industry highproductivity levels (relative to the apparel and rubber/plastic industries)allows for tangible gains from economies of scale.
● The growing global demand for electronic products combined with theTNCs desire to lower production costs allows Sri Lanka to market itself asa low-cost manufacturing country.
● Ability to assimilate into the existing ASEAN regional value chains (i.e.,Malaysia and Thailand) as low-cost component suppliers and offersecondary components for the Indian manufacturing markets (e.g.,electronics parts for automobile).
● As production costs rise in the more developed neighbouring economiessuch as ASEAN, Sri Lanka, with its ample supply of skilled workforce andlow labour costs, represents a cost effective alternative for TNCs.
● Government sponsored electronics sector-specific investment campaign topromote Sri Lanka as an electronic manufacturing hub to foreign investors.

198
STUDIES IN TRADE AND INVESTMENT 70
Threats
● Further growth of Chinese, Indian and ASEAN manufacturing electronicproduct markets threatens Sri Lanka prospects of electronic productmarket development.
● Bureaucratic processes, tax and labour regulations create confusingbusiness environment that hinders future foreign investments.
● Weak access to credit hinders SMEs growth.
13. ACTION PLAN FOR THE DEVELOPMENT OF THE ELECTRONICS SECTORVALUE CHAINS IN SRI LANKA
Asia and the Pacific is fast becoming the manufacturing hub of the globalelectronics industry and Sri Lanka should capitalize on the great opportunity. By 2020,venturing into electronic component and product manufacturing as specified in theaction plan, Sri Lanka aims at capturing a 0.1 per cent share of the global electronicsmarket, which would correspond to approximately $2 billion (as compared to $967million in 2008).
The strategic perspectives of the action plan are based on the electronicsindustry maturity level and specific areas within the electronics industry where theproduction and sales of precision and branded electronic components and productswould fit. The perspectives and action plan are presented in the following matrices(tables 8 and 9). Several priority actions and activities specified below are as follows:
1. Vigorously promote electronics component manufacturing by attractingFDI from major component manufacturers;
2. Commence electronic component manufacturing by promoting jointventures to manufacturers under license;
3. Develop and modernize education/training and R and D for the electronicsindustry;
4. Establish market information and advisory system for the identification ofnew markets;
5. Promote design and manufacturing of electronic components for nichemarkets by establishing Sri Lankan brands;
6. Establish and strengthen design service providers in electronic circuitdesign, die and mould design and rapid prototyping;
7. Establish supporting industries capable of manufacturing precision plasticand metal components for the electronics industry;
8. Promote establishment of links with foreign brand manufacturers toconsider Sri Lanka as a suitable destination for own design manufacturingin addition to contract manufacturing;
9. Promote and support technology parks that cooperate closely witheducational and R and D centres;

199
COUNTRY STUDIES ON BANGLADESH, NEPAL AND SRI LANKA
10. Prepare the industry to comply with the environmental laws andregulations (e.g., lead-free soldering, electromagnetic compatibility, etc.);
11. Promote the establishment of links with foreign brand manufacturers tomarket Sri Lankan brands for niche markets where foreign brandmanufacturers are not currently providing any services; and
12. Promote the establishment of foreign subsidiaries to promote Sri Lankanbrands.
Box 2: An example of the electronics sector FDI in Sri Lanka
FDK Lanka was established in 1990 as one of foreign subsidiaries of FDK Corporation,a Japanese manufacturer of electronic-related materials and products that received over$1.2 billion in revenue in 2010. The FDK Lanka employs over 1,100 people and is locatedwithin the Katunayake EPZ, which provides a convenient access to transportation hubs.FDK Lanka started with producing magnetic heads for floppy drives in 1990, but recently,after five expansion stages, has overhauled its product portfolio to include optical isolators(for fibre optic communication equipments) and ferrite cores and rotary transformers (forVCR/Video cameras). FDK Lanka is equipped with computerized production machineries,precision cutting, cleanroom manufacturing environments of Class 100, 1,000, and 10,000,where optical components and rotary transformers are processed and assembled up tothe final product. Its products are shipped to China; European Union; Hong Kong, China;Indonesia; Japan; Malaysia, Republic of Korea; and the United States of America. Thesuccess of FDK Lanka demonstrates a business opportunity for the electronics sector TNCsin Sri Lanka.
Source: http://www.fdklanka.com

200
STUDIES IN TRADE AND INVESTMENT 70
Tabl
e 8:
Act
ion
plan
mat
rix
for t
he e
lect
roni
cs s
ecto
r in
Sri L
anka
Ob
ject
ive
Pre
sen
t St
atu
sTa
rget
Act
ion
sR
esp
on
sib
leIn
stit
uti
on
Mai
n ob
ject
ive:
To
capt
ure
0.1
per c
ent s
hare
in th
e gl
obal
ele
ctro
nics
mar
ket b
y 20
20 b
y ve
ntur
ing
into
ele
ctro
nics
com
pone
nt a
nd p
rodu
ct m
anuf
actu
ring.
Com
men
ce th
epr
oduc
tion
ofel
ectr
onic
sco
mpo
nent
s.
Onl
y on
e fo
reig
nin
vest
or is
invo
lved
in m
anuf
actu
ring
capa
cito
rs.
Com
men
ce p
rodu
ctio
nan
d m
arke
t ele
ctro
nic
com
pone
nts,
such
as
capa
cito
rs, r
esis
tors
,in
duct
ors,
conn
ecto
rs,
etc.
A1.
Att
ract
FD
I by
maj
or c
ompo
nent
man
ufac
ture
rs.
A2.
Pro
mot
e jo
int v
entu
res
to m
anuf
actu
rers
und
erlic
ense
.
A3.
Pro
mot
e de
sign
and
man
ufac
ture
ele
ctro
nic
com
pone
nts
for n
iche
mar
kets
by
esta
blis
hing
Sri
Lank
anbr
ands
.
A4.
Dev
elop
men
t and
mod
erni
zatio
n of
edu
catio
n an
d R
and
D fo
r the
ele
ctro
nics
indu
stry
.
A5.
Pro
mot
ion
and
supp
ort f
or te
chno
logy
par
ksco
oper
atin
g cl
osel
y w
ith e
duca
tiona
l and
R&
D c
entr
es.
A6.
Pre
para
tion
of in
dust
ry fo
r env
ironm
enta
l dire
ctiv
es(e
.g.,
lead
-free
sol
derin
g), e
lect
rom
agne
tic c
ompa
tibili
ty,
etc.
A7.
Est
ablis
h m
arke
t inf
orm
atio
n an
d ad
viso
ry s
yste
mfo
r ide
ntifi
catio
n of
new
mar
kets
.
A8.
Est
ablis
h de
sign
ser
vice
pro
vide
rs in
ele
ctro
nic
circ
uit d
esig
n, d
ie a
nd m
ould
des
ign,
rapi
d pr
otot
ypin
gan
d st
reng
then
ing
them
.
A9.
Est
ablis
h su
ppor
ting
indu
strie
s ca
pabl
e of
man
ufac
turin
g pr
ecis
ion
plas
tic a
nd m
etal
com
pone
nts
for t
he e
lect
roni
cs in
dust
ry.
BOI,
SLEM
EA
Com
men
ce th
epr
oduc
tion
ofel
ectr
onic
pro
duct
s.
At p
rese
nt, m
ainl
yco
ntra
ctm
anuf
actu
ring
isca
rrie
d ou
t.
Com
men
ce p
rodu
ctio
nan
d m
arke
t ele
ctro
nic
prod
ucts
in c
onsu
mer
elec
tron
ics,
tele
com
mun
icat
ion,
com
pute
r and
offi
ceau
tom
atio
n se
ctor
, as
wel
l as
indu
stria
lel
ectr
onic
s se
ctor
s.
BOI,
SLEM
EA
EDB,
SLE
MEA
Uni
vers
ities
MID
Min
istr
y of
Envi
ronm
ent
EDB
MID
MID
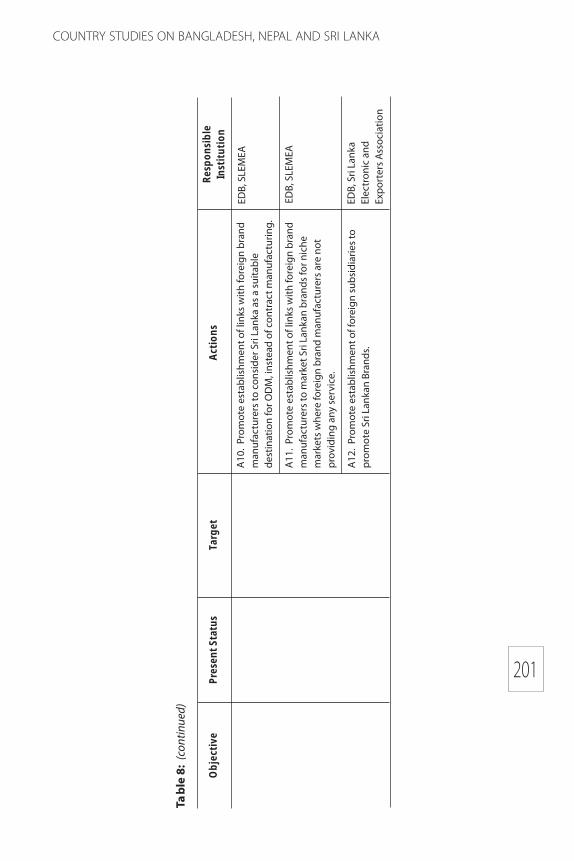
201
COUNTRY STUDIES ON BANGLADESH, NEPAL AND SRI LANKA
Tabl
e 8:
(co
ntin
ued)
Ob
ject
ive
Pre
sen
t St
atu
sTa
rget
Act
ion
sR
esp
on
sib
leIn
stit
uti
on
A10
. Pr
omot
e es
tabl
ishm
ent o
f lin
ks w
ith fo
reig
n br
and
man
ufac
ture
rs to
con
side
r Sri
Lank
a as
a s
uita
ble
dest
inat
ion
for O
DM
, ins
tead
of c
ontr
act m
anuf
actu
ring.
A11
. Pr
omot
e es
tabl
ishm
ent o
f lin
ks w
ith fo
reig
n br
and
man
ufac
ture
rs to
mar
ket S
ri La
nkan
bra
nds
for n
iche
mar
kets
whe
re fo
reig
n br
and
man
ufac
ture
rs a
re n
otpr
ovid
ing
any
serv
ice.
A12
. Pr
omot
e es
tabl
ishm
ent o
f for
eign
sub
sidi
arie
s to
prom
ote
Sri L
anka
n Br
ands
.
EDB,
SLE
MEA
EDB,
SLE
MEA
EDB,
Sri
Lank
aEl
ectr
onic
and
Expo
rter
s As
soci
atio
n
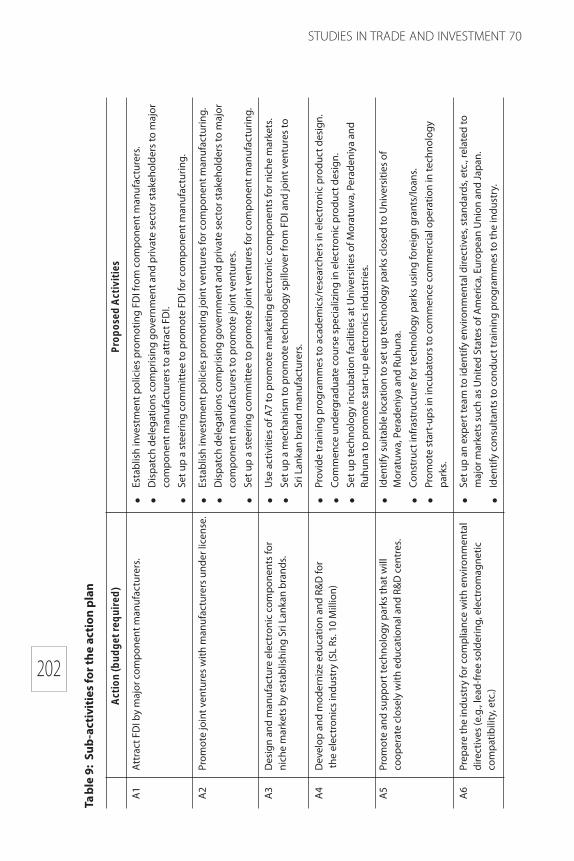
202
STUDIES IN TRADE AND INVESTMENT 70
Tabl
e 9:
Sub
-act
ivit
ies
for t
he a
ctio
n pl
an
Act
ion
(bu
dg
et r
equ
ired
)P
rop
ose
d A
ctiv
itie
s
A1
Attr
act F
DI b
y m
ajor
com
pone
nt m
anuf
actu
rers
.●
Esta
blis
h in
vest
men
t pol
icie
s pr
omot
ing
FDI f
rom
com
pone
nt m
anuf
actu
rers
.●
Dis
patc
h de
lega
tions
com
pris
ing
gove
rnm
ent a
nd p
rivat
e se
ctor
sta
keho
lder
s to
maj
orco
mpo
nent
man
ufac
ture
rs to
att
ract
FD
I.●
Set u
p a
stee
ring
com
mitt
ee to
pro
mot
e FD
I for
com
pone
nt m
anuf
actu
ring.
A2
Prom
ote
join
t ven
ture
s w
ith m
anuf
actu
rers
und
er li
cens
e.●
Esta
blis
h in
vest
men
t pol
icie
s pr
omot
ing
join
t ven
ture
s fo
r com
pone
nt m
anuf
actu
ring.
●D
ispa
tch
dele
gatio
ns c
ompr
isin
g go
vern
men
t and
priv
ate
sect
or s
take
hold
ers
to m
ajor
com
pone
nt m
anuf
actu
rers
to p
rom
ote
join
t ven
ture
s.●
Set u
p a
stee
ring
com
mitt
ee to
pro
mot
e jo
int v
entu
res
for c
ompo
nent
man
ufac
turin
g.
A3
Des
ign
and
man
ufac
ture
ele
ctro
nic
com
pone
nts
for
●U
se a
ctiv
ities
of A
7 to
pro
mot
e m
arke
ting
elec
tron
ic c
ompo
nent
s fo
r nic
he m
arke
ts.
nich
e m
arke
ts b
y es
tabl
ishi
ng S
ri La
nkan
bra
nds.
●Se
t up
a m
echa
nism
t o p
rom
ote
tech
nolo
gy s
pillo
ver f
rom
FD
I and
join
t ven
ture
s to
Sri L
anka
n br
and
man
ufac
ture
rs.
A4
Dev
elop
and
mod
erni
ze e
duca
tion
and
R&D
for
●Pr
ovid
e tr
aini
ng p
rogr
amm
es to
aca
dem
ics/
rese
arch
ers
in e
lect
roni
c pr
oduc
t des
ign.
the
elec
tron
ics
indu
stry
(SL
Rs. 1
0 M
illio
n)●
Com
men
ce u
nder
grad
uate
cou
rse
spec
ializ
ing
in e
lect
roni
c pr
oduc
t des
ign.
●Se
t up
tech
nolo
gy in
cuba
tion
faci
litie
s at
Uni
vers
ities
of M
orat
uwa,
Per
aden
iya
and
Ruhu
na to
pro
mot
e st
art-
up e
lect
roni
cs in
dust
ries.
A5
Prom
ote
and
supp
ort t
echn
olog
y pa
rks
that
will
●Id
entif
y su
itabl
e lo
catio
n to
set
up
tech
nolo
gy p
arks
clo
sed
to U
nive
rsiti
es o
fco
oper
ate
clos
ely
with
edu
catio
nal a
nd R
&D
cen
tres
.M
orat
uwa,
Per
aden
iya
and
Ruhu
na.
●Co
nstr
uct i
nfra
stru
ctur
e fo
r tec
hnol
ogy
park
s us
ing
fore
ign
gran
ts/lo
ans.
●Pr
omot
e st
art-
ups
in in
cuba
tors
to c
omm
ence
com
mer
cial
ope
ratio
n in
tech
nolo
gypa
rks.
A6
Prep
are
the
indu
stry
for c
ompl
ianc
e w
ith e
nviro
nmen
tal
●Se
t up
an e
xper
t tea
m to
iden
tify
envi
ronm
enta
l dire
ctiv
es, s
tand
ards
, etc
., re
late
d to
dire
ctiv
es (e
.g.,
lead
-free
sol
derin
g, e
lect
rom
agne
ticm
ajor
mar
kets
suc
h as
Uni
ted
Stat
es o
f Am
eric
a, E
urop
ean
Uni
on a
nd Ja
pan.
com
patib
ility
, etc
.)●
Iden
tify
cons
ulta
nts
to c
ondu
ct tr
aini
ng p
rogr
amm
es to
the
indu
stry
.

203
COUNTRY STUDIES ON BANGLADESH, NEPAL AND SRI LANKA
A7
Esta
blis
h m
arke
t inf
orm
atio
n an
d ad
viso
ry s
yste
m fo
r●
Esta
blis
h a
netw
ork
of tr
ade
mis
sion
s at
Sri
Lank
an E
mba
ssie
s to
iden
tify
new
mar
kets
the
iden
tific
atio
n of
new
mar
kets
(SL
Rs .1
0 M
illio
n).
for e
lect
roni
c pr
oduc
ts a
nd c
ompo
nent
s.●
Esta
blis
h an
info
rmat
ion
bure
au to
gat
her a
nd d
isse
min
a te
mar
ket i
nfor
mat
ion
amon
gel
ectr
onic
pro
duct
and
com
pone
nt m
anuf
actu
rers
.●
Crea
te a
fund
ing
mec
hani
sm to
exp
lore
mar
ket p
oten
tials
iden
tifie
d by
the
abov
e tw
opo
ints
.●
Set u
p a
serv
ice
bure
au to
pro
vide
mar
ketin
g ex
pert
ise
to e
lect
roni
c pr
oduc
t and
com
pone
nt m
anuf
actu
rers
.
A8
Esta
blis
h an
d st
reng
then
des
ign
serv
ice
prov
ider
s in
●Pr
ovid
e fin
anci
al s
uppo
rt to
the
priv
ate
sect
or to
est
ablis
h de
sign
ser
vice
s fo
rel
ectr
onic
circ
uit d
esig
n, d
ie a
nd m
ould
des
ign
and
elec
tron
ic c
ircui
t des
ign.
rapi
d pr
otot
ypin
g (S
L Rs
. 10
Mill
ion)
.●
Prov
ide
tax
conc
essi
ons
to d
esig
n se
rvic
e pr
ovid
ers.
●St
reng
then
rapi
d pr
otot
ypin
g fa
cilit
ies
at U
nive
rsity
of M
orat
uwa.
●St
reng
then
die
and
mou
ld fa
cilit
ies
at U
nive
rsity
of M
orat
uwa.
A9
Esta
blis
h su
ppor
ting
indu
strie
s ca
pabl
e of
●Pr
ovid
e fin
anci
al s
uppo
rt to
the
priv
ate
sect
or to
com
men
ce p
reci
sion
pla
stic
and
man
ufac
turin
g pr
ecis
ion
plas
tic a
nd m
etal
met
al c
ompo
nent
s.co
mpo
nent
s fo
r the
ele
ctro
nics
indu
stry
.●
Prov
ide
tax
conc
essi
on to
pre
cisi
on p
last
ic a
nd m
etal
com
pone
nt m
anuf
actu
rers
.
A10
Prom
ote
the
esta
blis
hmen
t of l
inks
with
fore
ign
bran
d●
Use
act
iviti
es o
f A4
to p
rom
ote
OD
M.
man
ufac
ture
rs to
con
side
r Sri
Lank
a as
a s
uita
ble
●U
se a
ctiv
ities
of A
5 to
pro
mot
e O
DM
.de
stin
atio
n fo
r OD
M, i
nste
ad o
f con
trac
t man
ufac
turin
g.●
Use
act
iviti
es o
f A7
to p
rom
ote
OD
M.
A11
Prom
ote
the
esta
blis
hmen
t of l
inks
with
fore
ign
bran
d●
Use
act
iviti
es o
f A7
to p
rom
ote
links
with
fore
ign
bran
d m
anuf
actu
rers
to m
arke
t Sri
man
ufac
ture
rs to
mar
ket S
ri La
nka
bran
ds fo
r nic
heLa
nkan
bra
nds.
mar
kets
whe
re fo
reig
n br
and
man
ufac
ture
rs a
re n
otpr
ovid
ing
any
serv
ices
.
A12
Prom
ote
the
esta
blis
hmen
t of s
ubsi
diar
ies
to p
rom
ote
●Pr
ovid
e fin
anci
al a
ids
to e
stab
lish
subs
idia
ries.
Sri L
anka
n br
ands
.●
Prov
ide
tax
conc
essi
on to
com
pani
es w
ho e
stab
lish
fore
ign
subs
idia
ries.
Tabl
e 9:
(co
ntin
ued)
Act
ion
(bu
dg
et r
equ
ired
)P
rop
ose
d A
ctiv
itie
s