Does Defining More Anchors on Behaviorally Anchored Rating Scales Increase Rater
Accuracy in Employment Interviews?
by
Mary Iseral
A Thesis Submitted in Partial Fulfillment of the Degree of Master of Arts on Industrial/Organizational Psychology
Middle Tennessee State University
May 2020
Thesis Committee:
Dr. Mark Frame, Advisor
Dr. Michael Hein, Committee Member
Dr. David Urban, Critical Reader

ii
ii
ACKNOWLEDGMENTS
First, I would like to thank my advisor, Dr. Mark Frame, for putting so much time
and effort into helping me complete this thesis. You pushed me to become a better
researcher and provided the support I needed along the way. I would also like to thank
my committee member, Dr. Hein, for answering my endless data analysis questions.
Thank you to my critical reader, Dr. Urban, for providing valuable insight from the start.
Thank you to Roxanne Covington for volunteering to be the actress for the interview
videos. Even with the limited time to rehearse, you did a great job.
I would also like to thank my wonderful mentee, Kelsey Byerly for assisting me
along the way. You ensured I had all of the help I needed and I greatly appreciate it.
Thank you to my family for the constant words of encouragement throughout this
process. Lastly, I want to thank Mattie Stremic for always being there to listen and
provide advice. I could not have finished this thesis or graduate school without your
friendship and support.
iii
iii
ABSTRACT
While the use of behaviorally anchored rating scales for employee selection has
been researched in the past, little research has been conducted regarding how many
anchors should include behavioral descriptions on BARS. This study sought to determine
if including five examples on BARS would increase rater accuracy when compared to
BARS with three examples. Participants were recruited from Amazon’s Mechanical Turk
(MTurk). Participants viewed videos of a person interviewing for a professor position at a
university and then rated the respondent’s answers. The results demonstrated that BARS
with five examples result in less over and under ratings on employment interviews when
compared to three example BARS. There were no other significant differences in
accuracy between three example BARS and five example BARS.
iv
iv
TABLE OF CONTENTS LIST OF TABLES..............................................................................................................v
CHAPTER I: INTRODUCTION AND LITERATURE REVIEW...........................6Behaviorally Anchored Rating Scales................................................................................6Employment Interviews....................................................................................................12Structured Interviews.......................................................................................................13Structured Interviews Using Behavioral Interview Items................................................14Structured Interviews Using Situational Interview Items................................................15Measuring Employment Interview Performance..............................................................16Accuracy...........................................................................................................................18Behaviorally Anchored Rating Scales and Accuracy........................................................21Participants.......................................................................................................................24Measures...........................................................................................................................25Procedure..........................................................................................................................27
CHAPTER III: RESULTS.......................................................................................32
CHAPTER IV: DISCUSSION.................................................................................36Limitations and Future Research.....................................................................................38Conclusion.........................................................................................................................39
References................................................................................................................41
APPENDICES..........................................................................................................45APPENDIX A: INTERVIEW QUESTIONS....................................................................46APPENDIX B: MANIPULATION CHECK QUESTIONS..............................................54APPENDIX C: BARS INSTRUCTIONS..........................................................................56APPENDIX D: IRB APPROVAL.....................................................................................57

v
v
LIST OF TABLES Table 1. Conditions for Random Assignment ................................................................... 28Table 2. Expert Ratings for Question 1 ............................................................................ 29Table 3. Expert Ratings for Question 2 ............................................................................ 29Table 4. Expert Ratings for Question 3 ............................................................................ 30Table 5. Expert Ratings for Question 4 ............................................................................ 30Table 6. Expert Ratings for Question 5 ............................................................................ 31Table 7. Expert Ratings for Question 6 ............................................................................ 31

6
CHAPTER I: INTRODUCTION AND LITERATURE REVIEW Hiring the right people for the job and determining how well employees are
performing are two persistent challenges that employers face. Organizations may fail to
meet goals and objectives and can face significant challenges if they do not hire the right
people for the job. Additionally, organizations may lose talented employees (and retain or
reward low performing employees) if they are measuring performance poorly. While
performance management should be an essential part of all companies, some do it well
and some don’t do it at all. Moreover, there is no set one-best method that can be used
across all organizations and in some cases the same process is not viable for different
jobs within an organization. Similarly, organizations have varied methods of selecting
employees. Research has found that standardized selection and performance
measurement methods are superior to unstandardized methods. One standardized method
that has been found to produce accurate results is by using behaviorally anchored rating
scales.
Behaviorally Anchored Rating Scales Behaviorally anchored rating scales (BARS) are “an observation-rating system
that provides data for the assessment of estimates of accuracy for individual raters”
(Bernardin & Smith, 1981, p. 458). In other words, BARS provide a means for rating the
participant being observed, and the data collected using BARS can be analyzed to assess
the accuracy of raters using the system. BARS were first created by Smith and Kendall in
1963 with the initial purpose of identifying behaviors that could be discussed with the
person being rated. Behaviorally anchored rating scales were developed not only to

7
standardize the rating process, but also the observation process because the observation
process will impact the rating process (Bernardin & Smith, 1981). In the years that
followed their initial development, BARS have been used for performance evaluations
(Hauenstein, Brown, & Sinclair, 2010) and in structured interview processes (Kell et al.,
2017).
BARS are formatted as a continuous graphic rating scale that are often arranged
vertically (Smith & Kendall, 1963). Behavioral descriptions are typically set along the
vertical scale. The behavioral descriptions are used as anchors to define levels of
performance, usually ranging from poor to excellent performance. The raters observe the
participant’s behavior and then rate the participant’s performance using the anchors
provided. The ratings can be compared among raters to see if there is agreement on the
ratings. BARS use work behaviors which are combined to create performance dimensions
that can be utilized to group ratings of performance. BARS can also be used in selection
procedures by rating an applicant’s structured interview responses on the scale. BARS
provide an explicit definition and a consistent frame of reference for each aspect of
performance (DeNisi & Murphy, 2017). BARS are not all identical in format, some have
more dimensions that are defined and some have limited definitions for the anchors.
Additionally, research has not determined any best practices regarding having a set
number of anchors to be used in BARS.
BARS are often developed using a five step process, delineated by Schwab,
Heneman, and DeCotiis (1975). The first is step is to identify the critical incidents related
to the position of job, which involves having subject matter experts identify examples of
effective and ineffective performance (Flanagan, 1954). Critical incidents can be

8
identified by observing the job or conducting interviews with subject matter experts. The
second step is to classify the critical incidents into performance dimensions. To
accomplish this, the critical incidents are reduced to a smaller set of overall performance
dimensions that serve as the anchors for the behavioral descriptions on the BARS. A
panel of subject matter experts can be used to narrow down the incidents. The third step
is retranslations, which involves having a different group of experts reallocate the
incidents into the performance dimensions. An incident will be retained if fifty to eighty
percent of the group assigns it to the same performance dimension as the group from step
two (Schwab, Heneman, & Decotiis 1975). The fourth step in the process is to scale the
incidents. The individuals rate the behaviors on a scale ranging from ineffective
performance to effective performance. The individuals then average the ratings for each
incident, which identifies the degree to which the incident represents performance on a
dimension (Schwab, Heneman, & Decotiis 1975). The standard deviation of the ratings
for each incident is also calculated. The standard deviation represents the degree of
agreement among raters (Schwab, Heneman, & Decotiis 1975). A lower standard
deviation represents greater agreement among raters. The last part of step four is to set a
standard deviation criterion that is used to identify which incidents will be kept in the
final scale. Schwab, Heneman, and Decotiis (1975) noted that critical incidents that have
a standard deviation of 1.50 or less are retained in the final scale. The last step is to
finalize the BARS instrument. A subset of the incidents that were kept during
retranslation and that met the standard deviation criterion are then used as the behavioral
anchors on the scale. The finished BARS will contain a sequence of vertical scales

9
anchored by the critical incidents. Given all of this, it is no wonder that Prien et al. (2009)
point out that BARS can be time and labor intensive to develop.
As mentioned above, identifying the critical incidents of the job is essential to
creating BARS. The critical incident technique was explained by Flanagan in 1954 and
has since been a common method for rating performance. Flanagan (1954) described the
technique as “a set of procedures for collecting direct observations of human behavior in
such a way as to facilitate their potential usefulness in solving practical problems and
developing broad psychological principles” (Flanagan, 1954, p. 327). Observers identify
how certain behaviors can be used to resolve problems. The observations of behavior can
be used to see what incidents are critical to the job. The incidents can be any observable
behavior that can be used to make inferences about future behavior. Flanagan explained
that for an incident to be critical it must take place in a clear situation and the impact of
the incident should be unambiguous. Not all incidents that occur classify as critical to the
job. The critical incidents provide a basis for what the different levels of performance are
and how to identify each level.
Schwab, Heneman, and DeCotiis (1975) note that many of the critical incidents
identified in step one are often lost in steps three through five. The loss of incidents may
be due to those incidents being reallocated to a smaller set of performance dimensions.
When the dimensions are being narrowed down, certain incidents do not make it into the
set anchors. Another potential issue is that the criteria of performance may not have been
set stringently enough to accomplish the set goals (Schwab, Heneman, & DeCotiis 1975).
It is important for the BARS to contain the adequate levels of performance needed. The
last issue the researchers identified is that the final BARS instrument may not provide the
10
unambiguous examples of performance that the BARS developers had hoped for
(Schwab, Heneman, & DeCotiis 1975). The BARS will be more effective if the
performance examples are clear to raters.
In addition to identifying the steps of creating a BARS instrument, Schwab,
Heneman, and DeCotiis (1975) also identified the hypothesized advantages of using
BARS. The development of BARS provides an advantage over other rating methods in
that BARS uses subject matter experts to generate the performance dimensions. The
experts have extensive knowledge of the job and can provide valuable information.
Additionally, the retranslation step ensures that the critical incidents chosen are the most
accurate for the performance dimension (Schwab, Heneman, & DeCotiis 1975). The
experts must come to agreement about whether the incident should be included in the
performance dimension.
Another advantage to using BARS is that research has found BARS yields less
leniency error when compared to summated rating techniques (Campbell et al., 1973).
Kinicki, Bannister, and Hom (1985) concluded in their research that BARS not only
yields less leniency error, but also less halo error than the summated rating scale. Benson,
Buckly, and Hall (1988) found that BARS yield more accurate results than a mixed
standard scale. As previously mentioned, Campbell et al. (1973) confirmed that BARS
yield less error than other rating methods in their research. Burnaska and Hollmann’s
(1974) results had contradicting findings and they concluded that the format of the rating
scale does not have a significant impact on the outcomes.
A question that arises when examining BARS is how many anchors on the scale
should include behavioral descriptions. Some scales only describe the best behaviors and

11
the unacceptable behaviors. Others include descriptions of very effective behaviors,
average behaviors, and ineffective behaviors. To date, however, researcher has not fully
examined the impact that the number of anchors might have on the psychometric
properties and accuracy of the ratings provided using BARS. Lissitz and Green (1975)
used a Monte Carlo approach to examine at the number of points on a Likert rating scale
and the impact it has on reliability. They found that reliability levels off near the 5-point
mark. They did not research how many of the anchors on the scale should be defined.
Kell et al. (2017) explained that satisfactory behaviors should also be included in BARS
rather than just highly effective and ineffective. These findings support the idea that more
research needs to be conducted to decide exactly how many anchors should be defined on
the scale.
Hauenstein, Brown, and Sinclair (2010) investigated the missing middle anchor
problem in relation to BARS. They focused more on why BARS are missing the middle
mark rather than what the impact of the missing BARS has on accuracy. They found that
in the early stages of developing BARS, the focus is on good and bad behaviors rather
than on average behaviors. They also noted that agreement is often lower for examples of
average performance. They did conclude that defining more dimensions will lead to more
accurate ratings. Smith and Kendall (1963) researched whether operationally defining the
anchors has an impact. They found that unambiguous anchors do in fact improve the
accuracy of ratings. This finding provides evidence that defining more anchors with
unambiguous terminology could improve the accuracy of the ratings.
As mentioned previously, BARS are commonly used for both performance
measurement and employment interviews. In the latter use, employers can use BARS to

12
ensure that their selection interview processes are job relevant, reliable, fair, and meet
legal requirements (Kell et al., 2017).
Employment Interviews
Employment interviews are one of the most common ways that organizations
screen potential new employees. Pettersen and Durivage (2008) explained that the four
criteria for an effective selection interview are reliability, validity, legal defensibility, and
the candidates’ positive reactions. Most interviewers do not take these criteria into
consideration when interviewing employees. Instead, many interviewers rely on personal
judgements rather than standardized methods. Graves and Karren (1996) found that many
interviewers are basing their selection decisions on the different factors than one another.
They observed how 29 different recruiters at the same company evaluated applicants for
customer service positions. The recruiters used five different criteria (interpersonal skills,
communication skills, education, work experience, and motivation) to evaluate
applicants. The recruiters had thirteen different ways of using those criteria to judge
applicants. Even when the recruiters used the same factors, they ranked the importance of
each factor differently. This is likely to occur when interviewers do not discuss what the
hiring goals are beforehand. They also noted that many interviewers’ hiring standards
varied, leading to differences in selection decisions. Interviews are a critical part of the
selection process, therefore organizations should be concerned about conducting them in
the most effective manner. One way to ensure that interviews not only are effective but
are also compliant with the law is to conduct structured interviews.

13
Structured Interviews
Structured interviews consist of standardized questions in which all applicants are
asked. In a structured interview, the interviewers follow a standardized protocol and
make sure all participants are given the same or similar experiences. Many employers use
structured interviews in order to have a more successful and reliable selection process
that is perceived as more fair by applicants. Structured interviews have been found to
produce more valid and reliable results when compared to unstructured interviews
(Kataoka,Latham,&Whyte, 1997). Additionally, structured interviews have been found
to have higher validities in predicting job performance (Kell et al., 2017). In a meta-
analysis conducted by Wright, Lichtenfels, and Pursell (1989), the results showed that
structured job interviews were better at predicting job performance than unstructured
interviews. Conducting structured interviews allows for compliance both with the law
and with organizational policies (Pettersen & Durivage, 2008). Organizations may be
legally permitted to use unstructured interview methods, but using structured interview
methods is much easier to defend if legally challenged. Additionally, many candidates
have more positive reactions to interviews when they perceive the questions as fair and
relevant (Pettersen & Durivage, 2008). Structured interviews include standardized
questions and procedures, whereas unstructured interviews may use questions and
processes that have not been predetermined and can vary from candidate to candidate.
The standardized questions should be job relevant and can be derived from the job
analysis. Campion, Pursell, and Brown (1988) note that having a job analysis as the basis
of the interview questions provides legal defensibility. After the questions have been
developed, the next step is to ask all of the candidates the same questions (Campion,
14
Pursell, & Brown 1988). By asking all the candidates the same questions, the interviewer
is ensuring fairness.
One way to rate a structured interview is to use a behaviorally anchored rating
scale. The applicants are asked behavioral or situational questions and then rated on a set
scale. BARS can also be used to evaluate structured situational interview questions. The
use of BARS in structured interviews can increase the reliability and validity of scores
(Kell et al., 2017). Reilly, Bocketti, and Wennet (2006) noted in their research that the
use of BARS in structured interviews can potentially decrease bias against protected
groups. BARS can be used to rate both behavioral and situational interview items.
Structured Interviews Using Behavioral Interview Items Behavioral interview items (or behavioral questions) involve asking participants
about previous on the job behavior. They are very common in most organizations’
interview process. Motowidlo et al. (1992) explain in their research the process of
structured behavioral interviews and why they are implemented in organizations.
Structured behavioral interviews are based on the job analysis conducted using critical
incidents. The questions are based on behavioral dimensions that were identified by the
critical incidents. The behavioral questions are standardized and each participant is asked
the same set of questions. The interviewees are asked to explain how they handled
previous work related situations. The goal is to identify past behavior that could predict
future performance. The responses are then evaluated on a standard scale, often BARS.
Research has found that job performance can be predicted from structured behavioral
interviews (Motowidlo et al., 1992). One issue with behavioral questions, however is that
an applicant with limited experience may have limited examples of past behaviors to

15
report in such an interview even though the applicant might be capable of performing the
job. However, Pulakos and Schmitt (1995) noted in their research that interviewers were
likely to discuss past behaviors outside of their current job. The interviewees discussed
behaviors from past school and social events.
Structured Interviews Using Situational Interview Items
Situational interview items (or situational questions) are similar to behavioral
interviews, except the interviewer is not asking about past behaviors. The interviewees
are presented with hypothetical situations that are related to the job (Oostrom et al.,
2016). This allows the interviewers to get an idea about how the participant would handle
potential issues that may arise on the job. Situational questions allow the interviewer to
assess how a candidate may perform tasks that they have not had performed previously or
to determine how an applicant might perform in a situation they haven’t experienced
before. As such situational interviews may be better measures of assessing the potential
of an applicant to perform a job they have never done by allowing them to provide a
hypothetical response (Pulakos & Schmitt, 1995). Oostrom et al. (2016) noted that
situational interviews are one of the most criterion valid interview techniques, but may
lack construct validity. Using situational interviews in additional to other testing
procedures, such as an assessment center, could improve the validity of the selection
process (Latham et al., 1980). Having more than one testing procedure allows for the
interviews to get a well-rounded view of the applicant.
Latham et al. (1980) described the likely rationale as to why situational interviews
are effective. The first reason is that the interview questions are derived from a job
analysis, which makes them job relevant. This not only allows to interviews to see how

16
the applicant responds to work related questions, but also provides legal defensibility.
Second, having the job related questions increases the face validity of the interview. This
will likely result in a positive reaction in the applicants. The third reason is that using an
anchoring scale to rate the responses increases interobserver reliability and validity.
Lastly, the selection instrument is based on overt employee behavior rather than on traits.
The structured situational interviews can also be evaluated using BARS.
Measuring Employment Interview Performance
While BARS provide a useful tool for raters to use when evaluating an applicant’s
performance in a job interview, that tool must be used by raters who must evaluate and
score the applicants responses. Borman (1978) delineated a three step process to evaluate
performance that raters can use to guide their process. Step one involves observing the
employees’ behavior. Step two is to then evaluate the behavior that was observed. The
third step is to weigh the evaluations and decide on a single rating. Smith and Kendall
(1963) explain that equivalence among raters and interpretation are the two most critical
demands of rating performance. Equivalence among raters occurs when all ratings among
the different raters are comparable. Interpretation, as explained by Smith and Kendall
(1963), is when raters are forced to make decisions about what the anchors mean and how
they relate to actual behavior.
Although BARS are helpful in rating an applicant’s responses in an employment
interview, there is no guaranteed method to avoid rater errors. Rater errors have been
defined as errors in judgement that can occur when one person observes another (Latham,
Wexley, & Pursell, 1975). Murphy and Cleveland explain that the presence of rater errors
suggests that the ratings are inaccurate, whereas the absence of errors indicate accurate

17
ratings. Rater error is not the only source of inaccurate ratings, but it does play a
significant role. DeNisi and Murphy (2017) note that main types of rater error are halo,
leniency, severity, central tendency, and range restriction.
Borman (1978) identified the four prominent issues that can occur when raters are
rating performance – all of which may occur when raters rate applicants’ employment
interview responses. The first issue is that raters do not always have an ample amount of
opportunity to observe the ratees’ behaviors, which can lead to inaccurate ratings. A
second issue is that raters are not always aware of the potential rating errors they may be
committing and may not have experience in rating performance (Borman, 1978). Without
having previous knowledge or experience, the raters are less likely to know how to avoid
making errors. A third issue is that the rating format of performance appraisal can also be
problematic if not done correctly (Borman, 1978). Raters need to ensure that they are
using the most accurate rating scale as possible. Some formats make it difficult to assign
the observed work behaviors to a specific point on a rating scale. The behaviorally
anchored rating scale can help overcome this issue, because the scale is based off of
critical work incidents. The behavior being observed can be compared to the critical
incidents that make up the performance dimensions. Lastly, the fourth issue is there are
organizational constraints that arise when rating performance. Borman (1978) explains
that raters often base the evaluations on organizational demands rather than employee
performance.
When measuring the performance of applicants in employment interviews, it is
important to ensure that the ratings provided are accurate. Having the right performance
measurement tool in place will not be sufficient if the ratings produced are not accurate.
18
Raters need to be informed of the potential rating errors that could influence ratings and
how to obtain accurate scores.
Accuracy
When dealing with rating scales, it is essential that the raters have an
understanding of what accuracy is and how to obtain accurate ratings. Accuracy has been
defined as the degree to which ratings are relevant to or correlated with true criterion
scores (Dunnette & Borman, 1979 p.488). A significant amount of the research on
accuracy revolves around the classical test theory. The classical test theory was described
by Charles Spearman in 1904 and has been used to explain how true test scores can be
used to predict future scores for the same item or population (McMahon, 2019). The
theory involves the formula “X=T+e” with X as the observed score, T as the true score,
and e as error (McMahon, 2019). In order to use this formula, one must understand what
a true score is and what the potential errors are that could impact the observed score.
When measuring accuracy using classical test theory, all measures require the
direct comparison of ratings obtained from a single rater to the true scores (Sulksy &
Balzer, 1988). Allen and Yen (1978) defined true scores as the mean of an infinite
number of scores across parallel measures of a test. True scores have also been defined in
terms of the expected value one would obtain from a specific population (Murphy &
Cleveland, 1995, p. 209). True scores can be obtained in numerous ways. One method is
to use the average of the scores provided by all subjects or raters (Sulksy & Balzer,
1988). Another option is to average the ratings of previously scales written incidents
included as information in ratees’ performance profile (1988). The last method proposed
by Sulksy and Balzer (1988) is to use a group of expert raters to prove the true scores.

19
Smither, Barry, and Reilley (1989) supported the use of expert raters serving as a valid
measure of true scores in their research.
There are many different methods to assess accuracy and they are impacted by
numerous types of rating error. The two main categories of accuracy error are
distributional errors and process errors. Distributional errors are errors that occur when
the rater is predominantly utilizing one portion of the scale (i.e. low end of the scale, the
middle of the scale, or the high end of the scale). These errors impact all ratees. Process
errors are errors in the interaction between the rater and the ratee. All of the methods to
assess accuracy measures compare the raters’ scores against the true scores to see how
much they differ.
Some examples of distributional errors include leniency error, severity error,
central, and tendency error. Leniency measures indicate whether the ratings are lenient or
severe. If ratings are too lenient, then the ratings will be higher than deserved. If the
ratings are too severe, then the ratings given are lower than deserved. A potential way to
identify leniency is if the mean ratings are high (Kingstrom & Bass, 1981). The issue
with identifying leniency in that manner is that researchers define high ratings differently.
One possible way to mathematically measure leniency is by subtracting the rater’s rating
from the true score rating (Sulksy & Balzer, 1988). Central tendency error occurs when
raters distribute all ratings around the middle anchor avoiding the extreme ends of the
scale (Jacobs, Kafry, & Zedeck, 1980). Logical error takes place when raters rate
dimensions that seem logically related the same (Jacobs, Kafry, & Zedeck, 1980). Raters
are unable to distinguish dimensions from one another.

20
Process errors relate to the interaction the rater has with the individual ratee.
Some examples include halo, negative halo, recency error, primacy error, and similar to
me error. Halo error occurs when raters give the same or similar score to an individual on
all dimensions due to an overall impression on one dimension (Jacobs, Kafry, & Zedeck,
1980). Halo error has also been defined as “the influence of a rater’s general impression
on ratings of specific rate qualities” (Lance, LaPointe, & Stewart, 1994, p. 339). Positive
halo is when all of the ratings given are high. Negative halo occurs when all of the ratings
tend to be low. Recency error occurs when the rater is considering more recent
performance rather than all of the performance that is supposed to be measured
(Lunenburg, 2012). Additionally, primacy error occurs when the rater is only considering
performance or information from early on. Similar-to-me error occurs when raters give
individuals higher scores if they perceive them as similar to themselves (Jacobs, Kafry, &
Zedeck, 1980).
Researchers have analyzed how to improve accuracy and reduce error. Borman
(1979) explained that training raters can reduce rater errors. Borman (1979) found that
showing raters a video regarding halo error was successful in reducing error. Reducing
rater error alone does not necessarily increase accuracy (Murphy & Balzer, 1989). Other
forms of error may still impact the level of accuracy. Murphy and Balzer (1989) tested
the effects of reduced rater error by analyzing the correlation between rater error and rater
accuracy. They found that the traditional interpretation of rater error measures as indirect
indicators of accuracy was unjustified. Therefore, the researchers noted that error scores
should not be used to predict accuracy. Raters should be trained on how to reduce error,
but that alone will not guarantee the results are fully accurate. Bernardin and Pence

21
(1980) noted that for rater training to be effective, it should focus on showing raters how
to observe more accurately rather than on how to or how not to rate. Borman (1979)
stated that training focused on standardizing the observation of behavior can help
increase interrater agreement leading to higher accuracy.
Accuracy is an essential aspect to rating scales. If the scale does not produce
accurate ratings, it is of no value. As previously discussed, BARS have been shown to
increase accuracy of ratings. An important question that arises is whether BARS is the
superior rating method in increasing accuracy of ratings.
Behaviorally Anchored Rating Scales and Accuracy
Numerous studies have found that behaviorally anchored rating scales yield more
accurate ratings. Tziner and Kopelman (2002) noted that BARS are superior in promoting
performance improvement and worker development. They attribute this to the fact that
BARS provide precise measures. As previously mentioned, Benson, Buckley, and Hall
(1988) concluded that BARS yields more accurate ratings than a mixed standard scale.
The results were constant throughout both of their studies. Alternatively, some research
studies have found that BARS is not a more accurate rating method. Kingstrom and Bass
(1981) compared BARS to other rating scales and did not find any one method to be
superior. Kinicki, Bannister, and Hom (1985) also concluded that BARS offers no clear
advantage over other rating formats in terms of accuracy and errors. While the results on
whether BARS is the superior method is mixed, researchers have concluded that BARS is
an effective rating method.
As stated previously, the optimal number of anchors defined on BARS has not
been researched in depth. If defining all five anchors on BARS could increase accuracy,

22
there is potential for BARS to become the superior rating method. If BARS are the
superior rating method, organizations could use them to hire the right people and
accurately measure performance. This leads to the following hypotheses:
Hypothesis 1: BARS with five examples will be more accurate in scoring interview
responses than BARS with three examples.
Hypothesis 1a: BARS with five examples will result in higher scale alphas on
employment interview ratings than BARS with three examples.
Hypothesis 1b: BARS with five examples will result in lower absolute differences
between on employment interview ratings and true score estimates than BARS
with three examples.
Hypothesis 1c: BARS with five examples will result in raters having less over
rating and under rating (as compared to true score estimates) on their employment
interview ratings than BARS with three examples.
RQ 1: Are there differences in the scale alphas of the ratings provided based upon
behavioral interview questions and situational interview questions?
RQ 1a: Are there differences in the scale alphas on employment interview ratings
of behavioral interviews evaluated with BARS with three examples compared to
BARS with five examples?
RQ 1b: Are there differences in the scale alphas on employment interview ratings
of situational interview questions evaluated with BARS with three examples
compared to BARS with five examples?
RQ 2: Do accuracy estimates (absolute value and over-under ratings) vary for ratings
provided based upon behavioral interview questions and situational interview questions?

23
RQ 2a: Do accuracy estimates (absolute value and over-under rater) vary for
employment interview ratings of behavioral interview questions evaluated with
BARS with three examples compared to BARS with five examples?
RQ 2b: Do accuracy estimates (absolute value and over-under rater) vary for
employment interview ratings of situational interview questions evaluated with
BARS with three examples BARS compared to BARS with five examples?
24
CHAPTER II: METHOD
The study was a within and between group design to assess the accuracy of
employment interview ratings on a computerized assessment. The study used videos as
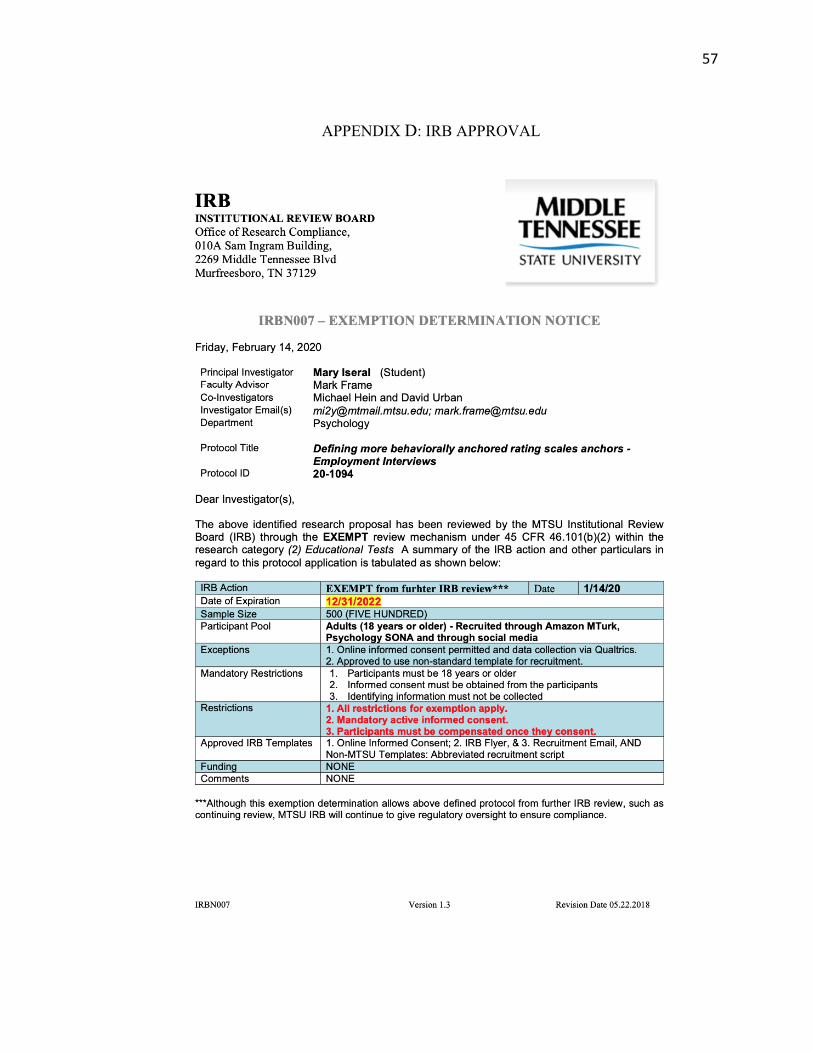
stimulus material for the participants. The research was conducted in accordance with the
Middle Tennessee State University Institutional Review Board.
Participants The participants were recruited utilizing Amazon’s Mechanical Turk (MTurk).
MTurk is an online platform that allows researchers to obtain data from a large pool of
individuals. Researchers posted requests for participants to complete a Human
Intelligence Task (HIT) for a set monetary payment. By recruiting from MTurk, the
researchers were able to collect information from people with a wide variety of
backgrounds.
Approximately 181 participants began the study. However, only the participants
who passed the manipulation check process were included in this analysis. To pass the
manipulation check process, participants had to answer five out of the six manipulation
check questions correctly. This cutoff was very stringent because in the present study it
was critical for participants to attend to the stimulus. The final number of participants
included was 59 (32 men, 26 women, and 1 that did not identify a gender). The ages
ranged from 20 to 70 years old. The most frequently reported ethnicity was
Caucasian/White (73.3%), followed by African/American Black (8.3%), those that did
not identify an ethnicity (5%), Hispanic/Latina (3.3%), and Biracial/Multiracial (3.3%).
Majority of respondents were employed full time (71.7%). The most frequently reported
degree obtained was Bachelor’s degree (35%), followed by high school diploma (33.3%),

25
Associate’s degree (21.7%), Master’s degree (6.7%), and Doctorate (1.7%). The 59
participants were randomly assigned to one of the two BARS conditions with 29
participants in the three level BARS condition and 30 in the five level BARS condition.
Measures MTurk participants were directed to the study by clicking a web link and
completing an on-line consent form before beginning the research study. After consenting
to participate in the study, they were directed to begin the study on-line.
Participant Information Questionnaire
Participants were asked to respond to questions at the beginning of the survey
regarding their education and college experience. Other questions related to their current
and previous employment. Additional questions were used to assess participants’
knowledge and experience with interviewing and with behaviorally anchored rating
scales. They were asked if they had been interviewed previously or if they had
interviewed someone in the past. They were asked if they had used behaviorally anchored
rating scales for any purpose previously. Participants were told that based upon their
responses, they had been selected to participate in a study examining how best to hire
University professors.
Behaviorally Anchored Rating Scales
Using a method similar to the one described previously, behaviorally anchored
rating scales (BARS) were created by the researchers based upon the situational interview
questions and behavioral interview questions used as stimulus, the script provided to the
“actor” in the stimulus materials, and the actor’s actual performance in the stimulus
materials.

26
For each question, the performance dimension assessed was defined as five levels
of performance. For each performance level, exemplars of performance for the interview
question were described and be provided as anchors for the appropriate level.
The BARS developed were used for all conditions but were modified as described
below in some instances.
BARS with Three Anchors
The BARS created by the researchers consisted of five anchors were modified to
have the anchors for level 2 and 4 removed creating three anchor BARS. The three
anchors defined were for ineffective, average, and effective responses. The resulting
BARS were used to rate situational interview questions and behavioral interview
questions.
Manipulation Check Items
For each of the scales, there were manipulation check questions to ensure
participants paid attention to the items and to the applicant’s responses to the interview
questions. The manipulation check items asked questions about what the applicant said in
the video. Each participant, regardless of the condition, received these questions.
Demographic Questionnaire
At the end of the study, participants were asked to respond to demographic
questions. These questions focused on participants’ age, religious affiliation, gender,
sexual orientation, and ethnicity. Participants were provided with a debriefing statement
and asked to not discuss the study with their peers or others that may be participants for
the study.

27
Procedure
Researchers conducted a pretest with a sample of students. Prior to conducting the
study, the researchers created videos as stimulus material. The videos involved an actor
answering both situational and behavioral interview questions. The questions were
generated by the researchers. The researchers provided the actor with a script for a
response to each question. The actor signed a release form prior to filming and was
briefed on the purpose and plan of the study. The researchers developed BARS for the
questions to be evaluated, as discussed previously in the measures section.
The participants were recruited from Amazon’s Mechanical Turk (MTurk). They
were first asked demographic questions. After the demographic questions, the online
survey platform randomly assigned the participants to one of the two conditions (three
example BARS and five example BARS). See Table One. Participants in each condition
viewed a set of instructions regarding the purpose of BARS and how BARS are used.
Participants watched the videos of an actor answering interview questions. Each
participant viewed six videos. After watching each video, participants rated the interview
response on one of the behaviorally anchored rating scales (BARS). After the rating the
video on the BARS, they were asked to rate the candidate’s overall performance on a
Likert scale. After rating the actor’s response to each question, participants were given
manipulation-check questions to ensure they are paying attention to the items. At the end
of the survey, participants were asked to complete the demographic questions.
Participants were asked to enter a code for compensation to be awarded for their
participation.

28
Table 1 Conditions for Random Assignment Condition 1 Condition 2 Behavioral Questions 3 Anchored BARS 5 Anchored Bars Situational Questions 3 Anchored BARS 5 Anchored Bars
Expert Ratings
True score estimates provided the basis for several of the evaluation criteria used
in this study. The videos were viewed and rated by expert raters to obtain true score
estimates for each question. The true score estimates were obtained in a manner similar to
recommendations provided by Sulsky and Balzer (1988). Two highly experienced
assessors thoroughly familiar with the rating task, the rating scales, and the actor’s script
were selected to serve as expert raters. The expert raters calibrated their ratings by
viewing the videos and reaching consensus regarding effective and ineffective
performance (Keown-Gerrard & Sulsky, 2001; Sulsky & Balzer, 1988).
The expert raters viewed all 6 videos in accordance with the recommendations of
Sulsky and Balzer (1988). Each expert rater individually rated each participant’s
performance in the exercise and were in consensus on the ratings. These expert ratings
were produced under optimal conditions (Murphy & Cleveland, 1995, p. 290). The expert
raters were allowed as much time as needed for observation and rating.
The expert raters were individuals who are highly experienced with both
interviews and with behaviorally anchored rating scales. The expert ratings can be seen in
Table Two. The participants’ ratings were compared to the expert ratings in order to
obtain accuracy scores. Additionally, the absolute differences between ratings were

29
compared. There was a reliability estimate for the situational with three examples defined
scale, one for the situational with five examples scale, one for the behavioral with three
examples defined scale, and one for the behavioral with five anchors defined scale. This
allowed the researchers to not only compare participants to the experts, but also to one
another.
Table 2 Expert Ratings for Question 1 Question 1: Tell me about a situation in which you had to manage your time to meet multiple deadlines.
Rating
Please rate the candidate’s ability to plan 2
Please rate the candidate's ability to plan for the unexpected 2
Please rate the candidate's ability to meet multiple deadlines 2
Please rate the candidate's overall response to the interview question 2
Table 3 Expert Ratings for Question 2 Question 2: Tell me about a time when you had to deal with an issue of academic integrity or academic dishonesty.
Rating
Please rate the candidate’s ability to uphold integrity 3
Please rate the candidate's ability to prioritize integrity 3
Please rate the candidate's ability to handle academic dishonesty 3
Please rate the candidate's overall response to the interview question 2

30
Table 4 Expert Ratings for Question 3 Question 3: Tell me about a time you had to work with a colleague that you did not see eye to eye with
Rating
Please rate the candidate’s ability to work with others 5
Please rate the candidate's ability to communicate with colleague 4
Please rate the candidate's ability to problem solve 4
Please rate the candidate's overall response to the interview question 4
Table 5 Expert Ratings for Question 4 Question 4: How would you incorporate technology into your classes to improve students' ability to learn course content?
Rating
Please rate the candidate’s ability to adapt 4
Please rate the candidate's ability to collaborate 3
Please rate the candidate's ability to action plan 3
Please rate the candidate's overall response to the interview question 3

31
Table 6 Expert Ratings for Question 5 Question 5: What would you do if you found out that one of your peers was violating University policies regarding sexual harassment?
Rating
Please rate the candidate’s ability to solve ethical dilemmas 4
Please rate the candidate's ability to handle private information 3
Please rate the candidate's ability to enforce rules and policies 3
Please rate the candidate's overall response to the interview question 3
Table 7 Expert Ratings for Question 6 Question 5: How would you handle conflict between two students? Rating
Please rate the candidate’s ability to manage conflict 2
Please rate the candidate's ability to maintain control in the classroom 3
Please rate the candidate's ability to communicate with the students 2
Please rate the candidate's overall response to the interview question 2

32
CHAPTER III: RESULTS
Descriptive statistics and frequency counts were calculated for all qualitative
questions related to the participants’ demographic information. To answer the hypotheses
and the research questions, a series of descriptive statistics, Fisher R to Z correlation
transformations and z tests, between-subject’s MANOVAs, and repeated measures within
subjects MANOVAs were computed to determine the accuracy differences between three
and five example BARS. The results were analyzed for both the composite ratings and
the overall ratings for each question. The absolute differences as well as over rating and
under ratings were calculated using the expert rater scores. Additionally, the scale alphas
for the three example BARS and the five example BARS, as well as for the situational
and behavioral items, were compared.
Hypothesis 1: stated that BARS with five examples will be more accurate in scoring
interview responses than BARS with three examples.
Hypothesis one was first tested by comparing the scale alphas on employment
interview ratings between the BARS with three examples and the BARS with five
examples. The scale alphas were calculated for each scale and compared between the
three example BARS participants and the five example BARS participants. The BARS
with five examples did not result in higher scale alphas on employment interview ratings
when compared to the BARS with three examples. The results were nonsignificant for
both composite ratings, z = 1.179, p > .05, and for the overall ratings, z = .396, p > .05.
The results do not support hypothesis 1a.
Hypothesis one was then tested by comparing the absolute difference between on
employment interview ratings and true score estimates between BARS with three
33
examples and BARS with five examples. A between subjects MANOVA was conducted
to test whether BARS with five examples resulted in lower absolute difference between
on employment interview ratings and true score estimates than BARS with three
examples. The results were nonsignificant for the composite ratings, F(6, 52) = 1.808, p
= .116. The results were also nonsignificant for the overall ratings, F(6, 52) = 1.139, p
= .353. Therefore, hypothesis 1b was not supported.
Lastly, hypothesis one was tested by comparing the amount of over rating and
under rating (as compared to true score estimates) on their employment interview ratings
between BARS with three examples and BARS with five examples. A between subjects
MANOVA showed that BARS with five examples did result in raters having less over
rating and under rating on their employment interview ratings than BARS with three
examples for the composite ratings, F(6, 52) = 3.725, p = .004. However, the results were
nonsignificant for the overall ratings, F(6, 52) = 2.134, p = .065. Hypothesis 1c was
supported for composite ratings but not for overall (single item) ratings.
RQ 1: Are there differences in the scale alphas of the ratings provided based upon
behavioral interview questions and situational interview questions?
Scale alphas were calculated for the situational and behavioral items and
compared between the three example BARS participants and the five example BARS.
The BARS with five examples did not result in higher scale alphas on employment
behavioral interview ratings than BARS with three anchors for overall ratings, z = .503,
p > .05. However, the BARS with five examples’ scale alphas were significantly higher
than the BARS with three examples for the behavioral composite ratings z = .133, p
< .05. The BARS with five examples did not result in higher scale alphas on employment
34
situational interview ratings than BARS with three anchors for overall ratings, z = .149,
p > .05 or for composite ratings, z = .338, p > .05.
RQ 2: Do accuracy estimates (absolute value and over-under ratings) vary for
ratings provided based upon behavioral interview questions and situational
interview questions?
A repeated measures within subjects MANOVA was conducted to see whether
accuracy estimates (absolute value and over-under rater) vary for employment interview
ratings of behavioral interview questions compared between BARS with three examples
and BARS with five examples. The results showed no significant differences in the
accuracy of overall ratings for behavioral questions, F(1,58) = .378, p = .541 or for the
composite ratings, F(1,58) = 2.667, p = 1.08. Additionally, the results showed no
significant differences in the accuracy of overall ratings for situational questions, F(1,57)
= .247, p = .621 or for the composite ratings, F(1,57) = 1.471, p = .230.

35
Table 8 Fisher’s r to z Outcome variable: Rater accuracy Scale r of 3
examples r of 5 examples
n of 3 examples
n of 5 examples
Fisher’s z
Overall interview items .673 .609 29 30 .396
Composite interview items
.494 .214 29 30 1.179
Overall behavioral items
.503 .403 29 30 .459
Composite behavioral items
.133 -.422 29 30 2.125
Overall situational items .419 .512 29 30 -.433
Composite situational items
.338 .437 29 30 -.427
Bolded z values are significant at p<.05

36
CHAPTER IV: DISCUSSION Previous research has focused on whether BARS are a more accurate way to rate
employment interview when compared to other methods, such as Likert scales. The
present study sought to determine whether using three or five anchors on BARS has an
impact of the accuracy of ratings. The results of this study show that defining additional
anchors on BARS does have a significant effect on the accuracy of composite ratings
generated from BARS ratings.
Hypothesis one stated that BARS with five examples will be more accurate in
scoring interview responses than three example BARS. The hypothesis was broken down
to investigate whether BARS with five examples would result in higher scale alphas,
lower absolute differences, and less over rating and under rating (as compared to true
score estimates) on their employment interview ratings than BARS with three examples.
The results showed that the ratings from the three examples BARS were not significantly
different compared to the five example BARS in regards to scale alphas and absolute
differences. BARS with five examples did result in raters having less over rating and
under rating on their employment interview ratings than BARS with three examples for
the composite ratings. This significant finding suggests that defining five BARS will
produce the most accurate results in employment interviews. Over and under ratings on
employment interviews can lead to either hiring someone who is not qualified or failing
to hiring a qualified candidate. By using five example BARS, the interview ratings will
be closer to what the candidates’ true interview performance scores are.
In addition to testing the hypotheses, the researchers also analyzed two research
questions. The first research question investigated whether there are differences in the

37
scale alphas of the ratings provided based upon behavioral interview questions and
situational interview questions. The results of the study showed that BARS with five
examples’ scale alphas were significant higher than the three example BARS for the
behavioral composite ratings. The BARS with five examples’ scale alphas were not
found to be significantly higher for the situational questions. This suggests that when
using behavioral questions, using five example BARS will lead to more accurate results
compared to three example BARS.
The second research question investigated whether accuracy estimates (absolute
value and over-under ratings) vary for ratings provided based upon behavioral interview
and situational interview questions. The results show that the accurate estimates do not
vary by the type of interview question (behavioral or situational). The accuracy estimates
also do not vary for each type of question based on whether the BARS had three or five
examples.
Theoretical Implications
With the lack of research comparing the number of examples needed on
behaviorally anchored scales, the present study provides a deeper understanding of how
to best create BARS for employment interviews. The results showed that when
comparing the scale alphas of three and five example BARS, there were no significant
differences. However, there was a significant difference between the two when the scale
was broken down into only behavioral items. Future research could investigate the
interactions between the number of BARS examples and the question type. The
participants did not receive rater training before rating the videos. Future research could
investigate whether giving raters training beforehand impacts the two significant findings

38
from this study. The data from this study could also be analyzed to see if the composite
ratings on the BARS scales results in more accurate results when compared to overall
summated ratings scales. Previous research that claims behaviorally anchored rating
scales are more accurate than summated rating scales (Campbell et al., 1973; Kinicki,
Bannister, and Hom, 1985). This was not the focus of this study, but the data could be
used to investigate whether the BARS were more accurate than the summated rating
scales.
Practical Implications
While the results of the study were not what the researchers hypothesized, there
are still relevant practical implications of the results. Two out of the three accuracy
assessments were found to be nonsignificant. However, there was a significant finding
between three example BARS and five example BARS in the differences in over and
under ratings. This is important for practitioners to be aware of because using three
example BARS could lead to qualified candidates being under rated and not getting hired.
It could also lead to unqualified candidates being hired. It is beneficial for practitioners to
take the extra steps to define all five examples on BARS in order to increases rating
accuracy. Hiring managers strive to produce ratings as close to the true score as possible,
and that is more likely to be done through using five example BARS. The results also
showed that five example BARS result in higher scale alphas for behavioral composite
ratings. If practitioners are using behavioral questions in the employment interviews, five
BARS should be used in order to have the most accurate results.
Limitations and Future Research

39
One concern of this study is that the manipulation check items significantly
decreased the total number of participants. Many of the MTurk participants did not pass
five out of six manipulation checks. The first manipulation check had two answers that
could have been perceived to be correct. Due to this, the participants did not have to pass
this check to be included in the analysis. The other manipulation check answers did not
appear to have multiple right answers, which is why the participants had to get at least
five correct to be included in the analysis. The participants were not proctored while
completing the study, so they may not have been paying close attention. Having the
participants complete the study in a proctored setting may increase the number of
participants who pass the manipulation check items. The participants were not required to
stay on the video page for the entirety of the video. This posed a limitation because
participants could skip through the videos without finishing viewing it. As previously
mentioned, future research could investigate the interactions between the number of
BARS examples and the question type. Future research could also investigate whether
giving raters training beforehand leads to less over and under rating on BARS with three
examples than BARS with five examples.
Conclusion BARS are a commonly used rating tool that organizations use in employment
interviews. Past research has concluded that using BARS can increase rating accuracy
(Campbell et al., 1973; Kinicki, Bannister, & Hom, 1985; Benson, Buckley, & Hall,
1988). This study found differences in accuracy ratings in employment interviews
between BARS with three examples and BARS with five examples. Most BARS only
include the lowest, middle, and highest examples, but the researchers wanted to see of
40
adding two more examples would increase accuracy. The study concluded that the
accuracy differences between three and five example BARS are in the over and under
composite ratings. The scale alphas and absolute differences were not significantly
different between the three example BARS and the five example BARS. While only one
accuracy estimate improved by using five example BARS, that is still sufficient evidence
that defining additional examples produces more accurate ratings. The study showed that
when comparing the accuracy of the composite ratings for behavioral questions, five
example BARS are more accurate than three example BARS. The interaction between the
question type and number of BARS examples should be further investigated. Researchers
should continue to study how to best conduct employment interviews so organizations
can continuously improve their hiring processes and ensure the right person is hired for
the job.

41
References Allen, M. J., & Yen, W. M. (1979). Introduction to measurement theory. Monterey, Calif.: Brooks/Cole Pub. Co., 1979. Benson, P. G., Buckley, M. R., & Hall, S. (1988). The impact of rating scale format on rater accuracy: an evaluation of the mixed standard scale. Journal of Management, 14(3), 415. Bernardin, H. J., & Pence, E. C. (1980). Effects of rater training: Creating new response sets and decreasing accuracy. Journal of Applied Psychology, 65, 60–66. doi:10.1037/0021-9010.65.1.60. Bernardin, H. J., & Smith, P. C. (1981). A clarification of some issues regarding the development and use of behaviorally anchored ratings scales (BARS). Journal of Applied Psychology, 66(4), 458–463. doi:10.1037/0021-9010.66.4.458. Borman, W. C. (1978). Exploring upper limits of reliability and validity in job performance ratings. Journal of Applied Psychology, 63(2), 135–144. doi:10.1037/0021-9010.63.2.135. Borman, W. C. (1979). Format and training effects on rating accuracy and rater errors. Journal of Applied Psychology, 64(4), 410–421. doi:10.1037/0021-9010.64.4.410. Burnaska, R. F., & Hollmann, T. D. (1974). Empirical comparison of relative effects of rater response biases on three rating scale formats. Journal of Applied Psychology, 59, 307– 312. doi:10.1037/h0036536. Campbell, J. P., Dunnette, M. D., Arvey, R. D., & Hellervik, L. V. (1973). The development and evaluation of behaviorally based rating scales. Journal of Applied Psychology, 57(1), 15222. doi:10.1037/h0034185. Campion, M. A., Pursell, E. D., Brown, B. K. Structured interviewing: Raising the psychometric properties of the employment interview. (1988). Personnel Psychology, 41(1), 25. DeNisi, A. S., & Murphy, K. R. (2017). Performance appraisal and performance management: 100 years of progress? Journal of Applied Psychology, 102(3), 421–433. doi:10.1037/apl0000085. Dunnette, M. D., & Borman, W. C. (1979). Personnel selection and classification systems. Annual Review of Psychology, 30(1), 477. doi:10.1146/annurev.ps.30.020179.002401.

42
Flanagan, J. C. (1954). The critical incident technique. Psychological Bulletin, 51(4), 327–358. doi:0.1037/h0061470. Garner, W. R. (1960). Rating scales, discriminability, and information transmission. Psychological Review, 67(6), 343–352. doi:10.1037/h0043047. Graves, L. M., & Karren, R. J. (1996). The employee selection interview: A fresh look at an old problem. Human Resource Management (Wiley), (2), 163. Hauenstein, N., Brown, R. D., & Sinclair, A. L. (2010). BARS and those mysterious, missing middle anchors. Journal of Business and Psychology, 25(4), 663. Hom, P. W., DeNisi, A. S., Kinicki, A. J., & Bannister, B. D. (1982). Effectiveness of performance feedback from behaviorally anchored rating scales. Journal of Applied Psychology, 67(5), 568–576. Jacobs, R., Kafry, D., & Zedeck, S. (1980). Expectations of behaviorally anchored rating scales. Personnel Psychology, 33(3), 595–640. doi:10.1111/j.1744- 6570.1980.tb00486.x. Kataoka, H. C., Latham, G. P., & Whyte, G. (1997). The relative resistance of the situational, patterned behavior, and conventional structured interviews to anchoring effects. Human Performance, (1), 47. doi:10.1207/s15327043hup1001_3. Kell, H. J., Martin-Raugh, M. P., Carney, L. M., Inglese, P. A., Chen, L., & Feng, G. (2017). Exploring methods for developing behaviorally anchored rating scales for evaluatingstructured interview performance. Research Report. ETS RR-17-28. ETS Research Report Series. Keown-Gerrard, J. L., & Sulsky, L. M. (2001). The effects of task information training
and frame-of-reference training with situational constraints on rating accuracy. Human Performance, 14(4), 305-320.
Kingstrom, P. O., & Bass, A. R. (1981). A critical analysis of studies comparing behaviorally anchored rating scales (BARS) and other rating formats. Personnel Psychology, 34(2), 263–289. doi:10.1111/j.1744-6570.1981.tb00942.x. Kinicki, A. J., Bannister, B. D., & Hom, P. W. (1985). Behaviorally anchored rating scales vs. summated rating scales: Psychometric properties and susceptibility to rating bias. Educational & Psychological Measurement, 45, 535–549. Lance, C. E., LaPointe, J. A., & Stewart, A. M. (1994). A test of the context dependency of three causal models of halo rater error. Journal of Applied Psychology, 79(3), 332–340.

43
Latham, G. P, Saari, L. M., Pursell, E. D., & Campion, M. A. (1980). Situational interview. Journal of Applied Psychology, 65, 422–427. Doi:10.1037/0021- 9010.65.4.422. Lissitz, R. W., & Green, S. B. (1975). Effect of the number of scale points on reliability: A Monte Carlo approach. Journal of Applied Psychology, 60(1), 10–13. doi:10.1037/h0076268. Lunenburg, F. (2012). Performance appraisal: Methods and rating errors. International Journal of Scholarly Academic Intellectual Diversity, 14(1), 1-9. McMahon, M. (2019). Classical test theory. Salem Press Encyclopedia. Motowidlo, S. J., Carter, G. W., Dunnette, M. D., Tippins, N., Werner, S., Burnett, J. R., & Vaughan, M. J. (1992). Studies of the structured behavioral interview. Journal of Applied Psychology, 77(5), 571–587. Murphy, K. R., & Balzer, W. K. (1989). Rater errors and rating accuracy. Journal of Applied Psychology, 74(4), 619. Murphy, K. R., & Cleveland, J. (1995). Understanding performance appraisal: social, organizational, and goal-based perspectives. Sage Publications. Murphy, K. R., & Pardaffy, V. A. (1989). Bias in behaviorally anchored rating scales: Global or scale-specific? Journal of Applied Psychology, 74(2), 343. Oostrom, J., Melchers, K., Ingold, P., & Kleinmann, M. (2016). Why do situational interviews predict performance? Is it saying how you would behave or knowing how you should behave? Journal of Business & Psychology, 31(2), 279–291. doi.org/10.1007/s10869-015-9410-0. Pettersen, N., & Durivage, A. (2008). The Structured Interview: Enhancing Staff Selection. Québec: Presses de l’Université du Québec. Prien, E. P., Goodstein, L. D., Goodstein, J., Gamble, L. G. (2009). A practical guide to job analysis. San Francisco, CA. Pulakos, E. D., & Schmitt, N. (1995). Experience-based and situational interview questions: Studies of validity. Personnel Psychology, 48(2), 289–308. Reilly, N. P., Bocketti, S. P., Maser, S. A., & Wennet, C. L. (2006). Benchmarks affect perceptions of prior disability in a structured interview. Journal of Business and Psychology, (4), 489. doi:10.1007/s10869-005-9005-2.

44
Schwab, D. P., Heneman, I. H. G., & DeCotiis, T. A. (1975). Behaviorally anchored rating scales: A review of the literature. Personnel Psychology, 28(4), 549–562. doi:10.1111/j.1744-6570.1975.tb01392.x. Shapira, Z., & Shirom, A. (1980). New issues in the use of behaviorally anchored rating scales: Level of analysis, the effects of incident frequency, and external validation. Journal of Applied Psychology, 65(5), 517–523. doi:10.1037/0021- 9010.65.5.517. Smith, P. C., & Kendall, L. M. (1963). Retranslation of expectations: An approach to the construction of unambiguous anchors for rating scales. Journal of Applied Psychology, 47, 149–155. Smither, J. W., Barry, S. R., & Reilly, R. R. (1989). An investigation of the validity of expert true score estimates in appraisal research. Journal of Applied Psychology, 74(1), 143–151. doi:10.1037/0021-9010.74.1.143. Sulsky, L. M., & Balzer, W. K. (1988). Meaning and measurement of performance rating accuracy: Some methodological and theoretical concerns. Journal of Applied Psychology, 73(3), 497–506. doi:10.1037/0021-9010.73.3.497. Tziner, A., & Kopelman, R. E. (2002). Is there a preferred performance rating format? A non-psychometric perspective. Applied Psychology-London-Lawrence Erlbaum Associates Then Psychology Press, (3), 479. doi:10.1111/1464-0597.00104. Wright, P. M., Lichtenfels, P. A., & Pursell, E. D. (1989). The structured interview: Additional studies and a meta-analysis. Journal of Occupational Psychology, 62(3), 191–199. Zedeck, S., Imparato, N., Krausz, M., & Oleno, T. (1974). Development of behaviorally anchored rating scales as a function of organizational level. Journal of Applied Psychology, 59(2), 249–252. doi:10.1037/h0036521.

45
APPENDICES

46
APPENDIX A: INTERVIEW QUESTIONS
1. Tell us about a situation in which you had to manage your time to meet multiple
deadlines.

47
2. Tell us about a time when you had to deal with an issue of academic integrity or
academic dishonesty. What was the outcome of the situation?

48
3. Tell us about a time you had to work with a colleague that you did not see eye to eye
with.

49
4. Tell us about a time you had to work with a colleague that you did not see eye to
eye with.

50

51
5. What would you do if you found out that one of your peers was violating
University policies regarding sexual harassment?

52

53
6. How would you handle conflict between two students?

54
APPENDIX B: MANIPULATION CHECK QUESTIONS Question 1:
Question 2:
Question 3:
55
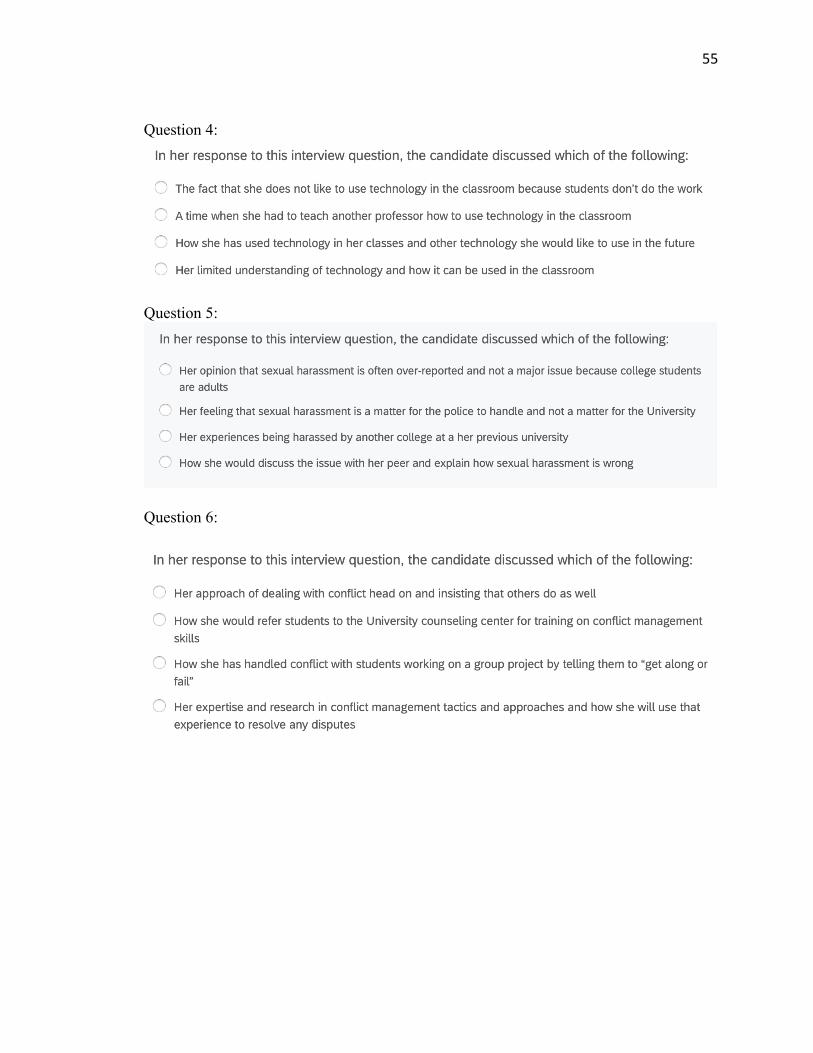
Question 4:
Question 5:
Question 6:

56
APPENDIX C: BARS INSTRUCTIONS
Behaviorally Anchored Rating Scales Are rating scales that provide more information than traditional performance rating scales.
• Behaviorally Anchored Rating Scales provide examples or exemplars of good and bad performance.
• Behaviorally Anchored Rating Scales give raters behavioral examples for each rating level to help guide the ratings.
• Using Behaviorally Anchored Rating Scales, the rater picks the behavior that comes closest to describing the performance of the person being rated.
57
APPENDIX D: IRB APPROVAL

58

59
Recommended