Sandia National Laboratories is a multi-program laboratory managed and operated by Sandia Corporation, a wholly owned subsidiary of Lockheed
Martin Corporation, for the U.S. Department of Energy’s National Nuclear Security Administration under contract DE-AC04-94AL85000.
Joshua S. Stein, Ph.D.
Sandia National Laboratories, Albuquerque, NM IEA PVPS Task 13 Workshop
1 October, 2013 Paris, France

Outline
Introduce the PV Performance Modeling Collaborative History, website, tools, coming
Review highlights of the 2nd PV Performance Modeling Workshop (May 2013 in Santa Clara, CA)
Ideas for Next Steps
2

PV Performance Modeling Collaborative Started after 1st PV Performance Modeling Workshop (Albuquerque, NM,
Sept. 2010)
PV performance modeling lacked organization.
Accurate information about algorithms, validation data, best practices difficult to find and access.
PVPMC.org started to provide an information hub on PV performance modeling
Model agnostic, focus on algorithms, methods, data, etc.
Detailed Modeling Steps (online textbook)
Modeling function library in Matlab (PV_LIB)
Member contact list, document library, bibliography, glossary, blog, events, …
2nd PV Performance Modeling Workshop (Santa Clara, CA, May 2013)
PVPMC and IEA PVPS Task 13 share many goals and can work together.
“The overall objective of Task 13 is to collect and communicate data that will help to improve the operation, the reliability and, thus, the electrical and economic output of PV systems and subsystems.”
3
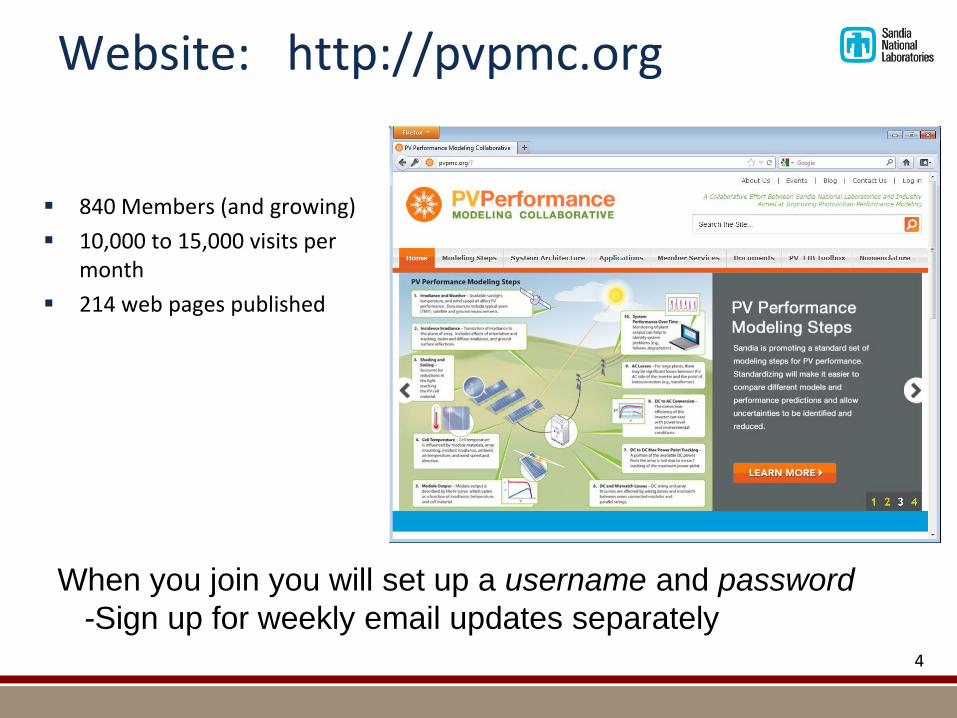
Website: http://pvpmc.org
4
When you join you will set up a username and password
-Sign up for weekly email updates separately
840 Members (and growing)
10,000 to 15,000 visits per month
214 web pages published

5

Standard Modeling Steps Irradiance and Weather
Definitions and Overview
Sun Position Solar Position Algorithm (SPA)
Simple models
Sandia’s code
Irradiance and Insolation Extraterrestrial radiation
Air Mass
Direct Normal Irradiance – DISC Model
– DIRINT Model
Global Horizontal Irradiance
Diffuse Horizontal Irradiance
Spectral Content – AM 1.5 Standard Spectrum
Satellite derived data
Weather Observations Air Temperature
Wind Speed and Direction
Precipitation
Air Pressure
Irradiance Data Sources for Performance Modeling National Solar Radiation Database
Typical Meteorological Years
Site-Specific Data
Measure Correlate Predict
Irradiance Modeling
Uncertainty and Variability Characterization of Irradiance Variability
– Interannual variability
– Short-term variability
– Spatial variability
Clear Sky Irradiance models
Incident Irradiance Definitions and Overview
Array Orientation Fixed tilt
Single Axis Tracking – 1-Axis Horizontal Roll
– 1-Axis Tilted Roll
– 1-Axis Equatorial
Two-Axis Tracking – 2-Axis Azimuth-Elevation
– 2-Axis Polar
– 2-Axis Tilt-Roll
Array Orientation Errors – Effect of Array Tilt Errors
– Effect of Array Azimuth Errors
Plane of Array (POA) Irradiance Measuring POA Irradiance
Calculating POA Irradiance – POA Beam
– Angle of Incidence
– POA Ground Reflected
» Albedo
– POA Sky Diffuse
» Isotropic Sky Diffuse Model
» Simple Sandia Sky Diffuse Model
» Hay Sky Diffuse Model
» Reindl Sky Diffuse Model
» Perez Sky Diffuse Model
Concentrators
POA Irradiance Uncertainty and Validation
Shading, Soiling, and Reflection Losses Definitions and Overview
Shading Far Shading
Near Shading
Soiling and Snow Soil Monitoring Studies
Snow Effects
Incident Angle Reflection Losses Physical Model of IAM
ASHRAE Model
Martin and Ruiz IAM Model – Soiling effects on Incident Angle Losses
Sandia Model
Cell Temperature Definitions and Overview
Module Temperature Thermocouple
Voc method
Sandia Module Temperature Model
Faiman Module Temperature Model
Cell temperature Sandia Cell Temperature Model
PVsyst Cell Temperature Model
Transient Cell Temperature Models
Module IV Curve Definitions and Overview
Effective Irradiance Spectral Mismatch
Single Diode Equivalent Circuit Models De Soto “Five-Parameter” Module Model
PVsyst Module Model
Point-value models Sandia PV Array Performance Model
Loss Factor Model
PVWatts – Improvements to PVWatts
DC and Mismatch Losses Definitions and Overview
Module IV Curves
String IV Curves String Mismatch Losses
Array IV Curves Array Mismatch Losses
DC Wiring Losses
Uncertainty and Validation Studies
Maximum Power Point Tracking Definitions and Overview
Array Utilization
MPPT Voltage
MPPT Efficiency
MPPT Algorithms
Uncertainty and Validation
DC to AC Conversion Definitions and Overview
Inverter Efficiency CEC Inverter Test Protocol
Operating Temperature
Sandia Inverter Model
Driesse Inverter Model
Inverter Saturation
Loss of Grid
Advanced Inverter Features Power Factor Control
Uncertainty and Validation
AC Losses Definitions and Overview
AC Wiring Losses
Transformer Losses
PV System Output Definitions and Overview
PV System Monitoring Monitoring Equipment
Data Filtering
Data Filling
PV Performance Metrics Performance Ratio
Performance Index
Annual Yield
PV Systems Operations and Maintenance
Definitions and Overview
Availability
Failure Mode and Rates
References
6

Example Model Description
7
Brief description
Equation support
Hyperlinking
Link to PV_LIB functions
References
Contributor info
We are looking for additional models and process descriptions

Modeling Steps: Areas Needed for Contributions
Tracking, backtracking models
Shading models and effect on performance
Soiling (and cleaning) models
Module IV parameter estimation methods
Degradation models / processes
MPPT algorithms
Monitoring standards
System Architecture (component and design descriptions)
Applications (model reviews, features, case studies, validation)
Much more………………………….
8
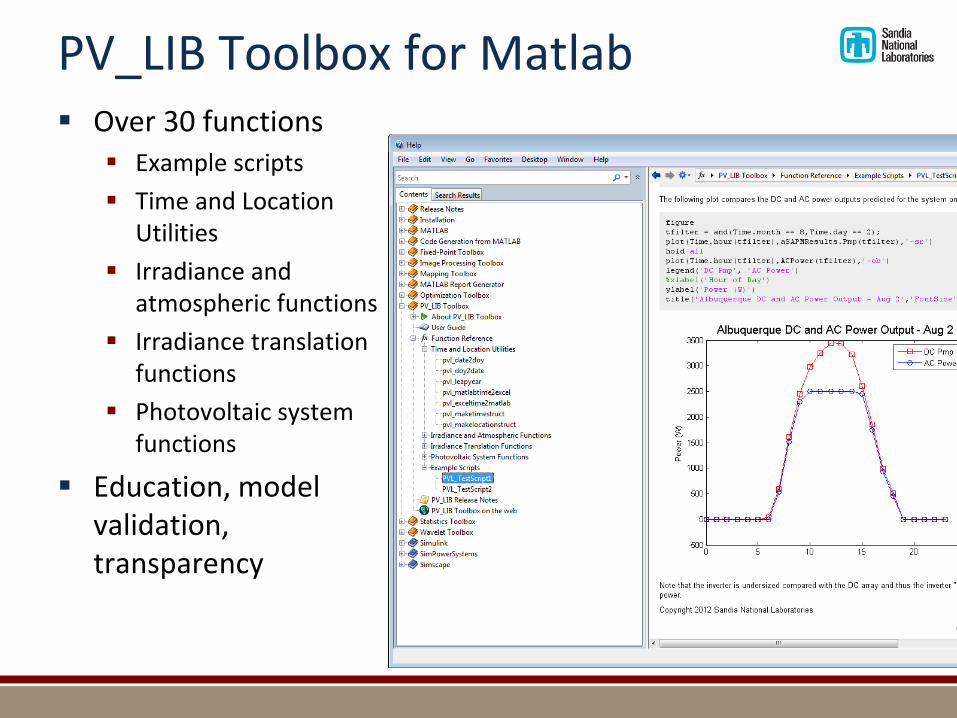
PV_LIB Toolbox for Matlab Over 30 functions
Example scripts
Time and Location Utilities
Irradiance and atmospheric functions
Irradiance translation functions
Photovoltaic system functions
Education, model validation, transparency
9

New Features!
http://wiki.pvpmc.org/ (New in Summer 2013) This was a request at the 2nd PV Performance Modeling Workshop
Platform to collaboratively develop content for the main site.
Provides a collaboration area for working groups to develop standards
Account requests will be made online.
Equations, files, flowchart navigation
PV_LIB to GitHub and offered in Python! (Fall-Winter 2013) Python is free, large user base, similar features to Matlab
Provide easy way to submit library functions and deliver updates (using GitHub).
10

2013 PV Performance Modeling Workshop http://pvpmc.org/home/2013-pv-performance-modeling-workshop/
Topical Sessions: PV Module Models (Coefficient generation)
PV System Performance Models (updates on new features)
Solar Resource Data (focus on uncertainty vs. variability)
Systems Losses and Derates (standard definitions are needed)
Performance Degradation (field data and modeling studies)
Modeling for the Real World (Existing models still have significant limitations, but these represent opportunities! Data sets are being collected that can help).
Feedback from Participants (survey results): Topics for next workshop:
Most votes: Solar resource, Inverters, dynamic performance (subhourly)
Best practices guides are needed (system monitoring, modeling guides)
Development of test data and case studies for illustrating analysis methods 11
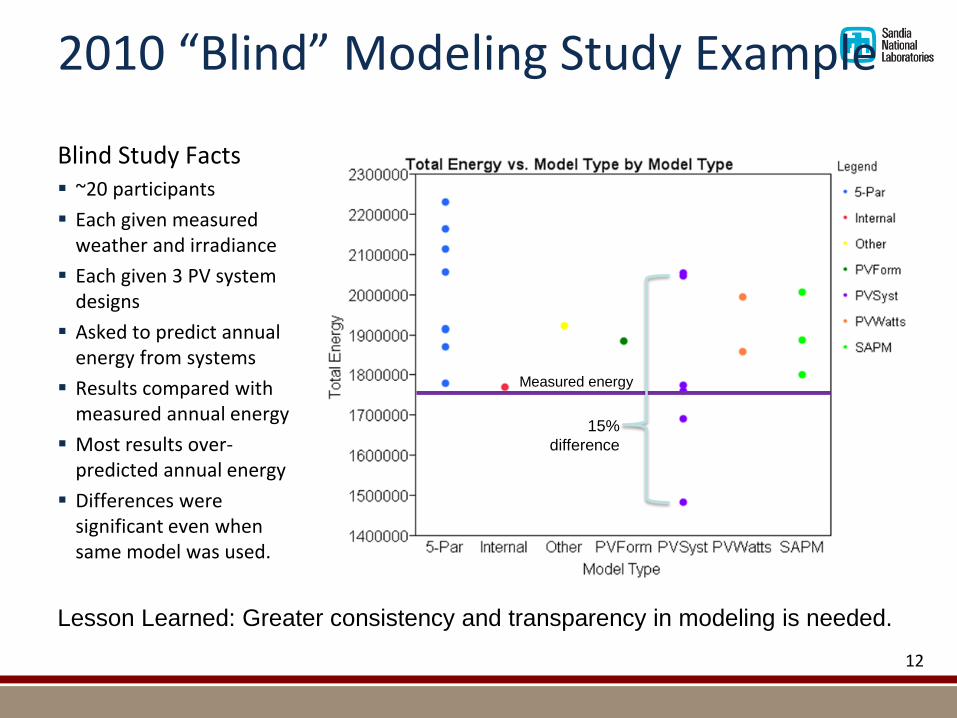
2010 “Blind” Modeling Study Example
Blind Study Facts ~20 participants
Each given measured weather and irradiance
Each given 3 PV system designs
Asked to predict annual energy from systems
Results compared with measured annual energy
Most results over-predicted annual energy
Differences were significant even when same model was used.
12
15%
difference
Measured energy
Lesson Learned: Greater consistency and transparency in modeling is needed.

2013 “Blind” IV-Coefficient Estimation
Exercise led by Cliff Hansen (Sandia National Laboratories)
IV curves from two modules (A&B) were provided (range of irradiance and temperatures)
7 Participants estimated module coefficients for CEC and PVsyst models.
Module A included IV curves measured at Sandia’s outdoor test facility
Module B was made up by using the single diode model to forward calculate IV points.
13
Module A (STC) Module B (STC)
Parameter results vary but are the differences significant?

2013 “Blind” IV-Coefficient Estimation Pmp over a range of irradiance and temperature conditions shows
differences between 1%-2%.
These differences are due to both the method used of estimate parameters and the choice of model (PVsyst or CEC).
These differences demonstrate that there is still room for improvement and standardization of analysis methods to estimate performance coefficients. 1-2% variation is enough to influence the choice of module for a large project.
14
0 10 20 30 40 50 60 70
0
1
2
3
4
5
6
7
Voltage (V)
Curr
ent
(A)
Predicted IV Curves away from STC
Ee = 1100, Tc = 75C
Ee = 800, Tc = 40C
Ee = 400, Tc = 25C
0 5 10 15 20 25 30 35 40 45 50
0
1
2
3
4
5
6
7
Voltage (V)
Curr
ent
(A)
Predicted IV Curves away from STC
Ee = 1100, Tc = 75C
Ee = 800, Tc = 40C
Ee = 400, Tc = 25C
Module A Module B
Summary Performance modeling is a key part of PV project bankability.
Currently many models and analysis methods are still opaque.
Uncertainty with data and methods remains significant.
PV Performance Modeling Collaborative provides a venue to Document PV performance modeling methods and practice.
Build an international PV performance modeling community
Share methods and tools needed for model validation
Establish PV performance modeling as a “discipline” and train future practitioners.
“Task 13 aims at being a platform for collecting, providing and exchanging international information on the reliability [and performance] of PV systems.” The PV Performance Modeling Collaborative can contribute to this
mission. 15

Thank You!
http://solar.sandia.gov
http://PV.sandia.gov
http://pvpmc.org
http://www.IEA-PVPS.org
16
Recommended