Construction and Building Materials 23 (2009) 2586–2592
Contents lists available at ScienceDirect
Construction and Building Materials
journal homepage: www.elsevier .com/locate /conbui ldmat
Evaluation of permanent deformation of unmodified and SBS modified asphaltmixtures using dynamic creep test
Ali Khodaii, Amir Mehrara *
Department of Civil Engineering, Amirkabir University of Technology, Tehran, Iran
a r t i c l e i n f o a b s t r a c t
Article history:Received 10 May 2008Received in revised form 5 February 2009Accepted 6 February 2009Available online 16 March 2009
Keywords:Permanent deformationDynamic creep testCreep curve modelSBS polymer
0950-0618/$ - see front matter � 2009 Elsevier Ltd. Adoi:10.1016/j.conbuildmat.2009.02.015
* Corresponding author. Tel.: +98 021 77535815.E-mail addresses: [email protected] (A. Khodaii
Mehrara).
Recent researches show that there is a serious need for more accurate methods to evaluate polymer mod-ified asphalt mixtures. In this research, dynamic creep test was conducted on unmodified and SBS mod-ified samples, using UTM25 machine to this end. During this work it was attempted to compare thepermanent deformation potential of the coarse graded mixtures with dense graded mixtures. Havingdetermined the type of gradation with lower permanent deformation, the amount of polymer to improvethe mechanical behavior of the samples made with this type of gradation was investigated. Finally thecreep behavior of the samples was estimated by the Zhou three-stage creep model. Based on the obtainedresults, dense graded mixtures had higher permanent deformation susceptibility than coarse graded mix-tures. Moreover, 5% of SBS polymer had better effect on improvement of permanent deformation resis-tance than 4% and 6%. The mathematical models of creep curves showed that lower stress levels indynamic creep test can not show the real behavior of asphalt mixtures and particularly the modifiedmixtures.
� 2009 Elsevier Ltd. All rights reserved.
1. Introduction
Because of asphalt’s visco-elastic properties, its mechanicalbehavior depends on its ambient temperature. On accounts ofthe fact that its viscosity falls by a rise in temperature, asphalt bin-der becomes softer and more susceptible to adopt permanentdeformation. Permanent deformation is a major contributor to rut-ting in wheel tracks.
In recent years, different kinds of polymers have been used tomodify properties of asphalt mixtures, among them SBS is one ofthe most widely used which can extremely improve the mechani-cal properties of asphalt mixtures [1]. So far various methods havebeen used to identify the effectiveness of polymers in modificationof asphalt mixtures. These methods can generally be categorized inthe following three groups:
1. Methods that evaluate physical and mechanical properties ofpolymers [2].
2. Methods that evaluate physical and mechanical properties ofpolymer modified asphalts [2–4].
3. Methods that evaluate physical and mechanical properties ofpolymer modified asphalt mixtures [5–7].
ll rights reserved.
), [email protected] (A.
Khattak et al. [8] believe in formation of fibrils in PMA mixtureswhich seems to make the mechanical behavior of these mixturesmore complicated than conventional mixtures. Bahia et al. [9]demonstrated that for evaluating the performance of polymermodified asphalt binders, tests should be conducted on PMA as-phalt mixtures to provide a reasonable expectation of the perfor-mance of the polymer in mixture. It seems that among thementioned types of testing methods the third group has the high-est accuracy. In this research; therefore, dynamic creep tests,which have high capability to estimate the permanent deformationsusceptibility of asphalt mixtures according to researchers [10],were performed on modified and unmodified mixtures usingUTM25 machine.
2. Background
Rutting is defined as the progressive accumulation of perma-nent deformation of each layer of the pavement structure underrepetitive traffic loading [7]; however, asphalt layer has a remark-able role in its magnitude [11,12].
Permanent deformation in pavements has long been recognizedto include two different modes according to Huang [13] and Gok-hale et al. [6]. The first mode is known as compactive deformation(consolidation of layers) and the second mode is plastic deforma-tion (asphalt shear flow). In the former mode, the deformed surfaceis lower than the initial pavement surface, and occurs in the wheelpath. In the later mode, the deformed surface is higher than the

A. Khodaii, A. Mehrara / Construction and Building Materials 23 (2009) 2586–2592 2587
original surface. This mode of deformation, which typically occursbetween and outside wheel paths, is attributed to shear flow of as-phalt materials under traffic loads, and is often referred to as‘‘heave”.
Various experimental tests such as static creep, dynamic creep,wheel tracking and indirect tensile tests are used to evaluate per-manent deformation potential of asphalt mixtures. There are, how-ever, doubts about whether or not these tests can properlyevaluate deformation properties of PMA mixtures. Tayfure et al.[7], for example, believe that static creep test can not accuratelyshow the differences which exist between modified and unmodi-fied asphalt mixtures.
Among the mentioned methods of assessing permanent defor-mation potential of asphalt mixtures, dynamic creep test isthought to be one of the best methods. This test was developedby Monismith et al. [14] in 1970, based on the concepts of axialcompression test. NCHRP conducted a comprehensive researchstudy to develop a simple mechanical test to supplement theSuperpave volumetric method of mixtures design. Research ofKaloush and Witzak [10] also indicates that Superpave volumetricmethod alone can not guarantee the proper functioning of the as-phalt layer according to field experiments.
NCHRP reported, that among the five laboratory tests investi-gated, dynamic creep test had very good correlation with mea-sured rut depth and a high capability to estimate ruttingpotential of asphalt layers [10]. On grounds of the results of theresearch, dynamic creep test was chosen as an appropriate labora-tory method to evaluate the permanent deformation susceptibilityof modified and unmodified asphalt mixtures.
0
20
40
60
80
100
120
0.01 0.1 1 10 100Sieve Size (mm)
Pass
ing
Perc
ent
Dense Graded Coarse Graded
Upper Limit of Gradation Lower Limit of Gradation
Fig. 1. Aggregate grading of asphalt mixtures.
3. Developed models based on dynamic creep test
Dynamic creep test has various outcomes that can be used as ameasure of evaluation of permanent deformation potential. Airey[16], for instance, used ultimate strain and mean strain rate for thispurpose, and according to him, of the two mentioned parametersthe latter is more reliable to measure the rutting performance ofthe asphalt mixture than the former because mean strain, unlikeultimate strain, is independent of the initial strain experiencedduring the dynamic creep test.
Kaloush et al. [15] used another outcome of dynamic creep testnamely flow number (FN) as a comparison measure. This parame-ter is obtained from creep curve (a plot of cumulative plastic strainversus number of load cycles). The creep curve is generally dividedinto three stages as indicated in the literature [15]. As reported byZhou et al. [17] over the past 40 years, various mathematical mod-els, among which are well known models such as Barksdale’s Semi-log model in 1972, Power-law models based on Monismith modelin 1975, and Tseng and Lytton’s model in 1989, have been devel-oped for fitting the creep curve and estimating the (FN) parameterin asphalt mixtures.
Zhou et al. [17] believe that (FN) can not be an appropriate cri-terion for evaluating the mixtures permanent deformation poten-tial, so they proposed a three-stage model (one model for eachstage of the creep curve) with a simple algorithm for estimatingthe initial point of each stage. West et al. have also developed athree-stage model [18], but their model can not estimate theboundary points of curve stages.
3.1. Outline of Zhou model
Zhou performed a comprehensive research to develop a modelthat could fit the creep curve and estimate its boundary points (ini-tial point of stages 2 and 3) precisely [17]. In this model a power-law function, a linear function and an exponential function was
used for stages 1–3, respectively. Equations below show each stageof the model:
N6NPS; ep¼ aNb ð1Þeps¼ aNb
PS and NPS6N6NST ; eP ¼ ePSþcðN�NPSÞ ð2ÞeST ¼ ePSþcðNST �NPSÞ and N P NST ; eP ¼ eST þdðef ðN�NST Þ �1Þ ð3Þ
4. Objectives and procedure of tests
In view of the above, efforts were made to conduct dynamiccreep test on SBS modified and unmodified asphalt mixtures. Theobtained creep curves were interpreted according to mathematicalmodels. During the research following stages were performed:
1. Comparing the permanent deformation potential of the densegraded mixtures with coarse graded mixtures and choosingthe more damageable gradation for the next stage.
2. Comparing the effect of different amounts of SBS polymer onmixtures behavior and determining the optimum polymeramount.
3. Comparing the behavior of SBS modified and unmodified mix-ture in different combinations of temperature and stress levelin dynamic creep test.
4. Deriving creep models based on Zhou model.
4.1. Samples preparation
Fig. 1 shows the aggregate grading used in this work. The twothick curves in the figure show the upper and lower limits of thepermitted grading for pavement surface layer according to localcode [19]. The aggregates used were crushed with two brokenfaces. The applied asphalt in this research was 60/70 penetrationgrade (PG 64-16). Optimum amount of asphalt was determinedto be 5.2% for dense graded and 4.8% for coarse graded mixturesusing Marshall test, and SBS modified mixture prepared with thesame amounts of modified binder.
SBS polymer used in samples preparation was according to Euro-prene SOLT 6302 grade and was bought in from a local petrochem-ical refinery. In order to mix the polymer with asphalt, a mixer wasdesigned in which the rotation speed of electro motor was adjust-able between 30 rpm up to 1200 rpm. A potentiometer was also in-stalled to the mixer allowing the user to alter the rotation speedgradually. Moreover, the mixer was equipped with a containerwhich was embedded in an electrical heating device. The heatercould increase the temperature of the asphalt up to 200 �C and
2588 A. Khodaii, A. Mehrara / Construction and Building Materials 23 (2009) 2586–2592
maintain it at a constant level (with the precision of ±2.5 �C) for anygiven period of time. For the purpose of producing a homogenousasphalt–polymer blend, the mixing process was carried out at thetemperature of 180 �C and rotation speed of 1200 rpm for an hour.
Testing samples were made according to ASTM D1559. Numberof blows in Marshall Compactor was selected by trial and error toobtain almost the same bulk specific gravity for different types ofmodified and unmodified samples, so that the influence of volu-metric parameters on the results would decrease, and a reasonablecomparison between different mixtures could be made.
4.2. Dynamic creep test
The Dynamic Creep Tests were carried out using UTM25 to ap-ply repeated axial stress pulse to asphalt specimens measuring thevertical deformation with the Linear Variable Displacement Trans-ducer (LVDTs). In servo hydraulic UTM25 machine the stress/loadapplied to the specimen is feed back controlled allowing the oper-ator to select a loading wave shape (haversine or square pulse), apulse width duration, a rest period, a deviator stress/load to be ap-plied during each loading pulse and a contact stress/load to be ap-plied so that the vertical loading shaft does not lift off the testspecimen during the rest period. Prior to testing a preload stress/load can also be programmed into the testing sequence. To controlthe ambient temperature of testing samples, loading mechanism ofUTM machine is equipped by an environmental chamber.
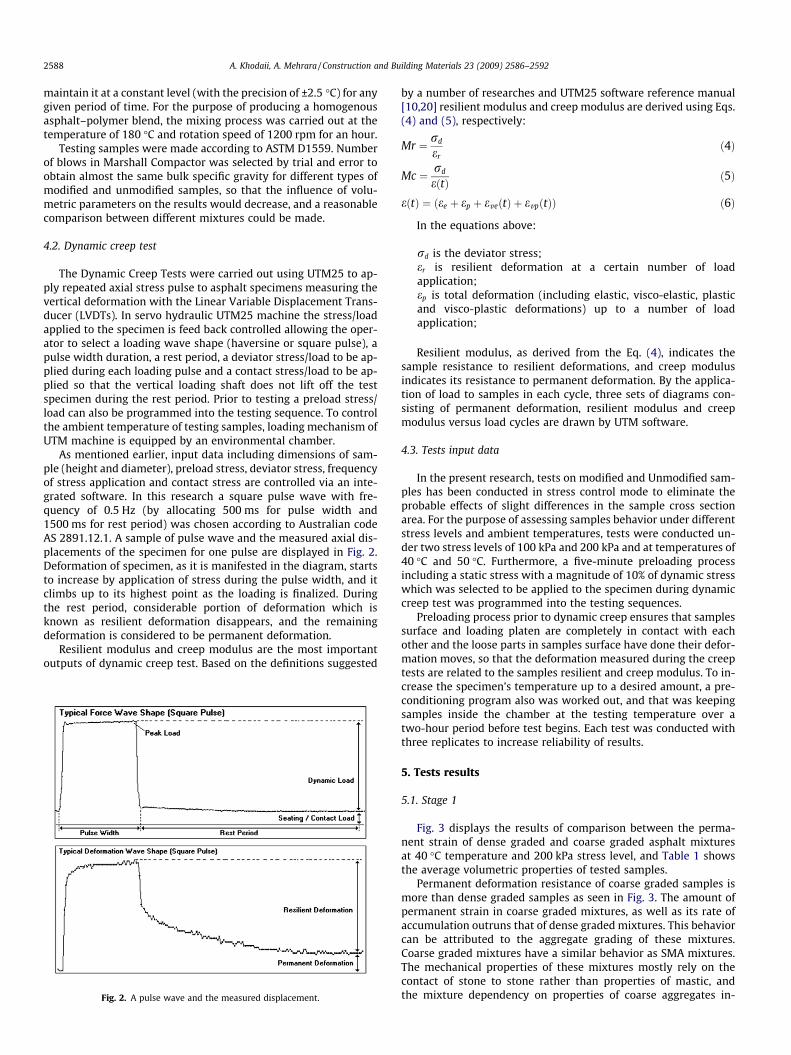
As mentioned earlier, input data including dimensions of sam-ple (height and diameter), preload stress, deviator stress, frequencyof stress application and contact stress are controlled via an inte-grated software. In this research a square pulse wave with fre-quency of 0.5 Hz (by allocating 500 ms for pulse width and1500 ms for rest period) was chosen according to Australian codeAS 2891.12.1. A sample of pulse wave and the measured axial dis-placements of the specimen for one pulse are displayed in Fig. 2.Deformation of specimen, as it is manifested in the diagram, startsto increase by application of stress during the pulse width, and itclimbs up to its highest point as the loading is finalized. Duringthe rest period, considerable portion of deformation which isknown as resilient deformation disappears, and the remainingdeformation is considered to be permanent deformation.
Resilient modulus and creep modulus are the most importantoutputs of dynamic creep test. Based on the definitions suggested
Fig. 2. A pulse wave and the measured displacement.
by a number of researches and UTM25 software reference manual[10,20] resilient modulus and creep modulus are derived using Eqs.(4) and (5), respectively:
Mr ¼ rd
erð4Þ
Mc ¼ rd
eðtÞ ð5Þ
eðtÞ ¼ ðee þ ep þ eveðtÞ þ evpðtÞÞ ð6Þ
In the equations above:
rd is the deviator stress;er is resilient deformation at a certain number of loadapplication;ep is total deformation (including elastic, visco-elastic, plasticand visco-plastic deformations) up to a number of loadapplication;
Resilient modulus, as derived from the Eq. (4), indicates thesample resistance to resilient deformations, and creep modulusindicates its resistance to permanent deformation. By the applica-tion of load to samples in each cycle, three sets of diagrams con-sisting of permanent deformation, resilient modulus and creepmodulus versus load cycles are drawn by UTM software.
4.3. Tests input data
In the present research, tests on modified and Unmodified sam-ples has been conducted in stress control mode to eliminate theprobable effects of slight differences in the sample cross sectionarea. For the purpose of assessing samples behavior under differentstress levels and ambient temperatures, tests were conducted un-der two stress levels of 100 kPa and 200 kPa and at temperatures of40 �C and 50 �C. Furthermore, a five-minute preloading processincluding a static stress with a magnitude of 10% of dynamic stresswhich was selected to be applied to the specimen during dynamiccreep test was programmed into the testing sequences.
Preloading process prior to dynamic creep ensures that samplessurface and loading platen are completely in contact with eachother and the loose parts in samples surface have done their defor-mation moves, so that the deformation measured during the creeptests are related to the samples resilient and creep modulus. To in-crease the specimen’s temperature up to a desired amount, a pre-conditioning program also was worked out, and that was keepingsamples inside the chamber at the testing temperature over atwo-hour period before test begins. Each test was conducted withthree replicates to increase reliability of results.
5. Tests results
5.1. Stage 1
Fig. 3 displays the results of comparison between the perma-nent strain of dense graded and coarse graded asphalt mixturesat 40 �C temperature and 200 kPa stress level, and Table 1 showsthe average volumetric properties of tested samples.
Permanent deformation resistance of coarse graded samples ismore than dense graded samples as seen in Fig. 3. The amount ofpermanent strain in coarse graded mixtures, as well as its rate ofaccumulation outruns that of dense graded mixtures. This behaviorcan be attributed to the aggregate grading of these mixtures.Coarse graded mixtures have a similar behavior as SMA mixtures.The mechanical properties of these mixtures mostly rely on thecontact of stone to stone rather than properties of mastic, andthe mixture dependency on properties of coarse aggregates in-

0
2000
4000
6000
8000
10000
12000
0 2000 4000 6000 8000 10000Cycles
Perm
anen
t Stra
in(µ
s)Dense Graded Coarse Graded
Fig. 3. Creep curve for unmodified coarse graded and dense graded samples at 40 �Cand 200 kPa stress level.
0
2000
4000
6000
8000
10000
0 2000 4000 6000 8000 10000Cycles
Perm
anen
t Stra
in(µ
s)
0%SBS 4%SBS 5%SBS 6%SBS
Fig. 4. Creep curve for modified mixtures with different amounts of SBS at 40 �Cand 200 kPa stress level.
A. Khodaii, A. Mehrara / Construction and Building Materials 23 (2009) 2586–2592 2589
creases, as the temperature rises. Therefore, it is expected thatcoarse grade mixtures will be more resistant to permanent defor-mation than dense graded mixtures. In this stage, dense gradingwas chosen as the critical type of grading for the rest of the tests.
5.2. Stage 2
In this stage, asphalt mixtures were prepared using modifiedbinders as it was described before, (with 4%, 5% and 6% of SBS poly-mer) and their permanent deformation potential was comparedwith each other. Fig. 4 illustrates the results of the comparisonfor these samples, and Table 2 represents volumetric propertiesof tested samples in this stage.
Adding polymer to asphalt mixtures remarkably decreases itssusceptibility to permanent deformation. As the results indicateda significant enhancement in the behavior of mixtures modifiedby 5% SBS, the same amount is chosen as the optimum amountof polymer for the next stage of the research.
5.3. Stage 3
In this stage, prepared samples (both modified and unmodified)were tested at different combinations of temperature and stress le-vel as mentioned before. The applied temperatures in this stagewere 40 �C and 50 �C and the applied stress levels were 200 kPaand 100 kPa.
5.3.1. Creep curvesFigs. 5 and 6 illustrate the permanent stain curves, and Table 3
shows the volumetric properties of tested samples. Sample code gi-ven to each group in Table 3 indicates whether a sample tested ismodified or unmodified and its temperature and stress testing con-ditions as well.
Fig. 5 manifests that modifying asphalt mixtures with SBS poly-mer decreases the temperature susceptibility of the mixtures. Inother words, dependency of permanent deformation on tempera-ture in modified samples is considerably lower than that ofunmodified samples. Fig. 6 shows the results of test carried outat 100 kPa stress level. As seen from the figure, although the per-manent strain of SBS modified samples is lower than unmodifiedones at both 40 �C and 50 �C, 10 �C increase in temperature leads
Table 1Physical properties of dense and coarse graded samples tested in this stage.
Gradation Type of sample Test temperature B
Coarse graded 0% SBS 40 �C 2Dense graded 0% SBS 40 �C 2
to more increase in permanent strain of modified samples thanunmodified samples. This result seems to be rather illogical, andit might be concluded that the stress level of 100 kPa is not suitableto show the real behavior of materials and particularly the polymermodified samples.
Figs. 7 and 8 show the variations in resilient and creep modu-lus of tested samples at 200 kPa stress level. Since there are threereplicates for each test, these diagrams are derived from the aver-age amount of parameters in each loading cycle. Resilient modu-lus of modified samples is more than unmodified samples at bothtemperatures of 40 �C and 50 �C according to Fig 7. The resilientmodulus of unmodified samples tested at 50 �C decreases bycontinuing the loading cycles up to 6000 cycles. A decreasingtrend in resilient modulus of unmodified samples tested at40 �C can be seen whereas for modified mixtures tested at 40 �Cand 50 �C, up to 10000 cycles loading, almost no change in resil-ient modulus is observed. The regressed linear equations in thefigure simply display that whether the resilient modulus has a ris-ing or falling trend during the process of load application, andalso how fast the rising and falling takes place. Although the gen-eral trend of resilient modulus in the unmodified samples is fall-ing, a slight ascent can be observed in them up to around 700cycles loading repetition.
It is believed by the authors that compactive deformation of as-phalt mixture is highly affected by resilient modulus and vice ver-sa, or the more compacted mixture the more resilient modulus. Ifresilient modulus of asphalt is increasing during a dynamic loadingprocess (Fig. 7), it is possibly because it is getting compacted. As itis realized from Fig. 7, all the mixtures experience a compactivedeformation in early stages of loading process. However, for mod-ified samples the compaction process has gently continued up tothe loading process is finalized.
Creep modulus trends, have shown a climb down. In unmodi-fied specimens the rate of reduction is more than modified sam-ples. Also, a 10 �C increase in temperature has caused a dramaticdescent in the creep modulus of unmodified samples so that thesesamples faced a total destruction at 50 �C. On the contrary, in themodified samples after a sharp drop in early stages of loading,the creep modulus has roughly reached a plateau of 59 MPa and36 MPa at 40 �C and 50 �C, respectively (Fig. 8).
ulk specific gravity Maximum specific gravity Air void (%)
.24 2.43 7.9
.23 2.40 7.07

Table 2Physical properties of samples tested in stage 2.
Type of sample Test temperature (�C) Bulk specific gravity Maximum specific gravity Air void (%)
0% SBS 40 2.24 2.43 7.914% SBS 40 2.25 2.39 6.105% SBS 40 2.25 2.39 6.036% SBS 40 2.24 2.39 6.28
0
5000
10000
15000
20000
25000
30000
35000
0 2000 4000 6000 8000 10000Cycles
Perm
anen
t Str
ain
(µs )
0% SBS, T=40C 5% SBS, T=40C 0% SBS, T=50C 5% SBS, T=50C
Fig. 5. Creep curve for modified and unmodified mixtures at 200 kPa stress level.
0
500
1000
1500
2000
2500
3000
3500
0 2000 4000 6000 8000 10000Cycles
Perm
anen
t Str
ain
(µs)
0% SBS, T=40C 5% SBS, T=40C 0% SBS, T=50C 5% SBS, T=50C
`
Fig. 6. Creep curve for modified and unmodified mixtures at 100 kPa stress level.
0
100
200
300
400
500
600
0 2000 4000 6000 8000 10000Cycles
Res
ilien
t Mod
ulus
(MPa
)
0% SBS, T=40C-- Y=-0.0012X+234.39 5% SBS, T=40C-- Y=-0.0002X+306.89
0% SBS, T=50C-- Y=0.0004X+246.02 5% SBS, T=50C-- Y=-0.0085X+222.49
Fig. 7. Resilient modulus changes for modified and unmodified mixtures at 200 kPastress.
0
50
100
150
200
250
0 2000 4000 6000 8000 10000Cycles
Cre
ep M
odul
us (M
Pa)
0% SBS, T=40C 5% SBS, T=40C 0% SBS, T=50C 5% SBS, T=50C
Fig. 8. Creep modulus changes for modified and unmodified mixtures at 200 kPastress level.
2590 A. Khodaii, A. Mehrara / Construction and Building Materials 23 (2009) 2586–2592
As quoted earlier, Gokhale et al. [6] showed that the permanentdeformation of asphalt mixtures usually consists of two parts: thecompactive and shear flow (plastic). In Dynamic creep test beingperformed by UTM machine, there is not a possibility of distin-guishing permanent deformation caused by compaction and thepermanent deformation caused by shear deformations. However,it is believed that by continuing the loading process the rate ofcompactive deformation decreases, and the rate of plastic defor-mation increases [6]. The results presented in Fig. 7 shows an in-crease of resilient modulus of samples in the first few repetitionof load which is an indication of the samples becoming more com-pacted; on the contrary, UTM machine takes this deformation as apermanent deformation and indicates a reduction in creep modu-lus (Fig. 8).
Gokhale et al. [6] tried to separate the two parts of deformationfrom each other in polymer modified and unmodified asphalt mix-tures. According to their results, the ratio of plastic to compactive
deformation was greater for unmodified samples, and it wasincreasing rapidly with continuing load application whereas it ap-proached a constant value for modified mixtures. Constant ratio ofplastic to compactive deformation can be observed either when therates of increase for both modes of deformation are equal, or whenthere is not any noticeable change in neither of those modes.
According to literature [15], shear deformations in asphalt mix-ture takes place without any sensible change in their volume, butcompactive deformation is always accompanied by a drop in mix-tures volume. If the ratio of plastic deformations to compactivedeformation rises with an increase in number of load application,either the rate of compaction process decreases or their plasticdeformation grows much faster than their compactive deforma-tion. When the ratio of plastic deformation to compactive deforma-tion decreases with an increase in number of load application,

Table 3Physical properties of samples tested in stage 3.
Sample code Type of sample Stress (kPa) Test temperature (�C) Bulk specific gravity Maximum specific gravity Air void (%)
O1 0% SBS 200 40 2.24 2.43 7.91O2 0% SBS 200 50 2.25 2.43 7.43M1 5% SBS 200 40 2.25 2.39 6.03M2 5% SBS 200 50 2.23 2.39 6.86O3 0% SBS 100 40 2.26 2.43 7.11O4 0% SBS 100 50 2.26 2.43 6.92M3 5% SBS 100 40 2.24 2.39 6.50M4 5% SBS 100 50 2.24 2.39 6.22
0
0.1
0.2
0.3
0.4
0.5
0.6
0.7
0.8
0 2000 4000 6000 8000 10000 12000CyclesR
atio
of C
reep
mod
ulus
to R
esili
ent
mod
ulus
0%SBS T=40C 5%SBS ,T=40C 0%SBS, T=50C 5%SBS , T=50C
Fig. 9. Changes of the ratio of Creep to Resilient modulus for modified andunmodified mixtures at 200 kPa stress level.
A. Khodaii, A. Mehrara / Construction and Building Materials 23 (2009) 2586–2592 2591
process of compaction takes place faster than growth of plasticdeformation. Mixtures with faster trend of compaction have highpotential to be compacted than mixtures with lower rate ofcompaction.
In this work a similar result to what is reported by Gokhale et al.[6] was obtained in comparing resilient and creep modulus oftested samples. To examine whether the sample is becoming com-pacted during dynamic creep test by UTM, both resilient and creepmodulus graphs must be considered. Whenever the creep modulusdecreases it might either be a sign of compactive deformation orplastic deformation. At the same time, providing that the resilientmodulus of specimen is increasing, it will be concluded that comp-active deformation outweighs the plastic deformation.
Fig. 9 shows the ratio of creep modulus to resilient modulus intested samples at any number of load repetition (Figs. 7 and 8) ver-sus the number of loading cycles. A sharp drop, as the diagram tes-tifies, is observed in the ratio of Mc/Mr up to about 700th cycle inall of the curves, which is because of a fall in Mc and a rise in Mr. Asit can be seen from the figure, all the samples have been compactedup to the mentioned number of load cycles. Modified sample, areapproaching a relatively constant value which means that the
Table 4Creep curve models based on Zhou’s model.
Sample code First phase Second phase
First stage model End of second stage Second stage model
O1 ep ¼ 369:14N0:3371 N ¼ 7728 eP ¼ 6817:174þ 0:607O2 ep ¼ 221:85N0:449 N ¼ 2800 eP ¼ 6409:265þ 2:322O3 ep ¼ 120:24N0:3667 NA NAO4 ep ¼ 143:06N0:3443 NA NAM1 ep ¼ 514:4N0:1838 NA NAM2 ep ¼ 923:43N0:1784 NA NAM3 ep ¼ 122:71N0:2559 NA NAM4 ep ¼ 131:18N0:2775 NA NA
changes in Mc and Mr are negligible and have the same rate. Con-sidering the slight increase in the resilient modulus of modifiedsamples (Fig. 7), it might be concluded that these samples are stillgetting compacted. The unmodified specimens, in which resilientmodulus decreases from 700th cycle forward (Fig. 7) at both tem-peratures of 40 �C and 50 �C, have a prominent falling trend. Thiscould mean that the rate of reduction in Mc grows faster than rateof reduction in Mr.
Since the Mc/Mr ratio is prominently falling in unmodified sam-ples, according to Fig. 9 on the one hand, and Mr is decreasing inthem on the other hand, it means that the proportion of compac-tive deformation to shear deformation is falling. This is the sameresult as Gokhale et al. [6] reported. It can also be understood fromFig. 9 that when Mc/Mr is decreasing gently (like it is approaching aconstant value) the process of compaction is still happening, or thegrowth of shear deformation is negligible. When the Mc/Mr is con-siderably falling (not at the early ages of dynamic load application)the samples are going through the shear deformation. In Fig. 9,therefore, unmodified samples have experienced shear deforma-tion whereas modified samples are still getting compacted.
5.4. Stage 4
Zhou’s three-stage model was used for fitting the creep curvesand estimating their boundary points. The developed method byZhou et al. includes eight steps [17]. The obtained mathematicalfunctions for each stage of tested samples are showed in Table 4.The numbers of cycles to reach different stages, slope of differentsections and total permanent strain at the end of the loading per-iod are also displayed in Table 5.
According to Tables 4 and 5, increasing the temperature from40 �C to 50 �C at stress level of 200 kPa in unmodified samples(O1, O2), increases the total permanent deformation from10,015 ls for O1 samples to 33,696 ls for O2 samples. The slopeof the linear stage and end point of the curve in these samples in-creases from 0.60 to 2.32 and from 2.37 to 28.28, respectively.However in modified mixtures at the same stress level (M1, M2)an increase of 10 �C in temperature can lead to 1980 ls increase(from 2795.77 to 4775.34) in permanent strain. Unmodified sam-
Third phase
End of first stage Third stage model
3ðN � 5712Þ N ¼ 5712 eP ¼ 8041:491þ 176:66ðeð0:0011ðN�7728ÞÞ � 1ÞðN � 1792Þ N ¼ 1792 eP ¼ 8749:841þ 760:91ðeð0:0011ðN�2800ÞÞ � 1Þ
NA NANA NANA NANA NANA NANA NA

Table 5Critical values of creep models.
Sample code End of first stage End of second stage Slope of linear part Slope of the end of the curve Total permanent strain
O1 5712 7728 0.6073 2.3655 10015.27O2 1792 2800 2.3220 28.2776 33695.84O3 – – – 0.1292 3522.48O4 – – – 0.1174 3409.72M1 – – – 0.0514 2795.77M2 – – – 0.0852 4775.34M3 – – – 0.0332 1295.63M4 – – – 0.0469 1689.93
2592 A. Khodaii, A. Mehrara / Construction and Building Materials 23 (2009) 2586–2592
ples at stress level of 200 kPa therefore, are much more sensitive totemperature increase than SBS modified samples.
Sample codes O3, O4, M3 and M4 in Tables 4 and 5 were testedunder 100 kPa axial stress, the creep curve for these samples didnot obey the Zhou model. In these samples the end parts of curves(generally the parts after 8000th loading cycle) neither belong tothe first nor to the second stage of the Zhou model. Since all ofthese samples have been tested at the same stress level, it seemsthat at this stress level samples behavior approaches to elasticstate. In these samples the rate of accumulation of permanentstrain is very low and it approaches to zero specially in modifiedsamples. Consequently it may be concluded that stress level of100 kPa was not sufficiently high enough and can not be used forevaluation of permanent deformation behavior of SBS modifiedmixtures.
6. Conclusions
� Coarse graded asphalt mixtures have more resistance to perma-nent deformation than dense graded mixtures, which can be dueto their lower dependency on mastic properties particularly athigh temperatures.
� Among the three types of mixtures prepared by 4%, 5% and 6% ofSBS polymer, the mixtures with 5% SBS had the most improvedmechanical behavior.
� SBS modified asphalt mixtures have considerably lower temper-ature susceptibility than unmodified mixtures.
� SBS modified mixture have higher compactibility than unmodi-fied mixtures, and dynamic loading transform them to a morecompacted state.
� Stress level of 100 kPa at 40 �C and 50 �C temperatures is notsuitable for investigating the permanent deformation potentialof the asphalt mixtures, because after a certain number of load-ing cycles samples mechanical behavior approaches elastic state,and their creep curve do not observe the Zhou model trend(which its accuracy has been verified [17]).
Acknowledgements
MACADA Asphalt Company and ASPHALT NEMOONE Companyare gratefully acknowledged for their backing in supplying re-quired materials.
References
[1] Yildirim Y. Polymer modified asphalt binders. Constr Build Mater2005.
[2] Bonemazzi F, Braga V, Corrieri R, Giavarini C, Sartori F. Characteristics ofpolymers and polymer-modified binders. J Transport Res Rec1996;1535:36–47.
[3] Uddin V. Viscoelastic characterization of polymer-modified asphalt binders ofpavement applications. The University of Mississippi, Carrier 203, University,MS 38677-1848, USA; 2003. <http://www.ar.ethz.ch/ARONLINE_FREE/13_191.pdf>.
[4] Wong WG, Han H, He G, Wang KCP, Lu W. Rutting response of hot-mix asphaltto generalized dynamic shear moduli of asphalt binder. Constr Build Mater2004;41(12):399–408.
[5] Khattak MJ, Baladi GY. Engineering properties of polymer-modified asphaltmixtures. J Transport Res Rec 1998;1638:12–22.
[6] Gokhale S, Choubane B, Byron T, Tia M. Rut initiation mechanisms in asphaltmixtures as generated under accelerated pavement testing. J Transport Res Rec2005;1940:136–45.
[7] Tayfur S, Ozen H, Aksoy A. Investigation of rutting performance of asphaltmixtures containing polymer modifiers. Constr Build Mater 2005(November).
[8] Khattak MJ, Baladi GY, Drzal LT. Low temperature binder–aggregate adhesionand mechanistic characteristics of polymer modified asphalt mixtures. ASCE JMater Civil Eng 2007;19(5):411–22.
[9] Bahia HU, Hanson DI, Zeng M, Zhia H, Khatri MA, Anderson RM.Characterization of modified asphalt binders in superpave mix design.NCHRP 459 report; 2001.
[10] Kaloush KE, Witczak MW. Tertiary flow characteristics of asphalt mixtures. JAssoc Asphalt Paving Technol 2002;71:278–306.
[11] Santucci L. Rut resistant asphalt pavement. Tech transfer program andpavement specialist. Pavement Research Center, UC Berkeley; 1998. <http://www.techtransfer.berkeley.edu/techtopics/>.
[12] Gabra R, Horvli I. Simplified testing method for evaluation of asphalt mixturesfor their susceptibility to permanent deformation; 2006. <http://vegvesen.no/nvf/stipend_rapporter/NVF_stipend_2003_Rabbira_Garba.pdf>.
[13] Huang HM, White TD. Minimum crushed aggregate requirements. Draft FinalReport, Joint Highway Research Project FHWA/IN/JHRP-96/23. PurdueUniversity, West Lafayette, IN; 1996.
[14] Monismith CL, Ogawa N, Freeme C. Permanent deformation of subgrade soilsdue to repeated loadings. J Transport Res Rec 1975:537.
[15] Kaloush KE, Witczak MW, Way GB. Performance evaluation of Arizona asphaltrubber mixtures using advanced dynamic material characterization tests.Department of Civil and Environmental Engineering, College of Engineeringand Applied Sciences, Arizona State University, July 2002.
[16] Airey GD. Fundamental binder and practical mixture evaluation of polymermodified bituminous materials. Int J Pavement Eng 2004;5(3):137–51.
[17] Zhou F, Scullion T, Sun L. Verification and modeling of three-stage permanentdeformation behavior of asphalt mixes. ASCE J Transport Eng2004;130(4):486–94.
[18] West Rc, Zhang J, Cooley LA. Evaluation of the asphalt pavement analyzer formoisture sensitivity testing. National Center for Asphalt Technology, NCATreport 04-04. Auburn University, Alabama, July 2004.
[19] Iran highway asphalt paving code. Ministry of Road and Transportation,Research and Education Center, Iran, No. 234; 2003.
[20] UTM software reference manual; 2006.
Recommended