ENROLLMENT PROJECTIONS
UNIVERSITY OF HAWAI‘I SYSTEM
FALL 2013 TO FALL 2018
Institutional Research and Analysis Office University of Hawai‘i System
July 2013
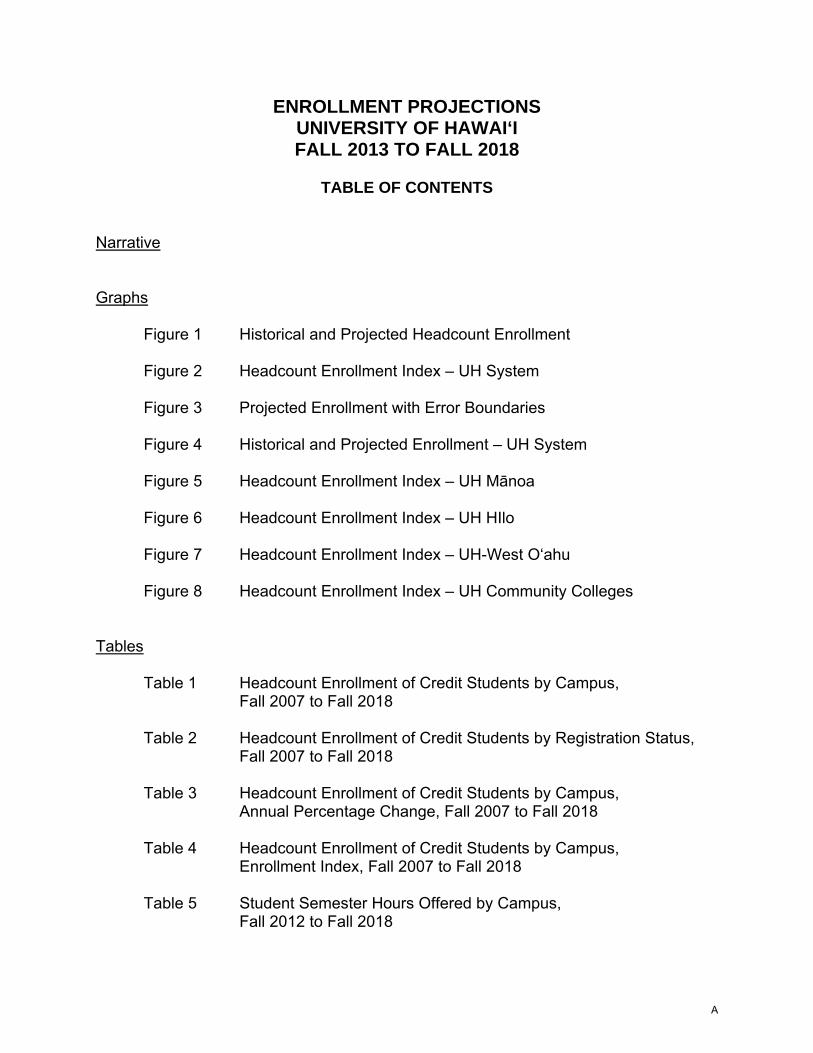
ENROLLMENT PROJECTIONS UNIVERSITY OF HAWAI‘I FALL 2013 TO FALL 2018
TABLE OF CONTENTS
Narrative Graphs
Figure 1 Historical and Projected Headcount Enrollment Figure 2 Headcount Enrollment Index – UH System Figure 3 Projected Enrollment with Error Boundaries Figure 4 Historical and Projected Enrollment – UH System Figure 5 Headcount Enrollment Index – UH Mānoa Figure 6 Headcount Enrollment Index – UH HIlo Figure 7 Headcount Enrollment Index – UH-West O‘ahu Figure 8 Headcount Enrollment Index – UH Community Colleges
Tables
Table 1 Headcount Enrollment of Credit Students by Campus,
Fall 2007 to Fall 2018 Table 2 Headcount Enrollment of Credit Students by Registration Status,
Fall 2007 to Fall 2018 Table 3 Headcount Enrollment of Credit Students by Campus,
Annual Percentage Change, Fall 2007 to Fall 2018 Table 4 Headcount Enrollment of Credit Students by Campus,
Enrollment Index, Fall 2007 to Fall 2018 Table 5 Student Semester Hours Offered by Campus,
Fall 2012 to Fall 2018
A
TABLE OF CONTENTS (CONT.)
Table 6 Full-Time Equivalent Course Enrollment Served by Campus,
Fall 2012 to Fall 2018 Table 7 Headcount Enrollment of Credit Students by Attendance Status,
Fall 2012 to Fall 2018
Appendices
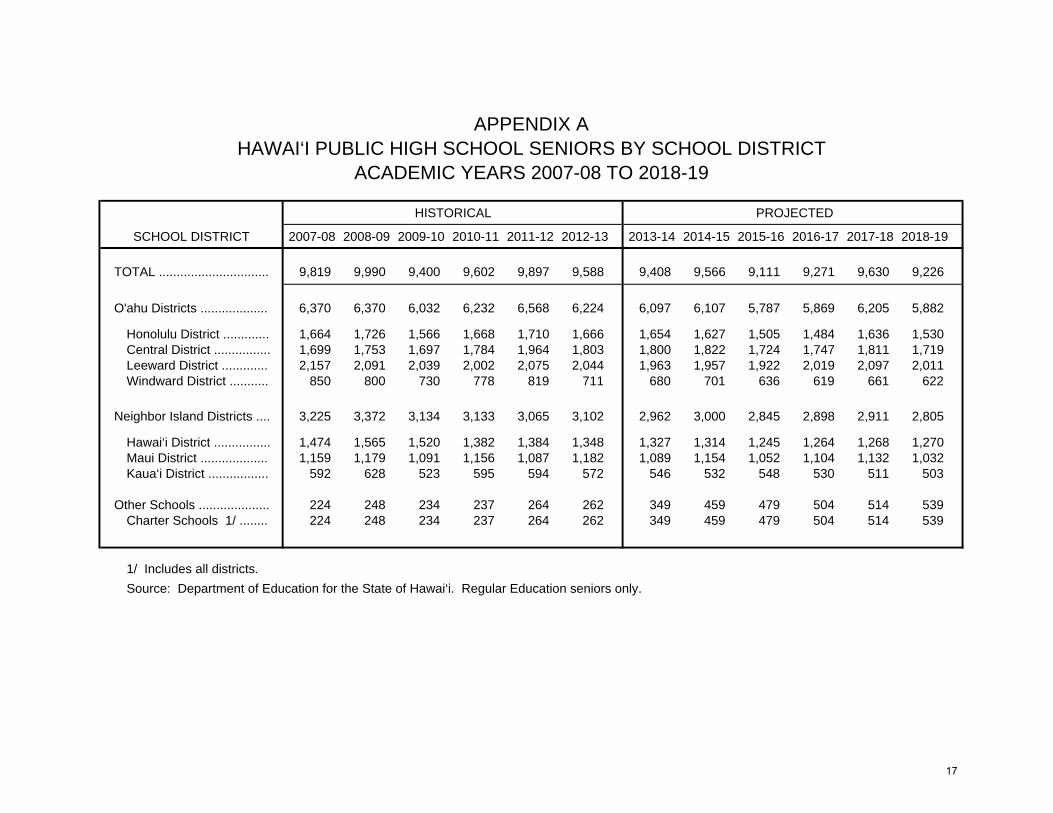
Appendix A Hawai‘i Public High School Seniors by School District, Academic Years 2007-08 to 2018-19
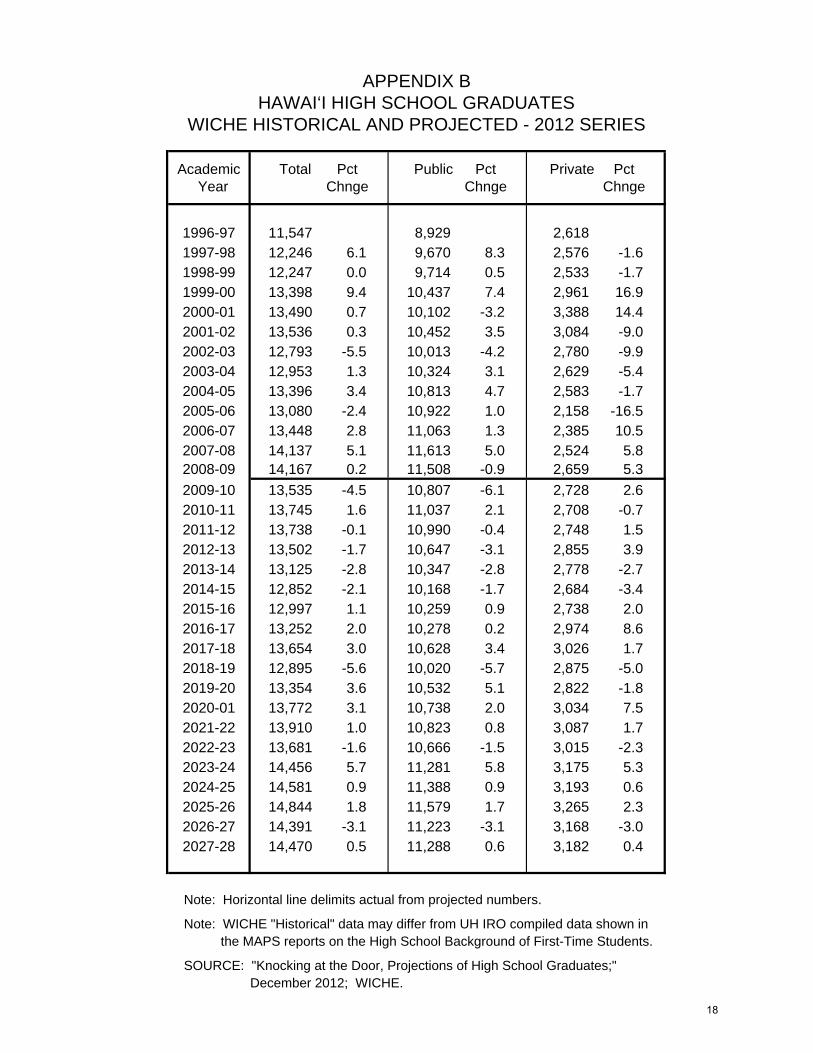
Appendix B Hawai‘i High School Graduates, WICHE Historical and Projected –
2012 Series Appendix C University of Hawai‘i Enrollment Projection Model, 2013
B
ENROLLMENT PROJECTIONS THE UNIVERSITY OF HAWAI>I
FALL 2013 TO FALL 2018
INTRODUCTION This report provides a summary of the enrollment projections for the campuses of the University of Hawai>i system: the University of Hawai>i at Mānoa, the University of Hawai>i at Hilo, the University of Hawai>i-West O>ahu, and the University of Hawai>i Community Colleges: Hawai>i, Honolulu, Kapi>olani, Kaua>i, Leeward, Maui College, and Windward. Details of the enrollment projections by campus may be found in the separate reports by UH unit (UH Mānoa, UH Hilo, UH-West O>ahu and the UH Community Colleges). The enrollment projections are based upon unduplicated headcounts of students enrolled in credit courses. Included are classified students in programs leading to a degree as well as unclassified students. Special students (early admits) have been included for all years, both historical and projected. Historical data are included in the tables and charts to facilitate comparison and analysis. They were extracted from the student enrollment, academic crossover, and course registration data files. The projections are statistical extrapolations of current trends in enrollment by campus. They do not set enrollment targets and, in general, do not take into consideration planned or potential changes in University or campus policies or procedures. They should be considered as an extension into the future of current enrollment trends. Beginning this year, the projection reports also make use of a time series analysis conducted by UH IRAO office staff that incorporates a variety of economic and demographic factors. This model has been used to guide and validate the projection methodology for the system-wide enrollment projections. ARIMA (time series) projections were made by UH unit. The analysis is attached to this report as an appendix. PROJECTION METHODOLOGY The projections for classified undergraduates are sub-divided by registration status (also called student type): first-time, transfer, returning and continuing. Graduate and unclassified student enrollments are forecast separately. The projection methodology makes use of continuation rates as well as ratios, trends and constants. The specific methods used and assumptions made in forecasting enrollments vary for each campus. Details are found in the separate enrollment projection reports by UH unit.
1
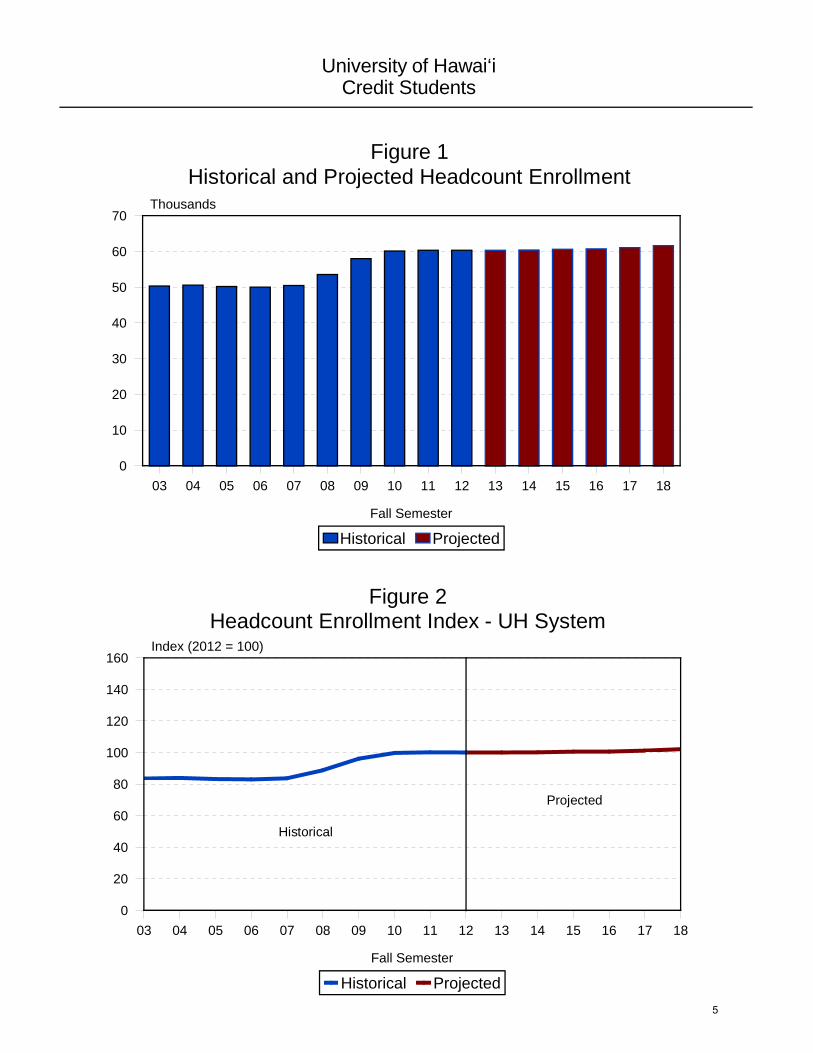
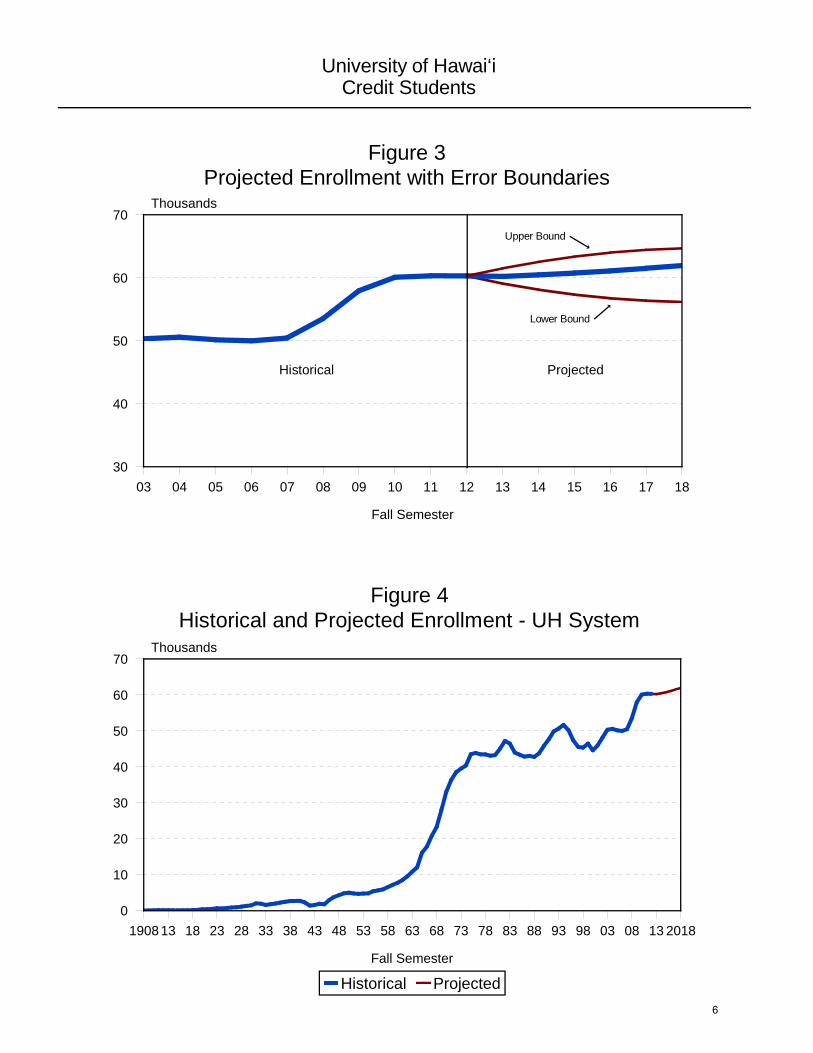
The projection reports by unit have charts (Figure 3 in this report) which illustrate visually the upper and lower forecast boundaries. These boundaries are based upon the observed average percentage error in the forecast, as measured over the most recent ten year period. Note that the forecast error increases with time. For the UH system as a whole, the 1-year forecast error has averaged 1.9%, while the 6-year forecast error has averaged 7.7%. The projected numbers given here may be considered mid-level forecasts. Table 1 presents historical and projected enrollments for each campus and for the UH system in aggregate from Fall 2007 to Fall 2018. Historical and projected enrollment by registration status at the UH system level are presented in Table 2. Annual percentage change in enrollment by campus is shown in Table 3. Table 4 provides enrollment indexes, useful for comparing across campuses, calculated using Fall 2012 as the base year. (An enrollment index is illustrated for the UH system in Figure 2 and for each UH unit in Figures 5 to 8.) Tables 5 and 6 show projected student semester hours (SSH) offered and full-time equivalent (FTE) course enrollment served, respectively. Projected enrollments by attendance status (full-time / part-time) are given in Table 7. Appendix A shows historical and projected enrollments of Hawai>i public high school seniors by geographic district. Appendix B gives forecasts of Hawai>i public and private high school graduates through academic year 2027-28.
ANALYSIS AND DISCUSSION • Headcount enrollment for the University of Hawai>i measured 60,295 in Fall 2012, a very
slight (0.1%) decrease from the previous fall semester (Tables 1 & 3 and Figures 1 & 4). Enrollment increased at five campuses: UH-West O‘ahu (20.2%); Kaua‘i CC (4.3%); Windward CC (1.3%); Leeward CC (0.8)%; UH Hilo (0.4)%. Enrollment declined at five campuses: UH Mānoa (<-0.1%); Honolulu CC (-0.4%); Kapi‘olani CC (-1.5%); Maui College (-3.2%); Hawai‘i CC (-6.5%). Overall, the recent period of rapid growth in enrollment appears to have ended.
• The forecast for the UH system projects a 0.1% decrease for Fall 2013, to 60,292 students, with subsequent annual growth through Fall 2018 averaging 0.4%. This rate of growth would result in enrollment surpassing 61,500 by 2018 (Table 1). This forecast is lower than the enrollment projection made last year.
• The Hawai>i Department of Education forecast of public high school seniors calls for a
7.9% decline through school year 2015-16, with the number subsequently increasing 5.7% through 2017-18 (Appendix A). The outlook for private high school graduates, as forecast by the Western Interstate Commission for Higher Education (WICHE), is for
2
graduates to average around 2,760 through 2015-16, then to increase mildly through 2017-18 (Appendix B).
• The going rate (college participation rate) of Hawai‘i public high school graduates into
the UH system has been stable for the last four years at about 40%, while the private high school going rate has measured between 30% and 33.5% (see the MAPS report entitled: “High School Background of First-Time Students, University of Hawai‘i, Fall 2012”). Given the forecasts in seniors and graduates, the first-time freshmen count will be stable to moderately declining through Fall 2016, with subsequent mild growth through Fall 2018.
• Since the admission of lower division students began in Fall 2007, enrollment growth at UH-West O‘ahu has picked up. Enrollment has increased 131% since Fall 2006, increasing 20.2% in Fall 2012 alone. The addition of new facilities, which opened in Fall 2012, will help to sustain continued growth for at least the next several years.
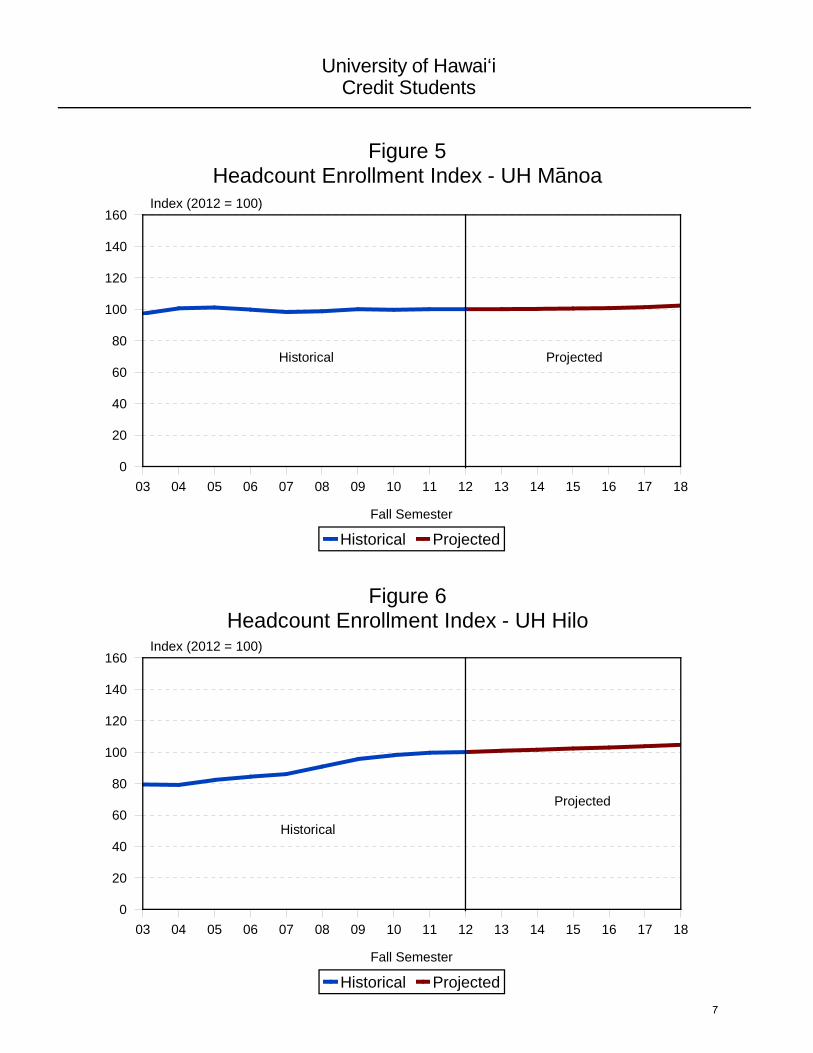
• The University of Hawai‘i at Hilo is scheduled to open a new undergraduate housing complex in Fall 2013. This complex will add 300 housing units to the current inventory, bringing the total to around 900. This complex is Phase 1 in the University Village development plan, that includes a commercial center, with the goal of creating a college town environment. New housing, along with continued mild growth in graduate level programs, will help to boost enrollment over 4,350 by Fall 2018.
• Classified graduate enrollment at UH Mānoa declined 1.3% in Fall 2011 and another
5.1% in Fall 2012. Further mild decline is anticipated. The decline in graduate enrollment may be offset by increases in undergraduate transfers from the UH Community Colleges, as well as some growth in continuing student enrollment. Overall, enrollment at UH Mānoa is forecast to increase very mildly through Fall 2018.
• Enrollment at the UH Community Colleges grew rapidly from Fall 2006 to 2009,
increasing by over 27% in just three years. However, enrollment growth slowed in Fall 2010 and has declined the last two years. One factor for the decrease is the improving labor market (declining unemployment rates), which our model shows has a negative impact on enrollment. The improving labor market may allow more students to opt for work rather than continued post-secondary education. The forecast calls for stability in enrollment for the UHCC system as a whole, with the total remaining above 33,000 through Fall 2018.
3
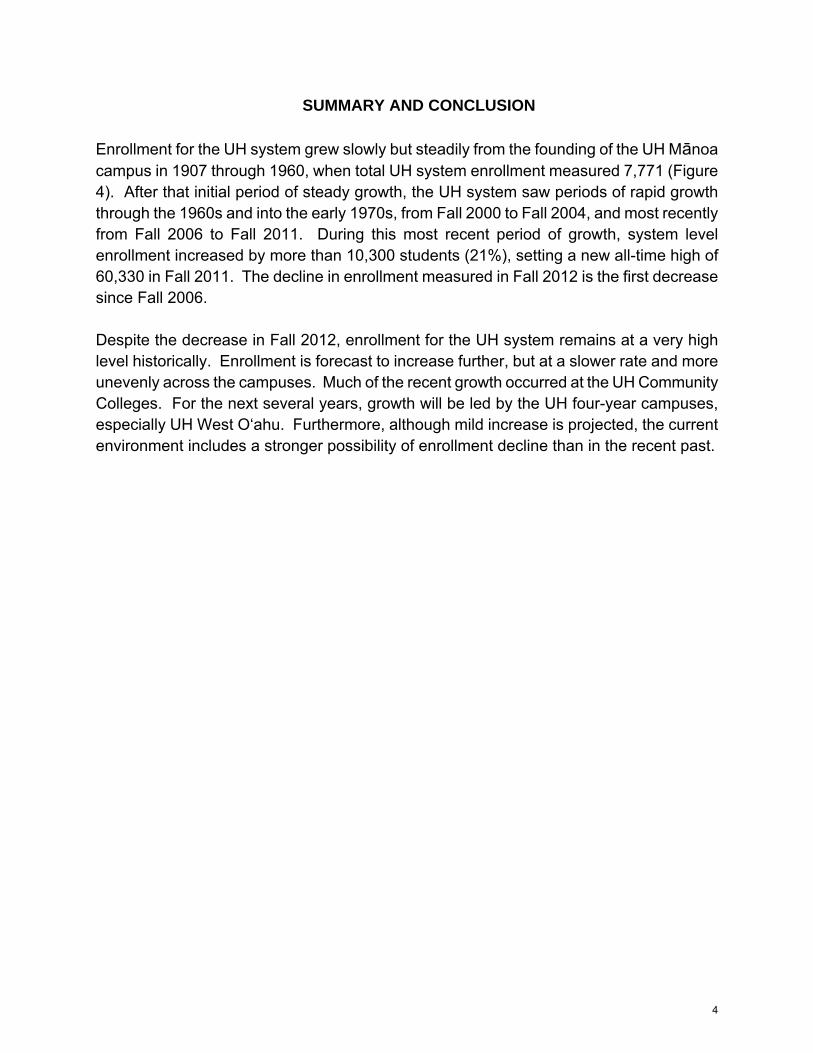
SUMMARY AND CONCLUSION
Enrollment for the UH system grew slowly but steadily from the founding of the UH Mānoa campus in 1907 through 1960, when total UH system enrollment measured 7,771 (Figure 4). After that initial period of steady growth, the UH system saw periods of rapid growth through the 1960s and into the early 1970s, from Fall 2000 to Fall 2004, and most recently from Fall 2006 to Fall 2011. During this most recent period of growth, system level enrollment increased by more than 10,300 students (21%), setting a new all-time high of 60,330 in Fall 2011. The decline in enrollment measured in Fall 2012 is the first decrease since Fall 2006. Despite the decrease in Fall 2012, enrollment for the UH system remains at a very high level historically. Enrollment is forecast to increase further, but at a slower rate and more unevenly across the campuses. Much of the recent growth occurred at the UH Community Colleges. For the next several years, growth will be led by the UH four-year campuses, especially UH West O‘ahu. Furthermore, although mild increase is projected, the current environment includes a stronger possibility of enrollment decline than in the recent past.
4
03 04 05 06 07 08 09 10 11 12 13 14 15 16 17 18
Fall Semester
0
10
20
30
40
50
60
70 Thousands
Historical Projected
Figure 1Historical and Projected Headcount Enrollment
03 04 05 06 07 08 09 10 11 12 13 14 15 16 17 18
Fall Semester
0
20
40
60
80
100
120
140
160 Index (2012 = 100)
Historical Projected
Figure 2Headcount Enrollment Index - UH System
University of Hawai‘iCredit Students
Historical
Projected
5
1908 13 18 23 28 33 38 43 48 53 58 63 68 73 78 83 88 93 98 03 08 13 2018
Fall Semester
0
10
20
30
40
50
60
70 Thousands
Historical Projected
Figure 4Historical and Projected Enrollment - UH System
University of Hawai‘iCredit Students
03 04 05 06 07 08 09 10 11 12 13 14 15 16 17 18
Fall Semester
30
40
50
60
70 Thousands
Figure 3Projected Enrollment with Error Boundaries
Historical Projected
Upper Bound
Lower Bound
6
03 04 05 06 07 08 09 10 11 12 13 14 15 16 17 18
Fall Semester
0
20
40
60
80
100
120
140
160 Index (2012 = 100)
Historical Projected
Figure 5Headcount Enrollment Index - UH Manoa
University of Hawai‘iCredit Students
03 04 05 06 07 08 09 10 11 12 13 14 15 16 17 18
Fall Semester
0
20
40
60
80
100
120
140
160 Index (2012 = 100)
Historical Projected
Figure 6Headcount Enrollment Index - UH Hilo
Historical
Projected
Historical Projected
7

03 04 05 06 07 08 09 10 11 12 13 14 15 16 17 18
Fall Semester
0
20
40
60
80
100
120
140
160 Index (2012 = 100)
Historical Projected
Figure 7Headcount Enrollment Index - UH-West O‘ahu
University of Hawai‘iCredit Students
03 04 05 06 07 08 09 10 11 12 13 14 15 16 17 18
Fall Semester
0
20
40
60
80
100
120
140
160 Index (2012 = 100)
Historical Projected
Figure 8Headcount Enrollment Index - UH Community Colleges
Historical
Projected
Historical
Projected
8
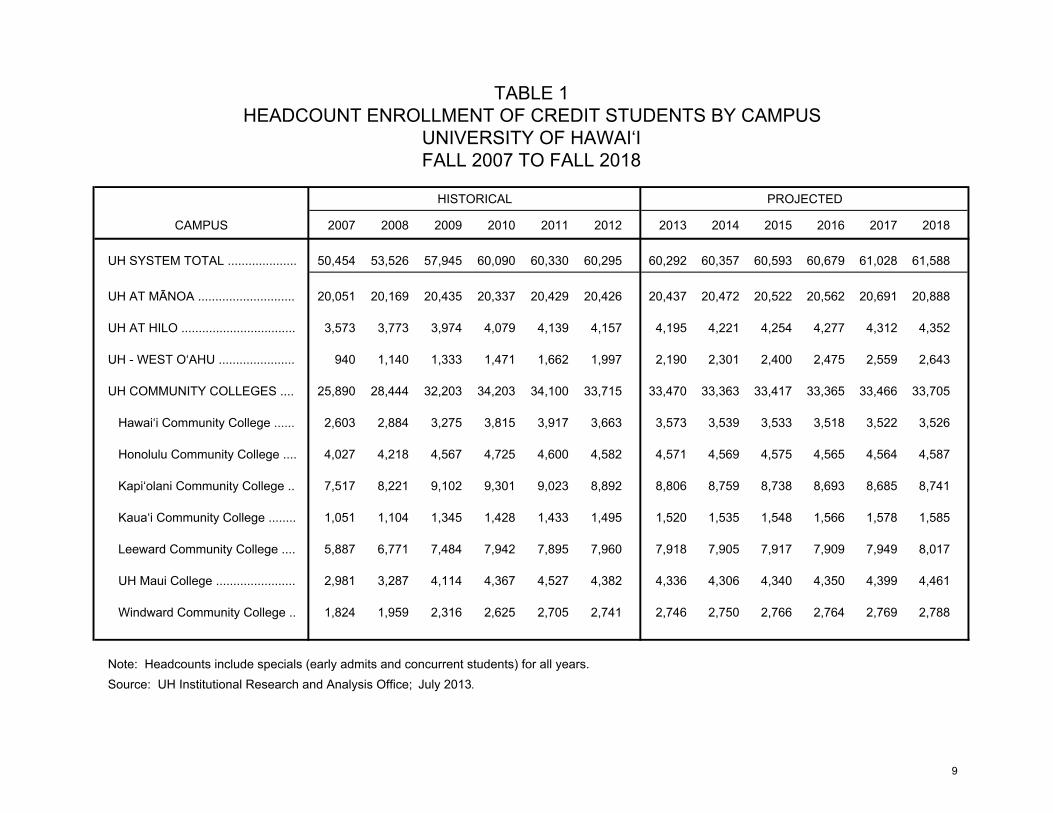
TABLE 1HEADCOUNT ENROLLMENT OF CREDIT STUDENTS BY CAMPUS
UNIVERSITY OF HAWAI‘IFALL 2007 TO FALL 2018
HISTORICAL PROJECTED
CAMPUS 2007 2008 2009 2010 2011 2012 2013 2014 2015 2016 2017 2018
UH SYSTEM TOTAL .................... 50,454 53,526 57,945 60,090 60,330 60,295 60,292 60,357 60,593 60,679 61,028 61,588
UH AT MĀNOA ............................ 20,051 20,169 20,435 20,337 20,429 20,426 20,437 20,472 20,522 20,562 20,691 20,888
UH AT HILO ................................. 3,573 3,773 3,974 4,079 4,139 4,157 4,195 4,221 4,254 4,277 4,312 4,352
UH - WEST O‘AHU ...................... 940 1,140 1,333 1,471 1,662 1,997 2,190 2,301 2,400 2,475 2,559 2,643
UH COMMUNITY COLLEGES ..... 25,890 28,444 32,203 34,203 34,100 33,715 33,470 33,363 33,417 33,365 33,466 33,705
Hawai‘i Community College ...... 2,603 2,884 3,275 3,815 3,917 3,663 3,573 3,539 3,533 3,518 3,522 3,526
Honolulu Community College .... 4,027 4,218 4,567 4,725 4,600 4,582 4,571 4,569 4,575 4,565 4,564 4,587
Kapi‘olani Community College .. 7,517 8,221 9,102 9,301 9,023 8,892 8,806 8,759 8,738 8,693 8,685 8,741
Kaua‘i Community College ........ 1,051 1,104 1,345 1,428 1,433 1,495 1,520 1,535 1,548 1,566 1,578 1,585
Leeward Community College .... 5,887 6,771 7,484 7,942 7,895 7,960 7,918 7,905 7,917 7,909 7,949 8,017
UH Maui College ....................... 2,981 3,287 4,114 4,367 4,527 4,382 4,336 4,306 4,340 4,350 4,399 4,461
Windward Community College .. 1,824 1,959 2,316 2,625 2,705 2,741 2,746 2,750 2,766 2,764 2,769 2,788
Note: Headcounts include specials (early admits and concurrent students) for all years.Source: UH Institutional Research and Analysis Office; July 2013.
9
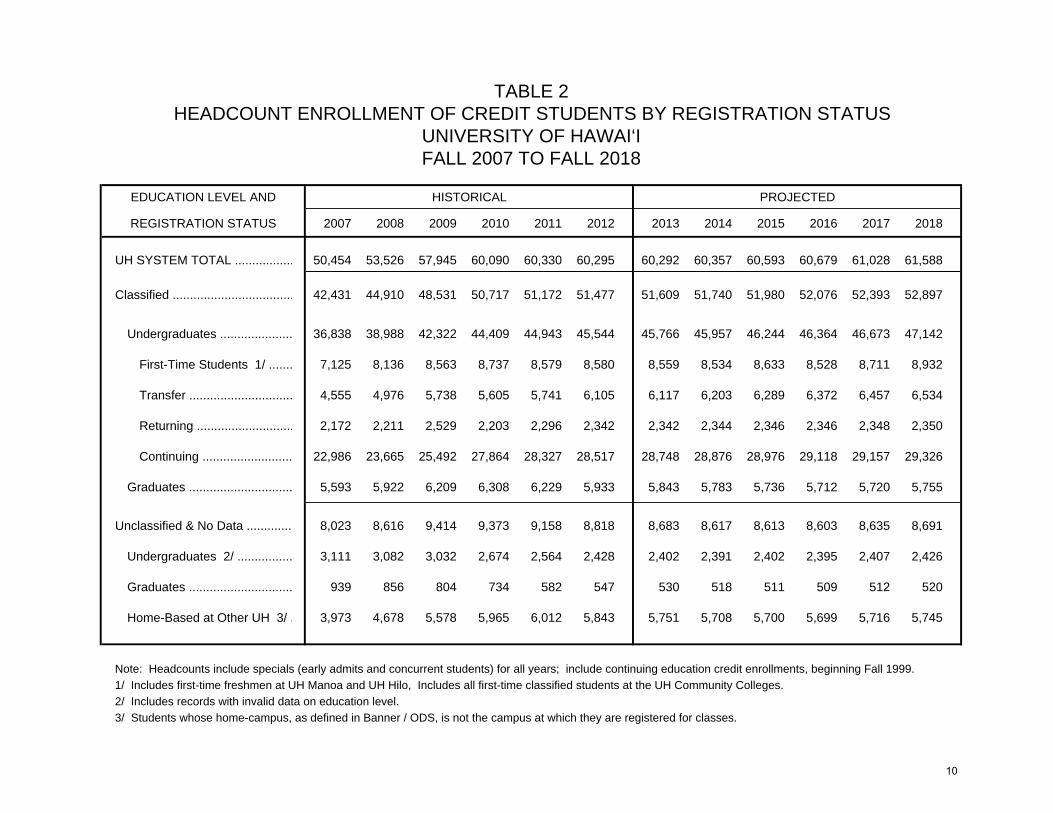
TABLE 2HEADCOUNT ENROLLMENT OF CREDIT STUDENTS BY REGISTRATION STATUS
UNIVERSITY OF HAWAI‘IFALL 2007 TO FALL 2018
EDUCATION LEVEL AND HISTORICAL PROJECTED
REGISTRATION STATUS 2007 2008 2009 2010 2011 2012 2013 2014 2015 2016 2017 2018
UH SYSTEM TOTAL ................. 50,454 53,526 57,945 60,090 60,330 60,295 60,292 60,357 60,593 60,679 61,028 61,588
Classified ................................... 42,431 44,910 48,531 50,717 51,172 51,477 51,609 51,740 51,980 52,076 52,393 52,897
Undergraduates ..................... 36,838 38,988 42,322 44,409 44,943 45,544 45,766 45,957 46,244 46,364 46,673 47,142
First-Time Students 1/ ....... 7,125 8,136 8,563 8,737 8,579 8,580 8,559 8,534 8,633 8,528 8,711 8,932
Transfer .............................. 4,555 4,976 5,738 5,605 5,741 6,105 6,117 6,203 6,289 6,372 6,457 6,534
Returning ............................ 2,172 2,211 2,529 2,203 2,296 2,342 2,342 2,344 2,346 2,346 2,348 2,350
Continuing .......................... 22,986 23,665 25,492 27,864 28,327 28,517 28,748 28,876 28,976 29,118 29,157 29,326
Graduates .............................. 5,593 5,922 6,209 6,308 6,229 5,933 5,843 5,783 5,736 5,712 5,720 5,755
Unclassified & No Data ............. 8,023 8,616 9,414 9,373 9,158 8,818 8,683 8,617 8,613 8,603 8,635 8,691
Undergraduates 2/ ................ 3,111 3,082 3,032 2,674 2,564 2,428 2,402 2,391 2,402 2,395 2,407 2,426
Graduates .............................. 939 856 804 734 582 547 530 518 511 509 512 520
Home-Based at Other UH 3/ . 3,973 4,678 5,578 5,965 6,012 5,843 5,751 5,708 5,700 5,699 5,716 5,745
Note: Headcounts include specials (early admits and concurrent students) for all years; include continuing education credit enrollments, beginning Fall 1999.1/ Includes first-time freshmen at UH Manoa and UH Hilo, Includes all first-time classified students at the UH Community Colleges.2/ Includes records with invalid data on education level.3/ Students whose home-campus, as defined in Banner / ODS, is not the campus at which they are registered for classes.
10
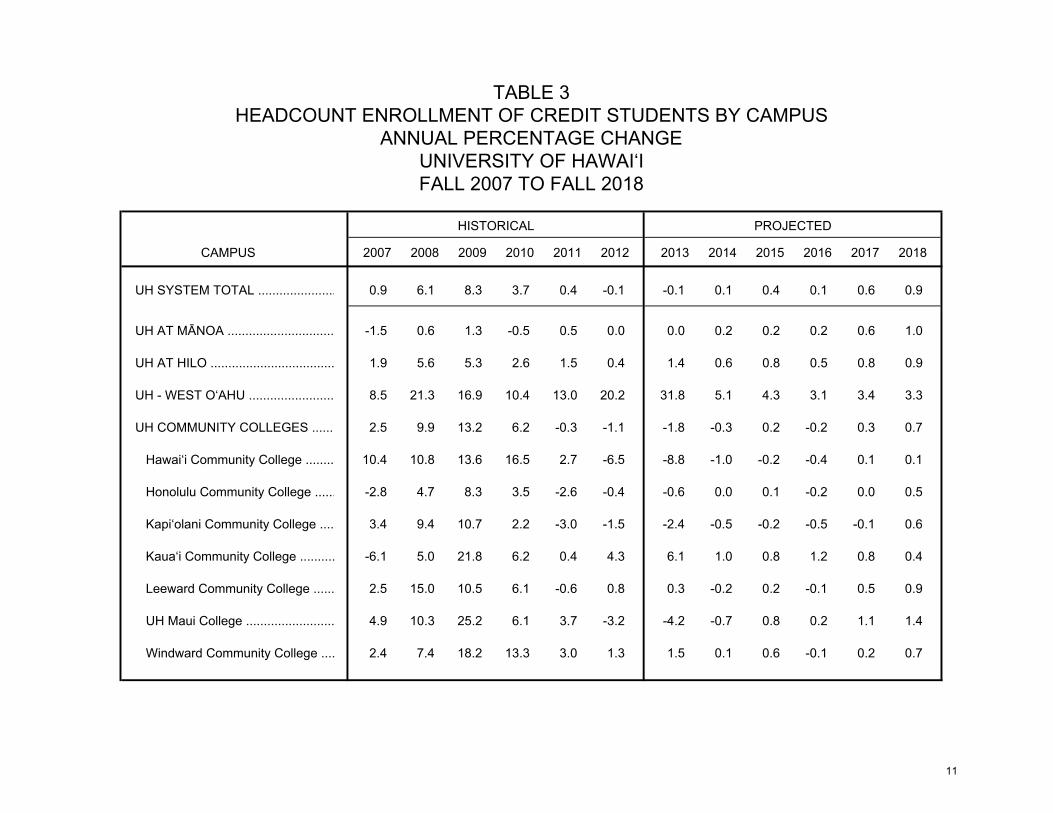
TABLE 3HEADCOUNT ENROLLMENT OF CREDIT STUDENTS BY CAMPUS
ANNUAL PERCENTAGE CHANGEUNIVERSITY OF HAWAI‘IFALL 2007 TO FALL 2018
HISTORICAL PROJECTED
CAMPUS 2007 2008 2009 2010 2011 2012 2013 2014 2015 2016 2017 2018
UH SYSTEM TOTAL ...................... 0.9 6.1 8.3 3.7 0.4 -0.1 -0.1 0.1 0.4 0.1 0.6 0.9
UH AT MĀNOA .............................. -1.5 0.6 1.3 -0.5 0.5 0.0 0.0 0.2 0.2 0.2 0.6 1.0
UH AT HILO ................................... 1.9 5.6 5.3 2.6 1.5 0.4 1.4 0.6 0.8 0.5 0.8 0.9
UH - WEST O‘AHU ........................ 8.5 21.3 16.9 10.4 13.0 20.2 31.8 5.1 4.3 3.1 3.4 3.3
UH COMMUNITY COLLEGES ....... 2.5 9.9 13.2 6.2 -0.3 -1.1 -1.8 -0.3 0.2 -0.2 0.3 0.7
Hawai‘i Community College ........ 10.4 10.8 13.6 16.5 2.7 -6.5 -8.8 -1.0 -0.2 -0.4 0.1 0.1
Honolulu Community College ...... -2.8 4.7 8.3 3.5 -2.6 -0.4 -0.6 0.0 0.1 -0.2 0.0 0.5
Kapi‘olani Community College .... 3.4 9.4 10.7 2.2 -3.0 -1.5 -2.4 -0.5 -0.2 -0.5 -0.1 0.6
Kaua‘i Community College .......... -6.1 5.0 21.8 6.2 0.4 4.3 6.1 1.0 0.8 1.2 0.8 0.4
Leeward Community College ...... 2.5 15.0 10.5 6.1 -0.6 0.8 0.3 -0.2 0.2 -0.1 0.5 0.9
UH Maui College ......................... 4.9 10.3 25.2 6.1 3.7 -3.2 -4.2 -0.7 0.8 0.2 1.1 1.4
Windward Community College .... 2.4 7.4 18.2 13.3 3.0 1.3 1.5 0.1 0.6 -0.1 0.2 0.7
11
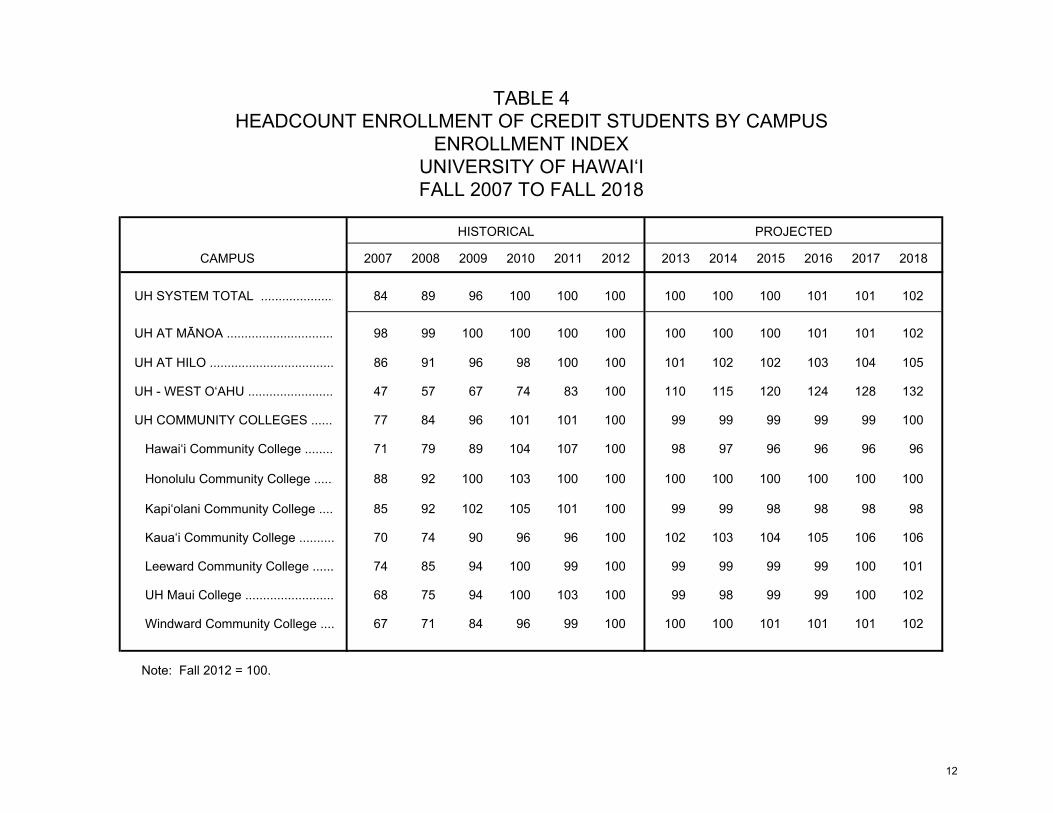
TABLE 4HEADCOUNT ENROLLMENT OF CREDIT STUDENTS BY CAMPUS
ENROLLMENT INDEXUNIVERSITY OF HAWAI‘IFALL 2007 TO FALL 2018
HISTORICAL PROJECTED
CAMPUS 2007 2008 2009 2010 2011 2012 2013 2014 2015 2016 2017 2018
UH SYSTEM TOTAL ..................... 84 89 96 100 100 100 100 100 100 101 101 102
UH AT MĀNOA .............................. 98 99 100 100 100 100 100 100 100 101 101 102
UH AT HILO ................................... 86 91 96 98 100 100 101 102 102 103 104 105
UH - WEST O‘AHU ........................ 47 57 67 74 83 100 110 115 120 124 128 132
UH COMMUNITY COLLEGES ....... 77 84 96 101 101 100 99 99 99 99 99 100
Hawai‘i Community College ........ 71 79 89 104 107 100 98 97 96 96 96 96
Honolulu Community College ...... 88 92 100 103 100 100 100 100 100 100 100 100
Kapi‘olani Community College .... 85 92 102 105 101 100 99 99 98 98 98 98
Kaua‘i Community College .......... 70 74 90 96 96 100 102 103 104 105 106 106
Leeward Community College ...... 74 85 94 100 99 100 99 99 99 99 100 101
UH Maui College ......................... 68 75 94 100 103 100 99 98 99 99 100 102
Windward Community College .... 67 71 84 96 99 100 100 100 101 101 101 102
Note: Fall 2012 = 100.
12
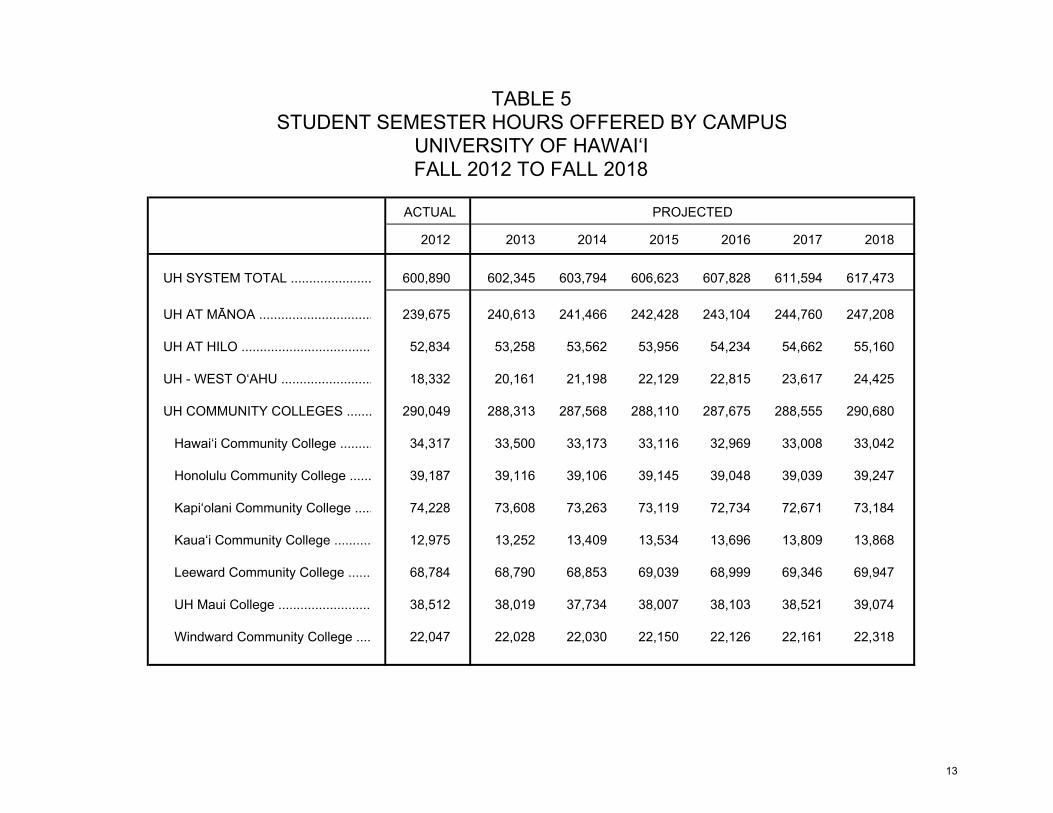
TABLE 5STUDENT SEMESTER HOURS OFFERED BY CAMPUS
UNIVERSITY OF HAWAI‘IFALL 2012 TO FALL 2018
ACTUAL PROJECTED
2012 2013 2014 2015 2016 2017 2018
UH SYSTEM TOTAL ...................... 600,890 602,345 603,794 606,623 607,828 611,594 617,473
UH AT MĀNOA ............................... 239,675 240,613 241,466 242,428 243,104 244,760 247,208
UH AT HILO .................................... 52,834 53,258 53,562 53,956 54,234 54,662 55,160
UH - WEST O‘AHU ......................... 18,332 20,161 21,198 22,129 22,815 23,617 24,425
UH COMMUNITY COLLEGES ....... 290,049 288,313 287,568 288,110 287,675 288,555 290,680
Hawai‘i Community College ......... 34,317 33,500 33,173 33,116 32,969 33,008 33,042
Honolulu Community College ...... 39,187 39,116 39,106 39,145 39,048 39,039 39,247
Kapi‘olani Community College ..... 74,228 73,608 73,263 73,119 72,734 72,671 73,184
Kaua‘i Community College .......... 12,975 13,252 13,409 13,534 13,696 13,809 13,868
Leeward Community College ....... 68,784 68,790 68,853 69,039 68,999 69,346 69,947
UH Maui College .......................... 38,512 38,019 37,734 38,007 38,103 38,521 39,074
Windward Community College .... 22,047 22,028 22,030 22,150 22,126 22,161 22,318
13
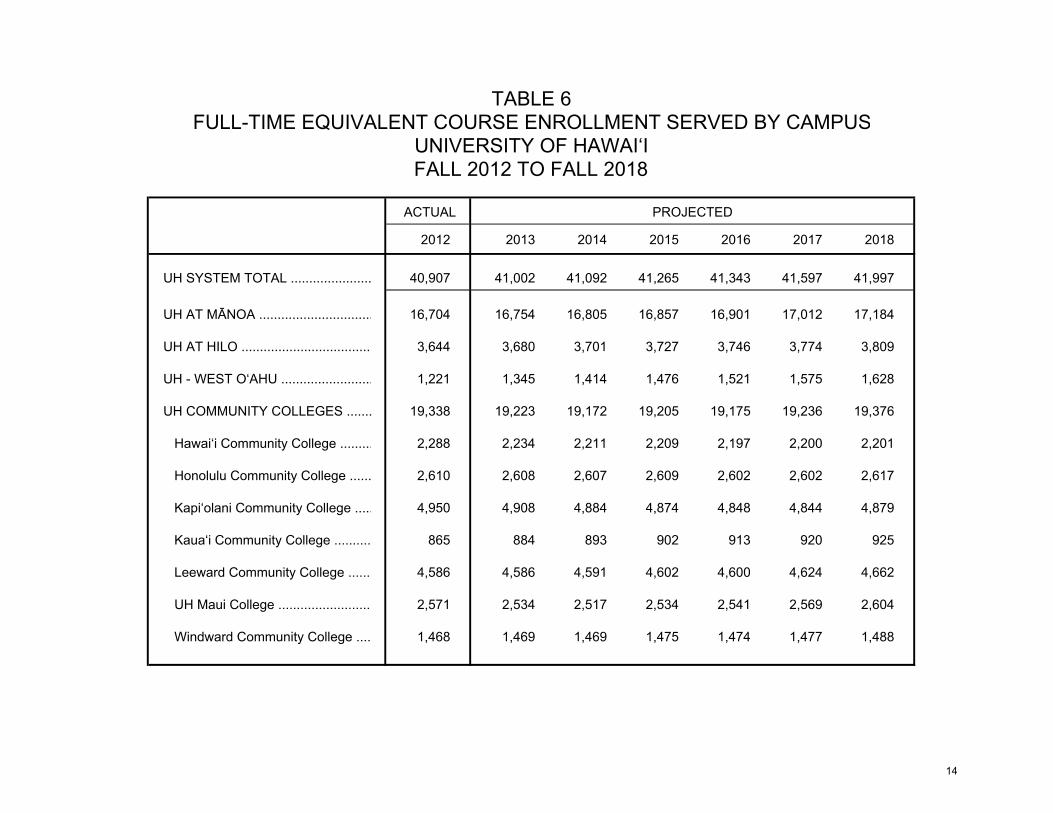
TABLE 6FULL-TIME EQUIVALENT COURSE ENROLLMENT SERVED BY CAMPUS
UNIVERSITY OF HAWAI‘IFALL 2012 TO FALL 2018
ACTUAL PROJECTED
2012 2013 2014 2015 2016 2017 2018
UH SYSTEM TOTAL ...................... 40,907 41,002 41,092 41,265 41,343 41,597 41,997
UH AT MĀNOA ............................... 16,704 16,754 16,805 16,857 16,901 17,012 17,184
UH AT HILO .................................... 3,644 3,680 3,701 3,727 3,746 3,774 3,809
UH - WEST O‘AHU ......................... 1,221 1,345 1,414 1,476 1,521 1,575 1,628
UH COMMUNITY COLLEGES ....... 19,338 19,223 19,172 19,205 19,175 19,236 19,376
Hawai‘i Community College ......... 2,288 2,234 2,211 2,209 2,197 2,200 2,201
Honolulu Community College ...... 2,610 2,608 2,607 2,609 2,602 2,602 2,617
Kapi‘olani Community College ..... 4,950 4,908 4,884 4,874 4,848 4,844 4,879
Kaua‘i Community College .......... 865 884 893 902 913 920 925
Leeward Community College ....... 4,586 4,586 4,591 4,602 4,600 4,624 4,662
UH Maui College .......................... 2,571 2,534 2,517 2,534 2,541 2,569 2,604
Windward Community College .... 1,468 1,469 1,469 1,475 1,474 1,477 1,488
14
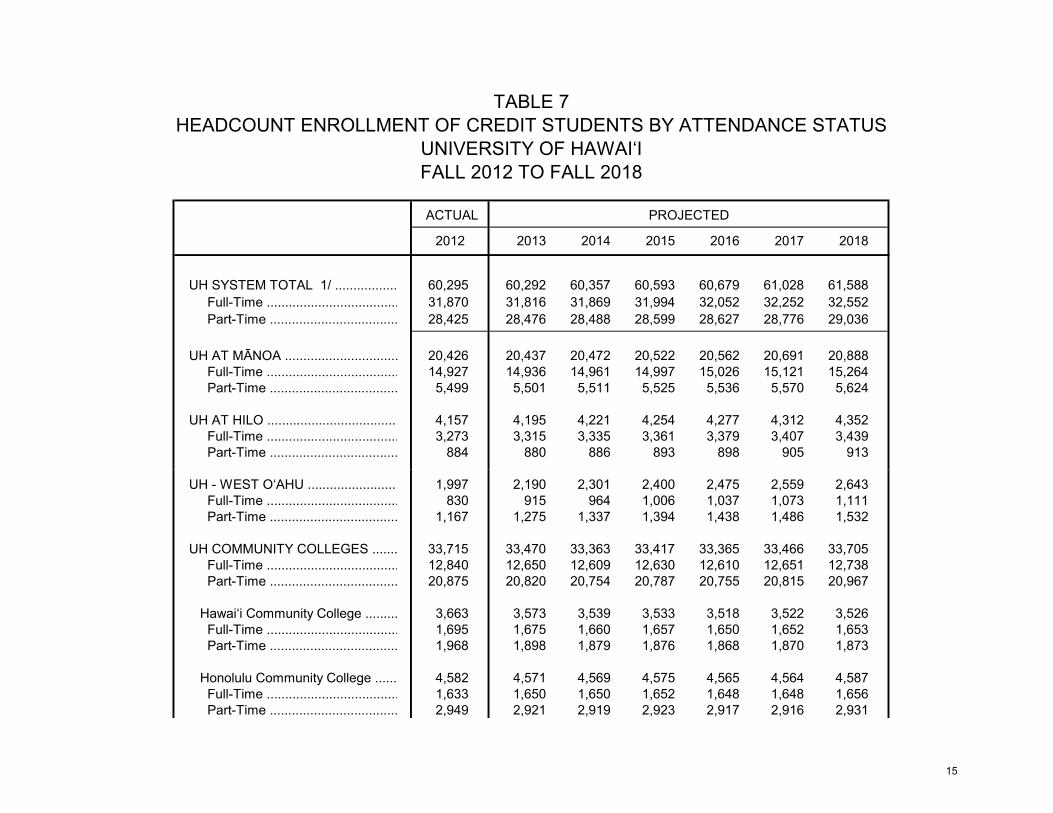
TABLE 7HEADCOUNT ENROLLMENT OF CREDIT STUDENTS BY ATTENDANCE STATUS
UNIVERSITY OF HAWAI‘IFALL 2012 TO FALL 2018
ACTUAL PROJECTED
2012 2013 2014 2015 2016 2017 2018
UH SYSTEM TOTAL 1/ ................. 60,295 60,292 60,357 60,593 60,679 61,028 61,588 Full-Time .................................... 31,870 31,816 31,869 31,994 32,052 32,252 32,552 Part-Time ................................... 28,425 28,476 28,488 28,599 28,627 28,776 29,036
UH AT MĀNOA ............................... 20,426 20,437 20,472 20,522 20,562 20,691 20,888 Full-Time .................................... 14,927 14,936 14,961 14,997 15,026 15,121 15,264 Part-Time ................................... 5,499 5,501 5,511 5,525 5,536 5,570 5,624
UH AT HILO .................................... 4,157 4,195 4,221 4,254 4,277 4,312 4,352 Full-Time .................................... 3,273 3,315 3,335 3,361 3,379 3,407 3,439 Part-Time ................................... 884 880 886 893 898 905 913
UH - WEST O‘AHU ......................... 1,997 2,190 2,301 2,400 2,475 2,559 2,643 Full-Time .................................... 830 915 964 1,006 1,037 1,073 1,111 Part-Time ................................... 1,167 1,275 1,337 1,394 1,438 1,486 1,532
UH COMMUNITY COLLEGES ....... 33,715 33,470 33,363 33,417 33,365 33,466 33,705 Full-Time .................................... 12,840 12,650 12,609 12,630 12,610 12,651 12,738 Part-Time ................................... 20,875 20,820 20,754 20,787 20,755 20,815 20,967
Hawai‘i Community College ......... 3,663 3,573 3,539 3,533 3,518 3,522 3,526 Full-Time .................................... 1,695 1,675 1,660 1,657 1,650 1,652 1,653 Part-Time ................................... 1,968 1,898 1,879 1,876 1,868 1,870 1,873
Honolulu Community College ...... 4,582 4,571 4,569 4,575 4,565 4,564 4,587 Full-Time .................................... 1,633 1,650 1,650 1,652 1,648 1,648 1,656 Part-Time ................................... 2,949 2,921 2,919 2,923 2,917 2,916 2,931
15
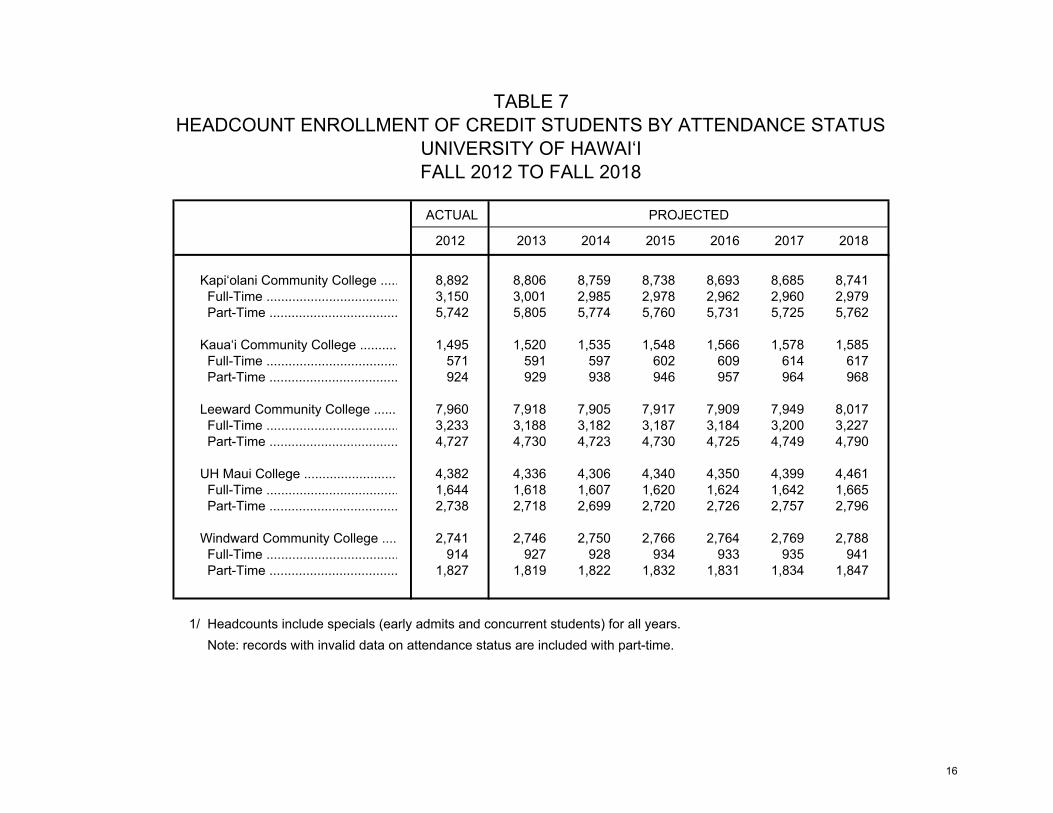
TABLE 7HEADCOUNT ENROLLMENT OF CREDIT STUDENTS BY ATTENDANCE STATUS
UNIVERSITY OF HAWAI‘IFALL 2012 TO FALL 2018
ACTUAL PROJECTED
2012 2013 2014 2015 2016 2017 2018
Kapi‘olani Community College ..... 8,892 8,806 8,759 8,738 8,693 8,685 8,741 Full-Time .................................... 3,150 3,001 2,985 2,978 2,962 2,960 2,979 Part-Time ................................... 5,742 5,805 5,774 5,760 5,731 5,725 5,762
Kaua‘i Community College .......... 1,495 1,520 1,535 1,548 1,566 1,578 1,585 Full-Time .................................... 571 591 597 602 609 614 617 Part-Time ................................... 924 929 938 946 957 964 968
Leeward Community College ....... 7,960 7,918 7,905 7,917 7,909 7,949 8,017 Full-Time .................................... 3,233 3,188 3,182 3,187 3,184 3,200 3,227 Part-Time ................................... 4,727 4,730 4,723 4,730 4,725 4,749 4,790
UH Maui College .......................... 4,382 4,336 4,306 4,340 4,350 4,399 4,461 Full-Time .................................... 1,644 1,618 1,607 1,620 1,624 1,642 1,665 Part-Time ................................... 2,738 2,718 2,699 2,720 2,726 2,757 2,796
Windward Community College .... 2,741 2,746 2,750 2,766 2,764 2,769 2,788 Full-Time .................................... 914 927 928 934 933 935 941 Part-Time ................................... 1,827 1,819 1,822 1,832 1,831 1,834 1,847
1/ Headcounts include specials (early admits and concurrent students) for all years. Note: records with invalid data on attendance status are included with part-time.
16
APPENDIX AHAWAI‘I PUBLIC HIGH SCHOOL SENIORS BY SCHOOL DISTRICT
ACADEMIC YEARS 2007-08 TO 2018-19
HISTORICAL PROJECTED
SCHOOL DISTRICT 2007-08 2008-09 2009-10 2010-11 2011-12 2012-13 2013-14 2014-15 2015-16 2016-17 2017-18 2018-19
TOTAL ............................... 9,819 9,990 9,400 9,602 9,897 9,588 9,408 9,566 9,111 9,271 9,630 9,226
O'ahu Districts .................... 6,370 6,370 6,032 6,232 6,568 6,224 6,097 6,107 5,787 5,869 6,205 5,882
Honolulu District ............. 1,664 1,726 1,566 1,668 1,710 1,666 1,654 1,627 1,505 1,484 1,636 1,530Central District ................ 1,699 1,753 1,697 1,784 1,964 1,803 1,800 1,822 1,724 1,747 1,811 1,719Leeward District .............. 2,157 2,091 2,039 2,002 2,075 2,044 1,963 1,957 1,922 2,019 2,097 2,011Windward District ............ 850 800 730 778 819 711 680 701 636 619 661 622
Neighbor Island Districts .... 3,225 3,372 3,134 3,133 3,065 3,102 2,962 3,000 2,845 2,898 2,911 2,805
Hawai‘i District ................ 1,474 1,565 1,520 1,382 1,384 1,348 1,327 1,314 1,245 1,264 1,268 1,270Maui District .................... 1,159 1,179 1,091 1,156 1,087 1,182 1,089 1,154 1,052 1,104 1,132 1,032Kaua‘i District .................. 592 628 523 595 594 572 546 532 548 530 511 503
Other Schools .................... 224 248 234 237 264 262 349 459 479 504 514 539Charter Schools 1/ ......... 224 248 234 237 264 262 349 459 479 504 514 539
1/ Includes all districts. Source: Department of Education for the State of Hawai‘i. Regular Education seniors only.
17
APPENDIX BHAWAI‘I HIGH SCHOOL GRADUATES
WICHE HISTORICAL AND PROJECTED - 2012 SERIES
Academic Total Pct Public Pct Private Pct Year Chnge Chnge Chnge
1996-97 11,547 8,929 2,6181997-98 12,246 6.1 9,670 8.3 2,576 -1.61998-99 12,247 0.0 9,714 0.5 2,533 -1.71999-00 13,398 9.4 10,437 7.4 2,961 16.92000-01 13,490 0.7 10,102 -3.2 3,388 14.42001-02 13,536 0.3 10,452 3.5 3,084 -9.02002-03 12,793 -5.5 10,013 -4.2 2,780 -9.92003-04 12,953 1.3 10,324 3.1 2,629 -5.42004-05 13,396 3.4 10,813 4.7 2,583 -1.72005-06 13,080 -2.4 10,922 1.0 2,158 -16.52006-07 13,448 2.8 11,063 1.3 2,385 10.52007-08 14,137 5.1 11,613 5.0 2,524 5.82008-09 14,167 0.2 11,508 -0.9 2,659 5.32009-10 13,535 -4.5 10,807 -6.1 2,728 2.62010-11 13,745 1.6 11,037 2.1 2,708 -0.72011-12 13,738 -0.1 10,990 -0.4 2,748 1.52012-13 13,502 -1.7 10,647 -3.1 2,855 3.92013-14 13,125 -2.8 10,347 -2.8 2,778 -2.72014-15 12,852 -2.1 10,168 -1.7 2,684 -3.42015-16 12,997 1.1 10,259 0.9 2,738 2.02016-17 13,252 2.0 10,278 0.2 2,974 8.62017-18 13,654 3.0 10,628 3.4 3,026 1.72018-19 12,895 -5.6 10,020 -5.7 2,875 -5.02019-20 13,354 3.6 10,532 5.1 2,822 -1.82020-01 13,772 3.1 10,738 2.0 3,034 7.52021-22 13,910 1.0 10,823 0.8 3,087 1.72022-23 13,681 -1.6 10,666 -1.5 3,015 -2.32023-24 14,456 5.7 11,281 5.8 3,175 5.32024-25 14,581 0.9 11,388 0.9 3,193 0.62025-26 14,844 1.8 11,579 1.7 3,265 2.32026-27 14,391 -3.1 11,223 -3.1 3,168 -3.02027-28 14,470 0.5 11,288 0.6 3,182 0.4
Note: Horizontal line delimits actual from projected numbers.
Note: WICHE "Historical" data may differ from UH IRO compiled data shown in the MAPS reports on the High School Background of First-Time Students.
SOURCE: "Knocking at the Door, Projections of High School Graduates;" December 2012; WICHE.
18
Appendix C University of Hawai‘i Enrollment Projection Model, 2013
Introduction
Student enrollment directly influences the University budget, program planning and decision making, as well as the human capital development and labor market for the State of Hawai‘i. A set of transfer function models, which incorporate both longitudinal change over time and cross‐sectional economic and demographic factors, has been created to project student enrollment at the University of Hawai‘i units: UH Mānoa, UH Hilo, UH West Oahu and the UH Community Colleges.
Major Factors Affecting Student Enrollment
The following economic and demographic variables were included in the initial specifications for each model.
Dependent variable:
• Enrollment headcount (1977‐2012), with associated time lags.
Independent variables (economic and demographic factors):
• Number of Hawaii high school graduates, one‐year time lag;
• Hawai‘i unemployment rate, one‐year time lag;
• Hawai‘i real gross national product, one‐year time lag (in millions of 2005 dollars);
• Hawai‘i real per capita personal income, one‐year time lag (in 2005 dollars);
• Hawai‘i Consumer Price Index (CPI‐U), one‐year time lag (in 2005 dollars).
Data Sources:
• University of Hawai‘i ODS (Operational Data Store) student data warehouse;
• University of Hawai‘i Institutional Research and Analysis Office: Enrollment Projections, University of Hawai‘i, Fall 2012 to Fall 2017;
• U.S. Bureau of Economic Analysis (BEA);
• U.S. Bureau of Labor Statistics (BLS);
• Hawai‘i State Department of Labor, Monthly Local Area Unemployment Statistics (LAUS);
• Hawai‘i State Department of Business, Economic Development and Tourism (DBEDT): Hawai‘i Databook & Quarterly Statistical & Economic Report (QSER);
• Hawai‘i State Department of Education, Hawai‘i Public School Official Enrollment Count.
• Western Interstate Commission for Higher Education, Hawai‘i Public and Private High School Graduates.
19
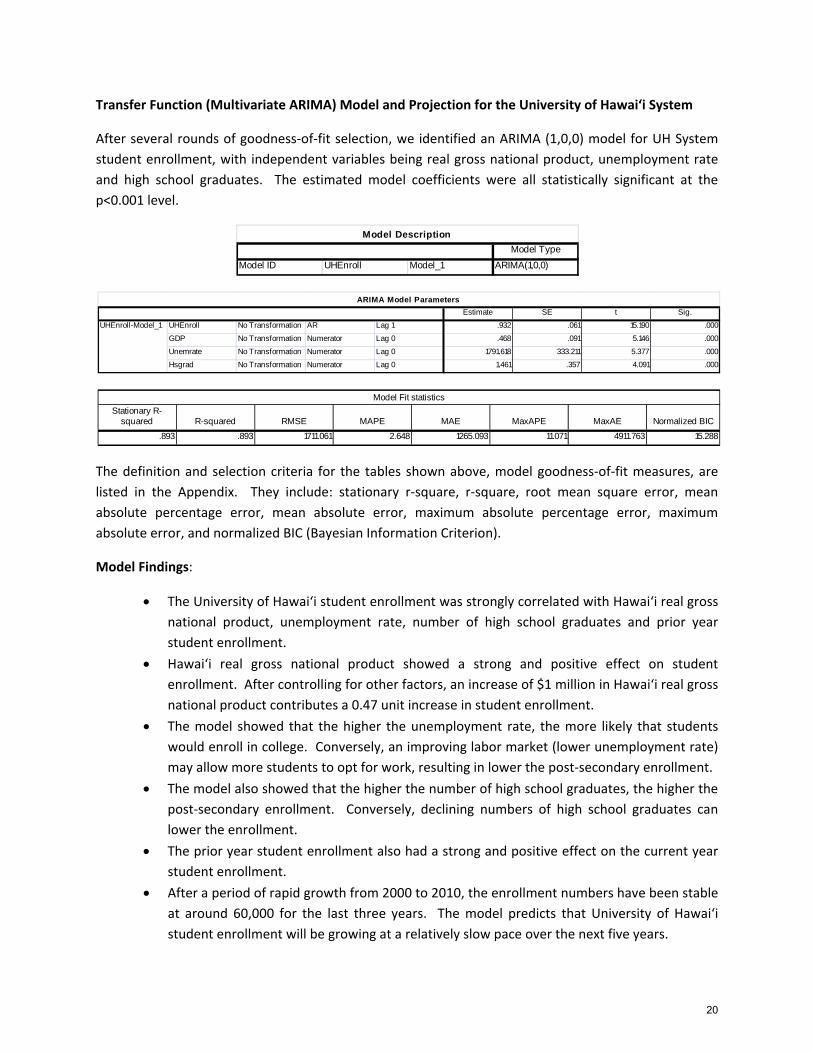
Transfer Function (Multivariate ARIMA) Model and Projection for the University of Hawai‘i System
After several rounds of goodness‐of‐fit selection, we identified an ARIMA (1,0,0) model for UH System student enrollment, with independent variables being real gross national product, unemployment rate and high school graduates. The estimated model coefficients were all statistically significant at the p<0.001 level.
The definition and selection criteria for the tables shown above, model goodness‐of‐fit measures, are listed in the Appendix. They include: stationary r‐square, r‐square, root mean square error, mean absolute percentage error, mean absolute error, maximum absolute percentage error, maximum absolute error, and normalized BIC (Bayesian Information Criterion).
Model Findings:
• The University of Hawai‘i student enrollment was strongly correlated with Hawai‘i real gross national product, unemployment rate, number of high school graduates and prior year student enrollment.
• Hawai‘i real gross national product showed a strong and positive effect on student enrollment. After controlling for other factors, an increase of $1 million in Hawai‘i real gross national product contributes a 0.47 unit increase in student enrollment.
• The model showed that the higher the unemployment rate, the more likely that students would enroll in college. Conversely, an improving labor market (lower unemployment rate) may allow more students to opt for work, resulting in lower the post‐secondary enrollment.
• The model also showed that the higher the number of high school graduates, the higher the post‐secondary enrollment. Conversely, declining numbers of high school graduates can lower the enrollment.
• The prior year student enrollment also had a strong and positive effect on the current year student enrollment.
• After a period of rapid growth from 2000 to 2010, the enrollment numbers have been stable at around 60,000 for the last three years. The model predicts that University of Hawai‘i student enrollment will be growing at a relatively slow pace over the next five years.
Model TypeModel ID UHEnroll Model_1 ARIMA(1,0,0)
Model Description
Estimate SE t Sig.UHEnroll No Transformation AR Lag 1 .932 .061 15.190 .000
GDP No Transformation Numerator Lag 0 .468 .091 5.146 .000
Unemrate No Transformation Numerator Lag 0 1791.618 333.211 5.377 .000Hsgrad No Transformation Numerator Lag 0 1.461 .357 4.091 .000
ARIMA Model Parameters
UHEnroll-Model_1
Stationary R-squared R-squared RMSE MAPE MAE MaxAPE MaxAE Normalized BIC
.893 .893 1711.061 2.648 1265.093 11.071 4911.763 15.288
Model Fit statistics
20
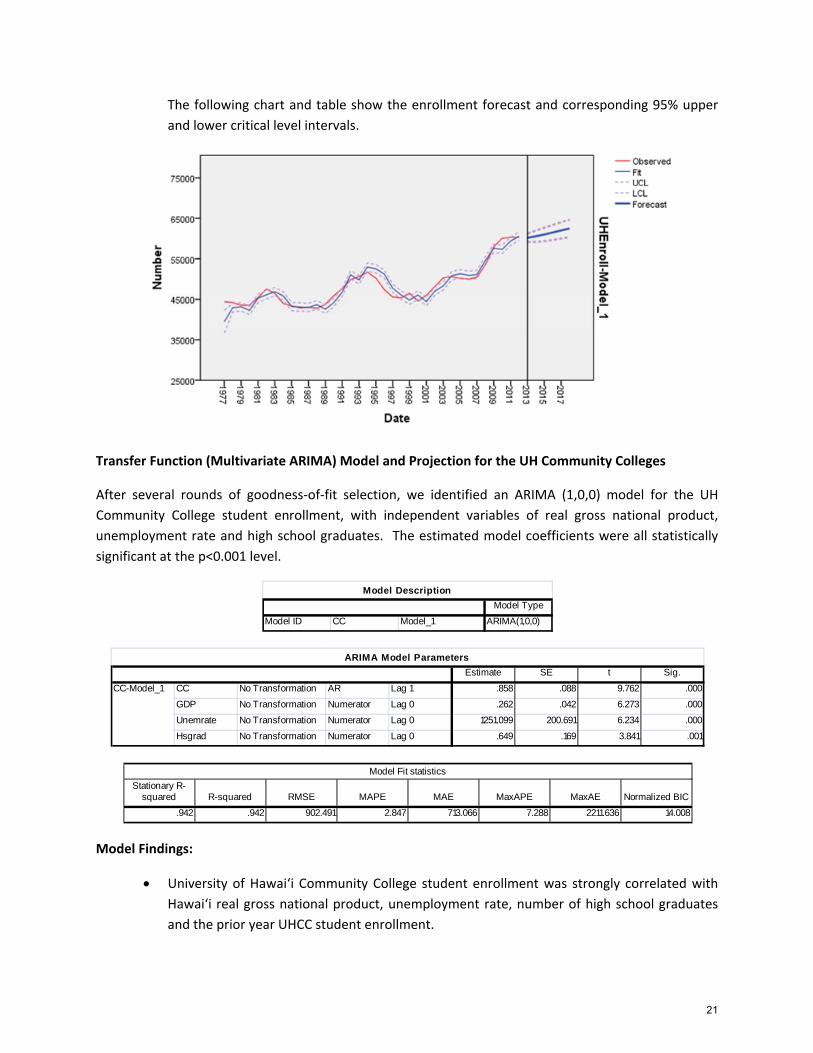
The following chart and table show the enrollment forecast and corresponding 95% upper and lower critical level intervals.
Transfer Function (Multivariate ARIMA) Model and Projection for the UH Community Colleges
After several rounds of goodness‐of‐fit selection, we identified an ARIMA (1,0,0) model for the UH Community College student enrollment, with independent variables of real gross national product, unemployment rate and high school graduates. The estimated model coefficients were all statistically significant at the p<0.001 level.
Model Findings:
• University of Hawai‘i Community College student enrollment was strongly correlated with Hawai‘i real gross national product, unemployment rate, number of high school graduates and the prior year UHCC student enrollment.
Model TypeModel ID CC Model_1 ARIMA(1,0,0)
Model Description
Estimate SE t Sig.
CC No Transformation AR Lag 1 .858 .088 9.762 .000
GDP No Transformation Numerator Lag 0 .262 .042 6.273 .000Unemrate No Transformation Numerator Lag 0 1251.099 200.691 6.234 .000
Hsgrad No Transformation Numerator Lag 0 .649 .169 3.841 .001
ARIMA Model Parameters
CC-Model_1
Stationary R-squared R-squared RMSE MAPE MAE MaxAPE MaxAE Normalized BIC
.942 .942 902.491 2.847 713.066 7.288 2211.636 14.008
Model Fit statistics
21
• Hawai‘i real gross national product showed a strong and positive effect on student enrollment. After controlling for other factors, an increase of $1 million in Hawai‘i real gross national product contributes a 0.26 unit increase in UH Community College enrollment.
• The model showed that the higher the unemployment rate, the more likely students would enroll at a UH Community College. Conversely, an improving labor market (lower unemployment rate) may allow more students to opt for work and lower the enrollment.
• The model also showed that the higher the number of high school graduates, the higher would be the UH Community College student enrollment. Conversely, declining numbers of high school graduates can lower the enrollment.
• The prior year student enrollment also had a strong and positive effect on the current year student enrollment.
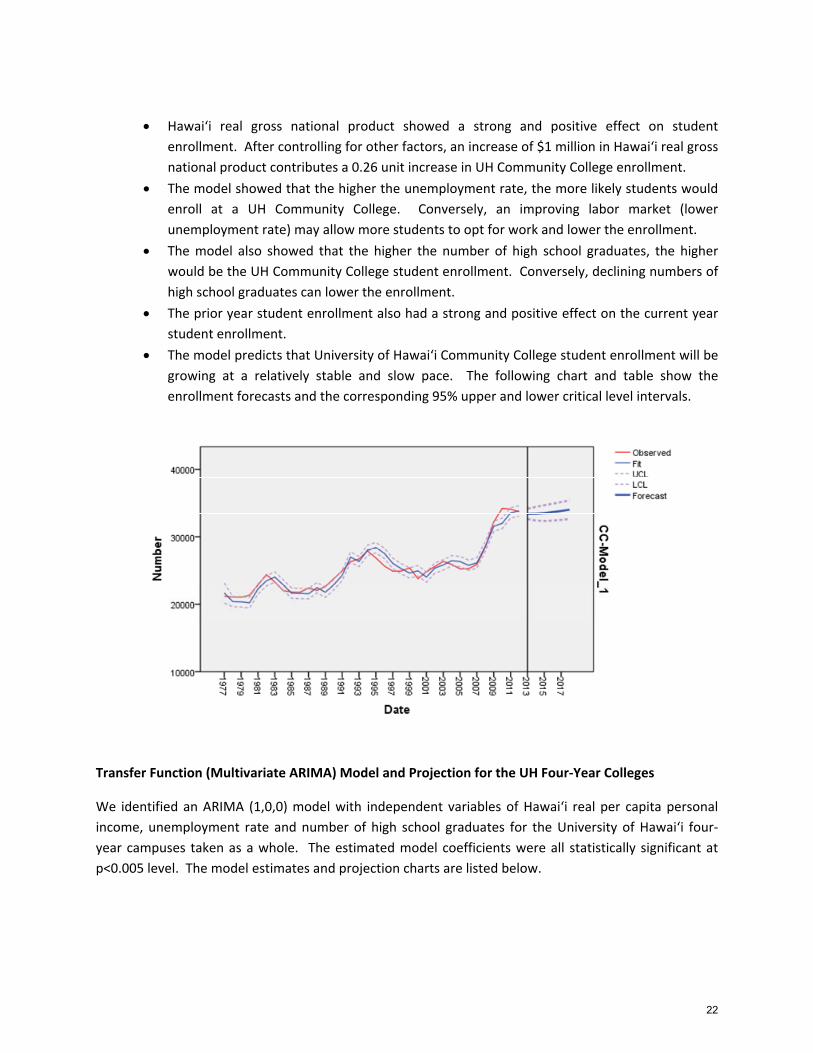
• The model predicts that University of Hawai‘i Community College student enrollment will be growing at a relatively stable and slow pace. The following chart and table show the enrollment forecasts and the corresponding 95% upper and lower critical level intervals.
Transfer Function (Multivariate ARIMA) Model and Projection for the UH Four‐Year Colleges
We identified an ARIMA (1,0,0) model with independent variables of Hawai‘i real per capita personal income, unemployment rate and number of high school graduates for the University of Hawai‘i four‐year campuses taken as a whole. The estimated model coefficients were all statistically significant at p<0.005 level. The model estimates and projection charts are listed below.
22
Model Findings:
• Enrollment at the University of Hawai‘i four‐year campuses was strongly correlated with Hawai‘i real per capita personal income, unemployment rate, number of high school graduates and prior year four‐year campus student enrollment.
• Hawai‘i real per capita personal income showed a strong and positive effect on student enrollment. After controlling for other factors, an increase of $1 million in Hawai‘i real per capita personal income contributes a 0.56 unit increase in four‐year campus enrollment.
• The model showed that the higher the unemployment rate, the more likely students would enroll in college. Conversely, an improving labor market (lower unemployment rate) may allow more students to opt for work, resulting in lower enrollment.
• The model also showed that the higher the number of high school graduates, the higher the four‐year campus student enrollment. Conversely, declining numbers of high school graduates can lower the enrollment.
• Prior four‐year campus student enrollment also had a strong and positive effect on current year student enrollment.
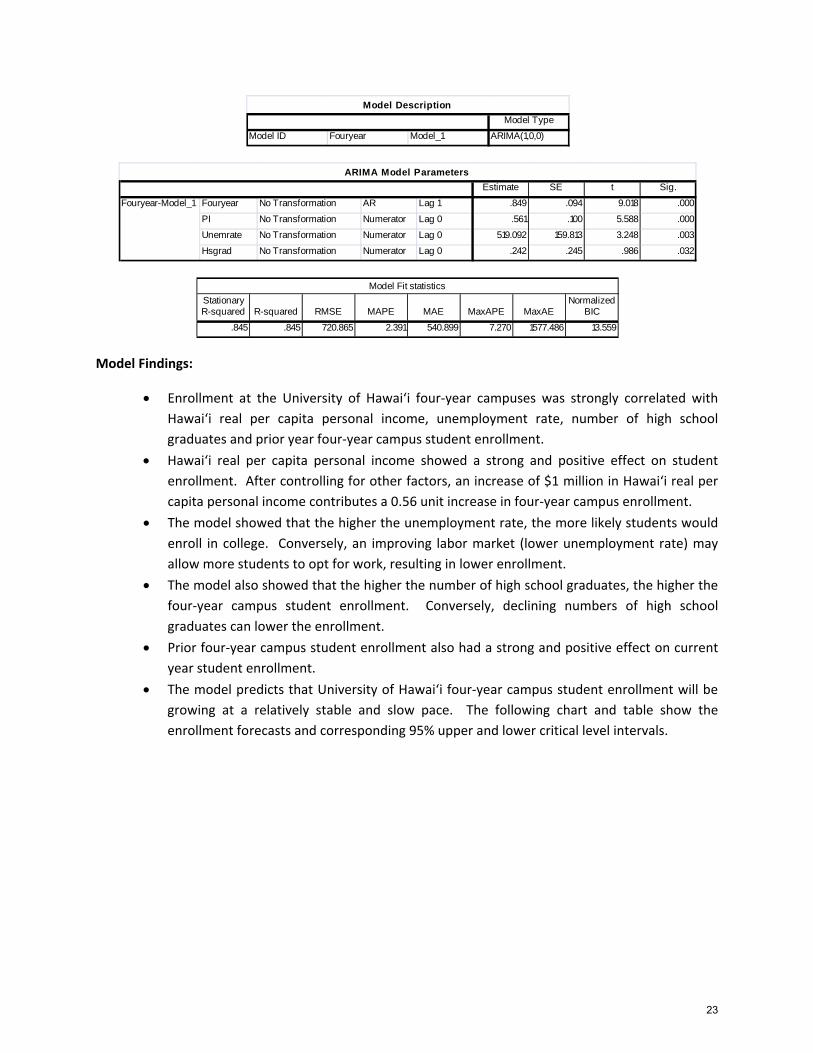
• The model predicts that University of Hawai‘i four‐year campus student enrollment will be growing at a relatively stable and slow pace. The following chart and table show the enrollment forecasts and corresponding 95% upper and lower critical level intervals.
Model TypeModel ID Fouryear Model_1 ARIMA(1,0,0)
Model Description
Estimate SE t Sig.
Fouryear No Transformation AR Lag 1 .849 .094 9.018 .000
PI No Transformation Numerator Lag 0 .561 .100 5.588 .000Unemrate No Transformation Numerator Lag 0 519.092 159.813 3.248 .003
Hsgrad No Transformation Numerator Lag 0 .242 .245 .986 .032
ARIMA Model Parameters
Fouryear-Model_1
Stationary R-squared R-squared RMSE MAPE MAE MaxAPE MaxAE
Normalized BIC
.845 .845 720.865 2.391 540.899 7.270 1577.486 13.559
Model Fit statistics
23
Transfer Function (Multivariate ARIMA) Model and Projection for UH Mānoa
We identified a different model for UH Mānoa student enrollment: an ARIMA (1,0,0) model with independent variables of Hawai‘i real per capita personal income, unemployment rate and number of high school graduates. The estimated model coefficients were all statistically significant at the p<0.01 level.
Model Findings:
• Student enrollment at the University of Hawai‘i at Mānoa was strongly correlated with Hawai‘i real per capita personal income, unemployment rate, number of high school graduates and prior year student enrollment.
• Hawai‘i real per capita personal income showed a strong and positive effect on student enrollment. After controlling for other factors, the model showed that the higher the real per capita personal income the more likely students would enroll in college.
Model TypeModel ID Manoa Model_1 ARIMA(1,0,0)
Model Description
Estimate SE t Sig.Manoa No Transformation AR Lag 1 .952 .055 17.247 .000
PI No Transformation Numerator Lag 0 .449 .098 4.570 .000Unemrate No Transformation Numerator Lag 0 386.509 138.248 2.796 .009
Hsgrad No Transformation Numerator Lag 0 .243 .224 1.084 .007
ARIMA Model Parameters
Manoa-Model_1
Stationary R-squared R-squared RMSE MAPE MAE MaxAPE MaxAE Normalized BIC
.606 .606 795.413 2.727 530.284 13.619 2874.385 13.756
Model Fit statistics
24
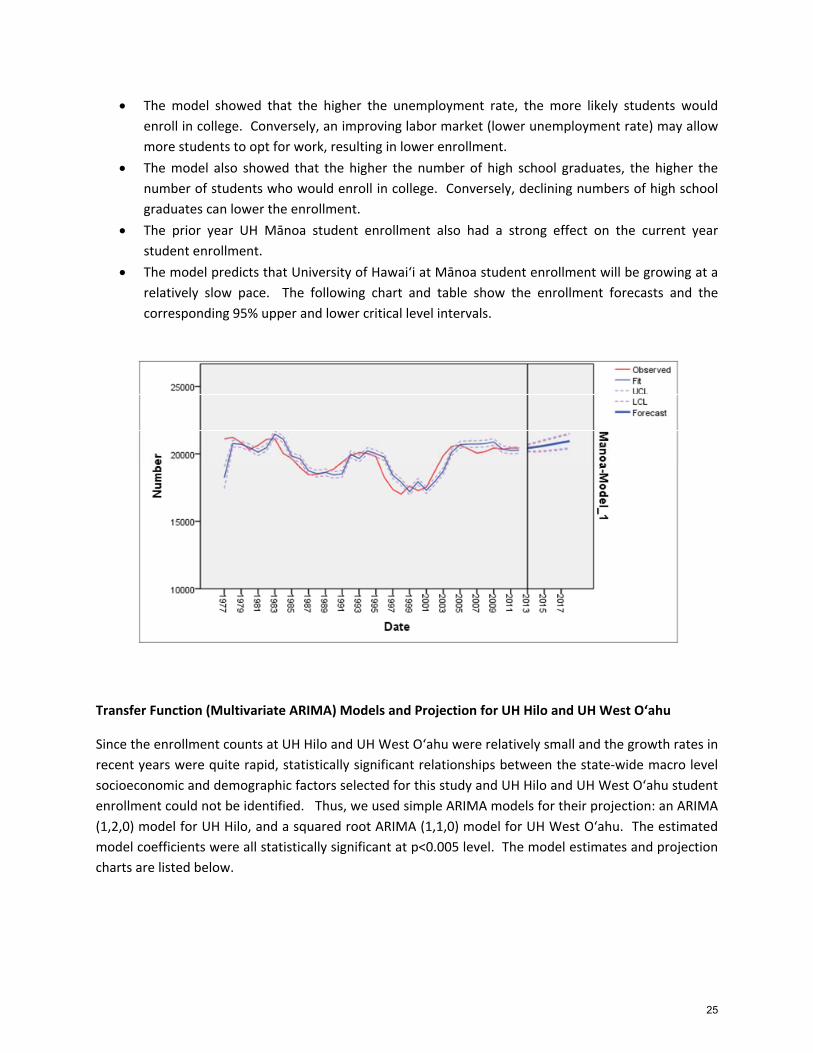
• The model showed that the higher the unemployment rate, the more likely students would enroll in college. Conversely, an improving labor market (lower unemployment rate) may allow more students to opt for work, resulting in lower enrollment.
• The model also showed that the higher the number of high school graduates, the higher the number of students who would enroll in college. Conversely, declining numbers of high school graduates can lower the enrollment.
• The prior year UH Mānoa student enrollment also had a strong effect on the current year student enrollment.
• The model predicts that University of Hawai‘i at Mānoa student enrollment will be growing at a relatively slow pace. The following chart and table show the enrollment forecasts and the corresponding 95% upper and lower critical level intervals.
Transfer Function (Multivariate ARIMA) Models and Projection for UH Hilo and UH West O‘ahu
Since the enrollment counts at UH Hilo and UH West O‘ahu were relatively small and the growth rates in recent years were quite rapid, statistically significant relationships between the state‐wide macro level socioeconomic and demographic factors selected for this study and UH Hilo and UH West O‘ahu student enrollment could not be identified. Thus, we used simple ARIMA models for their projection: an ARIMA (1,2,0) model for UH Hilo, and a squared root ARIMA (1,1,0) model for UH West O‘ahu. The estimated model coefficients were all statistically significant at p<0.005 level. The model estimates and projection charts are listed below.
25
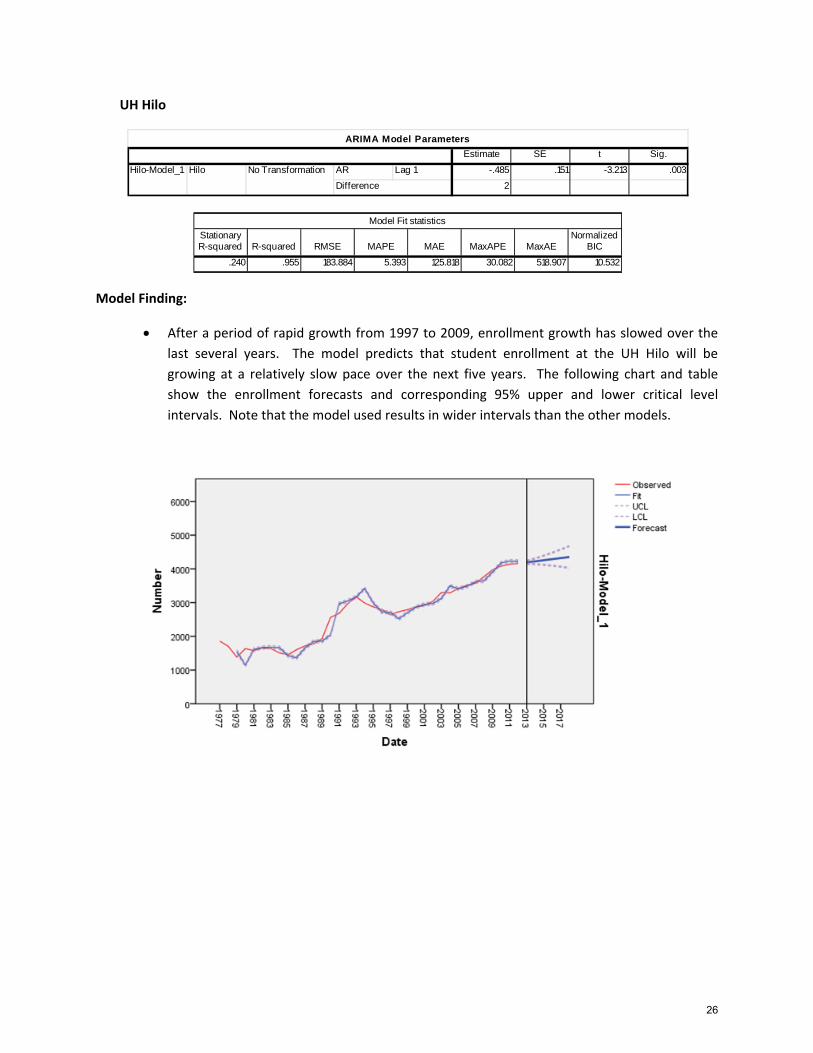
UH Hilo
Model Finding:
• After a period of rapid growth from 1997 to 2009, enrollment growth has slowed over the last several years. The model predicts that student enrollment at the UH Hilo will be growing at a relatively slow pace over the next five years. The following chart and table show the enrollment forecasts and corresponding 95% upper and lower critical level intervals. Note that the model used results in wider intervals than the other models.
Estimate SE t Sig.
AR Lag 1 -.485 .151 -3.213 .0032
ARIMA Model Parameters
Hilo-Model_1 Hilo No TransformationDifference
Stationary R-squared R-squared RMSE MAPE MAE MaxAPE MaxAE
Normalized BIC
.240 .955 183.884 5.393 125.818 30.082 518.907 10.532
Model Fit statistics
26
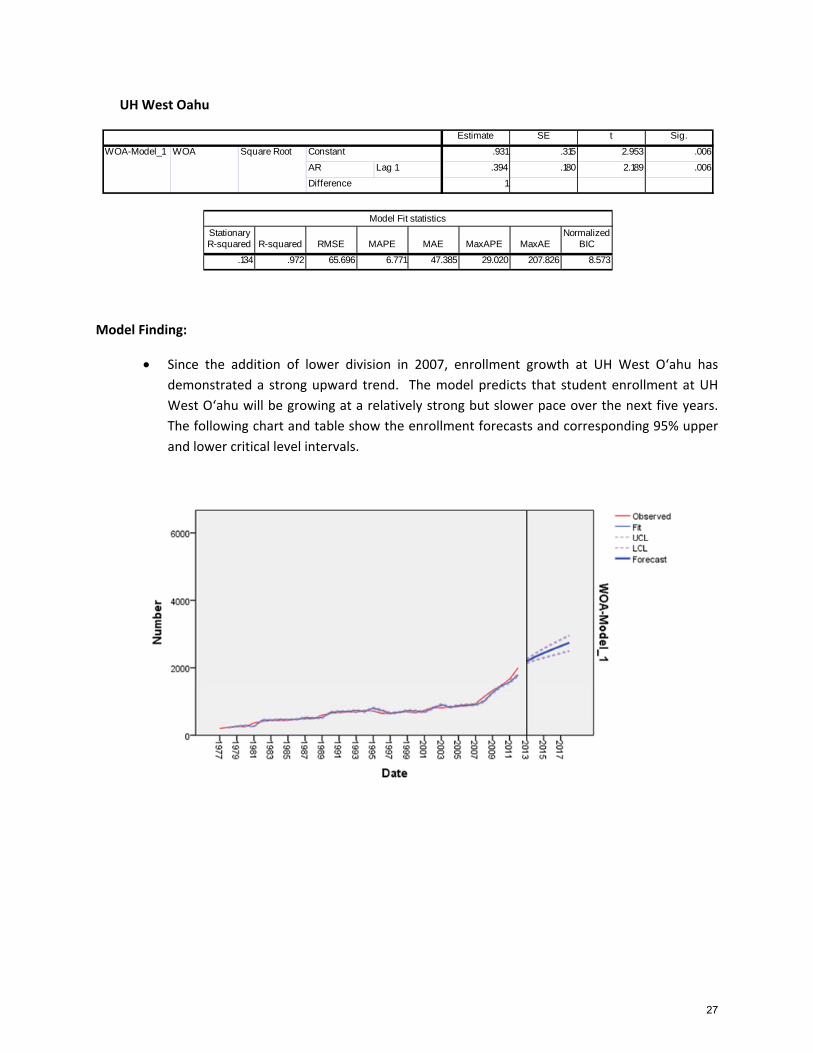
UH West Oahu
Model Finding:
• Since the addition of lower division in 2007, enrollment growth at UH West O‘ahu has demonstrated a strong upward trend. The model predicts that student enrollment at UH West O‘ahu will be growing at a relatively strong but slower pace over the next five years. The following chart and table show the enrollment forecasts and corresponding 95% upper and lower critical level intervals.
Estimate SE t Sig.
.931 .315 2.953 .006
AR Lag 1 .394 .180 2.189 .0061
WOA-Model_1 WOA Square Root Constant
Difference
Stationary R-squared R-squared RMSE MAPE MAE MaxAPE MaxAE
Normalized BIC
.134 .972 65.696 6.771 47.385 29.020 207.826 8.573
Model Fit statistics
27
Appendix
Definitions of the goodness‐of‐fit measures used in time series modeling:
• Stationary R‐squared. A measure that compares the stationary part of the model to a simple mean model. This measure is preferable to an ordinary R‐squared when there is a trend or seasonal pattern. Stationary R‐squared can be negative with a range of negative infinity to 1. Negative values mean that the model under consideration is worse than the baseline model. Positive values mean that the model under consideration is better than the baseline model.
• R‐squared. An estimate of the proportion of the total variation in the series that is explained by the model. This measure is most useful when the series is stationary. R‐squared can be negative with a range of negative infinity to 1. Negative values mean that the model under consideration is worse than the baseline model. Positive values mean that the model under consideration is better than the baseline model.
• RMSE. Root Mean Square Error. The square root of mean square error. A measure of how much a dependent series varies from its model‐predicted level, expressed in the same units as the dependent series.
• MAPE. Mean Absolute Percentage Error. A measure of how much a dependent series varies from its model‐predicted level. It is independent of the units used and can therefore be used to compare series with different units.
• MAE. Mean Absolute Error. Measures how much the series varies from its model‐predicted level. MAE is reported in the original series units.
• MaxAPE. Maximum Absolute Percentage Error. The largest forecasted error, expressed as a percentage. This measure is useful for imagining a worst‐case scenario for the forecasts.
• MaxAE. Maximum Absolute Error. The largest forecasted error, expressed in the same units as the dependent series. Like MaxAPE, it is useful for modeling the worst‐case scenario for the forecasts. Maximum absolute error and maximum absolute percentage error may occur at different series points – for example, when the absolute error for a large series value is slightly larger than the absolute error for a small series value. In that case, the maximum absolute error will occur at the larger series value and the maximum absolute percentage error will occur at the smaller series value.
• Normalized BIC. Normalized Bayesian Information Criterion. A general measure of the overall fit of a model that attempts to account for model complexity. It is a score based upon the mean square error and includes a penalty for the number of parameters in the model and the length of the series. The penalty removes the advantage of models with more parameters, making the statistic easy to compare across different models for the same series.
28
References
Box, G.E.P. & Jenkins, G.M.M. (2008). Time Series Analysis: Forecasting and Control, 4th ed., (Wiley Series in Probability and Statistics).
Chen, C.K. (2008). An Integrated Enrollment Forecast Model. IR Applications, Volume 15, Association of Institutional Research.
Hawai‘i State Department of Business, Economic Development and Tourism (DBEDT). State of Hawai‘i Data Book, 2011.
Hawai‘i State Department of Business, Economic Development and Tourism (DBEDT). Quarterly Statistical & Economic Report (QSER), May 2013.
Hawai‘i State Department of Education. Hawaii Public School Official Enrollment Count.
Hawai‘i State Department of Labor. Monthly Local Area Unemployment Statistics (LAUS), May 2013.
Pindyck, P.S. & Rubinfeld, D.L. (1998). Econometric Models and Economic Forecasts, 4th ed., McGraw‐Hill.
Reiss, Elayne (2013). Best Practices in Enrollment Modeling: Understanding Processes and Methods. 2013 AIR Conference.
University of Hawai‘i Institutional Research and Analysis Office (2012). Enrollment Projections, University of Hawai‘i, Fall 2012 to Fall 2017.
Western Interstate Commission for Higher Education. Hawai‘i Public and Private High School Graduates.
29
Recommended