CRANFIELD UNIVERSITY
ABASS KABIR OLAIDE
TECHNO-ECONOMIC ANALYSIS OF GAS TURBINE
COMPRESSOR WASHING TO COMBAT FOULING
SCHOOL OF ENGINEERING
MSc
Academic Year: 2011 - 2014
Supervisor: Dr. Uyighosa Igie & Prof.Pericles Pilidis
March 2015

CRANFIELD UNIVERSITY
SCHOOL OF ENGINEERING
MSc
Academic Year 2011 - 2014
ABASS KABIR OLIADE
Techno-Economic Analysis of Gas Turbine Compressor Washing to
Combat Fouling
Supervisor: Dr. Uyighosa Igie & Prof. Pericles Pilidis
March 2015
© Cranfield University 2015. All rights reserved. No part of this
publication may be reproduced without the written permission of the
copyright owner.

ABSTRACT
Among the major deterioration problems a gas turbine encountered while in
operation is compressor blade fouling. This is the accumulation and adhesion of
dirt and sediment on the compressor blade which contributes between 70 to
85% of gas turbine performance loss. Fouling reduces turbine air mass flow
capacity, compressor pressure ratio and overall gas turbine efficiency. In most
cases, its effect does not manifest immediately in gas turbine power output and
efficiency since they are not measured directly. However, it is apparent on the
gradual increase in Turbine Entry temperature (TET) and Exhaust Gas
Temperature (EGT). More fuel is burnt in the combustion chamber to maintain
turbine power output which leads to high combustion flame temperature and
thus reduces creep life of hot components.
This research seeks to analyse the technical and economic consequences of
compressor fouling in overall gas turbine performance. The work begins with
simulation of TS3000 engine and examination of its design and off design
performance. Subsequently, medium size gas turbine engine was modelled,
simulated and its performance at different condition was examined to validate
the outcome of field data analysis.
Three months field operating data of Hitachi H-25 gas turbine generator used
for power generation at bonny oil and gas terminal in Nigeria was collected and
corrected to international standard ambient condition, using thermodynamic
calculations. These data were analysed to determine the effect of fouling on the
engine fuel consumption, power output in order to determine the plant
profitability.
The above analysis gives an estimation of fuel cost saving benefit of $41,000
over the period of one year plant operation due to regular two weekly
compressor online water wash which is a good indication of the engine
efficiency.

Keywords: Compressor Fouling, Thermodynamic condition, Degradation,
ISO, Turbine Entry Temperature

ACKNOWLEDGEMENTS
I am grateful to Almighty Allah for the opportunity of life and for His abundance
provisions that have been following me right from the start of this programme.
Many thanks also go to my supervisors Dr Uyighosa Igie and Prof Pericles
Pilidis for given me necessary support and direction as regards this project.
I like to express my appreciation to every member of Cranfield Islamic
Association for their brotherly and academic support.
My sincere thanks also go to my entire family for their understanding,
endurance and prayers without which this programme might not have been
possible.
Lastly, I am indebted to Mr. Roupa Agbadede a Phd student for his time,
counselling and moral support towards this achievement.
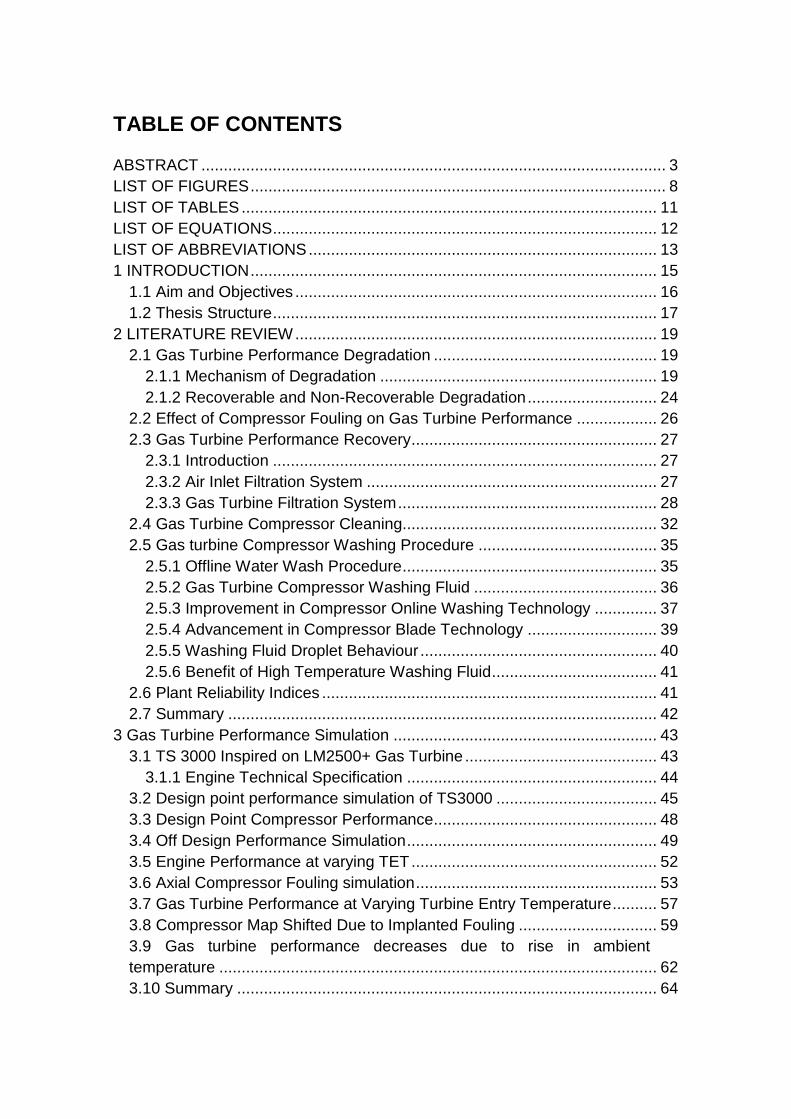
TABLE OF CONTENTS
ABSTRACT ........................................................................................................ 3
LIST OF FIGURES ............................................................................................. 8
LIST OF TABLES ............................................................................................. 11
LIST OF EQUATIONS ...................................................................................... 12
LIST OF ABBREVIATIONS .............................................................................. 13
1 INTRODUCTION ........................................................................................... 15
1.1 Aim and Objectives ................................................................................. 16
1.2 Thesis Structure ...................................................................................... 17
2 LITERATURE REVIEW ................................................................................. 19
2.1 Gas Turbine Performance Degradation .................................................. 19
2.1.1 Mechanism of Degradation .............................................................. 19
2.1.2 Recoverable and Non-Recoverable Degradation ............................. 24
2.2 Effect of Compressor Fouling on Gas Turbine Performance .................. 26
2.3 Gas Turbine Performance Recovery ....................................................... 27
2.3.1 Introduction ...................................................................................... 27
2.3.2 Air Inlet Filtration System ................................................................. 27
2.3.3 Gas Turbine Filtration System .......................................................... 28
2.4 Gas Turbine Compressor Cleaning......................................................... 32
2.5 Gas turbine Compressor Washing Procedure ........................................ 35
2.5.1 Offline Water Wash Procedure ......................................................... 35
2.5.2 Gas Turbine Compressor Washing Fluid ......................................... 36
2.5.3 Improvement in Compressor Online Washing Technology .............. 37
2.5.4 Advancement in Compressor Blade Technology ............................. 39
2.5.5 Washing Fluid Droplet Behaviour ..................................................... 40
2.5.6 Benefit of High Temperature Washing Fluid ..................................... 41
2.6 Plant Reliability Indices ........................................................................... 41
2.7 Summary ................................................................................................ 42
3 Gas Turbine Performance Simulation ........................................................... 43
3.1 TS 3000 Inspired on LM2500+ Gas Turbine ........................................... 43
3.1.1 Engine Technical Specification ........................................................ 44
3.2 Design point performance simulation of TS3000 .................................... 45
3.3 Design Point Compressor Performance .................................................. 48
3.4 Off Design Performance Simulation ........................................................ 49
3.5 Engine Performance at varying TET ....................................................... 52
3.6 Axial Compressor Fouling simulation ...................................................... 53
3.7 Gas Turbine Performance at Varying Turbine Entry Temperature .......... 57
3.8 Compressor Map Shifted Due to Implanted Fouling ............................... 59
3.9 Gas turbine performance decreases due to rise in ambient
temperature .................................................................................................. 62
3.10 Summary .............................................................................................. 64

4 Field Data Analysis ........................................................................................ 64
4.1 Plant (BOGT) Overview .......................................................................... 65
4.2 Overview of Hitachi H25 Engine ............................................................. 69
4.3 Engine Data Representation after 7841 Running Hours ......................... 70
4.4 Measurement Data Correction ................................................................ 75
4.5 Engine Control Mode .............................................................................. 77
4.6 Engine Fuel Consumption ....................................................................... 78
4.7 Summary ................................................................................................ 82
5 Economic Analysis of Hitachi Gas Turbine .................................................... 82
5.1 Economic Evaluation of Hitachi H25 at design point ............................... 83
5.2 Fuel Consumption Cost of Hitachi at Prevailing Operating
Temperature ................................................................................................. 84
5.3 Economic Analysis of Compressor Washing .......................................... 85
5.4 Summary ................................................................................................ 86
6 Conclusions and Recommendations ............................................................. 87
6.1 Conclusions ............................................................................................ 87
6.2 Recommendations .................................................................................. 88
REFERENCES ................................................................................................. 89
APPENDICES .................................................................................................. 94
Appendix A ................................................................................................... 94

LIST OF FIGURES
Figure 1: Picture of dirty Compressor (SGT400) Inlet Guide Vane [48] ............ 20
Figure 2: Axial Compressor Particle Deposition Mechanisms [18] .................. 21
Figure 3: Hot Corrosion Effect on Turbine Blades [11] ..................................... 23
Figure 4: Cracked Stator blade on SGT400 [49] .............................................. 25
Figure 5: Estimated non recoverable performance loss [22] ............................ 26
Figure 6: Effect of Compressor Efficiency on Gas Turbine Performance [11] .. 27
Figure 7: Effect of Fouled Filter on Engine Performance [4] ............................. 28
Figure 8: Gas Turbine Inlet Filter Weather Hood [4] ......................................... 29
Figure 9: Cartridge Type High Efficiency Filter [4] ............................................ 30
Figure 10: Pressure Loss Curve on Self-Cleaning Filter [4] ............................. 31
Figure 11: Operation of Self-Cleaning Filtration System [4] ............................. 31
Figure 12: Effectiveness of Compressor Washing on Power Output [7] ........... 33
Figure 13: Compressor Water Wash Schematic [8] ......................................... 35
Figure 14: Compressor Offline Wash Path [8] .................................................. 36
Figure 15: Stratification of Airflow Fluid with Wash Fluid [10] ........................... 38
Figure 16: Position of Wash Fluid Nozzle on Inlet Plenum ............................... 39
Figure 17: Streamline Disruption due to Deposit .............................................. 39
Figure 18: Wash Fluid droplet behaviour across Blade .................................... 40
Figure 19: Ranking of Force Outage and Force Outage Total down time [11] . 42
Figure 20: LM 2500+ Major Components [8] .................................................... 45
Figure 21:TS3000 DP Compressor Performance Curve .................................. 49
Figure 22: TS3000 DP Compressor Map ......................................................... 49
Figure 23: Variation of Shaft Power output, Pressure Ratio with Ambient Temperature .............................................................................................. 50
Figure 24 : Fuel Flow (kg/s) against Ambient Temp (k) .................................... 51
Figure 25: Variation of Thermal Efficiency with Fuel Flow ................................ 51
Figure 26: Shaft Power (MW) Turbine Entry Temperature TET (K) .................. 52
Figure 27: Efficiency versus Turbine Entry Temperature TET (K) .................... 52

Figure 28: Fuel Flow (kg/s) against Turbine Entry Temperature TET (K) ......... 53
Figure 29: Shows Single Shaft simple Gas Turbine ......................................... 54
Figure 30: Axial Compressor characteristics at different Rotational Speed ...... 56
Figure 31: Axial Compressor Efficiency against Pressure Ratio....................... 57
Figure 32: Shows Gas Turbine Thermal Efficiency versus Turbine Entry Temperature TET (K)................................................................................. 58
Figure 33: Shows variation of Turbine Power Output with Turbine Entry Temperature TET (K)................................................................................. 59
Figure 34: Shows variation of Fuel Flow (kg/s) with Turbine Entry Temperature TET (K) ...................................................................................................... 59
Figure 35: Effect of implanted fouling condition on compressor characteristics 60
Figure 36: Shows Compressor Isentropic Efficiency versus Pressure Ratio .... 61
Figure 37: Shows Effect of simulated washed condition .................................. 61
Figure 38: Shows Effect of Ambient Temperature rise on Gas Turbine Performance .............................................................................................. 63
Figure 39: Shows Decline in Gas Turbine Thermal efficiency as Ambient Temperature rises ..................................................................................... 63
Figure 40: Shows BOGT Plant overview .......................................................... 66
Figure 41: Shows Period A ............................................................................... 67
Figure 42: Show Period B................................................................................. 67
Figure 43: Shows Period C............................................................................... 68
Figure 44: Main Components Arrangement of H25 Engine .............................. 69
Figure 45: Shows Typical Daily Temperature Variation .................................... 71
Figure 46: Shows Ambient Temperature Variation ........................................... 72
Figure 47: Corrected Power Output versus Running Hours ............................. 72
Figure 48: Corrected fuel Flow (kg/s) versus Running Hours ........................... 74
Figure 49: Shows Corrected Fuel Flow (kg/s) versus Corrected Power Output (MW) .......................................................................................................... 74
Figure 50: Shows Corrected Power output versus Corrected Fuel flow ........... 75
Figure 51: Comparison of corrected fuel Flow with measured Fuel Flow (kg/s) 76
Figure 52: Comparison of Corrected power output with measured power output .................................................................................................................. 77

Figure 53: Corrected Exhaust Temperature versus Running Hours ................. 77
Figure 54: Corrected Exhaust Temperature (K) versus Corrected Fuel Flow (kg/s).......................................................................................................... 78
Figure 55: Corrected Fuel Flow versus Corrected Power Output ..................... 79
Figure 56: Corrected Power Output (MW) versus corrected Fuel Flow (kg/s) .. 81
LIST OF TABLES
Table 1: Trace Metal Specification and Effects ................................................ 24
Table 2: Effect of parameter change on turbine power output and Heat Rate [5] .................................................................................................................. 29
Table 3: Summary of Advantages and Disadvantages of various washing methods [6] ................................................................................................ 34
Table 4: LM2500+ Data Specification ............................................................... 45
Table 5: Design point result .............................................................................. 46
Table 6: Public domain engine parameter compared with design point simulated result .......................................................................................................... 46
Table 7: B54 Engine Model Design Point Objective ......................................... 54
Table 8: Effect of Implanted Fouling on Compressor Performance .................. 60
Table 9: Displayed percentage recovery in power output ................................. 62
Table 10: Shows H5 Gas Turbine Specification ............................................... 70
Table 11: Fuel Flow for a given Power Output ................................................. 80
Table 12: Power output for a given fuel flow..................................................... 81

LIST OF EQUATIONS
(3-1) .................................................................................................................. 55
(4-1) ................................................................................................................. 75
(4-2) ................................................................................................................. 75
(4-3) ................................................................................................................. 75

LIST OF ABBREVIATIONS
CCGT Combine cycle gas turbine
CW Compressor work
EP Engine parameter
COT Combustion Outlet temperature
SFC Specific Fuel Consumption
ETA Isentropic efficiency
FOD Foreign object damage
GE General Electric
H Number of particles colliding with surface
HPT High pressure turbine
L Number of particles that fall to the surface
LMP Larson Miller Parameter
MW Megawatt
NLNG Nigeria liquefied Natural gas
OEM Original equipment manufacturer
Qcc Combustion chamber heat
QCC Heat in Combustion chamber
HEPA High Efficiency Particulate Arrestance
EPA Efficient Particulate Arrestance
SGT Siemens Gas Turbine
GE General Electric
UCP Unit Control Panel
OEM Original Equipment Manufacturer
NDMF Non Dimensional Mass Flow
PR Pressure Ratio
DP Design Point
MW Mega Watt
K Kelvin
TET Turbine Entry Temperature
N Non Dimensional Rotational Speed
BOGT Bonny Oil and Gas terminal

Qr Heat rejected
RE Real Engine Data
SE Simulated engine
SW specific work
TET Turbine entry temperature
Tw Turbine work
UW useful work
EOH Equivalent operating Hours
FO Force outage hour
R Reliability

1 INTRODUCTION
As demand for energy in the world is continuously rising, gas turbine production
has been witnessing steady rise, particularly in non-aviation sector over the past
years and the spate is expected to continue to the near future. This is due to its
small weight to power ratio, lower fuel cost and pollution emission. Thus, efforts
have been channel to enhancing and sustaining gas turbine performance in
other to retain its relevance.
However, Compressor fouling poses a major and prevalent problem to effective
and economic advantage of operating industrial gas turbine [1] in fact it
contributes up to three quarter of gas turbine performance loss [2].The steady
rise in the price of fuel globally due deregulation of energy sector has made
every gas turbine operator pay special attention to efficient utilisation of fuel in
order to get good financial return from their investment [3].
Compressor washing has been identified as an effective method in controlling
gas turbine performance deterioration. Since, it has been identified that 70-85%
of gas turbine performance degradation is caused by fouling [4] then it is a
worthwhile venture to research and figure out simple and efficient method to
combat fouling.
Operators and manufacturers of gas turbine have recognised the economic loss
incurred by gas turbine poor performance, its adverse effect on the engine
components integrity which compromises turbine availability and reliability being
major advantage gas turbine has over other prime movers. Industrial gas
turbine is designed to be in service for about 100,000hours without major
maintenance activities. However, fouling could prolong equipment mean time to
repair (MTTR) if major gas turbine components like axial compressor, power
turbine which could not be easily purchase off self are allowed to terribly
deteriorate. Though the Mean Time between Failure (MTBF) of major gas
turbine components are designed to be longer but the equipment life could be
further elongated by regular online washing to take care of fouling.

This work investigates effectiveness of online compressor washing and its
techno-economic benefit. Literature review on gas turbine performance and
compressor washing was done while turbo-match simulation software was used
to investigate the overall gas turbine performance after compressor water wash
activity was done and its effects on various key components of gas turbine.
Hitachi H 25 field data has been collected and analysed to investigate the
engine performance at degraded condition and economic implication of running
fouled engine. Literature review on proactive method of reducing fouling through
effective filtration system is done and special feature of H25 engine was
highlighted.
1.1 Aim and Objectives
The aim of this research is to analyse technical and economic consequences of
compressor fouling in overall gas turbine performance. The specific objectives
are:
To investigate compressor fouling phenomenon and its effect on gas
turbine performance
To Develop model approach for simulation of compressor fouling with the
use of Turbo-Match software
To analyse real engine data with a view to study its overall performance
To simulate compressor washing with Turbo-match and analyse its
effectiveness
To compare clean, fouled and washed engine performance
To evaluate economic benefit of frequent compressor online washing,
complemented with offline washing

1.2 Thesis Structure
The entire work is covered under six chapters while each of the chapters is well
connected towards achieving the aims and objectives of the work:
Chapter 1: Introduction
In this chapter gas turbine performance problems are defined, its economic and
environmental effect is stated, the aim and objectives of the research work are
presented and the relevance of compressor washing as solution to the gas
turbine problem.
Chapter 2: Literature Review
This chapter contains classification of gas turbine performance degradation,
degradation mechanism, effect of degradation on turbine components and
overall engine performance, gas turbine reliability, availability, engine proactive
protection methods and compressor washing methods.
Chapter 3: Gas Turbine Performance Simulation
This chapter entails the use of Turbo-match software tool to demonstrate gas
turbine performance understanding, design point and off design performance of
engine model simulation, discussion of results of turbine performance due
operating and environment changes
Chapter 4: Engine running parameters Data Analysis
This chapter contains plant overview and Hitachi H25 engine description, data
investigation at different periods (1584-7848) which involves engine
performance without water wash compared with the engine performance after
frequent water wash.
Chapter 5: Economic implication of running deteriorated engine and
effectiveness of compressor washing
The engine economic performance at design stage is examined in terms of
power produced and fuel consumption. This is compared with real time
performance considering that the engine is operated mostly at part load. The

cost implication of frequent compressor washing, taking into account the
washing fluid cost.
Chapter 6: Conclusions and Recommendations
This chapter contains brief summary of research work, findings and suggestions
on how to obtain optimum performance from gas turbine

2 LITERATURE REVIEW
2.1 Gas Turbine Performance Degradation
Gas turbine like any other prime mover undergo wear and tear over life time
which reduces its thermal efficiency, increases overall maintenance and
operating cost as result of increased fuel consumption and increase in pollution
emission due rise in TET. Overall gas turbine function is as a result of smooth
interrelationship of gas path components which includes compressor,
compressor turbine and power turbine. Gas turbine has to operate in an
environment which deteriorates the behaviour of the gas path components due
to the presence of solids and liquid particles in form of aerosol and this affect
the matching of components [11].
2.1.1 Mechanism of Degradation
The understanding of the phenomenon of degradation of gas path components
is important to the operators and manufacturers of gas turbines. The most
prevalent form of degradation experience by gas turbine engine is fouling, which
may not be immediately noticed in the engine performance but could cause
compressor surge or prevent engine from starting if allow to build up and
occupy gas flow path. Fouling and other form of degradation mechanism are
explained in detailed under compressor fouling, component erosion and hot
corrosion sub headings.
2.1.1.1 Compressor Fouling
Fouling is adherence of airborne particles in the atmosphere to the compressor
aerofoils and annulus. Particles in form of smoke, dust, carbon, oil mist, insect,
sea salt are common example. Figure 1 shows accumulated dirt on turbine inlet
blade (IGV) taken from field during maintenance activities. Ingestion of flare,
exhaust from other gas turbine and oil mist from other producing process are
considered and avoided in the installation and plant layout. Frequent changes in
wind speed, wind direction and high level of humidity in the environment makes
particles stick and build up on the aerofoil resulting in reduction of air flow
capacity and plugging of turbine blade cooling holes which would result into
high turbine entry temperature TET and promotes overheating. Particles that
cause fouling are typically smaller than between 2µm to 10µm [6]
Figure 1: Picture of dirty Compressor (SGT400) Inlet Guide Vane [48]

2.1.1.2 Compressor Fouling Mechanism
Atmospheric air contains suspended particles which move randomly and collide
continuously with air molecules and component around the compressor blade
and annulus. Particles travel to the surface of compressor blade by diffusion,
impaction, settling and interception process in accordance with Brownian
motion which are represented in the Figure 2 [17].
Figure 2: Axial Compressor Particle Deposition Mechanisms [18]
2.1.1.3 Fouling Influencing Factor
Compressor fouling and the rate of fouling are influenced by the factors
discussed below:
Gas turbine design parameters: Design parameters such as inlet
velocity, mass flow rate, compressor pressure ratio, inlet guide vane,
aerodynamics and geometric characteristic, blade geometry and angle of

attack determine the sensitivity compressors to fouling. The higher the
mass flow the greater the tendency of particle injection into the
compressor[19]
Gas turbine operating area: Different climatic conditions influence gas
turbine fouling rate. Turbine performance varies due to location (dusty,
windy, temperate, tropical region) in which it is operated. Gas turbine
located in a heavily industrial area tends to be affected by emissions
from surrounding equipment.
Plant Design and layout: consideration is often given to the height of air
filter installation, wind direction and exhaust emission from adjacent
machinery and heavily motorised area in gas turbine installation. This is
done to take care of identified source of fouling and eliminate it at plant
layout stage.
Plant maintenance Culture: Maintenance practises deployed in plant
and quality of spares used determines gas turbine performance
efficiency and availability. A plant where preventive maintenance is held
in high esteem will likely have minimal compressor fouling problem, and
plant availability tends to be higher.
2.1.1.4 Component Erosion
Erosion is removal of metal components along the gas flow path by particles
bigger than 10µm in size. Erosion problem has been taken care off by the state
of the art filtration system installed in industrial gas turbine but occur
occasionally after maintenance activities when solid object are left in the engine
e.g. bolts or tools used or it is as a result of droplet of water which is
incompressible in the compressor part of engine. It as well occurs when sudden
removal of turbine component happened within the engine which would wreak
havoc on the entire engine.
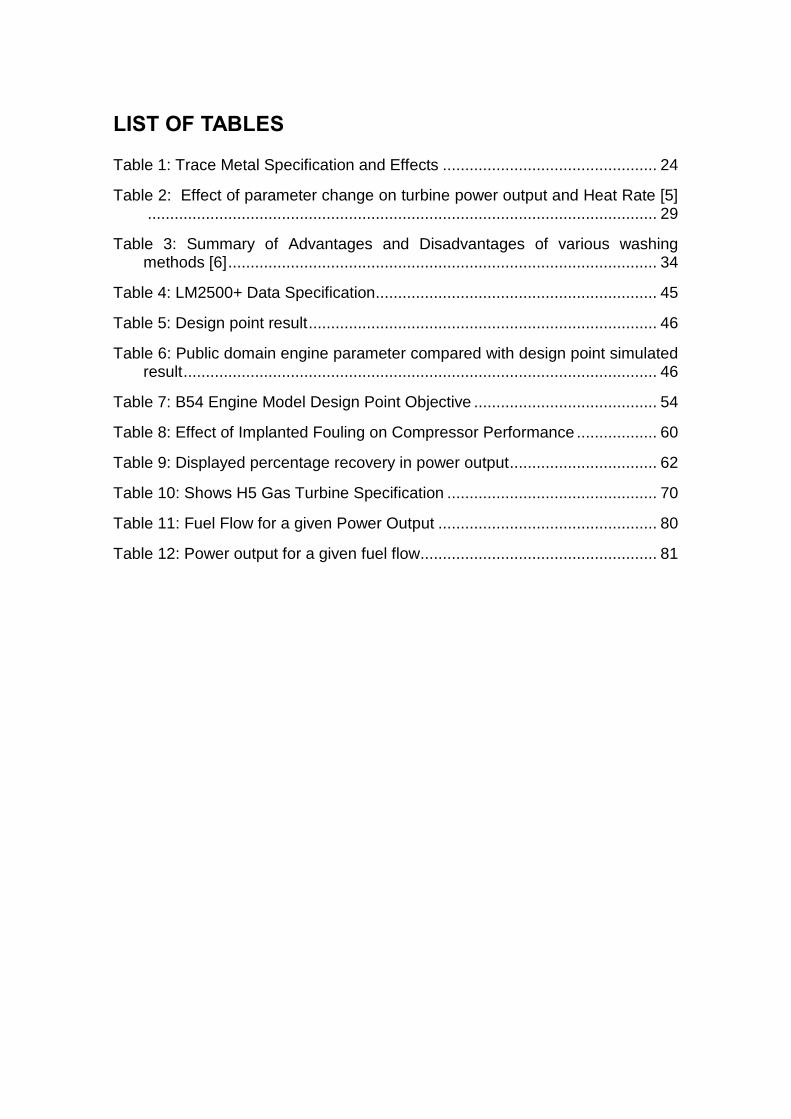
2.1.1.5 Hot Corrosion
Hot corrosion is chemical reaction of certain contaminants like reactive gases,
salt, mineral acid with flow path components which cause flow path components
deterioration. Scale is formed around the flow path component as a result of the
chemical reaction. Chemical reaction also occurs between atoms of metal
components around the hottest area-combustion chamber and oxygen known
as Temperature oxidation resulting into mechanical failure like cracks and
spalls. Figure 3 depicts the effect corrosion hot corrosion on Turbine blade [23;
24]
Figure 3: Hot Corrosion Effect on Turbine Blades [11]
2.1.1.6 Corrosion
Corrosion causes engine degradation due to chemical reaction between the
contaminants in the inlet air, fuel gas and combustion derived contaminants.
Sodium and potassium are major cause of corrosion even though lead and
vanadium are found as culprit as well. Sodium chloride is an impurities present
in air and posed major problem for engine operating in offshore because sea
water contains large amount of salt. Once the sodium impurity exceeds the

tolerance considered by the manufacturer, then it becomes a problem which
continues unabated even after the source is eliminated.
Small particles of between 2µm to 10µm get into engines despite the filtration
process fuses to the gas path components and block cooling air passages, alter
surface shape, severely interfere with heat transfer and leads to thermal
fatigue.Table1 displayed list of common trace metal elements found fuel,
tolerable limit and their effect on gas turbine components.
Table 1: Trace Metal Specification and Effects
Trace Metals
Limits in Raw Fuel
Effects in Turbine
Types of Treatment
Typical Limits in Fuel to Turbine
Sodium Plus Potassium
150ppm High
Temperature Fuel Wash 1ppm
Calcium 10ppm Fouling Deposit Fuel Washing to a Limited
Extent 10ppm
Lead 1ppm High
Temperature corrosion
Inhibited by Magnesium
1ppm
Vanadium High
Temperature Corrosion
Inhibited by Magnesium
0.5ppm
2.1.2 Recoverable and Non-Recoverable Degradation
Mechanism of degradation discussed above can be broadly categorised into
recoverable and non-recoverable degradation. Degradation that can be
salvaged or reversed by either online wash or off-line wash is regarded as
recoverable. Degradation caused by fouling is usually reversed by compressor
cleaning or water wash while degradation that require repair, replacement of
engine component or complete engine overhaul is regarded as Non-
recoverable.[3] Erosion, corrosion, abrasion ,hot corrosion and foreign object

damage result in non-recoverable engine deterioration. Figure 4 shows non
recoverable degradation
Figure 4: Cracked Stator blade on SGT400 [49]
2.1.2.1 Non Recoverable Performance Curve
Due to wear and tear experience by the engine components as a result of
frequent start up, running and engine shut down, the engine performance output
drops as the number of engine fire hours increases.
The graph in figure 5 is useful in estimation of compressor performance loss
expected after the first engine overhaul which occurs when an engine has been
in service for about 5 to 6 years equivalent of 43000 to 50000 running hours
[22]

Figure 5: Estimated non recoverable performance loss [22]
2.2 Effect of Compressor Fouling on Gas Turbine Performance
The gas turbine compressor utilises nearly 60% of the work produced by gas
turbine thus dirt accumulation on compressor results into significant drop in
engine performance. Compressor fouling reduces compressor flow capacity,
pressure ratio and efficiency which in turn lead to poor overall turbine power
output. Higher compressor pressure ratio engine are more susceptible to fouling
which could lead to surge and blade failure. The effect of fouling on compressor
is more pronounced on high compressor pressure ratio machine [11; 25]. The
higher the pressure ratio of an axial compressor the greater its reduction in
overall thermal efficiency due to fouling effect shown in Figure 6 [20; 25-28]:

Figure 6: Effect of Compressor Efficiency on Gas Turbine Performance [11]
2.3 Gas Turbine Performance Recovery
2.3.1 Introduction
Gas turbine performance degradation is inevitable like other machinery that
operates continuously in an environment that is filled with all sought of
impurities. However, with appropriate air inlet filtration system and schedule
compressor water wash in place gas turbine performance optimisation could be
achieved. Optimum performance of gas turbine would results into improved
power output, reduced heat rate, improved engine life cycle and reduced
maintenance cost [2; 2].
2.3.2 Air Inlet Filtration System
Gas turbine inlet filter is a very important component of air inlet filtration system
that prevents admission of dirt be it in form of solid, dust, particles, insect,

exhaust fume and aerosol from entry gas turbine inlet. An effective air inlet
filtration system will increase turbine availability and reliability thereby reduces
maintenance cost and maintains turbine performance optimally.
However, overtime dirt accumulation on filters results into filter fouling which
often manifest from increase in air inlet filter differential pressure which reduces
mass flow of air into turbine as a result of pressure loss. The reduction in mass
flow of air results into reduced power output and engine efficiency.[3] Figure 7
below shows the impact of air inlet pressure loss as a result of fouled filter on
engine heat rate and power output.
Figure 7: Effect of Fouled Filter on Engine Performance [4]
2.3.3 Gas Turbine Filtration System
Due to the importance of filtration system in gas turbine, different stages of
filtration are usually available on gas turbine inlet system. Hitachi 25 and
Siemens SGT 400 are provided with 3 different stages of filtration as highlighted
below:
1. Weather Protection and Trash screen: weather louvers, hood and
trash screen reduce amount of moisture and particles particularly large
particles that may accompany air flow and it’s usually installed in high

efficiency filtration system. Figure 8 below indicate Siemens SGT 400
weather hood.
Figure 8: Gas Turbine Inlet Filter Weather Hood [4]
2. Pre-filter: This type of filter was not initially installed but due to frequent
maintenance of filter cartridges as a result of pressure loss due to dirt
accumulation, pre-filter was latter installed which extend filter service
period and thus reduces maintenance cost. Effect of high pressure drop
across filter and rise in other environmental parameters like ambient
pressure, temperature and relative humidity cause reduction in turbine
power out and increase in turbine heat rate as shown in the table 2.
Table 2: Effect of parameter change on turbine power output and Heat Rate [5]
Parameters Parameter
change Power output Heat Rate
Ambient Temp 10oC -6.5% 2%
Ambient Pressure 10mbar 0.9% 0.9%
Ambient relative
Humidity 10% -0.0002% 0.0005%
Pressure drop in
Filter 25mmWC -0.5% 0.3%

Pre-filter is made up of disposable fibres which removes large particle of
between 2-10 microns from flow stream.
3. High Efficiency Filter: Cartridge type high efficiency filter as shown in
figure 9 below are provided for last stage of filtration to prevent particles
that could cause compressor fouling and plugging of blade cooling
passage from entry into the turbine. High efficiency filter particularly
cartridge type has high dust holding capacity with filtration efficiency of
between 80-99% for EPA and HEPA filter type respectively.
Figure 9: Cartridge Type High Efficiency Filter [4]
30The cartridge filter installed on H25 and Siemens gas turbine is
surface type with self-cleaning system.
2.3.3.1 Self-Cleaning Filtration System
Due to high dust rate, to prolong filter service life and reduce maintenance cost
of filter replacement, a system whereby the filter cleans its self when certain
pressure loss as being attained. A reversed pulse compressed air of between
80 t0100 psig cleans the filter by blown off the dirt accumulation, this occurs
between 100ms to 200ms and only about 10% of dirt is blown off to avoid flow

disruption and reduce the frequency of the use of compressed air. The principle
of operation of self-cleaning filter system is shown in Figure 11. Of course, the
filter has it service life about 2 year which would necessitate filter outright
replacement and in effectiveness of filter would manifest in efficiency and
increase in frequency of pulse system operation as figure10.
Figure 10: Pressure Loss Curve on Self-Cleaning Filter [4]
Figure 11: Operation of Self-Cleaning Filtration System [4]

2.4 Gas Turbine Compressor Cleaning
Compressor cleaning is an effective way of recovery gas turbine performance
loss as a result of fouling. Several methods of achieving compressor cleaning
are enumerated below with their pros and cons:
Manual Compressor washing: This involves shutdown of engine, strip the
engine to have access to the compressor blade and clean fouled engine with
brushed and other cleaning materials. This method has been proven to have
significant performance recovery but very task with length downtime.
Grit Blasting Method: this method evolved to eliminate the intense labour
involved in manual hand cleaning. It involves the use of abrasive material like
rice, charcoal, nutshell or synthetic resin to remove deposits on the blade. The
abrasive material is introduced into the engine during operations because high
air speed is needed to achieve desire impact on the blade. Satisfactory results
was achieved even with its limitation which includes inability to remove oily
deposit, tendency for sealing system contamination, poor cleaning of last stages
of compressor, blockage of blade cooling openings and damage of blade
coating on state of the art engines[6].
Online Compressor washing: This is another method of recovery gas turbine
performance degradation. It involves injection of washing fluid which is
demineralized water and detergents while engine still in full operation. This
method is recommended before any significant fouling is noticed on the engine
and it is used as complementary to offline washing because it unable to recover
full power after washes. The effectiveness of online washing as compared with
offline washing is shown in the figure 12.

Figure 12: Effectiveness of Compressor Washing on Power Output [7]
Offline compressor washing: This method is very effective in performance
recovery and it effect is far more than the result of using abrasive cleaning [6]. It
is as well referred to as Soak or Crank washing; it involves shutting down the
engine and allows it to cool before injection of demineralized water and
detergent. The engine is only rotated for about 20% to 30% of full operating
speed by starter motor [6].Offline water wash is done after all the air extraction
point has been isolated to prevent effluent from air sealing piping system.
Advantages and disadvantages of different methods of washing are
enumerated in the table 3.

Table 3: Summary of Advantages and Disadvantages of various washing methods [6]
Methods Advantages Disadvantages
Manual cleaning(brushes
and washing agents) Very effective
Shutdown of engine, Very
Laborious
Grit Blasting(Rice, Nutshell,
Charcoal and synthetic resin
particles)
Simple and fast, No engine
downtime, effective in cold
environment
Less effective at rear stage
and for oily deposit, Clogging
of internal cooling passage,
Erosion, Increase surface
roughness, Damage of blade
coating
Fired or online
washing(Demineralized
water and detergent)
No interference with load
profile, Extends interval of
crank wash
Less effective, cannot
replace offline washing
Unfired, cranked, soaked or
offline washing Very effective
Shutdown of engine, incurred
more down time

2.5 Gas turbine Compressor Washing Procedure
GT washing package are either built together with the new gas turbine package
or as retrofit to the existing turbines. Compressor washing recovers turbine
performance loss which manifests in form of reduction in power output or
increase in heat rate. Washing module is equipped with heating element, piping
connections on the base, insulated tank for water, motor operated valves for
water injection, and spray manifold for online and offline washing. Compressor
water wash schematic of a GE gas turbine wash module is shown Figure 13.
Drains are provided for waste from turbine inlet plenum, combustion area,
exhaust frame and exhaust plenum.
Figure 13: Compressor Water Wash Schematic [8]
2.5.1 Offline Water Wash Procedure
Figure 14 below shows GE compressor water wash path during offline washing
process. The procedure water wash involves:
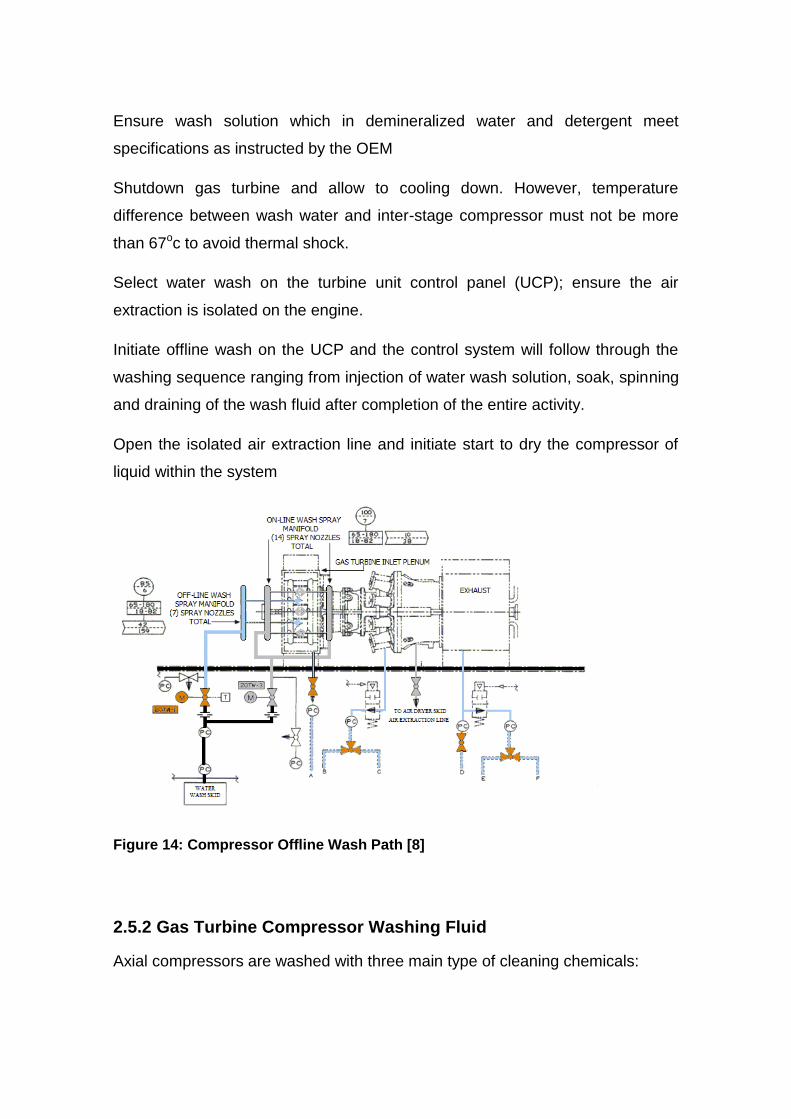
Ensure wash solution which in demineralized water and detergent meet
specifications as instructed by the OEM
Shutdown gas turbine and allow to cooling down. However, temperature
difference between wash water and inter-stage compressor must not be more
than 67oc to avoid thermal shock.
Select water wash on the turbine unit control panel (UCP); ensure the air
extraction is isolated on the engine.
Initiate offline wash on the UCP and the control system will follow through the
washing sequence ranging from injection of water wash solution, soak, spinning
and draining of the wash fluid after completion of the entire activity.
Open the isolated air extraction line and initiate start to dry the compressor of
liquid within the system
Figure 14: Compressor Offline Wash Path [8]
2.5.2 Gas Turbine Compressor Washing Fluid
Axial compressors are washed with three main type of cleaning chemicals:

Water and Kerosene are oldest established washing fluid with history of
effective washing with or without emulsifier. It is cheap and readily
available though, it is losing acceptance mainly because the emulsion
could split into water and kerosene during hot wash which could
dangerous to engine particularly aircraft engine.
Solvent based cleaner contains about 50-70% white spirit (solvent) while
water and detergent makes other proportion. The detergent is present to
emulsify mixture of solvent and water. However, the trend is shifting from
the use of solvent based fluid due to it health safety (offensive smell and
hazardous) even though it being accepted as a good cleaning chemical.
It being found to very corrosive, it attacks rubber, seal, metal and even
paints.
Aqueous based cleaners (ZOK27, ZOK mx) this is the latest cleaning
fluid in compressor washing, it is solution of detergent in water, it
contains corrosion inhibitor, and safe to transport and handle. It is usually
mixed in ratio of 1-4 with demineralised water [9].
2.5.3 Improvement in Compressor Online Washing Technology
There has been record of axial compressor vibration and disruption of power
output while carrying out on-line washing. These are among reasons why
operators hesitate to allow on-line compressor washing but with improvement in
gas turbine compressor cleaning technology, the challenges are being
addressed:
Washing fluid positioning, the injection nozzle is positioned without
protrusion into the airflow stream and that the spray injection is done
radially into the air flow.
Stratification of wash fluid and airflow, this is saturation of layer of air by
the duct wall where nozzles are positioned with wash fluid, the wash fluid
is introduced into the entire body of air flow as it moves through inlet
nozzle with little or no interference with air stream. There is smooth
change in direction of flow from duct through the plenum and into the

compressor (Fig 15).The benefit is that the fluid moves further away
downstream of plenum and has better coverage of the blade.
Figure 15: Stratification of Airflow Fluid with Wash Fluid [10]
Burying of wash fluid nozzle in the inlet plenum, this would provide less
intrusion of airflow by nozzle (Fig16) but might prevent mixing of wash fluid with
air flow. Pressurised wash fluid (45-90bar) is injected to achieve better
penetration of wash fluid ahead of air flow with no disturbance until they reach
compressor.
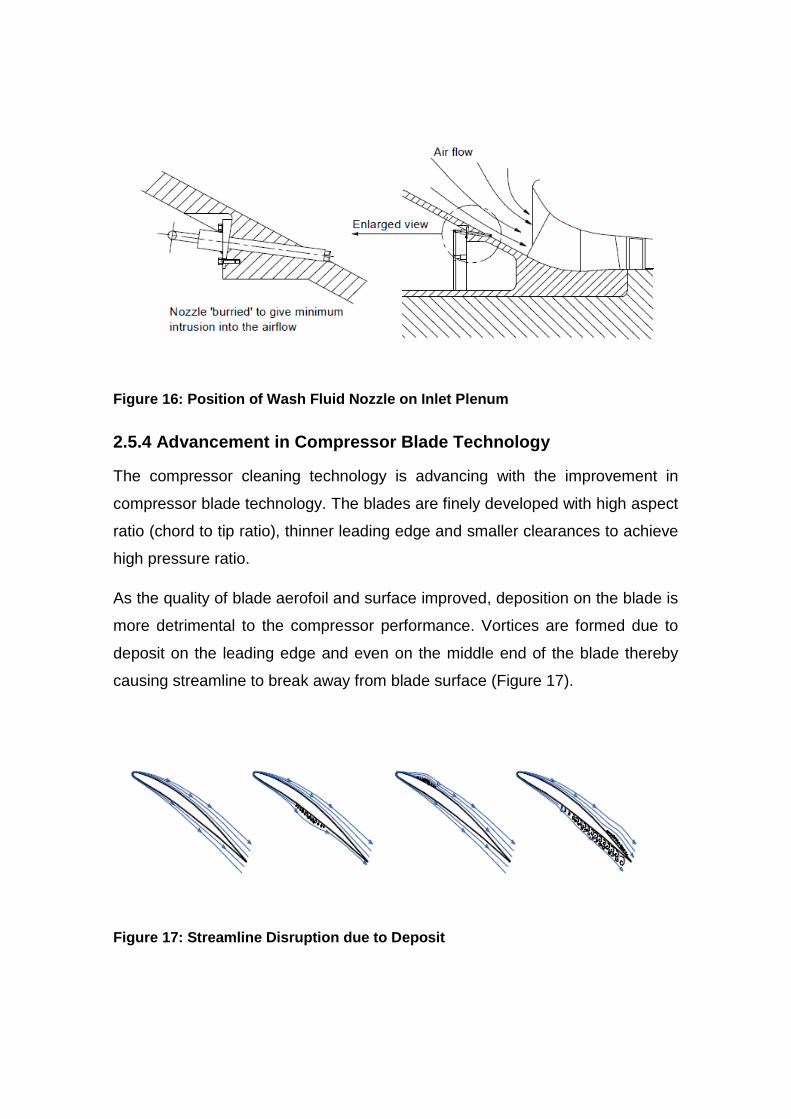
Figure 16: Position of Wash Fluid Nozzle on Inlet Plenum
2.5.4 Advancement in Compressor Blade Technology
The compressor cleaning technology is advancing with the improvement in
compressor blade technology. The blades are finely developed with high aspect
ratio (chord to tip ratio), thinner leading edge and smaller clearances to achieve
high pressure ratio.
As the quality of blade aerofoil and surface improved, deposition on the blade is
more detrimental to the compressor performance. Vortices are formed due to
deposit on the leading edge and even on the middle end of the blade thereby
causing streamline to break away from blade surface (Figure 17).
Figure 17: Streamline Disruption due to Deposit
Injection of usual 4-9 bar wash fluid have little or no effect on the deposit, it
would follows the streamline without any impact on the deposit.
However, development of small opening nozzle with high injection pressure of
up 90bar, heating of washing fluid and addition of surfactant reduces the fouling
surface tension and effective cleaning achieved [10].
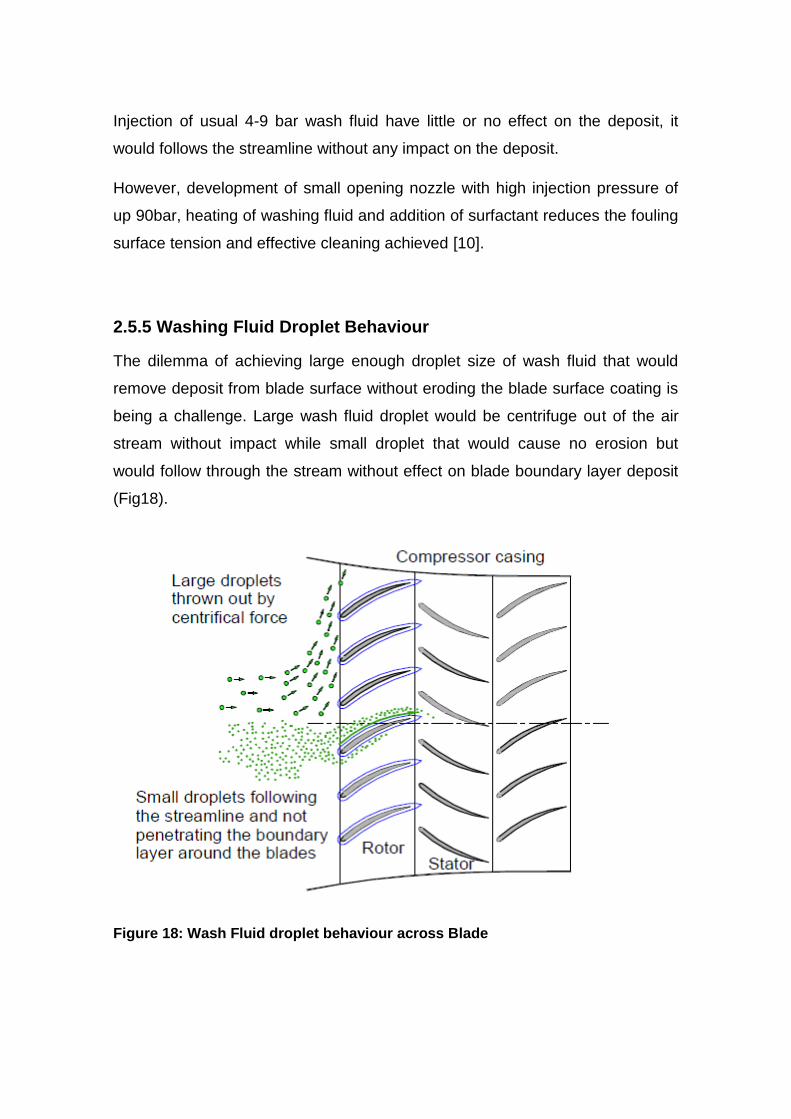
2.5.5 Washing Fluid Droplet Behaviour
The dilemma of achieving large enough droplet size of wash fluid that would
remove deposit from blade surface without eroding the blade surface coating is
being a challenge. Large wash fluid droplet would be centrifuge out of the air
stream without impact while small droplet that would cause no erosion but
would follow through the stream without effect on blade boundary layer deposit
(Fig18).
Figure 18: Wash Fluid droplet behaviour across Blade

However, with the increase in wash fluid injection pressure, heating and
addition of surfactant the small droplet are reduced and the large droplet are
eliminated by reducing the total spread of droplet size.
2.5.6 Benefit of High Temperature Washing Fluid
Compressor wash fluid get vaporised by air temperature at fifth to sixth stage,
and thus, the dirt removed are deposited on the latter stages. However, with the
evolution of high temperature carrier in washing fluid, the fluid boiling
temperature is raised to the compressor exit temperature and pressure. This
ensures complete cleaning of the compressor blade with reduced injection
pressure to vary the droplet size, the adhesion of boundary layer is achieved
2.6 Plant Reliability Indices
Most of the force outage recorded is due to turbine auxiliary control system
which includes fuel gas system, Speed control system, combustion temperature
sensing probes, Bentley Nevada vibration monitoring system and air inlet
system.
Figure 19 indicates engine system ranking of forced outage rate and force
outage total down time, engine control system often contributes higher number
of force outage thereby reduce turbine reliability but with holding right spare,
right technical personnel and right maintenance approach, the down time might
be reduced. The main hot path gas turbine component seldom fail which
suggest high reliability but once they fail it may take longer time to repair
because spare availability, technical know-how and high repair cost. Apart from
sophisticate monitoring instrumentation installed, the operator has also taken a
proactive measure to purchase capital spare for storage to reduce downtime
once it occurred.

Figure 19: Ranking of Force Outage and Force Outage Total down time [11]
Among other factors that could offer solution to the plant unavailability is
improvement in the technical competency of the maintenance team, proactive
ordering of spares and regular communication with OEM on equipment
performance.
Plant availability is the percentage of time the plant is available to generate
power in any given period at its acceptance load.
Reliability is the probability that the plant will perform it desire function within
specify time without failure. Availability is a function of reliability
2.7 Summary
Gas turbine performance deteriorates gradually in operation due to
accumulation of foreign particles contained in air. The gas turbine operating a
tropical environment has shown greater collection of dirt particles in form of dust
which are evident on clogged filter systems.

Experience has shown that high performance filtration system only reduces dirt
admittance into the turbine air inlet and enclosure. However, Boroscopic
inspection of turbine axial compressor has reveal that even high efficient
performance filter does not stop dirt particle in the air from being admitted into
gas turbine gas generator.
Advancement in technology has improved the gas turbine performance
recovery through regular cleaning of turbine axial compressor with the
introduction of cleaning fluid (detergent) into the gas turbine for washing off dirt
accumulated and thereby sustaining turbine efficient performance. This washing
is either done when turbine is at rest on even while running and on load.
3 Gas Turbine Performance Simulation
Introduction
The study begins with investigation of gas turbine performance with the use of
TURBOMACH SOFTWARE to demonstrate thorough understanding of inter-
relationship between major components of turbine. TS3000 engine, a single
shaft gas generator engine that is aerodynamically coupled with power turbine
is designed using Turbo-match code. The performance of its key components
are studied both at deign and off design point.
3.1 TS 3000 Inspired on LM2500+ Gas Turbine
Aero-derivative gas turbines are aircraft engines converted to industrial engine
due to rise in demand for a highly reliable, small size (compactness), high

power output, efficient, easy maintainability and environmental friendly prime
mover in the Industries. The increasing demand for oil and gas which are the
main energy sources has led engineers to develop and adapt aircraft engines
for industrial use.
Aero-derivative engines benefited from the long time and huge budget allotted
for aircraft research and development. This earns aero-derivative engine some
operational and economic advantages, and of course is attractive to end users.
Aero-derivative LM 2500 has over 31million operation running hours which
shows its excellent reliability and performance. LM 2500 series belong to the
F39/CF6-6 family.[8]
LM2500+ gas turbine conception was based on improvement of successful
design history and performance of LM2500. The current LM2500+ is rated at
thermal efficiency and power output of 41% and 31.3MW which was
advancement from its original 37.5% and 27.6MW thermal efficiency and power
output respectively. Figure 3-1 shows isometric view LM2500+.
3.1.1 Engine Technical Specification
LM2500+ gas generator operates at 22:1 compressor pressure ratio with 2
stage High speed power turbine design at 6100rpm, operating range of 3050
and 6400 rpm for mechanical drive application which can operate over a cubic
load curve. It also has another design with 6 stage low speed power turbine with
design speed of 3600 rpm for power generation application as shown in
Figure20.
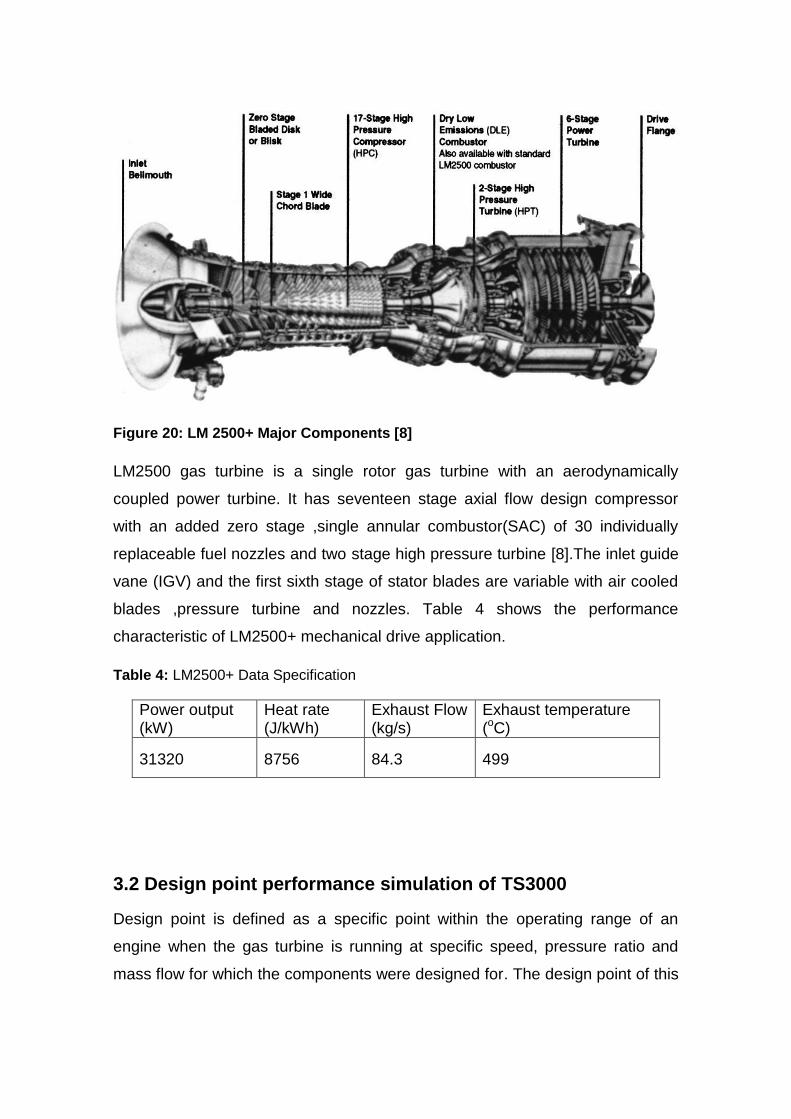
Figure 20: LM 2500+ Major Components [8]
LM2500 gas turbine is a single rotor gas turbine with an aerodynamically
coupled power turbine. It has seventeen stage axial flow design compressor
with an added zero stage ,single annular combustor(SAC) of 30 individually
replaceable fuel nozzles and two stage high pressure turbine [8].The inlet guide
vane (IGV) and the first sixth stage of stator blades are variable with air cooled
blades ,pressure turbine and nozzles. Table 4 shows the performance
characteristic of LM2500+ mechanical drive application.
Table 4: LM2500+ Data Specification
Power output (kW)
Heat rate (J/kWh)
Exhaust Flow (kg/s)
Exhaust temperature (oC)
31320 8756 84.3 499
3.2 Design point performance simulation of TS3000
Design point is defined as a specific point within the operating range of an
engine when the gas turbine is running at specific speed, pressure ratio and
mass flow for which the components were designed for. The design point of this

engine is calculated based on data gotten from open domain with standard
atmospheric parameters which are listed below.
1. Atmospheric Temperature : 288.15 k
2. Atmospheric pressure 101.325 kPa
3. Altitude ; 0
4. The result gotten from TS3000 design point is displayed in Table 5
Table 5: Design point result
ENGINE PARAMETER VALUE
Power output(MW) 31.3
Fuel flow (Kg/s) 1.7918
Specific fuel consumption ( mg/kW.s) 57.19
Exhaust Temperature( K) 788.84
Thermal efficiency 40.6%
Table 6 shows comparison between the engine public domain value and the
simulated design point value to validate the accuracy of turbomatch software.
Table 6: Public domain engine parameter compared with design point simulated
result
ENGINE
PARAMETER(EP)
ENGINE PUBLIC
DOMAIN VALUE(RE)
SIMULATED ENGINE
VALUE(SE)
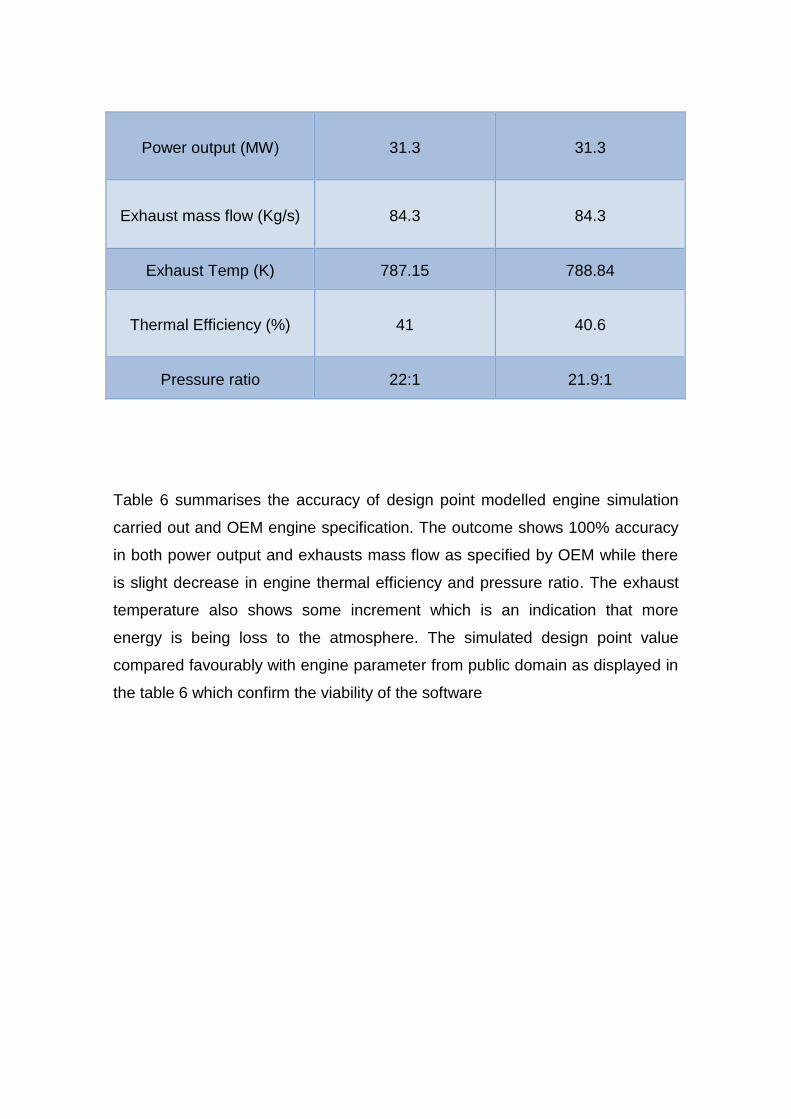
Power output (MW) 31.3 31.3
Exhaust mass flow (Kg/s) 84.3 84.3
Exhaust Temp (K) 787.15 788.84
Thermal Efficiency (%) 41 40.6
Pressure ratio 22:1 21.9:1
Table 6 summarises the accuracy of design point modelled engine simulation
carried out and OEM engine specification. The outcome shows 100% accuracy
in both power output and exhausts mass flow as specified by OEM while there
is slight decrease in engine thermal efficiency and pressure ratio. The exhaust
temperature also shows some increment which is an indication that more
energy is being loss to the atmosphere. The simulated design point value
compared favourably with engine parameter from public domain as displayed in
the table 6 which confirm the viability of the software

ENGINE PARAMETER VALUE
Power output(MW) 31.3
Fuel flow (Kg/s) 1.7918
Specific fuel consumption ( mg/kW.s) 57.19
Exhaust Temperature( K) 788.84
Thermal efficiency 40.6%
3.3 Design Point Compressor Performance
Figures 21 and 22 represent the TS3000 axial compressor performance
characteristic with Pressure ratio, isentropic efficiency plotted against non-
dimensional mass flow. At each constant speed line, the compressor pressure
ratio increases with mass flow which is the expected compressor behaviour.
However when the compressor maximum efficiency is attained further increase
rotational speed will not achieve corresponding rise in pressure ratio because
the air molecule will separate from the compressor blade surface. This
phenomenon is referred to as choke condition.

Figure 21:TS3000 DP Compressor Performance Curve
Figure 22: TS3000 DP Compressor Map
3.4 Off Design Performance Simulation
Off design performance simulation is important to establish engine overall
performance characteristic over a wide range of operating condition for safety
and operational economic benefit. Design engine is simulated at varying degree
of ambient conditions, altitude and part load.
0
5
10
15
20
25
30
35
40
10 30 50 70 90 110
PR
NDMF
SURGE LINE RUNNING LINE
0.3
0.4
0.5
0.6
0.7
0.8
0.9
1.0
10 30 50 70 90 110
ETA
NDMF

Figures 23 to 25 represent the performance of the engine when simulated under
various ambient condition (-5 to 40) oC as attached in the appendix A 1. The
performance shows optimal power output and increase pressure ratio when
operating in cold atmosphere because more dense air molecule is able to
consumed and compressed by the axial compressor and thus give rise to
maximum power output. The power output begin to decline when ambient
temperature increases which is the expected turbine performance. Furthermore,
fuel flow increases at cold ambient conditions which enhance maximum power
delivery and associated with rise in specific fuel consumption. Detailed
simulation data is attached in Appendix A2
Figure 23: Variation of Shaft Power output, Pressure Ratio with Ambient
Temperature
15
20
25
30
35
40
280 290 300 310 320 330 340
AMBIENT TEMP (K)
Shaft Power(MW)
PR

Figure 24 : Fuel Flow (kg/s) against Ambient Temp (k)
Figure 25: Variation of Thermal Efficiency with Fuel Flow
(k)
0.0
0.5
1.0
1.5
2.0
2.5
288.0 298.0 308.0 318.0 328.0 338.0
Fue
l Flo
w (
kg/s
)
AMB Temp (K)
Fuel Flow vs Ambient
Fuel Flow vs Ambient
0.35
0.36
0.37
0.38
0.39
0.40
0.41
0.42
288.0 298.0 308.0 318.0 328.0 338.0
EFFI
CIE
NC
Y
AMB (K)
EFFICIENCY VS AMB
EFFICIENCY VS AMB

3.5 Engine Performance at varying TET
Figure 26: Shaft Power (MW) Turbine Entry Temperature TET (K)
Figure 27: Efficiency versus Turbine Entry Temperature TET (K)
0
5
10
15
20
25
30
35
40
1000 1100 1200 1300 1400 1500 1600 1700
SHA
FT P
OW
ER (
MW
)
TET (K)
SHAFT POWER VS TET
SHAFT POWER VS TET
0.00
0.05
0.10
0.15
0.20
0.25
0.30
0.35
0.40
0.45
1000 1100 1200 1300 1400 1500 1600 1700
eff
icie
ncy
TET K
EFFICIENCY VS TET
EFFICIENCY VS TET

Figure 28: Fuel Flow (kg/s) against Turbine Entry Temperature TET (K)
Figure 26 to 28 depict the performance of gas turbine engine with influence of
changes in turbine entry temperature (TET).There is huge drop in shaft power
at low TET accompanied with large fuel consumption which an indication of
engine poor performance at TET (1000k) but as TET increases there is
indication of sudden drop in specific fuel consumption and appreciable increase
in shaft power output with increased fuel flow. Appendix A3
3.6 Axial Compressor Fouling simulation
In order to demonstrate good understanding of gas turbine performance and to
aid actual field data analysis, turbo-match software was used to model the
engine to be investigated (H25). The performance at different off design
condition was simulated and various interaction between various components of
the engine was studied. This provided better insight into engine characteristics
at different condition.
The effectiveness of online compressor wash on overall gas turbine
performance was simulated with used of TURBOMATCH software. An industrial
0.00
0.50
1.00
1.50
2.00
2.50
1000 1200 1400 1600 1800
FUEL
FLO
W(K
G/S
)
TET
FUEL FLOW VS TET
FUEL FLOW VS TET

single shaft engine (Fig29) called B54 with the under listed specifications(Table
6) was retrieved from public domain and investigated at clean, fouled and
washed condition
Figure 29: Shows Single Shaft simple Gas Turbine
Table 7: B54 Engine Model Design Point Objective
Design Parameters Value Simulation DP results
Mass Flow 88.0kg/s 88.0Kg/s
Pressure ratio 14.7 14.7
Turbine Inlet Temperature 1548K 1548
Exhaust temp 843K 840K
Thermal Efficiency 33.8%
33.7%
Compressor isentropic efficiency 0.8%
The engine is modelled at design point and run with turbo-match software; the
result is very valid when compared with the specification from open domain
(Table7) with minor disparity from exhaust temperature. This creates a good
platform to simulate and investigates the engine at off design performance
condition.
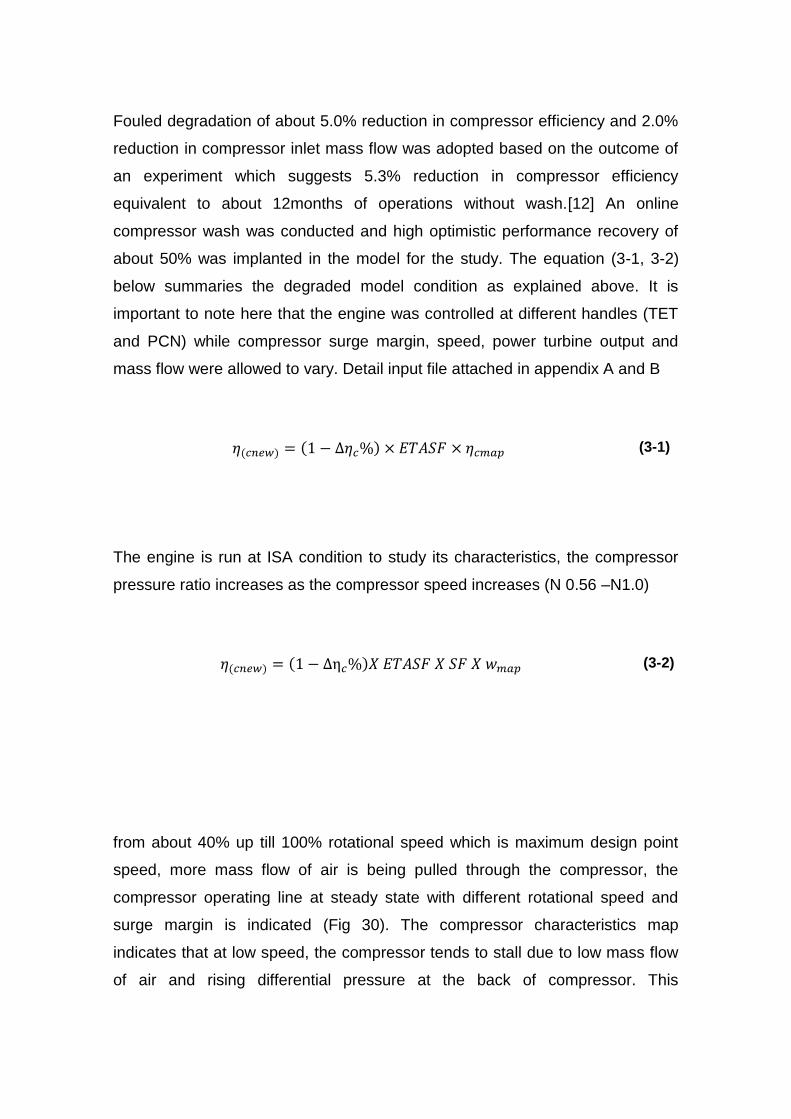
Fouled degradation of about 5.0% reduction in compressor efficiency and 2.0%
reduction in compressor inlet mass flow was adopted based on the outcome of
an experiment which suggests 5.3% reduction in compressor efficiency
equivalent to about 12months of operations without wash.[12] An online
compressor wash was conducted and high optimistic performance recovery of
about 50% was implanted in the model for the study. The equation (3-1, 3-2)
below summaries the degraded model condition as explained above. It is
important to note here that the engine was controlled at different handles (TET
and PCN) while compressor surge margin, speed, power turbine output and
mass flow were allowed to vary. Detail input file attached in appendix A and B
The engine is run at ISA condition to study its characteristics, the compressor
pressure ratio increases as the compressor speed increases (N 0.56 –N1.0)
from about 40% up till 100% rotational speed which is maximum design point
speed, more mass flow of air is being pulled through the compressor, the
compressor operating line at steady state with different rotational speed and
surge margin is indicated (Fig 30). The compressor characteristics map
indicates that at low speed, the compressor tends to stall due to low mass flow
of air and rising differential pressure at the back of compressor. This
𝜂(𝑐𝑛𝑒𝑤) = (1 − Δ𝜂𝑐%) × 𝐸𝑇𝐴𝑆𝐹 × 𝜂𝑐𝑚𝑎𝑝
(3-1)
𝜂(𝑐𝑛𝑒𝑤) = (1 − Δη𝑐%)𝑋 𝐸𝑇𝐴𝑆𝐹 𝑋 𝑆𝐹 𝑋 𝑤𝑚𝑎𝑝 (3-2)

phenomenon is usually controlled by the IGV, VGV and bleed valve installed on
the compressor. These control devices usual come to play during engine start
up to prevent engine from stalling. However, at higher rotational speed the
compressor tends to choke due higher mass flow of air and reduce pressure
ratio, which compressor cannot cope with. The compressor would go into surge
at higher speed beyond design speed and the compressor is protected by
installation of various anti-surge control systems. The compressor performance
does not further increase when the designed point efficiency has been attained
(Fig 31) and in fact further increase in rotational speed cause drastic downward
shift in compressor efficiency.
Figure 30: Axial Compressor characteristics at different Rotational Speed
2
4
6
8
10
12
14
16
18
30 50 70 90
Pre
ssu
re R
atio
NDMF
At 0.56
At 0.67
At 0.79
At 0.9
At N 1.0
Surge line
Operatingline

Figure 31: Axial Compressor Efficiency against Pressure Ratio
3.7 Gas Turbine Performance at Varying Turbine Entry
Temperature
The performance simulation shows that with increase turbine entry temperature
(1000-1500K), the engine thermal efficiency experiences rises which means
that more fuel flow is admitted into the combustion chamber to meet the
demand of load increase.
0
0.1
0.2
0.3
0.4
0.5
0.6
0.7
0.8
0.9
0 5 10 15 20 25 30
Co
mp
ress
or
Effi
cie
ncy
ηc
Pressure Ratio (PR)
N 0.56
N 0.67
N 0.79
N 0.9
N 1.0
N 1.03
N 1.07
N 1.12
N 1.24
N 1.29

Figure 32: Shows Gas Turbine Thermal Efficiency versus Turbine Entry
Temperature TET (K)
However, ambient temperature play significant role in performance of gas
turbine and can be seen in the Figure (32-34). These indicate that at same
power setting of TET but with colder ambient temperature of -5oC, an additional
gain of 4% thermal efficiency is achieved. This is due to the fact that more
dense air is able to move through axial compressor with addition of
proportionate fuel flow to achieve the desired power output.
0
0.05
0.1
0.15
0.2
0.25
0.3
0.35
0.4
1000 1100 1200 1300 1400 1500 1600
The
rmal
eff
icie
ncy
TET(K)
At -5ambt At 10 amb

Figure 33: Shows variation of Turbine Power Output with Turbine Entry
Temperature TET (K)
Figure 34: Shows variation of Fuel Flow (kg/s) with Turbine Entry Temperature
TET (K)
3.8 Compressor Map Shifted Due to Implanted Fouling
Base on the past work that was done in investigation of impact of compressor
fouling on gas turbine performance [13] compressor fouling of 5% reduction in
compressor efficiency and 2% reduction in mass flow was implanted in the
0.0
5.0
10.0
15.0
20.0
25.0
30.0
1000 1100 1200 1300 1400 1500 1600
Po
we
r o
utp
ut(
MW
)
TET(K)
At -5amb At 10ambt
0.0
0.2
0.4
0.6
0.8
1.0
1.2
1.4
1.6
1.8
2.0
1000 1100 1200 1300 1400 1500 1600
Fue
l flo
w(K
g/s)
TET(K)
At -5amb At 10amb

turbo-match engine input file (Appendix c) and an optimistic recovery of 50% in
efficiency and mass flow was simulated for washing effectiveness. The
compressor characteristics after simulation is presented (fig 35)
Figure 35: Effect of implanted fouling condition on compressor characteristics
Compressor map at clean, degraded and washed condition was plotted as
shown in figure 35.Fouled case shown some per cent of reduction in mass flow
which shifts compressor map entirely from its design characteristics map, it
assumed another characteristics map and the compressor will not be able
deliver its design maximum pressure ratio. Table 8 is the result of reduction in
compressor pressure ratio and non-dimensional mass flow due implanted
fouling and percentage recovery after simulated washed condition.
Table 8: Effect of Implanted Fouling on Compressor Performance
Compressor condition
Pressure Ratio NDMF Result
Clean 14.7 0.01489 0
Fouled 14.3 0.01461 2%
Washed 14.57 0.01475 0.9%
0
5
10
15
20
25
30
0 20 40 60 80 100 120 140
PR
mass flow( Kg/s)
clean
washed
Fouled

The shift in compressor map is more obvious (Fig 36) when the compressor
isentropic efficiency is plotted against pressure ratio for both design point
condition and fouled condition.
Figure 36: Shows Compressor Isentropic Efficiency versus Pressure Ratio
The impact of simulated and optimistic recovery of 50% in compressor
performance is illustrated in (Fig 37)
Figure 37: Shows Effect of simulated washed condition
0
0.1
0.2
0.3
0.4
0.5
0.6
0.7
0.8
0.9
0 5 10 15 20 25 30
Co
mp
ress
or
Effi
cie
cy η
c
Pressure Ratio PR
Clean
fouled
0
0.1
0.2
0.3
0.4
0.5
0.6
0.7
0.8
0.9
0 5 10 15 20 25 30
ηc
PR
clean
Washed
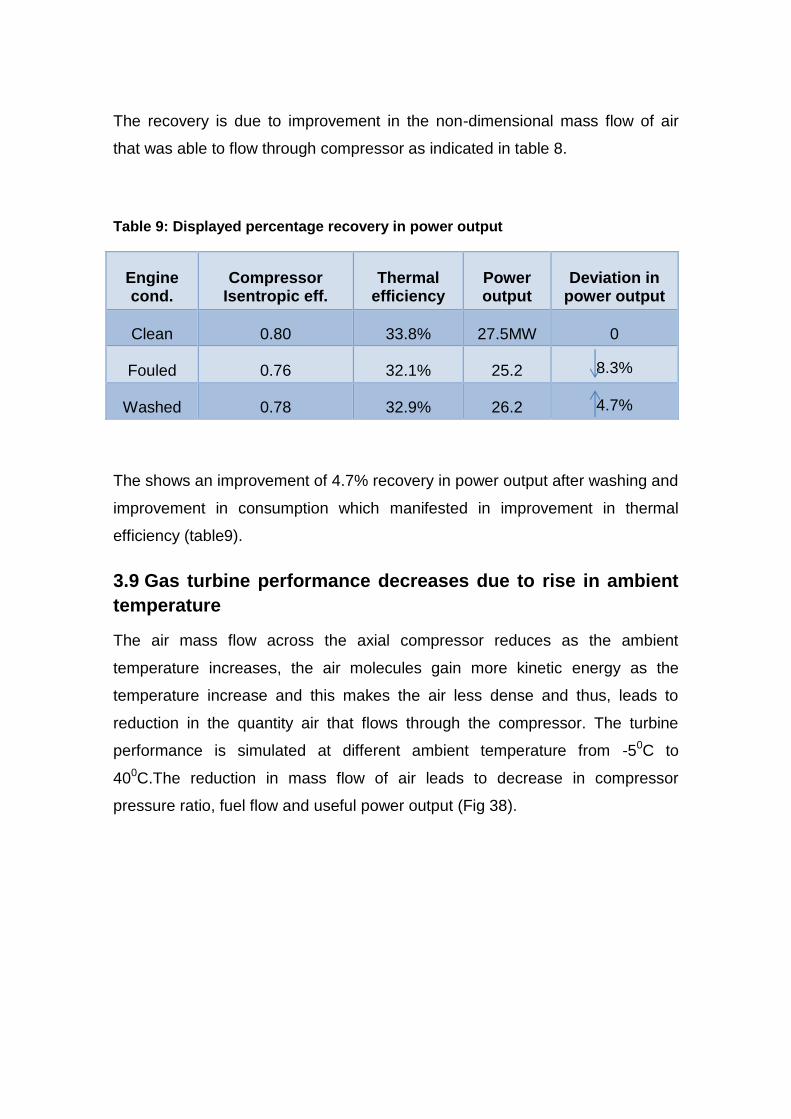
The recovery is due to improvement in the non-dimensional mass flow of air
that was able to flow through compressor as indicated in table 8.
Table 9: Displayed percentage recovery in power output
Engine cond.
Compressor Isentropic eff.
Thermal efficiency
Power output
Deviation in power output
Clean 0.80 33.8% 27.5MW 0
Fouled 0.76 32.1% 25.2 8.3%
Washed 0.78 32.9% 26.2 4.7%
The shows an improvement of 4.7% recovery in power output after washing and
improvement in consumption which manifested in improvement in thermal
efficiency (table9).
3.9 Gas turbine performance decreases due to rise in ambient
temperature
The air mass flow across the axial compressor reduces as the ambient
temperature increases, the air molecules gain more kinetic energy as the
temperature increase and this makes the air less dense and thus, leads to
reduction in the quantity air that flows through the compressor. The turbine
performance is simulated at different ambient temperature from -50C to
400C.The reduction in mass flow of air leads to decrease in compressor
pressure ratio, fuel flow and useful power output (Fig 38).

Figure 38: Shows Effect of Ambient Temperature rise on Gas Turbine
Performance
The gas turbine overall thermal efficiency drops as the ambient temperature
increases (Fig 39) which affect fuel flow as well because as ambient
temperature increase, the fuel gas become less dense and the quantity of fuel
flow decreases with increase ambient temperature.
Figure 39: Shows Decline in Gas Turbine Thermal efficiency as Ambient
Temperature rises
0.0
10.0
20.0
30.0
40.0
50.0
60.0
70.0
80.0
90.0
100.0
280.0 285.0 290.0 295.0 300.0 305.0 310.0 315.0 320.0 325.0 330.0 335.0
Ambient Temp(K)
Power output PR Mass flow
0.0
0.5
1.0
1.5
2.0
2.5
280.0 285.0 290.0 295.0 300.0 305.0 310.0 315.0 320.0 325.0 330.0 335.0
Ambient Temp(K)
Thermal efficiency Fuel flow

3.10 Summary
Turbo-match software has proven to be important tool in understanding gas
turbine performance at different operating condition. TS3000 and H 25 engine
were modelled, the off design performance has shown that the engine
behaviour is dependent on the prevailing operating atmospheric condition.
Thermal efficiency and power produced decreases with rise in ambient
temperature while same engine exhibit better efficiency with less fuel
consumption when operating in a cold atmospheric environment.
The Turbo-match revealed the effect of gas generator compressor fouling on
the overall gas turbine performance. The reduction in flow capacity, mass flow
and entire shift in compressor characteristics due to fouling is depicted in
compressor map which is detrimental to gas turbine operation because the
compressor equilibrium operating line is closer to the surge point.
The effectiveness of compressor washing in performance recovery is shown
with simulation exercise which results into recovery of gas turbine flow capacity
and thermal efficiency recovery.
4 Field Data Analysis
Many industries used gas turbine as their prime mover because of its known
advantages over diesel engine for example and thus expectations are high in
maximising its performance. Among other factors that contribute to gas turbine
deterioration is its operating environment, mode of its operating condition i.e.
load condition (base load or part load), type of driven equipment (alternator,
pump, propeller). This chapter will investigate the performance of gas turbine,
Hitachi H-25 model that is operating in coastal area, bonny terminal, Nigeria.
The aim is to study the plant engine performance over period time and identify
deterioration symptoms.

4.1 Plant (BOGT) Overview
The Bonny Oil and Gas Terminal (BOGT) located in onshore is mainly for crude
oil sales, it receives inventories from every Shell oil fields located in eastern
region, Nigeria. Crude oil is dehydrated, stabilised in BOGT before storage. It
has capacity to handle 1.2million barrel of oil per day. The process crude oil is
transported through offshore pipeline to the tankers and to Nigeria National
Petroleum Company refinery. The terminal is the biggest in the entire country
and thus its availability is paramount to the nation’s economy. The plant
supplies power to the neighbouring community as a social responsibility.
The Process Flow Scheme is illustrated figure 48 . Five incoming crude streams
enter the Terminal and are blended into one common header. These are Land
Light, Land Medium, Swamp Light, Cawthorne Light and Utapate Light
The blended crude is dehydrated partially and stabilized in Crude Dehydration
and Stabilization unit consisting of five (5) Free Water Knock out (FWKO) trains.
These are Trains A, B, C, D and E.
Following crude dehydration and stabilization, the treated crude is transferred to
Crude Storage Tanks and the separated water is pumped to Produced Water
Treatment plant consisting of one surge/buffer tank and five (5) trains.
The off gas (called Associated Gas) from the stabilization process is
compressed and piped to the Nigerian Liquefied Natural Gas (NLNG) plant
through the Bonny Non Associated Gas (BNAG) plant
Emulsion extracted from the Free Water Knock out (FWKO) during the crude
dehydration process is sent to Emulsion Treatment plant consisting of three (3)
trains and two (2) tanks. The emulsion is separated to oil and water, the oil
returns back to the crude oil dehydration and stabilization unit while the water is
piped to the water treatment unit.
The crude in Crude Storage Tanks is dehydrated to 0.5 % BS&W the required
quality ready for export and transferred to the old and new Offshore Export lines
or to the lines to the Refinery by booster pumps and export pumps.

Water from the FWKO trains, Emulsion treatment unit and Tank farm blend to a
single header and sent to the Produced Water Treatment [50]
Electrical power for the Terminal is supplied by three (3) existing SOLAR turbine
generator sets and three (3) new HITACHI turbine generator sets.
Figure 40: Shows BOGT Plant overview
The plant has three Hitachi, two solar, gas turbine for power generation. The
power distribution system is three phase, 33kV with 50Hz supplied. This work
will only be investigating the performance of one of the H25 model gas turbines
at three different periods in its operation:
Period A 1548-3104 running hours (Fig 41)
Period B 3104-5650 running hours (Fig 42)
Period C 5650-7841 running hours (Fig 43)

Figure 41: Shows Period A
Figure 42: Show Period B
y = 0.0005x + 8.0052
2
4
6
8
10
12
14
16
18
1000 2000 3000 4000
corr
ect
ed
po
we
r o
utp
ut(
MW
)
Time(hours)
Corrected Power Output against Equipment Running Hour
y = 0.0035x - 9.2139
2
4
6
8
10
12
14
16
18
20
5000.00
corr
ect
ed
po
we
r o
utp
ut(
MW
)
Time(hours)
Corrected Power Output against Equipment Running Hour

Figure 43: Shows Period C
Power output trend for different period within the investigation period show that
there was increase in power output in period B which was as a result of two
weekly online washing activities that was done during this period .However,
there was reduction in power output over time at period C which was a result of
no wash activities. Period A trend shows the engine performance shortly the
engine was commissioned.
There were no available equipment running data recorded from day one the
engine was commissioned till 1548 running period in the field logbook and this
explains why the analysis did not start from the inception of the equipment.
However, the data appeared scattered due to dynamic condition of field
operations. The average power utilised over the period of investigate is 9.5MW
with occasional higher power consumption of 17.1MW when more crude oil
loading pumps are required at the peak of vessel loading while power
generation at off peak when no loading operation take place is around 2.2MW
from the plant that has capacity to generate up to 27.5MW from a single Hitachi
turbine.
y = -0.0011x + 17.71
2
4
6
8
10
12
14
16
18
5500 6500 7500
corr
ect
ed
po
we
r o
utp
ut(
MW
)
Time(hours)
Corrected Power Output against Equipment Running Hour

4.2 Overview of Hitachi H25 Engine
H-25 model gas turbine is an open simple cycle, single shaft gas turbine with 17
stage axial compressor blade and three-turbine stages. The compressor
pressure ratio is 14.7 with combustor exit temperature of 12600c and 27.5MW
power capacity. [14]. It is equipped with pre-mix combustor of dry low NOx
emission of about 25ppm or less. Table 10 shows further H-25 gas turbine
performance specifications available in the public. It also has multi-can
combustor chamber (10 cans). Figure 44 shows the main components of H-25
model [15; 16].
Figure 44: Main Components Arrangement of H25 Engine

Table 10: Shows H5 Gas Turbine Specification
Item Unit
Output MW 27.5
Gross power generation efficiency
% 33.8
Airflow at compressor inlet
Kg/s 88
Exhaust 0C 555
Pressure Ratio 14.7
Rotational Speed RPM 7280
.
4.3 Engine Data Representation after 7841 Running Hours
Real engine data of Hitachi H25 (from August 2008 to September 2009) shortly
after the engine was commissioned and run for 7841 running hours will be used
for this part of study. The aim is to evaluate the performance over this period
and to demonstrate thorough understanding of gas turbine performance. The
engine data collected includes fuel flow (Kg/hr.), power output (MW), exhaust
temperature, and running hours. The data were corrected to ISA condition and
were converted to SI units.

Ambient temperature around the operating area usually hover between 22-280C
on a typical day (Fig 45) but could go up to 35oC during dry season while the
average daily ambient temperature is around 26oC
Figure 45: Shows Typical Daily Temperature Variation
Ambient condition pressure, humidity and temperature affect engine
performance. The atmospheric pressure of the environment where the engine is
operating experiences little or no change over times while relative humidity
changes but there is no instrumentation installed to measure humidity on the
engine, thus, their effect might be neglected

Figure 46: Shows Ambient Temperature Variation
The ambient temperature rise (Fig46) is usually in the afternoon and mostly
around 5th – 9th month of the year. The trend of power consumption (Fig 47) in
plant shows progressive demand which could be associated to installation of
new equipment (additional illumination and pumps) and growth in the population
of the communities. The investigation revealed that 6.1MW appears to be the
regular power demand because it has higher number of frequency from the data
gathered.
10
15
20
25
30
35
0 1000 2000 3000 4000 5000 6000 7000 8000 9000
Am
bie
nt
tem
p(o
C)
Time(hours)
0
2
4
6
8
10
12
14
16
18
20
0 1000 2000 3000 4000 5000 6000 7000 8000 9000
corr
ect
ed
po
we
r o
utp
ut(
MW
)
Time(hours)
Figure 47: Corrected Power Output versus Running Hours
The average power consumption over the period of study is 8.86MW; the lowest
being 2.2MW while the maximum power demand was 17.5MW. This shows that
the engine is running on part load which necessitated low engine performance
as indicated in fuel consumption analysis. The analysis shows that 28% of the
engine capacity is being utilised during the period of this investigation.
The minimum load (2.2MW) recorded was at off peak period when vessels are
not available to evacuate crude oil, thus plant operational activities are minimal.
The maximum load was at the peak of operation when vessels were on queue
to be filled with crude oil and the inventory from other locations was optimal.
The trend of fuel flow (Fig 48) over the period of study indicates progressive rise
as power demand increases.

Figure 48: Corrected fuel Flow (kg/s) versus Running Hours
The engine performance (Fig 49-50) shows normal characteristics, increase in
fuel supply as the load requirement changes and there is corresponding change
in power output with rise in fuel flow.
Figure 49: Shows Corrected Fuel Flow (kg/s) versus Corrected Power Output
(MW)
0
0.5
1
1.5
2
2.5
0 1000 2000 3000 4000 5000 6000 7000 8000 9000
corr
ect
ed
fu
el f
low
(Kg/
s)
Time (Hours)
Corrected fuel flow Linear (Corrected fuel flow)
0
0.5
1
1.5
2
2.5
0 2 4 6 8 10 12 14 16 18 20
corr
ect
ed
fu
el f
low
(Kg/
s)
corrected power output(MW)

Figure 50: Shows Corrected Power output versus Corrected Fuel flow
4.4 Measurement Data Correction
Gas turbine operates under varying conditions of ambient temperature,
pressure, rotating speed and load in the field. Though, the field data collected
were representation of measurement data at engine steady state. The data
analysed in this work is average data taken per day to eliminate errors and
improve the quality of the data. In order to remove the effect of ambient
conditions in field data, and estimate gas turbine performance at international
standard atmospheric (ISO) condition (ambient temp.303.15K, atmospheric
pressure 1.013 bars and relative humidity of 60%) the following correction
formula were employed in this analysis.
. 𝑊𝑎𝑐𝑜𝑟𝑟 =𝑤𝑎 √
𝑇1288𝐾
𝑝11.013 𝑏𝑎𝑟
(4-1)
𝑊𝑓𝑐𝑜𝑟𝑟 = 𝑤𝑓√ 𝑇1
288𝑘𝑃1
1.013𝑏𝑎𝑟
(4-2)
𝑃𝑐𝑜𝑟𝑟 = 𝑃√ 𝑇1
288𝑃1
1.013𝑏𝑎𝑟
(4-3)
0
0.5
1
1.5
2
2.5
0 2 4 6 8 10 12 14 16 18 20
corr
ect
ed
po
we
r o
utp
ut(
MW
)
corrected fuel flow(Kg/s)

T5=𝑇5𝑇1
288𝐾
(4-4)
The measured parameter is compared with corrected parameter (Fig 51-52) to
eliminate the effect of ambient condition and trend engine performance at
ISASLA condition. The corrected parameter is found to be slightly above the
measured parameter.
Figure 51: Comparison of corrected fuel Flow with measured Fuel Flow (kg/s)
0
0.5
1
1.5
2
2.5
0 1000 2000 3000 4000 5000 6000 7000 8000 9000
Fue
l flo
w(K
g/s)
Fuel Flow against Running Hour
Corrected fuel flow Measured fuel flow
Linear (Corrected fuel flow) Linear (Measured fuel flow)

Figure 52: Comparison of Corrected power output with measured power output
4.5 Engine Control Mode
Figure 53: Corrected Exhaust Temperature versus Running Hours
Engines are controlled usually by either rotating speed or turbine entry
temperature. It appears from the trend (Fig 53) that TET was this engine
handles of control because the EGT trend maintains parallel straight line over
0
5
10
15
20
0 1000 2000 3000 4000 5000 6000 7000 8000 9000
Po
we
r o
utp
ut
Power output against Running Hours
corrected power output Measured power output
Linear (corrected power output) Linear (Measured power output)
308
310
312
314
316
318
320
322
324
0 1000 2000 3000 4000 5000 6000 7000 8000 9000
corr
ect
ed
exh
aust
te
mp
.(K
)
Time(hours)
Corrected Exhaust Temperature Against Running Hour

the period of investigation. As the engine experiences increase in load
requirement which is compensated by increase in fuel flow and proportional rise
in exhaust temperature(Fig 54), TET being the handle of control responded by
maintaining the EGT within the set temperature range (600K).
Figure 54: Corrected Exhaust Temperature (K) versus Corrected Fuel Flow (kg/s)
4.6 Engine Fuel Consumption
A good measure of engine efficiency is fuel consumption; the fuel flow of the
engine over the period of time is investigated to determine the engine
performance and its fuel consumption rate (Fig 55).
Thermal Efficiency=𝑃𝑜𝑤𝑒𝑟 𝑜𝑢𝑡𝑝𝑢𝑡
𝐹𝑢𝑒𝑙 𝑠𝑢𝑝𝑝𝑙𝑖𝑒𝑑
(4-5)
𝑆𝐹𝐶 =𝑓𝑢𝑒𝑙 𝑓𝑙𝑜𝑤 𝑟𝑎𝑡𝑒
𝑢𝑠𝑒𝑓𝑢𝑙 𝑝𝑜𝑤𝑒𝑟
(4-6)
0
100
200
300
400
500
600
700
800
0 0.5 1 1.5 2 2.5corr
ect
ed
exh
aust
te
mp
era
ture
(K)
corrected fuel flow(Kg/s)
Corrected Exhaust Temp against Corrected Fuel Flow

The fuel consumption was further investigated at different engine period of
operations: Period A: 1535-3080, Period B: 3104-565, Period C: 5650-7841.It
is observed that the rate of fuel consumption at low power setting 2.2MW is
more than the fuel consumption rate at higher load requirement 6.1MW,which
has frequency of appearance within the data collected.
Figure 55: Corrected Fuel Flow versus Corrected Power Output
The fuel flow line during period A is intercepted by the fuel flow line of period B,
the trend actually shows fuel flow reduction when compared with the trend
indicated in period A. The improvement in fuel consumption was as a result of
online water wash activities that were carried out on the engine. The trend
during period C, shows rise in fuel consumption, which an indication of more
fuel consumption. (Fig55)
The engine clean condition is taken as base line data (period B) when water
wash was carried out, since, the engine performance at 0 operating hour is not
available from the data collected. Table 9 depicts the fuel consumption for a
given power output.
0
0.5
1
1.5
2
2.5
0 2 4 6 8 10 12 14 16 18
Co
rre
cte
d f
ue
l flo
w(K
g/s)
Corrected power output(MW)
Corrected Fuel Flow versus Corrected Power output
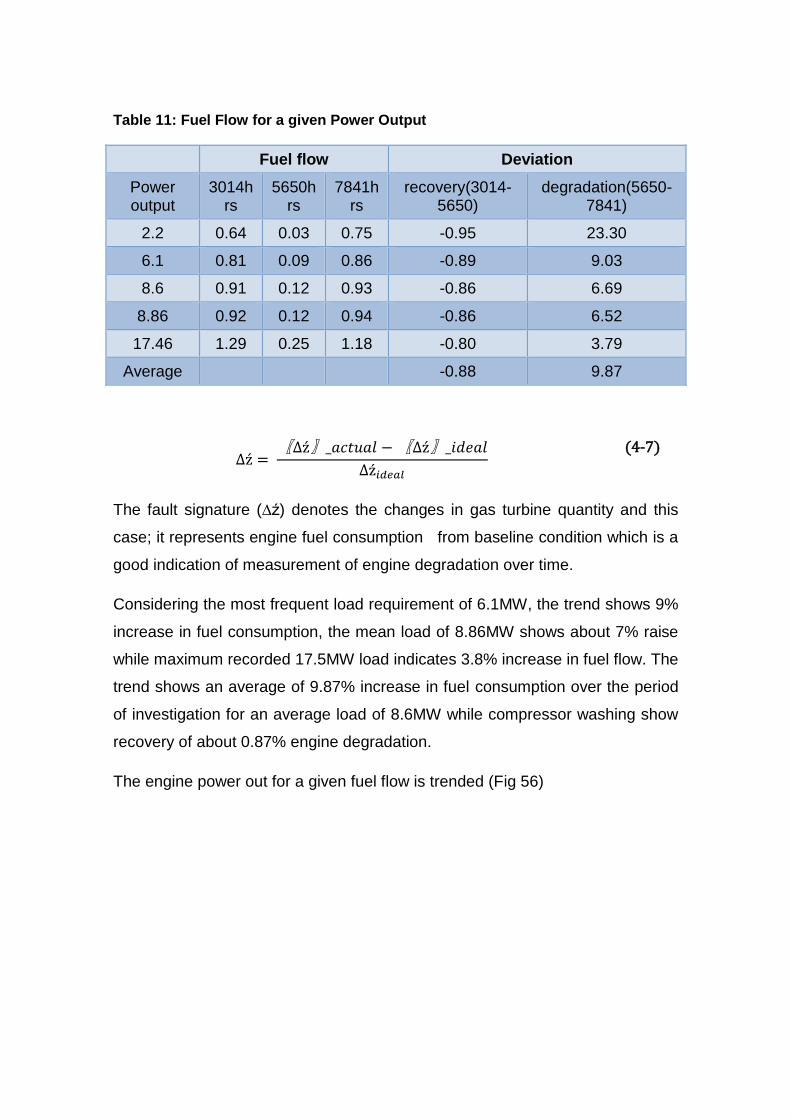
Table 11: Fuel Flow for a given Power Output
Fuel flow Deviation
Power output
3014hrs
5650hrs
7841hrs
recovery(3014-5650)
degradation(5650-7841)
2.2 0.64 0.03 0.75 -0.95 23.30
6.1 0.81 0.09 0.86 -0.89 9.03
8.6 0.91 0.12 0.93 -0.86 6.69
8.86 0.92 0.12 0.94 -0.86 6.52
17.46 1.29 0.25 1.18 -0.80 3.79
Average
-0.88 9.87
∆ź = 〖∆ź〗_𝑎𝑐𝑡𝑢𝑎𝑙 −〖∆ź〗_𝑖𝑑𝑒𝑎𝑙
∆ź𝑖𝑑𝑒𝑎𝑙
(4-7)
The fault signature (∆ź) denotes the changes in gas turbine quantity and this
case; it represents engine fuel consumption from baseline condition which is a
good indication of measurement of engine degradation over time.
Considering the most frequent load requirement of 6.1MW, the trend shows 9%
increase in fuel consumption, the mean load of 8.86MW shows about 7% raise
while maximum recorded 17.5MW load indicates 3.8% increase in fuel flow. The
trend shows an average of 9.87% increase in fuel consumption over the period
of investigation for an average load of 8.6MW while compressor washing show
recovery of about 0.87% engine degradation.
The engine power out for a given fuel flow is trended (Fig 56)

Figure 56: Corrected Power Output (MW) versus corrected Fuel Flow (kg/s)
Due compressor water washing maintenance activities during period B, the fuel
flow rate gives almost equal power output as period A and this is indicated in
the way the two trend matched into each other. Period C shows some increase
in fuel flow as load increase but when compared with the fuel flow at higher
power output, there is big reduction in Period C trend. Table 12 shows the
power output for a given fuel flow
Table 12: Power output for a given fuel flow
Power output Deviation
Fuel flow 3014hrs 5650hrs 7841hrs Recovery(3104-
5650) Degradation (5650-7841)
0.8 5.99 6.38 9.21 -0.060 0.443
1 10.6 10.60 10.09 -0.0002 -0.047
1.2 15.20 14.82 10.99 0.0258 -0.258
Average
-0.0118 0.04567178
The trend shows an average of 4.5% reduction over the period for a given fuel
flow. There is increase in power out from Period B when compared with period
0
5
10
15
20
0 0.5 1 1.5 2 2.5
corr
ect
ed
po
we
r o
utp
ut(
MW
)
corrected fuel flow(Kg/s)
Corrected Power Output against Corrected Fuel Flow
Period A Period B Period C
Linear (Period A) Linear (Period B) Linear (Period C)

C but the trend (power output) keep declining as the fuel supply increases. The
compressor water wash activity shows power recovery of 1% when compared
with period A
4.7 Summary
The general overview of the case study plant is given in the piping and
instrumentation drawing included in this chapter and the overview of the gas
turbine used in the plant. The data analysed shows typical plant energy
consumption and the plant utilisation.
The engine data provided opportunity to study the turbine behaviour at different
period within the operations. The high consumption in fuel is due to compressor
fouling while effectiveness of compressor washing is evident in reduced fuel
consumption for a given power output. The engine control mode was also
identified from the data analysed which is shown Exhaust gas temperature
consistency.
5 Economic Analysis of Hitachi Gas Turbine
The field data analysis executed in the previous chapter has provided a basis to
x-ray the economic performance of Hitachi-H25 gas turbine used for power
generation in bonny terminal, Nigeria. The engine designed for power
requirement of 27.5MW at full capacity is being underutilised due to low power
requirement in the plant as reflected in the available data. Though, this could
extend the engine creep life because the engine most time operates below
designed turbine inlet temperature of 1548K. However, the engine performance
exhibit poor thermal efficiency as indicated in higher fuel consumption at part
load. The operating cost of the engine at off design performance which involves
engine performance at part load and prevailing ambient temperature were
evaluated and benched mark with engine operating cost while operating at

design point. The performance recovery in terms of fuel cost after compressor
water wash is estimated to quantify the economic gains associated with the
compressor washing. However, the cost of compressor washing module,
washing fluid and the equipment downtime cost while carrying out cold wash
are included in the cost evaluation. It is important to showcase the cost
implication of the current power generation operating strategy to the company
for better business decision in the future.
5.1 Economic Evaluation of Hitachi H25 at design point
The Turbo-match engine model result indicates Hitachi H25 attain its optimum
performance of 27.5MW power output with 2.43Kg/s fuel consumption at engine
rotational speed of 7280rpm and 280K ambient temperature.
Engine performance is better appreciated when presented in monetary gains,
thus the need to estimate the plant profitability if the engine is running at its
design point.
The fuel price for natural gas is calculated using the formula below:
Natural gas price for single spool engine fuel consumption is $4.39 per 1000
cubic foot
The unit of thousand cubic foot is converted to kilogram [45]
(16𝑔
𝑚𝑜𝑙) × (1000
𝐿
𝑚3) × (22.4
𝐿
𝑚𝑜𝑙) = 0.714
𝐾𝑔
𝑚3 (5-1)
1000litres is contains in one cubic meter. Meanwhile 22.4 litres of any gas is
contains in one mole. Molar mass of methane CH4 is 16 g per mol which means
there are 0.714 kilograms of gas in a cubic meter.
$4.39 per thousand cubic foot = 1000 cubic foot = 28.3168 m3 = 20.2062Kg
1kg = 1.4014m3,therefore,2.43Kg/s = 3.40m3/s = 120.07 cubic foot = $0.53

The cost of fuel consumption per year when at design point = fuel price per
second * year = 0.53 * 3153600 = $1,671,408
5.2 Fuel Consumption Cost of Hitachi at Prevailing Operating
Temperature
The engine operates in an atmosphere which is completely different from the
design operating temperature. This results into increase in fuel flow and rise in
the engine operating fuel cost, which takes its toll in plant profitability. The off
design simulation exercise gives 2.55kg/s as fuel flow under normal ambient
temperature of the engine operating environment.
The fuel price for natural gas is calculated using the formula below:
Natural gas price for single spool engine fuel consumption is $4.39 per 1000
cubic foot
The unit of thousand cubic foot is converted to kilogram,
1000litres is contains in one cubic meter. Meanwhile 22.4 litres of any gas is
contains in one mole. Molar mass of methane CH4 is 16 g per mol which means
there are 0.714 kilograms of gas in a cubic meter.
$4.39 per thousand cubic foot = 1000 cubic foot = 28.3168 m3 = 20.2062Kg
1kg = 1.4014m3,therefore,2.55Kg/s = 3.58m3/s = 126.43 cubic foot = $0.56
Fuel cost per year for single spool engine running under high ambient
temperature = $0.56 * 3153600 = $1,766,016
5.3 Economic Analysis of Compressor Washing
The results obtained from the data analysis show that the fuel consumption for
a given power output decreases due to two weekly compressor online water
wash.
Estimation of the fuel cost while running the engine without water wash:
For a given power output of 6.1MW the fuel consumption is 0.86kg/s.
Note: $4.39 per thousand cubic foot = 1000 cubic foot = 28.3168 m3 =
20.2062Kg, 1kg = 1.4014m3,
Therefore,0.86Kg/s = 1.204m3/s = 42.52 cubic foot = $0.19
The engine fuel consumption cost per year without compressor wash = $0.19*
315600 = $59,964
Estimation of the fuel cost while online water wash is done:
For given power output of 6.1MW the fuel consumption is 0.09kg/s
The fuel consumption cost of 0.09kg/s = 0.126m3/s = 4.45 cubic foot = $0.02
The engine fuel consumption cost per year with online water wash = 0.02*
315600 = $6,312
Cost Analysis of Two weekly Compressor online water wash
It is important to estimate the cost implication of turbine online water wash
activities. Turbine requires minimum or no disruption during this operation and
thus no significant power loss is accounted for. However, the cost of detergent,
demineralised water and the initial capital of water wash module are significant
in the operation and needs to be included in the plant economic analysis. The
cost of labour is negligible because the operation require no special technicality
Cost of 25litres of water wash detergent = $2,300
Cost of 100litres of Demineralised water = $135.57
Capital cost of water wash module = $10,000

The total cost of water wash (Fixed cost and recurrent cost) = $12,435.57
The total cost of fuel consumption per year + the cost of Two weekly water
wash = $6,312 + $12,435.57 = $18,747.57
Net gain in fuel consumption cost = fuel consumption cost without water wash –
total fuel consumption with online water wash = $59,964 – $18,747.57 =
$41,216.43
5.4 Summary
The results of field analysis have shown that two weekly online compressor
washing is profitable for the plant operation despite additional recurrent cost of
water wash. It reduces the plant operating cost tremendously through reduction
in plant fuel consumption which takes greater per cent in plant running cost. The
cost saving derived from two weekly compressor online water wash annually is
estimated around $41,216.Besides, the plant has shown higher fuel
consumption cost of about $1000 while operating at higher ambient temperature
different from designed operating ambient temperature of 28K.

6 Conclusions and Recommendations
6.1 Conclusions
The main objective of this research has been to evaluate the effectiveness of
gas turbine axial compressor online water wash, in relation to gas turbine
performance recovery.
This work has shown other forms of degradations that have higher tendency to
shorten the engine life cycle through catastrophe failure of the engine
components. However, the failure frequency from this type of irrecoverable
degradation such as foreign object damage, erosion, corrosion and hot
corrosion are low, preventable and could be eliminated throughout the life of the
machine by conscious effort from the plant operator and maintenance team.
Regular washing of axial compressor has become inevitable in order for the
company to maximise her economic gains, optimise equipment utilisation and
reliability. It is shown that installation of high quality filtration system only
reduces the quantity of dirt ingestion into turbine but significant amount
penetrates through the filter overtime and adhere to the axial blade in
accordance with fouling mechanism, as discussed in this work. Though,
technological improvement incorporated in filtration system like filter self-
cleaning system only elongate filter life usage but huge dirt accumulates on the
filters which shows the volume of particulate that are present in the mass flow of
air consumes by the engine and within the turbine inlet volute.
The use of compressor washing detergent (ZOK27) has proven to be friendly to
both machine and human unlike other washing chemical which have negative
impact on environment, attack engine component and without safety guarantee
for the users. It is effective in dissolution of dirt on the blade, aqueous and non-
explosive. These important characteristic features of ZOK 27 enhanced the
effectiveness of the compressor online washing.
The online compressor effectiveness clearly manifested in the recovery of
power output loss from 25.2MW to 26.2MW which is equivalent to about 4.7%
power recovery from Turbomatch simulation while the field data analysis also
revealed an estimation of $41,000 fuel cost saving due to two weekly online
compressor regular water wash which is a huge benefit
6.2 Recommendations
For future research work it is recommended that the engine specific fuel
consumption at design point is provided by the manufacturer to serve as basis
for comparison on the equipment performance overtime. Although, the result
from turbo-match was used for the economic analysis, the specific equipment
design considerations will provide more accurate analysis.
Further work on techno-economic analysis should give considerations to the
effect of relative humidity (RH) in engine performance, the operator logbook
clearly omitted RH in daily equipment parameter logging. The frequency of field
equipment running parameters use for analysis should be on per seconds
interval as against per hour owing to the fact that field running conditions
change regularly. This will provide more accuracy in the data analysis and
eliminate scattered graphical result representation.
For regular implementation, online compressor washing should be included in
company Computerised Maintenance Management system such as System
Application Product software (SAP) which will prompt operator and
maintenance team to execute this activity as part of equipment maintenance
plan.
Robust maintenance plan should be developed for turbine ancillaries to reduce
unscheduled equipment breakdown and improve equipment reliability.
Technical capability of maintenance staff is recommended to be regularly
updated through both class room and on the job training. This will enhance the
quality of technical intervention and reduce equipment MTTR.

REFERENCES
[1] Aretakis, N., Roumeliotis, I., Doumouras, G. and Mathioudakis, K. (2012), "Compressor Washing Economic Analysis and Optimization for Power Generation", Applied Energy, vol. 95, pp. 77-86.
[2] Syverud, E., Brekke, O. and Bakken, L. E. (2007), "Axial compressor Deterioration Caused by Saltwater ingestion", Journal of Turbomachinery, vol. 129, no. 1, pp. 119-126.
[3] Kurz, R. and Brun, K. (2011), "Fouling mechanisms in axial compressors", ASME 2011 Turbo Expo: Turbine Technical Conference and Exposition, GT2011, Vol. 4, 6 June 2011 through 10 June 2011, Vancouver, BC, pp. 935.
[4] Kurz, R. and Brun, K. (2012), "Fouling mechanisms in axial compressors", Journal of Engineering for Gas Turbines and Power, vol. 134, no. 3, pp. 1-9.
[5] Seddigh, F. and Saravanamuttoo, H. I. H. (1990), "Proposed Method for Assessing the Susceptibility of Axial Compressors to Fouling", International Gas Turbine and Aeroengine Congress and Exposition, 11 June 1990 through 14 June 1990, Brussels, Belg, Published by ASME, New York, NY, United States .
[6] Boyce, M. P. and Gonzalez, F. (2005), "A study of On-line and Off-line Turbine Washing to Optimize the Operation of a Gas Turbine", ASME Turbo Expo 2005 - Gas Turbine Technology: Focus for the Future, Vol. 5, 6 - 9 June 2005, Reno-Tahoe, NV, pp. 537.
[7] Badeer, G. H. (October, 2000), GE Aero-derivatives gas turbine-design and operating features, available at: www.ge-
energy.com/products_and_services/productsgas_turbines_aeroderivatives (accessed 10, January, 2013).
[8] Wadia, A.R., Wolf, D.P., and Haseer, F.G. (2002), "Aerodynamic Design and Testing of an Axial Flow Compressor With Pressure Ratio of 23.3:1 for the LM25001 Gas Turbine", vol. 124, no. 6-9th June 1999, pp. 313-340.
[9] Rainer, K., Klaus,B. (2007), "Gas Turbine Tutorial-Maintenance and Operating Practices , Effect on Degradation and Life", pp. 173-179.
[10] Boyce, M. P. and Gonzalez, F. (2007), "A Study of On-line and Off-line Turbine Washing to Optimize the Operation of a Gas Turbine", Journal of Engineering for Gas Turbines and Power, vol. 129, no. 1, pp. 114-122.

[11] Zainul, A. M. (2005), "GT Compressor Water Washing Practices and Effectiveness for TNB Combine Cycle Plant", , pp. 1-4.
[12] Schneider, E., Demircioglu, S., Franco, S. and Therkorn, D. (2009), "Analysis of Compressor On-line Washing to Optimize Gas Turbine Power Plant Performance", 2009 ASME Turbo Expo, Vol. 4, 8 June 2009 through 12 June 2009, Orlando, FL, pp. 591.
[13] Tarabrin, A. P., Bodrov, A. I., Schurovsky, V. A. and Stalder, J. P. (1996), "Analysis of Axial Compressors Fouling and a Cleaning Method of their Blading", Proceedings of the 1996 International Gas Turbine and Aero engine Congress & Exhibition, 10-13 June 1996, Birmingham, UK, ASME, New York, NY, United States, .
[14] Li, Y. G. and Nilkitsaranont, P. (2009), "Gas Turbine Performance Prognostic for Condition-Based Maintenance", Applied Energy, vol. 86, no. 10, pp. 2152-2161.
[15] Tarabrin, A. P., Schurovsky, V. A., Bodrov, A. I. and Stalder, J. (1998), "An Analysis of Axial Compressor Fouling and a Blade Cleaning Method", Journal of Turbomachinery, vol. 120, no. 2, pp. 256-261.
[16] Saravanamuttoo, I. H. and Lakshminarasimha, A. N. (1985), "Preliminary Assessment of Compressor Fouling."Turbomachinery International, vol. 26, no. 7, pp. 14-18.
[17] Tarabrin, A., Schurovsky, V., Bodrov, A. and Stalder, J. (1998), "Influence of Axial Compressor Fouling on Gas Turbine unit Performance based on Different Schemes and with Different Initial Parameters", The 1998 International Gas Turbine & Aeroengine Congress & Exhibition, .
[18] Stalder, J. (2001), "Gas Turbine Compressor Washing State of the art: Field experiences", Journal of Engineering for Gas Turbines and Power, vol. 123, no. 2, pp. 363-370.
[19] Kurz, R. and Brun, K. (2009), "Degradation of Gas Turbine Performance in Natural Gas Service", Journal of Natural Gas Science and Engineering, vol. 1, no. 3, pp. 95-102.
[20] Schneider, K. and Grünling, H. W. (1983), "Mechanical Aspects of High Temperature Coatings", Thin Solid Films, vol. 107, no. 4, pp. 395-416.
[21] Chen, Z., Huang, Z., Wang, Z. and Zhu, S. (2009), "Thermo-Mechanical Fatigue Behavior of Ni-based Superalloy Coated with Ni-Cr-Al-Y", Jinshu Xuebao/ Acta Metallurgica Sinica, vol. 45, no. 7, pp. 820-825.

[22] Yoshiba, M. (1999), "Environment-induced Degradation in high-Temperature Coating Systems", Zairyo to Kankyo/ Corrosion Engineering, vol. 48, no. 3, pp. 135-143.
[23] Silva, V. R., Khatib, W. and Fleming, P. J. (2005), "Performance Optimization of Gas Turbine Engine", Engineering Applications of Artificial Intelligence, vol. 18, no. 5, pp. 575-583.
[24] Ezenwa, A. O. (2011), "Gas Turbine Performance Optimization Using Compressor Online Washing Technique", pp. 501-506.
[25] Hata, S., Horiba, J. and Snider, S. R. (2010), "Process Gas Compressor Fouling and Washing Mitigation a Better Understanding of Fouling Phenomenon and Compressor Design Techniques", AIChE Ethylene Producers Conference Proceedings, pp. 66.
[26] Meher-Homji, C. B., Chaker, M. and Bromley, A. F. (2009), "The Fouling of Axial Flow Compressors - Causes, Effects, Susceptibility and Sensitivity", 2009 ASME Turbo Expo, Vol. 4, 8 June 2009 through 12 June 2009, Orlando, FL, pp. 571.
[27] Morini, M., Pinelli, M., Spina, P. R. and Venturini, M. (2010), "Influence of Blade Deterioration on Compressor and Turbine Performance", Journal of Engineering for Gas Turbines and Power, vol. 132, no. 3.
[28] Rao, P. N. S. and Naikan, V. N. A.(2008),"An Optimal Maintenance Policy for Compressor of a Gas Turbine Power Plant", Journal of Engineering for Gas Turbines and Power, vol. 130, no. 2.
[29] Bromley, A., Meher-Homji, C.B. (2004), "Gas Turbine Axial Compressor Fouling and Washing", Proceedings of Turbomachinery symposium, Houston, TX,USA,pp. 163-168.
[30] Burke, R. J. and Boursier, A. (2010), "Use of Compressor Water Wash to Optimise Gas Turbine Performance", 11th European Fluid Machinery Congress, 12 September 2010 through 15 September 2010, Edinburgh, pp. 225.
[31] Kurz, R., Brun, K. and Wollie, M. (2008), "Degradation Effects on Industrial Gas Turbines", 2008 ASME Turbo Expo, Vol. 7, 9 June 2008 through 13 June 2008, Berlin, pp. 493.
[32] Gas Machinery Research council (2010), Guideline for gas turbine Inlet Air Filtration Systems , available at: http://www.ccj-online.com/wp-content/uploads/2013/11/SOLAR-LINK-2-
Guideline-for-GT-inlet-filtration-systems.pdf (accessed April).

[33] Mund, F. C. (2006), "Gas Turbine Compressor Washing:Historical Developments,Trends and Main design paramters for Online system", Vol128, no. July, pp. 344-353.
[34] Boyce, M. P. and Gonzalez, F. (2007), "A study of On-line and Off-line Turbine Washing to Optimize the Operation of a Gas turbine", Journ
al of Engineering for Gas Turbines and Power, vol. 129, no. 1, pp. 114-122.
[35] Ali Abdulmajeed, A. (2011), "Gas turbine Failure due to Water Wash and Extraction Line Blockage", ASME 2011 Turbo Expo: Turbine Technical Conference and Exposition, GT2011, Vol. 4, 6 June 2011 through 10 June 2011, Vancouver, BC, pp. 539.
[36] http://www.aviation-database.com/ZOK_International_engine_cleaning (2012), "ZOK International- Engine Cleaning Chemicals", , no. http://www.aviation-
database.com/ZOK_International_engine_cleaning, pp. 1-2.
[37] Gordon, R. (2010), "The Evolution of Gas Turbine Compressor Cleaning", vol. 576, no. 18th March.
[38] Singh, R. (1997), "Managing Turbine Availability,Performance and Life usage via Advance Diagnostics", .
[39] Osamu, A., Sinji, U., Shunichi, H., Shinichi, N., Mitsuo, T. and Kenji, K. (2008), "Characteristics and Applications of Hitachi H-25 Gas Turbine", Vol. 57, pp. 274-276.
[40] Jinichiro, G. and Sunichi, K. (2013), "Hitachi's Gas Turbine Product Range and Development background", vol. 62, pp. 17-18.
[41] Wikipedia (2012), Corrected Flow, available at: http://en.wikipedia.org/wiki/Corrected_flow (accessed June/14).
[42] Shell Petroleum Development Company. (2009), Plant Operating Manual
[43] Tomas, W. &. A.,W. (2014), Port Harcourt Weather Forecast, available at: http://www.weatherhq.com/port-harcourt (accessed April/19).
[44] Timot,V.Klaus,K.and Kaglerod,O (2004), "Measured Data Correction for Improved Fouling and Degradation Analysis of Offshore gas turbine", June 14, pp. 1-8.
[45] Igie, U., Pilidis, P., Fouflias, D., Ramsden, K. and Lambart, P. (2011), "On-line compressor cascade washing for Gas Turbine Performance Investigation", ASME 2011 Turbo Expo: Turbine Technical Conference and
Exposition, GT2011, Vol. 4, 6 June 2011 through 10 June 2011, Vancouver, BC, pp. 221.
46] U.S Energy information Administration(EIA)”Natural Gas Prices”, Available at;http://www.eia.gov/dnav/ng pri sum dcu nus m.htm
[47] Byington,C.S et al.,"Prognostic Enhanchements to Diagnostic Systems for Improved Condition-Based Maintenance"
[48] Shell Petroleum development company of Nigeria (2012) "Siemens SGT400 Engine Core change Out" unpublished material
[49] Siemens Turbo-machinery company (2012) "Siemens SGT 400 users conference " unpublished material
[50] Shell Petroleum Development Company of Nigeria (2010) "Description of Facilities and Operations of Bonny Oil and Gas Terminal Operations HSE Case".

APPENDICES
Whilst Heading 1 to Heading 6 can be used to number headings in the main
body of the thesis, Heading styles 7–9 have been modified specifically for
lettered appendix headings with Heading 7 having the ‘Appendix’ prefix as
shown below.
Appendix A
! TURBOMATCH SCHEME - Windows NT version (October 1999)
! LIMITS:100 Codewords, 800 Brick Data Items, 50 Station Vector
!15 BD Items printable by any call of:-
! OUTPUT, OUTPBD, OUTPSV, PLOTIT, PLOTBD or PLOTSV
! GENERAL ELECTRIC LM2500 PLUS DESIGN POINT
! MODELLED BY ABASS KABIR, SOE, JANUARY 2013
! Turbo-match programme: Design Point simulation of GE LM 2500 plus Industrial Gas Turbine
////
OD SI KE VA XP
-1
-1
INTAKE S1, 2 D1-4 R100
COMPRE S2, 3 D5-11 R101 V5 V6
PREMAS S3, 12,4 D12-15
PREMAS S4,13,5 D16-19
BURNER S5,6 D20-22 R102
MIXEES S6,13,7
TURBIN S7,8 D23-30,101,31 V24
MIXEES S8,12,9
TURBIN S9,10 D32-41 V32 V33

NOZCON S10, 11,1 D41 R107
PERFOR S1,0,0 D32,43-45,107,100,102,0,0,0,0,0,0,0,0,0
CODEND
DATA ITEMS////
! INTAKE
1 0.0 ! INTAKE ALTITUDE
2 0.0 ! ISA DEVIATION
3 0.0 ! MACH NO
4 0.9951 ! PRESSURE RECOVERY
! COMPRESSOR
5 -1.0 ! Z PARAMETER
6 -1.0 ! ROTATIONAL SPEED N
7 22.0 ! PRESSURE RATIO
8 0.8825 ! ISENTROPIC EFFICIENCY
9 0.0 ! ERROR SELECTION
10 3.0 ! MAP NUMBER
11 0.0 ! STATOR ANGLE RELATIVE TO DP
! PREMAS
12 0.049 ! BLEED AIR
13 0.0 ! FLOW LOSS
14 1.0 ! PRESSURE RECOVERY
15 0.0 ! PRESSURE DROP
! PREMAS
16 0.095 ! BLEED AIR
17 0.0 ! FLOW LOSS
18 1.0 ! PRESSURE RECOVERY

19 0.0 ! PRESSURE DROP
! BURNER
20 0.075 ! FRACTIONAL PRESSURE LOSS DP/P
21 0.9995 ! COMBUSTION EFFICIENCY
22 -1.0 ! FUEL FLOW
! HP TURBINE
23 0.0 ! AUXILIARY WORK
24 -1.0 ! NDMF
25 0.6 ! NDSPEED CN
26 0.9 ! ISENTROPIC EFFICIENCY
27 -1.0 ! PCN
28 1.0 ! COMPRESSOR NUMBER
29 5.0 ! TURBINE MAP NUMBER
30 -1.0 ! POWER LOW INDEX
31 0.0 ! NGV ANGLE RELATIVE TO DP
! POWER TURBINE
32313320.00 ! AUXILIARY WORK
33 -1.0 ! NDMF
34 0.6 ! NDSPEED CN
35 0.9 ! ISENTROPIC EFFICIENCY
36 1.0 ! PCN
37 0.0 ! COMPRESSOR NUMBER
38 5.0 ! MAP NUMBER
39 -1.0 ! POWER LAW INDEX
40 -1.0 ! COMWORK
41 0.0 ! NGV ANGLE RELATIVE TO DP

! NOZCON
42 -1.0 ! THROAT AREA
! PERFOR
43 1.0 ! PROPELLER EFFICIENCY
44 0.0 ! SCALING INDEX
45 0.0 ! REQUIRED THRUST
-1
1 2 82.55 ! INLET MASS FLOW
6 6 1580.0 ! COMBUSTION OUTLET TEMPERATURE
-1
-3
! TURBOMATCH SCHEME - Windows NT version (October 1999)
! LIMITS:100 Codewords, 800 Brick Data Items, 50 Station Vector
!15 BD Items printable by any call of:-
! OUTPUT, OUTPBD, OUTPSV, PLOTIT, PLOTBD or PLOTSV
! GENERAL ELECTRIC LM2500 PLUS OFF DESIGN
! MODELLED BY ABASS KABIR, SOE, JANUARY 2013
! Turbo-match programme: Off Design performance simulation for different ambient condition
////
OD SI KE VA XP
-1
-1
INTAKE S1,2 D1-4 R100
COMPRE S2,3 D5-11 R101 V5 V6
PREMAS S3,12,4 D12-15
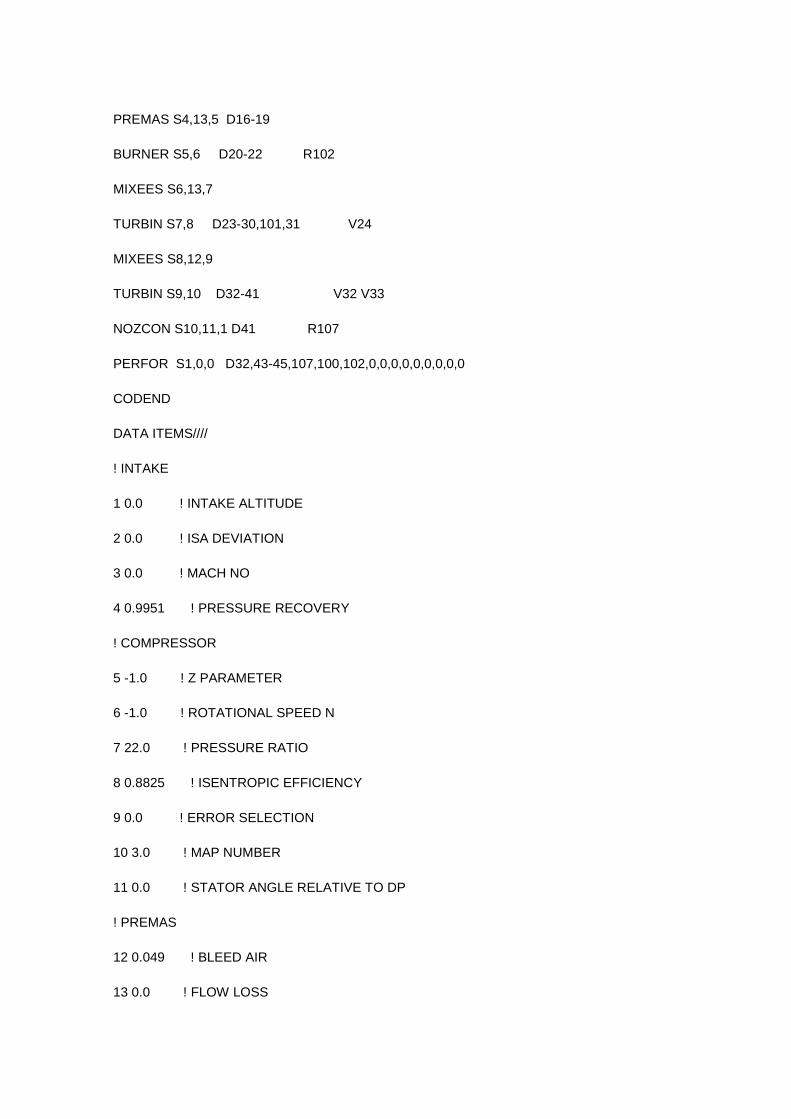
PREMAS S4,13,5 D16-19
BURNER S5,6 D20-22 R102
MIXEES S6,13,7
TURBIN S7,8 D23-30,101,31 V24
MIXEES S8,12,9
TURBIN S9,10 D32-41 V32 V33
NOZCON S10,11,1 D41 R107
PERFOR S1,0,0 D32,43-45,107,100,102,0,0,0,0,0,0,0,0,0
CODEND
DATA ITEMS////
! INTAKE
1 0.0 ! INTAKE ALTITUDE
2 0.0 ! ISA DEVIATION
3 0.0 ! MACH NO
4 0.9951 ! PRESSURE RECOVERY
! COMPRESSOR
5 -1.0 ! Z PARAMETER
6 -1.0 ! ROTATIONAL SPEED N
7 22.0 ! PRESSURE RATIO
8 0.8825 ! ISENTROPIC EFFICIENCY
9 0.0 ! ERROR SELECTION
10 3.0 ! MAP NUMBER
11 0.0 ! STATOR ANGLE RELATIVE TO DP
! PREMAS
12 0.049 ! BLEED AIR
13 0.0 ! FLOW LOSS

14 1.0 ! PRESSURE RECOVERY
15 0.0 ! PRESSURE DROP
! PREMAS
16 0.095 ! BLEED AIR
17 0.0 ! FLOW LOSS
18 1.0 ! PRESSURE RECOVERY
19 0.0 ! PRESSURE DROP
! BURNER
20 0.075 ! FRACTIONAL PRESSURE LOSS DP/P
21 0.9995 ! COMBUSTION EFFICIENCY
22 -1.0 ! FUEL FLOW
! HP TURBINE
23 0.0 ! AUXILIARY WORK
24 -1.0 ! NDMF
25 0.6 ! NDSPEED CN
26 0.9 ! ISENTROPIC EFFICIENCY
27 -1.0 ! PCN
28 1.0 ! COMPRESSOR NUMBER
29 5.0 ! TURBINE MAP NUMBER
30 -1.0 ! POWER LOW INDEX
31 0.0 ! NGV ANGLE RELATIVE TO DP
! POWER TURBINE
32313320.00! AUXILIARY WORK
33 -1.0 ! NDMF
34 0.6 ! NDSPEED CN
35 0.9 ! ISENTROPIC EFFICIENCY

36 1.0 ! PCN
37 0.0 ! COMPRESSOR NUMBER
38 5.0 ! MAP NUMBER
39 -1.0 ! POWER LAW INDEX
40 -1.0 ! COMWORK
41 0.0 ! NGV ANGLE RELATIVE TO DP
! NOZCON
42 -1.0 ! THROAT AREA
! PERFOR
43 1.0 ! PROPELLER EFFICIENCY
44 0.0 ! SCALING INDEX
45 0.0 ! REQUIRED THRUST
-1
1 2 82.55 ! INLET MASS FLOW
6 6 1580.0 ! COMBUSTION OUTLET TEMPERATURE
-1
2 -15.0 ! OD CALCULATION; DT = 0, ISA 15 DEG
-1
-1
2 -10.0 ! OD CALCULATION; DT = 0, ISA 15 DEG
-1
-1
2 -5.0 ! OD CALCULATION; DT = 0; ISA 15 DEG
-1
-1

2 -0.0 ! OD CALCULATION; DT = 0; ISA 15 DEG
-1
-1
2 5.0 ! OD CALCULATION; DT = 0; ISA 15 DEG
-1
-1
2 10.0 ! OD CALCULATION; DT = 0; ISA 15 DEG
-1
-1
2 15.0 ! OD CALCULATION; DT = 0; ISA 15 DEG
-1
-1
2 20.0 ! OD CALCULATION; DT = 0; ISA 15DEG
-1
-1
2 25.0 ! OD CALCULATION; DT = 0; ISA 15 DEG
-1
-1
2 30.0 ! OD CALCULATION; DT = 0; ISA 15 DEG
-1
-1
2 35.0 ! OD CALCULATION; DT = 0; ISA 15 DEG
-1
-1
2 40.0 ! OD CALCULATION; DT = 0; ISA 15 DEG
-1

-1
-3
A.1
! TURBOMATCH SCHEME - Windows NT version (October 1999)
! LIMITS:100 Codewords, 800 Brick Data Items, 50 Station Vector
!15 BD Items printable by any call of:-
! OUTPUT, OUTPBD, OUTPSV, PLOTIT, PLOTBD or PLOTSV
! GENERAL ELECTRIC LM2500 PLUS DESIGN POINT
! MODELLED BY ABASS KABIR, SOE, JANUARY 2013
! Turbo-match programme: Design Point simulation of GE LM 2500 plus Industrial Gas Turbine
////
OD SI KE VA XP
-1
-1
INTAKE S1, 2 D1-4 R100
COMPRE S2, 3 D5-11 R101 V5 V6
PREMAS S3, 12,4 D12-15
PREMAS S4,13,5 D16-19
BURNER S5,6 D20-22 R102
MIXEES S6,13,7
TURBIN S7,8 D23-30,101,31 V24
MIXEES S8,12,9
TURBIN S9,10 D32-41 V32 V33
NOZCON S10, 11,1 D41 R107

PERFOR S1,0,0 D32,43-45,107,100,102,0,0,0,0,0,0,0,0,0
CODEND
DATA ITEMS////
! INTAKE
1 0.0 ! INTAKE ALTITUDE
2 0.0 ! ISA DEVIATION
3 0.0 ! MACH NO
4 0.9951 ! PRESSURE RECOVERY
! COMPRESSOR
5 -1.0 ! Z PARAMETER
6 -1.0 ! ROTATIONAL SPEED N
7 22.0 ! PRESSURE RATIO
8 0.8825 ! ISENTROPIC EFFICIENCY
9 0.0 ! ERROR SELECTION
10 3.0 ! MAP NUMBER
11 0.0 ! STATOR ANGLE RELATIVE TO DP
! PREMAS
12 0.049 ! BLEED AIR
13 0.0 ! FLOW LOSS
14 1.0 ! PRESSURE RECOVERY
15 0.0 ! PRESSURE DROP
! PREMAS
16 0.095 ! BLEED AIR
17 0.0 ! FLOW LOSS
18 1.0 ! PRESSURE RECOVERY
19 0.0 ! PRESSURE DROP

! BURNER
20 0.075 ! FRACTIONAL PRESSURE LOSS DP/P
21 0.9995 ! COMBUSTION EFFICIENCY
22 -1.0 ! FUEL FLOW
! HP TURBINE
23 0.0 ! AUXILIARY WORK
24 -1.0 ! NDMF
25 0.6 ! NDSPEED CN
26 0.9 ! ISENTROPIC EFFICIENCY
27 -1.0 ! PCN
28 1.0 ! COMPRESSOR NUMBER
29 5.0 ! TURBINE MAP NUMBER
30 -1.0 ! POWER LOW INDEX
31 0.0 ! NGV ANGLE RELATIVE TO DP
! POWER TURBINE
32313320.00 ! AUXILIARY WORK
33 -1.0 ! NDMF
34 0.6 ! NDSPEED CN
35 0.9 ! ISENTROPIC EFFICIENCY
36 1.0 ! PCN
37 0.0 ! COMPRESSOR NUMBER
38 5.0 ! MAP NUMBER
39 -1.0 ! POWER LAW INDEX
40 -1.0 ! COMWORK
41 0.0 ! NGV ANGLE RELATIVE TO DP
! NOZCON

42 -1.0 ! THROAT AREA
! PERFOR
43 1.0 ! PROPELLER EFFICIENCY
44 0.0 ! SCALING INDEX
45 0.0 ! REQUIRED THRUST
-1
1 2 82.55 ! INLET MASS FLOW
6 6 1580.0 ! COMBUSTION OUTLET TEMPERATURE
-1
-3
A.2
! TURBOMATCH SCHEME - Windows NT version (October 1999)
! LIMITS:100 Codewords, 800 Brick Data Items, 50 Station Vector
!15 BD Items printable by any call of:-
! OUTPUT, OUTPBD, OUTPSV, PLOTIT, PLOTBD or PLOTSV
! GENERAL ELECTRIC LM2500 PLUS OFF DESIGN
! MODELLED BY ABASS KABIR, SOE, JANUARY 2013
! Turbo-match programme: Off Design performance simulation for different ambient condition
////
OD SI KE VA XP
-1
-1
INTAKE S1,2 D1-4 R100
COMPRE S2,3 D5-11 R101 V5 V6

PREMAS S3,12,4 D12-15
PREMAS S4,13,5 D16-19
BURNER S5,6 D20-22 R102
MIXEES S6,13,7
TURBIN S7,8 D23-30,101,31 V24
MIXEES S8,12,9
TURBIN S9,10 D32-41 V32 V33
NOZCON S10,11,1 D41 R107
PERFOR S1,0,0 D32,43-45,107,100,102,0,0,0,0,0,0,0,0,0
CODEND
DATA ITEMS////
! INTAKE
1 0.0 ! INTAKE ALTITUDE
2 0.0 ! ISA DEVIATION
3 0.0 ! MACH NO
4 0.9951 ! PRESSURE RECOVERY
! COMPRESSOR
5 -1.0 ! Z PARAMETER
6 -1.0 ! ROTATIONAL SPEED N
7 22.0 ! PRESSURE RATIO
8 0.8825 ! ISENTROPIC EFFICIENCY
9 0.0 ! ERROR SELECTION
10 3.0 ! MAP NUMBER
11 0.0 ! STATOR ANGLE RELATIVE TO DP
! PREMAS
12 0.049 ! BLEED AIR

13 0.0 ! FLOW LOSS
14 1.0 ! PRESSURE RECOVERY
15 0.0 ! PRESSURE DROP
! PREMAS
16 0.095 ! BLEED AIR
17 0.0 ! FLOW LOSS
18 1.0 ! PRESSURE RECOVERY
19 0.0 ! PRESSURE DROP
! BURNER
20 0.075 ! FRACTIONAL PRESSURE LOSS DP/P
21 0.9995 ! COMBUSTION EFFICIENCY
22 -1.0 ! FUEL FLOW
! HP TURBINE
23 0.0 ! AUXILIARY WORK
24 -1.0 ! NDMF
25 0.6 ! NDSPEED CN
26 0.9 ! ISENTROPIC EFFICIENCY
27 -1.0 ! PCN
28 1.0 ! COMPRESSOR NUMBER
29 5.0 ! TURBINE MAP NUMBER
30 -1.0 ! POWER LOW INDEX
31 0.0 ! NGV ANGLE RELATIVE TO DP
! POWER TURBINE
32313320.00! AUXILIARY WORK
33 -1.0 ! NDMF
34 0.6 ! NDSPEED CN

35 0.9 ! ISENTROPIC EFFICIENCY
36 1.0 ! PCN
37 0.0 ! COMPRESSOR NUMBER
38 5.0 ! MAP NUMBER
39 -1.0 ! POWER LAW INDEX
40 -1.0 ! COMWORK
41 0.0 ! NGV ANGLE RELATIVE TO DP
! NOZCON
42 -1.0 ! THROAT AREA
! PERFOR
43 1.0 ! PROPELLER EFFICIENCY
44 0.0 ! SCALING INDEX
45 0.0 ! REQUIRED THRUST
-1
1 2 82.55 ! INLET MASS FLOW
6 6 1580.0 ! COMBUSTION OUTLET TEMPERATURE
-1
2 -15.0 ! OD CALCULATION; DT = 0, ISA 15 DEG
-1
-1
2 -10.0 ! OD CALCULATION; DT = 0, ISA 15 DEG
-1
-1
2 -5.0 ! OD CALCULATION; DT = 0; ISA 15 DEG
-1
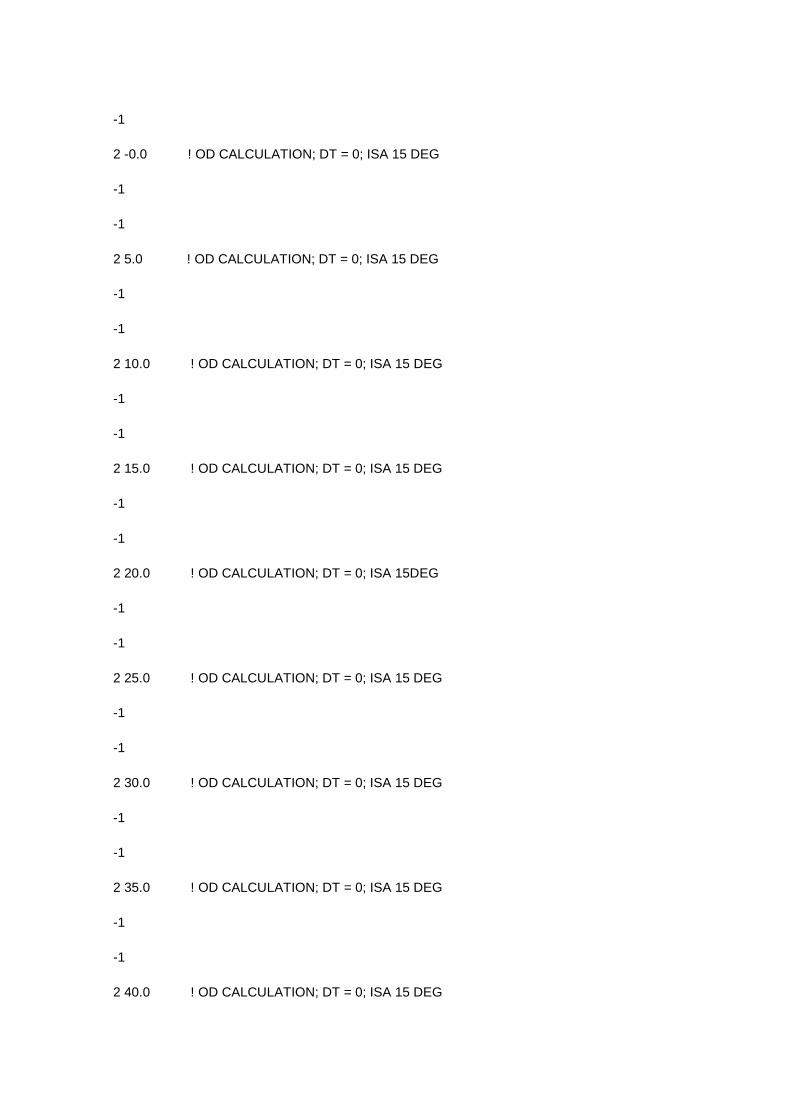
-1
2 -0.0 ! OD CALCULATION; DT = 0; ISA 15 DEG
-1
-1
2 5.0 ! OD CALCULATION; DT = 0; ISA 15 DEG
-1
-1
2 10.0 ! OD CALCULATION; DT = 0; ISA 15 DEG
-1
-1
2 15.0 ! OD CALCULATION; DT = 0; ISA 15 DEG
-1
-1
2 20.0 ! OD CALCULATION; DT = 0; ISA 15DEG
-1
-1
2 25.0 ! OD CALCULATION; DT = 0; ISA 15 DEG
-1
-1
2 30.0 ! OD CALCULATION; DT = 0; ISA 15 DEG
-1
-1
2 35.0 ! OD CALCULATION; DT = 0; ISA 15 DEG
-1
-1
2 40.0 ! OD CALCULATION; DT = 0; ISA 15 DEG

-1
-1
-3
A.3
OUTPBD, OUTPSV, PLOTIT, PLOTBD or PLOTSV
! GENERAL ELECTRIC LM2500 PLUS DESIGN POINT
! MODELLED BY ABASS KABIR, SOE, JANUARY 2013
! Turbo match programme: Off Design TET Handle simulation of GE LM 2500plus Industrial Gas
turbine
////
OD SI KE VA XP
-1
-1
INTAKE S1,2 D1-4 R100
COMPRE S2,3 D5-11 R101 V5 V6
PREMAS S3,12,4 D12-15
PREMAS S4,13,5 D16-19
BURNER S5,6 D20-22 R102
MIXEES S6,13,7
TURBIN S7,8 D23-30,101,31 V24
MIXEES S8,12,9
TURBIN S9,10 D32-41 V32 V33
NOZCON S10,11,1 D41 R107
PERFOR S1,0,0 D32,43-45,107,100,102,0,0,0,0,0,0,0,0,0

CODEND
DATA ITEMS////
! INTAKE
1 0.0 ! INTAKE ALTITUDE
2 0.0 ! ISA DEVIATION
3 0.0 ! MACH NO
4 0.9951 ! PRESSURE RECOVERY
! COMPRESSOR
5 -1.0 ! Z PARAMETER
6 -1.0 ! ROTATIONAL SPEED N
7 22.0 ! PRESSURE RATIO
8 0.8825 ! ISENTROPIC EFFICIENCY
9 0.0 ! ERROR SELECTION
10 3.0 ! MAP NUMBER
11 0.0 ! STATOR ANGLE RELATIVE TO DP
! PREMAS
12 0.049 ! BLEED AIR
13 0.0 ! FLOW LOSS
14 1.0 ! PRESSURE RECOVERY
15 0.0 ! PRESSURE DROP
! PREMAS
16 0.095 ! BLEED AIR
17 0.0 ! FLOW LOSS
18 1.0 ! PRESSURE RECOVERY
19 0.0 ! PRESSURE DROP
! BURNER

20 0.075 ! FRACTIONAL PRESSURE LOSS DP/P
21 0.9995 ! COMBUSTION EFFICIENCY
22 -1.0 ! FUEL FLOW
! HP TURBINE
23 0.0 ! AUXILIARY WORK
24 -1.0 ! NDMF
25 0.6 ! NDSPEED CN
26 0.9 ! ISENTROPIC EFFICIENCY
27 -1.0 ! PCN
28 1.0 ! COMPRESSOR NUMBER
29 5.0 ! TURBINE MAP NUMBER
30 -1.0 ! POWER LOW INDEX
31 0.0 ! NGV ANGLE RELATIVE TO DP
! POWER TURBINE
32313320.0 ! AUXILIARY WORK
33 -1.0 ! NDMF
34 0.6 ! NDSPEED CN
35 0.9 ! ISENTROPIC EFFICIENCY
36 1.0 ! PCN
37 0.0 ! COMPRESSOR NUMBER
38 5.0 ! MAP NUMBER
39 -1.0 ! POWER LAW INDEX
40 -1.0 ! COMWORK
41 0.0 ! NGV ANGLE RELATIVE TO DP
! NOZCON
42 -1.0 ! THROAT AREA

! PERFOR
43 1.0 ! PROPELLER EFFICIENCY
44 0.0 ! SCALING INDEX
45 0.0 ! REQUIRED THRUST
-1
12 82.55 ! INLET MASS FLOW
6 6 1580.0 ! COMBUSTION OUTLET TEMPERATURE
-1
-1
6 6 1650 ! DT = 0 ; TET = 1650
-1
-1
6 6 1600 ! DT = 0 ; TET = 1600
-1
-1
6 6 1550 ! DT = 0 ; TET = 1550
-1
-1
6 6 1500 ! DT = 0 ; TET = 1500
-1
-1
6 6 1450 ! DT = 0 ; TET = 1450
-1
-1
6 6 1400 ! DT = 0 ; TET = 1400
-1

-1
6 6 1350 ! DT = 0 ; TET = 1350
-1
-1
6 6 1300 ! DT = 0 ; TET = 1300
-1
-1
6 6 1250 ! DT = 0 ; TET = 1250
-1
-1
6 6 1200 ! DT = 0 ; TET = 1200
-1
-1
6 6 1150 ! DT = 0 ; TET = 1150
-1
-1
6 6 1100 ! DT = 0 ; TET = 1100
-1
-1
6 6 1050 ! DT = 0 ; TET = 1050
-1
-1
6 6 1000 ! DT = 0 ; TET = 1000
-1
-3

A.4
! TURBOMATCH SCHEME - Windows NT version (October 1999)
! LIMITS: 100 Codewords, 800 Brick Data Items, 50 Station Vector
!15 BD Items printable by any call of:-
! OUTPUT, OUTPBD, OUTPSV, PLOTIT, PLOTBD or PLOTSV
! GENERAL ELECTRIC LM2500 PLUS OFF DESIGN CALCULATION
! MODELLED BY ABASS KABIR, SOE, JANUARY 2013
! Turbo-match Programme: Ambient Temperature Influence simulation of GE LM 2500plus Gas
Turbine
////
OD SI KE VA XP
-1
-1
INTAKE S1,2 D1-4 R100
COMPRE S2,3 D5-11 R101 V5 V6
PREMAS S3,12,4 D12-15
PREMAS S4,13,5 D16-19
BURNER S5,6 D20-22 R102
MIXEES S6,13,7
TURBIN S7,8 D23-30,101,31 V24
MIXEES S8,12,9
TURBIN S9,10 D32-41 V32 V33
NOZCON S10,11,1 D41 R107
PERFOR S1,0,0 D32,43-45,107,100,102,0,0,0,0,0,0,0,0,0
CODEND
DATA ITEMS////

! INTAKE
1 0.0 ! INTAKE ALTITUDE
2 0.0 ! ISA DEVIATION
3 0.0 ! MACH NO
4 0.9951 ! PRESSURE RECOVERY
! COMPRESSOR
5 -1.0 ! Z PARAMETER
6 -1.0 ! ROTATIONAL SPEED N
7 22.0 ! PRESSURE RATIO
8 0.8825 ! ISENTROPIC EFFICIENCY
9 0.0 ! ERROR SELECTION
10 3.0 ! MAP NUMBER
11 0.0 ! STATOR ANGLE RELATIVE TO DP
! PREMAS
12 0.049 ! BLEED AIR
13 0.0 ! FLOW LOSS
14 1.0 ! PRESSURE RECOVERY
15 0.0 ! PRESSURE DROP
! PREMAS
16 0.095 ! BLEED AIR
17 0.0 ! FLOW LOSS
18 1.0 ! PRESSURE RECOVERY
19 0.0 ! PRESSURE DROP
! BURNER
20 0.075 ! FRACTIONAL PRESSURE LOSS DP/P
21 0.9995 ! COMBUSTION EFFICIENCY

22 -1.0 ! FUEL FLOW
! HP TURBINE
23 0.0 ! AUXILIARY WORK
24 -1.0 ! NDMF
25 0.6 ! NDSPEED CN
26 0.9 ! ISENTROPIC EFFICIENCY
27 -1.0 ! PCN
28 1.0 ! COMPRESSOR NUMBER
29 5.0 ! TURBINE MAP NUMBER
30 -1.0 ! POWER LOW INDEX
31 0.0 ! NGV ANGLE RELATIVE TO DP
! POWER TURBINE
32313320.0 ! AUXILIARY WORK
33 -1.0 ! NDMF
34 0.6 ! NDSPEED CN
35 0.9 ! ISENTROPIC EFFICIENCY
36 1.0 ! PCN
37 0.0 ! COMPRESSOR NUMBER
38 5.0 ! MAP NUMBER
39 -1.0 ! POWER LAW INDEX
40 -1.0 ! COMWORK
41 0.0 ! NGV ANGLE RELATIVE TO DP
! NOZCON
42 -1.0 ! THROAT AREA
! PERFOR
43 1.0 ! PROPELLER EFFICIENCY

44 0.0 ! SCALING INDEX
45 0.0 ! REQUIRED THRUST
-1
1 2 82.55 ! INLET MASS FLOW
6 6 1580.0 ! COMBUSTION OUTLET TEMPERATURE
-1
-1
2 0.0 ! OD Calculation; DT = 0, ISA = 15 DEG C
-1
5 6 1650.0 ! DT = 0 ; TET = 1650
-1
-1
5 6 1600.0 ! DT = 0 ; TET = 1600
-1
-1
5 6 1550.0 ! DT = 0; TET = 1550
-1
-1
5 6 1500.0 ! DT = 0 ; TET = 1500
-1
-1
5 6 1450.0 ! DT = 0 ; TET = 1450
-1
-1
5 6 1400.0 ! DT = 0 ; TET = 1400
-1

-1
5 6 1350.0 ! DT = 0 ; TET = 1350
-1
-1
5 6 1300.0 ! DT = 0 ; TET = 1300
-1
-1
5 6 1250.0 ! DT = 0 ; TET = 1250
-1
-1
5 6 1200.0 ! DT = 0 ; TET = 1200
-1
-1
5 6 1150.0 ! DT = 0 ; TET = 1150
-1
-1
5 6 1100.0 ! DT = 0 ; TET = 1100
-1
-1
5 6 1050.0 ! DT = 0 ; TET = 1050
-1
-1
5 6 1000.0 ! DT = 0 ; TET = 1000
-1
2 -5.0 ! OD Calculation; DT = -5, ISA = 15 DEG C
-1
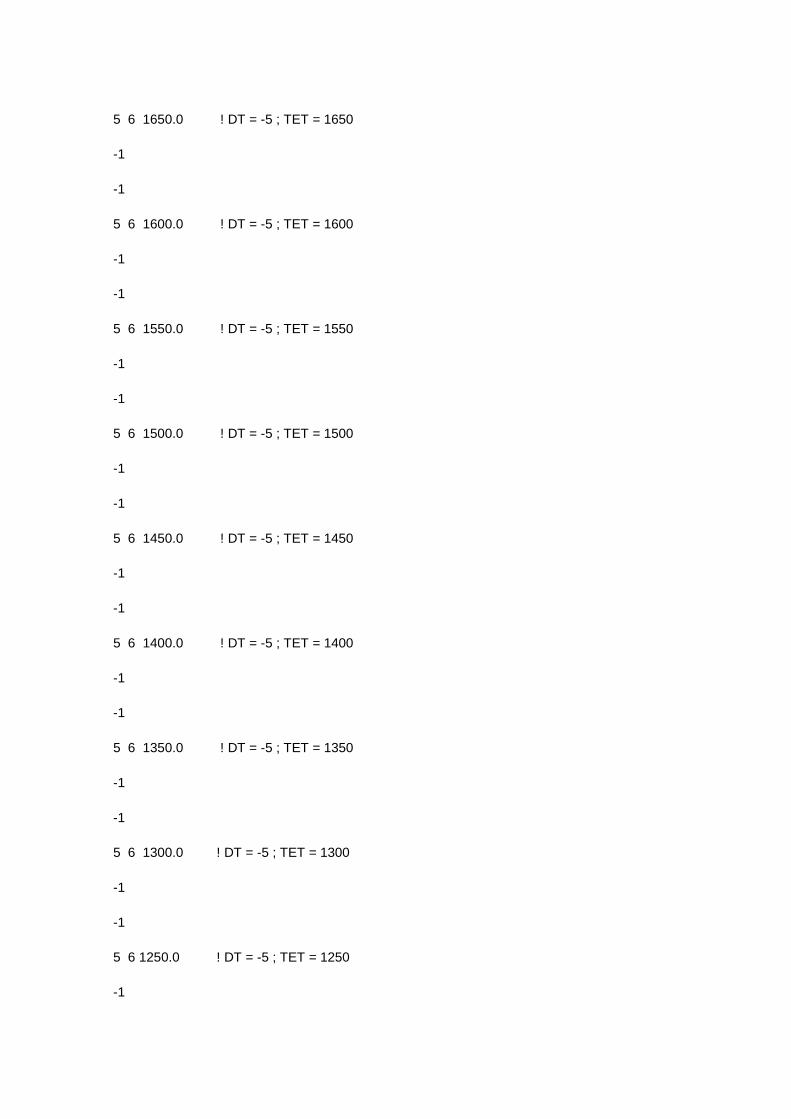
5 6 1650.0 ! DT = -5 ; TET = 1650
-1
-1
5 6 1600.0 ! DT = -5 ; TET = 1600
-1
-1
5 6 1550.0 ! DT = -5 ; TET = 1550
-1
-1
5 6 1500.0 ! DT = -5 ; TET = 1500
-1
-1
5 6 1450.0 ! DT = -5 ; TET = 1450
-1
-1
5 6 1400.0 ! DT = -5 ; TET = 1400
-1
-1
5 6 1350.0 ! DT = -5 ; TET = 1350
-1
-1
5 6 1300.0 ! DT = -5 ; TET = 1300
-1
-1
5 6 1250.0 ! DT = -5 ; TET = 1250
-1

-1
5 6 1200.0 ! DT = -5 ; TET = 1200
-1
-1
5 6 1150.0 ! DT = -5 ; TET = 1150
-1
-1
5 6 1100.0 ! DT = -5 ; TET = 1100
-1
-1
5 6 1050.0 ! DT = -5 ; TET = 1050
-1
-1
5 6 1000.0 ! DT = -5 ; TET = 1000
-1
2 -10.0 ! OD Calculation; DT = -10, ISA = 15 DEG C
-1
5 6 1650.0 ! DT = -10 ; TET = 1650
-1
-1
5 6 1600.0 ! DT = -10 ; TET = 1600
-1
-1
5 6 1550.0 ! DT = -10 ; TET = 1550
-1
-1

5 6 1500.0 ! DT = -10 ; TET = 1500
-1
-1
5 6 1450.0 ! DT = -10 ; TET = 1450
-1
-1
5 6 1400.0 ! DT = -10 ; TET = 1400
-1
-1
5 6 1350.0 ! DT = -10 ; TET = 1350
-1
-1
5 6 1300.0 ! DT = -10 ; TET = 1300
-1
-1
5 6 1250.0 ! DT = -10 ; TET = 1250
-1
-1
5 6 1200.0 ! DT = -10 ; TET = 1200
-1
-1
5 6 1150.0 ! DT = -10 ; TET = 1150
-1
-1
5 6 1100.0 ! DT = -10 ; TET = 1100
-1

-1
5 6 1050.0 ! DT = -10 ; TET = 1050
-1
-1
5 6 1000.0 ! DT = -10 ; TET = 1000
-1
2 5.0 ! OD Calculation; DT = 5, ISA = 15 DEG C
-1
5 6 1650.0 ! DT = 5 ; TET = 1650
-1
-1
5 6 1600.0 ! DT = 5 ; TET = 1600
-1
-1
5 6 1550.0 ! DT = 5 ; TET = 1550
-1
-1
5 6 1500.0 ! DT = 5 ; TET = 1500
-1
-1
5 6 1450.0 ! DT = 5 ; TET = 1450
-1
-1
5 6 1400.0 ! DT = 5 ; TET = 1400
-1
-1

5 6 1350.0 ! DT = 5 ; TET = 1350
-1
-1
5 6 1300.0 ! DT = 5 ; TET = 1300
-1
-1
5 6 1250.0 ! DT = 5 ; TET = 1250
-1
-1
5 6 1200.0 ! DT = 5 ; TET = 1200
-1
-1
5 6 1150.0 ! DT = 5 ; TET = 1150
-1
-1
5 6 1100.0 ! DT = 5 ; TET = 1100
-1
-1
5 6 1050.0 ! DT = 5 ; TET = 1050
-1
-1
5 6 1000.0 ! DT = 5 ; TET = 1000
-1
-3

A.5
************** TURBOMATCH WORKSHOPS **********
***************** EXERCISE 4 ***********
REF_TITLE: Performance simulation modelling of HITACHI H25 ENGINE using the TURBOMATCH scheme ______________________________________________________________________ !Turbomatch Code: Simulation of HITACHI H25 INDUSTRIAL ENGINE Ambient temperature influence = TAMB = BD(2) //// OD SI KE VA FP -1 -1 INTAKE S1,2 D1-4 R100 COMPRE S2,3 D5-11 R102 V5 V6 PREMAS S3,4,15 D12-15 BURNER S4,5 D16-18 R104 MIXEES S5,15,6 TURBIN S6,7 D19-26,102,27 V20 NOZCON S7,8,1 D28 R110 PERFOR S1,0,0 D19,30-32,110,100,104,0,0,0,0,0,0,0,0,0 CODEND DATA ITEMS //// 1 0.0 ! INTAKE DATA : ALTITUDE 2 0.0 ! DEV FROM STANDART TEMP 3 0.0 ! MA-NUMBER 4 -1.0 ! PRESSURE RECOVERY 5 0.85 ! COMP : Z 6 1.0 ! RELATIVE ROTATIONAL SPEED 7 14.7 ! PRESSURE RATIO 8 0.80 ! ISENTROPIC EFFICIENCY 9 0.0 ! ERROR SWITCH 10 3.0 ! MAP-NUMBER 11 0.0 ! STATOR ANGLE RELATIVE TO DP 12 0.85 ! Premas: Cooling bypass: LAMBDA W 13 0.0 ! DELTA W 14 1.0 ! LAMBDA P 15 0.0 ! DELTP 16 0.05 ! BURNER: PRESSURE LOSS 17 0.9995 ! COMB. EFF. 18 -1.0 ! FUEL FLOW 19 27500000.0 ! TURBINE DATA: AUXWORK 20 0.8 ! DESIGN NON DIM FLOW / MAX 21 0.6 ! DESIGN NON DIM SPEED 22 0.89 ! ISENTROPIC EFF 23 -1.0 ! ROT SPEED OF PT 24 1.0 ! NUMBER OF COMPRESSOR DRIVEN 25 3.0 ! MAP NUMBER 26 1000.0 ! POWER LAW INDEX; POWER OUTPUT = CONSTANT*PCN**3.0 27 0.0 ! NGV ANGLE RELATIVE TO DP

28 -1.0 ! FIXED CONVERGENT NOZZLE 29 -1.0 ! POWER OUTPUT 30 -1.0 ! PROPELLER EFF 31 0.0 ! SCALING SWITCH 32 0.0 ! REQUIRED THRUST at Design point -1 1 2 88.0 ! item 2 at station 1 = Mass flow(kg/s) 5 6 1548.0 ! Item 6 at station 5 = TET(K) -1 -1 5 6 1000.0 ! --New OD Calculation; DT=TAMB(STANDARD)-TAMB(ACTUAL)=0; TET = 1000.0K -1 -1 5 6 1100.0 ! OD Calculation; DT=0; TET = 1100.0K -1 -1 5 6 1200.0 ! OD Calculation; DT=0; TET = 1200.0K -1 -1 5 6 1300.0 ! OD Calculation; DT=0; TET = 1300.0K -1 -1 5 6 1400.0 ! OD Calculation; DT=0; TET = 1400.0K -1 -1 5 6 1500.0 ! OD Calculation; DT=0; TET = 1500.0K -1 2 -5.0 ! --New OD Calculation; DT=-5.0; TET = 1500.0K -1 5 6 1500.0 ! OD Calculation; DT=-5; TET = 1500.0K -1 -1 5 6 1400.0 ! OD Calculation; DT=-5; TET = 1400.0K -1 -1 5 6 1300.0 ! OD Calculation; DT=-5; TET = 1300.0K -1 -1 5 6 1200.0 ! OD Calculation; DT=-5; TET = 1200.0K -1 -1 5 6 1100.0 ! OD Calculation; DT=-5; TET = 1100.0K -1 -1 5 6 1000.0 ! OD Calculation; DT=-5; TET = 1000.0K -1 2 -10.0 ! --New OD Calculation; DT=-10; TET = 1000.0K -1 5 6 1000.0 ! OD Calculation; DT=-10; TET = 1000.0K -1 -1 5 6 1100.0 ! OD Calculation; DT=-10; TET = 1100.0K -1 -1

5 6 1200.0 ! OD Calculation; DT=-10; TET = 1200.0K -1 -1 5 6 1300.0 ! OD Calculation; DT=-10; TET = 1300.0K -1 -1 5 6 1400.0 ! OD Calculation; DT=-10;TET = 1400.0K -1 -1 5 6 1500.0 ! OD Calculation; DT=-10; TET = 1500.0K -1 2 5.0 ! --New OD Calculation; DT=5; TET = 1500.0K -1 5 6 1500.0 ! OD Calculation; DT=5; TET = 1500.0K -1 -1 5 6 1400.0 ! OD Calculation; DT=5; TET = 1400.0K -1 -1 5 6 1300.0 ! OD Calculation; DT=5; TET = 1300.0K -1 -1 5 6 1200.0 ! OD Calculation; DT=5; TET = 1200.0K -1 -1 5 6 1100.0 ! OD Calculation; DT=5; TET = 1100.0K -1 -1 5 6 1000.0 ! OD Calculation; DT=5; TET = 1000.0K -1 2 10.0 ! --New OD Calculation; DT=10; TET = 1000.0K -1 5 6 1000.0 ! OD Calculation; DT=10; TET = 1000.0K -1 -1 5 6 1050.0 ! OD Calculation; DT=10; TET = 1050.0K -1 -1 5 6 1100.0 ! OD Calculation; DT=10; TET = 1100.0K -1 -1 5 6 1150.0 ! OD Calculation; DT=10; TET = 1150.0K -1 -1 5 6 1200.0 ! OD Calculation; DT=10; TET = 1200.0K -1 -1 5 6 1300.0 ! OD Calculation; DT=10; TET = 1300.0K -1 -1 5 6 1400.0 ! OD Calculation; DT=10; TET = 1400.0K -1 -1 5 6 1500.0 ! OD Calculation; DT=10; TET = 1500.0K -1 -3

A.6 ************** TURBOMATCH WORKSHOPS ********** ***************** EXERCISE 4 *********** REF_TITLE: Performance simulation modelling of HITACHI H25 ENGINE using the TURBOMATCH scheme ______________________________________________________________________ !Turbomatch Code: Simulation of HITACHI H25 ENGINE INDUSTRIAL ENGINE Ambient temperature influence = TAMB = BD(2) //// OD SI KE VA XP -1 -1 INTAKE S1,2 D1-4 R100 COMPRE S2,3 D5-11 R102 V5 PREMAS S3,4,15 D12-15 BURNER S4,5 D16-18 R104 W5,6 MIXEES S5,15,6 TURBIN S6,7 D19-26,102,27 V20 NOZCON S7,8,1 D28 R110 PERFOR S1,0,0 D19,30-32,110,100,104,0,0,0,0,0,0,0,0,0 CODEND DATA ITEMS //// 1 0.0 ! INTAKE DATA : ALTITUDE 2 0.0 ! DEV FROM STANDART TEMP 3 0.0 ! MA-NUMBER 4 -1.0 ! PRESSURE RECOVERY 5 0.85 ! COMP : Z 6 1.0 ! RELATIVE ROTATIONAL SPEED 7 14.7 ! PRESSURE RATIO 8 0.80 ! ISENTROPIC EFFICIENCY 9 0.0 ! ERROR SWITCH 10 3.0 ! MAP-NUMBER 11 0.0 ! STATOR ANGLE RELATIVE TO DP 12 0.85 ! Premas: Cooling bypass: LAMBDA W 13 0.0 ! DELTA W 14 1.0 ! LAMBDA P 15 0.0 ! DELTP 16 0.05 ! BURNER: PRESSURE LOSS 17 0.9995 ! COMB. EFF. 18 -1.0 ! FUEL FLOW 19 27500000.0 ! TURBINE DATA: AUXWORK 20 0.8 ! DESIGN NON DIM FLOW / MAX 21 0.6 ! DESIGN NON DIM SPEED 22 0.89 ! ISENTROPIC EFF 23 -1.0 ! ROT SPEED OF PT 24 1.0 ! NUMBER OF COMPRESSOR DRIVEN 25 3.0 ! MAP NUMBER

26 1000.0 ! POWER LAW INDEX; POWER OUTPUT = CONSTANT*PCN**3.0 27 0.0 ! NGV ANGLE RELATIVE TO DP 28 -1.0 ! FIXED CONVERGENT NOZZLE 29 -1.0 ! POWER OUTPUT 30 -1.0 ! PROPELLER EFF 31 0.0 ! SCALING SWITCH 32 0.0 ! REQUIRED THRUST at Design point -1 1 2 88.0 ! item 2 at station 1 = Mass flow(kg/s) 5 6 1548.0 ! Item 6 at station 5 = TET(K) -1 6 0.9 ! PCN=90% -1 -1 6 0.8 ! PCN=80% -1 -1 6 0.7 ! PCN=70% -1 -1 6 0.6 ! PCN=60% -1 -1 6 0.5 ! PCN=50% -1 -1 6 0.4 ! PCN=40% -1 -3
A.7 !TURBOMATCH SCHEME DESIGN FILE !ENGINE TYPE: HITACHI H25 //// OD SI KE VA XP -1 -1 INTAKE S1-2 D1-4 R100 ARITHY D310-317 ARITHY D320-327 COMPRE S2-3 D5-11 R101 V5 V6 PREMAS S3,11,4 D12-15 BURNER S4-5 D16-18 R102 MIXEES S5,11,6 TURBIN S6-7 D19-26,101,27 V19 V20 NOZCON S7-8,1 D28 R103 PERFOR S1,0,0 D19,29-31,103,100,102,0,0,0,0,0,0

CODEND BRICK DATA//// ! INTAKE 1 0.0 ! INTAKE ALTITUDE 2 0.0 ! DEVIATION FROM ISA CONDITIONS: Tamb=288.15K, Pamb=1.01325bar 3 0.0 ! MACH NUMBER 4 0.99 ! TOTAL PRESSURE RECOVERY ! COMPRESSOR 5 0.85 ! SURGE MARGIN [Z=[PR-PR(choke)]/[PR-PR(surge)] 6 1.0 ! DESIGN SPEED PCN [PCN=RPM/RPM(DP)] 7 14.7 ! DESIGN PRESSURE RATIO 8 0.80 ! DESIGN ISENTROPIC EFFICIENCY 9 0.0 ! ERROR SWITCH 10 3.0 ! COMPRESSOR MAP NUMBER 11 0.0 ! STATOR ANGLE RELATIVE TO DESIGN POINT ! PREMAS 12 0.150 ! COOLING BYPASS: LAMBDA W 13 0.0 ! DELTA W 14 1.0 ! LAMBDA P 15 0.0 ! DELTA P ! BURNER 16 0.05 ! TOTAL PRESSURE LOSS IN THE BURNER 17 0.9995 ! COMBUSTION EFFICIENCY 18 -1.0 ! FUEL FLOW [-1 = TET SPECIFIED. SEE SV DATA] ! TURBIN 19 27500000.0 ! DESIGN GENERATOR TURBINE FROM TURBINE DATA 20 0.8 ! DESIGN NON DIM MASS FLOW 21 0.6 ! DESIGN NON DIM SPEED 22 0.89 ! ISENTROPIC EFFICIENCY 23 -1.0 ! RELATIVE ROTATIONAL SPEED 24 1.0 ! NUMBER OF COMPRESSOR DRIVEN 25 3.0 ! TURBINE MAP NUMBER 26 1000.0 ! POWER INDEX 27 0.0 ! NGV ANGLE RELATIVE TO DESIGN POINT ! NOZCON 28 -1.0 ! FIXED AREA ! PERFOR 29 1.0 ! SHAFT EFFICIENCY 30 0.0 ! SCALING INDEX 31 0.0 ! REQUIRED DESIGN POWER 310 3.0 ! COMPRESSOR #1,BD(820)=BD(820)*BD(317) 311 -1.0 312 820.0 ! ETASF FOR COMPRESSOR#1 313 -1.0 314 820.0 315 -1.0 316 317.0 317 1.0 ! COMPRESSOR#1 DETERIORATION OF 0% IN EFFICIENCY 320 3.0 ! COMPRESSOR#1,BD(830)=BD(830)*BD(327)

321 -1.0 322 830.0 ! WASF FOR COMPRESSOR#1 323 -1.0 324 830.0 325 -1.0 326 327.0 327 1.0 ! COMPRESSOR#1 DETERIORATION OF 0% IN NON-DIMENSIONAL MASS FLOW -1 1 2 88.0 ! MASS FLOW (kg/s) 5 6 1548 ! TET (K) -1 317 0.950 !5.0% DETERIORATION OF COMPRESSOR EFFICIENCY:COMPRESSOR 2 327 0.98 !2% DETERIORATION OF COMPRESSOR MASS FLOW:COMPRESSOR 2 -1 -1
Recommended