April Runoff Forecasts April Runoff Forecasts for the Columbia Basin for the Columbia Basin
andandPower Supply Power Supply Implications Implications
Jim Ruff and John FazioCouncil MeetingApril 14, 2010
Boise, ID
2

3

4
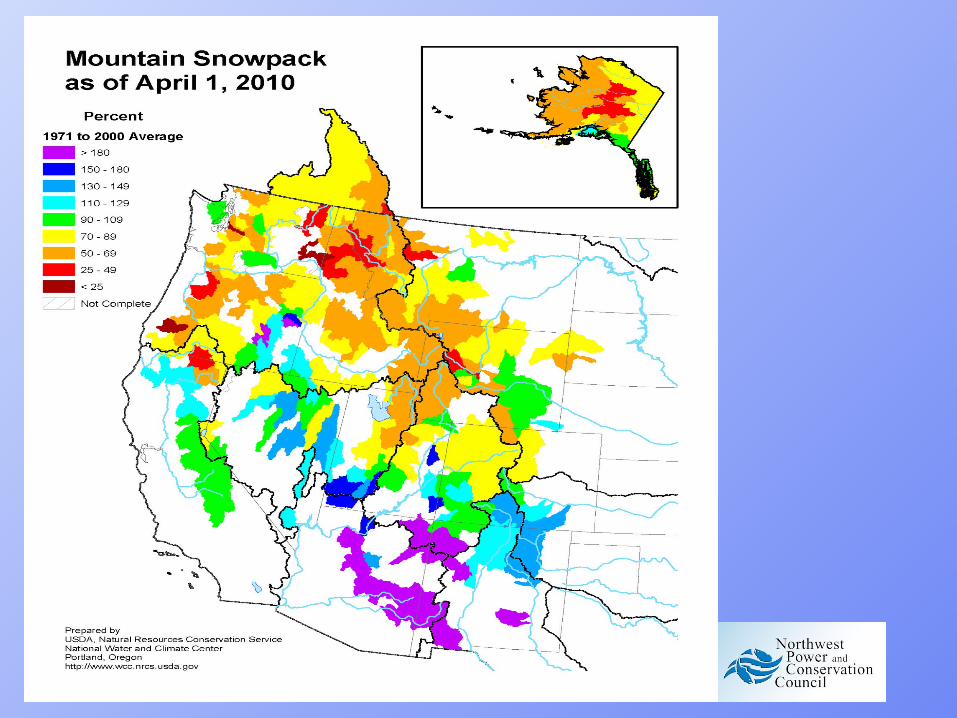
April 1 Snowpack for April 1 Snowpack for Columbia Basin above The Columbia Basin above The
Dalles, ORDalles, OR
5

6
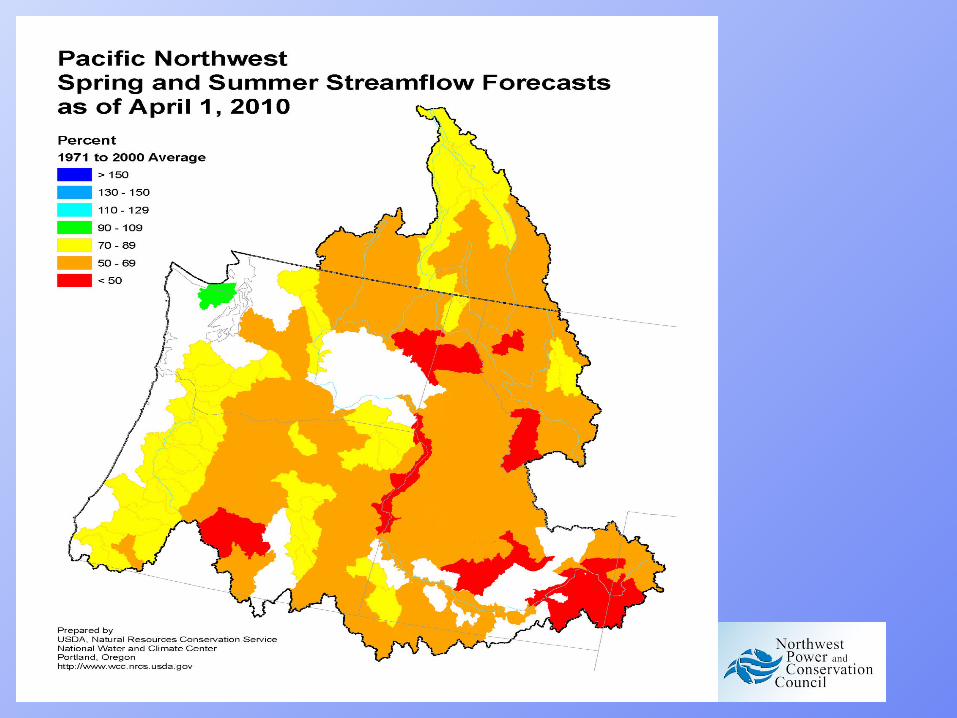
2010 January-July Runoff 2010 January-July Runoff ForecastForecast
69.7 Million Acre Feet69.7 Million Acre Feet (April Forecast for The Dalles Dam)(April Forecast for The Dalles Dam)
Hydroelectric Fuel Gauge
69.7 Maf is 65% of Average
95% Confidence Range is from 56 to 83 Maf

7
Recent Runoff VolumesRecent Runoff Volumes(January-July Volume at The Dalles)(January-July Volume at The Dalles)
70
8875
104
139
159
104
124
98
58.2
103.8
87.7
114.7
69.783
81.3 90.295.799.2
0
20
40
60
80
100
120
140
160
180
Ru
no
ff (
Ma
f)
8
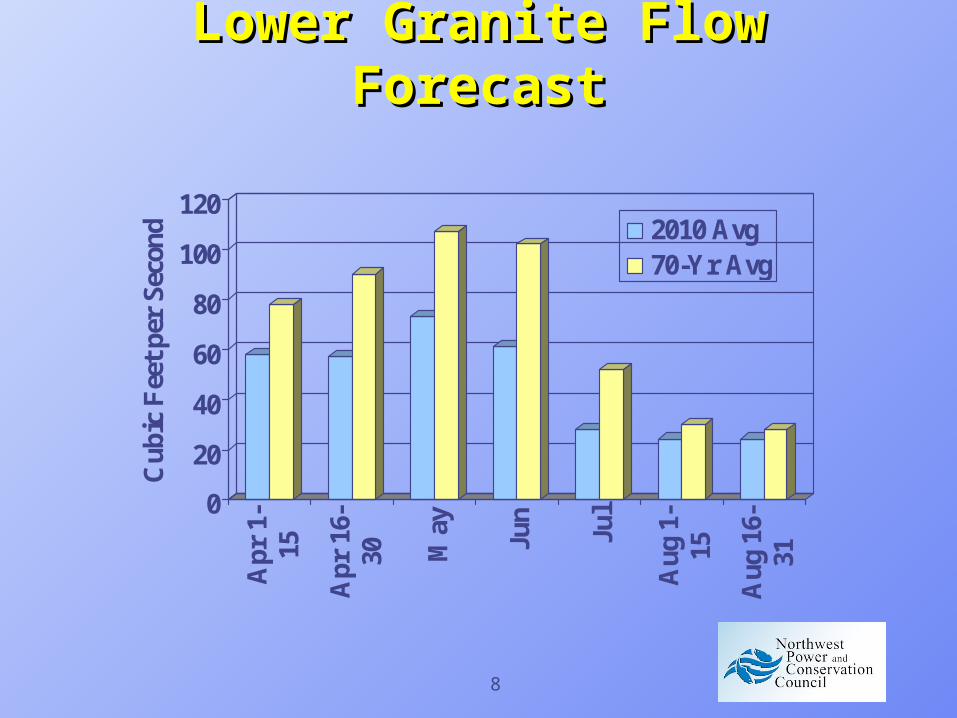
Lower Granite Flow Lower Granite Flow ForecastForecast
0
20
40
60
80
100
120
Cub
ic F
eet
per
Seco
nd
Apr
1-
15
Apr
16-
30 May
Jun
Jul
Aug
1-
15
Aug
16-
31
2010 Avg70-Yr Avg

9
McNary Flow ForecastMcNary Flow Forecast
0
50
100
150
200
250
300
Cub
ic F
eet
per
Seco
nd
Apr
1-
15
Apr
16-
30 May
Jun
Jul
Aug
1-
15
Aug
16-
31
2010 Avg70-Yr Avg
10
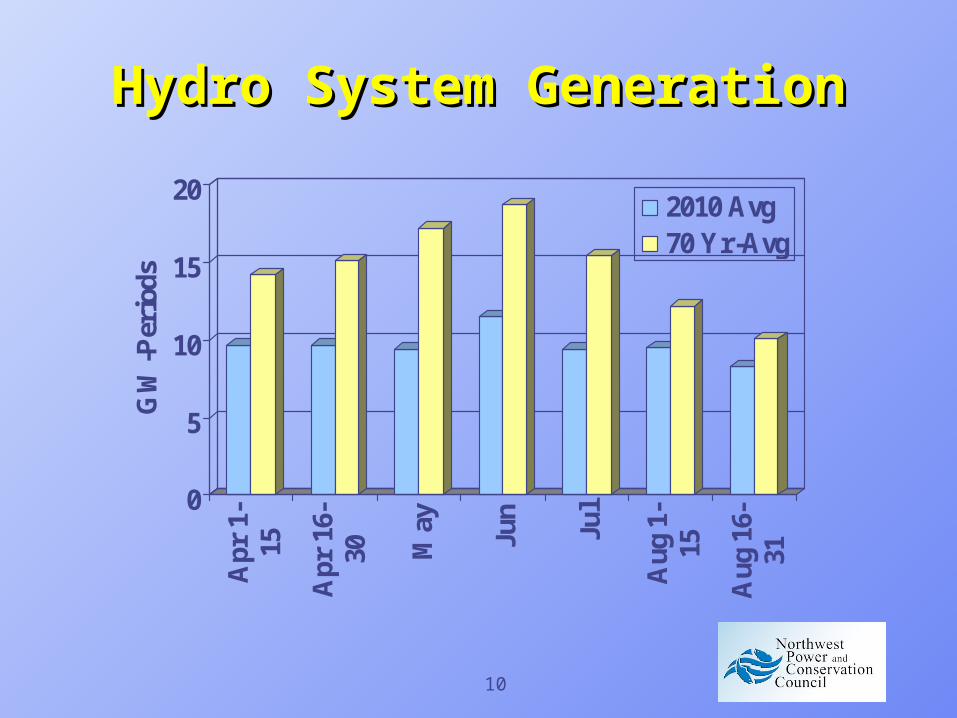
Hydro System GenerationHydro System Generation
0
5
10
15
20
GW
-Per
iods
Apr
1-
15
Apr
16-
30 May
Jun
Jul
Aug
1-
15
Aug
16-
31
2010 Avg70 Yr-Avg

11
2010 Power Supply 2010 Power Supply OutlookOutlook
(Approximate)(Approximate)
Annual Load/Resource
Balance
Summer Sustained-Peak Reserve Margin
Minimum Required
0 MWa 24%
Critical Hydro and Firm Resources Only
300 MWa 26%
With this Year’s Hydro
1,400 MWa 32%
With Available Non-firm Resources
5,300 MWa 35%

12
Power Supply ConclusionsPower Supply Conclusions
Very low chance of power outage Revenues will be lower than average
Less non-firm hydro to sell Need to purchase more from the
market BPA is using some of its financial
reserves to get through this year Reservoir elevations at BiOp levels

13
NW Power Pool Analysis NW Power Pool Analysis (March 5)(March 5)
NW Power Pool area (larger than the Council region) has adequate generation
Low flows will decrease hydro flexibility Emergency measures may need to be
implemented in the event of a significant resource loss and/or extreme temperature event (standard caveat)

14
Additional SlidesAdditional Slides
15
16
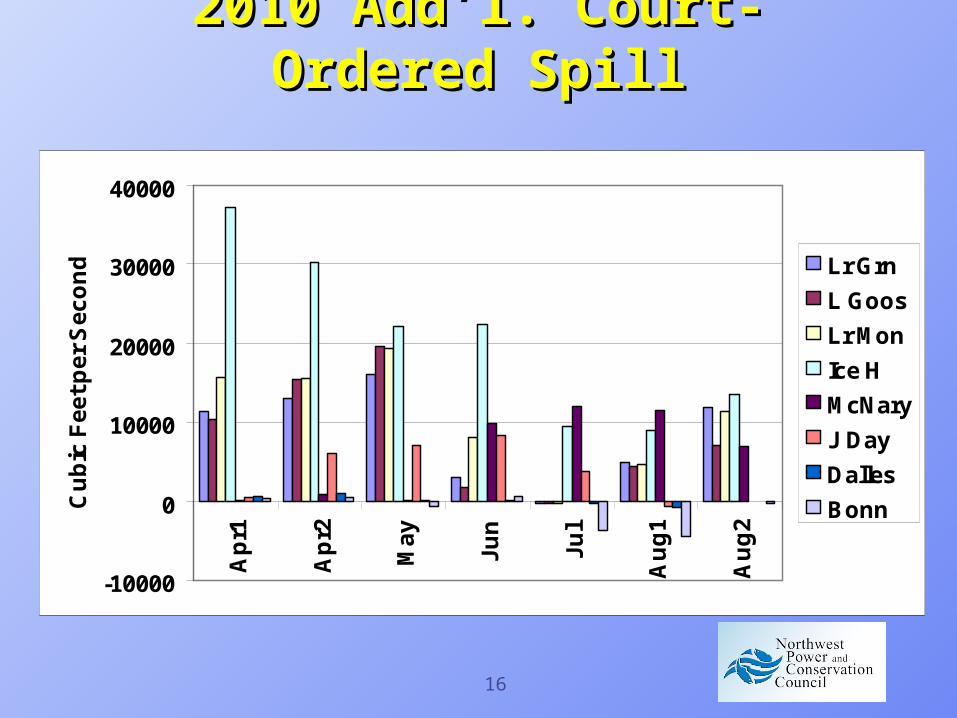
2010 Add’l. Court-Ordered 2010 Add’l. Court-Ordered SpillSpill
-10000
0
10000
20000
30000
40000
Ap
r1
Ap
r2
Ma
y
Ju
n
Ju
l
Au
g1
Au
g2
Cu
bic
Fe
et
pe
r S
ec
on
d Lr Grn
L Goos
Lr Mon
Ice H
McNary
J Day
Dalles
Bonn

17
Generation Loss due toGeneration Loss due toCourt-Ordered SpillCourt-Ordered Spill
0
100
200
300
400
500
600
MW
-Per
iod
s
Apr
1-
15
Apr
16-
30 May
Jun
Jul
Aug
1-
15
Aug
16-
31

18
Runoff Distribution UsedRunoff Distribution UsedDistribution for April Early Bird Forecast 2010
Mean 70.0, sigma 5.0
0
5
10
15
20
50 70 90 110 130 150
Jan-Jul Runoff Volume (kaf) at The Dalles
We
igh
t
19
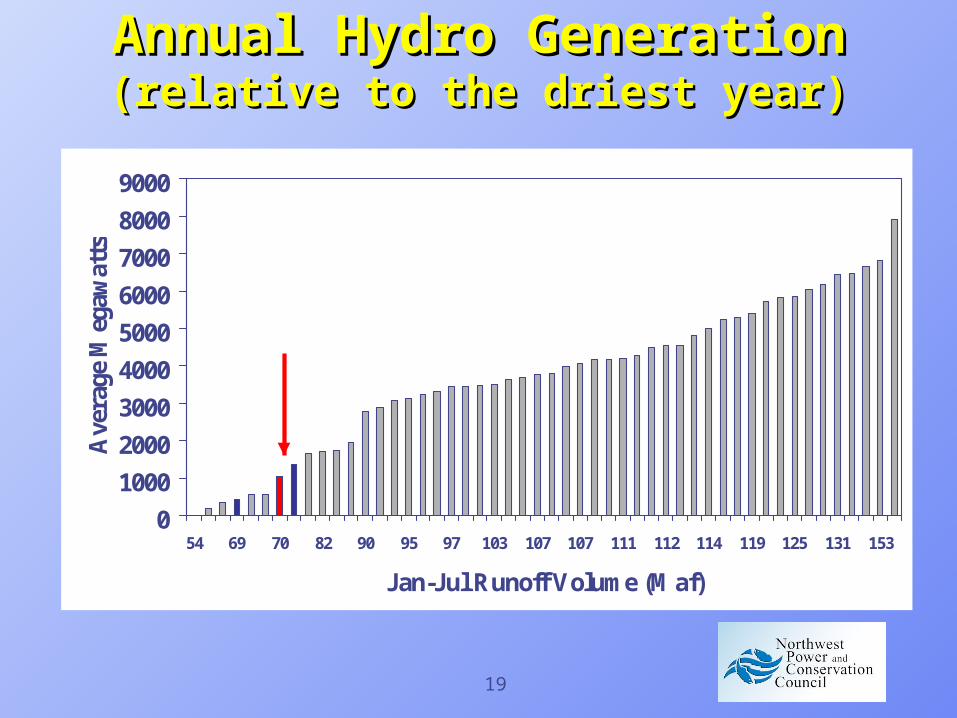
Annual Hydro GenerationAnnual Hydro Generation(relative to the driest year)(relative to the driest year)
0
1000
2000
3000
4000
5000
6000
7000
8000
9000
54 69 70 82 90 95 97 103 107 107 111 112 114 119 125 131 153
Jan-Jul Runoff Volume (Maf)
Ave
rage
Meg
awat
ts 70 Mafabout 1,100 MWamore than lowest year

20
Lower Granite Flow Lower Granite Flow ForecastForecast
(in Kcfs) 2010 Avg 70-Yr Avg
Apr 1-15 58 78
Apr 16-30 57 90
May 73 107
Jun 61 102
Jul 28 52
Aug 1-15 24 30
Aug 16-31 24 28

21
McNary Flow ForecastMcNary Flow Forecast
(in Kcfs) 2010 Avg 70-Yr Avg
Apr 1-15 125 189
Apr 16-30 134 228
May 140 275
Jun 165 298
Jul 124 204
Aug 1-15 124 162
Aug 16-31 104 126
22
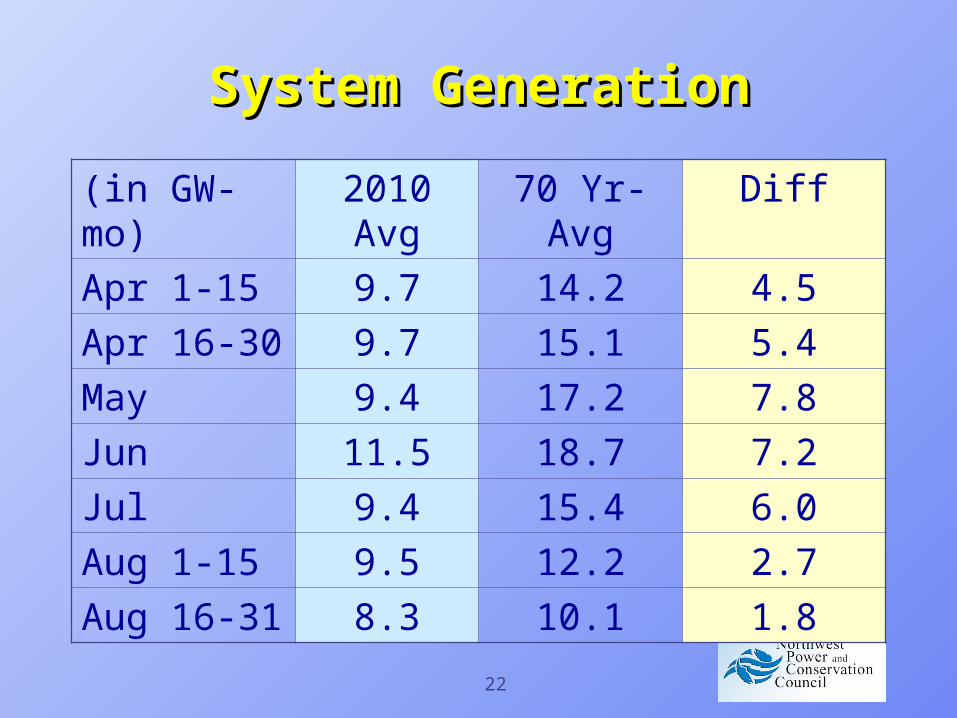
System GenerationSystem Generation
(in GW-mo)
2010 Avg
70 Yr-Avg Diff
Apr 1-15 9.7 14.2 4.5
Apr 16-30 9.7 15.1 5.4
May 9.4 17.2 7.8
Jun 11.5 18.7 7.2
Jul 9.4 15.4 6.0
Aug 1-15 9.5 12.2 2.7
Aug 16-31 8.3 10.1 1.8
23
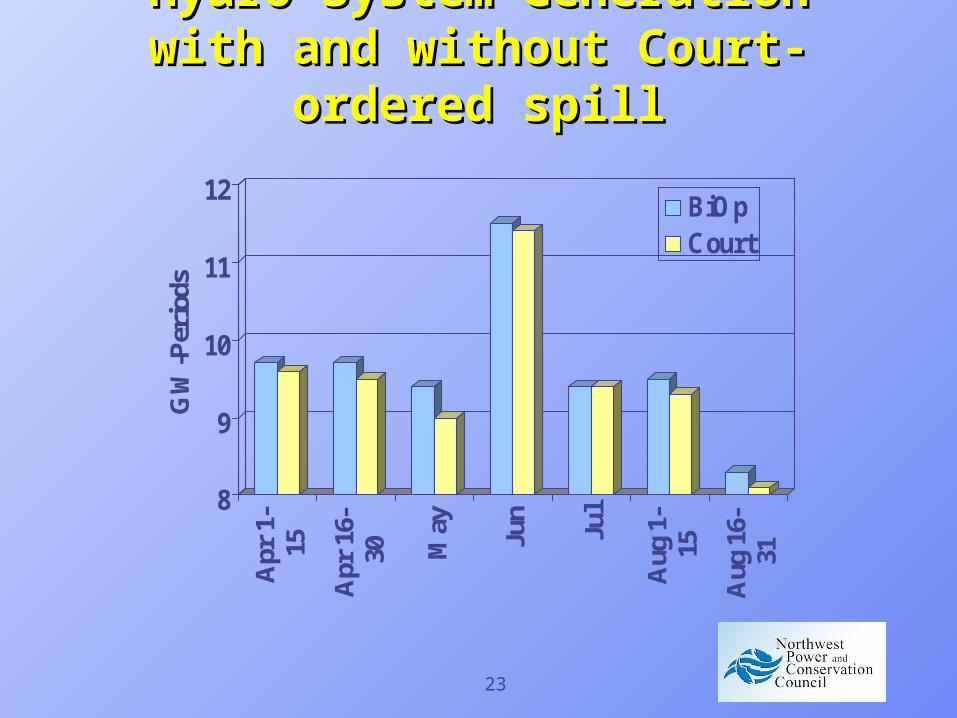
Hydro System GenerationHydro System Generationwith and without Court-with and without Court-
ordered spillordered spill
8
9
10
11
12G
W-P
erio
ds
Apr
1-
15
Apr
16-
30 May Jun
Jul
Aug
1-
15
Aug
16-
31
BiOpCourt

24
Energy Value of Court-Energy Value of Court-Ordered SpillOrdered Spill
MW-period
Apr 1-15 176
Apr 16-30 304
May 580
Jun 318
Jul 216
Aug 1-15 373
Aug 16-31 347
Season Avg 350 MW-seas
Annual Avg 150 MWa

25
Court-Ordered Spill Court-Ordered Spill (Columbia R.)(Columbia R.)
BONNEVILLE Apr10-Jun20: 100 kcfs all hours Jun21-Jul20: 85 kcfs day/ gas cap night (113 kcfs) Jul21-Aug31: 75 kcfs day/ gas cap night
THE DALLES 40% of flow all hours
JOHN DAY Apr 10-19: 0/60% of flow, all hours Apr 20 - Jul 20: 35% of flow, all hours (testing 30%
vs 40%) Jul 21 - Aug 31: 30% of flow, all hours
MCNARY Apr10-Jun14: 40% of flow Jun15-Aug31: 50% of flow (testing 40% vs. 60%)
26
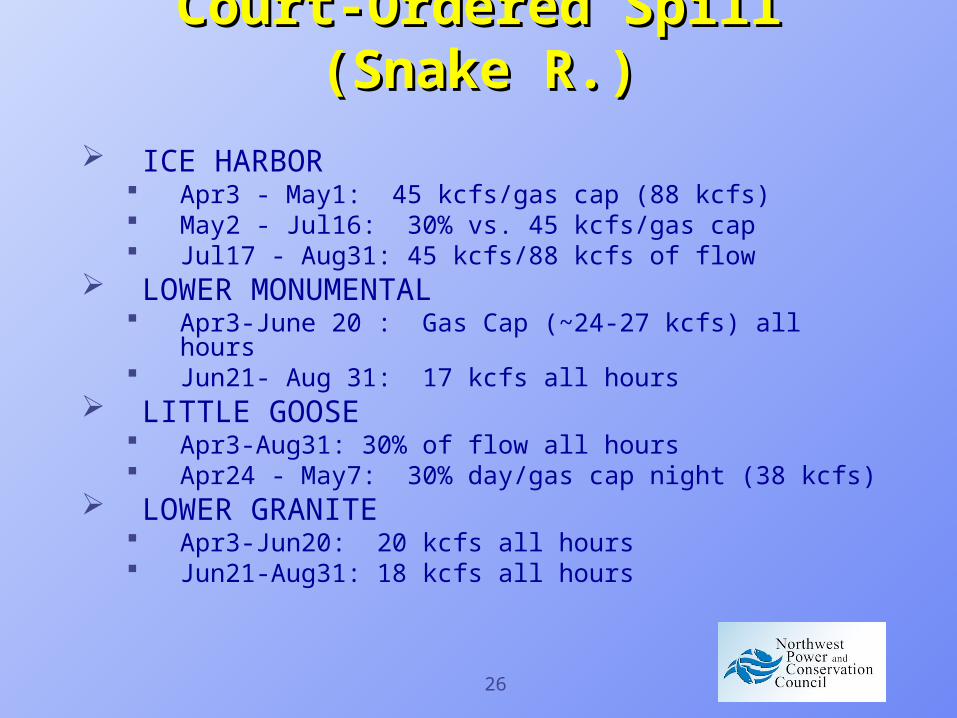
Court-Ordered Spill Court-Ordered Spill (Snake R.)(Snake R.)
ICE HARBOR Apr3 - May1: 45 kcfs/gas cap (88 kcfs) May2 - Jul16: 30% vs. 45 kcfs/gas cap Jul17 - Aug31: 45 kcfs/88 kcfs of flow
LOWER MONUMENTAL Apr3-June 20 : Gas Cap (~24-27 kcfs) all hours Jun21- Aug 31: 17 kcfs all hours
LITTLE GOOSE Apr3-Aug31: 30% of flow all hours Apr24 - May7: 30% day/gas cap night (38 kcfs)
LOWER GRANITE Apr3-Jun20: 20 kcfs all hours Jun21-Aug31: 18 kcfs all hours
Recommended