Embed Size (px)
Citation preview

World Tour 2013 #SBworldtour
by

2
Agenda, London, February 20th
4:30 pm - 5:00 pm Registration 5:00 pm - 5:45 pm Jan Rezab, CEO, Socialbakers 5:45 pm – 6:45 pm Speakers session and Panel discussion with
David Parkinson, Nissan Phil Mitchelson, News International Ivan Fernandes, Mediacom
6:45 pm - 7:00 pm Questions & Answers 7:00 pm - 9:00 pm Dinner buffet

3
World Tour 2013
NOW: London Next Stop: Sao Paulo (February 22nd)

Introduction
Jan Rezab, CEO & Co-Founder @janrezab

5
About Us
20 % of FORTUNE 500
Companies
Marketers monthly across 100+ countries
Customers

6
Social is changing all the Time
Brands are changing 1 billion Users are changing = increasing “noise”
7
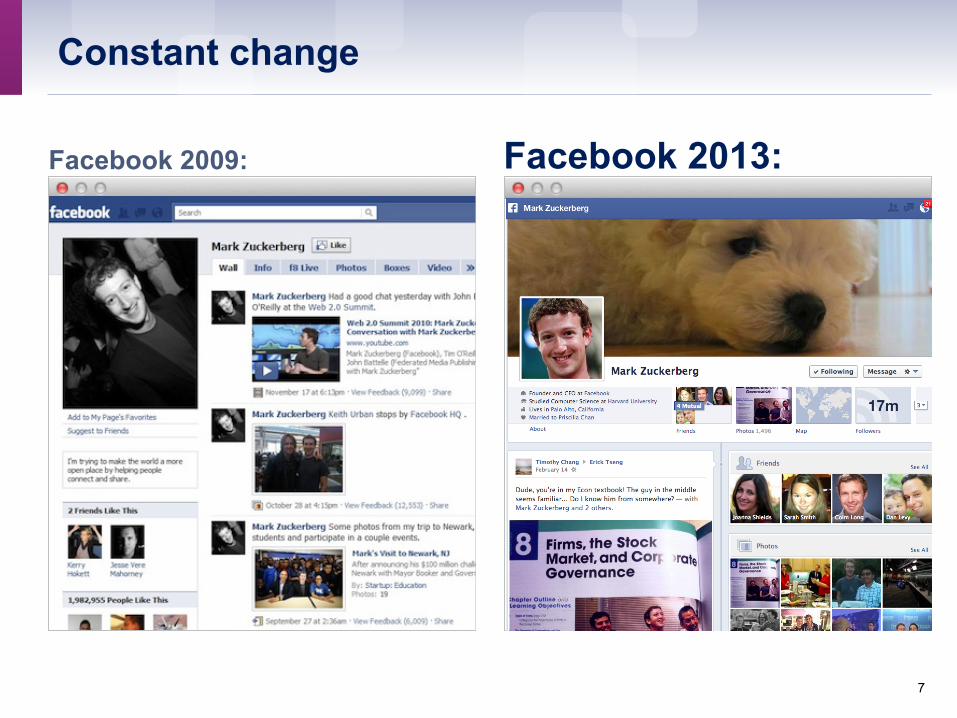
Constant change
Facebook 2009: Facebook 2013:

8
UK Facebook Users
9
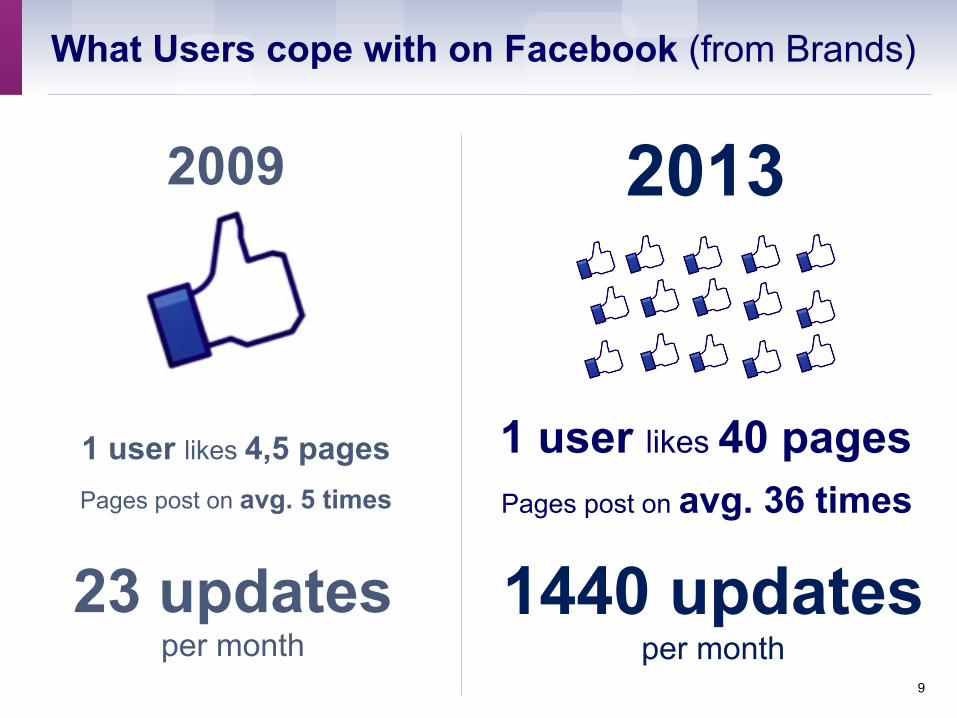
What Users cope with on Facebook (from Brands)
1 user likes 4,5 pages
Pages post on avg. 5 times
1 user likes 40 pages Pages post on avg. 36 times
23 updates per month
2009 2013
1440 updates per month

10
UK Brands post less on average
0
5
10
15
20
25
30
35
40
45
English
Worldwide Brands

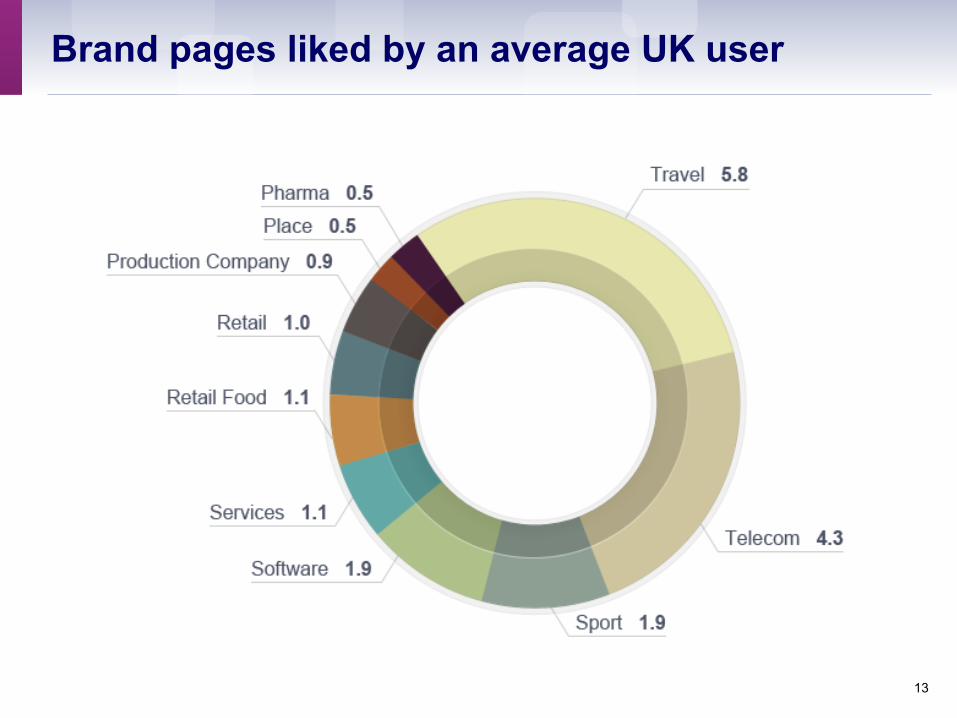
An average UK Facebook user is a fan of 48 pages

12
Average UK user is a fan of 48 pages
13
Brand pages liked by an average UK user

14
What brands post and what users like to share
Post Shares Post Types
0%
25%
50%
75%
100%
0%
25%
50%
75%
100%
Status
Photo
Link
15
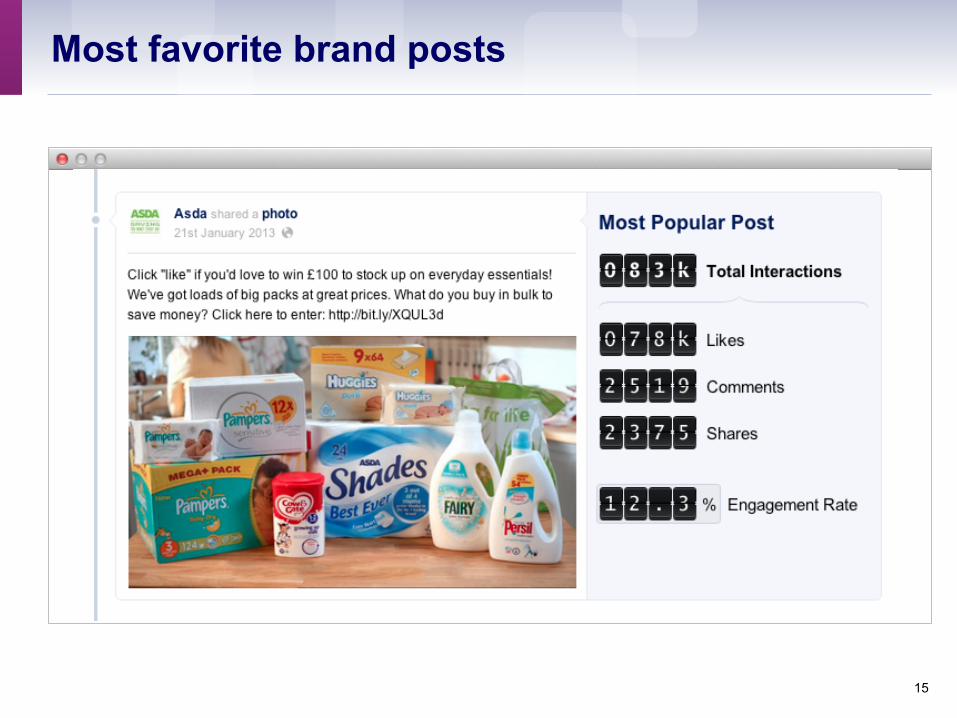
Most favorite brand posts
16
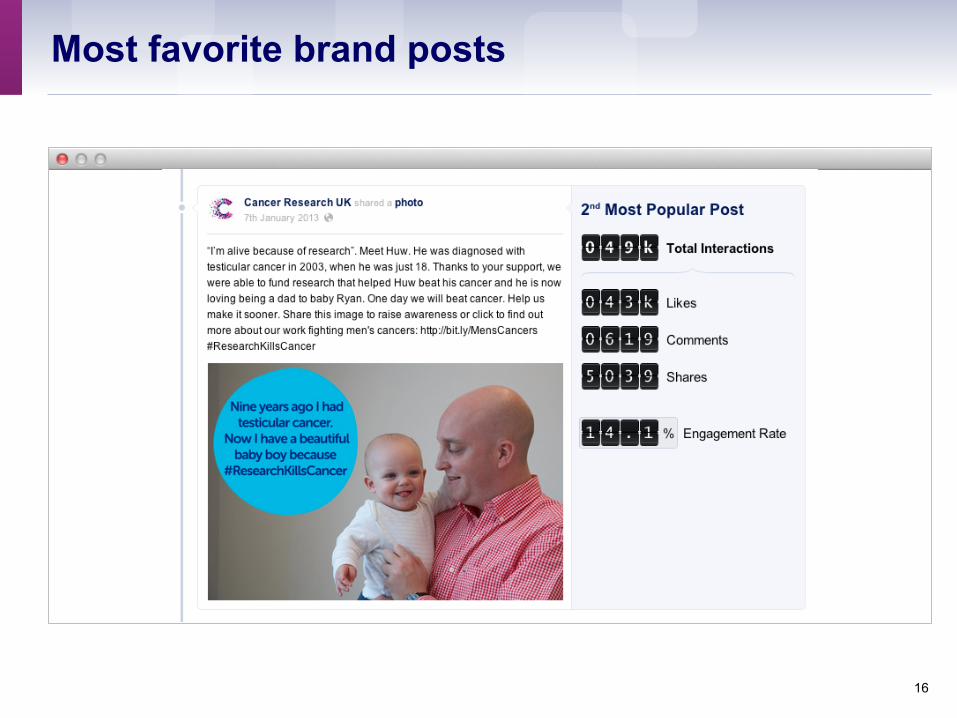
Most favorite brand posts

17
Top 5 Facebook Brands by Number of Local Fans
18
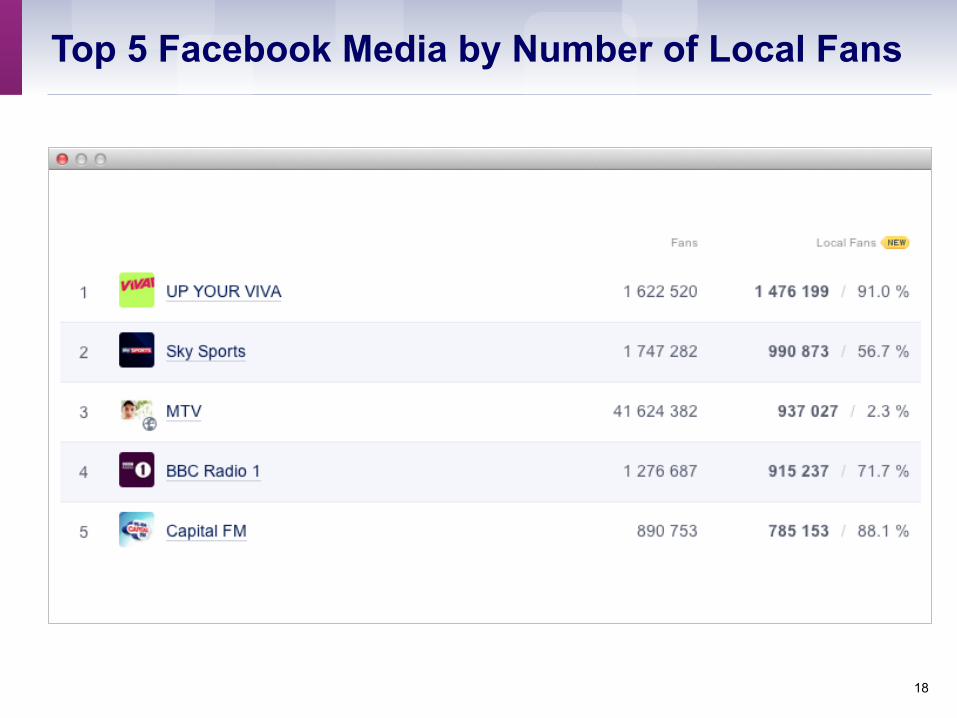
Top 5 Facebook Media by Number of Local Fans

19
Top 5 Facebook Brands by Post Engagement Rate

20
Top METRICS in Social Media
Being social is not about one metric. It’s about all of them.

21
Return On Engagement
Fans and Fan Growth
Activity of Your Page
Engagement Rate and Reach
Response Rate Response Time

The Alpha and omega of successful social strategy

23
0
10
20
30
40
50
60
70
0
500
1000
1500
2000
2500
1 11 21 31 41 51 61
Like
s
Impr
essi
ons
Average organic unique impressions
Average Likes
Time in Minutes
Gaining the Reach and Engagement in Minutes

24
Science of Posting

25
Science of Posting
0.00%
0.20%
0.40%
0.60%
0.80%
1.00%
1.20%
1.40%
1.60%
0:00 2:00 4:00 6:00 8:00 10:00 12:00 14:00 16:00 18:00 20:00 22:00
Weekly Traffic
Weekend Traffic

26
Open and drive 2 Way Communication
socially-devoted.com

27
Questions answered on Facebook

28
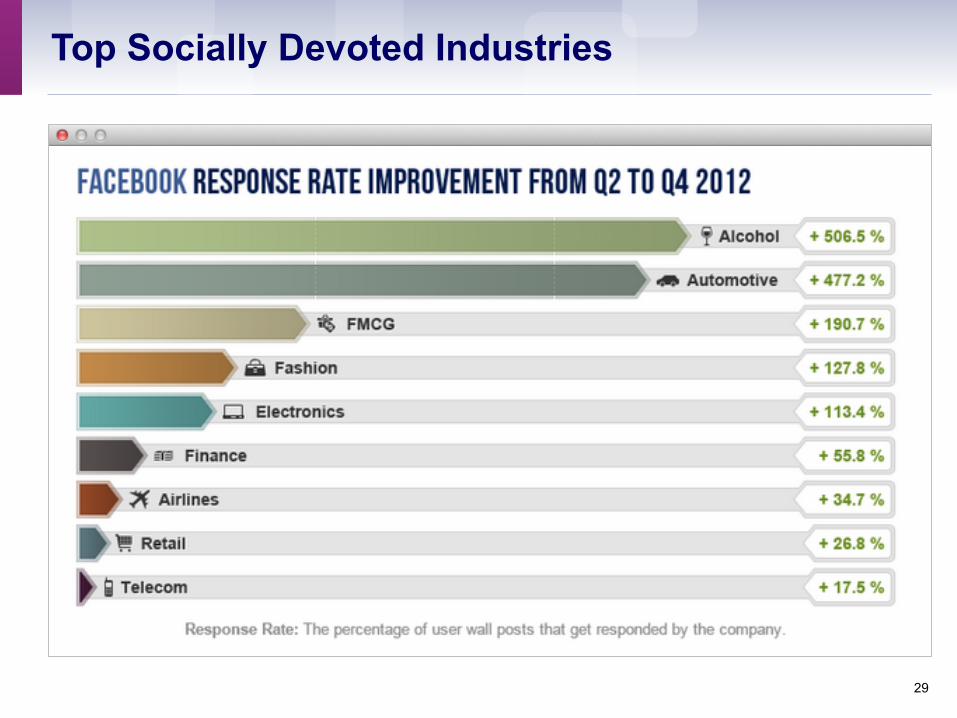
Top Socially Devoted Industries
29
Top Socially Devoted Industries

30
Top 5 Socially Devoted FB Brands in UK

31
Fashion – Case Study
Are not responded… 14%
32
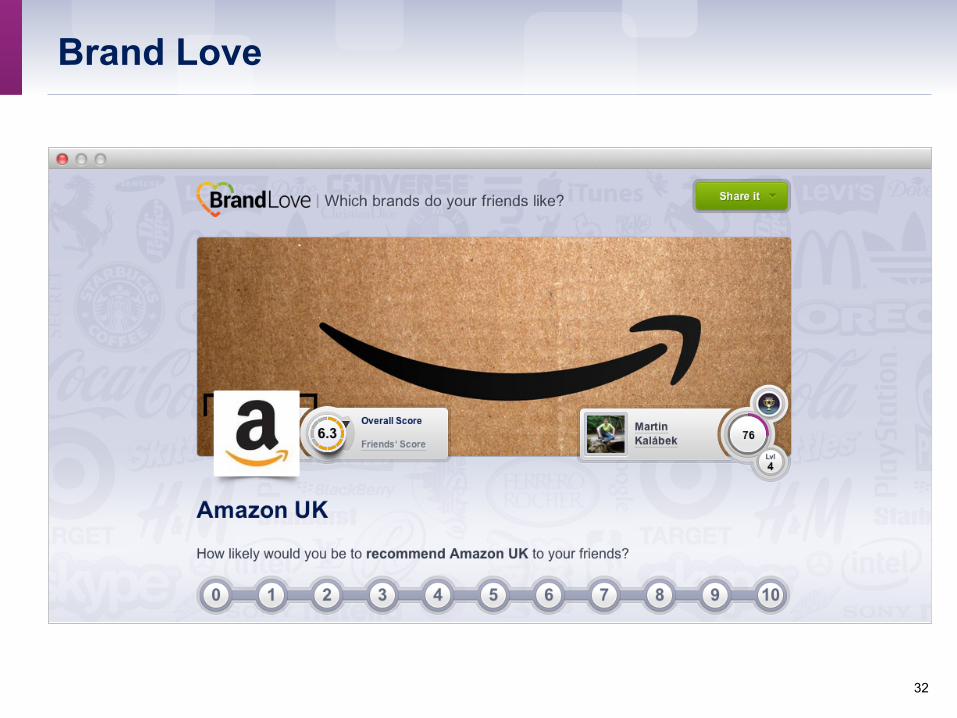
Brand Love

33
Recommendation for 2013
› Monitor and measure your activity
› Drive the industry and invest in innovations
› Devote resources into social customer service
› Post only local and relevant content in a timely manner
› Make sure you get into News Feed

34
How We can help You to get there.....
Data Categorization Brand Graph

35
How We can help You to get there.....
Benchmarks Categorization Brand Graph

36
Brand Graph
*not all categories present

37
Brand Graph

38
How We can help You to get there.....
Benchmarks
Visualization

39
...with Our Products
Platform
ad
Thank you
Jan Rezab, CEO of @janrezab