Embed Size (px)
Citation preview

© 2016 WIPRO LTD | WWW.WIPRO.COM1
Wipro Limited
April - June 2016
Presentation to Investors

© 2016 WIPRO LTD | WWW.WIPRO.COM2
Safe Harbor
This presentation may contain certain “forward looking” statements, which
involve a number of risks, uncertainties and other factors that could cause
actual results to differ materially from those that may be projected by these
forward looking statements. These uncertainties have been detailed in the
reports filed by Wipro with the Securities and Exchange Commission and
these filings are available at www.sec.gov. This presentation also contains
references to findings of various reports available in the public domain.
Wipro makes no representation as to their accuracy or that the company
subscribes to those findings.

© 2016 WIPRO LTD | WWW.WIPRO.COM3
Agenda
Our track record on performance
Overall Market Opportunity
Our Strategy
1
2
3

© 2016 WIPRO LTD | WWW.WIPRO.COM4
Track Record on Performance

© 2016 WIPRO LTD | WWW.WIPRO.COM5
Growth of IT Services business
�1200+ active global clients
�Nine $100M relationships
�57% revenues on Fixed Price
� Over 160,000 workforce
� 100+ nationalities represented
� 32%+ women employees
Partner to Industry Global footprint Diverse talent p ool
Revenues for FY16 at $7.3 billion
IT Services Business has grown at a CAGR of 12% in the last 9 years
� Part of NYSE TMT Index
� Present in over 175 cities
� 53% Revenues from America
IT Services Revenue $ Mn
$2,611
$3,647 $4,323 $4,390
$5,221 $5,921 $6,218
$6,618 $7,082 $7,346
2006-07 2007-08 2008-09 2009-10 2010-11 2011-12 2012-13 2013-14 2014-15 2015-16

© 2016 WIPRO LTD | WWW.WIPRO.COM6
Revenue Distribution
Revenue contribution a
Diversified BU portfolio to hedge sector risk
Business Unit-wise share
Integrated consulting constitute ~1.7% of revenues
Service Line distribution Geographical Distribution
Revenue Distribution
Top 1 customer
Top 5 customers
Top 10 customers
Customers >$100 MN
Customers >$1 MN
3.1%
11.6%
19.3%
9
550
Customer Metrics
aTrailing Twelve month basis
Americas 52.7%
APAC & Emerging markets 11.2%
Europe 25.3%
India & Middle East 10.8%
Scale in developed & presence in emerging markets
Strong contribution from top customers
Revenue well-diversified across verticals, service line & geographies
RCTG15.2%
BFSI26.3%
Mfg-Hitech18.6%
HLS12.0%
GMT13.3%
ENU14.6%
GIS
28.3%
Analytics
7.4%
AS
46.6%
BPS
9.8%
PES
7.9%
The distribution percentages have been calculated based on FY16 USD revenues for the Business Unit/ Service line/ Geography
BFSI-Banking, Financial Services and Insurance
HLS-Healthcare & Life Sciences
RCTG-Retail, Consumer, Transport and Government
ENU-Energy, Natural Resources & Utilities
MFG-Manufacturing & Hitech
GMT-Global Media & Telecom
GIS-Global Infrastructure Services
PES-Product Engineering Services
BPS-Business Process Services
AS-Application Services

© 2016 WIPRO LTD | WWW.WIPRO.COM7
Winning together with Strategic Alliances
Joint Value Thought Leadership Executive Commitment
Wipro's WINNING TOGETHER approach is all about driving joint Go to Market initiatives in partnership with Strategic Alliances and help customers Do Business Better.
Wipro Strategic Alliances community helps in creating winning partnerships which offers mutual business growth opportunities, joint value driven by collaboration, executive commitment and thought leadership around future technologies.

© 2016 WIPRO LTD | WWW.WIPRO.COM8
Overall Market Opportunity

© 2016 WIPRO LTD | WWW.WIPRO.COM9
India Off-shoring market
~ 350-400
~200-225
Source: NASSCOM The IT - BPO Sector in India – Strategic Review 2016
Long Term Fundamentals of the India Off-shoring story remain intact
23.617.7
31.440.3
59.147.1
49.7
CAGR
18%
FY12
68.8
Off-shoring market is expected to grow at a 14% CAGR for the next nine years
FY13FY07FY06FY05 FY08 FY09 FY10 FY11 FY14
76.187.7
FY 2020
98.5
FY15 FY 2025
108
India’s offshore IT and BPO exports ($B)
FY16
Digital technologies
Revenues from Digital technologies are expected to represent 23% and 38% share by 2020 and 2025

© 2016 WIPRO LTD | WWW.WIPRO.COM10
Our Strategy

© 2016 WIPRO LTD | WWW.WIPRO.COM11
Themes to win: Run: Modernize the ‘Core’
Localization
Integrated Services
Hyper Automation
• Solve business problem AsAServicerather than offer à la carte services
• Delivery-led sales program launched
• Hyper automation is initiative to drive robotic process automation (RPA) and Cognitive Intelligence drastically changing traditional IT delivery model
• In FY16 we performed successful PoCs across 42 clients• FY17 we plan to scale the PoCs across Infra, AMS & BPS and plan to release 4,500
people from our engagements through automation for the year• Released employees are being trained & redeployed into newer technologies
• Continuing to focus on the new growth markets like Latin America, Canada, South Africa as well as Continental Europe
• Driving Localization in key markets by increasing local centers , a center in Mountain view has already been set up.
• Local presence through M&A, such as cellent acquisition in DACH region.• Increasing the % of locals in the workforce and diversity
• Set up integrated services unit (ISSG) to synergize domain knowledge with end-to-end solutions from multiple services like Apps, Infra & Analytics
• An example is the Managed File Transfer (MFT) platform which is a BPaaS offering hosted on cloud enabling secure transfers of large file in organizations. The platform has transformed B2B file transfers for our Fortune 500 customers
• ADROIT is a program for 1000 account delivery managers aimed at fostering learning agility in delivery teams & creating a framework for delivery-led sales.
• Increase Automation; de-skill task
• Robotic Process Automation
• Cognitive Intelligence
• Setting up of local delivery centers
• Acquisitions
• Diversification of Workforce
Annuity Services
• Drive Higher Annuity Mix• Automation Asset covering ADM
• Drive higher annuity mix for predictability & stickiness in revenues and improve OM• ADM solutions like portfolio rationalization, modernization, cloud migration and SaaS /
PaaS offerings.
Alliances
• Strategic, Growth & Niche Alliances • A dedicated unit to deepen and widen alliance ecosystems to drive creation of new markets and solutions, expand in key verticals/geographies and drive GTM outcomes.

© 2016 WIPRO LTD | WWW.WIPRO.COM12
Non-Linearity
Digital
• Aligned Consulting services with Digital unit • Designit: unique design capabilities driving synergy wins for Wipro • Opened digital pods in London & New York to serve global customers• Dedicated Digital leaders in each vertical; ‘One Voice’ program to enable front-
end across Wipro to pitch Digital services consistently to key customers• In FY16 launched a program to train 10,000 employees in digital technologies.• Scaling the training program to cover another 20,000 employees
Partner Ecosystem
• Acquired 4 companies Designit, cellent, Viteos & HealthPlan Services in FY16• Wipro Ventures invested $20 million in 6 start-ups operating in the cutting-
edge technology space• Continue to enhance our 360 degree alliances with key technology companies• Initiated 2 joint research programs on AI with leading universities
• Advisory, Design & technology
• Transformative end-user experience
• Deep investment in selling Digital
• Training Workforce in Digital
• M&A and Wipro Ventures
• Alliances & Academia
• Other strategic partnerships
Themes to win: Change: Driving the ‘Future’
• Focus on core suite of IP assets including product (eg. Promax), platform (eg, ServiceNXT), solution (eg. Managed File Transfer) & tool (eg. RPA)
• Wipro HOLMES TM has received strong adoption with 18 engagements. Key Wall Street customer deployed Wipro HOLMES TM for an eKYC solution
• We have filed for over 1,000 patents including many on Wipro HOLMES TM
• Target a larger share of revenue led by non-linearity
• Investments in Intellectual Property (IP).
• Cognitive Intelligence Platform, Wipro HOLMES TM
Invest for Future
• Dedicated Units that are addressing the opportunity in emerging areas by delivering platforms, framework and solutions
• Internet of Everything• Software-Defined• Cyber-Security• Open Source

© 2016 WIPRO LTD | WWW.WIPRO.COM13
Recognitions on Sustainability front

© 2016 WIPRO LTD | WWW.WIPRO.COM14
Annexure - Key Highlights

© 2016 WIPRO LTD | WWW.WIPRO.COM15
Financial Summary for the Year Ended March 31, 2016 (IFRS)
Wipro Limited
FY 16 (Rs miliion) YoY Growth
Revenues 512,440 9%
Results from Operating Activities(EBIT)
97,021 2%
Net Income 88,922 3%
Net Income refers to ‘Profit for the period attributable to equity shareholders of the company’
Revenue of the Company grew 9% YoY in FY16. Net Income grew 3% YoY.
Segments Revenue(Rs million)
YoY GrowthSegment Results
(Rs million)YoY Growth f
IT Services 487,316 11% 99,716 2%
IT Services Revenue grew by 11% on a YoY basis and EBIT grew 2% YoY.
Board approved a buyback proposal for purchase by the company of upto 40 million shares at a price of Rs. 625 per equity share aggregating up to Rs.25,000 million.
Payout for the year including interim, final dividend and maximum buyback amount is 48 %
© 2016 WIPRO LTD | WWW.WIPRO.COM16
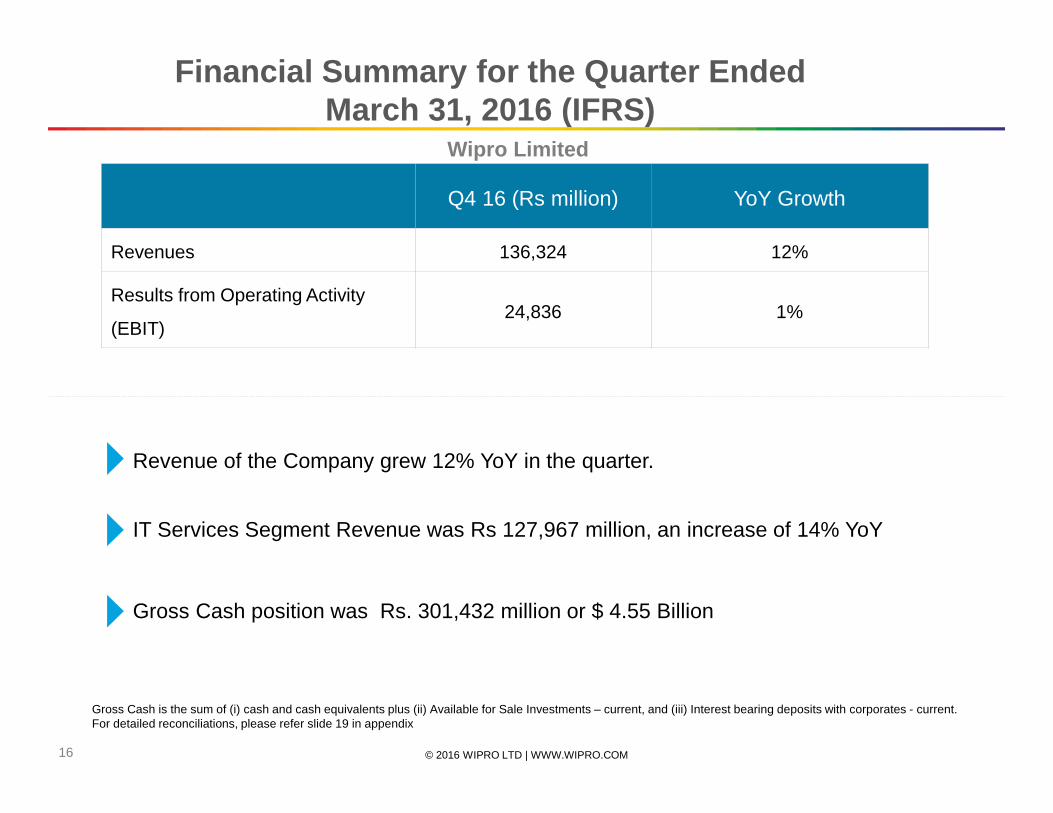
Financial Summary for the Quarter Ended March 31, 2016 (IFRS)
Wipro Limited
Q4 16 (Rs million) YoY Growth
Revenues 136,324 12%
Results from Operating Activity
(EBIT)24,836 1%
Gross Cash is the sum of (i) cash and cash equivalents plus (ii) Available for Sale Investments – current, and (iii) Interest bearing deposits with corporates - current.For detailed reconciliations, please refer slide 19 in appendix
Revenue of the Company grew 12% YoY in the quarter.
Gross Cash position was Rs. 301,432 million or $ 4.55 Billion
IT Services Segment Revenue was Rs 127,967 million, an increase of 14% YoY

© 2016 WIPRO LTD | WWW.WIPRO.COM17
Highlights for the quarter
Net Headcount addition of 2,248 in the quarter. Headcount now stands at 172,912.
For reconciliation of non-GAAP constant currency IT Services USD revenues please refer to slide 19Segment Profit refers to Segment Results
IT Services Segment Margins was 20.1% for the quarter.
Non-GAAP constant currency IT Services Segment USD Revenue grew 2.7% QoQ and grew 7.8% YoY.
Wipro completed the acquisition of Health Plan Services, a BPaaS company in US
Quarterly Annualized voluntary attrition dropped from 16.3% in Q3 to 14.9%

© 2016 WIPRO LTD | WWW.WIPRO.COM18
Thank You

© 2016 WIPRO LTD | WWW.WIPRO.COM19
Reconciliation of Selected GAAP measures to Non-GAA P measures
Reconciliation of Gross Cash
WIPRO LIMITED AND SUBSIDIARIES(Amounts in INR million)
As ofMar 31, 2016
Computation of Gross cash positionCash and cash equivalents 99,049 Available for sale investments - current 132,944 Inter corporate and term deposit - current 69,439 Total 301,432
WIPRO LIMITED AND SUBSIDIARIES(Amounts in INR million)
Three months ended
Mar 31, 2016Profit for the period [A] 22,350
Computation of Free cash flowNet cash generated from operating activities 19,277Add/(deduct) cash inflow/(outflow) on :
Purchase of Property,plant and equipment (5,273)Proceeds from sale of Property,plant and equipment 278
Free cash flow attributable to equity holders of the company [B] 14,281
Free cash flow as a percentage of Net income [B/A] 64%
Reconciliation of Non-GAAP Constant Currency IT Se rvices Revenue to IT Services Revenue as per IFRS ( $MN)
Three months ended March 31, 2016 Three months ended March 31, 2016
IT Services Revenue as per IFRS $1,882.0 IT Services Revenue as per IFRS $1,882.0
Effect of Foreign currency exchange movement $ 5.6 Effect of Foreign currency exchange movement $ 30.3Non-GAAP Constant Currency IT Services Revenue based on previous quarter exchange rates
$ 1,887.6
Non-GAAP Constant Currency IT Services Revenue based on exchange rates of comparable period in previous year $1,912.3
Reconciliation of Free Cash Flow
Reconciliation of Non-GAAP constant currency Reven ue
1 crores=10 million