Embed Size (px)
Citation preview

© 2017 Wipro wipro.com confidential 1
Wipro Limited
Presentation to Investors
April - June 2017

© 2017 Wipro wipro.com confidential 2
Safe Harbor
This presentation may contain certain “forward looking” statements, which involve a
number of risks, uncertainties and other factors that could cause actual results to
differ materially from those that may be projected by these forward looking
statements. These uncertainties have been detailed in the reports filed by Wipro
with the Securities and Exchange Commission and these filings are available at
www.sec.gov. This presentation also contains references to findings of various
reports available in the public domain. Wipro makes no representation as to their
accuracy or that the company subscribes to those findings.
© 2017 Wipro wipro.com confidential 33
Our track record on performance1
Agenda
Overall Market Opportunity2
Our Strategy3
© 2017 Wipro wipro.com confidential 4
Track record on performance
© 2017 Wipro wipro.com confidential 5
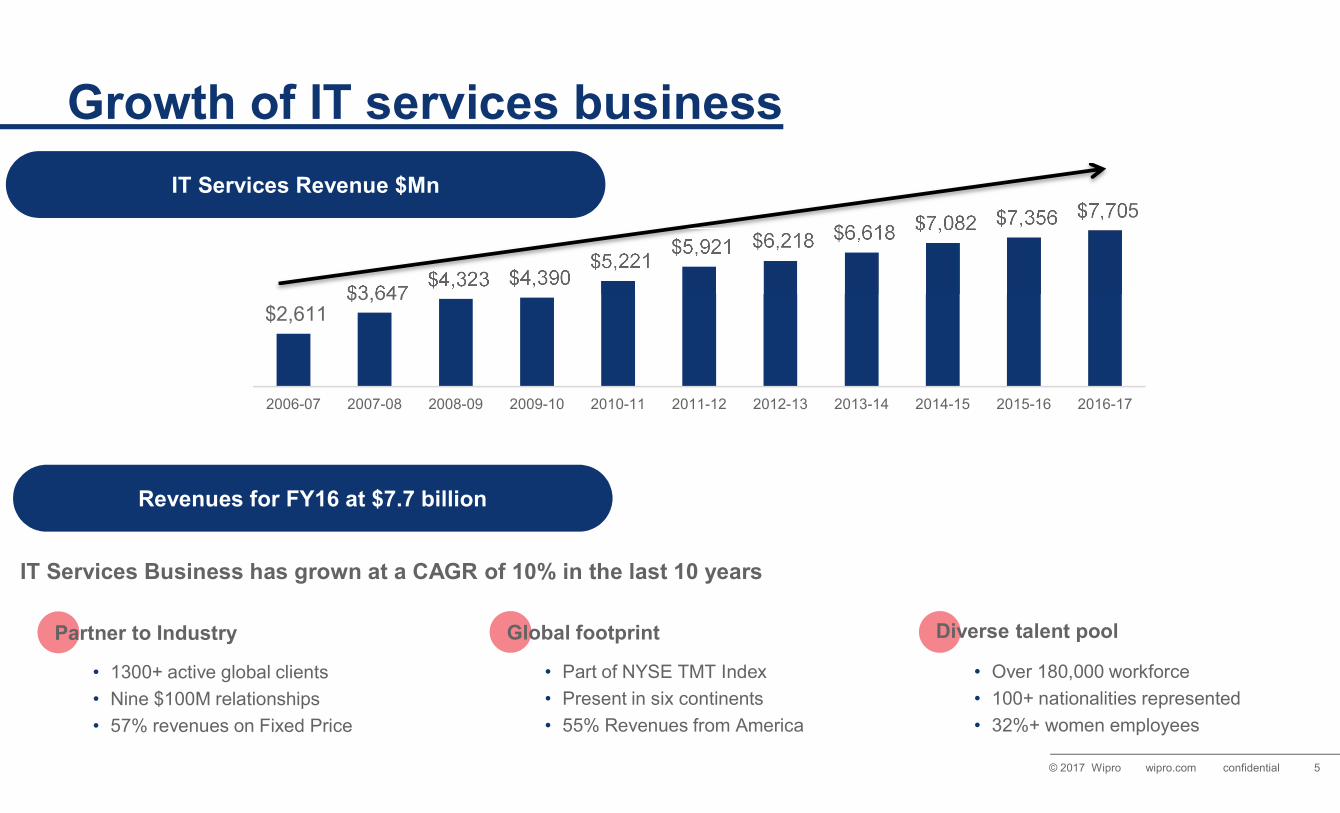
Growth of IT services business
$2,611 $3,647
$4,323 $4,390 $5,221
$5,921 $6,218 $6,618 $7,082 $7,356 $7,705
2006-07 2007-08 2008-09 2009-10 2010-11 2011-12 2012-13 2013-14 2014-15 2015-16 2016-17
Revenues for FY16 at $7.7 billion
IT Services Revenue $Mn
IT Services Business has grown at a CAGR of 10% in the last 10 years
• 1300+ active global clients
• Nine $100M relationships
• 57% revenues on Fixed Price
• Part of NYSE TMT Index
• Present in six continents
• 55% Revenues from America
• Over 180,000 workforce
• 100+ nationalities represented
• 32%+ women employees
Partner to Industry Global footprint Diverse talent pool
© 2017 Wipro wipro.com confidential 6
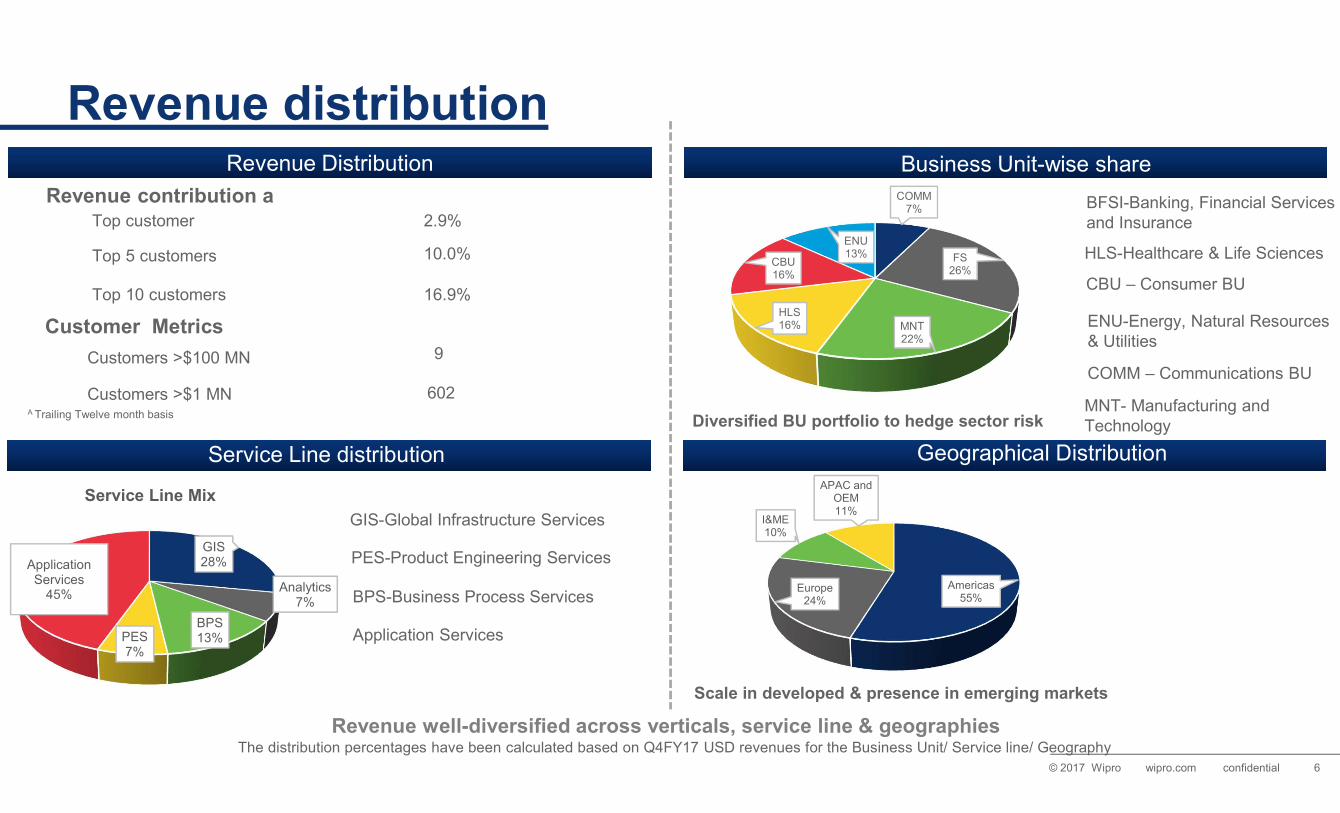
Revenue distributionRevenue Distribution Business Unit-wise share
Revenue contribution aTop customer
Top 5 customers
Top 10 customers
Customers >$100 MN
Customers >$1 MN
2.9%
10.0%
16.9%
9
602A Trailing Twelve month basis
Customer Metrics
COMM7%
FS26%
MNT22%
HLS16%
CBU16%
ENU13%
Diversified BU portfolio to hedge sector risk
BFSI-Banking, Financial Services and Insurance
HLS-Healthcare & Life Sciences
CBU – Consumer BU
ENU-Energy, Natural Resources & Utilities
COMM – Communications BU
MNT- Manufacturing and Technology
Service Line distribution
GIS28%
Analytics7%
BPS13%PES
7%
Application Services
45%
Service Line Mix
GIS-Global Infrastructure Services
PES-Product Engineering Services
BPS-Business Process Services
Application Services
Americas55%
Europe24%
I&ME10%
APAC and OEM11%
Scale in developed & presence in emerging markets
Revenue well-diversified across verticals, service line & geographiesThe distribution percentages have been calculated based on Q4FY17 USD revenues for the Business Unit/ Service line/ Geography
Geographical Distribution
© 2017 Wipro wipro.com confidential 7
Overall market opportunity

© 2017 Wipro wipro.com confidential 8
India off-shoring market
India’s offshore IT and BPO exports ($B)~ 350-400
~200-225
23.66
17.731.4
40.3
59.147.1 49.7
CAGR 17%
FY12
68.8
FY13FY07FY06FY05 FY08 FY09 FY10 FY11 FY14
76.1 87.7
FY 2020
98.5
FY15 FY 2025
117
FY16
Digital technologies
FY17
108
• Long Term Fundamentals of the India Off-shoring story remain intact
• Off-shoring market is expected to grow at a 15% CAGR for the next eight years
• Revenues from Digital technologies are expected to represent 23% and 38% share by 2020 and 2025
Source: NASSCOM The IT - BPO Sector in India – Strategic Review 2017
© 2017 Wipro wipro.com confidential 9
Our strategy
© 2017 Wipro wipro.com confidential 10
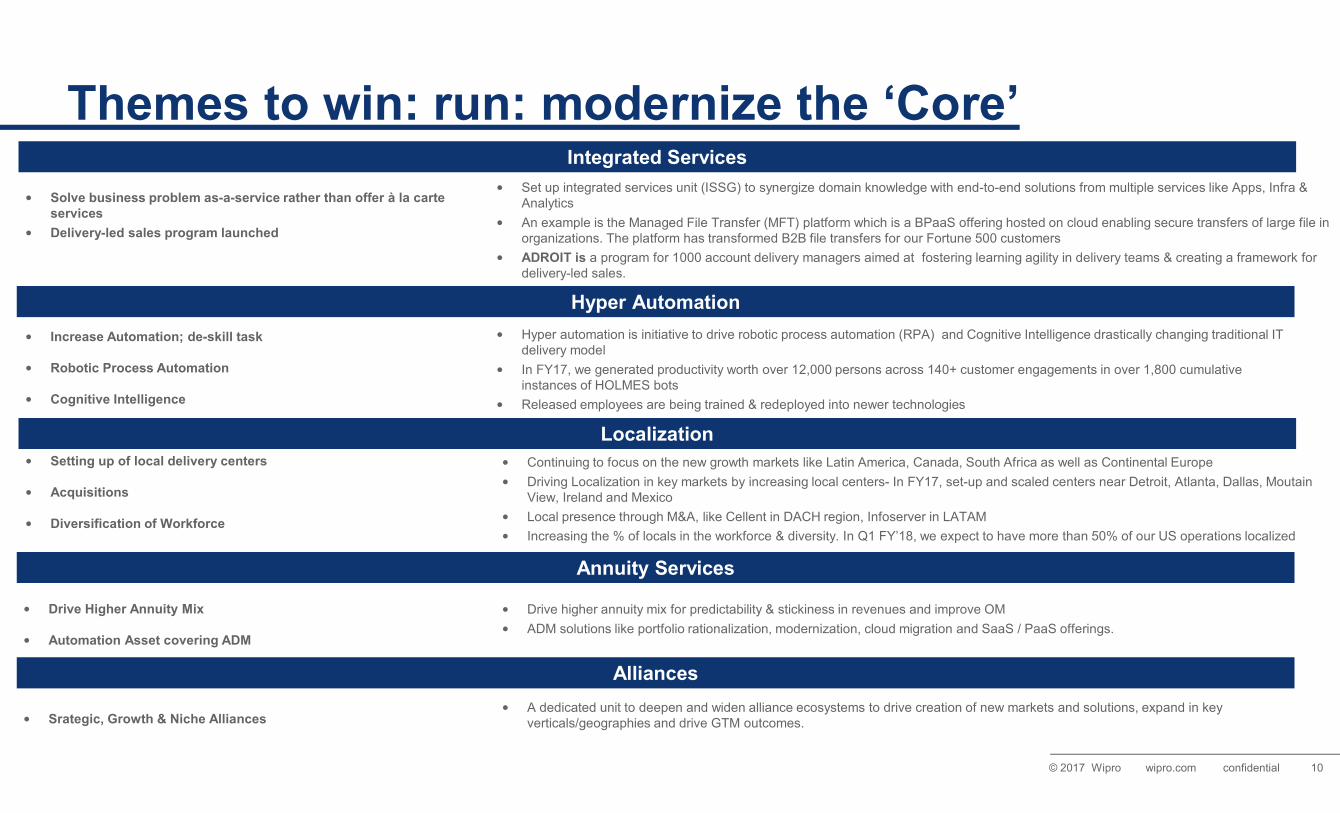
Themes to win: run: modernize the ‘Core’
Localization
Integrated Services
Hyper Automation
• Solve business problem as-a-service rather than offer à la carte services
• Delivery-led sales program launched
• Hyper automation is initiative to drive robotic process automation (RPA) and Cognitive Intelligence drastically changing traditional IT delivery model
• In FY17, we generated productivity worth over 12,000 persons across 140+ customer engagements in over 1,800 cumulative instances of HOLMES bots
• Released employees are being trained & redeployed into newer technologies
• Continuing to focus on the new growth markets like Latin America, Canada, South Africa as well as Continental Europe
• Driving Localization in key markets by increasing local centers- In FY17, set-up and scaled centers near Detroit, Atlanta, Dallas, MoutainView, Ireland and Mexico
• Local presence through M&A, like Cellent in DACH region, Infoserver in LATAM
• Increasing the % of locals in the workforce & diversity. In Q1 FY’18, we expect to have more than 50% of our US operations localized
• Set up integrated services unit (ISSG) to synergize domain knowledge with end-to-end solutions from multiple services like Apps, Infra & Analytics
• An example is the Managed File Transfer (MFT) platform which is a BPaaS offering hosted on cloud enabling secure transfers of large file in organizations. The platform has transformed B2B file transfers for our Fortune 500 customers
• ADROIT is a program for 1000 account delivery managers aimed at fostering learning agility in delivery teams & creating a framework for delivery-led sales.
• Increase Automation; de-skill task
• Robotic Process Automation
• Cognitive Intelligence
• Setting up of local delivery centers
• Acquisitions
• Diversification of Workforce
Annuity Services
• Drive Higher Annuity Mix
• Automation Asset covering ADM
• Drive higher annuity mix for predictability & stickiness in revenues and improve OM
• ADM solutions like portfolio rationalization, modernization, cloud migration and SaaS / PaaS offerings.
Alliances
• Srategic, Growth & Niche Alliances• A dedicated unit to deepen and widen alliance ecosystems to drive creation of new markets and solutions, expand in key
verticals/geographies and drive GTM outcomes.

© 2017 Wipro wipro.com confidential 11
Themes to win: change: driving the ‘Future’
Partner Ecosystem
Digital
Non-Linearity
• Advisory, Design & technology
• Transformative end-user experience
• Deep investment in selling Digital
• Training Workforce in Digital
• Focus on core suite of IP assets including product (eg. Promax), platform (eg, ServiceNXT), solution (eg. Managed File Transfer) & tool (eg. RPA)
• Wipro HOLMES Artificial Intelligence PlatformTM has received strong adoption with multiple engagements. Key Wall Street customer deployed HOLMES for an eKYC solution
• We have filed for over 1,650 patents including many on HOLMES
• Acquired 4 companies Designit, Cellent, HealthPlan Services, Appirio and Infoserver over the last 24 months
• Wipro Ventures completed 4 minority investments in the last 12 months. We have 10 commercial engagements across our portfoliocompanies
• Continued to enhance our 360 degree alliances with key technology companies
• Engaged with academia in joint research programs.
• Aligned Consulting services with Digital unit
• Designit: unique design capabilities driving synergy wins for Wipro
• Opened digital pods in London, New York to serve global customers
• Dedicated Digital leaders in each vertical; ‘One Voice’ program to enable front-end across Wipro to pitch Digital services consistently to key customers
• In FY 17, we trained 39,600 employees. Overall, we now have 61,000 technical employees trained on Digital skills.
• Target a larger share of revenue led by non-linearity• Investments in Intellectual Property (IP).• Cognitive Intelligence Platform, Wipro HOLMESTM
• M&A and Wipro Ventures
• Alliances & Academia
• Other strategic partnerships
Invest for Future
• Internet of Everything• Software-Defined• Cyber-Security• Open Source
• Dedicated Units that are addressing the opportunity in emerging areas by delivering platforms, framework and solutions
• Horizon program for intrapreneurship

© 2017 Wipro wipro.com confidential 12
Winning together with strategic alliances
Joint Value Thought Leadership Executive Commitment
Wipro's WINNING TOGETHER approach is all about driving joint Go to Market initiatives in partnership with Strategic Alliances and help customers Do Business Better.
Wipro Strategic Alliances community helps in creating winning partnerships which offers mutual business growth opportunities, joint value driven by collaboration, executive commitment and thought leadership around future technologies.

© 2017 Wipro wipro.com confidential 13
Recognitions on sustainability front

© 2017 Wipro wipro.com confidential 14
Annexure – key highlights

© 2017 Wipro wipro.com confidential 15
Financial summary for the year ended march 31, 2017
All figures based on IFRS FY17 (₹ crores) YoY Growth
Gross Revenues 55,040 7.4%
Results from Operating Activities (EBIT) 9,388 -3.1%
Gross Cash is the sum of (i) cash and cash equivalents plus (ii) Investments – Current.For detailed reconciliations, please refer slide 11 in appendix1 crores=10 million
• IT Services Segment revenue in constant currency grew 7.0% YoY.
• The Board of Directors recommends issue of bonus shares in the ratio of 1:1
• Gross Cash position was ₹34,474 crores or $ 5.3 Billion.
• Cash generation was strong with operating cash flow at 109% of Net Income.
• The Board of Directors will consider a proposal for buyback of equity shares around July 2017

© 2017 Wipro wipro.com confidential 16
Financial summary for the quarter ended march 31, 2017
All figures based on IFRS Q417 (₹ crores) QoQ Growth
Gross Revenues 13,988 2.2%
Results from Operating Activities (EBIT) 2,483 6.9%
Margins for the quarter and year ended March 31, 2017 have been computed by dividing the segment results by an aggregate of Segment Revenue and Other Operating Income.1crore= 10million
• IT Services Segment revenue in constant currency grew 1.7% QoQ in line with guidance
• Our hedge book, as on March 31, 2017 stood at $2.5 Billion.
• IT Services Margin for the quarter was at 18.3%, flat as compared to Q3.
• In a quarter with volatile currency, IT Services Segment revenue on reported USD basis grew 2.7%.
• Digital Eco-system, which was 17.5% of IT Services revenues in Q1 has grown to 22.1% of IT Services revenues in Q-4.
© 2017 Wipro wipro.com confidential 17
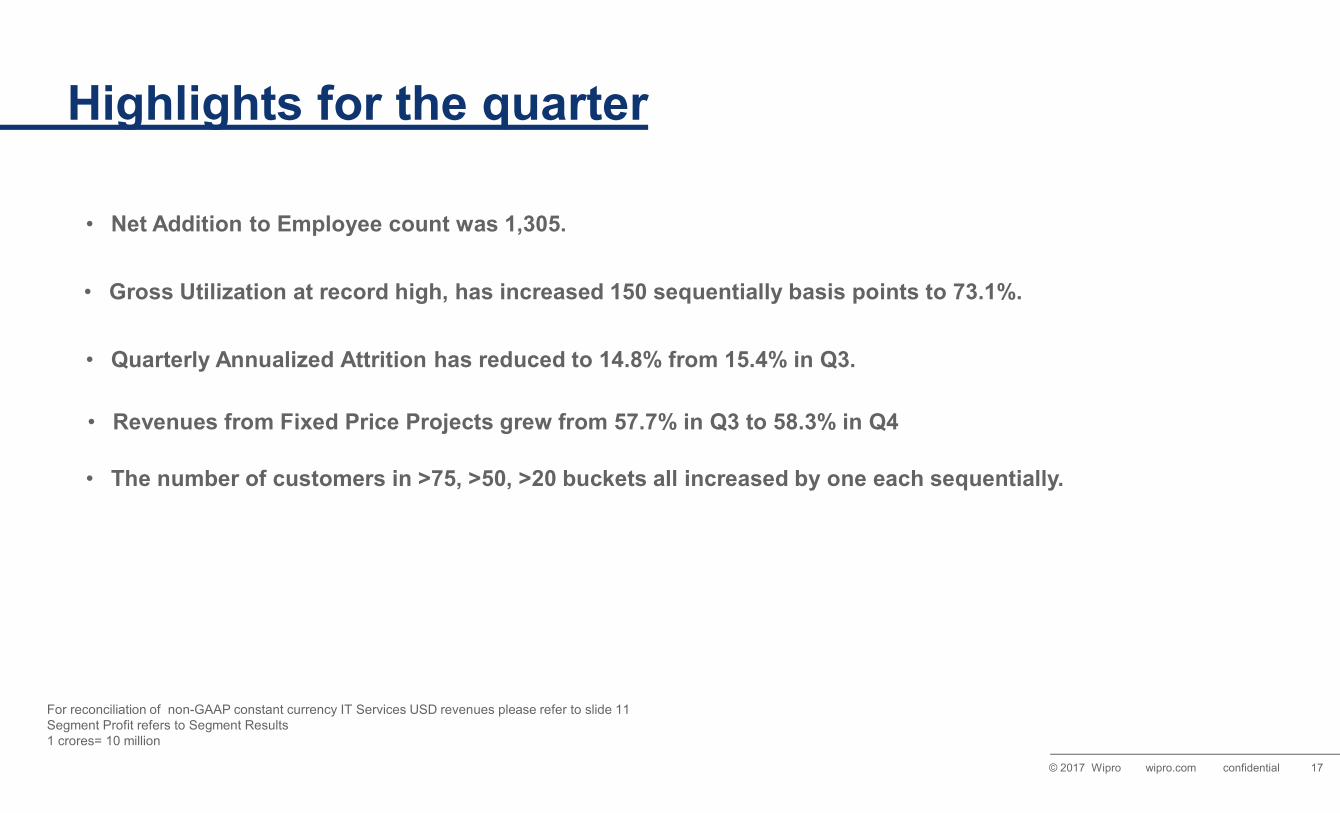
Highlights for the quarter
For reconciliation of non-GAAP constant currency IT Services USD revenues please refer to slide 11Segment Profit refers to Segment Results1 crores= 10 million
• Gross Utilization at record high, has increased 150 sequentially basis points to 73.1%.
• Net Addition to Employee count was 1,305.
• Quarterly Annualized Attrition has reduced to 14.8% from 15.4% in Q3.
• Revenues from Fixed Price Projects grew from 57.7% in Q3 to 58.3% in Q4
• The number of customers in >75, >50, >20 buckets all increased by one each sequentially.

© 2017 Wipro wipro.com confidential 18
Thank you

© 2017 Wipro wipro.com confidential 19
Reconciliation of Selected GAAP measures to Non-GAAP measures
WIPRO LIMITED AND SUBSIDIARIES
(Amounts in ₹crores)
As of
March 31, 2017
Computation of Gross cash position
Cash and cash equivalents 5,271
Investments - Current 29,203
Total 34,474
WIPRO LIMITED AND SUBSIDIARIES(Amounts in ₹crores)
Three months ended
March 31, 2017Profit for the period [A] 2,261
Computation of Free cash flowNet cash generated from operating activities 2,559Add/(deduct) cash inflow/(outflow) on :
Purchase of Property, plant and equipment(415)
Proceeds from sale of Property, plant and equipment38
Free cash flow [B] 2,182
Free cash flow as a percentage of Net income [B/A] 96%
Reconciliation of Non-GAAP Constant Currency IT Services Revenue to IT Services Revenue as per IFRS ($MN)
Three months ended March 31, 2017 Three months ended March 31, 2017
IT Services Revenue as per IFRS $1,954.6 IT Services Revenue as per IFRS $1,954.6
Effect of Foreign currency exchange movement $ (19.3) Effect of Foreign currency exchange movement $ 25.2
Non-GAAP Constant Currency IT Services Revenue based on previous quarter exchange rates $ 1,935.3
Non-GAAP Constant Currency IT Services Revenue based on exchange rates of comparable period in previous year $1,979.8
Reconciliation of Non-GAAP constant currency Revenue
Reconciliation of Gross Cash Reconciliation of Free Cash Flow

© 2017 Wipro wipro.com confidential 20
Reconciliation of Selected GAAP measures to Non-GAAP measures
Reconciliation of Non-GAAP constant currency Revenue
Reconciliation of Gross Cash Reconciliation of Free Cash Flow
WIPRO LIMITED AND SUBSIDIARIES
(Amounts in ₹ crores)
As of
March 31, 2017Computation of Gross cash positionCash and cash equivalents 5,271 Investments - Current 29,203
Total 34,474
WIPRO LIMITED AND SUBSIDIARIES
(Amounts in ₹ crores)
For the year ended March 31, 2017
Profit for the period [A] 8,490
Computation of Free cash flowNet cash generated from operating activities 9,277Add/(deduct) cash inflow/(outflow) on :
Purchase of Property, plant and equipment (2,085)
Proceeds from sale of Property, plant and equipment121
Free cash flow [B] 7,313
Free cash flow as a percentage of Net income [B/A]
86%
Reconciliation of Non-GAAP Constant Currency IT Services Revenue to IT Services Revenue as per IFRS ($MN)
Year ended March 31, 2017
IT Services Revenue as per IFRS $7,704.5
Effect of Foreign currency exchange movement $ 155.3
Non-GAAP Constant Currency IT Services Revenue based on previous year exchange rates $ 7,859.8