Embed Size (px)
Citation preview
1
March 1, 2017
Fourth Quarter and Fiscal Year 2017 Financial Results
2
Investor Disclosure: Forward‐Looking Statements and Non‐GAAP Measures• This presentation contains forward‐looking statements that involve risks and uncertainties, including statements regarding
Box’s expectations regarding the size of its market opportunity, the demand for its products, its ability to scale its business and drive operating leverage, its long‐term revenue target expectations, its ability to achieve and maintain positive free cash flow for the full fiscal year ending January 31, 2018, profitability, recent and planned product introductions and enhancements, benefits of such product introductions and enhancements, and success of strategic partnerships, as well as expectations regarding its revenue, billings, GAAP and non‐GAAP earnings per share, the related components of GAAP and non‐GAAP earnings per share, and weighted average basic and diluted outstanding share count expectations for Box’s fiscal first quarter and full fiscal year 2018.
• There are a significant number of factors that could cause actual results to differ materially from statements made in this press release, including: (1) adverse changes in general economic or market conditions; (2) delays or reductions in information technology spending; (3) factors related to Box’s intensely competitive market, including but not limited to pricing pressures, industry consolidation, entry of new competitors and new applications and marketing initiatives by Box’s current or future competitors; (4) the development of the Cloud Content Management market; (5) risks associated with Box’s ability to manage its rapid growth effectively; (6) Box’s limited operating history, which makes it difficult to predict future results; (7) the risk that Box’s customers do not renew their subscriptions, expand their use of Box’s services, or adopt new products offered by Box; (8) Box’s ability to provide timely and successful enhancements, new features and modifications to its platform and services; (9) actual or perceived security vulnerabilities in Box’s services or any breaches of Box’s security controls; and (10) Box’s ability to realize the expected benefits of its third‐party partnerships. Further information on these and other factors that could affect the forward‐looking statements we make in this presentation can be found in the documents that we file with or furnish to the US Securities and Exchange Commission, including our most recent Quarterly Report on Form 10‐Q filed for the fiscal quarter ended October 31, 2016.
• You should not rely on any forward‐looking statements, and we assume no obligation, nor do we intend, to update them. All information in this presentation is as of March 1, 2017. This presentation contains non‐GAAP financial measures and key metrics relating to the company's past and expected future performance. You can find the reconciliation of these measures to the nearest comparable GAAP measures in the appendix at the end of this presentation. You can also find information regarding our use of non‐GAAP financial measures in our earnings release dated March 1, 2017.
3
All your work, together
4
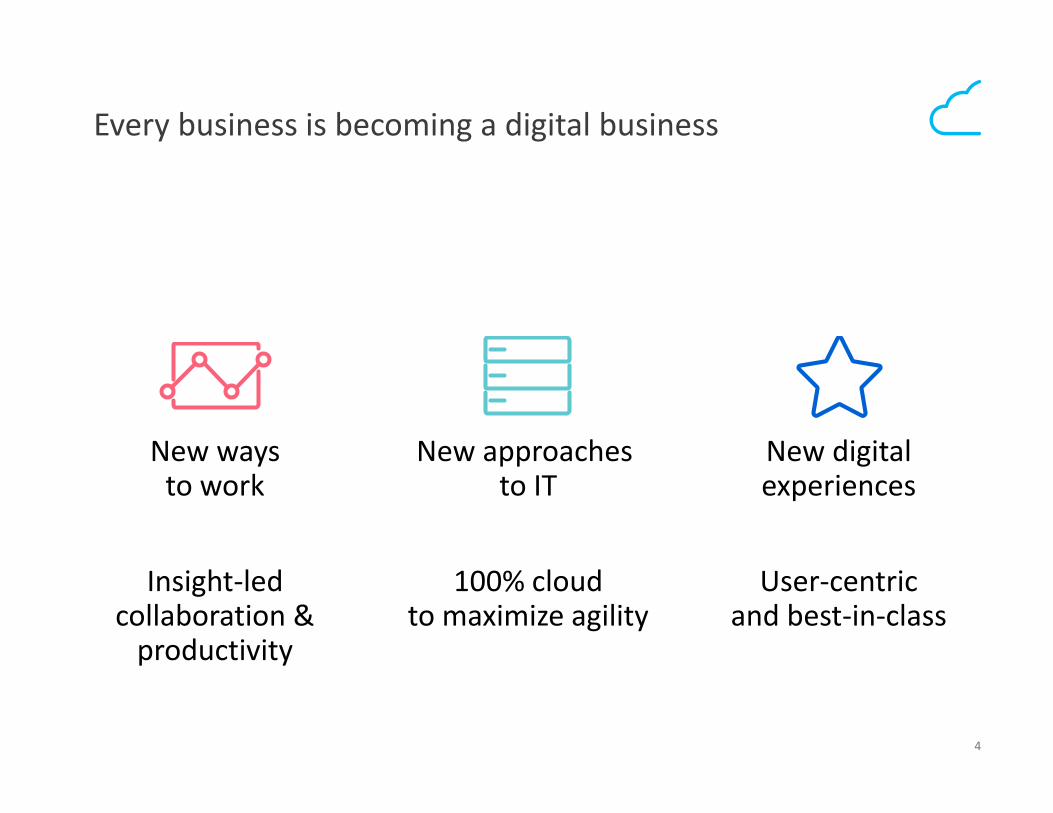
Every business is becoming a digital business
New ways to work
Insight‐led collaboration & productivity
New approachesto IT
100% cloud to maximize agility
New digital experiences
User‐centric and best‐in‐class
5
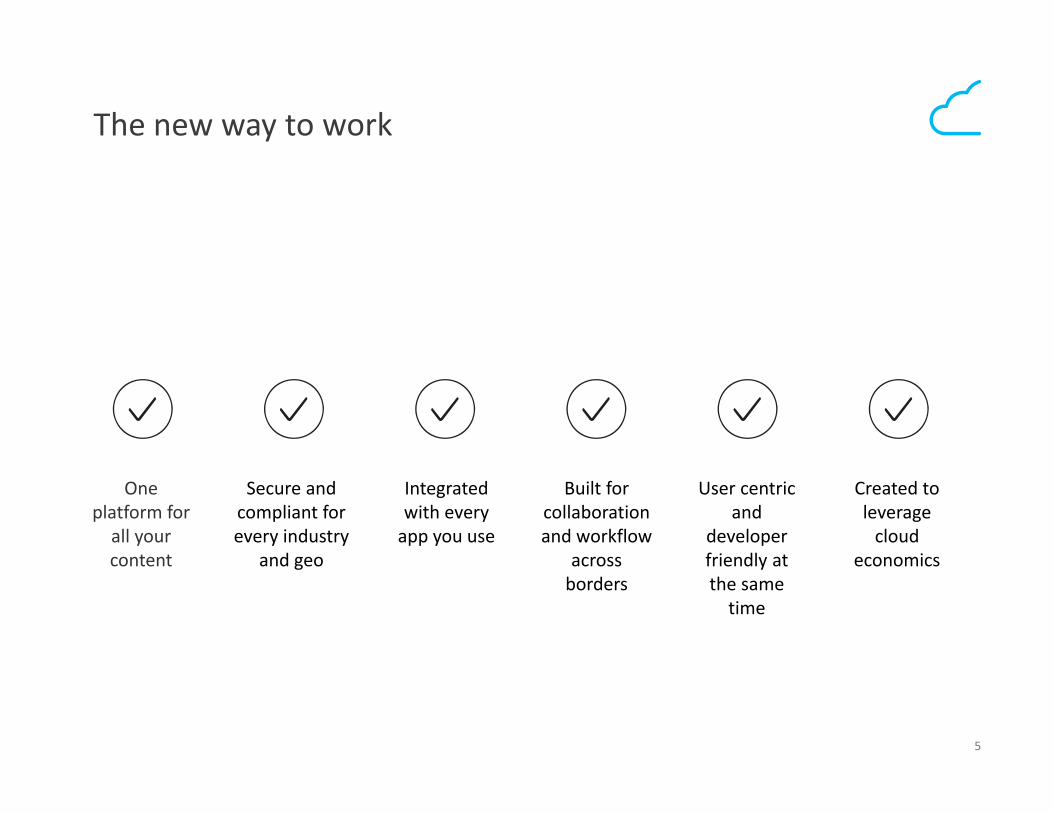
The new way to work
One platform for all your content
Secure and compliant for every industry
and geo
Integrated with every app you use
Built for collaboration and workflow
across borders
User centric and
developer friendly at the same time
Created to leverage cloud
economics
6
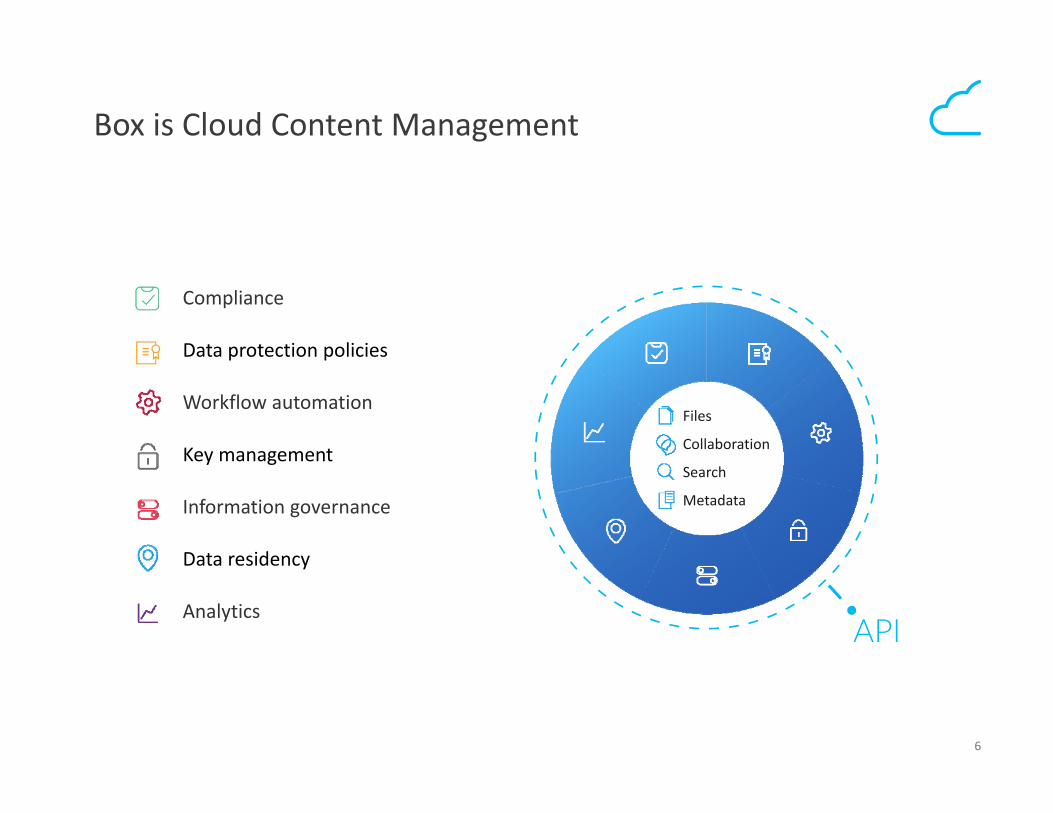
Box is Cloud Content Management
Compliance
Data protection policies
Workflow automation
Key management
Information governance
Data residency
AnalyticsAPI
Files
Collaboration
Search
Metadata
7
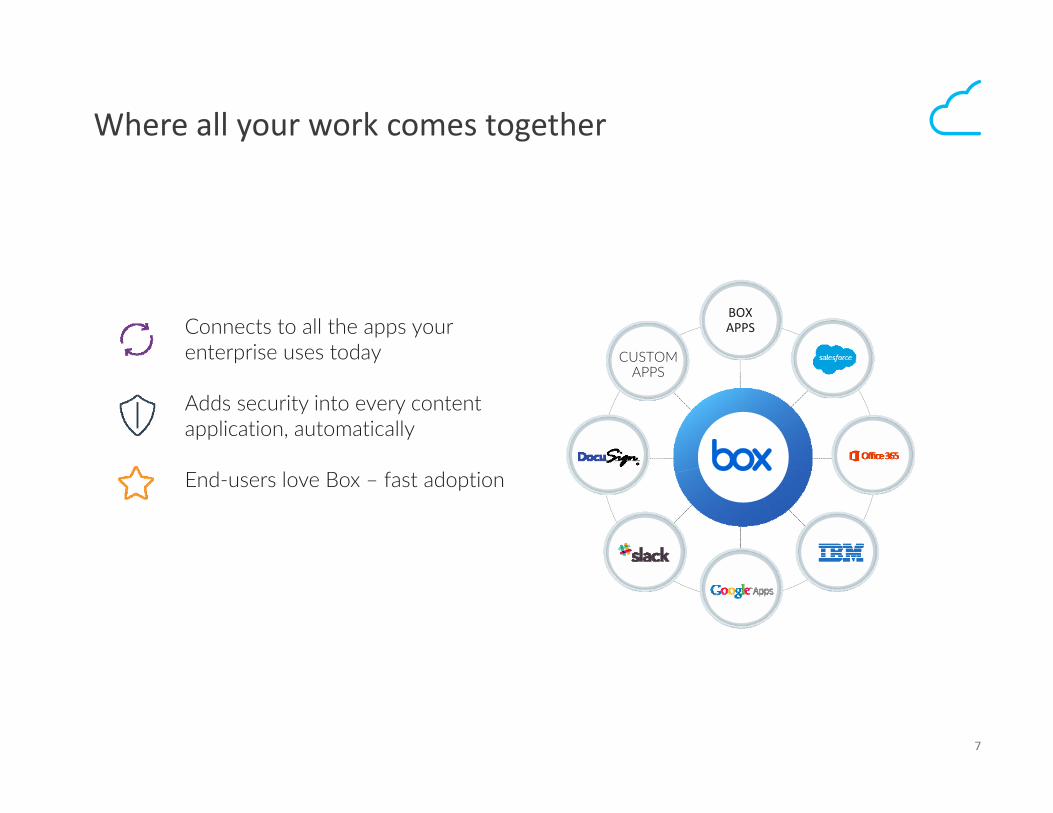
Where all your work comes together
Connects to all the apps your enterprise uses today
Adds security into every content application, automatically
End‐users love Box – fast adoption
CUSTOM APPS
BOX APPS
8
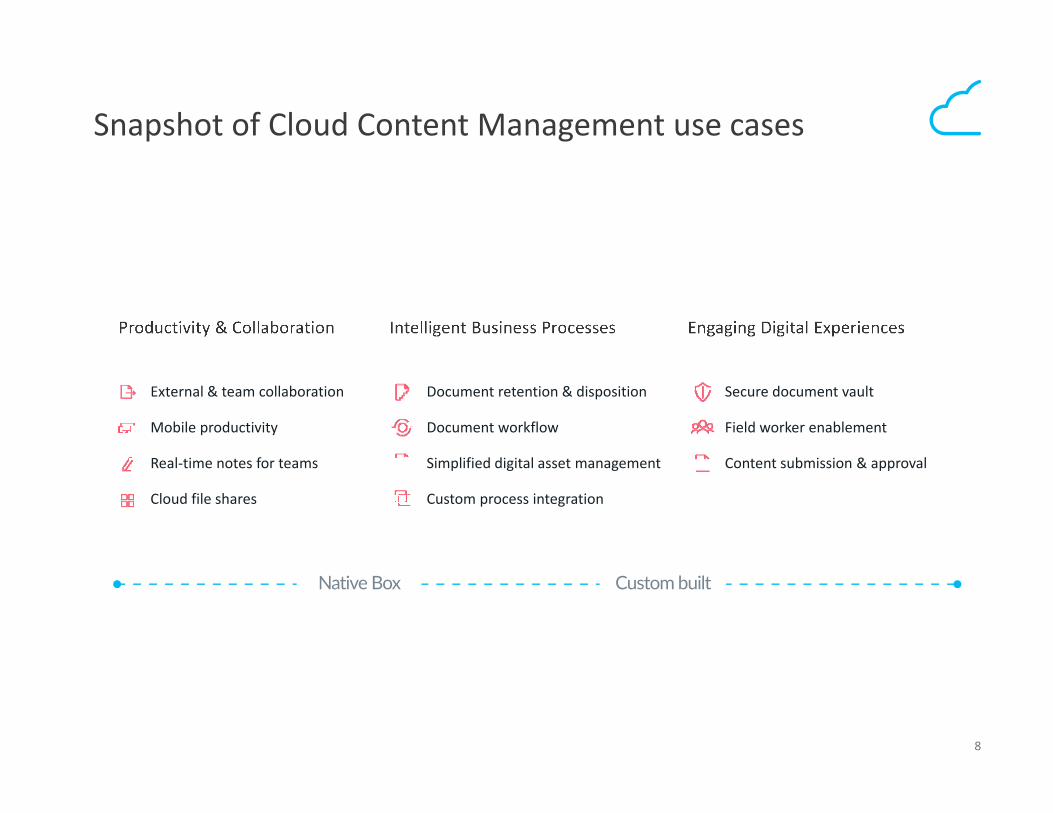
Snapshot of Cloud Content Management use cases
Secure document vault
Field worker enablement
Content submission & approval
Document retention & disposition
Document workflow
Simplified digital asset management
Custom process integration
External & team collaboration
Mobile productivity
Real‐time notes for teams
Cloud file shares
Custom builtNative Box
9
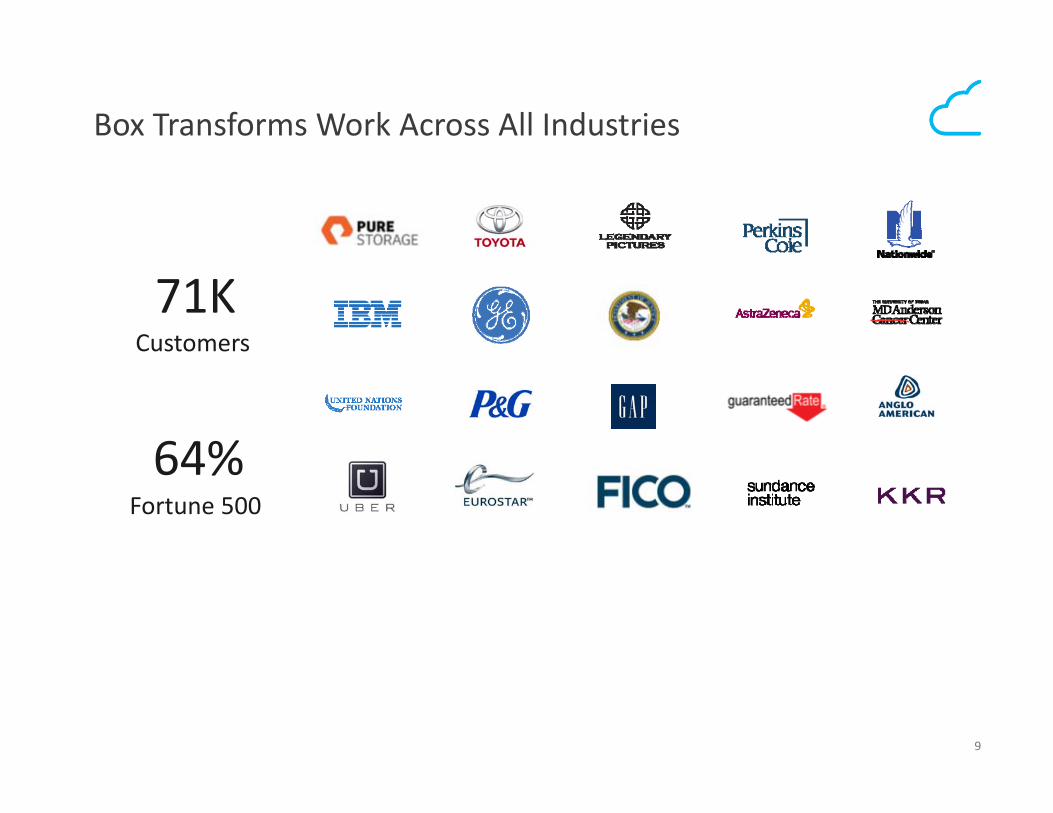
Fortune 50064%
71KCustomers
Box Transforms Work Across All Industries
10
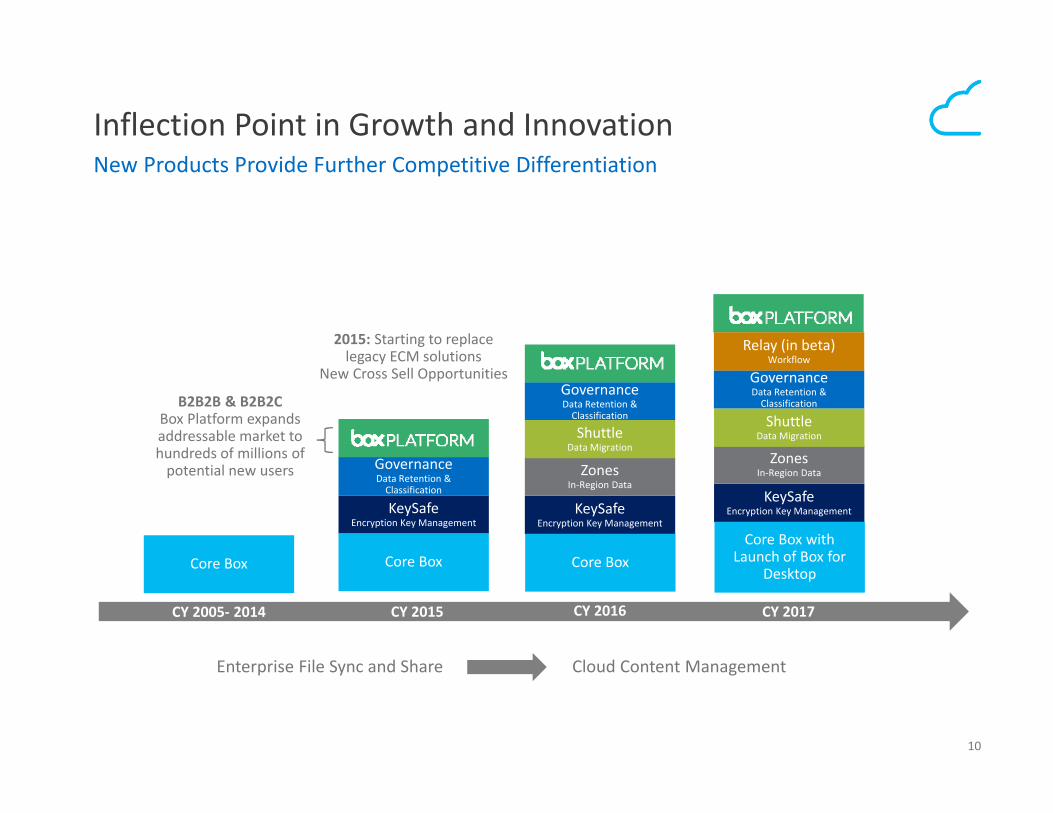
Enterprise File Sync and Share Cloud Content Management
Inflection Point in Growth and InnovationNew Products Provide Further Competitive Differentiation
Core Box
CY 2005‐ 2014
2015: Starting to replace legacy ECM solutions
New Cross Sell Opportunities
B2B2B & B2B2CBox Platform expands addressable market to hundreds of millions of potential new users
CY 2016
KeySafeEncryption Key Management
GovernanceData Retention & Classification
Core Box
ZonesIn‐Region Data
ShuttleData Migration
KeySafeEncryption Key Management
GovernanceData Retention & Classification
CY 2015
Core Box
CY 2017
KeySafeEncryption Key Management
GovernanceData Retention & Classification
Core Box with Launch of Box for
Desktop
ZonesIn‐Region Data
ShuttleData Migration
Relay (in beta)Workflow
11
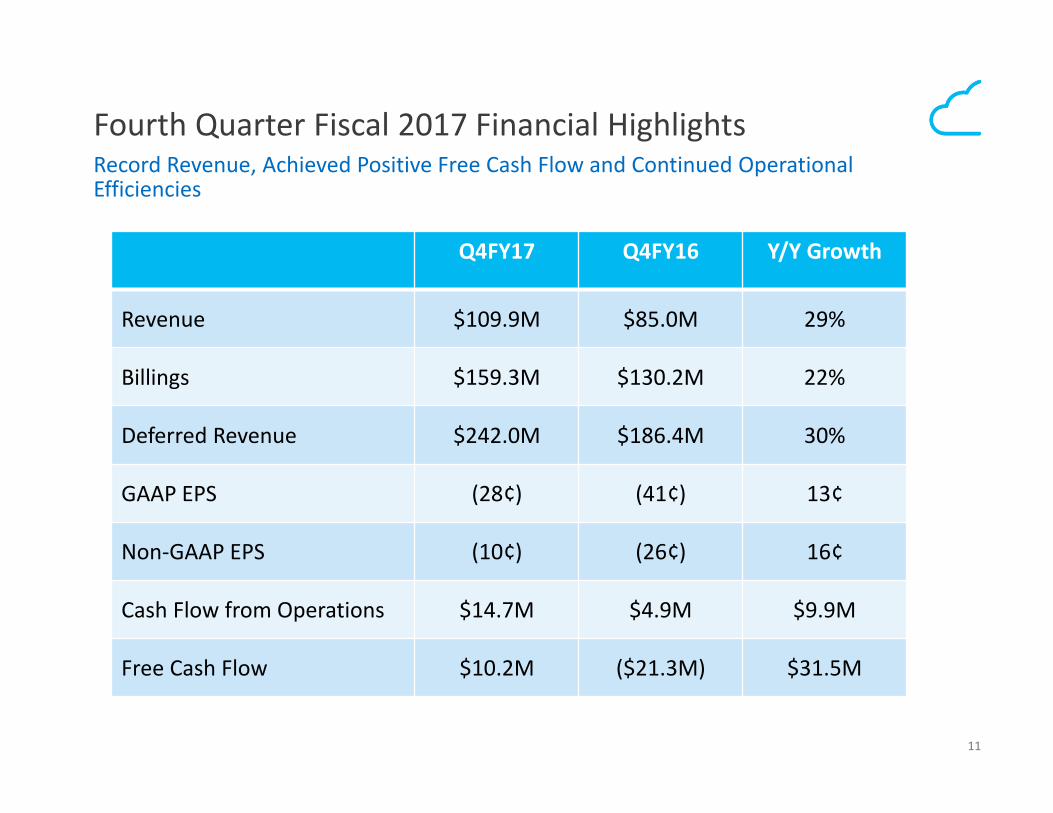
Fourth Quarter Fiscal 2017 Financial HighlightsRecord Revenue, Achieved Positive Free Cash Flow and Continued Operational Efficiencies
Q4FY17 Q4FY16 Y/Y Growth
Revenue $109.9M $85.0M 29%
Billings $159.3M $130.2M 22%
Deferred Revenue $242.0M $186.4M 30%
GAAP EPS (28¢) (41¢) 13¢
Non‐GAAP EPS (10¢) (26¢) 16¢
Cash Flow from Operations $14.7M $4.9M $9.9M
Free Cash Flow $10.2M ($21.3M) $31.5M
12
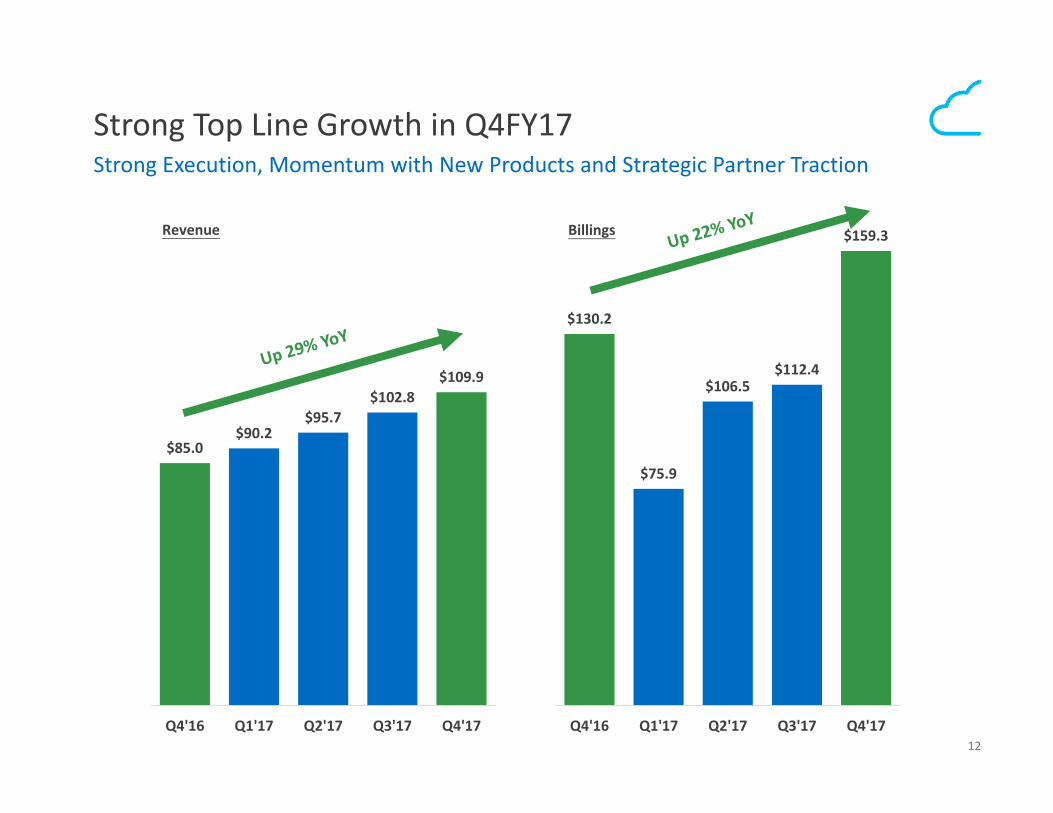
Revenue
Strong Top Line Growth in Q4FY17Strong Execution, Momentum with New Products and Strategic Partner Traction
$85.0$90.2
$95.7$102.8
$109.9
Q4'16 Q1'17 Q2'17 Q3'17 Q4'17
Billings
$130.2
$75.9
$106.5$112.4
$159.3
Q4'16 Q1'17 Q2'17 Q3'17 Q4'17
13
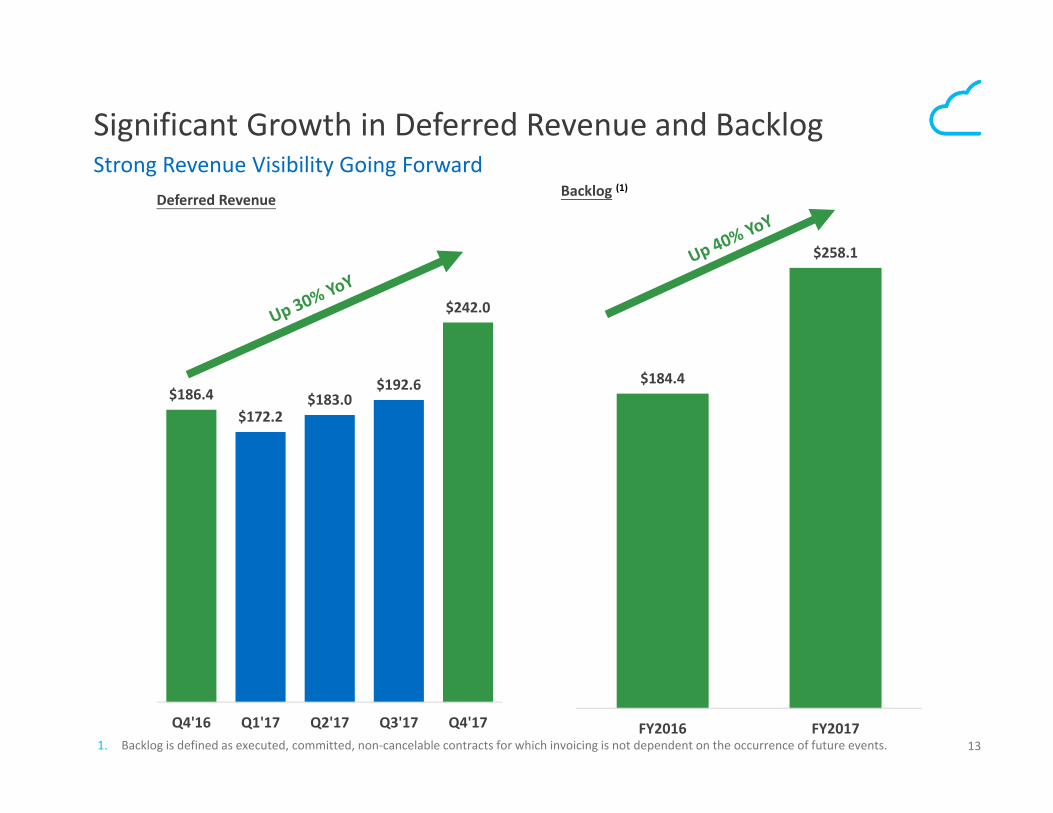
Significant Growth in Deferred Revenue and BacklogStrong Revenue Visibility Going Forward
$186.4$172.2
$183.0$192.6
$242.0
Q4'16 Q1'17 Q2'17 Q3'17 Q4'17
Deferred Revenue Backlog (1)
$184.4
$258.1
FY2016 FY20171. Backlog is defined as executed, committed, non‐cancelable contracts for which invoicing is not dependent on the occurrence of future events.
14
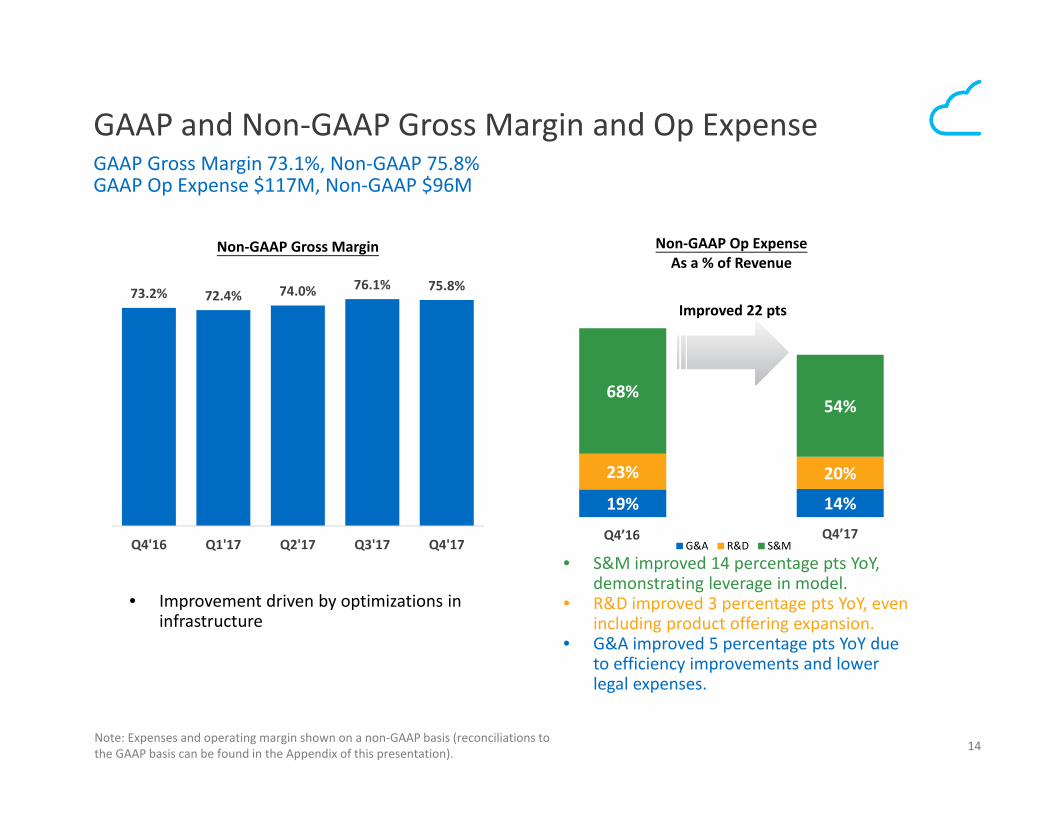
19% 14%
23% 20%
68%54%
Non‐GAAP Op Expense As a % of Revenue
G&A R&D S&MQ4’16 Q4’17
GAAP and Non‐GAAP Gross Margin and Op ExpenseGAAP Gross Margin 73.1%, Non‐GAAP 75.8%GAAP Op Expense $117M, Non‐GAAP $96M
Note: Expenses and operating margin shown on a non‐GAAP basis (reconciliations to the GAAP basis can be found in the Appendix of this presentation).
• S&M improved 14 percentage pts YoY, demonstrating leverage in model.
• R&D improved 3 percentage pts YoY, even including product offering expansion.
• G&A improved 5 percentage pts YoY due to efficiency improvements and lower legal expenses.
73.2% 72.4% 74.0% 76.1% 75.8%
Q4'16 Q1'17 Q2'17 Q3'17 Q4'17
Non‐GAAP Gross Margin
Improved 22 pts
• Improvement driven by optimizations in infrastructure
15
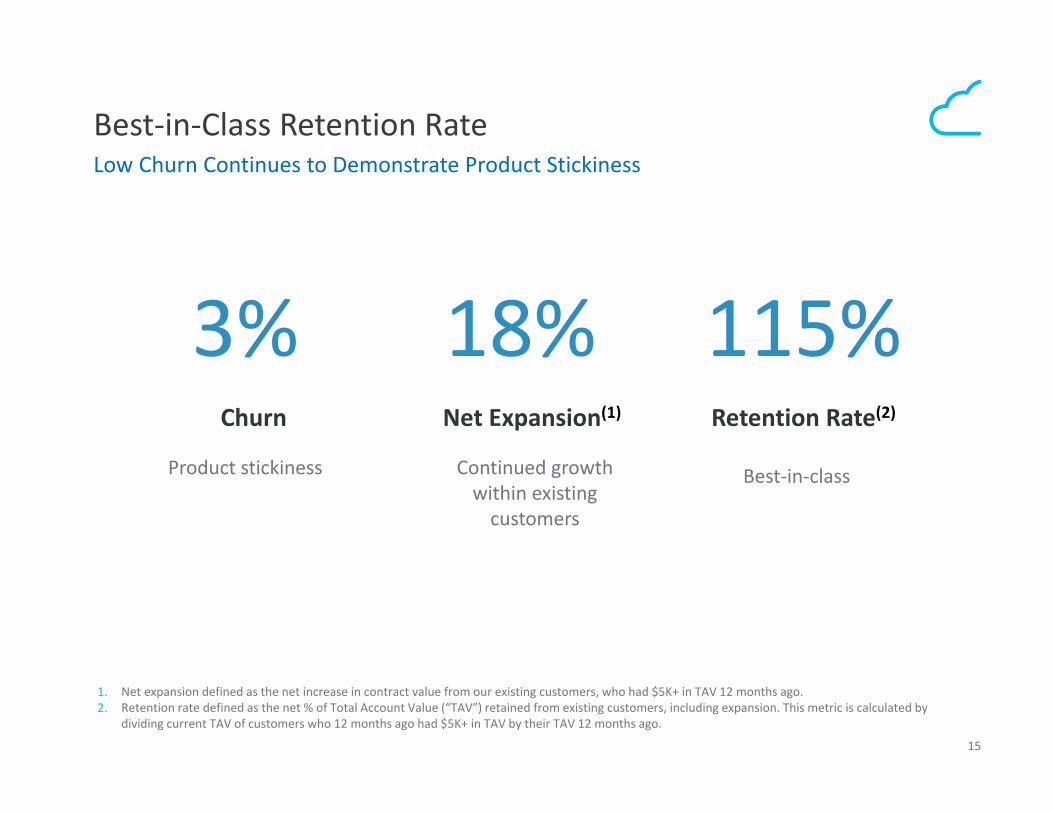
Best‐in‐Class Retention RateLow Churn Continues to Demonstrate Product Stickiness
1. Net expansion defined as the net increase in contract value from our existing customers, who had $5K+ in TAV 12 months ago.2. Retention rate defined as the net % of Total Account Value (“TAV”) retained from existing customers, including expansion. This metric is calculated by
dividing current TAV of customers who 12 months ago had $5K+ in TAV by their TAV 12 months ago.
Retention Rate(2)
115%18%3%Net Expansion(1)Churn
Product stickiness Continued growth within existing customers
Best‐in‐class
16
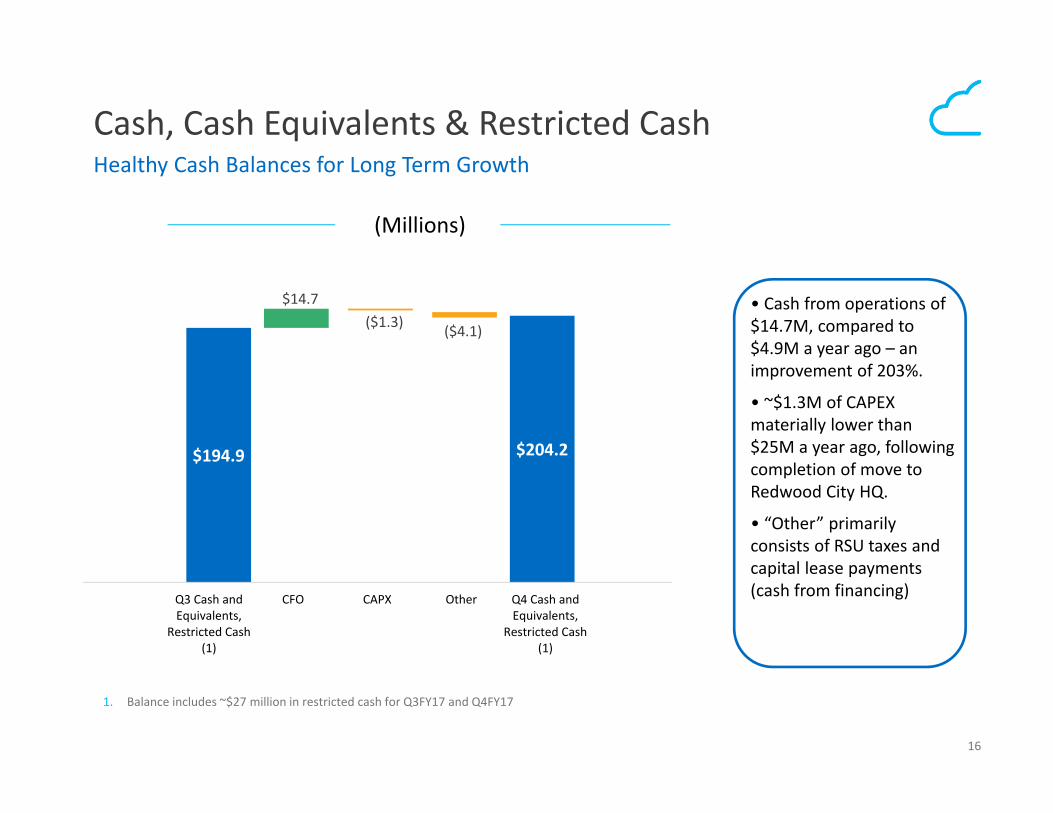
$204.2
$14.7($1.3) ($4.1)
$194.9
Q3 Cash andEquivalents,
Restricted Cash(1)
CFO CAPX Other Q4 Cash andEquivalents,
Restricted Cash(1)
Cash, Cash Equivalents & Restricted CashHealthy Cash Balances for Long Term Growth
(Millions)
1. Balance includes ~$27 million in restricted cash for Q3FY17 and Q4FY17
• Cash from operations of $14.7M, compared to $4.9M a year ago – an improvement of 203%.
• ~$1.3M of CAPEX materially lower than $25M a year ago, following completion of move to Redwood City HQ.
• “Other” primarily consists of RSU taxes and capital lease payments (cash from financing)
17
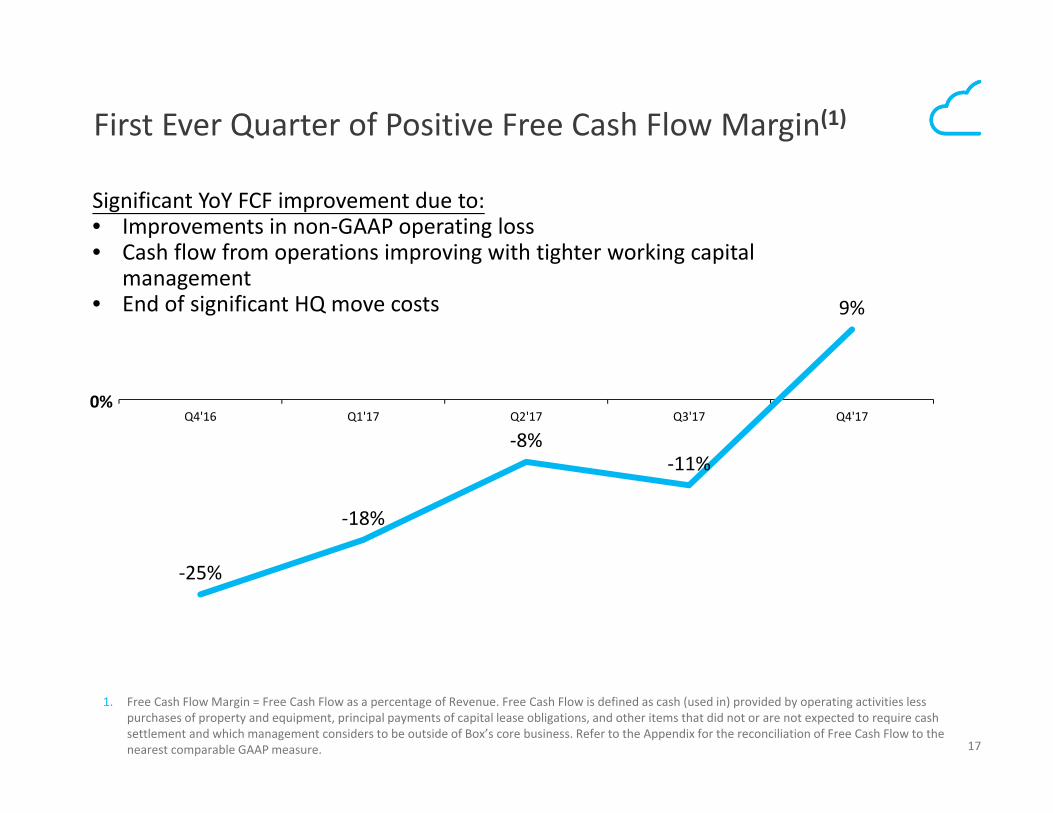
‐25%
‐18%
‐8%‐11%
9%
Q4'16 Q1'17 Q2'17 Q3'17 Q4'170%
First Ever Quarter of Positive Free Cash Flow Margin(1)
Significant YoY FCF improvement due to:• Improvements in non‐GAAP operating loss• Cash flow from operations improving with tighter working capital
management• End of significant HQ move costs
1. Free Cash Flow Margin = Free Cash Flow as a percentage of Revenue. Free Cash Flow is defined as cash (used in) provided by operating activities less purchases of property and equipment, principal payments of capital lease obligations, and other items that did not or are not expected to require cash settlement and which management considers to be outside of Box’s core business. Refer to the Appendix for the reconciliation of Free Cash Flow to the nearest comparable GAAP measure.
18
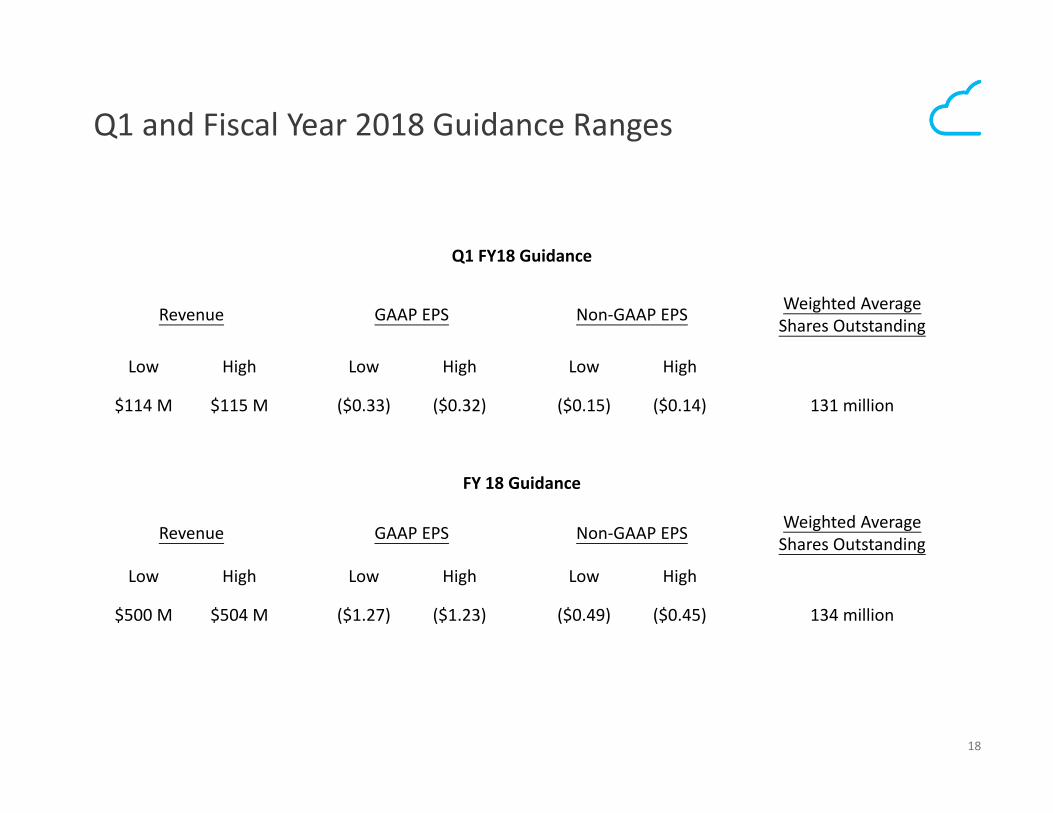
Q1 and Fiscal Year 2018 Guidance Ranges
Q1 FY18 Guidance
Revenue GAAP EPS Non‐GAAP EPS Weighted Average Shares Outstanding
Low High Low High Low High
$114 M $115 M ($0.33) ($0.32) ($0.15) ($0.14) 131 million
FY 18 Guidance
Revenue GAAP EPS Non‐GAAP EPS Weighted Average Shares Outstanding
Low High Low High Low High
$500 M $504 M ($1.27) ($1.23) ($0.49) ($0.45) 134 million
19
Appendix
20
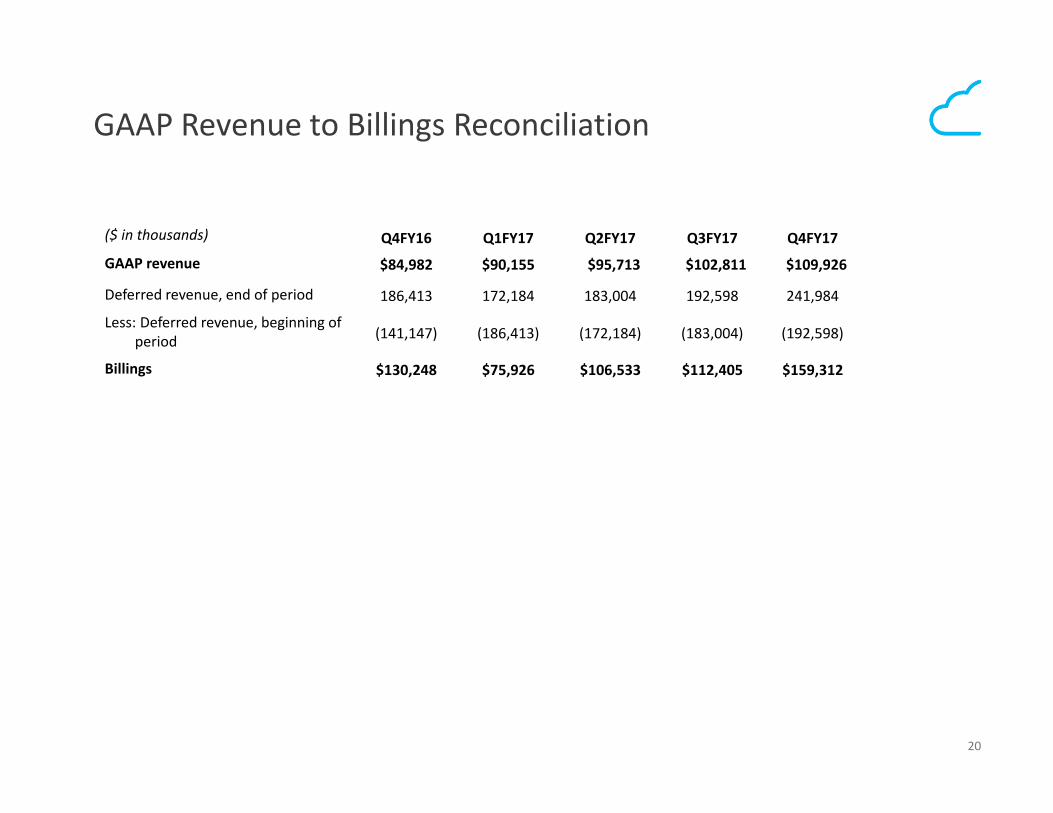
GAAP Revenue to Billings Reconciliation
($ in thousands) Q4FY16 Q1FY17 Q2FY17 Q3FY17 Q4FY17
GAAP revenue $84,982 $90,155 $95,713 $102,811 $109,926
Deferred revenue, end of period 186,413 172,184 183,004 192,598 241,984
Less: Deferred revenue, beginning of period (141,147) (186,413) (172,184) (183,004) (192,598)
Billings $130,248 $75,926 $106,533 $112,405 $159,312
21
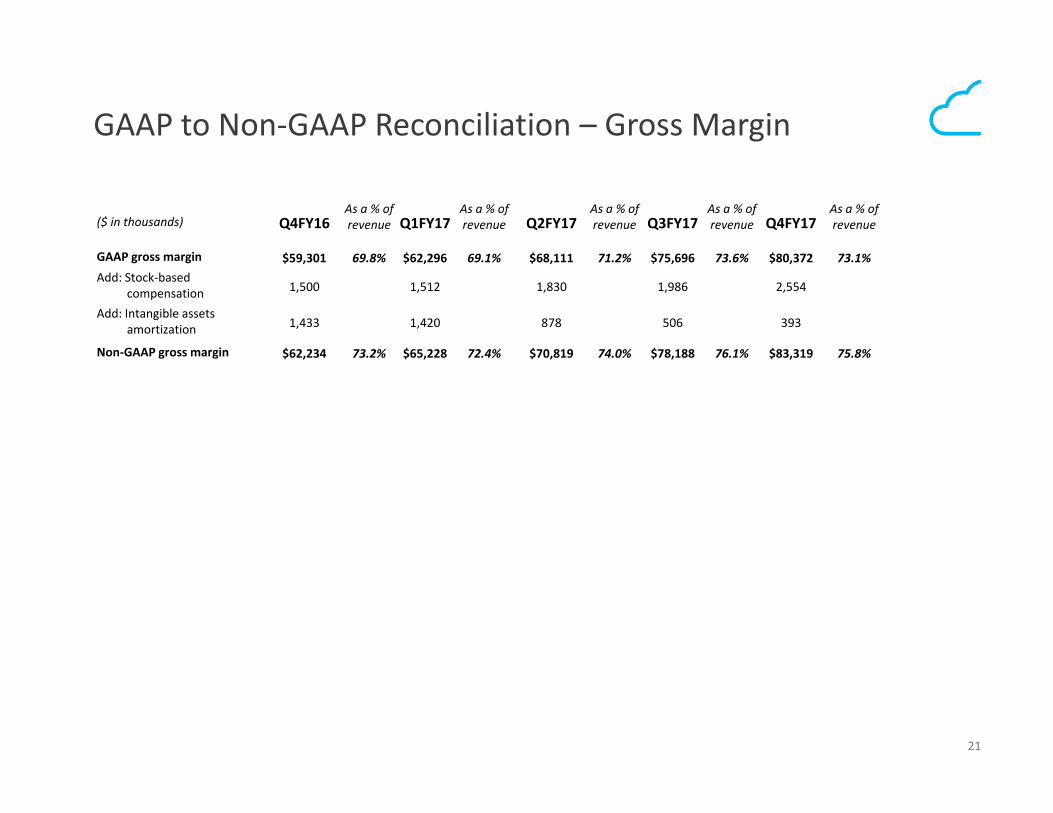
GAAP to Non‐GAAP Reconciliation – Gross Margin
($ in thousands) Q4FY16As a % of revenue Q1FY17
As a % of revenue Q2FY17
As a % of revenue Q3FY17
As a % of revenue Q4FY17
As a % of revenue
GAAP gross margin $59,301 69.8% $62,296 69.1% $68,111 71.2% $75,696 73.6% $80,372 73.1%Add: Stock‐based
compensation 1,500 1,512 1,830 1,986 2,554
Add: Intangible assets amortization 1,433 1,420 878 506 393
Non‐GAAP gross margin $62,234 73.2% $65,228 72.4% $70,819 74.0% $78,188 76.1% $83,319 75.8%
22
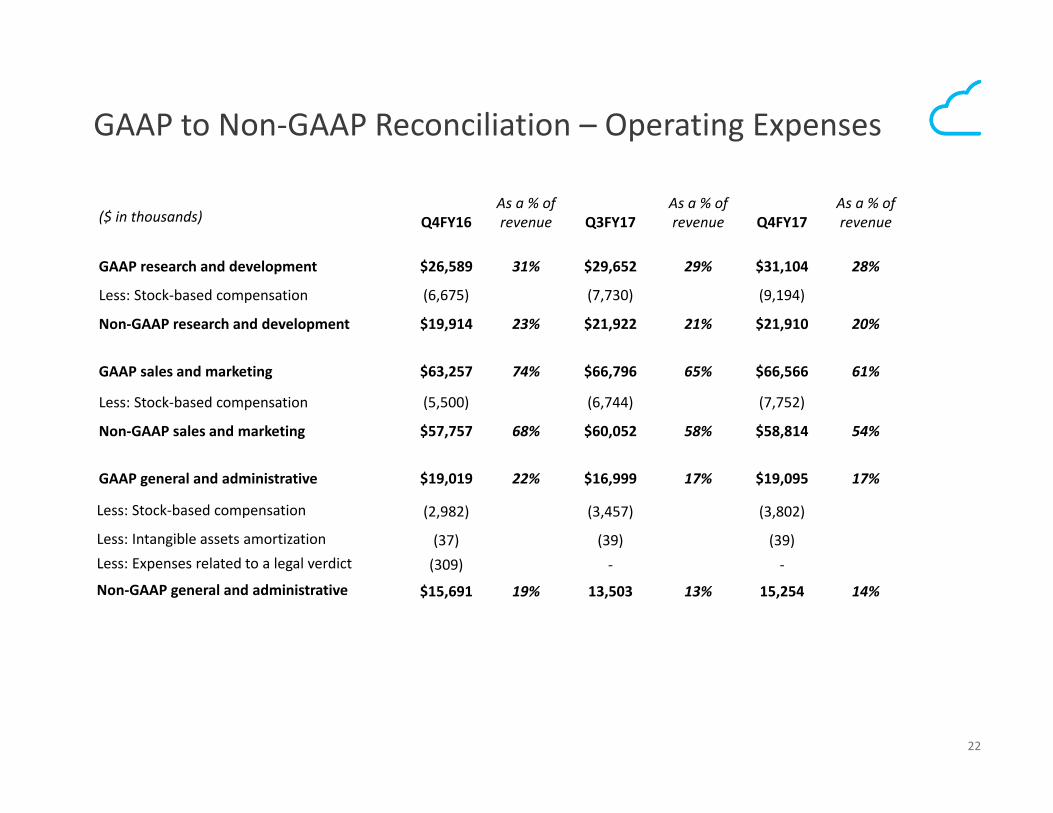
GAAP to Non‐GAAP Reconciliation – Operating Expenses
($ in thousands) Q4FY16As a % of revenue Q3FY17
As a % of revenue Q4FY17
As a % of revenue
GAAP research and development $26,589 31% $29,652 29% $31,104 28%
Less: Stock‐based compensation (6,675) (7,730) (9,194)
Non‐GAAP research and development $19,914 23% $21,922 21% $21,910 20%
GAAP sales and marketing $63,257 74% $66,796 65% $66,566 61%
Less: Stock‐based compensation (5,500) (6,744) (7,752)
Non‐GAAP sales and marketing $57,757 68% $60,052 58% $58,814 54%
GAAP general and administrative $19,019 22% $16,999 17% $19,095 17%
Less: Stock‐based compensation (2,982) (3,457) (3,802)
Less: Intangible assets amortization (37) (39) (39)Less: Expenses related to a legal verdict (309) ‐ ‐
Non‐GAAP general and administrative $15,691 19% 13,503 13% 15,254 14%
23
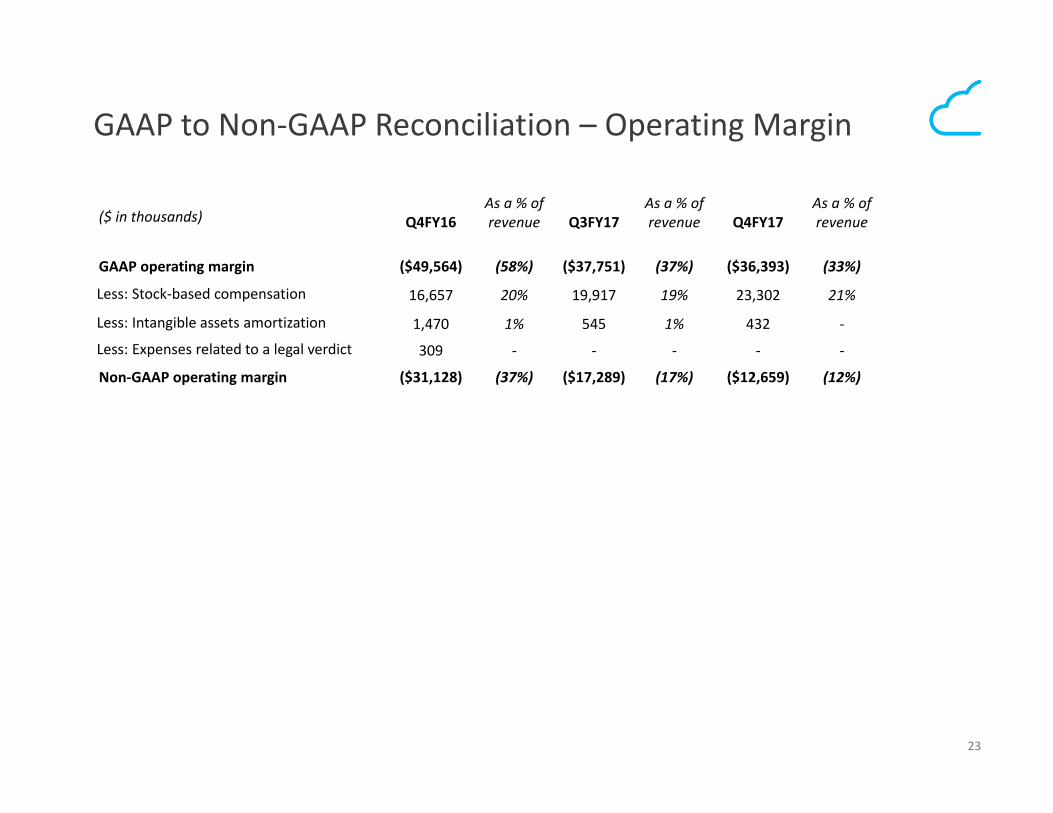
GAAP to Non‐GAAP Reconciliation – Operating Margin
($ in thousands) Q4FY16As a % of revenue Q3FY17
As a % of revenue Q4FY17
As a % of revenue
GAAP operating margin ($49,564) (58%) ($37,751) (37%) ($36,393) (33%)
Less: Stock‐based compensation 16,657 20% 19,917 19% 23,302 21%
Less: Intangible assets amortization 1,470 1% 545 1% 432 ‐
Less: Expenses related to a legal verdict 309 ‐ ‐ ‐ ‐ ‐
Non‐GAAP operating margin ($31,128) (37%) ($17,289) (17%) ($12,659) (12%)
24
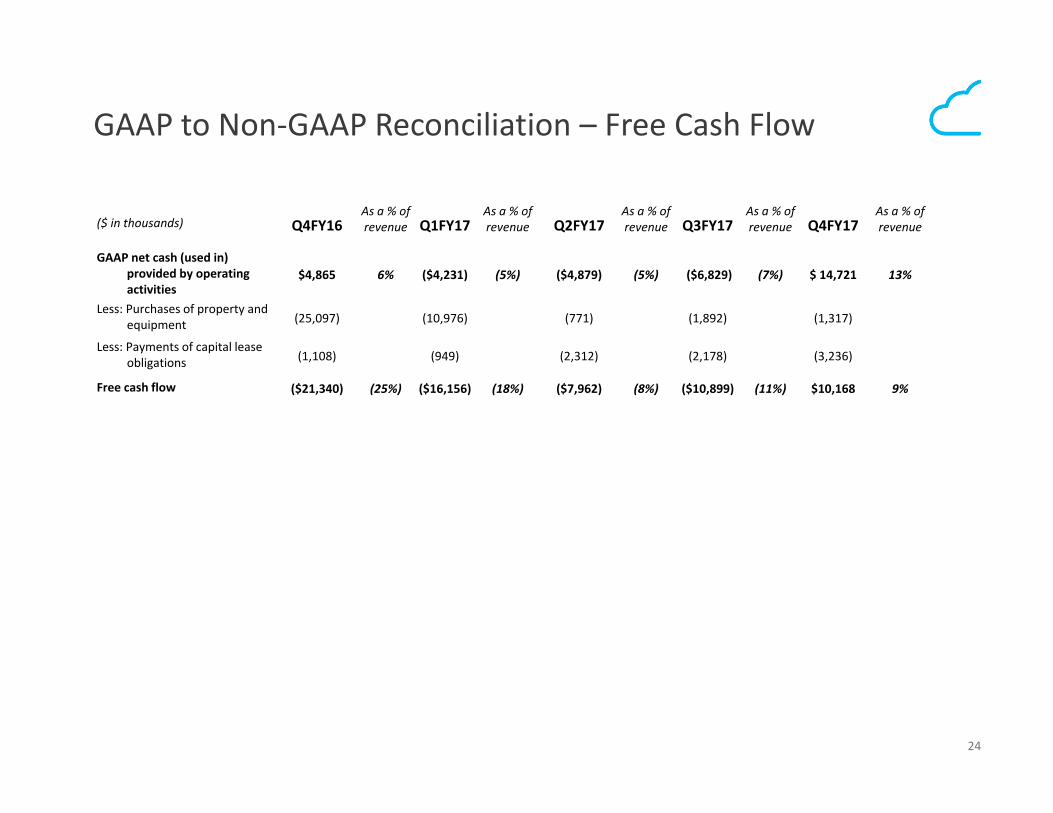
GAAP to Non‐GAAP Reconciliation – Free Cash Flow
($ in thousands) Q4FY16As a % of revenue Q1FY17
As a % of revenue Q2FY17
As a % of revenue Q3FY17
As a % of revenue Q4FY17
As a % of revenue
GAAP net cash (used in) provided by operating activities
$4,865 6% ($4,231) (5%) ($4,879) (5%) ($6,829) (7%) $ 14,721 13%
Less: Purchases of property and equipment (25,097) (10,976) (771) (1,892) (1,317)
Less: Payments of capital lease obligations (1,108) (949) (2,312) (2,178) (3,236)
Free cash flow ($21,340) (25%) ($16,156) (18%) ($7,962) (8%) ($10,899) (11%) $10,168 9%
25
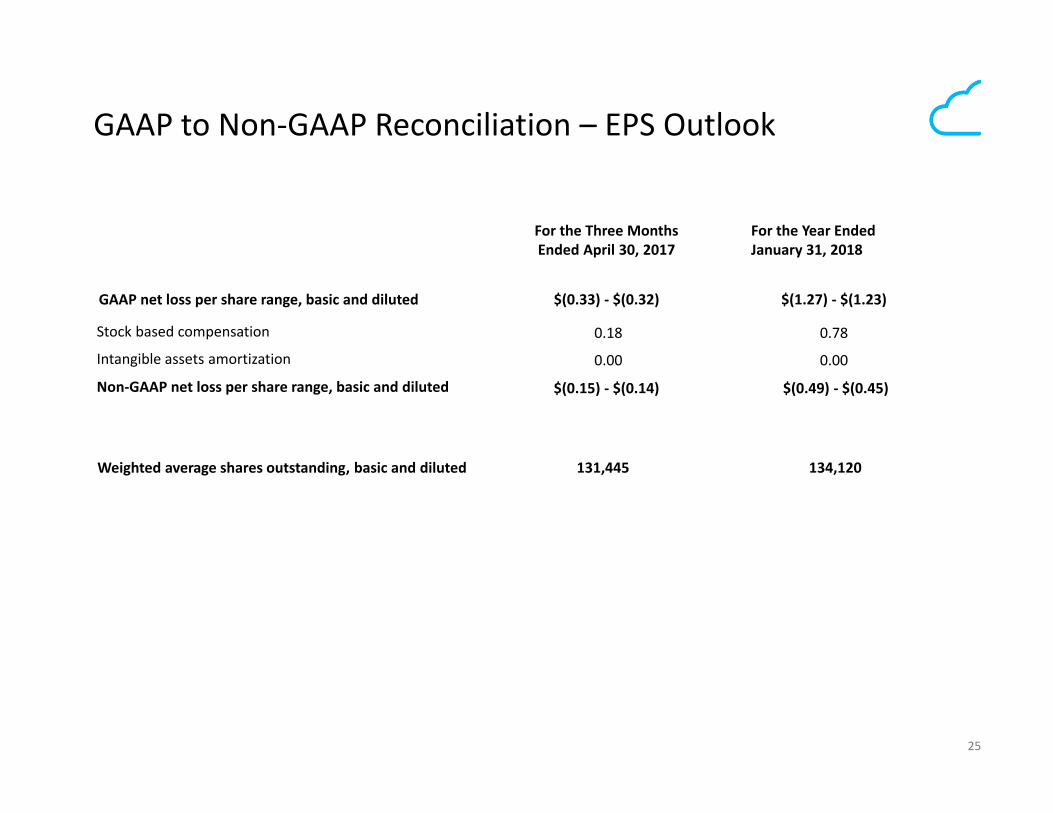
GAAP to Non‐GAAP Reconciliation – EPS Outlook
For the Three Months Ended April 30, 2017
For the Year Ended January 31, 2018
GAAP net loss per share range, basic and diluted $(0.33) ‐ $(0.32) $(1.27) ‐ $(1.23)
Stock based compensation 0.18 0.78
Intangible assets amortization 0.00 0.00
Non‐GAAP net loss per share range, basic and diluted $(0.15) ‐ $(0.14) $(0.49) ‐ $(0.45)
Weighted average shares outstanding, basic and diluted 131,445 134,120