Embed Size (px)
Citation preview

Fourth Quarter 2015
Investor Update

Caution re: Forward-looking Statements
2
This presentation provides management with the opportunity to discuss
the financial performance and condition of Home Capital Group Inc. and
Home Trust Company and, as such may contain forward-looking
information about strategies and expected financial results. Various
factors, many difficult to predict and to control, could cause actual results
to differ materially from results projected in forward-looking statements.
Accordingly, the audience is cautioned against undue reliance on these
remarks.

Fourth Quarter 2015
3
• Performance Against Mid‐Term Targets
• Financial Performance
• Capital Management
• Risk Management
• 2016 Outlook
Agenda

Performance Against Mid-Term Targets
Fourth Quarter 2015
4
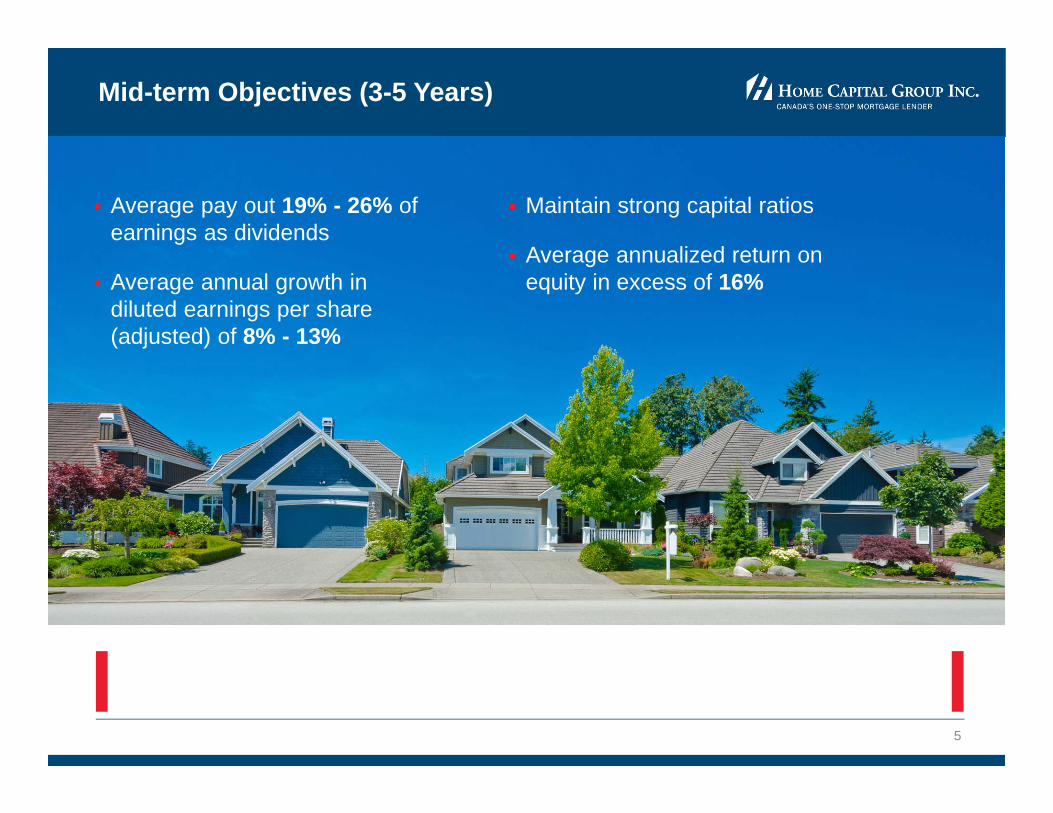
Mid-term Objectives (3-5 Years)
5
Average pay out 19% - 26% of earnings as dividends
Average annual growth in diluted earnings per share (adjusted) of 8% - 13%
Maintain strong capital ratios
Average annualized return on equity in excess of 16%

Q4 2015 Results
6
Q4 2015 Results
Increase (Decrease)
vs. Q4 2014
2015 Results Increase (Decrease)
vs. 2014
Adjusted Net Income* $71.8M - $288.9M (0.1)%
Adjusted Diluted EPS* $1.02 - $4.11 -
Adjusted Return on Equity* 18.0% 18.8%
Total Loans UnderAdministration
$25.1B 11.1% $25.1B 11.1%
Payout Ratio 22.0% 21.5%
Total Capital Ratio 20.70% 20.70%
CET 1 Ratio 18.31% 18.31%
* Adjusted metrics for 2015 exclude the impact of acquisition and integration costs, offset by the gain on bargain purchase in relation to CFF Bank. Adjusted metrics for 2014 exclude the impact of the prepayment income received on the sale of the water heater loan portfolio.

Financial Performance
Fourth Quarter 2015
7

Q4 2015 Financial Results
8
Q4 2015 Q3 2015 Q4 2014 2015 2014
Adjusted Net Income* $71.8M $72.4M $71.9M $288.9M $289.2M
Adjusted Revenue* $246.4M $247.2M $251.9M $993.7M $1.01B
NIM (TEB) 2.46% 2.38% 2.27% 2.36% 2.25%
Loans Under Administration
$25.1B $23.4B $22.6B $25.1B $22.6B
Adjusted Efficiency Ratio*
33.7% 30.8% 28.2% 31.8% 28.8%
Provision as a % of Gross Uninsured Loans
0.04% 0.08% 0.09% 0.06% 0.10%
NPL Ratio 0.28% 0.30% 0.30% 0.28% 0.30%
CET1 Ratio 18.31% 18.06% 18.30% 18.31% 18.30%
* Adjusted metrics for 2015 exclude the impact of acquisition and integration costs, offset by the gain on bargain purchase in relation to CFF Bank. Adjusted metrics for 2014 exclude the impact of the prepayment income received on the sale of the water heater loan portfolio.
• Delivered a net interest margin of 2.46%, from a healthy loan portfolio with low non-performing loans and credit losses, continued progress on improving the pace of loan originations and a strong capital position
• Total loans under administration rose to $25.1B, driven by its solid core residential business, increases in its Accelerator portfolio and the acquisition of the CFF loans portfolio, along with increases in commercial mortgages and other lending.

YTD 2015 Items of Note
9
2015 2014
After Tax Diluted EPS After Tax Diluted EPS
Reported net income and EPS (diluted) $287.3M $4.09 $313.2M $4.45
Items of Note
Adjustment for acquisition and integration costs, net of gain recognized on acquisition of CFF Bank (net of tax)
$1.6M $0.02 - -
Adjustment for prepayment income on portfolio sale (net of tax)
- - $(24.0M) $(0.34)
Adjusted net income and EPS $288.9M $4.11 $289.2M $4.11

Mortgage Originations
10
‐
200.0
400.0
600.0
800.0
1,000.0
1,200.0
1,400.0
1,600.0
Traditional Single‐familyResidential Mortgages
Accelerator Single‐familyResidential Mortgages
Residential CommercialMortgages
Non‐ResidentialCommercial Mortgages
Q4 2014
Q1 2015
Q2 2015
Q3 2015
Q4 2015
Q4 2014 Q1 2015 Q2 2015 Q3 2015 Q4 2015
Traditional Single-family Residential Mortgages $1,484.5M $961.3M $1,294.7M $1,514.4M $1,304.3M
Accelerator Single-family Residential Mortgages
$353.0M $180.0M $279.5M $416.3M $515.9M
Residential Commercial Mortgages $313.8M $112.3M $243.9M $347.9M $133.7M
Non-Residential Commercial Mortgages $139.1M $130.3M $205.2M $219.3M $200.3M
Total Mortgage Originations $2,290.5M $1,384.0M $2,023.3M $2,498.0M $2,154.2M

Net Interest Margin
11
NIM (TEB)
NIM Non Securitized Assets (TEB) NIM Securitized Assets (TEB)
Spread of Non-Securitized Loans over Deposits (TEB)
2.27%2.28% 2.29%
2.38%
2.46%
Q4 2014 Q1 2015 Q2 2015 Q3 2015 Q4 2015
2.79%
2.81%
2.77%
2.83%
2.89%
Q4 2014 Q1 2015 Q2 2015 Q3 2015 Q4 2015
0.60%0.46%
0.42%
0.52% 0.60%
Q4 2014 Q1 2015 Q2 2015 Q3 2015 Q4 2015
2.83%
2.87%
2.89% 2.93%
2.97%
Q4 2014 Q1 2015 Q2 2015 Q3 2015 Q4 2015

CFF Acquisition
12
Assets Acquired $251.8M
Loans under Administration $1.45B
Capital injected on October 1, 2015 $35M
Purchase Price $19.6M cash consideration, subject to
final adjustments
Financial Highlights Description of TransactionOn October 1, 2015, Home Capital Group through its subsidiary Home Trust Company completed the acquisition of all outstanding common shares of CFF Bank, a Schedule I bank under the Bank Act (Canada). CFF Bank is a Canadian retail bank offering deposit, mortgage and personal banking products through a number of channels.
Expected Synergies• Supports the Company’s long-term strategy to
develop its deposit diversification and expand the broker network to build relationships and drive mortgage and loan origination volumes
Integration Update • All retained former CFF Bank employees have been
transitioned to Home Trust and relocated from their former locations in Calgary and Oakville
• Beginning the initial stages of decommissioning redundant systems to realize planned cost savings and to facilitate the efficient growth of the CFF business.
Historical Share Price Performance
13
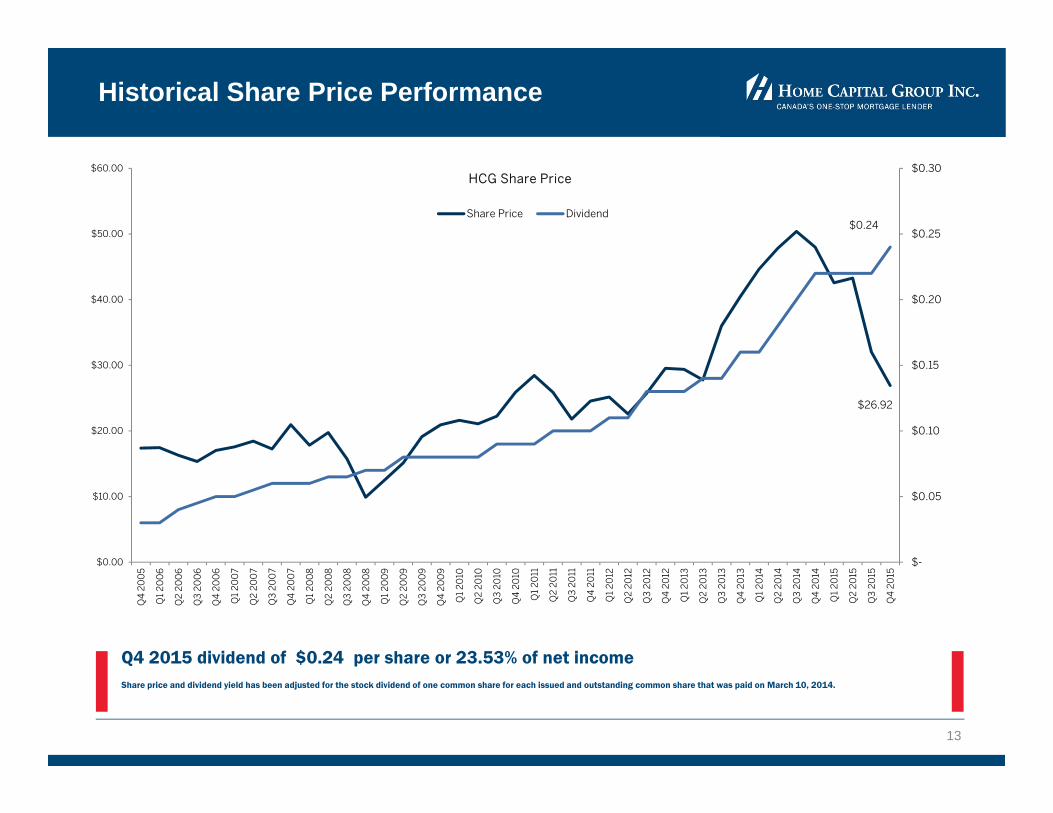
Q4 2015 dividend of $0.24 per share or 23.53% of net incomeShare price and dividend yield has been adjusted for the stock dividend of one common share for each issued and outstanding common share that was paid on March 10, 2014.
$26.92
$-
$0.05
$0.10
$0.15
$0.20
$0.25
$0.30
$0.00
$10.00
$20.00
$30.00
$40.00
$50.00
$60.00
Q4
20
05
Q1
20
06
Q2
20
06
Q3
20
06
Q4
20
06
Q1
20
07
Q2
20
07
Q3
20
07
Q4
20
07
Q1
20
08
Q2
20
08
Q3
20
08
Q4
20
08
Q1
20
09
Q2
20
09
Q3
20
09
Q4
20
09
Q1
20
10
Q2
20
10
Q3
20
10
Q4
20
10
Q1
20
11
Q2
20
11
Q3
20
11
Q4
20
11
Q1
20
12
Q2
20
12
Q3
20
12
Q4
20
12
Q1
20
13
Q2
20
13
Q3
20
13
Q4
20
13
Q1
20
14
Q2
20
14
Q3
20
14
Q4
20
14
Q1
20
15
Q2
20
15
Q3
20
15
Q4
20
15
HCG Share Price
Share Price Dividend$0.24

Capital Management
14

Capital & Liquidity
15
18.30%
17.95%18.03% 18.06%
18.31%
Q4 2014 Q1 2015 Q2 2015 Q3 2015 Q4 2015
20.94%
20.50% 20.53% 20.51%20.70%
Q4 2014 Q1 2015 Q2 2015 Q3 2015 Q4 2015
Basel III Common Equity Tier 1
Basel III Total Capital Leverage Ratio
6.756.94
7.177.36
Q1 2015 Q2 2015 Q3 2015 Q4 2015
• Continued to maintain strong CET 1 and Tier 1 capital ratios of 18.31% and 18.30%, along with total capital ratios of 20.70%
• Conservative leverage ratio at 7.36%• The Company’s Board of Directors has
authorized a share repurchase of up to $150 million.
• The Company declared a quarterly dividend of $0.22 per common share, subsequent to the end of the year.
• Payout ratio of 22.0% in Q4 2015

Risk Management
16

Mortgage Lending
17
• Total mortgage portfolio balance of $17.5B, of which 91.5% of the portfolio is residential mortgages• 23.0% of the residential mortgage portfolio is insured• Weighted average current loan-to-value (LTV) of the uninsured portfolio was 66.4% • 98.2% of the mortgage portfolio is current, with 0.3% over 90 days past due• No unusual credit issued have been identified related to the mortgages associated with the
suspended mortgage brokers• Condominiums represent 9.1% of the residential mortgage portfolio, with 22.3% insured• 3.0% of the uninsured mortgage portfolio was in energy producing regions
Single-Family Residential Loans by Province Insured Uninsured Equity Line Visa Total %
British Columbia $294.1M $537.7M $3.4M $835.2M 5.5%
Alberta $270.2M $370.6M $11.8M $652.6M 4.3%
Ontario $2,467.8M $10,152.7M $301.9M $12,922.3M 84.7%
Quebec $149.5M $350.8M $1.5M $501.8M 3.3%
Other $174.1M $160.1M $2.4M $336.6M 2.2%
Total $3,355.7M $11,571.9M $321.0M $15,248.5M 100.0%

Non-Performing vs. Net Write Offs as a % of Gross Loans
18
• Prudent strategies to maintain a high credit quality• Close monitoring of non performing loans and proactive measures to minimize losses
0.28%
0.05%
0.00%
0.20%
0.40%
0.60%
0.80%
1.00%
1.20%
1.40%
Q4 2007 Q4 2008 Q4 2009 Q4 2010 Q4 2011 Q4 2012 Q4 2013 Q4 2014 Q4 2015
Non Performing Loans as a Percentage of Gross Loans
Net Writeoff's as a Percentage of Gross Loans
2016 Outlook
19

Outlook for 2016
20
• Supply and demand in the Company’s key established real estate market is expected to remain balanced in 2016, with relatively stable prices and sales volumes with regional disparities, as demand for new homes and resale activity eases moderately. The Company believes that the current and expected levels of housing activity indicate a healthy real estate market overall.
• The Company expects to see the impact of certain positive forces on its established markets through 2016, including a generally positive outlook for the US economy, the comparatively weaker Canadian dollar, the continued low interest rate environment and the beneficial impact of lower oil prices on economic growth in Central Canada. Adverse effects related to the drop in oil prices and other commodity prices continue to negatively impact the economies of energy producing regions.
• The Company remains committed to offering a range of mortgage products to support its “one-stop” initiative.
• The Company expects to see continued strengthening of its origination volumes through 2016, when compared to 2015 originations. The Company will look to rebuild its market share lost during 2015 through the Company’s proved business model and service levels.
• The Company will continue to originate and securitize prime insured single-family and multi-unit residential mortgages and will generally sell these off-balance sheet, generating gains on sale. The market for both of these products remains very competitive.
• The Company expects 2016 net interest margin to remain relatively stable to margins experienced on new loans originated in Q4 2015, but is prepared for modest volatility.
• The Company will continue to source deposits from the public through investment dealers and deposit brokers and will continue to emphasize growth of its direct-to-consumer business, Oaken Financial. The Company will continue to strengthen its funding capability through agreements with additional deposit brokers and the enhancement of its direct-to-consumer sales and service capabilities. The relative cost of deposits is expected to remain stable to slightly lower when compared to 2015.
• The acquisition of CFF Bank supports the Company’s long-term strategy to diversify its funding sources. Through 2016, the Company will integrate the technology platform of CFF Bank into the Company’s infrastructure, to facilitate growth in depositfunding generated through CFF Bank, which issues deposits that would be eligible for deposit insurance, in an efficient, and effective manner.

Appendices
21

Home Capital Group Inc.
22
Home Trust Company - Federally regulated deposit taking institution;includes, its subsidiary, CFF Bank, a federally regulated bank
Member of Canada Deposit Insurance Corporation offering:• Term deposit products• High Interest Savings Account (HISA)• Direct to consumer savings via Oaken Financial
Canada’s one-stop mortgage lender offering• “Classic” non-prime mortgages• “Accelerator” Prime insured mortgages• “Equityline” Visa• Secured Visa• Preferred Visa• Merchant acquirer solutions (via PSiGate)• Retail Credit• Commercial lending
Investment grade ratings:• HCG – BBB-/A3 (Standard & Poor’s), BBB/R-2 (middle) (DBRS)• HTC – BBB/A2 (Standard & Poor’s), BBB(high)/R-2 (high) (DBRS)
Listed on the Toronto Stock Exchange (Symbol: HCG)

Business Profile
23
Home Capital Group Inc., together with its operating subsidiary Home Trust Company, has developed a track record of success as Canada's leading alternative lender. Building on the demonstrated strength of its core residential mortgage lending business, the Company also offers complementary lending services, as well as highly competitive deposit investment products.
MORTGAGE LENDING
Home Trust is one of Canada's leading mortgage lenders, focusing on homeowners who typically do not meet all the lending criteria of traditional financial institutions. In addition, Home Trust offers a full range of insured mortgage products through the Accelerator program to individuals customarily served by larger financial institutions. With a proprietary lending approach, comprehensive borrower profiling and flexible alternative solutions, Home Trust is a one‐stop shop for borrowers and mortgage brokers. Home Trust is also a provider of commercial first mortgages to high‐quality borrowers in selected markets across Canada.
CONSUMER LENDING
Home Trust's Equityline Visa program brings the advantages to cardholders of accessing the equity they have built in their homes together with the features and convenience of a Gold Visa card. The Company also offers deposit‐secured credit cards for individuals who wish to build or re‐establish a positive credit history as well as unsecured cards under Home Trust’s brand name as well as recently launched Union Plus, Optimax and Giant Tiger co‐branded programs. PSiGate, a wholly owned subsidiary, offers electronic card‐based payment services to merchants who conduct business primarily on the Internet. Home Trust's Retail Credit Services provides installment financing for customers making purchases from established businesses.
DEPOSIT INVESTMENTS
Home Trust provides a broad range of Guaranteed Investment Certificates and a high interest savings account. These are offered via Registered Retirement Savings Plans, Registered Retirement Income Funds, Tax‐free Savings Accounts and on a non‐registered basis. The Company has developed an extensive network nationally of intermediaries, including investment dealers, mutual fund dealers, deposit brokers and other wealth management professionals through which these are offered.
DIRECT TO CONSUMER SAVINGS
Oaken Financial offers a suite of consumer deposit products, including Guaranteed Investment Certificates (GICs) and the Oaken Savings Account. Oaken provides consumers with a secure alternative to managing their savings independently.

Home Trust Branches
24
Home Capital Group Inc. is a public company, traded on the Toronto Stock Exchange (HCG), operating through its principal subsidiary, Home Trust Company. Home Trust is a federally regulated trust company offering deposits, residential and non-residential mortgage lending, securitization of insured residential first mortgage products, consumer lending and credit card services. In addition, Home Trust offers deposits via brokers and financial planners, and through its direct to consumer deposit brand, Oaken Financial. Home Trust also conducts business through its wholly owned subsidiary, CFF Bank. Licensed to conduct business across Canada, Home Trust has branch offices in Ontario, Alberta, British Columbia, Nova Scotia, Quebec and Manitoba.
www.hometrust.ca www.oaken.com www.homecapital.com
Across Canada:
•6 branches and stores
•2 stores
•877 employees (as of December 31, 2015)
HALIFAX
VANCOUVER
MONTREALTORONTO
CALGARY
WINNIPEG

Media/Investor Relations Contacts
25
Investor Relations Media RelationsHome Capital Group Inc.Attention: Investor Relations145 King St. West, Suite 2300 Toronto, ON, M5H 1J8 Canada
Phone: (416) 360‐4663 Toll Free Phone: (800) 990‐7881
Inquiries:[email protected]
Gerald M. Soloway, Chief Executive Officer or Martin Reid, President
To arrange an interview:Margaret KingerskiPhone: (416) 775‐5089Toll Free Phone: (800) 990‐7881Email: [email protected]
Upcoming EventsFebruary 10, 2016Q4 2015 Earnings Release
February 11, 2016, 10:30 a.m.Q4 2015 Conference Call
May 4, 2016Q1 2016 Earnings Release
May 11, 2016Annual General Meeting


![Q4 & FY16 Investor Update [Company Update]](https://img.dokumen.tips/doc/110x75/577c7fc91a28abe054a60c7a/q4-fy16-investor-update-company-update.jpg)


![Q4 & FY 2015-16 Results Updates & Investor Presentaion [Company Update]](https://img.dokumen.tips/doc/110x75/577c7e701a28abe054a12801/q4-fy-2015-16-results-updates-investor-presentaion-company-update.jpg)


