Embed Size (px)
Citation preview
Winners and Losers in the Knowledge Economy: Evidence from Linked Employer-Employee Data
Rebecca Riley1,2 and Chiara Rosazza Bondibene1
1 National Institute of Economic and Social Research and LLAKES 2 Economic Statistics Centre of Excellence
Please do not cite without permission.
LLAKES Centre Conference 2018 London, 15-16 November 2018
Acknowledgements:
This work was part of the programme of the Centre for Learning and Life Chances in Knowledge Economies and Societies (LLAKES), an ESRC-funded Research Centre with grant reference ES/J019135/1. Support from the Office for National Statistics is also
gratefully acknowledged.
Disclaimer
This work contains statistical data which is Crown Copyright; it has been made available by the Office for National Statistics (ONS) through the Secure Data Service (SDS) and has been used by permission. Neither the ONS nor the SDS bear any responsibility for the analysis or interpretation of the data reported here. This work uses research datasets which may not exactly reproduce National Statistics aggregates.
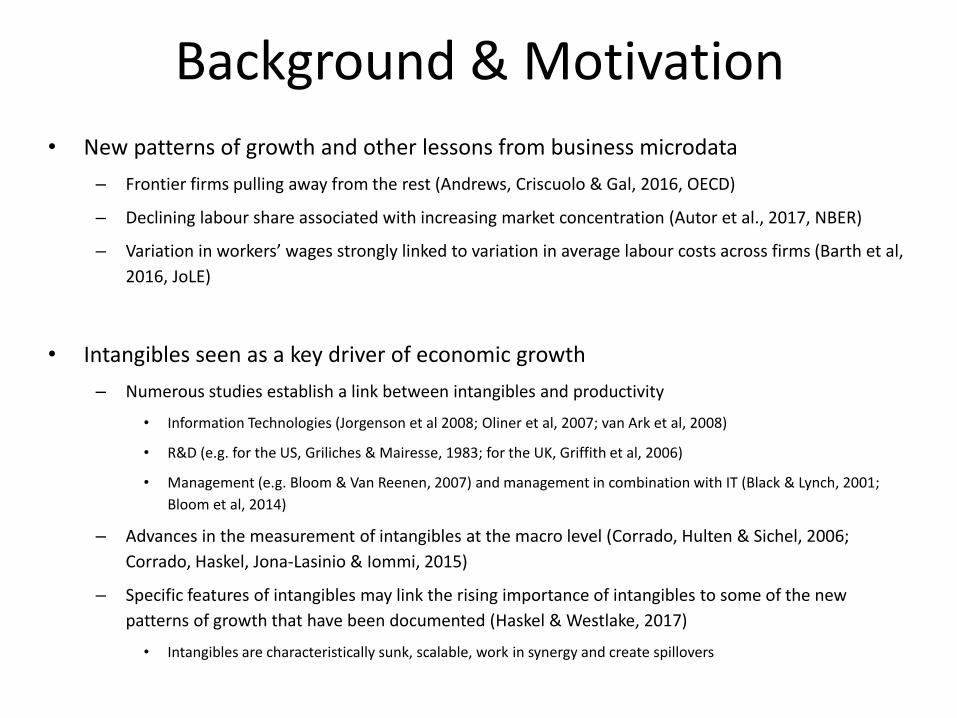
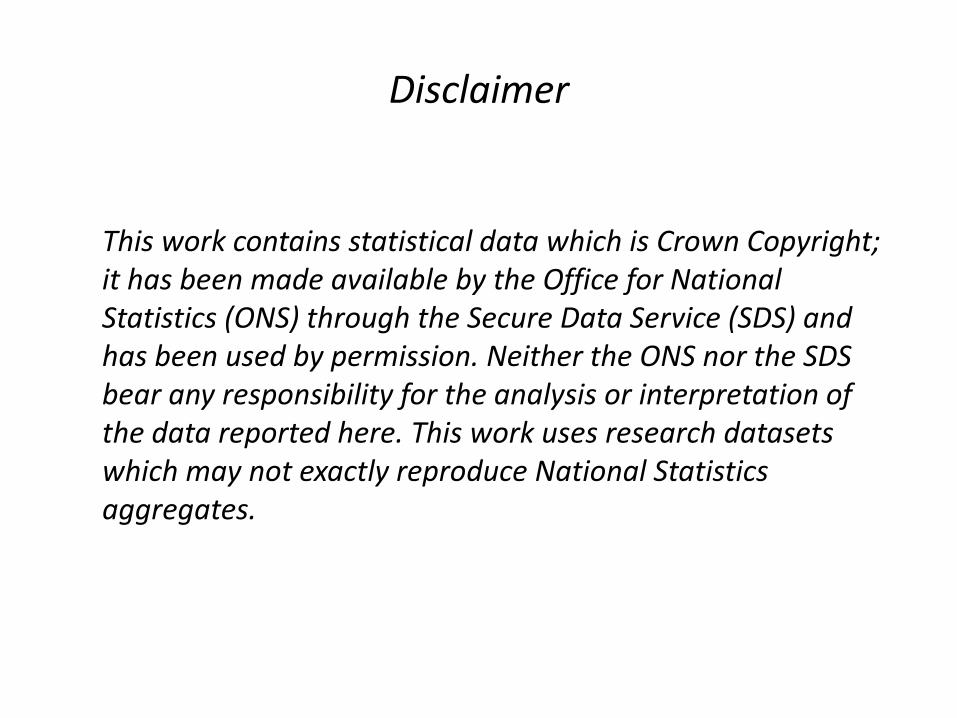
Background & Motivation
• New patterns of growth and other lessons from business microdata
– Frontier firms pulling away from the rest (Andrews, Criscuolo & Gal, 2016, OECD)
– Declining labour share associated with increasing market concentration (Autor et al., 2017, NBER)
– Variation in workers’ wages strongly linked to variation in average labour costs across firms (Barth et al,
2016, JoLE)
• Intangibles seen as a key driver of economic growth
– Numerous studies establish a link between intangibles and productivity
• Information Technologies (Jorgenson et al 2008; Oliner et al, 2007; van Ark et al, 2008)
• R&D (e.g. for the US, Griliches & Mairesse, 1983; for the UK, Griffith et al, 2006)
• Management (e.g. Bloom & Van Reenen, 2007) and management in combination with IT (Black & Lynch, 2001;
Bloom et al, 2014)
– Advances in the measurement of intangibles at the macro level (Corrado, Hulten & Sichel, 2006;
Corrado, Haskel, Jona-Lasinio & Iommi, 2015)
– Specific features of intangibles may link the rising importance of intangibles to some of the new
patterns of growth that have been documented (Haskel & Westlake, 2017)
• Intangibles are characteristically sunk, scalable, work in synergy and create spillovers
Contributions of this study
Explore the role of knowledge assets in the context of these new
patterns of growth
– Document features of the productivity distribution of UK firms
– Develop a representative dataset on intangible investment and capital using linked
business data
• Based in part on similar methods to those used in the recent macroeconomic literature on
intangibles
– Document patterns of intangible investment and other characteristics across the
productivity distribution
– Analyse the relationship between intangibles and productivity in a production
function framework using a comprehensive set of intangible assets
– Consider the occupational structure (intangible producing occupations and other
occupations) and employee returns amongst firms in different parts of the
productivity distribution using linked business-employee data
– Consider the relationship between qualifications and intangible occupations
Main data source
• Annual Respondents Database (ARDX) – establishment level business survey (or set of surveys) conducted by the UK
Office for National Statistics (ONS) that is widely used in the study of firm behaviour and productivity analysis in the UK • including information on production inputs and outputs
– a census of larger establishments and a stratified (by industry, region and employment size) random sample of establishments with less than 250 employees (SMEs)
– grossing weights can be calculated using population data available in the Inter-Departmental Business Register
– covers businesses in the non-financial non-agriculture sectors back to 1997, but some of the key questions we need to measure intangibles are not available before 2002, and are mainly available for larger firms
– throughout we focus on the market sector and exclude • micro firms (with 0-9 employees) • the top and bottom 1% of the productivity distribution within 2-digit SIC groups • imputed responses
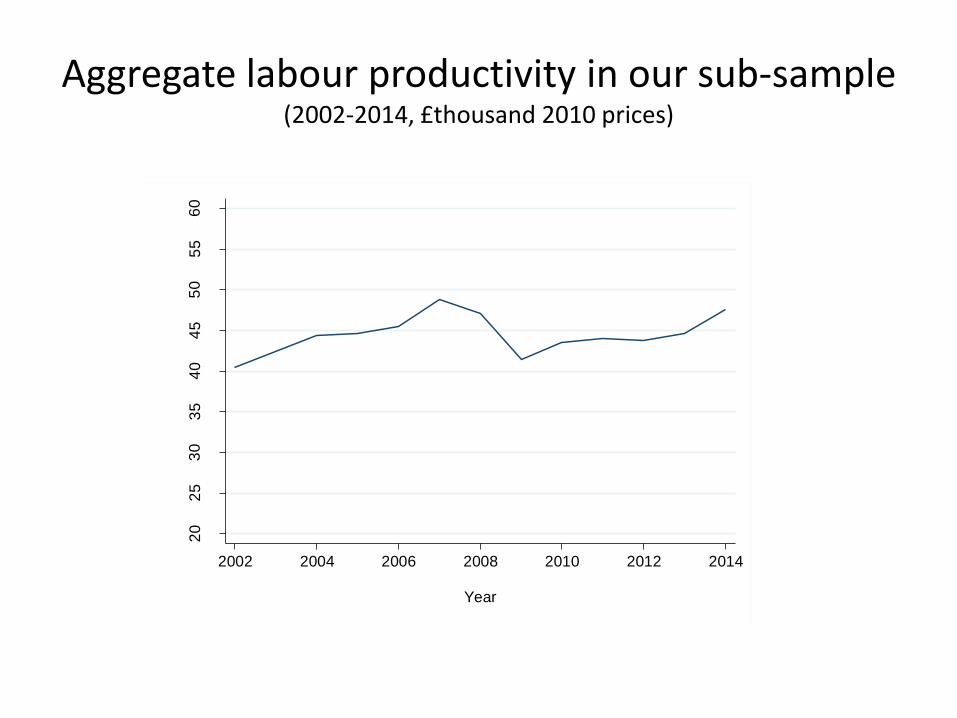
Aggregate labour productivity in our sub-sample (2002-2014, £thousand 2010 prices)
20
25
30
35
40
45
50
55
60
GV
A p
er
em
plo
yee
, £th
ousa
nd
201
0 p
rices
2002 2004 2006 2008 2010 2012 2014
Year
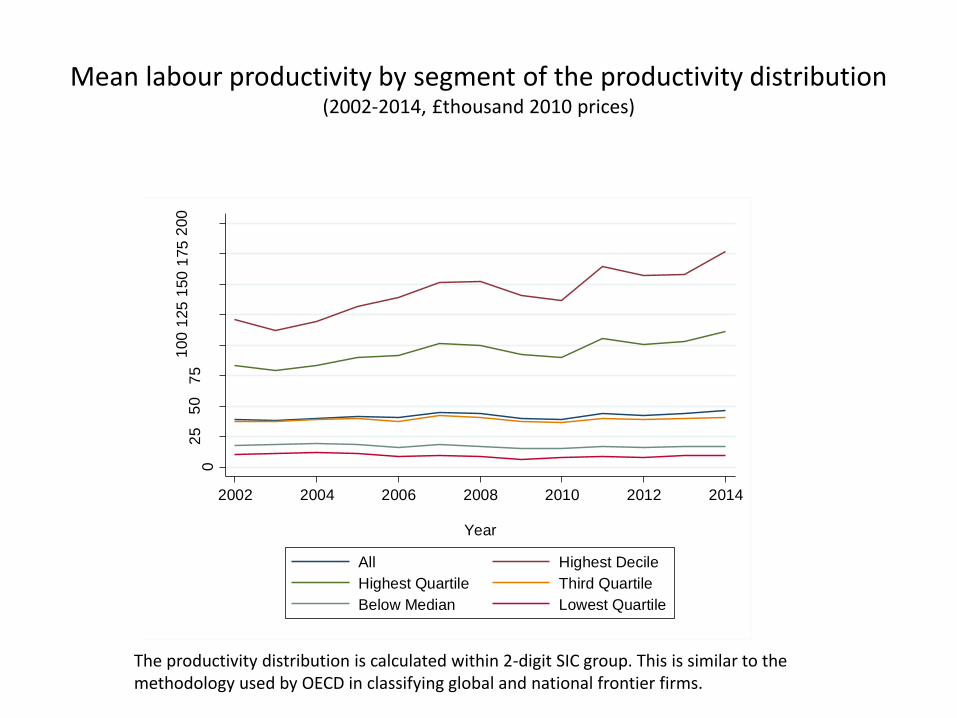
Mean labour productivity by segment of the productivity distribution (2002-2014, £thousand 2010 prices)
02
55
07
51
00
125
150
175
200
GV
A p
er
em
plo
yee
, £th
ousa
nd
201
0 p
rices
2002 2004 2006 2008 2010 2012 2014
Year
All Highest Decile
Highest Quartile Third Quartile
Below Median Lowest Quartile
The productivity distribution is calculated within 2-digit SIC group. This is similar to the methodology used by OECD in classifying global and national frontier firms.
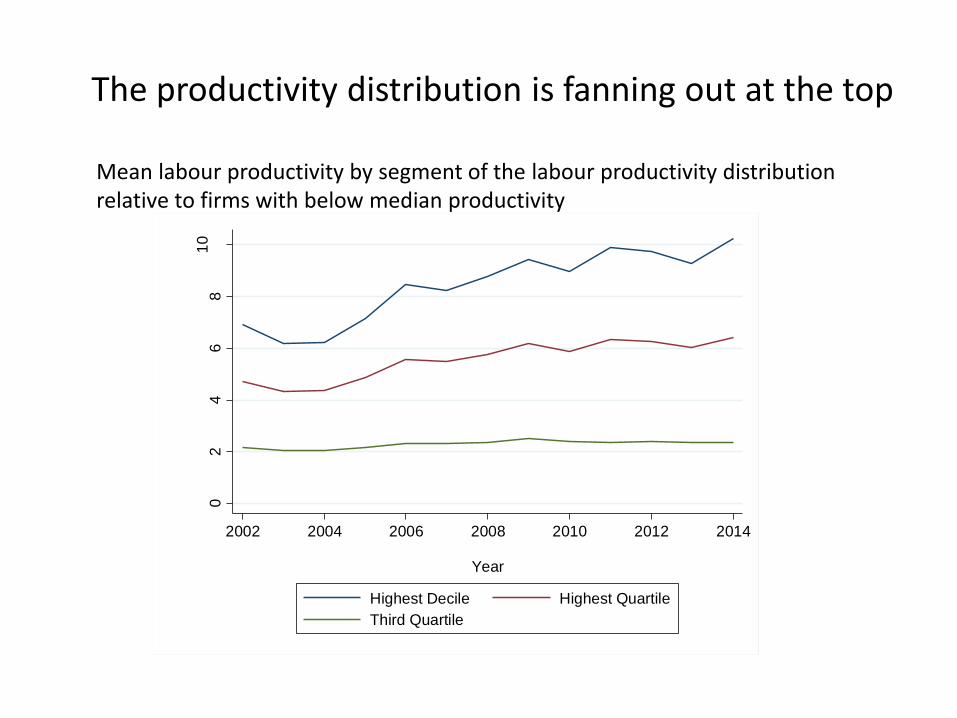
The productivity distribution is fanning out at the top
02
46
81
0
Me
an
pro
ductivity r
atio
s
2002 2004 2006 2008 2010 2012 2014
Year
Highest Decile Highest Quartile
Third Quartile
Mean labour productivity by segment of the labour productivity distribution relative to firms with below median productivity
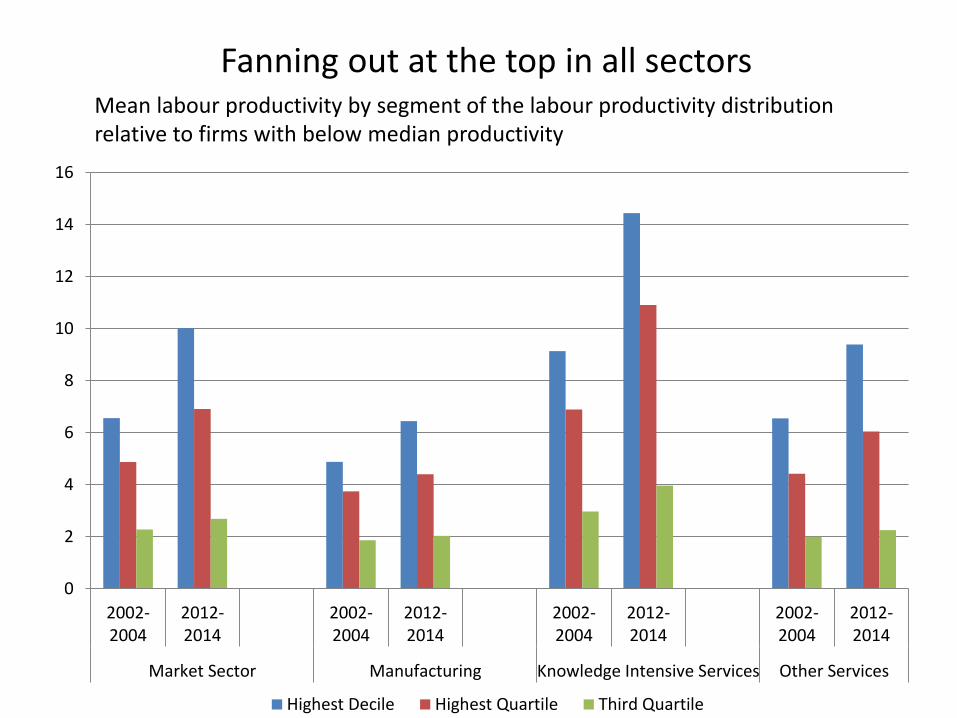
Fanning out at the top in all sectors Mean labour productivity by segment of the labour productivity distribution relative to firms with below median productivity
0
2
4
6
8
10
12
14
16
2002-2004
2012-2014
2002-2004
2012-2014
2002-2004
2012-2014
2002-2004
2012-2014
Market Sector Manufacturing Knowledge Intensive Services Other Services
Highest Decile Highest Quartile Third Quartile
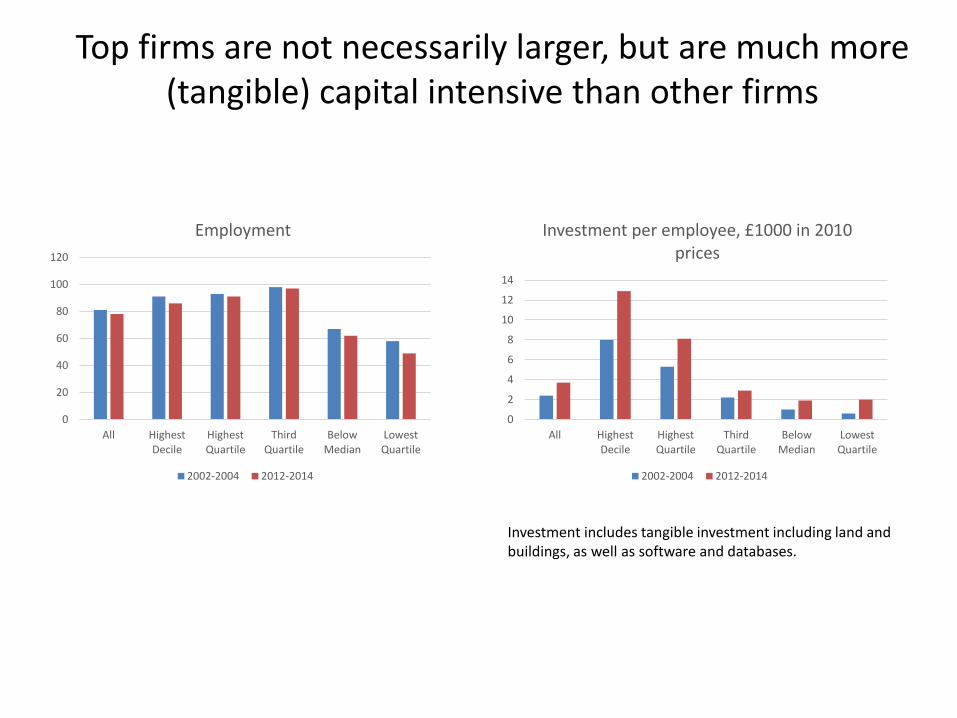
Top firms are not necessarily larger, but are much more (tangible) capital intensive than other firms
0
20
40
60
80
100
120
All HighestDecile
HighestQuartile
ThirdQuartile
BelowMedian
LowestQuartile
Employment
2002-2004 2012-2014
0
2
4
6
8
10
12
14
All HighestDecile
HighestQuartile
ThirdQuartile
BelowMedian
LowestQuartile
Investment per employee, £1000 in 2010 prices
2002-2004 2012-2014
Investment includes tangible investment including land and buildings, as well as software and databases.

Increased foreign ownership and consolidation at the top during the last decade
0
0.02
0.04
0.06
0.08
0.1
0.12
0.14
0.16
0.18
All HighestDecile
HighestQuartile
ThirdQuartile
BelowMedian
LowestQuartile
Foreign Ownership
2002-2004 2012-2014
0
0.05
0.1
0.15
0.2
0.25
0.3
0.35
0.4
All HighestDecile
HighestQuartile
ThirdQuartile
BelowMedian
LowestQuartile
Part of multi-establishment group
2002-2004 2012-2014
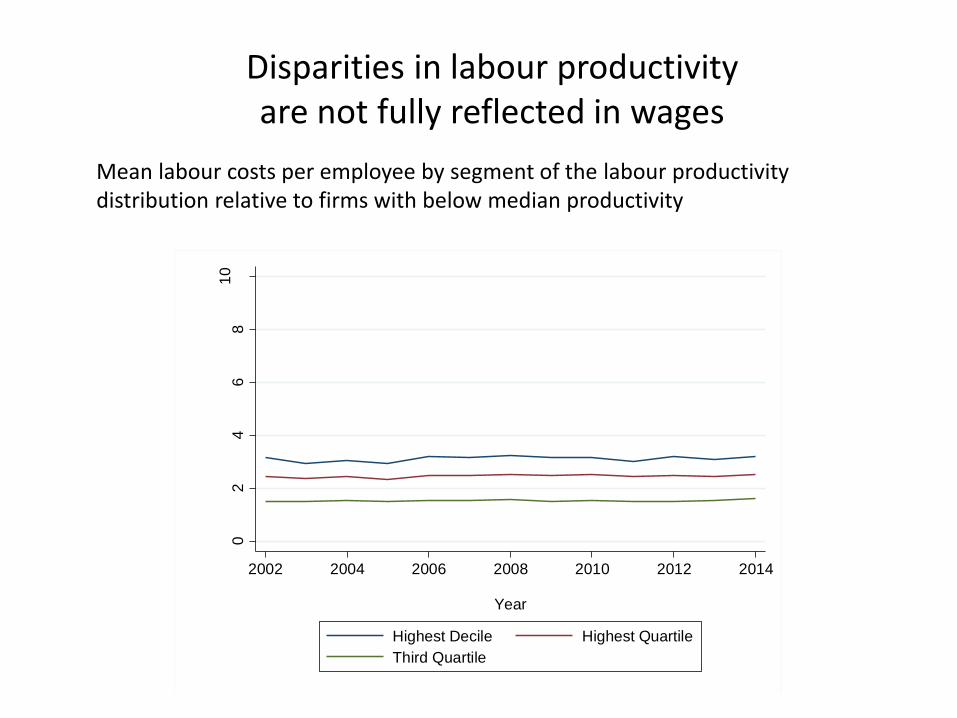
Disparities in labour productivity are not fully reflected in wages
Mean labour costs per employee by segment of the labour productivity distribution relative to firms with below median productivity
02
46
81
0
Me
an
lab
ou
r co
sts
pe
r e
mplo
ye
e r
atio
s
2002 2004 2006 2008 2010 2012 2014
Year
Highest Decile Highest Quartile
Third Quartile

Measuring firms’ investments in intangibles
• Evaluate firms’ expenditures on intangibles: – Using information on firms’ purchases of intangibles (classified either as
investment or expenditure) – And costs of workers undertaking “intangible” tasks – Evaluate investment share
• Using common assumptions in the literature
– Capitalise investment flow (PIM) • Using depreciation rates in the literature • Starting stocks proportional to sample average investment
• Number (or cost) of workers undertaking “intangible” tasks
• Data sources: – Annual Respondents Database (X) – Business Enterprise Research and Development Survey – Annual Survey of Hours and Earnings

Data Issues
• Focus intangibles analysis on large firms (250+) because of: – Time gaps – Imputed data – Assumptions made in linking ARDX to BERD
• Similar patterns across the productivity distribution: – For firms 250+ and firms 10+ – Note that the productivity distribution is calculated on
the sample of firms 10+

Occupations involved in the production of knowledge assets
• Digitised Information – ICT professionals & managers
• Intellectual Property – Natural & Social Science professionals & managers – Architects, Engineering professionals, Business research professionals – Highly skilled artistic workers, designers
• Organisational Capital (Economic Competencies) – HRM: human resources managers and directors, vocational
and industrial trainers – BRAND: sales, marketing, advertising & public relations managers – MANAGEMENT: chief executive and senior officials, production &
operations department managers
For related , but broader, occupational classifications of occupations involved in the production of intangibles see FP7 INNODRIVE and Riley and Robinson (2011) Skills and Economic Performance: The Impact of Intangible Assets on UK Productivity Growth, UK Commission for Employment and Skills.
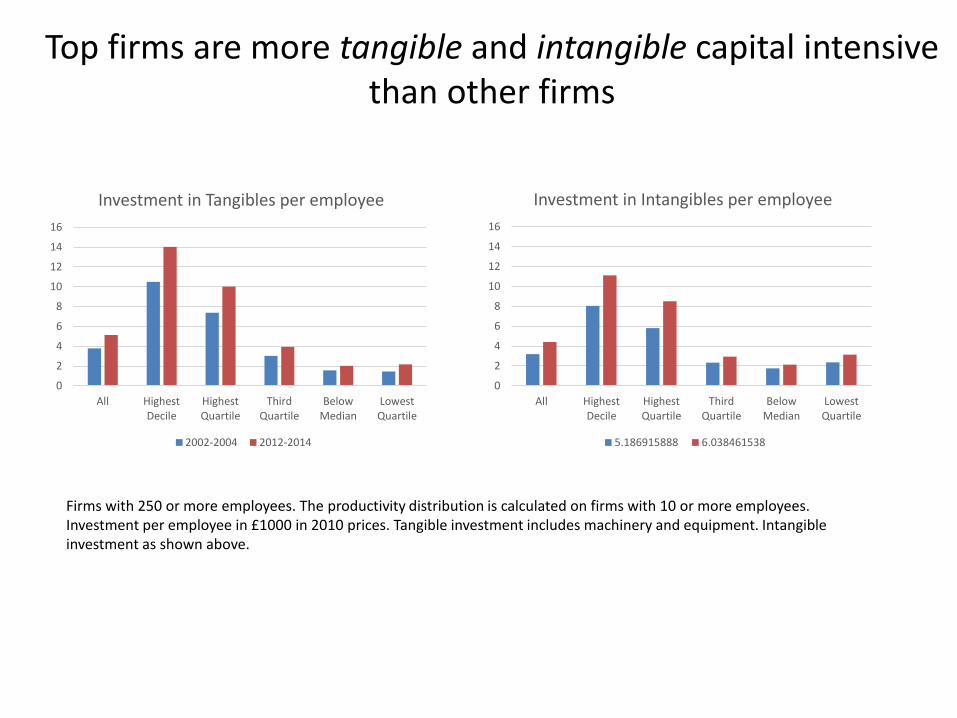
Top firms are more tangible and intangible capital intensive than other firms
Firms with 250 or more employees. The productivity distribution is calculated on firms with 10 or more employees. Investment per employee in £1000 in 2010 prices. Tangible investment includes machinery and equipment. Intangible investment as shown above.
0
2
4
6
8
10
12
14
16
All HighestDecile
HighestQuartile
ThirdQuartile
BelowMedian
LowestQuartile
Investment in Tangibles per employee
2002-2004 2012-2014
0
2
4
6
8
10
12
14
16
All HighestDecile
HighestQuartile
ThirdQuartile
BelowMedian
LowestQuartile
Investment in Intangibles per employee
5.186915888 6.038461538
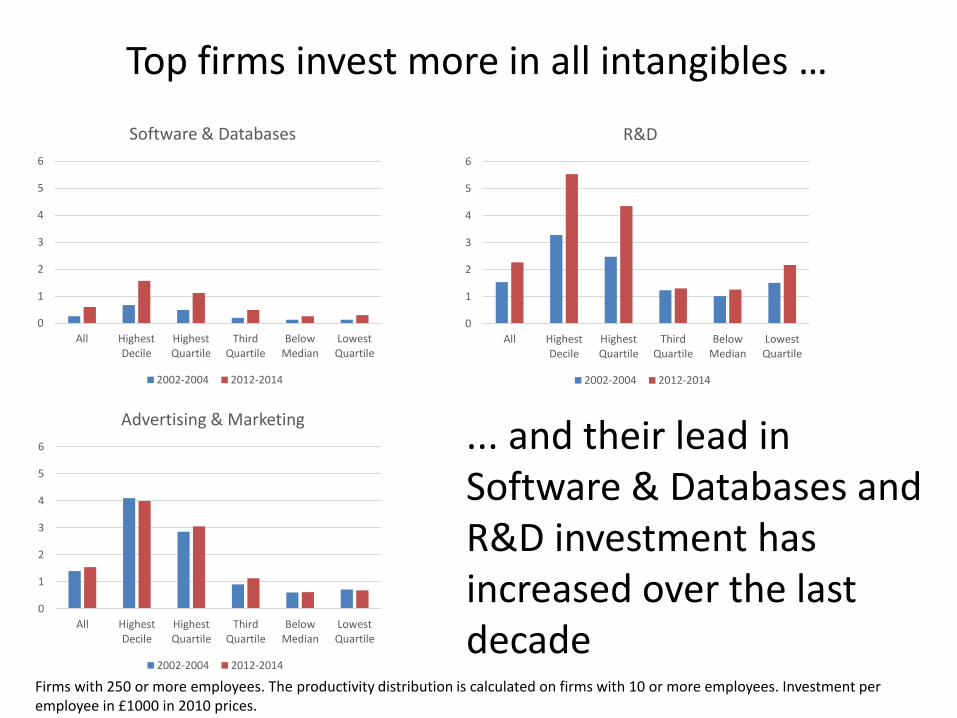
Top firms invest more in all intangibles …
Firms with 250 or more employees. The productivity distribution is calculated on firms with 10 or more employees. Investment per employee in £1000 in 2010 prices.
0
1
2
3
4
5
6
All HighestDecile
HighestQuartile
ThirdQuartile
BelowMedian
LowestQuartile
Software & Databases
2002-2004 2012-2014
0
1
2
3
4
5
6
All HighestDecile
HighestQuartile
ThirdQuartile
BelowMedian
LowestQuartile
R&D
2002-2004 2012-2014
0
1
2
3
4
5
6
All HighestDecile
HighestQuartile
ThirdQuartile
BelowMedian
LowestQuartile
Advertising & Marketing
2002-2004 2012-2014
... and their lead in Software & Databases and R&D investment has increased over the last decade
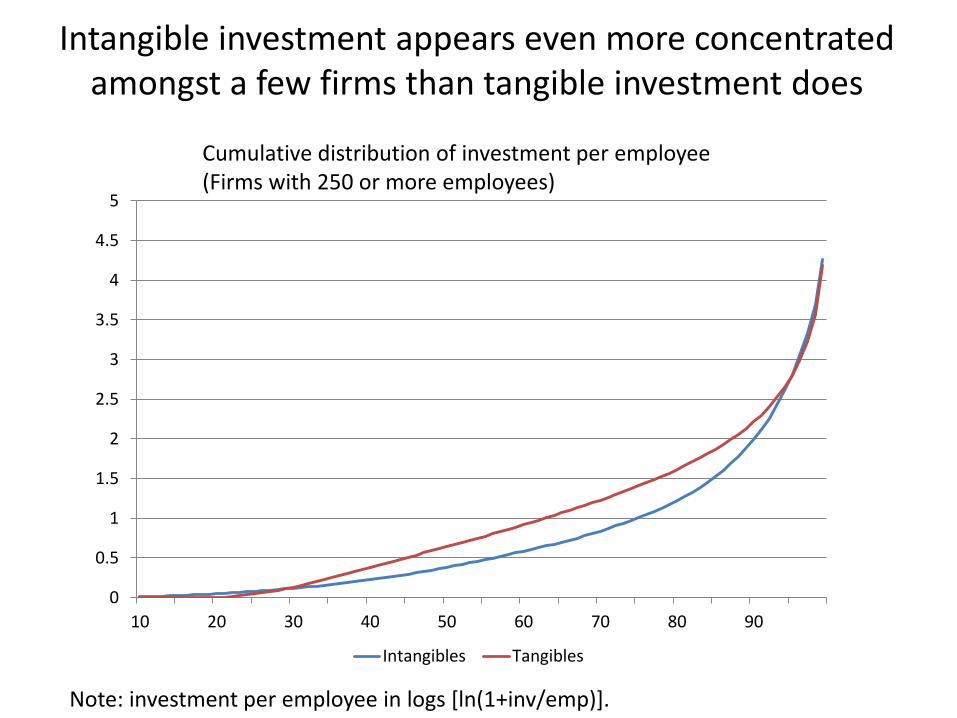
Intangible investment appears even more concentrated amongst a few firms than tangible investment does
Cumulative distribution of investment per employee (Firms with 250 or more employees)
Note: investment per employee in logs [ln(1+inv/emp)].
0
0.5
1
1.5
2
2.5
3
3.5
4
4.5
5
10 20 30 40 50 60 70 80 90
Intangibles Tangibles
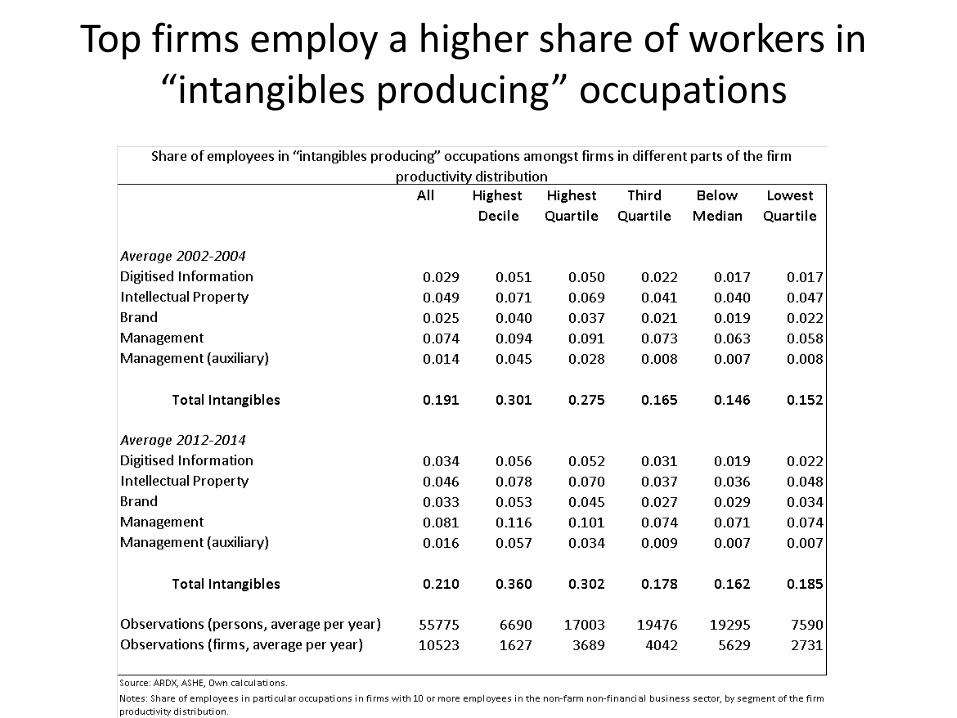
Top firms employ a higher share of workers in “intangibles producing” occupations

Top firms pay workers a premium (even when we account for the occupational mix)
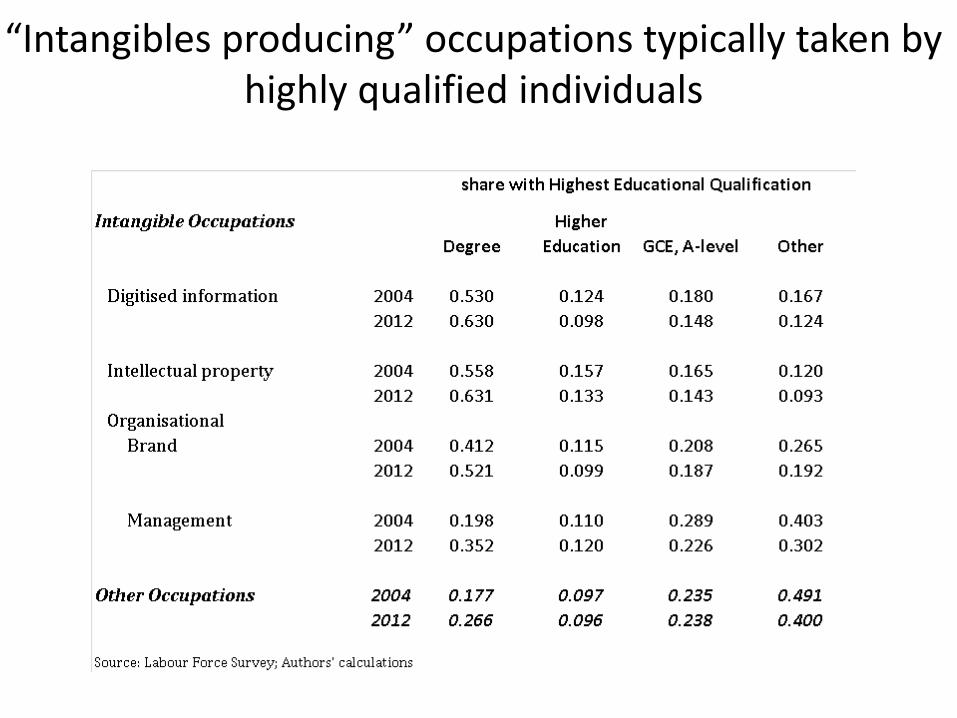
“Intangibles producing” occupations typically taken by highly qualified individuals
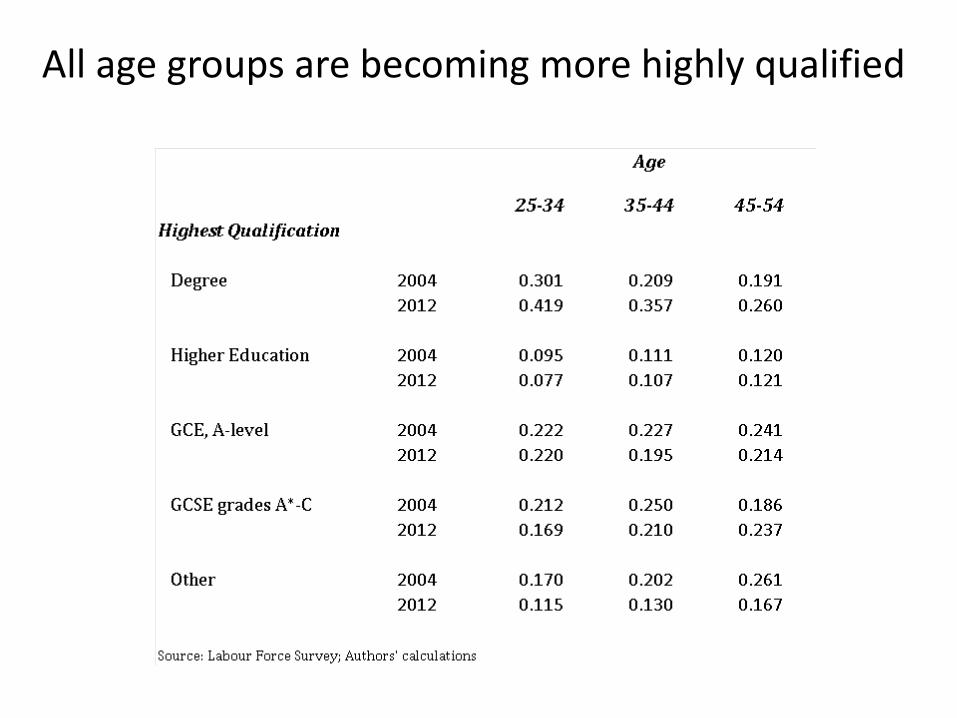
All age groups are becoming more highly qualified
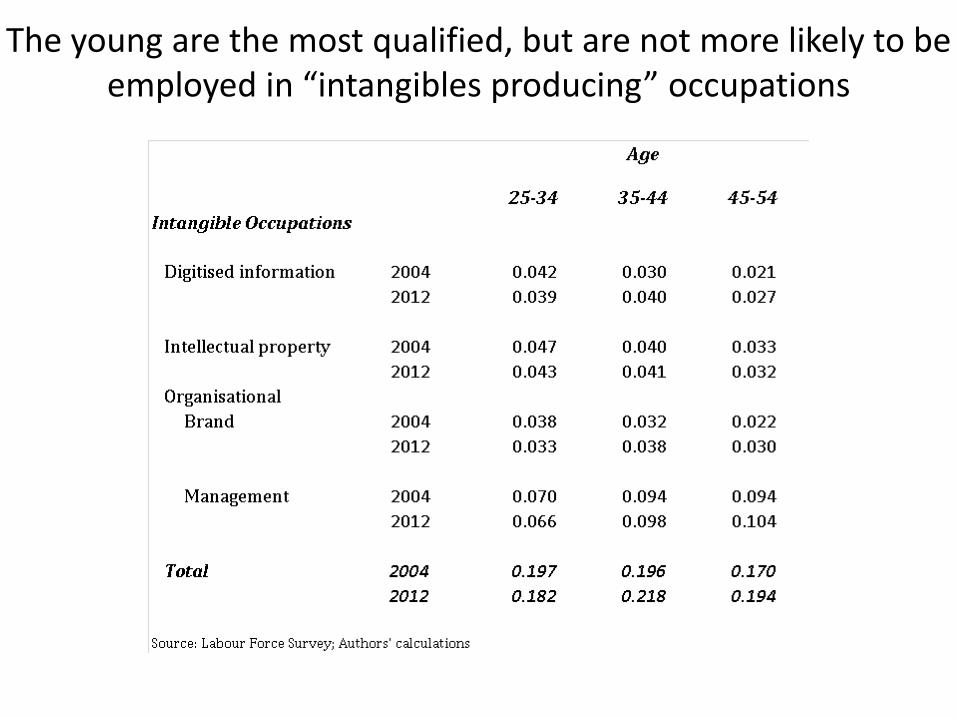
The young are the most qualified, but are not more likely to be employed in “intangibles producing” occupations
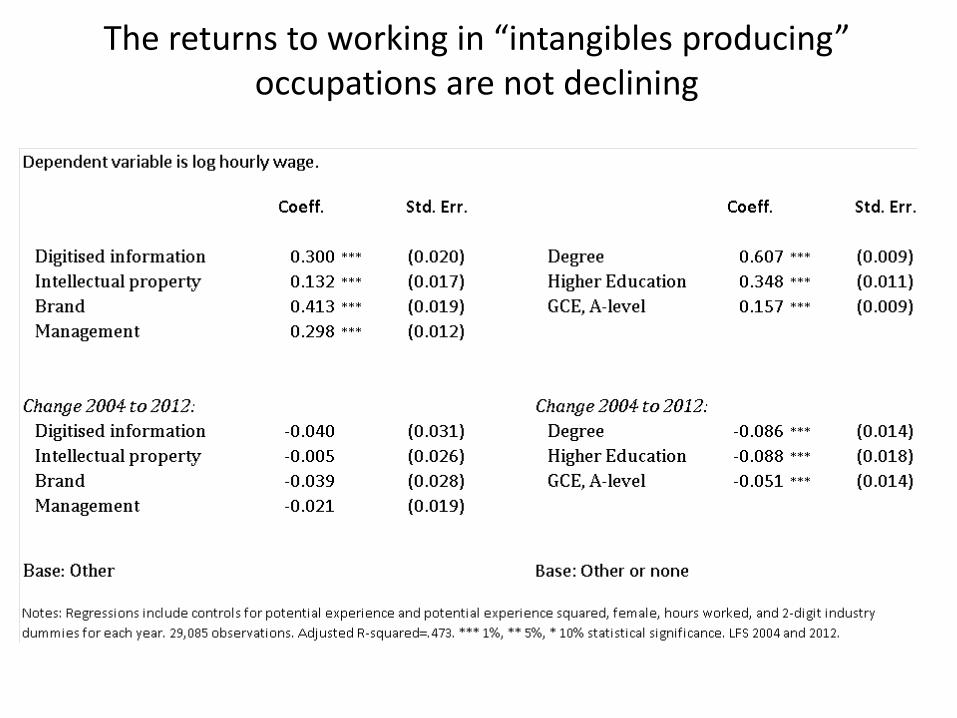
The returns to working in “intangibles producing” occupations are not declining
Conclusions
• The firm-productivity distribution is fanning out within sectors in the UK.
• Top firms are much more likely than lower tail firms to be foreign owned and part of a group, and invest much more in both tangibles and intangibles.
• Top firms are also much more likely to employ workers who are highly qualified and in “intangibles producing” occupations.
• These patterns have become more pronounced over the last decade and do not reflect firm-size differentials.
• Workers in top firms earn a premium compared to similar workers in lower tail firms. But, productivity differentials are not fully reflected in pay differentials.
• Younger workers are more highly qualified than older workers, but are no more likely to be in “intangibles producing” occupations.
• Wage premia in “intangibles producing” occupations are not declining, although the return to qualifications is.

Data References
• ONS (2017) Business Expenditure on Research and Development, 1994-2015: Secure Access. 6th Edition. UK Data Service SN: 6690. ONS.VML. http://doi.org/10.5255/UKDA-SN-6690-6
• ONS. VML. University of West England, Bristol (2017) Annual Respondents Database X, 1998-2015: Secure Access. 4th Edition. Office for National Statistics. UK Data Service SN: 7989. http://doi.org/10.5255/UKDA-SN-7989-4
• ONS (2018) Annual Survey of Hours and Earnings, 1997-2017: Secure Access. 12th Edition. UK Data Service SN: 6689. http://doi.org/10.5255/UKDA-SN-6689-11