Embed Size (px)
Citation preview

Why Do White Americans Support the Death Penalty?
Joe SossAmerican University
Laura LangbeinAmerican University
Alan R. MetelkoAmerican University
This article explores the roots of white support for capital punishment in the United States. Our analy-sis addresses individual-level and contextual factors, paying particular attention to how racial atti-tudes and racial composition influence white support for capital punishment. Our findings suggestthat white support hinges on a range of attitudes wider than prior research has indicated, includingsocial and governmental trust and individualist and authoritarian values. Extending individual-levelanalyses, we also find that white responses to capital punishment are sensitive to local context. Perhapsmost important, our results clarify the impact of race in two ways. First, racial prejudice emerges hereas a comparatively strong predictor of white support for the death penalty. Second, black residentialproximity functions to polarize white opinion along lines of racial attitude. As the black percentageof county residents rises, so too does the impact of racial prejudice on white support for capital punishment.
States, as Max Weber famously observed, are distinguished in part by theirclaim to a legitimate monopoly over the use of violence within a given territory(Gerth and Mills 1946, 78). This claim is nowhere more evident, or controver-sial, than when the state kills an individual it has convicted of a capital crime(Sarat 2001). In a majority of countries, laws permit the state to impose lifelongincarceration, but withhold the authority to take life. At present 109 countriesreject the death penalty in law or practice; 86 retain and use the death penalty,but most do not do so with great regularity (AI 2001). No country in WesternEurope currently practices capital punishment; and in 1999, the U.N. Commis-sion on Human Rights called for a worldwide moratorium on executions (Dieter1999). Between 1990 and 2001, over 30 countries abolished this mode of pun-
THE JOURNAL OF POLITICS, Vol. 65, No. 2, May 2003, Pp. 397–421© 2003 Blackwell Publishing, 350 Main St., Malden, MA 02148, USA, and PO Box 1354, 9600Garsington Road, Oxford OX4 2DQ, UK.
For helpful comments and suggestions, we thank Leonie Huddy, Stanley Feldman, Gina Sapiro,William Jacoby, and the anonymous reviewers. In addition, we thank American University for extend-ing generous support for this study through a 2001 Faculty Senate research grant.

ishment (AI 2001). Increasingly, nations around the world have decided that thelegitimate scope of state violence should not extend to the taking of a prisoner’slife.
Against this backdrop, the United States remains an outlier. In 2000, the U.S.was one of only four countries that accounted for 88% of known executionsworldwide (the others were China, Saudi Arabia, and Iran; see AI 2001). In the1990s, the U.S. was also one of only seven countries known to execute prisonersfor crimes committed under the age of 18 (the others were Iran, Nigeria, Pak-istan, Yemen, Congo, and Saudi Arabia; see AI 2001). Thirty-eight Americanstates and both federal jurisdictions (civilian and military) currently authorize thedeath penalty for capital crimes. Of this total of 40 jurisdictions, 24 permit exe-cutions for crimes committed before the age of 18 (Streib 2001).
Public support for the death penalty in the U.S. has varied over time, but inmost eras it has remained strong. In 1936, 61% of Americans favored the deathpenalty (Harry 2000). This figure declined to a low of 47% in 1966, but then rosethrough the 1970s to reach a stable 70% to 75% level in the 1980s (Ellsworthand Gross 1994). In 1994, public support for capital punishment peaked at around80% (Harry 2000). In more recent years, amid concern over racial disparities anderroneous convictions, support has once again begun to drop (Goodstein 2001).At present, however, support for the death penalty remains a majority position,with favorable responses standing at around 68% (Gallup 2002).1
In the politics of capital punishment, patterns of public support are no small matter. Although its influence varies across time and issue areas, publicopinion generally has a considerable effect on policy outcomes in the UnitedStates (Sharp 1999). In addition to its direct impact on representatives who must anticipate electoral accountability, majority opinion provides elite support-ers of the death penalty with a crucial form of political leverage—the presump-tion that democratic governments should “give the people what they want.”Perhaps most important, public opinion is a key factor used to determine whetherstate executions are constitutional under the Eighth Amendment’s prohibitionagainst cruel and unusual punishment. Since Trop v. Dulles (1958), courts havetreated the meaning of “cruel and unusual” as a question to be settled by “evolv-ing standards of decency.” In attempting to divine these standards, the U.S.Supreme Court has relied heavily on levels of public support (McGarrell andSandys 1996).
From the perspective of democratic values, there are good reasons to favor suchresponsiveness to citizens’ preferences. Understanding the popular will, however,
398 Joe Soss, Laura Langbein, and Alan R. Metelko
1 The 68% figure is based on abstract support (favor or oppose) questions and, hence, should beviewed as a high-end estimate of public support. As in other areas of public opinion, question wordinghas a large effect on death penalty support (McGarrell and Sandys 1996). In 1993, for example, anational poll found that abstract support for capital punishment stood at 77%. When respondents wereasked to consider alternatives, their support for the death penalty declined as follows: 56% if “noparole for 25 years” is available; 49% if “no parole ever” is available; 44% if “no parole for 25 yearsplus restitution” is available; and 41% if “no parole ever plus restitution” is available (Dieter 1993).

requires more than just consulting a single item on a national poll. To ascertainthe meaning of the public’s preference, one must dig into the stuff of which thispreference is made. “Giving the people what they want” has a noble ring, but itmay have troubling consequences when majority desires reflect hostility towardminority opinions or groups. In this sense, it is not enough to ask whether Amer-icans support the death penalty. Interpretation of public sentiment must beinformed by an analysis of which Americans support the death penalty and whythey support it.
This article takes steps toward the development of such an analysis. Specifi-cally, we present a quantitative case study of white death penalty support in theU.S., as it stood in 1992. Our focus on white opinion reflects several considera-tions. First, despite significant shifts in the demographic and political landscape,white people remain the most numerous and politically powerful racial group inAmerica (Klinkner and Smith 1999). Second, white people make up the core ofsupport for capital punishment in the U.S.; they favor it to a degree that far out-strips support among racial minorities.2 Third, a number of observers have sug-gested that white support for executions is driven by distinctive forces that getobscured in analyses that average effects across social groups (Barkan and Cohn1994; Cohn, Barkan, and Haltman 1991). In this regard, we are particularly interested in how, if at all, racial attitudes might fuel white desire for capital punishment.
Our reasons for focusing on opinion in 1992 are both substantive and analytic. Substantively, an investigation of white death penalty support in theearly 1990s has historical importance in its own right. Here, we find white support at its “high tide” (Harry 2000). In the election year of 1992, both major-party presidential candidates favored the death penalty, and the Democra-tic candidate (then-Governor Bill Clinton) interrupted his campaign to presideover the highly publicized execution of Ricky Ray Rector, a brain-damaged black man. Thus, survey data from 1992 allow us to investigate what drove white sentiment on the death penalty at a moment when the issue was highlysalient and white support ran thick. Beyond this historical rationale, our focus on1992 also offers analytic advantages. The American National Election Study(ANES) that year included a number of key measures that do not appear in lateryears—for example, measures of authoritarian and individualist values as well asbeliefs about violence as a racial group trait. In addition, the proximity of the1992 ANES to the 1990 U.S. Census makes it possible to examine how socialcontext may augment or mediate individual-level sources of death penaltysupport.
Why Do White Americans Support the Death Penalty? 399
2 Consider levels of opposition measured by abstract support questions in the last three presiden-tial-year American National Election Studies. In 1992, only 17% of white respondents opposed thedeath penalty; opposition ran at 43% among black respondents. In 1996, white opposition stood at18%, while black opposition was measured at 47%. In 2000, the ANES sample showed white oppo-sition rising slightly to 24%, while black opposition stood firm at 45%.
In what follows, we present a general model of white support for the deathpenalty.3 Previous research on this topic has focused on aggregate levels ofsupport, variation across demographic groups, and relationships with a smallnumber of attitudes. Our goal is to provide a more fully specified multivariatemodel of white sentiment. Our analysis offers the first effort we know of to testseveral attitudinal and contextual hypotheses regarding death penalty opinion. Inso doing, we hope to illuminate the broad range of forces that drive popularsupport. Equally important, by controlling for these diverse sources of opinion,we offer a relatively stringent test of the claim that racial prejudice and racialcontext contribute to white support for capital punishment.
Theory and Hypotheses
Like any hotly debated policy question, capital punishment is likely to elicitpublic responses based on a range of values, beliefs, and attitudes. Drawing ontheory and previous research, our analysis treats white support for the deathpenalty as a product of four types of factors: racial attitudes, social group dif-ferences, core values and political attitudes, and features of social context.
Racial Attitudes
There are a number of good reasons to suspect that anti-black attitudes may bolster white support for the death penalty. Over the past several decades,crime in the U.S. has become an increasingly racialized issue. The symbolic linkbetween race and crime partly reflects the high rate of violence in poor black neighborhoods, but it also stems from the race-coded rhetoric public officials use to talk about crime and from media coverage that exaggerates black violence (Entman and Rojecki 2000, 78–93; Mendelberg 2001; Peffley,Shields, and Williams 1996). Media stories routinely convey threatening imagesof black crime suspects and disproportionately portray black prisoners as “irra-tional, incorrigible, predatory, and dangerous” (Sloop 1996, 116). Not surpris-ingly, white Americans tend to associate criminality with people of color andbelieve that most criminals come from racial minorities (Roberts and Stalans1997).
In this context, it seems likely that when white Americans think about ques-tions of crime and punishment, they frame the issues partly in racial terms.Indeed, some observers have argued that white preferences for harsh sentencingshould be viewed as a response to racially tinged perceptions of threat (Cohn,
400 Joe Soss, Laura Langbein, and Alan R. Metelko
3 The target of our analysis, we want to underscore, is white opinion. We do not intend for the the-ories or the multivariate model presented in this article to explain death penalty support among peopleof color. Consistent with our expectations, the model presented in this article fails even to achievestatistical significance when applied to the 1992 ANES sample of African Americans (n = 142; LRc2
19df = 13.9, p = .79). Full results for this analysis are available from the authors on request.
Barkan, and Haltman 1991). Stiff punishments may provide white Americanswith a means to control or subordinate black people, or they may simply offer away to vent anti-black resentments (Sidanius and Pratto 1999). Previous researchoffers some evidence for this view. Among white Americans, individuals whohold more negative beliefs about black people generally endorse more punitiveresponses to crime (Cohn, Barkan, and Haltman 1991). When confronted withimages of black perpetrators, whites who hold anti-black stereotypes becomemore likely to believe in a suspect’s guilt, more likely to expect recidivism, andmore likely to favor harsh criminal punishments (Gilliam and Iyengar 2000;Hurwitz and Peffley 1997).
In light of these findings, as well as research showing that race is highly cor-related with the availability and use of capital punishment in the U.S. states(Jacobs and Carmichael 2002), it is surprising how little attention students ofdeath penalty support have devoted to racial prejudice. There is a small amountof survey evidence indicating that anti-black attitudes may enhance white support(Barkan and Cohn 1994; Gross and Kinder 2000; Kinder and Sanders 1996). Inaddition, mock jury studies have found that white jurors are more likely to imposethe death penalty when defendants are black rather than white and that thesejurors tend to supply “stereotype-consistent” justifications for their sentences(Lynch and Haney 2000).
Such previous findings, however, are limited in important respects. Mock jurystudies offer many insights, but their nonprobability samples cannot be used todraw valid statistical inferences about the national population. Survey researchtypically overcomes this difficulty. But the survey-based studies to date have con-trolled for only a handful of demographic and attitudinal variables, and none sofar have investigated the ways race-based effects may be abridged or mediatedby contextual factors. As a result, there remain good reasons for skepticism aboutthe claim that racial attitudes underpin white support for the death penalty. Sup-portive evidence comes from a slender base of studies that have tested for racialeffects without controlling for plausible rival explanations.
To pursue a more stringent test, we use a prejudice scale designed to captureboth the cognitive and affective components of anti-black racial attitudes.4 Thescale is based on three measures of group stereotyping and one measure of group-based antipathy. The stereotype items indicate the difference between white
Why Do White Americans Support the Death Penalty? 401
4 Our use of the term “prejudice scale” should not be read as a strict application of Allport’s (1954)definition of prejudice as “an antipathy based on a faulty and inflexible generalization.” Specifically,we cannot know based on available evidence whether respondents who score high on this scale holddemonstrably false or inflexible beliefs. Moreover, as Glick and Fiske (2001, 279) have argued, thescope of prejudice extends beyond pure antipathy (contemptuous prejudice) to ambivalent forms thatcombine “both hostile and subjectively favorable beliefs about outgroups” (envious prejudice orpaternalistic prejudice). We use the term “prejudice” simply to denote a negative evaluative orienta-tion toward a specific social group (and its members) that incorporates negative stereotypes and neg-ative affect. Additional data would be needed to tell whether respondents’ beliefs are demonstrablyfaulty, rigid in the face of new information, or devoid of positive sentiments.

respondents’ ratings of white and black people on traits of intelligence, laziness,and propensity toward violence.5 Our affective measure is a standard feeling ther-mometer score indicating how “warm” or “cool” white respondents feel towardblack people. A factor analysis of these four variables produces a single-factorsolution, suggesting that as a group they measure a coherent underlying con-struct.6 Thus, rather than pit the cognitive and affective elements against oneanother in a multivariate analysis, we use a single prejudice scale based on thefactor score generated by all four items. All else equal, we expect higher levelsof Anti-Black Prejudice to be associated with higher levels of support for capitalpunishment.
Social Group Differences
Public support for most government policies exhibits some group bias (Eriksonand Tedin 2001, 170–207). We expect white support for the death penalty to varyacross social groups defined by gender, formal education, family income, andreligion. Although claims about the gender gap in mass politics are frequentlyoverdrawn, more consistent gender differences tend to emerge on policies thatentail or address the use of violence (gun control or military action, for example;see Sapiro 2001). Polls of death penalty opinion routinely find stronger supportamong men than among women (Lester 1998). Based on these results, we expectwhite Women to be less likely than white men to support capital punishment.
Formal education is widely recognized as a major determinant of citizen ori-entations (Nie, Junn, and Stehlik-Barry 1996). People with higher educationlevels tend to cling more tenaciously to civil liberties (Nie, Junn, and Stehlik-Barry 1996), hold more egalitarian beliefs about race relations (Schuman et al.1997), and express less support for harsh criminal punishments (Hough, Lewis,and Walker 1988). Based on such findings, we expect higher Education levels todampen white support for the death penalty. By contrast, we expect higher familyincome to have the opposite effect. Despite the puny state of class consciousnessin the United States, economic position remains an important basis for sharedperspectives and interests (Jackman and Jackman 1983). State executions, like
402 Joe Soss, Laura Langbein, and Alan R. Metelko
5 Resarchers have generally taken one of two approaches to using this type of stereotype measure.Some, such as Hurwitz and Peffley (1997) and Gilens (1999), treat the items for white and black traitsseparately, in an effort to isolate group-based categories of expectation. Others, such as Virtanen andHuddie (1998) and Sears et al. (1997), emphasize the need to control for interpersonal differences inthe ways individuals use 7-point scales and establish whether respondents actually believe blackpeople differ from white people. Following this latter group, we computed difference scores by sub-tracting ratings of “whites in general” from ratings of “blacks in general.”
6 Results are available from the authors on request. Not surprisingly, the loading for the feelingthermometer was smaller than those obtained for the three stereotype measures. This difference mayreflect the underlying cognitive-affective distinction these variables are designed to capture, or it maybe a product of the common measurement format shared by the battery of stereotype items. In eithercase, our analysis does not yield a separate factor for the feeling thermometer, suggesting that it issafe to summarize these items with a single-dimension scale.

most harsh criminal penalties, are overwhelmingly applied to people drawn fromthe poor and working classes (Reiman 1998). As a result, low-income people havegreater direct and indirect contact with the costs of punitive sentencing; high-income people primarily experience the benefits of state efforts to maintain orderand punish violent crime. Accordingly, we expect higher Family Incomes to beassociated with stronger white support for capital punishment.
The impact of religion on political opinion tends to vary considerably acrossissue areas, with specific denominations being more distinctive in some areas andless so in others (Wald 1996). In the area of death penalty policy, two specificgroups stand out: Catholics and fundamentalist Christians. Now as in the past,official Catholic doctrine remains squarely set against capital punishment, withCatholic clergy in the U.S. routinely issuing statements of condemnation (CAPC2001). By contrast, white Christians who identify themselves as “fundamental-ist” tend to adopt relatively conservative positions on social issues, includingcapital punishment (Layman 1997). Accordingly, we expect white support for thedeath penalty to be significantly lower among Catholics and significantly higheramong Christian Fundamentalists.
Core Values and Attitudes
Our third set of factors focuses on core values and attitudes in U.S. politics,beginning with partisan and ideological identification. Traditionally, ideolog-ical conservatives and Republicans have been viewed as primary sources ofsupport for capital punishment (Sarat 2001). Previous research suggests thatamong white people especially, conservative identification is associated withmore punitive attitudes toward crime (Cohn, Barkan, and Haltman 1991; Lang-worthy and Whitehead 1986). Studies of criminal attitudes have given less atten-tion to partisanship. But our expectations here follow the conventionalexpectation that Republicans are more likely than Democrats to favor “tough”approaches to social problems. All else equal, we expect white Americans whoidentify as Republicans and/or Conservatives to express stronger support forstate executions.
To the best of our knowledge, no previous survey research has analyzed deathpenalty support as a matter of trust. In pursuing this issue, we emphasize the dis-tinction between trust in other people and trust in government. People who havea higher level of interpersonal trust tend to have a higher level of civic engage-ment in a variety of domains; they also tend to have stronger commitments to therights of others (Putnam 2000).7 Such trust, we suggest, may have considerablerelevance for the ways individuals think about capital punishment. The decision
Why Do White Americans Support the Death Penalty? 403
7 By “interpersonal trust,” we refer specifically to what Putnam (2000) calls “thin” trust rather thanthe “thick” forms of trust that may emerge with one’s friends or associates. Thin trust may be describedas a “standing decision to give most people—even those whom one does not know from direct expe-rience—the benefit of the doubt” (Rahn and Transue 1998, 545).

to put a fellow citizen to death expresses, among other things, a loss of faith inthe idea that a stranger who has committed a violent act might go on to live aredeemed or productive life. All else equal, we expect individuals who expresslow levels of Interpersonal Trust to be more likely than other white Americansto support capital punishment.
Although feelings of interpersonal trust and trust in government tend to be pos-itively correlated (Brehm and Rahn 1997; Newton 1999), the two constructs referto distinct targets. In the death penalty context, trust in government refers to theagent that is responsible for assigning and carrying out the punishment of death.The importance of this form of trust has recently been cast in sharp relief asinvestigators have called attention to problems in the administration of capitalpunishment, such as racial disparities and innocent prisoners on death row(Dwyer, Neufeld, and Scheck 2000; Goodstein 2001). Accordingly, we expectlower levels of Trust in Government to be associated with lower levels of whitesupport for capital punishment.
In addition to neglecting trust, another key weakness in previous research ondeath penalty support has been its lack of attention to core values. As is wellknown, most Americans lack the sort of broad cognitive constraint that mightcome from an all-encompassing ideological belief system (Converse 1964).Instead, individuals appear to organize clusters of policy preferences around corevalues that serve as domain-specific guides to what is right and desirable in polit-ical matters (Feldman 1988). By failing to incorporate these values, analyses ofdeath penalty opinion have offered a somewhat biased view of mass attitudes anda weak test of the claim that racial prejudice influences white support.
Our analysis aims to remedy these problems by incorporating measures of fourvalues: moralism, individualism, egalitarianism, and authoritarianism. Moralismhas long been viewed as an important thread in the fabric of American politicalculture (Lipset 1990). Among white Americans, it has been shown to have a sig-nificant impact on anti-black attitudes (Sears et al. 1997) and on responses toprominent black officials such as Clarence Thomas (Sapiro and Soss 1999). Inaddition, state-level evidence suggests that moralistic political cultures have anindirect, positive effect on death penalty sentencing rates (Norrander 2000).Accordingly, we expect high levels of Moralism to strengthen white support forthe death penalty.
The second value we address is normative individualism, a commitment to theidea that status and well-being should be individual responsibilities, not com-munity or governmental obligations.8 Individualist values have been shown toinfluence mass preferences regarding welfare policy, government spending,federal activism, and programs designed to help minorities (Feldman 1988). Theyhave also been linked to racial attitudes and support for policies designed to
404 Joe Soss, Laura Langbein, and Alan R. Metelko
8 This concept may be contrasted with descriptive individualism—the belief that patterns of socialstatus and well being do, in fact, result from differences in individual effort and talent (Kinder andSanders 1996).

ensure equal opportunity for black people (Sears et al. 1997). In the death penaltycontext, individualist values may suggest that an individual who commits a crimeis a suitable target for blame and punishment. They may also provide a bufferagainst charges that state executions are distributed unequally across groups. Asa result, we expect Individualist values to enhance white support for capital punishment.
Egalitarianism offers a third core value typically associated with U.S. politicalculture (Lipset 1990). Egalitarian values have a considerable impact on the waysindividuals evaluate policies related to social stratification (Feldman 1988).Regarding the death penalty, one would expect egalitarians to be especially trou-bled by evidence of systematic group bias. In addition, egalitarians may see lessvalue in state executions as a tool for maintaining order in a hierarchical society.Accordingly, we expect Egalitarian values to dampen white support for the deathpenalty.
Our fourth and final core value is authoritarianism, a desire for a highly struc-tured world in which individuals know their place, conform to social conventions,obey rules, and respect officialdom. White people who hold more authoritarianvalues are more likely to develop anti-black racial attitudes (Peffley and Hurwitz1998; Sears et al. 1997). Some argue that authoritarianism may also encourageabsolutist thinking regarding rule violations and punishments (Stack 2000). As a result, we expect Authoritarian values to enhance white support for state executions.
Contextual Factors
Existing explanations for death penalty support rely almost exclusively on indi-vidual-level factors. Aside from paying some attention to regional variation(Barkan and Cohn 1994; Cohn, Barkan, and Hartman 1991), previous analyseshave implicitly assumed that contextual forces do not exert an independent influ-ence and do not condition the effects of individual-level factors. By contrast, agrowing literature suggests that people with similar characteristics think aboutpolitical issues in different ways depending on features of their social environ-ments (Huckfeldt and Sprague 1995). Recent research indicates that socialcontext can prove especially important for white attitudes toward racially chargedpolicies (Glaser and Gilens 1997; Kinder and Mendelberg 1995; Oliver andMendelberg 2000). Building on this work, we investigate several contextualfactors that may influence white support for capital punishment.
Our first two hypotheses extend our earlier discussion of group differences. Inaddition to their individual-level effects, we suggest that education and incomelevels exert influence as features of a person’s social environment (for effects onracial attitudes, see Oliver and Mendelberg 2000). Specifically, following ourindividual-level predictions, we expect County-level Income to have a positiveimpact on white support for the death penalty; we expect a negative relationshipfor our measure of County-level Education among white residents.
Why Do White Americans Support the Death Penalty? 405

The third contextual factor in our analysis is the murder rate in each respon-dent’s county. For several reasons, observers have suggested that victimizationpatterns may influence support for the death penalty (Lester 1998). A highermurder rate implies a greater chance that an individual will know someone (orknow someone who knows someone) who has been murdered. It also mayproduce a greater stream of interpersonal and mediated communication regard-ing crime and punishment. Such information may enhance death penalty supportby cultivating fears of victimization, perceptions of social disorder, and percep-tions that there is a real need for the death penalty (Langworthy and Whitehead1986; Mendes and McDonald 2001). Accordingly, we hypothesize that deathpenalty support will run stronger among white people who live in an area witha higher County Murder Rate.
Finally, we extend our analysis of racial effects by including an indicator ofthe black percentage of residents in each respondent’s county. How might thelocal presence of African Americans affect white support for state executions?One possibility is that racially integrated environments lay the groundwork forinterracial social contact. Insofar as this is the case, integrated social interactionmay make white individuals more aware of racial bias in the death penalty, or itmay allow for greater exposure to the higher rate of anti-death-penalty attitudesin black communities. As V.O. Key (1949) noted, however, a second possibilityalso exists: rising numbers of black people in a community may inflame whiteracial hostility and provoke a repressive response. This “racial threat hypothesis”has received mixed support from research on racial attitudes (Glaser and Gilens1997; Kinder and Mendelberg 1995; Oliver and Mendelberg 2000), but it clearlysuggests that a higher percentage of black people should enhance white supportfor punitive, social-control policies.
In considering these two possibilities, it seems reasonable to ask whether whitepeople might respond to racially integrated environments in different ways. Whois likely to be most threatened by such environments? Who is most likely to convertresidential proximity into real social contact? We suspect that acceptance or rejec-tion of anti-black prejudice is a crucial mediating factor. Consequently, our modelincorporates a term to capture the interaction of anti-black prejudice and racialcontext. We hypothesize that this term will have a positive coefficient: as thePercent Black in County goes up, the relationship between racial prejudice anddeath penalty support will grow stronger. Specifically, white people with low levelsof anti-black prejudice will become less likely to favor capital punishment; whitepeople with higher levels of prejudice will become more likely to favor it.
Data and Methods
To test our hypotheses, we employ survey data from the 1992 ANES and con-textual data from the 1990 U.S. Census (see Appendix A for measures andsources). Our dependent variable is an ordinal measure of death penalty opinionwith four response categories that run from “strongly oppose” (at the low end)
406 Joe Soss, Laura Langbein, and Alan R. Metelko

to “strongly favor” (at the high end).9 Accordingly, we estimate an ordered logitmodel consisting of individual-level and contextual variables for non-Hispanicwhite respondents (see Greene 2000).10
Empirical Analysis
As a whole, the ordered logit model in Table 1 performs quite well. Fourteenof our nineteen hypotheses yield statistically significant relationships and, rela-tive to a null model including only intercept terms, the model as a whole offersa significant improvement in fit. Turning to our first set of hypotheses, we find anumber of results that match our expectations. All else equal, white people withhigher family incomes are more likely than their low-income counterparts tofavor the death penalty. We also find that white men are more likely than whitewomen to support capital punishment. Formal education levels do not have a dis-cernible impact in this data set. However, with respect to religion, we find thatwhite Catholics are more likely than white members of other religious groups tooppose the death penalty. Christian fundamentalists, by contrast, hold views thatare indistinguishable from the rest of the white population.11
Turning to our core values and attitudes, we find that partisan and ideologicalidentifications make independent contributions to death penalty opinion. All elseequal, white people who identify as Republicans hold significantly more favor-able views of capital punishment; the same is true (at borderline significance) forself-identified conservatives. The results for our trust measures show a similarpattern. As we expected, diffuse trust in government to “do what is right” sig-nificantly enhances white support for state executions. At the same time, higherlevels of interpersonal trust exert a (borderline significant) dampening effect onwhite support. Among our value measures, moralism and egalitarianism do not
Why Do White Americans Support the Death Penalty? 407
9 Two points merit note here. First, the abstract support question in the ANES probably overstatesmass support for state executions (see footnote 1). At present, however, research indicates only thatquestion wording affects estimates of overall support; no evidence so far has suggested that suchwording effects alter the correlates of support. Second, in 1992, the ANES death penalty questionallowed respondents a fifth response option: “it depends.” We have excluded this category from ouranalysis for several reasons. First, it is unclear to us what this response means or how it relates to theother responses. Second, this vagueness suggests that placing the “depends” category in the middleof the scale may increase heteroscedasticity—a conclusion supported by our diagnostics. Third, thisresponse option was an aberration in the ANES time series; it was not offered in 1990 and was droppedagain in 1996 and 2000. Fourth, including respondents who answered “it depends” at the center of a5-point scale adds only 64 cases to our sample of 1,129 and does not significantly change our results.
10 Diagnostic tests indicated no heteroscedasticity in our model, and the use of robust standarderrors yielded no change in our results. Thus, the model in Table 1 employs no correction for heteroscedasticity.
11 We also examined the impact of other religious affiliations, including various Christian denom-inations and being Jewish. Of these categories, only Catholicism yielded significant results. Despiteits weak performance, Christian fundamentalism was retained because it receives considerable atten-tion in the death penalty literature and, hence, merited inclusion on theoretical grounds.

emerge as significant predictors. By contrast, we find that authoritarian and indi-vidualist values both significantly enhance support for capital punishment.
Turning to our contextual results, we find no discernible effects associated withmedian county income. However, white people who live in more highly educatedcounties, regardless of their own level of formal education, express significantlylower levels of support for the death penalty. Likewise, living in a county thathas a higher murder rate appears to significantly enhance white support for capitalpunishment.
408 Joe Soss, Laura Langbein, and Alan R. Metelko
TABLE 1
White Support for the Death Penalty, 1992 (Ordered Logit)
Coefficient S.E.
Social GroupsEducation -.032 .033Family Income .036*** .013Women -.415*** .133Catholic -.484*** .155Christian Fundamentalist .067 .225
Core Values and AttitudesParty Identification .074** .038Ideology .088* .055Interpersonal Trust -.222* .138Trust in Government .231* .124Egalitarianism -.023 .016Individualism .297*** .079Moralism .011 .019Authoritarianism .054*** .016
County ContextMedian County Income .015 .012County Whites w/ College Degree -2.169* 1.146County Murder Rate 1.889* 1.123
Racial Attitudes and ContextAnti-Black Prejudice .018*** .008Percent Black in County -.053** .025Prejudice ¥ Percent Black in Co. .001* .0006
Intercept 1 .435 .903Intercept 2 1.215 .902Intercept 3 2.269 .903
Overall Model LR c219df = 185.0
p = .001N = 1,129PRE = .08
* p £ .05, ** p £ .025, *** p £ .01.Notes: All significance tests for coefficients are one-tailed. Analysis performed in Stata 6.0, using
data from the 1992 American National Election Study, the 1990 U.S. Census, and the 1991 UniformCrime Reporting Program.

Most important, the results in Table 1 offer strong support for our racialhypotheses at both the individual and contextual level. Controlling for all the pre-ceding factors, we find significant effects associated with a white individual’slevel of racial prejudice, the racial composition of the individual’s county popu-lation, and the interaction of these two terms. Black residential presence has asignificant impact on white individuals’ support for the death penalty, but thenature of this impact depends on the individual’s level of anti-black prejudice.The negative coefficient for “percent black in county” means that for whites whoscore a zero on our prejudice scale, living in a more racially integrated countyreduces support for the death penalty.12 Beyond this zero category, the effectsassociated with the three coefficients must be interpreted simultaneously.
To do so, we turn to a graphic presentation based on procedures developed byKing, Tomz, and Wittenberg (2000). The two panels in Figure 1 allow us to showmore clearly how racial context and prejudice interact to shape white support forcapital punishment. Specifically, they demonstrate how an increasing black pres-ence at the county level strengthens the relationship between racial prejudice andwhite support. With the values of all other variables fixed at their means (andcounty racial composition set at a specified low or high value), each panel showsthe simulated effect of increasing anti-black prejudice.13 The vertical bars in thesepanels denote asymmetric 95% confidence intervals around the predicted proba-bility of strong death penalty support.
The top panel shows results for white people who live in counties that have noblack residents (a value less than one standard deviation below the mean). Thepattern suggests that prejudice has a moderately large, positive effect among thisgroup. Looking from left to right, we see that the upper bound for the left-most(low prejudice) interval stops only a bit short of the lower bound for the right-most (high prejudice) interval. In addition, no point estimate in this panel fallsbelow the line that marks a 50-50 chance of being a strong death penalty sup-porter. As scores on the prejudice scale rise from 0 to 100, the estimated proba-bility of strong death penalty support increases from .52 to .86.
By comparison, the bottom panel shows a much stronger relationship. Here,we see the predicted probabilities for white people who live in counties with a
Why Do White Americans Support the Death Penalty? 409
12 As in any case in which an interaction term is used, the magnitude and significance of each inde-pendent variable depend on the value of the second variable. In Table 2, for example, the coefficientand standard error for anti-black stereotypes permit a test of this variable’s impact when percent blackin the county is set at zero. If we estimate the impact of each variable with the other variable set atits mean (instead of zero), we get the following results. Anti-black prejudice: b = .027, s.e. = .011, p= .01. Percent black in county: b = -.099, s.e. = .049, p = .02. The results for the interaction of thesetwo variables and other variables in the model are unchanged.
13 Specifically, we used our original 1,129 respondent observations to generate a Monte Carlosample of 1,000 sets of coefficient estimates. We then used this simulated distribution to estimate thepredicted probability of observing strong support for capital punishment—based on changes in thevalues of our racial attitude variables, with all other variables set at their means. (For a full discus-sion of the method, see King, Tomz, and Wittenberg 2000).

410 Joe Soss, Laura Langbein, and Alan R. Metelko
FIGURE 1
Effects of Anti-Black Stereotyping on “Strong” White Support for theDeath Penalty by Percent Black in County
1A. Effects of Anti-Black Prejudice in Counties with No Black Residents (<1 SD Below the Mean)
1B. Effects of Anti-Black Prejudice in Counties with 19.6% Black Residents (1 SD above the Mean)
Pro
babili
ty o
f S
trong S
upport
Prejudice Scale0 50 100
0
.2
.5
.8
1
Pro
babili
ty o
f S
trong S
upport
Prejudice Scale0 50 100
0
.2
.5
.8
1
Note: X axes indicate R’s level of anti-black prejudice. Y axes indicate the estimated probability ofR being a strong supporter of the death penalty. Bars indicate (asymmetrical) 95% confidence inter-vals around the estimated probability of strong support. Point estimates in Panel 1A range from .52to .86; point estimates in Panel 1B range from .29 to .95. Analysis performed with Clarify, using 1000simulations.
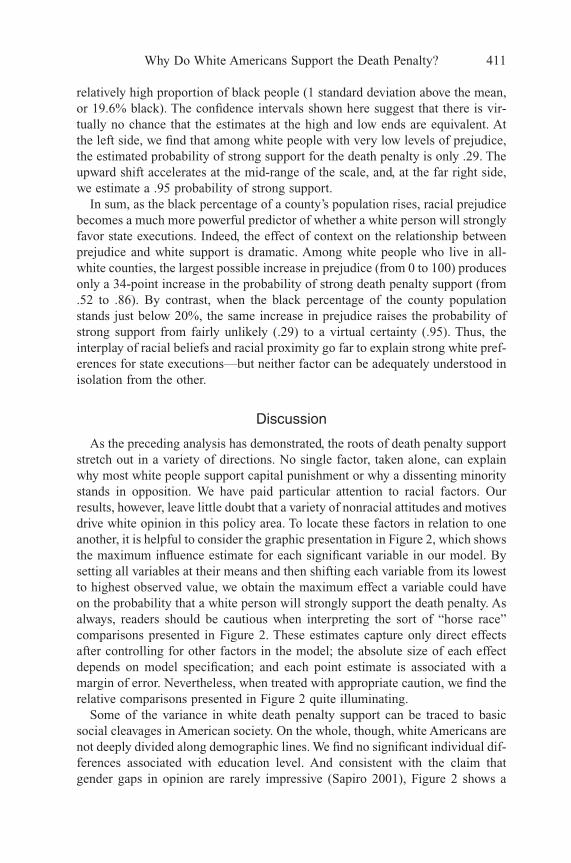
relatively high proportion of black people (1 standard deviation above the mean,or 19.6% black). The confidence intervals shown here suggest that there is vir-tually no chance that the estimates at the high and low ends are equivalent. Atthe left side, we find that among white people with very low levels of prejudice,the estimated probability of strong support for the death penalty is only .29. Theupward shift accelerates at the mid-range of the scale, and, at the far right side,we estimate a .95 probability of strong support.
In sum, as the black percentage of a county’s population rises, racial prejudicebecomes a much more powerful predictor of whether a white person will stronglyfavor state executions. Indeed, the effect of context on the relationship betweenprejudice and white support is dramatic. Among white people who live in all-white counties, the largest possible increase in prejudice (from 0 to 100) producesonly a 34-point increase in the probability of strong death penalty support (from.52 to .86). By contrast, when the black percentage of the county populationstands just below 20%, the same increase in prejudice raises the probability ofstrong support from fairly unlikely (.29) to a virtual certainty (.95). Thus, theinterplay of racial beliefs and racial proximity go far to explain strong white pref-erences for state executions—but neither factor can be adequately understood inisolation from the other.
Discussion
As the preceding analysis has demonstrated, the roots of death penalty supportstretch out in a variety of directions. No single factor, taken alone, can explainwhy most white people support capital punishment or why a dissenting minoritystands in opposition. We have paid particular attention to racial factors. Ourresults, however, leave little doubt that a variety of nonracial attitudes and motivesdrive white opinion in this policy area. To locate these factors in relation to oneanother, it is helpful to consider the graphic presentation in Figure 2, which showsthe maximum influence estimate for each significant variable in our model. Bysetting all variables at their means and then shifting each variable from its lowestto highest observed value, we obtain the maximum effect a variable could haveon the probability that a white person will strongly support the death penalty. Asalways, readers should be cautious when interpreting the sort of “horse race”comparisons presented in Figure 2. These estimates capture only direct effectsafter controlling for other factors in the model; the absolute size of each effectdepends on model specification; and each point estimate is associated with amargin of error. Nevertheless, when treated with appropriate caution, we find therelative comparisons presented in Figure 2 quite illuminating.
Some of the variance in white death penalty support can be traced to basicsocial cleavages in American society. On the whole, though, white Americans arenot deeply divided along demographic lines. We find no significant individual dif-ferences associated with education level. And consistent with the claim thatgender gaps in opinion are rarely impressive (Sapiro 2001), Figure 2 shows a
Why Do White Americans Support the Death Penalty? 411

412 Joe Soss, Laura Langbein, and Alan R. MetelkoF
IGU
RE
2
Max
imum
Est
imat
ed I
mpa
ct o
n th
e P
roba
bilit
y of
Str
ong
Whi
te S
uppo
rt f
or t
he D
eath
Pen
alty
.05
.09
.09
.11
.12
.14
.18
.19
.19
.20
.25
.34
.66
.00
.10
.20
.30
.40
.50
.60
.70
Inte
rper
sona
l Tru
st
Gende
r
Party
IDCat
holic
ism
Ideo
logy
Trust
in Gov
ernm
ent
Count
y Mur
der R
ate Fam
ily In
com
e Autho
ritar
ianism
Indiv
iduali
sm Count
y Edu
catio
n
Prejud
ice (a
ll-whit
e co
unty)
Prejud
ice (2
0% b
lack c
ount
y)
Maximum Impact on Probability of Strong DP Support
Not
e:E
ntri
es a
re b
ased
on
resu
lts
repo
rted
in
Tabl
e 1.
Onl
y re
sult
s fo
r st
atis
tica
lly s
igni
fica
nt c
oeffi
cien
ts a
re s
how
n. E
stim
ates
are
com
pute
d by
set
ting
all
var
i-ab
les
at t
heir
mea
ns a
nd t
hen
shif
ting
the
sin
gle
inde
pend
ent
vari
able
fro
m i
ts o
bser
ved
min
imum
to
its
obse
rved
max
imum
.

decidedly small distance separating white men and women, once attitudinal dif-ferences are accounted for. Catholics remain modestly less likely than other whitepeople to express strong support for the death penalty. Christian fundamentalists,however, do not emerge as distinctive at all. The most noteworthy result amongour group variables concerns economic position. Because of differential contactwith the benefits and burdens of criminal sanctions, we expected death penaltysupport to run stronger among the “haves” than among the “have nots.” Theresults clearly suggest that economic position matters: the effect of family incomeis easily the largest we find for any social-group variable.
Relative to the group results, we find more consistent (but still modest) effectsassociated with partisanship and ideology. Despite an election year in which bothmajor-party candidates endorsed capital punishment, people who identified them-selves as conservative and/or Republican remained significantly more likely toexpress strong support for capital punishment. Here again, however, Figure 2helps clarify that the effects for these variables are not as large as one mightexpect. Party and ideology, like gender and religion, appear to be meaningful butnot primary themes in this story.
The effect of core values on death penalty support is uneven in a way thatstrikes us as provocative. Moralistic family values do not have any effect on whiteopinion in this area, and neither do egalitarian values. The finding for egalitari-anism is especially striking in light of advocates’ recent efforts to publicize pat-terns of unequal sentencing and attack the death penalty as a violation of fair andequal treatment (Jackson, Shapiro, and Jackson 2002). Clearly, white Americansin 1992 did not frame the death penalty debate primarily as a question of equal-ity. Perhaps this non-finding may point to fertile ground for research on how thebases of public sentiment have changed over the past decade.
Despite these weak results, we do find strong effects associated with two corepolitical values. Support for capital punishment runs significantly stronger amongwhite people who view individual responsibility as a normative ideal for “true”Americans. Equally striking, we find that strong support for the death penalty ismuch more likely among white people who place a high value on the need fororder and deference. Indeed, leaving aside racial prejudice, authoritarianism andindividualism emerge in Figure 2 as the two strongest individual-level predictorsof white death penalty support. Considering our core-value variables as a group,then, it appears that for white Americans in 1992 the death penalty was less aquestion of equality than a matter of individual accountability and social order.
As noted earlier, previous work on death penalty opinion has paid little atten-tion to trust. Our results suggest that this omission has obscured significant influ-ences on white opinion and may have biased previous efforts to estimate thecorrelates of death penalty support. Among white Americans, distrust of otherpeople enhances support for capital punishment, but the maximum effect for thisfactor is the smallest of any in Figure 2. A diffuse distrust of government, by con-trast, dampens white support for capital punishment, and its impact is larger thanwhat we find for a majority of the significant individual factors in our model.
Why Do White Americans Support the Death Penalty? 413

This finding suggests that a portion of white Americans may be quite open toarguments that government cannot be trusted to carry out the death penaltywithout killing the innocent. Given our null finding for egalitarianism and ourstrong finding for racial prejudice, we are tempted to speculate that among whiteAmericans, evidence of racial inequalities in death sentencing may pack lesspunch than “government ineptitude” arguments that emphasize the exonerationof death-row prisoners.
Like trust, contextual factors also have received scant attention in death-penalty opinion research. Accordingly, we should underscore that our analysisproduces strong evidence of contextual effects. Only one contextual factor in ourmodel, median county income, failed to produce significant results. And as Figure2 shows, contextual factors have an impact that is generally stronger than whatwe find for individual-level predictors. Death penalty support runs heavier amongwhite people who live in counties with higher murder rates, suggesting someresponsiveness to real local conditions. Living in a county with a higher densityof college-educated whites tends to curb death penalty support, regardless of theindividual’s own education level; and this effect is larger than what we find forany nonracial factor in our model. Even before turning to the results for racialcontext, these findings clearly suggest that researchers have overlooked a key setof forces shaping white support for state executions. Two individuals with similarcharacteristics can be expected to respond differently to this issue depending ontheir surrounding social environments.
With these results in hand, we may return to the central issue of racial effectsand pose two basic questions. First, how much does racial prejudice matter forwhite opinion on the death penalty? Based on the results in Figure 2, we mustconclude it has the largest influence of any factor in our analysis. Among our sig-nificant nonracial variables, the maximum change values cover a range that runsfrom 5 to 25 points. Thus, for respondents who live in all-white counties, the esti-mate for anti-black prejudice (.34) is nine points higher than for any nonracialfactor. Among white people who live in 20% black counties, the change in prob-ability that occurs across the full range of our prejudice scale is a staggering 66points. This change value is more than double the impact of any nonracial influ-ence and more than triple the impact of the largest nonracial influence at the indi-vidual level.
Second, what kind of effect does residential proximity to black people have onwhite support for capital punishment? In addressing this type of question, it hasbecome standard to contrast the concepts of “racial contact” and “racial threat.”The former suggests that integration will lead whites to develop more positiveracial views and less punitive policy stances. The latter predicts that black resi-dential presence will provoke a backlash of white support for repressive policies.In contrast, our findings suggest that the primary effect of black residential prox-imity is to polarize white opinion along lines of racial attitude.
White people who express the highest levels of anti-black prejudice are verylikely to show strong support for the death penalty under any racial context (.86
414 Joe Soss, Laura Langbein, and Alan R. Metelko

in an all-white county); there is little room for escalation. Even with this con-straint, however, a shift to a 20%-black county yields a modest 9-point increase(to a .95 probability). The complementary effect can be seen more clearly amongwhite people with low levels of anti-black prejudice. For this group, moving froman all-white county to a 20%-black county reduces the probability of strongsupport for the death penalty 23 points, from .52 to .29.
Conclusion
The political psychology of capital punishment has many dimensions, some ofwhich fall beyond the reach of survey analysis. This article has had little to say,for example, about how the dramaturgy of state-directed death may function asa collective rite. Likewise, we have not shed light on the kinds of moral and polit-ical reasoning individuals bring to bear on capital punishment or the ways dis-cursive frames might shape public responses to this policy. Our goal has beenmore targeted: to ascertain the individual and contextual characteristics that dis-tinguish white supporters of capital punishment in the U.S. Toward that end, wehave developed and tested a general model of white preferences for the deathpenalty.
Understanding mass support for the death penalty is not just a scholarly chal-lenge, but also a political necessity. The legal and political viability of capitalpunishment hinges on both its consequences in practice and its meaning in thepublic mind. Too often, American views of the death penalty are gauged by simplytabulating responses to a single survey question. The problem with this approachis that it cuts policy support away from its social and political roots, strippingaway the values and beliefs that give meaning to public preferences. It is notenough to ask which response item Americans pick off a pollster’s closed-endedlist; we need to know something about the stuff of which this response is made.In the preceding sections, we have done some digging at the roots of whitesupport. Several conclusions may be drawn from our analysis.
First, at the individual level, the forces that drive white support for capital pun-ishment cover a broader range than previous research has suggested. Existing lit-erature in this area emphasizes demographics, ideological placement, and racialattitudes. Too little attention has been given to core political values, and virtuallyno attention has been given to the effects of trust in other people and govern-ment. Public sentiment toward capital punishment does not rest on a narrow foun-dation; it is likely to be susceptible to arguments along a variety of dimensions.To illuminate the politics of death penalty opinion, researchers must attend to theways individuals’ policy preferences fit within a broader web of values, attitudes,and beliefs.
Second, white responses to the death penalty are not just a product of personalcharacteristics or attitudes; they are highly sensitive to social context. Individu-als who are similar in other ways respond to this issue differently depending ontheir county’s local murder rate, education level, and racial composition. The
Why Do White Americans Support the Death Penalty? 415

implications of these findings extend beyond the current case to suggest a generallesson for analyses of public opinion. Environmental forces matter in ways thatcan significantly augment or mediate the effects of individual attitudes and demo-graphics. The interplay of social context and political thought offers an impor-tant and largely untapped area for inquiry in research on policy opinion.
Third and finally, we turn to our most conspicuous and unsettling finding. Pre-vious research has suggested that racial attitudes might play some role in whitesupport for the death penalty (Barkan and Cohn 1994). Our analysis has sub-jected this claim to a relatively stringent test, and the result has been a strikingconfirmation of the racial hypothesis. White support for the death penalty in theUnited States has strong ties to anti-black prejudice. For white people living inan all-white county, racial prejudice emerges as the strongest predictor of whitedeath penalty support in our analysis. For their counterparts in more integratedcounties, this effect is more than doubled.
In our view, it would be incorrect and unwise to dismiss white support for thedeath penalty as a simple expression of racial prejudice. The sources of whitesupport are diverse; and at any rate, ugly attitudinal correlates do not warrant asuspension of democratic norms. Nevertheless, we would not want to see too littlemade of this connection. White Americans’ preferences for the death penaltycannot be adequately understood apart from their racial component. Racial prej-udice is, in the aggregate, a significant part of what white death penalty supportmeans. Just as racial bias remains a feature of how capital punishment seems tobe practiced in the U.S., so too does it continue to distort the ways white Amer-icans think about and respond to the ultimate penalty.
Appendix A: Measurement
Unless noted, measures are drawn from the 1992 American National ElectionStudy.
Death Penalty Support: An ordinal dependent variable indicating responsesto two questions that ask whether, and how strongly, the respondent favors (oropposes) the death penalty for persons convicted of murder [v5933, v5934].Potential and Observed Range = 1 to 4, where 4 means that the respondentstrongly favors the death penalty. “It depends” and “don’t know” responses areexcluded from analysis. The distribution is skewed, with a mean of 3.4; 17%oppose the death penalty; 17% express weak support; and 66% express strongsupport.
Prejudice Scale: A factor score based on four items: a standard feeling ther-mometer score indicating “warm” or “cold” feelings toward black people [v2232]and difference scores indicating the gap between respondents’ ratings of whitepeople and black people on three traits: hardworking-lazy, intelligent-unintelli-gent, and violent-peaceful [v6221, v6222, v6225, v6226, v6229, v6230]. Afterobtaining a single-factor solution for these items, we re-scaled the factor score
416 Joe Soss, Laura Langbein, and Alan R. Metelko

so that its observed range runs from 0 to 100; 100 indicates the highest level ofanti-black prejudice. Mean = 41.5; SD = 13.5.
Education: An indicator of the highest year of school each respondent com-pleted [v3905]. Observed Range = 4 to 17; Mean = 13.4; SD = 2.5
Gender: A dummy variable; 1 indicates female (49%) and 0 indicates male(51%) [v4201].
Family Income: An ordinal scale with 24 response categories indicating therespondent’s family income [v4014]. Observed Range = 1 to 24; Mean = 15.2;SD = 6.0
Ideology: Liberal-conservative identification, measured on a scale that rangesfrom extremely liberal (1) to extremely conservative (7) [v2450]. ObservedRange = 1 to 7; Mean = 4.3; SD = 1.4
Party Identification: Partisan self-identification, measured on a 7-point scalethat ranges from Strong Democrat (0) to Strong Republican (6) [v2333].Observed Range = 0 to 6; Mean = 3.0; SD = 2.0
Moralism: An additive index based on five items that ask how strongly respon-dents agree or disagree with statements on issues such as changes in moral behav-ior, changes in moral standards, traditional family ties, new lifestyles and socialbreakdown, and sex outside of marriage [v6115–v6119]. We code the index sothat higher values indicate a higher level of moralism. Cronbach’s alpha (= .74)suggests reliability. Potential Range = 1 to 25; Observed Range = 1 to 20; Mean= 13.2; SD = 4.0.
Normative Individualism: An ordinal measure based on a question that askshow important “trying to get ahead on your own effort” is “in making someonea true American”—extremely important, very important, somewhat important, ornot at all important [v3520]. A higher value indicates a higher level of norma-tive individualism. Potential and Observed Range = 1 to 4; Mean = 3.1; SD = .82
Egalitarianism: An additive index based on six items that ask about the desir-ability of equal opportunity and whether equality should be pursued more or lessvigorously [v6025–v6029]. Higher values indicate more egalitarian views. Cron-bach’s alpha = .72; Observed Range = 7 to 30; Mean = 20.8, SD = 4.7.
Authoritarianism: An additive index based on four items that ask respondentsto choose which values are most important for a child to have: independence orrespect for elders, obedience or self-reliance, curiosity or good manners, beingconsiderate or well behaved [v6019–v6022]. A high score indicates greaterimportance for authoritarian values (respect, obedience, manners, behavior).Cronbach’s alpha = .66; Potential and Observed Range = 4 to 20; Mean = 12.8;SD = 4.9.
Catholic: A dummy variable, where 1 indicates Catholic self-identification(24%) and 0 indicates all other respondents (76%) [v3830].
Christian Fundamentalist: A dummy variable, where 1 indicates Christianfundamentalist self-identification (11%) and 0 indicates all other respondents(89%) [v3846].
Why Do White Americans Support the Death Penalty? 417

Interpersonal Trust: A dichotomous measure based on a single item. “Gen-erally speaking, would you say that most people can be trusted, or that you can’tbe too careful in dealing with people?” 52% fall into the “trusting” category (1);48% fall into the “can’t be too careful” category (0).
Trust in Government: A 4-point ordinal scale based on a single question:“How much of the time do you think you can trust the government in Washing-ton to do what is right—just about always (coded 4), most of the time (coded 3),or only some of the time (coded 2)?” R’s who volunteered “none of the time”were coded 1. Observed Range = 1 to 4; Mean = 2.3; SD = .5.
County Income Level: Median family income in R’s county of residence, asindicated by the 1990 U.S. Census. Observed Range = 17.6 to 65.2 (1000s); Mean= 37.1; SD = 9.2.
County Education Level: Proportion of the white population with a collegeeducation in R’s county, as indicated by the 1990 U.S. Census. Observed Range.07 to .58; Mean = .22; SD = .09.
Percentage Black in County: Percentage of the population identified as blackin R’s county, as indicated by the 1990 U.S. Census. Observed Range = 0 to 55.4;Mean = 9.1; SD = 10.5.
Murder Rate: Number of reported murders per 1000 residents in R’s county,as indicated by the 1991 Uniform Crime Reporting Program. Observed Range =0 to .57; Mean = .08; SD = .08.
Manuscript submitted 27 September 2001Final manuscript received 1 April 2002
References
AI [Amnesty International]. 2001. Facts and Figures on the Death Penalty.www.web.amnesty.org/rmp/dplibrary.nsf/current?openview.
Allport, Gordon W. 1954. The Nature of Prejudice. Cambridge, MA: Addison-Wesley.Barkan, Steven E., and Steven F. Cohn. 1994. “Racial Prejudice and Support for the Death Penalty
by Whites.” Journal of Research in Crime and Delinquency 31 (2): 202–09.Brehm, John, and Wendy Rahn. 1997. “Individual-Level Evidence for the Causes and Consequences
of Social Capital.” American Journal of Political Science 41 (3): 999–1023.CAPC. 2001. Catholics Against Capital Punishment. http://www.igc.org/cacp/bkgrd.html.Cohn, Steven F., Steven E. Barkan, and William E. Haltman. 1991. “Punitive Attitudes toward
Criminals: Racial Consensus or Racial Conflict?” Social Problems 38 (2): 287–96.Converse, Philip. 1964. “The Nature of Belief Systems in Mass Publics.” In Ideology and Discon-
tent, ed. David Apter. New York: Free Press.Dieter, Richard C. 1993. Sentencing for Life: Americans Embrace Alternatives to the Death Penalty.
Washington, DC: Death Penalty Information Center.Dieter, Richard C. 1999. International Perspectives on the Death Penalty: A Costly Isolation for the
U.S. Washington, DC: Death Penalty Information Center.Dwyer, Jim, Peter Neufeld, and Barry Scheck. 2000. Actual Innocence: Five Days to Execution and
Other Dispatches from the Wrongly Convicted. New York: Doubleday.Ellsworth, Phoebe C., and Samuel R. Gross. 1994. “Hardening of the Attitudes: Americans’ Views
on the Death Penalty.” Journal of Social Issues 50 (2): 19–52.
418 Joe Soss, Laura Langbein, and Alan R. Metelko

Entman, Robert M., and Andrew Rojecki. 2000. The Black Image in the White Mind. Chicago: University of Chicago Press.
Erikson, Robert S., and Kent L. Tedin. 2001. American Public Opinion: Its Origin, Contents, andImpact. 6th ed. Boston: Allyn & Bacon.
Feldman, Stanley. 1988. “Structure and Consistency in Public Opinion: The Role of Core Beliefs andValues.” American Journal of Political Science 32 (2): 416–40.
Gallup Organization. 2002. Poll Topics and Trends: The Death Penalty.http://www.gallup.com/poll/topics/death_pen.asp.
Gerth, H. H., and C. Wright Mills, eds. 1946. From Max Weber: Essays in Sociology. New York:Oxford University Press.
Gilens, Martin. 1999. Why Americans Hate Welfare. Chicago: University of Chicago Press.Gilliam, Franklin D., Jr. and Shanto Iyengar. 2000. “Prime Suspects: The Influence of Local Televi-
sion News on the Viewing Public.” American Journal of Political Science 44 (3): 560–73.Glaser, James M., and Martin Gilens. 1997. “Interregional Migration and Political Resocialization:
A Study of Racial Attitudes under Pressure.” Public Opinion Quarterly 61: 72–86.Glick, Peter, and Susan T. Fiske. 2001. “Ambivalent Stereotypes as Legitimizing Ideologies: Differ-
entiating Paternalistic and Envious Prejudice.” In The Psychology of Legitimacy: Emerging Per-spectives on Ideology, Justice, and Intergroup Relations, ed. J. T. Jost and B. Major. New York:Cambridge University Press.
Goodstein, Laurie. 2001 “Death Penalty Falls from Favor as Some Lose Confidence in Its Fairness.”New York Times, 17 June, 2001, A1, 14.
Greene, William H. 2000. Econometric Analysis. Upper Saddle River, NJ: Prentice Hall.Gross, Kimberly, and Donald R. Kinder. 2000. “Ethnocentrism Revisited: Explaining American
Opinion on Crime and Punishment.” Paper presented at the Annual Meeting of the American Polit-ical Science Association, Washington, DC.
Harry, Jennifer L. 2000. “Death Penalty Disquiet Stirs Nation.” Corrections Today (December):122–28.
Hough, Mike, Helen Lewis, and Nigel Walker. 1988. “Factors Associated with Punitiveness inEngland and Wales.” In Public Attitudes to Sentencing, eds. N. Walker and M. Hough. London:Gower, 203–17.
Huckfeldt, Robert, and John Sprague. 1995. Citizens, Politics, and Social Communication. New York:Cambridge University Press.
Hurwitz, Jon, and Mark Peffley. 1997. “Public Perceptions of Race and Crime: The Role of RacialStereotypes.” American Journal of Political Science 41 (2): 375–401.
Jackman, Mary R., and Robert W. Jackman. 1983. Class Awareness in the United States. Berkeley:University of California Press.
Jackson, Jesse L., Bruce Shapiro, and Jesse L. Jackson, Jr. 2002. Legal Lynching: The Death Penaltyand America’s Future. Boston: New Press.
Jacobs, David, and Jason T. Carmichael. 2002. “The Political Sociology of the Death Penalty: APooled Time-Series Analysis.” American Sociological Review 67 (1): 109–31.
Key, V. O., Jr. 1949. Southern Politics in State and Nation. Knoxville: University of Tennessee Press.Kinder, Donald R., and Tali Mendelberg. 1995. “Cracks in American Apartheid: The Political Impact
of Prejudice among Desegregated Whites.” Journal of Politics 57 (2): 402–24.Kinder, Donald R., and Lynn Sanders. 1996. Divided by Color. Chicago: University of Chicago Press.King, Gary, Michael Tomz, and Jason Wittenberg. 2000. “Making the Most of Statistical Analyses:
Improving Interpretation and Presentation.” American Journal of Political Science 44 (2): 347–61.Klinkner, Philip A., and Rogers M. Smith. 1999. The Unsteady March: The Rise and Decline of Racial
Equality in America. Chicago: University of Chicago Press.Langworthy, Robert H., and John T. Whitehead. 1986. “Liberalism and Fear as Explanations of
Punitiveness.” Criminology 24: 575–91.Layman, Geoffrey C. 1997. “Religion and Political Behavior in the United States: The Impact of
Beliefs, Affiliations, and Commitment from 1980 to 1994.” Public Opinion Quarterly 61 (2):288–316.
Why Do White Americans Support the Death Penalty? 419

Lester, D. 1998. The Death Penalty: Issues and Answers. 2nd ed. Springfield, IL: Charles C. Thomas.Lipset, Seymour Martin. 1990. Continental Divide. New York: Routledge.Lynch, Mona, and Craig Haney. 2000. “Discrimination and Instructional Comprehension: Guided
Discretion, Racial Bias, and the Death Penalty.” Law & Human Behavior 24.McGarrell, Edmund F., and Marla Sandys. 1996. “The Misperception of Public Opinion toward
Capital Punishment.” American Behavioral Scientist 39 (4): 500–13.Mendelberg, Tali. 2001. The Race Card: Campaign Strategy, Implicit Messages, and the Norm of
Equality. Princeton, NJ: Princeton University Press.Mendes, Silvia, and Michael D. McDonald. 2001. “The Politics and Economics of Capital Punish-
ment Policy in the U.S.: Deterrence vs. Public Opinion.” Paper presented at the Annual Meetingof the Midwest Political Science Association, Chicago.
Newton, Ken. 1999. “Social and Political Trust.” In Critical Citizens: Global Support for Democra-tic Government, ed. P. Norris. Oxford: Oxford University Press.
Nie, Norman H., Jane Junn, and Kenneth Stehlik-Barry. 1996. Education and Democratic Citizen-ship in America. Chicago: University of Chicago Press.
Norrander, Barbara. 2000. “The Multi-Layered Impact of Public Opinion on Capital PunishmentImplementation in the American States.” Political Research Quarterly 53 (4): 771–93.
Oliver, J. Eric, and Tali Mendelberg. 2000. “Reconsidering the Environmental Determinants of WhiteRacial Attitudes.” American Journal of Political Science 44 (3): 574–89.
Peffley, Mark, and Jon Hurwitz, eds. 1998. “Whites’ Stereotypes of Blacks: Sources and PoliticalConsequences.” In Perception and Prejudice, eds. J. Hurwitz and M. Peffley. New Haven: YaleUniversity Press, 58–99.
Peffley, Mark, T. Shields, and B. Williams. 1996. “The Intersection of Race and Crime in TelevisionNews Stories: An Experimental Study.” Political Communication 13: 309–28.
Putnam, Robert D. 2000. Bowling Alone: The Collapse and Revival of American Community. NewYork: Simon and Schuster.
Rahn, Wendy M., and John E. Transue. 1998. “Social Trust and Value Change: The Decline of SocialCapital in American Youth.” Political Psychology 19: 545–65.
Reiman, Jeffrey. 1998. The Rich Get Richer and the Poor Get Prison. Boston: Allyn and Bacon.Roberts, Julian V., and Loretta J. Stalans. 1997. Public Opinion, Crime, and Criminal Justice. Boulder,
CO: Westview Press.Sapiro, Virginia. 2001. “Gender and Political Psychology.” Paper presented at the Annual Meeting of
the International Society of Political Psychology, Cuernavaca, Morelos, Mexico.Sapiro, Virginia, and Joe Soss. 1999. “Spectacular Politics, Dramatic Interpretations: Multiple Mean-
ings in the Thomas/Hill Hearings.” Political Communication 16: 285–314.Sarat, Austin. 2001. When the State Kills. Princeton, NJ: Princeton University Press.Schuman, Howard, Charlotte Steeh, Lawrence Bobo, and Maria Krysan. 1997. Racial Attitudes in
America. Rev. ed. Cambridge, MA: Harvard University Press.Sears, David O., Colette van Laar, Mary Carrillo, and Rick Kosterman. 1997. “Is It Really Racism?
The Origins of White Americans’ Opposition to Race-Targeted Policies.” Public Opinion Quar-terly 61: 16–53.
Sharp, Elaine B. 1999. The Sometime Connection: Public Opinion and Social Policy. Albany, NY:State University of New York Press.
Sidanius, Jim, and Felicia Pratto. 1999. Social Dominance: An Intergroup Theory of Social Hierar-chy and Oppression. Cambridge, UK: Cambridge University Press.
Sloop, John M. 1996. The Cultural Prison. Tuscaloosa: University of Alabama Press.Stack, Steven. 2000. “Support for the Death Penalty: A Gender-Specific Model.” Sex Roles 43 (3/4):
163–79.Streib, Victor L. 2001. The Juvenile Death Penalty Today: Death Sentences and Executions For Juve-
nile Crimes, January 1973–June 2000. http://www.law.onu.edu/faculty/streib/juvdeath.htmU.S. Bureau of the Census. 1993. 1990 Census of Population and Housing Summary Tape File 3A.
Washington, DC: Data Users Service Division.
420 Joe Soss, Laura Langbein, and Alan R. Metelko

U.S. Department of Justice. 1994. Uniform Crime Reporting Program Data, 1991. ICPSR ed. AnnArbor, MI: Inter-University Consortium for Political and Social Research.
Virtanen, Simo V., and Leonie Huddy. 1998. “Old-Fashioned Racism and New Forms of Racial Prejudice.” Journal of Politics 60 (2): 311–32.
Wald, Kenneth D. 1996. Religion and Politics in the United States. 3rd ed. Washington, DC: CQ Press.
Joe Soss is associate professor of government, American University, Washington, DC 20016-8130.
Laura Langbein is professor of public administration, American University,Washington, DC 20016-8020.
Alan R. Metelko is information systems analyst and adjunct professor of publicpolicy, American University, Washington, DC 20016-8130.
Why Do White Americans Support the Death Penalty? 421


![Convex Optimization CMU-10725 · Definition [Penalty function] Example [Penalty function] 18 Derivative of the penalty function Penalty program: Penalty function: Assumptions: Derivatives:](https://img.dokumen.tips/doc/110x75/5f4d6fd89079d1731710faab/convex-optimization-cmu-definition-penalty-function-example-penalty-function.jpg)