Embed Size (px)
Citation preview

Who wants school vouchers?*
Yu-Sung Su†and Andrew Gelman‡
August 30, 2010
Abstract
School vouchers are one of the most contested issues in educational policy. Yet,
various survey data o�en yield di�erent results on support for vouchers (Moe 2001).
Voucher opinions are better understood by looking at American people into several de-
mographical and geographical segments. However, by doing this, we encounter a data
problem because we do not have enough sample sizes in each segments. To address
this issue, we propose the use of a model based simulation method - multilevel regres-
sion and poststrati�cation - to estimate the voucher opinions. We �nd that vouchers
are most popular among high-income white Catholics and Evangelicals that in general,
among whites, the higher the income, the more popular vouchers are. But the pattern
goes the other way among nonwhites. Among them, Vouchers are less popular among
mid-income class but are more welcome in lower income groups.
Keywords: Vouchers, Multilevel Regression and Poststrati�cation
School vouchers are one of the most contested issues in educational policy. Vouchers, as it
is commonly described, provide families the funds to pay for the tuitions in the public or
private school of their choice (Metcalf and Legan 2002). Inmost cases, families use vouchers
to leave the public school and attend the private school, which cost more but is viewed as a
provider for better education. Henceforth, supporters of vouchers promote them as a way of
making quality education more a�ordable for lower-income families and as a promoter of
additional choice for all which leads to increased competition and educational improvement
*Prepared for delivery at the Annual Meeting of the American Political Science Association, Washington
DC September 2–5, 2010.†Department of Political Science, Tsinghua University, Email: [email protected]‡Department of Statistics and Department of Political Science, Columbia University, Email: gel-
1

Dra� version! Please do NOT cite without permission!
for all. More immediately, it is a �nancial relief for people who are currently sending their
children to private schools. On the other side, opponents fear vouchers will drawmoney and
political support away from public schools which results in greater educational inequality.
In addition, to the extent that vouchers support religious schools, there is the issue of sep-
aration of church and state. In sum, public funding for private schools is controversial at
the primary and secondary levels, despite the general acceptance of tuition assistance pro-
grams for college and beyond (see Chubb and Moe 1990; Levin 2002; Moe 2001 for more
comprehensive reviews for the debate).
�ere have been numerous studies comparing public to private schools, and otherwise,
attempting to estimate the potential e�ects of vouchers and other school choice programs
(Chubb andMoe 1990;Witte 1998; Bush 2004; Ferreyra 2007;Witte and�orn 1996; Howell
2004; Moe 2001). But less attention has been devoted to another key part of the political
picture: public opinion (Chubb and Moe 1988, 1990; Moe 2001). Beyond the issues of edu-
cational policy, debate over school choice focuses on three key demographic factors:
• Income. Are vouchers a way for low-income families to gain educational opportu-
nity, or are they really just a handout for richer parents who send their kids to private
schools?
• Religion. To what extent are vouchers a special bene�t for Roman Catholics or other
religious groups?
• Race/ethnicity. Do vouchers a chance for ethnic minorities to a�ord something better
than their local public schools, or are they?
We cannot answer the policy questions and we don’t even try to do it in this paper. But
we can look at which segments of the population support school vouchers andwhich oppose
them. In addition to the above factors, we break down the responses by state of residence:
2

Dra� version! Please do NOT cite without permission!
much of school policy is decided at the state level, and public opinion has been shown to be
relevant to state policy in various areas (Gelman, Park, Shor, Bafumi, and Cortina 2009; Lax
and Phillips 2009).
�e paper is organized as follows: In Section I, we present the public opinions on vouch-
ers over times with di�erent surveys, showing that the Americans overall do not have con-
sistent opinions on vouchers. Voucher opinion is better revealed a�er further breaking it
down into several segments. In Section II, we brie�y describe the statistical method, mul-
tilevel regression and poststrati�cation (MRP), employed in this paper to better summarize
various segments of the population that support vouchers. In Section III, we display the re-
sult of theMRP and demonstrate that: vouchers aremost popular among high-incomewhite
Catholics and Evangelicals and low-income Hispanics. Among white groups, the higher the
income, the more popular are school vouchers. But among nonwhites, it goes the other way.
We conclude in Section IV.
Public Opinions on Vouchers
Various survey data o�en yield di�erent results on support for vouchers (Moe 2001). For
instance, the Phi Delta Kappan polls (PDK), one of the surveys that records public opin-
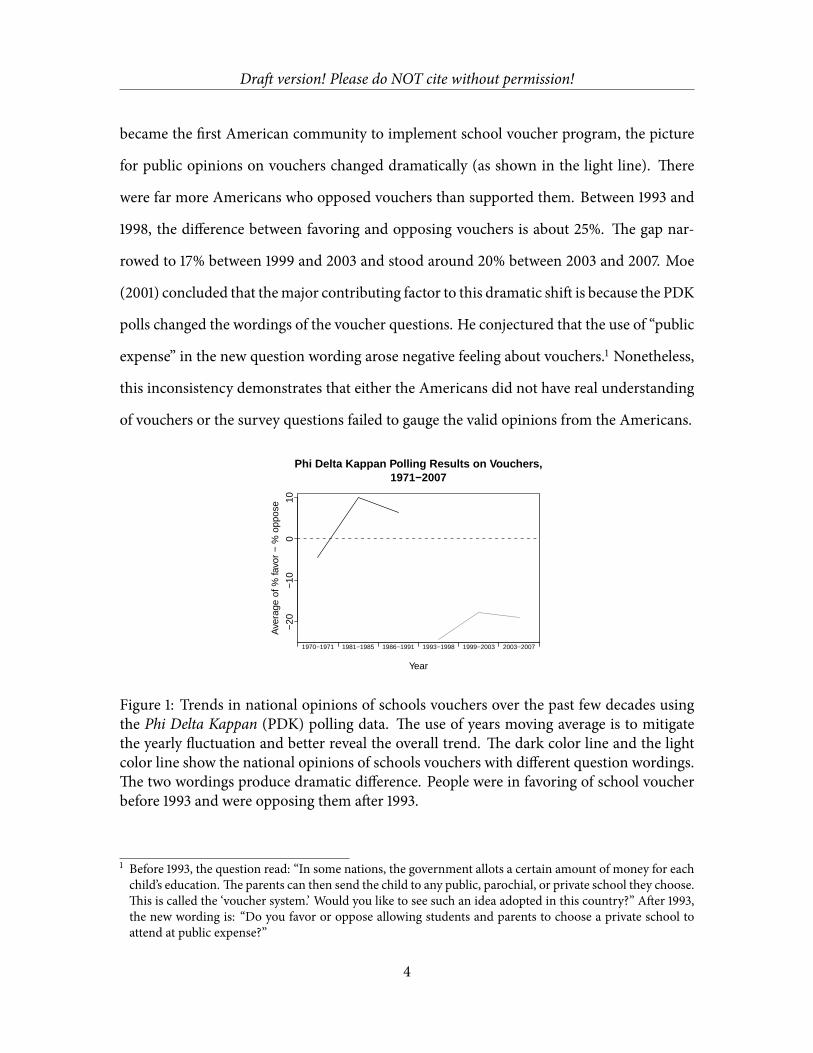
ions about school vouchers over years, shows this inconsistency. Figure 1 shows the trends
in national opinions over the past few decades. �e dark line shows that in 1970 and 1971,
vouchers did not get much support from Americans. However, a�er 1970’s, more Amer-
icans supported vouchers than opposed them. �e support for vouchers peaked between
1981 and 1985 that the di�erence in opinions between favoring and opposing vouchers was
about 10%. It dropped down to 5% between 1986 and 1991. Nonetheless, in the early 1990’s,
when vouchers were getting more attentions and real discussions, and when the Milwaukee
3
Dra� version! Please do NOT cite without permission!
became the �rst American community to implement school voucher program, the picture
for public opinions on vouchers changed dramatically (as shown in the light line). �ere
were far more Americans who opposed vouchers than supported them. Between 1993 and
1998, the di�erence between favoring and opposing vouchers is about 25%. �e gap nar-
rowed to 17% between 1999 and 2003 and stood around 20% between 2003 and 2007. Moe
(2001) concluded that themajor contributing factor to this dramatic shi� is because the PDK
polls changed the wordings of the voucher questions. He conjectured that the use of “public
expense” in the new question wording arose negative feeling about vouchers.1 Nonetheless,
this inconsistency demonstrates that either the Americans did not have real understanding
of vouchers or the survey questions failed to gauge the valid opinions from the Americans.
Phi Delta Kappan Polling Results on Vouchers,1971−2007
Year
Ave
rage
of %
favo
r −
% o
ppos
e
−20
−10
010
1970−1971 1981−1985 1986−1991 1993−1998 1999−2003 2003−2007
Figure 1: Trends in national opinions of schools vouchers over the past few decades using
the Phi Delta Kappan (PDK) polling data. �e use of years moving average is to mitigate
the yearly �uctuation and better reveal the overall trend. �e dark color line and the light
color line show the national opinions of schools vouchers with di�erent question wordings.
�e two wordings produce dramatic di�erence. People were in favoring of school voucher
before 1993 and were opposing them a�er 1993.
1 Before 1993, the question read: “In some nations, the government allots a certain amount of money for each
child’s education. �e parents can then send the child to any public, parochial, or private school they choose.
�is is called the ‘voucher system.’ Would you like to see such an idea adopted in this country?” A�er 1993,
the new wording is: “Do you favor or oppose allowing students and parents to choose a private school to
attend at public expense?”
4
Dra� version! Please do NOT cite without permission!
Moreover, the other reason that we fail to garner from the surveys a consistent picture of
the American peoples on school voucher might be that the level of analysis of these surveys
is simply not making any critical sense. In other words, by looking at the American people
as a whole, we average over important messages of American people. As Moe (2001, 207)
puts it, “what we want to know is not whether people express support for vouchers during
a particular survey, but what matters to them. �e existing surveys don’t tell us much about
that.”
To address this data issue, Chubb andMoe (2001) conducted a new survey through tele-
phone interviews in 1995. �e sample consists of 4,700 adults and it yields a nationally rep-
resentative cross-section of the American adult population. In their survey, the voucher
question was well-worded and very informative to the interviewers. It read:
“. . .Under a voucher plan, the parents of each school-age would be eligible for a
grant or voucher from the state, representing a certain amount of tax money. �ey
would then have the right to send their child to a public school, just as before.
Or they could use the voucher to help pay for the child’s education at a private or
parochial school of their choosing.”
�ey conclude that parents are more supportive than non-parents on vouchers; and
among these parents, those whose children are in private schools are more sympathetic
to vouchers than those whose children are in public schools. In terms of various racial
groups, African Americans are stronger supporters of vouchers than whites and Hispan-
ics do. Among these three groups, whites are the least supportive to vouchers. Educa-
tion is negatively associated with the support of school vouchers. And party identi�cation
doesn’t matter much. Nonetheless, Republicans are slightly more supportive of vouchers
than Democrats.
5

Dra� version! Please do NOT cite without permission!
Similar to the conclusions of Moe (2001), Witte and �orn (1996) �nd similar demo-
graphic portraits of those who choose vouchers. �ey look at the data of the Milwaukee
Parental Choice program and �nd that 70% of participating students are African American.
20% of them are Hispanics and almost no Asian students. Gender di�erence is minor; yet
there are more female students than male students. In terms of reported household income,
the average income is below $22,000. Most of them are single parent households (75%). Fur-
thermore, over 50% of these mothers are employed either full- or part-time. �ese mothers
have at least some college education.
In short, they �nd that American people do have consistent opinion about vouchers. As
Moe (2001, 211) �nds it, “[t]here is an underlying structure to the issue [of school vouchers]
that makes sense.” �at is people with stakes on school vouchers are those who expressed
support of vouchers.
Estimating Voucher Opinion withMultilevel Regression and
Poststrati�cation (MRP)
In light of the �ndings of Moe (2001) and Witte and �orn (1996), we understand better
the voucher opinions by looking at Americans in various segments. To estimate the public
opinions by various segments, scholars commonly used two main methods disaggregation
(Erikson et al. 1993) and simulation (Park, Gelman, and Bafumi 2006; Gelman and Little
1997). Relative to simulation, disaggregation is easier to be implemented. But disaggregation
has drawbacks. As we further break the survey data into several segments (e.g., states), we
thus encounter a problem of insu�cient sample sizes in each segment (i.e., the state-level
data is rare). Furthermore, the segmented data might not perfectly map into the original
sample design; thus this undermines the sample randomness. Henceforth, the derived es-
6

Dra� version! Please do NOT cite without permission!
timate of disaggregation is less e�cient and less accurate. On the other hand, the estimate
of simulation is obtained via modeling responses as a function of each segment (multilevel
regressions). For segments that have few samples, their estimates are thus pooled toward
the group mean. Nonetheless, these estimates still su�er the insu�ciency problem. Park,
Gelman, and Bafumi (2006) and Gelman and Little (1997) improve this method by post-
stratifying (weighting) these estimates with population data. In the following sections, we
are going to apply their method - multilevel regression and poststrati�cation (MRP) - to
estimate the voucher opinions.
Data
We use the 2000 and 2004 National Annenberg Election Survey (NAES), which yields over
50,000 respondents, to estimate the responses of school voucher opinion. Its voucher ques-
tion reads, “Federal government should give school vouchers – give tax credits or vouchers to
help parents send their children to private schools – should the federal government do this or
not?”We code this response as 1 for favoring vouchers and 0 for opposing vouchers. In 2000,
45% of those who expressed an opinion on this question said yes; in 2004, 52% expressed
support of vouchers. Income is coded into 5 categories (under $20,000, $20,000–$40,000,
$40,000–$75,000, $75,000–$150,000, and over $150,000); religion and race/ethnicity are
combined into a variable of 7 categories (White Catholics, White evangelical Protestants,
White non-evangelical Protestants, White other/no religion, Blacks, Hispanics, and other
races). We also include 2 geographical variables: 51 states including DC as a separate “state”,
and 4 regions (Northeast, Midwest, South, and West). For each state, we have average state
income and the Republican presidential election share in 2004.
Figure 2 displays the raw estimates (disaggregation) of the percentages of voucher sup-
ports from the 2000 and 2004 NAES and Moe (2001). �e percentages vary a lot by state,
7
Dra� version! Please do NOT cite without permission!
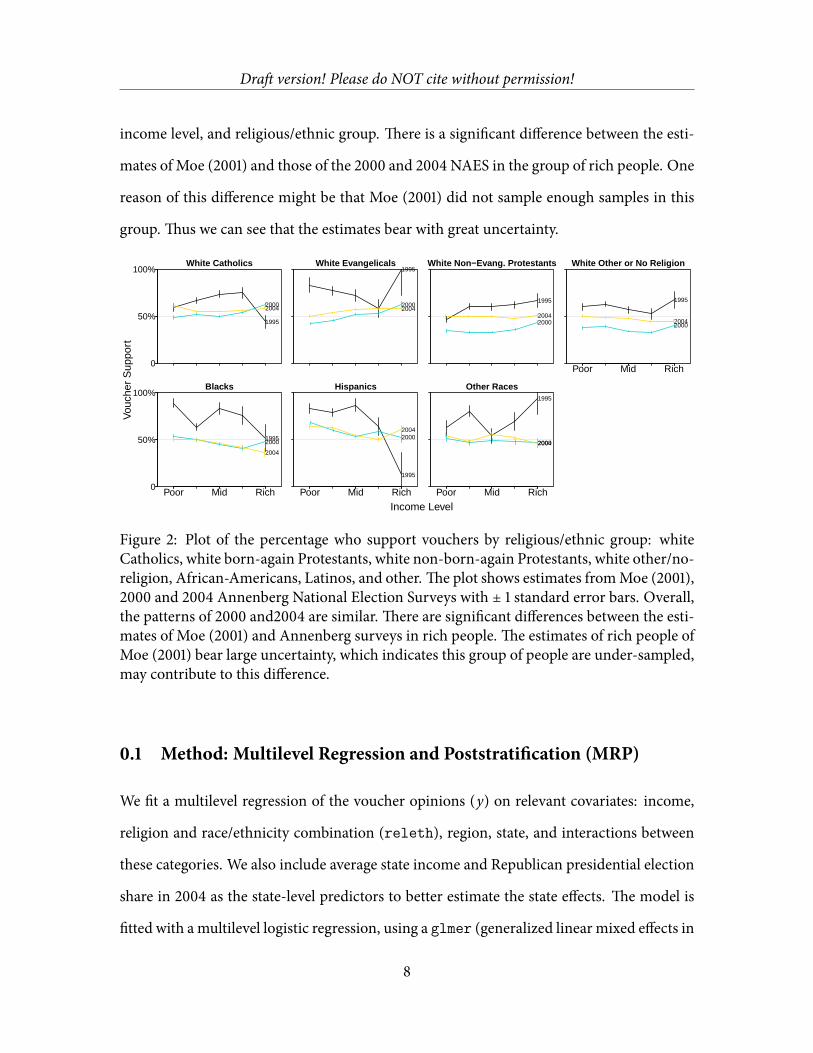
income level, and religious/ethnic group. �ere is a signi�cant di�erence between the esti-
mates of Moe (2001) and those of the 2000 and 2004 NAES in the group of rich people. One
reason of this di�erence might be that Moe (2001) did not sample enough samples in this
group. �us we can see that the estimates bear with great uncertainty.
White Catholics
0
0
50%
100%
1995
20002004
White Evangelicals0
1995
20002004
White Non−Evang. Protestants
0
1995
20002004
White Other or No Religion
0
Poor Mid Rich
1995
20002004
Blacks
0
0
50%
100%
Poor Mid Rich
19952000
2004
Hispanics
0
Poor Mid Rich
1995
20002004
Other Races
0
Poor Mid Rich
1995
20002004
Vou
cher
Sup
port
Income Level
Figure 2: Plot of the percentage who support vouchers by religious/ethnic group: white
Catholics, white born-again Protestants, white non-born-again Protestants, white other/no-
religion, African-Americans, Latinos, and other. �e plot shows estimates fromMoe (2001),
2000 and 2004 Annenberg National Election Surveys with ± 1 standard error bars. Overall,
the patterns of 2000 and2004 are similar. �ere are signi�cant di�erences between the esti-
mates of Moe (2001) and Annenberg surveys in rich people. �e estimates of rich people of
Moe (2001) bear large uncertainty, which indicates this group of people are under-sampled,
may contribute to this di�erence.
0.1 Method: Multilevel Regression and Poststrati�cation (MRP)
We �t a multilevel regression of the voucher opinions (y) on relevant covariates: income,
religion and race/ethnicity combination (releth), region, state, and interactions between
these categories. We also include average state income and Republican presidential election
share in 2004 as the state-level predictors to better estimate the state e�ects. �e model is
�tted with amultilevel logistic regression, using a glmer (generalized linear mixed e�ects in
8

Dra� version! Please do NOT cite without permission!
R) function (Bates and Maechler 2010). �e formal expression of the model is as Equation
(1):
Pr (yi = 1) =logit−1 (α0 + αrel ethm[i] + α income
k[i] + αstates[i] + αreg ion
r[i] +
α income ,statek[i],s[i] + α income ,reg ion
k[i],r[i] + αrel eth,statem[i],s[i] + αrel eth,state
m[i],r[i] )(1)
�e terms a�er the intercept (α0) are e�ects for the various groups and categories of
respondents (varying intercepts):
α incomek[i] ∼ N (0, σ 2
income) , for k = 1, . . . , 5
α income ,statek[i],s[i] ∼ N (0, σ 2
income ,state) , for k = 1, . . . , 5 and for s = 1, . . . , 51
α income ,reg ionk[i],r[i] ∼ N (0, σ2
income ,reg ion) , for k = 1, . . . , 5 and for s = 1, . . . , 4
αrel eth,statem[i],s[i] ∼ N (0, σ
2rel eth,state) , for m = 1, . . . , 7 and for s = 1, . . . , 51
αrel eth,reg ionm[i],r[i] ∼ N (0, σ2
rel eth,reg ion) , for m = 1, . . . , 7 and for r = 1, . . . , 4
αrel ethm[i] ∼ N (β income
rel eth ⋅ incomem , σ 2rel eth) , for m = 1, . . . , 7
αreg ionr[i] ∼ N (β
incomeregion ⋅ incomer , σ 2
reg ion) , for r = 1, . . . , 7
αstates[i] ∼ N (β income
state ⋅ incomes + βstate .incomestate ⋅ state .incomes + βrep.vote
state ⋅ rep.votes , σ2state) , for s = 1, . . . , 51
�e varying intercepts of the income, income-state, income-region, and religion/ethnicity-
state levels are drawn from a normal distribution with mean 0. �e varying intercepts of the
religion/ethnicity and region group levels are modeled as a function of the average income
of respondents of those groups. �e varying intercept of the state level are modeled as a
function of the average income of respondents of each state, the average state income, and
the Republican presidential election share in 2004. �e variances of these varying intercepts
are thus modeled from the correlated grouping structures (Gelman and Hill 2006).
9
Dra� version! Please do NOT cite without permission!
A�er �tting this multilevel logistic regression, we calculated the predictive probability
of the support of voucher opinion for each demographic-geographic type θ. �ere are 7140
(51 states × 4 regions × 5 income categories × 7 religion/ethnicity) combinations of these
demographic-geographic types. For the purpose of our analysis, we exclude the region as-
pects and focus looking at the state-level responses. Henceforth, we are le� with 1785 cells
of estimates.
Next, to correct the e�ciency problem, we poststratify these estimates θ’s with popu-
lation percentages N ’s. �e corresponding population percentages of these 1785 cells are
calculated from IPUMS “5-Percent Public Use Microdata Sample” from the United States
census data. Henceforth, for each theta j in each state s, the weighted predictive probability
( ys) is:
ys =∑ j∈s N jθ j
∑ j∈s N j(2)
Results of MRP
Figure 3 and Figure 4 visually display these 1785 estimates from the NAES in 2000 and
20042, both of which asked a question of whether the Federal government should give school
vouchers, respectively. �e support is displayed with brown color and the opposition is dis-
played with blue. Other colors are blended with the increasing level of gray color and hence
revealed the percentage of voucher opinion as they fall close to the national average. �e
average percentage of voucher opinion is colored as gray.
In a broader picture, if we just look at the American voters as a whole, without taking
2 �ese surveys are rolling cross-sections with about 100,000 respondents each, which become 48,778 and
55,977 once we restrict ourselves to those who were asked and responded to the income, ethnicity, religion,
and voucher questions. �e question in 2004 allowed �ve possible answers. We excluded from our analysis
the 30% of respondents who gave the middle category.
10

Dra� version! Please do NOT cite without permission!
into account race and religion aspects, there is no strong pattern between di�erent states. In
2000, for those whose income levels are over $150,000, the support for voucher is somewhat
higher in the east. But the pattern disappears in 2004. Henceforth, in the followings, we
examine American voters by further breaking them down into di�erence race and religion
groups.
Similar to Moe (2001) and Witte and �orn (1996), we �nd vouchers are particularly
popular among Roman Catholics and also, to a lesser extent, among born-again Protestants.
African Americans in general support vouchers. Nonetheless, we discover some subtlety by
taking into account the income and geographical factors.
Vouchers are most popular among high-income white Catholics and Evangelicals and
low-income Hispanics. In general, among white groups, the higher the income, the more
popular are school vouchers. But among nonwhites, it goes the other way: with vouchers
being popular in the lower income categories but then becoming less popular among the
middle class.
�e support for vouchers roughlymatchesRepublican voting, but not completely. Vouch-
ers are popular in the heavilyCatholicNortheast andCalifornia, less so inmany of themostly
Protestant states in the Southeast.
We also see a regional pattern among African Americans, where vouchers are most pop-
ular outside the South. We observe similar patterns between African-American and non-
whites with respect to low income people. African-American support for vouchers is also
higher at lower incomes and in addition is consistently higher in the northeast and midwest
than in the south.
We �nd similar patterns from the 2004 Annenberg survey. But it is di�cult to make a
direct comparison to the 2000 survey because the question was worded di�erently: instead
of yes/no, it recorded with �ve possible responses. We counted the two positive responses as
11
Dra� version! Please do NOT cite without permission!
Yes, the two negative responses as No, and discarded the 30% or responses in themiddle cat-
egory (Neither favor nor oppose). Nonetheless, beyond these similar patterns between 2000
and 2004, the most notable change is the increase in support from 2000 to 2004. Although
this trend is tricky to assess from these data alone, as the wording for the coded responses
in the survey was changed.
Insofar, we obtain much more subtle information using MRP by breaking the data into
many categories.�is could not have been donewith simple raw state estimates (disaggrega-
tion) because wemight not have enough sample sizes in some categories; and thus wemight
fail to garner estimates or estimates with greater uncertainty. One the other hand, our MRP
method addresses to this data issue. Nonetheless, since our estimates are predictive proba-
bility that estimated from an elaborated multilevel logistic regression, as shown in Equation
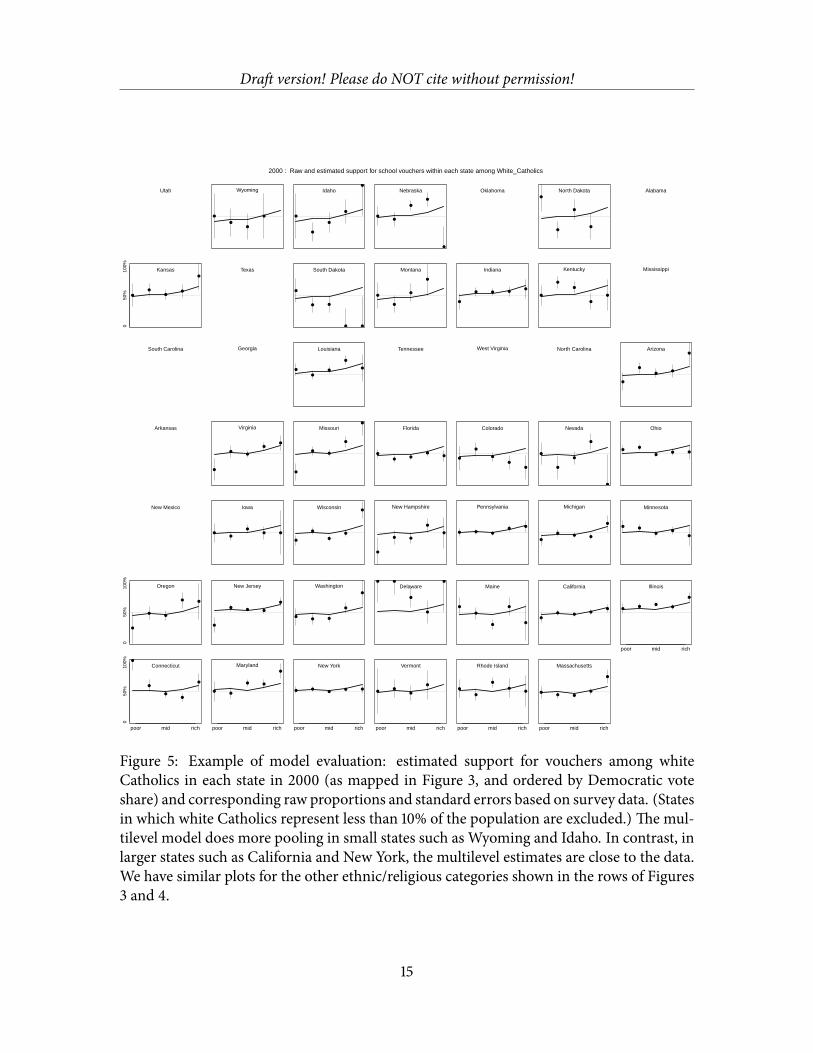
(1), their predictions are succumbed to the goodness of �t of the model. For the assessment
purpose, we illustrate in Figure 5, which shows estimates and raw data for white Catholics
in each state.
Comparing Figure 5 to Figure 3, the estimates from the multilevel model does more
pooling in small states such as Wyoming and Idaho. In contrast, in larger states such as
California and New York, the multilevel estimates are close to the data. We have similar
plots for the other ethnic/religious categories shown in the rows of Figures 3 and 4.
Discussions and Conclusions
Since 1970’s, scholars have found that the estimates of voucher opinions of American people
varied overtime. Moe (2001) have thus conjectured that Americans might not understand
the voucher policy or the existing data failed to garner the real opinion of vouchers. With
this respect, Chubb andMoe (2001) designed a new survey in 1995, and looked at American
12

Dra� version! Please do NOT cite without permission!
All voters
WhiteCatholics
White evangelicalProtestants
White non−evang.Protestants
White other/no religion
Blacks
Hispanics
Other races
Income under $20,000 $20−40,000 $40−75,000 $75−150,000 Over $150,000
70%45%20%The state is left blank where a category represents less than 1% of the voters of a state
2000: Do you support school vouchers?
Figure 3: Estimates of proportion of voters who support school vouchers in each state in
2000, for voters of di�erent religious/ethnic categories and �ve di�erent categories of family
income. Colors (brown as support and blue as opposition) show support relative to the
national average (gray).
13

Dra� version! Please do NOT cite without permission!
All voters
WhiteCatholics
White evangelicalProtestants
White non−evang.Protestants
White other/no religion
Blacks
Hispanics
Other races
Income under $20,000 $20−40,000 $40−75,000 $75−150,000 Over $150,000
77%52%27%The state is left blank where a category represents less than 1% of the voters of a state
2004: Do you support school vouchers?
Figure 4: Estimates of proportion of voters who support school vouchers in each state in
2004, for voters of di�erent religious/ethnic categories and �ve di�erent categories of family
income. Colors (brown as support and blue as opposition) show support relative to the
national average (gray). �e patterns are similar to those in 2000; see Figure 3.
14
Dra� version! Please do NOT cite without permission!
Utah Wyoming
●
●
●
●
Idaho
●
●
●
●
●
Nebraska
●
●
●
●
●
Oklahoma North Dakota●
●
●
●
Alabama
050
%10
0%
Kansas
●
●
●
●
●
Texas South Dakota
●
● ●
● ●
Montana
●
●
●
●
Indiana
●
● ● ●●
Kentucky
●
●
●
●
●
Mississippi
South Carolina Georgia Louisiana
●
●
●
●
●
Tennessee West Virginia North Carolina Arizona
●
●
●●
●
Arkansas Virginia
●
●●
●
●
Missouri
●
●●
●
●
Florida
●
●●
●●
Colorado
●
●
●
●
●
Nevada
●
●
●
●
●
Ohio
●●
●● ●
New Mexico Iowa
●
●
●
● ●
Wisconsin
●
●
●
●
●New Hampshire
●
● ●
●
●
Pennsylvania
● ●●
●●
Michigan
●
●●
●
●
Minnesota
●●
●●
●
050
%10
0%
Oregon
●
●●
●●
New Jersey
●
●● ●
●
Washington
●● ●
●
●
Delaware● ●
●
●
●
Maine
●
●
●
●
●
California
●
●●
●
●
poor mid rich
Illinois
●●
●●
●
050
%10
0%
poor mid rich
Connecticut●
●
●
●
●
poor mid rich
Maryland
●●
● ●
●
poor mid rich
New York
●●
●● ●
poor mid rich
Vermont
●●
●
●
poor mid rich
Rhode Island
●
●
●
●●
poor mid rich
Massachusetts
●● ●
●
●
2000 : Raw and estimated support for school vouchers within each state among White_Catholics
Figure 5: Example of model evaluation: estimated support for vouchers among white
Catholics in each state in 2000 (as mapped in Figure 3, and ordered by Democratic vote
share) and corresponding raw proportions and standard errors based on survey data. (States
in which white Catholics represent less than 10% of the population are excluded.) �e mul-
tilevel model does more pooling in small states such as Wyoming and Idaho. In contrast, in
larger states such as California and New York, the multilevel estimates are close to the data.
We have similar plots for the other ethnic/religious categories shown in the rows of Figures
3 and 4.
15

Dra� version! Please do NOT cite without permission!
people in various demographical aspects. �ey found that those with stakes on vouchers are
going to support vouchers more than those without. Henceforth, they found that African
American and Hispanics, in general, are more sympathetic to vouchers. Lower income peo-
ple support vouchers stronger than rich people do. And parents favor vouchers more than
nonparents.
In light of the �ndings of Moe (2001), we believe that there are more to gauge from
the Americans in terms of their voucher opinions. In particular, we shall not neglect the
geographical factors such as state and region that o�en the times do a�ect the opinions of
American people. Moreover, we have every reason to believe that there are interaction e�ects
between several important factors. Nonetheless, to look at the data this way, we have to break
the data further into small pieces and we thus will encounter the e�ciency problem of the
estimates.
We propose the use of a model based simulation method - multilevel regression and
poststrati�cation - to estimate the voucher opinions. �e step of multilevel regression al-
lows us to pool the estimates toward the overall mean whereas the sample size is small. �e
pooling is modeled based prediction and thus we are using information from other predic-
tors and the correlations of these predictors with respect to the data structure of other group
levels. �is makes much sense than the simple raw estimates from average of small sample
sizes. �e step of poststrati�cation using population percentage further gives us more e�-
cient estimates. Overall, withMRP, we garnermore reliable andmore sensible estimates and
are able to look at data in many segments.
In addition to traditional demographic trait of voucher opinions, our estimates of MRP
demonstrate the subtle di�erence between racial-religious groups. In particular, vouch-
ers are most popular among high-income white Catholics and Evangelicals that in general,
among whites, the higher the income, the more popular vouchers are. But the pattern goes
16
Dra� version! Please do NOT cite without permission!
the other way among nonwhites. Vouchers are less popular amongmid-income class people
but are more welcome in lower income nonwhites. Additionally, there is a signi�cant region
pattern that vouchers are popular among African American in the south,
As noted in the beginning of the paper, we are not trying to o�er answers to explain why
some Americans support vouchers and why some don’t. In the past, scholars have mixed
conclusions about voucher opinions because they were limited by either the quality of the
data or the use of methods. Henceforth, it is our major goal to contribute to the voucher
literatures in �nding who support vouchers by looking at American people in various de-
mographical and geographical aspects. Nevertheless, one can imagine that theremore subtle
patterns le� to be discovered in the data about voucher opinions. �ese patterns are going
to be the bases for model buildings, which are going to be used to answer the reason why
American support vouchers.
17

Dra� version! Please do NOT cite without permission!
ReferencesBates, Douglas, and Martin Maechler. 2010. lme4: Linear mixed-e�ects models using S4
classes. R package version 0.999375-34, URL http://CRAN.R-project.org/package=
lme4.
Bush, Lawson V. 2004. “Access, School Choice, and Independent Black Institutions: A His-
torical Perspective.” Journal of Black Studies 34 (3): 386–401. URL http://www.jstor.org/stable/3180943.
Chubb, John E., and Terry M. Moe. 1988. “Politics, Markets, and the Organization of
Schools.” �e American Political Science Review 82 (4): 1066–1087. URL http://www.
jstor.org/stable/1961750.
Chubb, John E., and Terry M. Moe. 1990. Politics, Markets, and America’s Schools. Washing-
ton, D.C.: Brookings Institution.
Erikson, Robert S., Gerald C.Wright, and John P. McIver. 1993. Statehouse Democracy: Pub-lic Opinion and Policy in the American States. Cambridge: Cambridge University Press.
Ferreyra, Maria Marta. 2007. “Estimating the E�ects of Private School Vouchers in Mul-
tidistrict Economies.” �e American Economic Review 97 (3): 789–817. URL http:
//www.jstor.org/stable/30035020.
Gelman, Andrew, and Jennifer Hill. 2006. Data Analysis Using Regression and Multi-level/Hierarchical Models. UK: Cambridge University Press.
Gelman, Andrew, and �omas Little. 1997. “Postrati�cation into Many Categories Using
Hierarchical Logistic Regression.” Survey Methodology 23 (2): 127–135. URL http://
www.statcan.gc.ca/bsolc/olc-cel/olc-cel?catno=12-001-X19970023616.
Gelman, Andrew, David Park, Boris Shor, Joseph Bafumi, and Jeronimo Cortina. 2009. RedState, Blue State, Rich State, Poor State: Why Americans Vote the Way �ey Do? 2nd ed.
Princeton: Princeton University Press.
Howell, William G. 2004. “Dynamic Selection E�ects in Means-Tested, Urban School
Voucher Programs.” Journal of Policy Analysis and Management 23 (2): 225–250.
Lax, Je�rey R., and Justin H. Phillips. 2009. “Gay Rights in the States: Public Opinion
and Policy Responsiveness.” American Political Science Review 103 (3): 367–386.
URL http://journals.cambridge.org/action/displayAbstract?fromPage=
online&aid=6101660&fulltextType=RA&fileId=S0003055409990050.
Levin, HenryM. 2002. “AComprehensive Framework for Evaluating EducationalVouchers.”
Educational Evaluation and Policy Analysis 24 (3): 159–174. URL http://www.jstor.
org/stable/3594163.
18

Dra� version! Please do NOT cite without permission!
Metcalf, KimK., andNatalieA. Legan. 2002. “EducationalVouchers: APrimer.”�eClearingHouse 76 (1): 25–29. URL http://www.jstor.org/stable/30189782.
Moe, Terry M. 2001. Schools, Vouchers, and the American Public. Washington, D.C.: Brook-
ings Institution Press.
Park, David, Andrew Gelman, and Joseph Bafumi. 2006. “State Level Opinions from Na-
tional Surveys: Poststrati�cation UsingMulitlevel Logistic Regression.” In Public Opinionin State Politics, edited by Je�rey E. Cohen. Standford, CA: Stanford University Press, pp.
209–228.
Witte, John F. 1998. “�e Milwaukee Voucher Experiment.” Educational Evaluation andPolicy Analysis 20 (4): 229–251. URL http://www.jstor.org/stable/1164323.
Witte, John F., and Christopher A.�orn. 1996. “Who Chooses? Voucher and Interdistrict
Choice Programs in Milwaukee.” American Journal of Education 104 (3): 186–217. URL
http://www.jstor.org/stable/1085641.
19


![ÝÝÝ¡¡¡Ý¡‰‰‰ŸŸ‰Ÿ]]]Ÿ]hhhh ]]] ] · 2018. 7. 31. · ÷÷÷÷zzzz ÝÝÝ¡¡¡Ý¡‰‰‰ŸŸ‰Ÿ]]]Ÿ]hhhh]]] ] ((((]]]ZZ]ZZxxxxÆÆÆÆ)))) {{{{uuukkkŠŠŠŠ](https://img.dokumen.tips/doc/110x75/60c5c73620d4a617ba4141c0/aaaahhhh-2018-7-31-zzzz-aaaahhhh.jpg)


![ÿÿÿ ôôô ÿÿÿ üüü ÿÿÿ ÿÿÿ ýýý õõõ ÿÿÿ7gym-laris.lar.sch.gr/ergasies/KATASKEVES ERGASIA.pdf · [5] ΠΕΡΙΕΧΟΜΕΝΑ ΕΙΣΑΓΩΓΗ ΤΟ ΝΕΡΟ ΣΤΗ](https://img.dokumen.tips/doc/110x75/5e0f2d973141e136fc040d4e/-7gym-larislarschgrergasieskataskeves.jpg)