Embed Size (px)
Citation preview

PRIVATE & CONFIDENTIAL www.dtz.com
DTZ, a UGL company
Job No/Ref:
Wakefield CIL Viability Addendum
Prepared on behalf of Wakefield Council December 2014

Page 2
Contents 1 Purpose and Scope of Addendum ............................................................................................................................... 3
2 Summary of Representations and Response ............................................................................................................... 4
3 Amended Residential Viability Modelling and CIL Headroom Calculations ................................................................ 7
3.1 Site size .................................................................................................................................................................. 7
3.2 House sizes, housing mix and site density ............................................................................................................. 7
3.3 Build costs .............................................................................................................................................................. 9
3.4 Site abnormals ....................................................................................................................................................... 9
3.5 Site value thresholds ........................................................................................................................................... 10
3.6 Other appraisal assumptions ............................................................................................................................... 11
3.7 CIL Headroom and viability cushion .................................................................................................................... 13
4 S106 and affordable housing evidence ..................................................................................................................... 15
4.1 Affordable Housing and CIL ................................................................................................................................. 15
4.2 S106 evidence – Residential ................................................................................................................................ 18
4.3 S106 evidence - Retail.......................................................................................................................................... 19
5 Retail Evidence .......................................................................................................................................................... 21
5.1 Differentiation of CIL tariff by Supermarket size band ........................................................................................ 21
5.2 Retail Evidence .................................................................................................................................................... 21
6 Conclusion and Recommendations ........................................................................................................................... 25
Appendix 1 Data for average house prices in value area map ......................................................................................... 26
Appendix 2 Supermarket Yields Evidence ........................................................................................................................ 27
Appendix 3 Gardiner and Theobald Cost Report .............................................................................................................. 29

Page 3
1 Purpose and Scope of Addendum
This report has been prepared by DTZ in response to representations made in relation to Wakefield Council’s Community Infrastructure Levy Preliminary Draft Charging Schedule, which was consulted on in July/August 2014. It responds to the main representations made that relate to the viability evidence document, prepared by DTZ dated February 2014.
The report first summarises the main representations that have been made relating to viability and provides a response to each. It then goes on to outline supplementary evidence in support of the Community Infrastructure Levy, specifically:
Additional economic viability modelling of residential development
Details of the affordable housing and S106 agreements in Wakefield
Further evidence to support the retail viability assessment set out in the February 2014 report
It should be noted that this document does not represent a comprehensive update to the viability evidence produced earlier this year, but rather supplementary advice that should be read in conjunction with the February report. The residential modelling however can be interpreted as superseding that set out in the February report as the basis of the CIL rates that are proposed. In summary, the report reinforces the viability evidence for the introduction of a Community Infrastructure Levy in Wakefield District. However, it proposes the following changes to the way that the Council introduces CIL:
It recommends a reduction in the CIL rate charged in the medium value area from £33 per sq m
to £20 per sq m. This takes account of the economic viability modelling of additional schemes
contained in this report and ensures there is an adequate viability cushion allowed for on
schemes within this charging zone.
It recommends that the Council consider options for mitigating the impact of CIL on large scale
sites that may incur an above average level of residual S106/278 obligations alongside CIL.

Page 4
2 Summary of Representations and Response
The table below summarises the main representations that are related to viability evidence, together with a response:
Points raised in consultation
DTZ Response
Insufficient evidence to justify differentiation of charging rates in retail classification
The archetypes selected reflect the different typical models being implemented in the supermarket sector and 2000 sq m is considered an appropriate threshold to set reflecting the different viability characteristics and performance at each level. Further evidence is provided in Section 5 below.
Larger sites should be sampled
The working assumption was that because payments for land, planning obligations and CIL would be phased, then provided the largest site tested in the area wide model was of an adequate size to reflect that of the largest phase of a strategic site, then it would provide consistent results and there was no need to sample a larger site. Because the site specific report looked at larger sites, it was considered to provide adequate consideration to larger sites. However we have devised and tested further schemes for larger sized sites at 5 ha and 10ha to test/check the results (see Section 3 below) and to provide wider range of representation of site typologies across the District.
House sizes are too large
House sizes were selected to reflect the range of densities and site coverage expected across the District given policy based density objectives. Further testing has been carried out to review smaller units sizes (see Section 3 below)
Site value thresholds too low
Site value thresholds are based on evidence of levels agreed on viability cases in the District to date and are therefore reflective of precedent levels within the market and as such are considered to provide the land owner with a ‘competitive return’ in accordance with National Planning Policy Guidance. It is important to note that RICS guidance advises that historic market land values should be discounted to allow for the effects of future policy (in this case the future CIL tariff). A small increase in site values has been incorporated into the revised residential viability modelling set out in Section 3 to reinforce the viability cushion within the appraisal.
Build costs too low
Independent cost advice has been supplied by national cost specialist Gardiner and Theobald, details of which are set out in Appendix 3 and summarised in Section 3 below.
Insufficient allowance for abnormals
The allowance of £100,000 per acre is intended to allow for a typical level of abnormal costs. The site values are considered to provide a degree of tolerance such that if abnormals were
Page 5
higher they could be absorbed into a reduced site value.
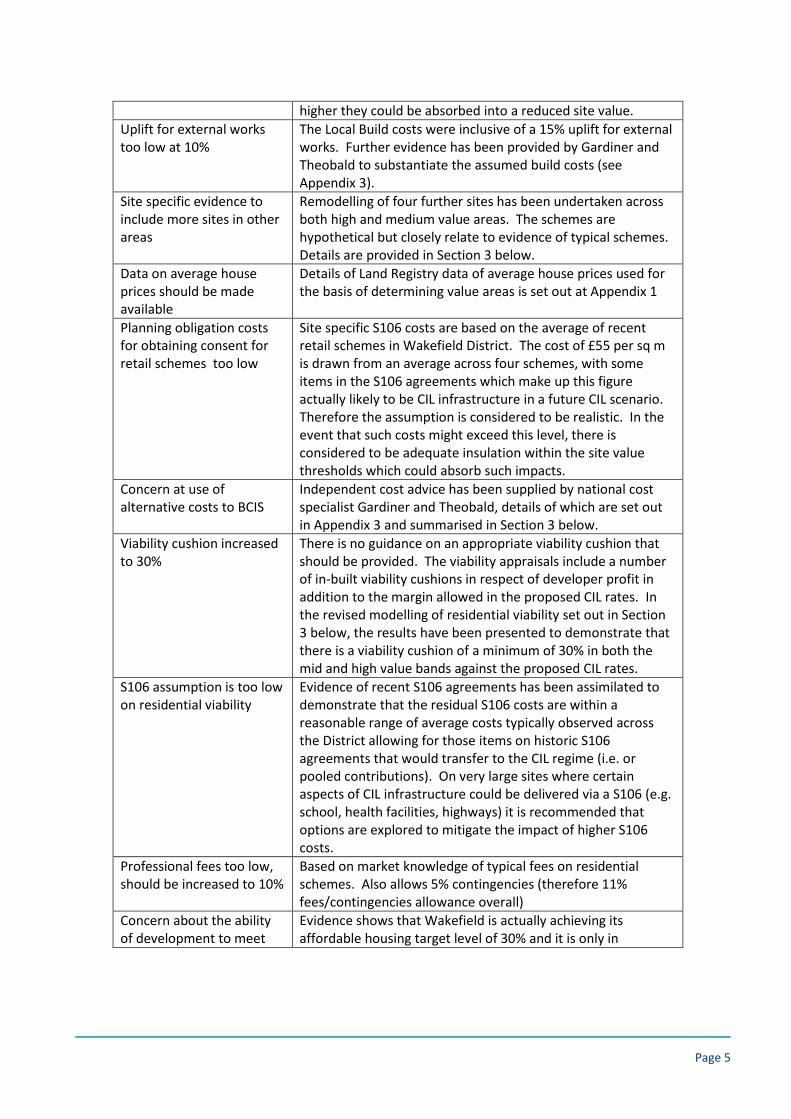
Uplift for external works too low at 10%
The Local Build costs were inclusive of a 15% uplift for external works. Further evidence has been provided by Gardiner and Theobald to substantiate the assumed build costs (see Appendix 3).
Site specific evidence to include more sites in other areas
Remodelling of four further sites has been undertaken across both high and medium value areas. The schemes are hypothetical but closely relate to evidence of typical schemes. Details are provided in Section 3 below.
Data on average house prices should be made available
Details of Land Registry data of average house prices used for the basis of determining value areas is set out at Appendix 1
Planning obligation costs for obtaining consent for retail schemes too low
Site specific S106 costs are based on the average of recent retail schemes in Wakefield District. The cost of £55 per sq m is drawn from an average across four schemes, with some items in the S106 agreements which make up this figure actually likely to be CIL infrastructure in a future CIL scenario. Therefore the assumption is considered to be realistic. In the event that such costs might exceed this level, there is considered to be adequate insulation within the site value thresholds which could absorb such impacts.
Concern at use of alternative costs to BCIS
Independent cost advice has been supplied by national cost specialist Gardiner and Theobald, details of which are set out in Appendix 3 and summarised in Section 3 below.
Viability cushion increased to 30%
There is no guidance on an appropriate viability cushion that should be provided. The viability appraisals include a number of in-built viability cushions in respect of developer profit in addition to the margin allowed in the proposed CIL rates. In the revised modelling of residential viability set out in Section 3 below, the results have been presented to demonstrate that there is a viability cushion of a minimum of 30% in both the mid and high value bands against the proposed CIL rates.
S106 assumption is too low on residential viability
Evidence of recent S106 agreements has been assimilated to demonstrate that the residual S106 costs are within a reasonable range of average costs typically observed across the District allowing for those items on historic S106 agreements that would transfer to the CIL regime (i.e. or pooled contributions). On very large sites where certain aspects of CIL infrastructure could be delivered via a S106 (e.g. school, health facilities, highways) it is recommended that options are explored to mitigate the impact of higher S106 costs.
Professional fees too low, should be increased to 10%
Based on market knowledge of typical fees on residential schemes. Also allows 5% contingencies (therefore 11% fees/contingencies allowance overall)
Concern about the ability of development to meet
Evidence shows that Wakefield is actually achieving its affordable housing target level of 30% and it is only in

Page 6
both affordable housing and CIL requirements
circumstances where there is an unusually large level of abnormal site costs where the level of affordable housing achieved falls below the target level. Evidence is presented below in Section 4.
Agricultural dwellings, disabled dwellings, care homes.
Agricultural dwellings Where houses are constructed on farms, they will be subject to CIL, but for other agricultural buildings they will not since they do not conform to the types of development that are liable for CIL on the charging schedule. No evidence has been provided to indicate or demonstrate that there is any difference between the viability of building dwellings on a farm as compared to any other site and in the absence of such it is not appropriate to differentiate in respect of CIL tariff. Disabled dwellings It is noted that the introduction of Lifetime Home standards would introduce an uplift on build costs. However, no such policy exists in Wakefield and it is therefore not considered appropriate to make such an allowance in the viability appraisals since in the large majority of cases such standards are not being implemented by house-builders. The appraisals do provide an in-built viability cushion through the allowance for abnormals so it is possible that Lifetime Home costs could be absorbed by development with the proposed levels of CIL subject to the aggregate effect of other abnormal costs. Care homes The February 2014 Viability Evidence report included analysis of a care home scheme and concluded that viability could be placed at risk through the introduction of CIL on this property type therefore no CIL levy should be applied.

Page 7
3 Amended Residential Viability Modelling and CIL Headroom Calculations
This section deals with the representatives made that relate to the residential viability assessment, specifically that:
House sizes are too large
Larger sites should be sampled
Site value thresholds are too low
Build costs are too low
There is insufficient allowance for abnormals
The viability cushion should be increased to 30%
A review of the viability evidence has been produced taking into consideration the representations made and additional evidence sought. A revised modelling exercise has been undertaken of new sites with adjustments to a number of key appraisal variables set out in the February 2014 DTZ viability report. The site characteristics, scheme details and appraisal assumptions for this analysis are set out below.
3.1 SITE SIZE The site sizes tested have been revised following the earlier modelling so that the focus is on the main site typologies that are expected to dominate housing delivery in Wakefield in the short to medium term. The net site areas tested are as follows:
1 ha (2.471 acres)
2.5 ha (6.18 acres)
5 ha (12.36 acres)
10 ha (24.74 acres)
These sites have been tested in Value Area 1 and Value Area 2. Value Area 3 has not been remodelled since it is proposed to carry a zero tariff.
3.2 HOUSE SIZES, HOUSING MIX AND SITE DENSITY Comments were made in representations that the dwelling sizes applied in the area wide model were larger than typical in the market. Dwelling sizes are a key variable which affect the amount of development on each site and therefore influence the viability results. We have revised the dwelling sizes in the light of our review of evidence. The following adjustments have been made to house sizes. These adjustments take account of the representations made and our review of evidence:

Page 8
Feb-14 Revised
House type (sq m) (sq ft) (sq m) (sq ft)
2 bed house 81 872 70 753
3 bed house 98 1055 80 861
4 bed house 125 1345 115 1238
5 bed house 144 1550 140 1507
It should be noted that dwelling size is one of three key variables which drive density of development in the model; the other two being mix (i.e. the mix of different sized properties) and dwellings per ha. Further, it should be noted that these three variables are interrelated since, for example, a greater emphasis on larger house sizes will result in a lower number of dwellings per ha, or reduced house sizes will enable a higher number of dwellings to be achieved on a given site. It is therefore not possible to review one without giving consideration to the others. In our experience house builders often use the measure of ‘sq ft per acre’ as an indicator of performance when benchmarking density and that a range of 14,000 to 16,000 sq ft per acre is typically sought. We have reviewed local evidence of development density on the basis of the amount of floor space per ha/acre as a means of ‘sense-checking’ the suitability of the assumptions overall. Our review of the evidence, summarised below, indicates an average of approximately 15,000 sq ft per acre.
Source: planning applications, Wakefield Council Achieving an appropriate level of density on the basis of floor space per site area is therefore the key performance indicator and the combination of house size, units per ha and mix need to be balanced to create the right level of overall density within the model. The mix of houses on each site sampled has been adjusted so that it is entirely housing with no flats. This is reflective of current market conditions in which house builders remain focused on mid and lower density schemes with low or no flat content. A density of 30 dwellings per ha has been assumed which, given it is at the lower end of the density range (Wakefield Core Strategy policy indicates a requirement 30-50 dwellings per ha), is considered suitable to a mid/large size mix of 3, 4 and 5 bedroom houses. Taken together with the unit sizes outlined above, this generates a site
Developer Site Net Area Acres Density/Hectare Square foot coverage per acre
Miller Homes Altofts 2.3 5.6833 34.5 14,166
Barratt Balne Mills, Wakefield 3.14 7.75894 43.2 15,304
Barratt Healdfield Road, Castleford 2.63 6.49873 28.1 12,396
Strata Flass Lane, Castleford 4.11 10.15581 53 21,506
Gleeson Langthwaite 4.2 10.3782 40.5 12,850
Lumley Street, Castleford 3.49 8.62379 39.6 13,564
Seddon Fryston 11.16 27.57636 31.9 14,828
Persimmon Northfield Lane 4.1 10.1311 47.6 16,753
Taylor Wimpey Flass Lane, Castleford 15.8 39.0418 39 17,204
Taylor Wimpey Sharlston 3.6 8.8956 39.8 15,798
Harworth Estates Prince of Wales, Pontefract 45 111.195 37 13,969
168,338
Average 15,303

Page 9
density of 14,300 per acre. An alternative scenario was also examined with a different combination of small, mid and large sized properties and a density of 35 units per ha, which generated a similar level of floor space per acre. This level of density is within and towards the bottom end of the range of stated above and is therefore considered reinforce and validate the assumptions relating to house size, mix and dwellings per ha.
3.3 BUILD COSTS The ‘local’ build costs used in the February 2014 report were based on local evidence from viability cases of typical build costs over the last two years in Wakefield. The cost assumption used was £807 per sq m (75 per sq ft). It should be noted that this cost is exclusive of contingency and fees and that with contingency and fee levels added grosses to £896 per sq m (83.25 per sq ft). The cost rate is intended to be representative of typical national house builders’ costs. An independent cost expert – Gardiner and Theobald – has since been commissioned by DTZ on behalf of Wakefield Council to review this cost assumption. The report, attached at Appendix 3, provides a break-down of cost rates for a typical scheme based on their experience and evidence from across the country. The report indicates a cost of £862 per sq m (£80.10 per sq ft) inclusive of external works, fees and contingencies, therefore supporting the figures used in the earlier report. The cost assumptions have in any event been increased slightly to a figure of £824 per sq m (£76.58 per sq ft) to allow for a further buffer and to add further robustness to the evidence, equating to £915 per sq m (£85 per sq ft) including contingencies and fees. An additional 5% on the build cost has also been added for the 1 ha sites tested, to reflect the possibility of smaller local house builders having to incur higher build cost rates. The revised build costs are as follows:
House build cost
£psf £psm
Inc externals 76.58 824
Professional fees 6% 6%
Contingencies 5% 5%
Subtotal (exc finance) 85 915
3.4 SITE ABNORMALS Regarding site abnormal costs, a figure of £247,100 per ha (£100,000 per acre) has been allowed for reflected in the site value thresholds assumed in the model. Site value thresholds have been increased below but no further increase has been made to the abnormals allowance. Gardiner and Theobald have allowed for an uplift on the build cost of £3.12 per sq ft for a typical level of abnormals. Applying this to the average site cover per acre of £14,310 equates to a figure of £47,000 per acre, indicating that the £100,000 per acre provides a generous allowance for a typical site in normal circumstances.

Page 10
Whilst it is recognised that site abnormal costs could occasionally exceed this figure depending on individual circumstances, there is considered to be a reasonable level of tolerance in the site value thresholds to allow some further insulation from variations. Moreover, there is flexibility in the way that other planning standards and obligations could be negotiated given such exceptional circumstances so as to enable viability of delivery not to be put at risk by CIL, much in the same way that the Council has implemented its Core Strategy policies to date. Analysis of the Council’s site allocations indicates that the majority are Greenfield. The total site area remaining for the allocations in the Council’s Development Plan is 211.06ha, 51.43 ha of which are Brownfield and 159.63ha (76%) are Greenfield. Whilst this does not mean that there will be no site abnormals in the majority of cases (since Greenfield sites can also experience abnormal development costs), it does indicate that the unusually high abnormal development costs associated with site remediation/decontamination with previously developed sites will not be the norm. Therefore, this reinforces the case that the viability evidence should be predicated on a normal/typical allowance for abnormals such as £247,100 per ha, rather than an extraordinary one.
3.5 SITE VALUE THRESHOLDS The National Planning Policy Guidance documents confirm the approach taken to site value stating that it should:
Reflect emerging policy requirements and planning obligations and, where applicable, any
Community Infrastructure Levy charge;
Provide a competitive return to willing developers and land owners (including equity resulting
from those building their own homes); and
Be informed by comparable, market-based evidence wherever possible. Where transacted bids
are significantly above the market norm, they should not be used as part of this exercise.
There has been much debate about the most suitable approach to determining minimum site value thresholds, with the Local Housing Delivery Group report Viability Testing Local Plans (June 2012) recommending that site value thresholds should be predicated on the basis of an uplift from Existing Use Values (EUV) and the RICS Financial Viability in Planning (1st Edition 2012) advising against the use of EUV and recommending a discount from Market Value based approach instead. The National Planning Policy Guidance (2014) refers to the use of comparable market based evidence and re emphasises the requirement for a ‘competitive return’ to land owner indicating a closer alignment with the RICS approach. The site value thresholds that have been applied are based on comparable evidence of minimum prices agreed on viability cases (as set out in the February 2014 DTZ report) and as such are considered to provide land owners with a competitive market adjusted return and therefore conform to National Planning Policy Guidance. Evidence of the site values from which the thresholds has been derived is set out below:

Page 11
Site Base land
value
Net site area Land value per ha
Balne Mills, Wakefield £520,000 1.27 ha (3.14 acres) £410,000 per ha (£166,000 per acre)
Healdfield Road,
Castleford
£558,000 1.06 ha (2.63 acres) £526,000 per ha (£212,000 per acre)
Beechnut Lane,
Pontefract
£458,000 0.73 ha (1.8 acres) £627,000 per ha (£254,000 per acre)
Standbridge Lane,
Crigglestone
£1,741,000 3.52 ha (8.7 acres) £495,000 per ha (£200,000 per acre)
Walton Lane, Wakefield £5,680,000 6.27 ha (15.5 acres) £905,000 per ha (£366,000 per acre)
Northfield Lane South
Kirkby
£813,000 1.65 ha (4.08 acres) £493,000 per ha (£199,000 per acre)
Flass Lane, Castleford £1,235,000 1.47 ha (3.63 acres) £840,000 per ha (£340,000 per acre)
Flass Lane (2),
Castleford
£4,813,000 6.39 ha (15.8 acres) £753,000 per ha (£305,000 per acre)
Fryston, Castleford £1,280,000 4.49 ha (11.1 acres) £285,000 per ha (£115,000 per acre)
Newton Hill, Wakefield £907,000 2.49 ha (6.03 acres) £364,000 per ha (£147,000 per acre)
Langthwaite, South
Kirkby
£1,158,000 1.70 ha (4.2 acres) £681,000 per ha (£276,000 per acre)
Whilst the land values previously used are considered to be reasonable for the purpose as a benchmark for testing, we have increased the site value thresholds by approximately 10% to add further robustness to the evidence. The revised site value thresholds, expressed in net developable areas, are as follows:
February 2014 report Revised assumptions
Site value thresholds £ per acre £ per ha £ per acre £ per ha
Value area 1 £400,000 £988,400 £425,000 £1,050,175
Value area 2 £337,500 £834,000 £350,000 £864,850
NB. These site value thresholds include an allowance of £247,100 per ha (£100,000 per acre) for abnormal site development costs.
3.6 OTHER APPRAISAL ASSUMPTIONS Sales value assumptions remain within the ranges of the earlier report with the following single levels tested. For the high value area, £2045 per sq m (£190 per psf) has been assumed which is the mid- point of the two earlier assumptions (£180 psf and £200 psf). For the mid value area a figure of £1884 per sq m (£175 psf) has been assumed which is the upper of the two figures previously applied (£170 and £175 psf) but which is supported by the balance of evidence set out in the February 2014 report which indicated a range of £1830 to £1916 per sq m (£170-178 psf) for new build values in this location.

Page 12
Affordable housing transfer values for social rented units have been adjusted downwards in the high value area from 47.5% of market value to 42%, to reflect the latest advice from Wakefield Council. Otherwise the assumptions remain the same:
Affordable housing % of units 30% Intermediate/social 50/50
Discount (% of MV) Value
area 1 Value
area 2
Intermediate 55% 55%
Social 42% 45%
The following delivery rates have been assumed which are broadly consistent with the earlier report albeit with some small adjustments to reflect the different site sizes tested. The larger site of 10ha assumes two house-builders developing out concurrently:
Delivery rates
Units p/a 1 ha 24 2.5 ha 36 5 ha 36 10 ha 70
Developer’s profit has been adjusted to 17.5% of GDV. This represents a blended rate which allows for 20% profit of GDV for market housing and a lower contractor’s based profit of 6% on affordable units. It is assumed that affordable housing will be transferred to a Registered Provider on a pre sale basis for which it is considered reasonable to assume a contractor’s margin would apply. By adjusting the profit figure in the model, the analysis merely externalises what was previously an in-built viability cushion as explained in the February 2014 report. NB It should be noted that the profit figure is a net profit, therefore it excludes overheads and finance costs which are addressed separately in the model. All other assumptions remain consistent with the February 2014 report:
Other assumptions
Finance 6.50% Acquisition costs 5.80% Sales agent and
marketing 3.50%

Page 13
3.7 CIL HEADROOM AND VIABILITY CUSHION The schemes have been remodelled on the basis of the revised assumptions set out above. The results are presented below for Value Area 1 and Value Area 2. Value Area 3 has not been remodelled as this is considered to remain unviable for CIL in prevailing market conditions.
Table 3.1: Value Area 1
Dwellings per ha Sq m Ha
Actual residual of each archetype
Site value benchmark actual
Headroom (balance against benchmark)
Max CIL Per sq m
30 3285 1.00 £1,235,673 £1,050,175 £196,257 £85
30 8213 2.50 £3,129,646 £2,625,438 £533,453 £93
30 16425 5.00 £5,901,174 £5,250,875 £688,016 £60
30 32850 10.00 £12,179,450 £10,501,750 £1,775,006 £77
Mean £79
Median £81
Table 3.2: Value Area 2
Dwellings per ha Sq m Ha
Actual residual of each archetype
Site value benchmark actual
Headroom (balance against benchmark)
Max CIL Per sq m
30 3285 1.00 £935,762 £864,850 £75,025 £33
30 8213 2.50 £2,434,023 £2,162,125 £287,668 £50
30 16425 5.00 £4,590,055 £4,324,250 £281,222 £24
30 32850 10.00 £9,481,829 £8,648,500 £881,662 £38
Mean £36
Median £35
The results indicate that the two areas (high and mid value) are able to withstand the CIL rates. In the high value area (Value Area 1), the average maximum CIL headroom is £79 per sq m (mean) and £81 per sq m (median). Based on the charge rate of £55 per sq m, this provides a viability cushion of approximately 30% against the Mean, with the lowest ‘head room’ calculation indicated to be approximately 8% above the proposed CIL level. In the mid value (Value Area 2), the average maximum CIL headroom is £35 per sq m (mean), and £36 (median). This is much closer to the proposed CIL levy of £33 per sq m in this area. Also, it is notable that for the 5 ha site, the maximum CIL headroom falls below the proposed levy to £24 per sq m. Whilst this represents only one of the four schemes tested, in view of the need to demonstrate that rates are not set at the margins of viability and leave an appropriate ‘viability

Page 14
cushion’ (as set out in the recently published National Planning Policy Guidance), it is recommended that the charge rate in Value Area 2 be reduced to £20 per sq m. This will allow a buffer of approximately 40% from the average and approximately 8% from the lowest of the sites tested. The proposed CIL rates of £55 per sq m and £20 per sq m are benchmarked below as a percentage of construction cost and total development costs. The charge rate of £55 per sq m (Value Area 1) equates to 4.67% of construction costs, and approximately 3% of total development costs. The charge rate of £20 per sq m (Value Area 2) equates to 1.70% of construction cost and just over 1% of total development costs. Table 3.3 £55 per sq m as a percentage of costs
Market housing (sq m)
CIL at £55 psm
CIL as a % of construction cost
CIL as a % of total development cost
2300 £126,473 4.67% 2.87%
5749 £316,181 4.67% 3.03%
11498 £632,363 4.67% 3.05%
22995 £1,264,725 4.67% 2.95%
Table 3.4 £20 per sq m as a percentage of costs
Market housing (sq m)
CIL at £20 psm
CIL as a % of construction cost
CIL as a % of total development cost
2300 £45,990 1.70% 1.04%
5749 £114,975 1.70% 1.10%
11498 £229,950 1.70% 1.11%
22995 £459,900 1.70% 1.07%

Page 15
4 S106 and affordable housing evidence
This section provides evidence of recent Affordable Housing and other S106 contributions in Wakefield. Its purpose is to consider:
The ability of development to meet both affordable housing, CIL and other planning obligations
Whether the assumptions regarding site specific S106 evidence in the viability evidence are appropriate and reasonable
4.1 AFFORDABLE HOUSING AND CIL
Table 4.1 below provides evidence of affordable housing achieved on residential development schemes across Wakefield District over the 12 months from October 2013 to September 2014. Of the twelve schemes listed, it shows that the Council’s policy target of 30% was achieved on five schemes. Four out of five of those schemes also delivered a significant pooled S106 agreement in a range of £20 per sq m to £67 per sq m, indicating that there is headroom for both target affordable housing levels and CIL in the future. Of those schemes that did not deliver the full affordable housing target, five of them were in the proposed medium or high CIL charging areas and two of them in the lower value zone proposed for £0 CIL. Those schemes that could not deliver the entire 30% affordable housing target were subject to a viability appraisal reviewed by the Council’s in house Development Surveyor. The feedback provided by the Council Officer indicates the reason for those schemes not meeting the full affordable housing target was the existence of an unusually high level of abnormal site costs affecting those sites, such as site assembly or site preparation works, or generally low values. Therefore, this suggests that only in low value areas and on sites with significant abnormal issues is the affordable housing target not viable. Table 4.1 also illustrates the level of pooled S106 contributions that have been agreed alongside the affordable housing on each scheme. The pooled contribution has been converted into a sq m figure assuming an average house size of 100 sq m, to enable like for like comparison with a future CIL tariff. This shows that of the schemes delivering 30% target affordable housing, they have also agreed to contribute on average £30 per sq m on pooled S106 contributions with a range of £0 to £67 per sq m. These schemes are in a mix of medium and high value areas and given the proposed CIL rates of £20 per sq m and £55 per sq m respectively, it suggests they are within a reasonable range of the pooled S106 contributions secured recently. It is also noteworthy that those schemes not delivering the full level of affordable housing were able to make a pooled S106 contribution with a range of £8 per sq m to £67 per sq m and an average of £36 per sq m. This demonstrates that if the Council strictly prioritised affordable housing over other contributions, they are likely to have been able to achieve a greater percentage of affordable housing than that indicated. Therefore, this evidence shows that there is a track record of achieving the affordable housing target and pooled S106 obligations indicating that there is headroom for both 30% affordable housing and

Page 16
CIL. Where affordable housing targets have not been achieved, this has been due to either low values (in low value areas which are not proposed to carry a CIL charge) or high abnormal development costs (or a combination of both). Given that CIL is proposed only in mid and high value areas, and that the majority of allocated housing land (76%), is Greenfield not brownfield it is considered likely that CIL and target affordable housing will be viable together in the majority of circumstances.

Page 17
Table 4.1: Affordable housing agreements in Wakefield 2013/14
Address
Application
Reference
No. of Private
dwellings on
site
No. of
Affordable
dwellings on
site
Total
dwellings on
site
%age of
affordables on
site
Reason why below policy
target of 30%
S106 pooled
contributions
agreed per sq m
(assume
average
dwelling size of
100 sqm)
Proposed CIL
Residential
Charging
Zone
School Street
(Land At),
Castleford 12/01218/FUL 5 15 20 75% N/a £0.00 MediumGreenfield
Road (Land
At), off Station
Road, Altofts 12/01114/FUL 28 5 33
15% + off site
contribution of
£21,500
Abnormals of £380K, relatively
high for a small site. £8.61 MediumNorthfield
Lane (Land
Off), Northern
part, South 10/02029/FUL 78 6 84
7% + off site
contribution of
£31,995 Low value and high abnormals £33.52 LowDurkar Lane
(Land Off),
Durkar,
Wakefield 10/02367/FUL 177 75 252 30% N/a £27.34 Medium
Sunnydale
Mills, Intake
Lane, Ossett 10/00274/FUL 46 2 48
4% + off site
contribution of
£216,000
Site purchased at top of
market before the crash and
consequently land owner
requiring an unusually high
land price. £7.60 HighRuskin Avenue
(Land to Rear),
Bradford Road,
Wrenthorpe, 11/02067/FUL 161 69 230 30% N/a £30.19 High
R/O 122-138
Lumley Street,
Castleford 14/00840/FUL 48 8 56 14%
Multi-owner site lead to
abnormal costs associated
with land assembly £43.30 Low/Medium
Monkhill Lane
(Land West),
Pontefract 14/00458/FUL 47 6 53
11% + off site
contribution of
£147,212
Substantial abnormals
totalling over £1m including
foundations of £220K £67.00 Medium
Priory Ridge
(Land At),
Crofton 13/03226/FUL 48 20 68 30% N/a £22.39 Medium
Standbridge
Lane,
Wakefield 14/01145/REM 100 29 129 22% Abnormals £29.86
High/
Medium
Land At
Sowood Lane,
Ossett 13/02584/FUL 64 26 90
29% plus off
site
contribution of
£55,000 N/a £66.87
High /
Medium
Leeds Road
(Land To Rear
Of 311),
Newton Hill,
Wakefield 13/03114/FUL 61 18 79 23% Abnormals £62.03 High

Page 18
4.2 S106 EVIDENCE – RESIDENTIAL
Wakefield Council has collated evidence from S106 agreements to identify typical / average rates of site specific S106 to test the assumptions used in the viability analysis. Data has been extrapolated to determine the split between the pooled and non-pooled components to establish what, in a ‘CIL world’ scenario would typically remain as a site specific S106 obligation alongside a CIL tariff. The following S106 agreements have been sampled, based on a range of site sizes to align with the revised viability analysis in Section 2:
Table 4.2: S106 sampled schemes
Size PA Reference Address
<1ha
11/02601/FUL Land off former Thornhill St, Bungalows
12/01114/FUL Land at Greenfield Road, Altfots
07/02156/FUL Land At Grove Lane, Hemsworth
13/02258/OUT Land at Stump Cross, Pontefract
2.5ha
10/02029/FUL Land at Northfield Lane, South Kirby
09/01976/FUL Land at Victoria Way, Wakefield
10/00447/REM Land off Park Drive, Lofthouse
13/03114/FUL Land to rear of 311 Leeds Road, Newton Hill, Wakefield
> 5ha
11/02067/FUL Land lying to the north west of Ruskin Av
10/02367/FUL Land at Durkar Lane, Crigglestone
10/01907/OUT Standbridge Lane, Crigglestone
12/01590/FUL land at Cutsyke Road, Castleford
>10 ha
11/02363/REM Land at North side of Dewsbury Road, Land at Dewsbury Road
13/02623/HYB City Fields, Wakefield
12/01515OUT Cobblers Lane, Pontefract
13/01144/OUT Prince Of Wales Colliery
In retrospectively determining what elements of past S106 agreements would remain a site specific/non pooled S106 alongside CIL in the future we have made the simple assumption that only the education contributions would be pooled CIL infrastructure, and that all other S106 costs including highway works, Public Open Space (POS)/green infrastructure, travel cards and bus shelters would remain an onsite S106 necessary to make the development acceptable in planning terms. It is acknowledged that there may be some variation with certain works capable of being included on the Regulation 123 list but consider it a robust basis from which to assess typical/average residual site specific S106 costs. For the avoidance of doubt, Affordable Housing has been excluded from the analysis.

Page 19
Table 4.3 below displays the results of this analysis. The total S106 costs are presented alongside the residual S106 costs which are then averaged into a per-unit cost. The results show a range of approximately £800 to £1200 per unit, and an average of £1055 per unit. In summary therefore we consider that this provides a reasonable basis and supports the figure of £1,000 per unit applied in the viability modelling of CIL. Table 4.3: S106 evidence
Number of sites in
sample
Total units (aggregate of
sites sampled) Total S106
Average residual S106
(non pooled S106)
Average residual
S106 (non pooled S106)
per unit
Small (<1ha) 4 105 £372,935 £125,049 £1,191
Medium (2.5 ha) 4 436 £1,742,278 £503,668 £1,155
Large (>5 ha) 4 734 £2,341,733 £614,164 £837
Strategic (>10 ha) 4 2022 £9,123,328 £2,235,911 £1,106
Total 3297 £13,580,274 £3,478,791 £1,055
The S106 agreement recently agreed regarding the first phase planning permission for City Fields Wakefield East Extension has been incorporated into the above analysis. The S106 agreement for this scheme is £2.365million, comprising an education contribution of £2.24 million, public art of £50,000 and infrastructure improvement sum of £75,000. Based on the 500 units proposed as part of the planning application, this equates to a sum of approximately £4,700 per unit, with the education element of this representing £4,500 per unit. As currently drafted, the Regulation 123 list requires education provision on large scale sites to be provided on site through S106. If this is the case for future phases of City Fields, the S106 costs are likely to be greater than the £1,000 per unit allowed for in the appraisals above. The Council should consider ways to mitigate the impact of higher S106 costs through the provisions of the CIL regulations and review of its approach to S106 on such sites.
4.3 S106 EVIDENCE - RETAIL
The S106 rate of £55 per sq m applied to retail viability appraisals is based on evidence of S106s agreements relating to retail schemes across the District which are as follows:
Trinity Walk (completed 2005, amended July 2006 & May 2011)
£50,000 contribution towards the cost to the Council of carrying out and completing environmental initiatives in the College Grove and neighbouring residential area comprising improved pedestrian facilities and landscaping
£1,530,000 as a contribution towards the cost of improvement of public access arrangements within the Bull Ring, Northgate, Westmorland Street, Union Street, The Springs, Teall Street and Brook Street
Edinburgh House – Aire Street, Castleford (October 2012)

Page 20
Contribution towards off-site highway works at the Aire Street/Bridge Street roundabout – not
to exceed the sum of £400,000.
Tesco, Hemsworth extension (completed November 2011)
£15,000 towards cost of off-site highway improvement works
£40,000 towards townscape improvements in Hemsworth town centre
£1,620 towards diverting public footpath
£17,000 towards cost of lighting (if applicable) and maintaining public footpath
Ings Road The draft S106 submitted by the applicant proposed:
£55,000 contribution towards the improvement of the quality of the water environment in the
locality of the application site
£465,000 contribution towards funding an additional City Bus for five years
£441,000 towards ‘indicative linkage works’
£710,000 towards highway works to Ings Road.
Table 4.4 below summarises the S106 contribution based on a per sq m rate, calculating the average of the schemes to be £55 per sq m. It should be noted that the Ings Road planning application, which represented a substantially higher S106 cost than the other three schemes, was refused by the Council. Removing this from the table would significantly reduce the average, underlining the robustness of the £55 per sq m figure applied.
Table 4.4: Retail S106 evidence
S106
contribution GIA (sq m) Average £ per sq
m
Trinity Walk £1,580,000 44721 £35
Edinburgh House £400,000 10200 £39
Tesco extension, Hemsworth £73,620 2086 £35
Ings Road £1,671,000 10290 £162
Total £3,724,620 67297 £55

Page 21
5 Retail Evidence
5.1 DIFFERENTIATION OF CIL TARIFF BY SUPERMARKET SIZE BAND
The viability evidence produced three typologies of foodstore which reflect the broad models being implemented within the sector. These are:
Convenience ‘C’ Store, based on the maximum size required for Sunday trading (these stores are
a maximum of 280 sq m net sales, but typically gross to 350-400 sq m). The ‘big four’
supermarket operators are active in this market (e.g. Sainsbury Local, Tesco Express), alongside
a wider range of operators such as Co-op and Cost Cutter.
Budget size stores, dominated by Lidl, Aldi, Iceland and the former Netto stores (now part of
Asda), and typically within a size range of circa 1,000-2,000 sq m gross.
Large foodstore / traditional supermarket with sizes ranging from 2,000 sq m upwards. This size
band is dominated by the big four operators who, following a period of retrenchment have
moved away from the very large models (i.e. 7,000-10,000 sq m) and reverted to a traditional
sizes typically in the range of 2,500-5,000 sq m
These three typologies were modelled based on evidence of comparable schemes. The results, as set out in the Viability Evidence (February 2014), illustrate the different levels of viability for each typology indicating that only the large foodstore/supermarket is capable of withstanding CIL. The different results are driven by variation in rent and yield assumptions across the three typologies. Our assessment of the market indicated that typical rents for small and budget sized foodstores at the regional level are typically in the range of £110-£160 psm (£10-£15 psf) with supermarkets typically at a higher rent of £160-£190 psm (£15-£18 psf). Our assessment also established that average investment yields1 are lower for supermarkets than for the small and mid/budget size; this is largely the result of a broader range of operators at the smaller size bands with varying and weaker covenant strength and in more varied locations pulling down the average, in contrast to the larger end of the size spectrum where the big four, with their stronger covenant strength, dominate. Market evidence is provided below and in Appendix 2.
5.2 RETAIL EVIDENCE
The table below provides details of the evidence collated to support the viability analysis.
1 The yield is the rate of return for a property investment, expressed as a percentage, that is used in the valuation of
commercial property. A lower yield drives a high capital value and vice versa. Yields are determined by the level of risk associated with a property investment with riskier investments carrying a higher yield. The covenant strength of an occupier, alongside other factors, is a key consideration in determining the yield and therefore the capital value.

Page 22
Table 5.1: Retail Evidence
Value assumptions
Evidence Cost assumptions
Evidence
City Centre Retail
Rent £188 psm, 24 months rent free period as a combined void/incentive allowance
Based on review of comparable evidence and discussions with retail agents – e.g. Trinity Walk achieved recent lettings for £160 - £185 psm (Next, Sportsworld, New Look)
£783 psm BCIS median, rebased for Yorkshire and Humber , plus 15% uplift for external works
Yield of 7-7.5% Average quoted investment yields observed by DTZ Investment team on retail investments in Wakefield 2008-2014 is 7.33%
District Centre Retail scheme
Rent 134.55 psm (£12.50 psf) and 24 months rent free period as a combined void/incentive allowance
Based on review of comparable evidence and discussions with retail agents
£783 psm BCIS median, rebased for Yorkshire and Humber , plus 15% uplift for external works
Retail warehouse park
Rent £172 psm (£16 psf) and 24 months rent free period as a combined void/incentive allowance
Based on review of comparable evidence that show rents passing at Wakefield’s retail park ranges from £130 psm to £195 psm. Reported transactions:
Albion Mills Rent passing £156 psm
Westgate Retail Park – lease to Harveys for 15,000 sq ft reported at headline £248 psm
Westgate Retail Park – lease to Dreams at headline of £215 psm
Cathedral Retail Park – lease to Brantano at £170 psm
£591 psm BCIS median, rebased for Yorkshire and Humber , plus 15% uplift for external works

Page 23
Yield 7.0-7.5% Review of evidence –
Albion Mills Retail park sold at 7% in December 2013
Castleford Retail Park 8.5% in 2009
£1135 psm BCIS median, rebased for Yorkshire and Humber , plus 15% uplift for external works
Supermarkets Rents Large £177.60 psm (£16.50 psf) Discount £134.55 psm (£12.50 psf) Small £161.46 psm (£15 psf)
Large stores:
Salter’s Lane, Sedgefield Sainsbury 49,000 sq ft, July 2012 £183 psm
First Point Business Park Doncaster, Morrisons 89000 sq ft GIA, rent of £173 per sq m (2013)
Skelton, Reditch October 2012, 50,000 sq ft at £183 psm
Sunderland, Sainsbury of 99,000 sq ft, February 2012, rent of £199 per sq m
Budget sized stores:
Co-op Washdyke Lane, Immingham £129 psm
Iceland, 255 Dewsbury Road, Beeston, Leeds, £71 psm
Small
Tesco Express, 99 Dewbury Road, Ossett £160 psm
Co-Op, 952-952A Ecclesall Road, Banner Cross, Sheffield £141 psm
Tesco Express, Huddersfield Road, Mirfield, Huddersfield £124 psm
Sainsburys Local, 55 Leeds Road, Harrogate £118 psm
£1135 psm BCIS median, rebased for Yorkshire and Humber , plus 15% uplift for external works

Page 24
Yield Large 5-5.25% Medium and small 6-6.5%
Based on average yields of schemes quoted at regional level observed by DTZ investment team. Average of large stores over 2,000 sq m 5.05%; average of stores below 2000 sq m 5.9% (see Appendix 2)
£1135 psm BCIS median, rebased for Yorkshire and Humber , plus 15% uplift for external works

Page 25
6 Conclusion and Recommendations
The supplementary evidence provided in this report reinforces the case for introducing CIL in Wakefield. It confirms that CIL is viable on the basis of the uses and locations set out in the Preliminary Draft Charging Schedule and that an appropriate balance can be struck between safeguarding deliverability and securing contributions to meet the District’s infrastructure needs. Based on the further viability modelling carried out in this report, it is recommended that an amendment to the Preliminary Draft Charging Schedule is made which is to reduce the tariff for the medium value area from £33 to £20 per sq m. This takes account of the economic viability modelling of additional schemes contained in this report and also ensures that there is an adequate viability cushion allowed for on schemes within the mid value charging zone.
It is also recommended that the Council consider the options available through both the CIL Regulations and its approach to S106 on large scale sites to ensure that the impacts of CIL on such sites can be managed. It is considered that these amendments will reinforce the robustness and fairness of the proposed Community Infrastructure Levy in Wakefield District.

Page 26
Appendix 1 Data for average house prices in value area map
Postcode
Average House Price April to
September 2012 (all houses)
WF10 2 £120,908
WF10 3 £120,208
WF10 4 £117,573
WF10 5 £123,106
WF11 8 £109,915
WF11 9 £157,532
WF1 2 £157,506
WF12 0 £138,470
WF12 7 £111,252
WF12 8 £93,661
WF12 9 £106,937
WF1 3 £183,852
WF13 3 £80,103
WF13 4 £112,123
WF1 4 £118,926
WF14 0 £125,950
WF14 8 £177,630
WF14 9 £157,425
WF1 5 £131,433
WF15 6 £89,716
WF15 7 £148,626
WF15 8 £173,214
WF16 0 £114,319
WF16 9 £131,020
WF17 0 £170,228
WF17 6 £98,722
WF17 7 £97,275
WF17 8 £119,390
WF17 9 £102,243
WF2 0 £164,453
WF2 6 £248,961
WF2 7 £154,782
WF2 8 £122,002
WF2 9 £101,303
WF3 1 £150,339
WF3 2 £141,900
WF3 3 £161,943
WF3 4 £106,375
WF4 1 £138,261
WF4 2 £120,647
WF4 3 £135,833
WF4 4 £188,670
WF4 5 £147,619
WF4 6 £117,233
WF5 0 £147,858
WF5 8 £172,530
WF5 9 £125,012
WF6 1 £121,745
WF6 2 £124,181
WF7 5 £105,618
WF7 6 £112,786
WF7 7 £164,780
WF8 1 £115,381
WF8 2 £110,134
WF8 3 £198,967
WF8 4 £120,674
WF9 1 £107,876
WF9 2 £108,076
WF9 3 £108,634
WF9 4 £58,940
WF9 5 £93,666
WF11 0 £9,766

Page 27
Appendix 2 Supermarket Yields Evidence
The following table provides evidence of quoting yields on regional foodstore investments on the market monitored by DTZ’s Yorkshire Investment team. The results show the average yield for foodstores larger than 2,000 sq m and for those that are smaller, illustrating the difference between the two levels.

Page 28
Size Average yield %
Over 2,000 sq m 5.05
Under 2,000 sq m 5.91
Operator / address Town/City Price Rent Yield Date
Area (GIA Sq
m)Tesco Express, Sunbridge Road, Bradford £1,080,000 £60,000 5.25 23/04/2008 465
Tesco Express, 99 Dewbury Road, Ossett
Ossett
£927,000 £58,800 6.00
24/04/2009 390
Waitrose, Foss Island, York York
£11,000,000 £640,000 5.50
13/10/2009 3269
Tesco, 300 Barlowmoor Road,
Chorlton, Manchester
Manchester
£900,000
27/09/2010 Small
White Cross Retail Park, Guiseley,
Leeds
Leeds
£1,200,000 £76,625 6.04
04/10/2010 459
Co-Op store, 27,29 & 31 The Square,
Hessle, Hull
Hull
£6,150,000 £325,084 5.00
06/10/2010 912
Co-Op store, 44 New York Street, Leeds Leeds
£1,130,000 £75,000 6.25
06/10/2010 455
Waitrose, Foss Island, York
York
£11,200,000 £563,500 4.76
17/11/2010 3269
Tesco, Unit 1, Acorn Park IE,
Charlestown, Shipley
Shipley
£1,200,000 5.58
05/01/2011 Small
Jack Fultons, 316 Marfleet Lane, Hull Hull £350,000 £24,000 27/01/2011 305
Tesco, Dykes Hall Road, Sheffield Sheffield
£725,000 £46,000 6.00
09/02/2011 253
Sainsburys Local, 55 Leeds Road,
Harrogate
Harrogate
£1,100,000 £66,500 5.71
11/03/2011 470
Tesco Express, Huddersfield Road,
Mirfield, Huddersfield
Huddersfield
£765,000 £46,000 6.00
22/03/2011 381
Co-Op, 952-952A Ecclesall Road,
Banner Cross, Sheffield
Sheffield
£285,000 £16,000 5.36
26/05/2011 51
Co-Op, 6 Middlewood Road,
Hillsborough, Sheffield
Sheffield
£250,000 £17,750 6.90
26/05/2011 51
Costcutter Portfolio (pictures in prop
details folder)
Portfolio
£2,370,000 £157,000 6.25
27/06/2011 Portfolio
Tesco Express, 15 St Paul's Street,
Leeds
Leeds
£1,365,000 £65,000 4.50
05/09/2011 292
Tesco, Market Street, Hoyland Barnsley
£7,675,000 £406,000 5.00
30/01/2012 2594
The Co-operative, Hessle Hull
£5,500,000 £339,877 5.85
16/02/2012 912
Aldi, White Cross, Guiseley Leeds
£3,600,000 £219,893 5.75
24/02/2012 1298
Tesco, King Lane, Leeds Leeds
£1,026,000 £57,000 5.25
01/06/2012 368
Tesco (forward funding) Drummond
Street, Rotherham
Rotherham
£39,775,000 £2,039,550 5.00
02/07/2012 10239
Iceland, 255 Dewsbury Road, Beeston,
Leeds
Leeds
£675,000 £50,000 7.00
09/08/2012 900
Co-op Washdyke Lane, Immingham Immingham
£4,140,000 £240,966 5.50
04/02/2013 1800
Co-op Washdyke Lane, Immingham Immingham
£3,960,000 £240,966 5.75
31/07/2013 1800
Co-op Convenience store & petrol filing
station, Beverley
Beverley
£1,920,000 £169,710 8.35
09/10/2013 387

Page 29
Appendix 3 Gardiner and Theobald Cost Report

DTZ Wakefield
Residential Benchmarking
WAKEFIELD Residential Benchmarking
for DTZ
November 2014

DTZ Wakefield
Residential Benchmarking
Please see the below cost benchmarking of similar large residential schemes, which includes indexing analysis to the most recent point (Quarter 4, 2014). You will see that the median cost (including externals) comes out at £85.52 (indexed to 2014 Q4). This includes for the build costs and various further allowances including contingencies, fees, increased spec, site abnormals etc. An indicative breakdown of how we would expect the figure to be split down is included below:
Housebuilder Residential - Indicative Breakdown Split
4Q 14
2q12
average house £56.29
garage £3.82
house inc garage £60.11
contingency @ 2.5% £1.50
house inc contingency £61.62
plus extenals, prelims, fees etc £18.48
Total £80.10
abnormals £3.12
increased spec £2.30
Grand Total Build £85.52 Our approach is entirely consistent with the advice of the RICS, as it references the best and most current construction cost information there is with regard to standard construction costs, that is to say, evidence from actual, recent, similar schemes. Whilst BCIS is a useful and very well respected reference source, indeed administered by the RICS itself, its primary purpose is as a marker for the various sectors and interests of the development industry for schemes at the very earliest stages of planning prior to professional cost advice being sought, and indeed as a rudimentary sense check for more advanced schemes. Site specific abnormals aside (i.e. infrastructure off and on site through to particular special requirements regarding foundations), the actual process of house building is relatively straightforward, and the unit cost is generally a constant factor in the business modelling of housebuilders, large or small, and as such most volume housebuilders (national and regional) tend to keep these costs to themselves. As to how much they will factor in as a build cost when carrying out a development appraisal when considering a land purchase much depends on their view of the market at the time, and the importance or not they attach to acquiring the site. Hence build costs can vary widely within one housebuilder, with the quality of finishes typically being only a minor consideration (around +/- £2/sqft.). It is not uncommon for the headline “all in” (i.e. including estate roads and plot externals) build costs (excluding abnormals) to vary by around £20/sqft by development. As it is, the build costs of larger SUE schemes naturally fall within the lower end of the range.

DTZ Wakefield
Residential Benchmarking
Project Client Tender Date Units Average
unit size
Net to gross
eff iciency
Building Cost
only
Regional
Location Factor
Location Adjusted
Costs*
Market Forces
update to 4Q
2014**
Resultant
Comparative Cost
SQ FT % £ / SQ FT % £ / SQ FT % £ / SQ FT
Project 1 Confidential Jan-10 400 1,249 100% 78.11 -12% 68.62 18% 81.22
Project 2 Confidential Jul-07 1,750 1,380 100% 80.56 -3% 78.07 3% 80.51
Project 3 Confidential Jul-08 4,000 829 100% 78.44 -3% 76.01 4% 78.98
Project 4 Confidential Jan-09 200 882 100% 80.05 -11% 70.99 13% 80.14
Project 5 Confidential Jan-09 750 900 100% 79.89 -10% 71.52 13% 80.74
Project 6 Confidential Apr-08 2,500 945 100% 91.45 -12% 80.34 4% 83.16
Project 7 Confidential Apr-08 1,000 945 100% 93.65 -12% 82.27 4% 85.16
Project 8 Confidential Jan-12 4,500 920 100% 77.92 0% 77.92 10% 85.83
Project 9 Confidential Jan-14 2,600 800 100% 68.00 0% 68.00 5% 71.45
Project 10 Confidential Dec-13 2,000 1029 99% 72.12 4% 75.33 7% 80.62
Average 80.78
*BCIS Location Indicies used to adjust projects to Wakefield
**BCIS All In TPI Indicies used to adjust projects to 4Q 2014 Median Cost w ith Fees and Contingencies 85.52
Median £80.68
AVERAGE COST PER SQ FT £80.78
DTZ Wakefield
RESIDENTIAL BENCHMARKING EXERCISE
Residential Units
SCHEME DETAILS COST ANALYSIS