Embed Size (px)
Citation preview

1
climate change
2007
Joachim CurtiusInstitut für Physik der Atmosphäre
Universität Mainz
CO
2 (p
pm)
Contents1. Summary
2. Background
3. Climate change: observations
4. CO2
5. Other Greenhouse Gases (GHGs)
6. Aerosols and Clouds
7. Solar variability
8. Future climate change
9. Paleo-climate
10. Climate protection

2
global mean radiation balance
kurzwellig
langwellig
4 4
4 4
4
2 0
0,7 04
0,7 04
A B
KA B
KA
T T
IT T
IT
σ σ
σ σ
σ
− + =
− + =
− + =
simple (perfect) greenhouse model:
area A:
area B:
net:
results:TA= -18°C, TB= 30°C
TA corresponds to Teff,Erde
Model:Ø Atmosphere = one planeØ surface has albedo of 30% Ø no other energy transport→ natural greenhouse effect qualitative
[Kraus, 2004]

3
4 42 0A A A BT Tε σ ε σ− + =
Extension of the simple greenhouse model:
plane A:
plane B:
results:for TB= 288 K à TA= 242 K
and εA=0,78
for TB= 289 K à TA= 243 Kand εA=0,79
Model:Ø Atmosphere = one planeØ Earth surface has albedo agØ no other energy transportØ longwave "window" with the hep of εA→ demonstrates the effect of additional GHGs
( )4 4 1 04K
A A B g
IT T aε σ σ− + − =
[Kraus, 2004]

4
[IPCC,2001]
radiative forcing ∆F:
"change of the radiative budget at the tropopause, caused by disturbancesof the energy fluxes in the sub system surface-atmosphere "(definition after Schönwiese, IPCC-Def. more complex).
negative radiative forcing: coolingpositive radiative forcing: warming
semi-empirical connection between temperature and climate forcing:
F Tλ∆ = ∆
dc F T
dtλ
∆Τ= ∆ − ∆
in long-term steady-state:
time-delayedclimate response radiative
forcing parameter:sensitivity(feedbacks etc.)
change ofsurface temperature

5
Contents1. Summary
2. Background
3. Climate change: observations
4. CO2
5. Other Greenhouse Gases (GHGs)
6. Aerosols and Clouds
7. Solar variability
8. Future climate change
9. Paleo-climate
10. Climate protection
anthropogenic sources of climate change:
two components:
A) detection
B) attribution of causes

6
Questions:
Ø By how much has Earth warmed?
Ø Is that unusual?
Ø Have water vapor and precipitationchanged?
Ø Increase of wether extremes?
Ø Are the observations of climate change consistentwith each other?
3. observed climate changeØ records of temperatures at surface: "Hockeystick"
Ø records of temperatures for stratosphere and ocean, etc.Ø changes in sea ice content, snow cover and glaciers
Ø changes in precipitation
Ø regional development, urban climate
Ø changes in extreme events:
Ø tropical storms
Ø heat waves
Ø flooding

7
Network for ground-based atmospheric measurements
[Schönwiese, 2003]
[IPCC,2001]Ø past decade most likely the warmest in the past 1000 years.

8
[IPCC, 2001]
temperature reconstruction for NH after Mann et al.,1999, from Multi-Proxy-Analysis of: tree rings, coral reefs, ice cores, bore holes, etc.
further reconstructions
[IPCC, 2001]

9
comparison:simulations by von Storch et al., Science, 2004,with reconstructions by Mann, Bradley, Hughs, Nature, 1998 (MBH)
MBH-reconstructions: are long-termvariabilityincluded correctly?
Global mean temperatures are rising faster with time
100 0.074±0.01850 0.128±0.026
Warmest 12 years:1998,2005,2003,2002,2004,2006, 2001,1997,1995,1999,1990,2000
Period Rate
Years ° /decade

10
temperature reconstruction from bore holes 1500-2000
a) methodb) 862 reconstructions
world-widec) averaged reconstruction
and comparison withdirect measurements
a)
c)
b)
temperature trends 1901-2000 in three time intervals
[IPCC,2001]

11
temperature trends 1976-2000 by seasons
[IPCC,2001]
heat content and temperatures of the oceans
left: observed (dot-dashed line, Levitus et al., Science, 2000) und modelled(full line, Barnett et al., Science, 2001) increase in the heat contents of the oceans(upper 3000 m).
right: increase in temperature of the ocean temperatures , modelled, (Barnett et al., Science, 2001), 1.5e22 J corresponds to 1 W yr m -2

12
Ø currently: non-equilibrium of the energy budget
Ø Earth takes up ~0.85 W/m2 more than what is deposited to space
Ø Temperatures of the atmosphere will increase further(+0.6°C), even if atmospheric concentrations of GHGs do not increase further.
heat content change of the oceansHansen et al., Science 2005
Trend in the changes of the diurnal-temperature-range:
daytime maximum temperatures have risen more strongly than thenighttime minimum temperatures.
[IPCC,2001]

13
Maximum temperature changes between city centerand surrounding rural areas.
Average urban heat island effect: 0.5-1.5°C[Schönwiese, 2003]
temperature-change in thestratosphere:
causes: ...
ozone depletion
troposphericwater vapouris enhanced.
[Schönwiese, 2003]
14
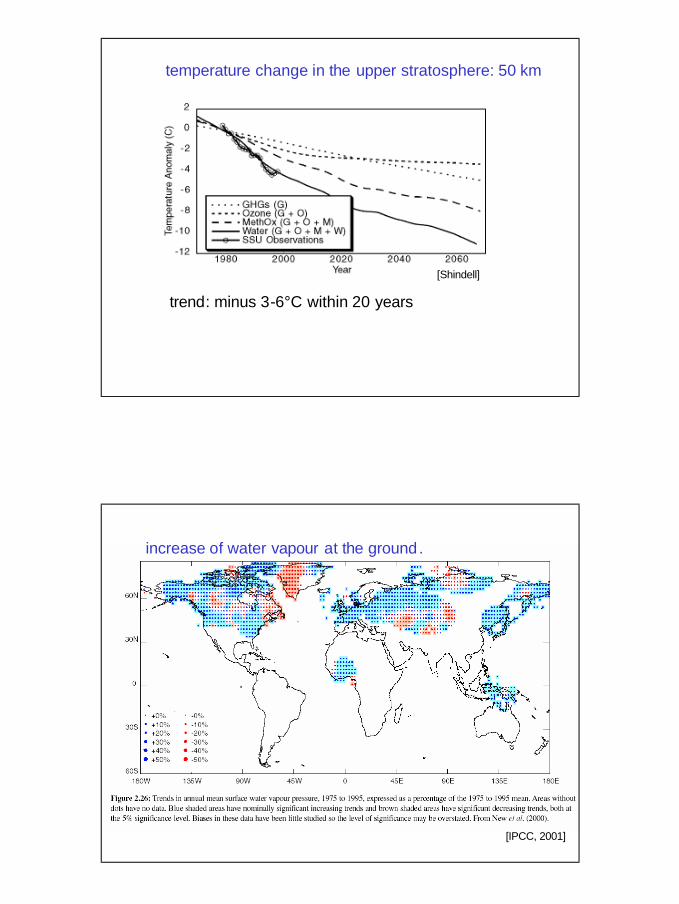
temperature change in the upper stratosphere: 50 km
trend: minus 3-6°C within 20 years
[Shindell]
increase of water vapour at the ground.
[IPCC, 2001]

15
increase of watervapour in thestratosphere
causes:manyfold, methaneH2O-transport
regional changes of precipitation over the past century
Ø increase of precipitaion by 0.5 - 1%/decadeover land in mid-latitudes .
[IPCC, 2001]