Embed Size (px)
Citation preview
Master’s Thesis
for the Attainment of the Degree
Master of Science
at the TUM Department of Mechanical Engineering
of the Technische Universität München
Virtual Reality Experiences While Driving:
A User Acceptance Model
Examiner: Prof. Dr. Joachim Henkel
Chair/ Professorship for Technology and
Innovation Management
Person in Support: Virginia Herbst (University)
Jens Bosse-Parra and
Ignacio Fernández de la Puente (Business Company)
Course of Study: TUM Mechanical Engineering and Management
Submitted by: Alejandra Alonso Cosío
Schleibingerstr. 5
81669 Munich
Matriculation Number: 03695200
Submitted on: 27.09.2019

Abstract I
Abstract
In a society in which people spend a significant amount of time traveling by car, in-car
entertainment systems have emerged to reduce the boredom and tediousness of journeys.
Thinking in the foreseeable future in which autonomous cars will be commonplace, car
manufacturers are developing a new in-car entertainment system for passengers which
reduces the motion sickness and enhances the passenger’s experience. This system
consists of adapting the use of virtual reality headsets inside cars to enable the passenger
to experience virtual reality content while riding in the car. Although some automakers
have already demonstrated their virtual reality in-car systems, they are not
commercialized yet. In order to predict the degree of adoption of this innovative solution,
evaluating user acceptance is crucial. However, there is not a user acceptance model to
evaluate this solution in the literature.
In this thesis, a user acceptance model is proposed to predict the adoption of virtual reality
headsets by backseat passengers in the car. The model is grounded on the Technology
Acceptance Model and has five factors: Perceived usefulness, Perceived ease of use,
Behavioral intention, Personal innovativeness, and Accessibility; that predict the user
adoption of this application, explaining about 60% of the variance.
Additionally, insights into individuals' beliefs, collected through two quantitative
questionnaires, are provided about the subject. Respondents from a European sample are
skeptical about this innovative in-car entertainment solution and would not adopt it in a
foreseeable future, because they do not perceive its utility. However, respondents from
an American sample are more positive about its adoption. Findings showed that there is
a strong relationship between prior virtual reality usage and the willingness to use VR
reality headsets in the car as a passenger. This factor should be included in future research.

Table of contents II
Table of contents
Abstract ............................................................................................................................ I
Table of contents ............................................................................................................ II
Table of figures ............................................................................................................. IV
List of tables ............................................................................................................... VIII
List of abbreviations .................................................................................................... IX
1. Introduction .............................................................................................................. 1
1.1 Motivation .......................................................................................................... 1
1.2 Definition of the problem ................................................................................... 2
1.3 The objective of the thesis .................................................................................. 3
1.4 Structure of the thesis ......................................................................................... 4
2. Virtual reality background ..................................................................................... 6
2.1 Definition of virtual reality ...................................................................................... 6
2.2 Immersion and presence .......................................................................................... 6
2.3 Virtual reality systems ............................................................................................. 7
2.3.1 The Head-Mounted Display.............................................................................. 9
2.3.2 Commercial VR HMDs .................................................................................. 10
2.4 Virtual reality sickness .......................................................................................... 12
2.5 Virtual reality applications .................................................................................... 13
2.6 Virtual reality in the automotive industry ............................................................. 15
2.7 In-car virtual reality experiences ........................................................................... 16
3. Theoretical framework .......................................................................................... 18
3.1 User acceptance of technology .............................................................................. 18
3.2 Technology Acceptance Model ............................................................................. 18
3.3 Derivative theories of TAM .................................................................................. 20
3.4 Proposed research model ....................................................................................... 23
4. Methodology ........................................................................................................... 27
4.1 Research purpose ................................................................................................... 27
4.2 Research approach ................................................................................................. 27
4.3 Research strategy ................................................................................................... 28
4.4 Sampling ................................................................................................................ 28
4.5 Data collection ....................................................................................................... 29
4.6 Questionnaire design ............................................................................................. 30
4.7 Data analysis .......................................................................................................... 30
5. Analysis and discussion of results ........................................................................ 39

Table of contents III
5.1 Description of the sample ...................................................................................... 39
5.2 Exploratory factor analysis .................................................................................... 40
5.2.1 Reliability........................................................................................................ 40
5.2.2 Structure validity............................................................................................. 41
5.3 SEM-PLS analysis ................................................................................................. 45
6. Market study .......................................................................................................... 51
6.1 Methodology ......................................................................................................... 51
6.2 Description of the sample ...................................................................................... 51
7. Insights into user acceptance ................................................................................ 53
8.1 Findings from QUEST1 ........................................................................................ 53
8.2 Findings from QUEST2 ........................................................................................ 54
8. Conclusion .............................................................................................................. 56
8.1 Model to predict user acceptance .......................................................................... 56
8.2 Insights into user acceptance ................................................................................. 57
8.3 Limitations of the work ......................................................................................... 58
8.5 Future lines of research ......................................................................................... 58
9. Bibliography ........................................................................................................... 59
Appendix ........................................................................................................................ 64
A Measurement scales ................................................................................................. 64
B QUEST1 .................................................................................................................. 65
C Results from QUEST1 ............................................................................................. 71
D Exploratory factor analysis ...................................................................................... 75
E SmartPLS analysis ................................................................................................... 79
F Market study ............................................................................................................. 80
Declaration of Authorship ............................................................................................ 85

Table of figures IV
Table of figures
Figure 1. Example of HMD (a). Example of CAVE system (b). Example of a desktop-
based application with a video camera (c). ....................................................................... 8
Figure 2. Example of a smartphone-based HMD, in particular, a Samsung Gear VR. ... 9
Figure 3. Examples of input devices. Steering wheel for driving simulation (a). .......... 10
Figure 4. PlayStation VR headset (a). HTC Vive headset with controllers (b). ............ 10
Figure 5. Oculus Go (a). Oculus Quest (b). ................................................................... 12
Figure 6. Astronaut virtually training tasks (a). Surgery training (b). .......................... 13
Figure 7. A game player in an immersive virtual game. ................................................ 14
Figure 8. Holoride virtual reality experience demonstration. ........................................ 16
Figure 9. The basic concept underlying user acceptance models. ................................. 18
Figure 10. The original TAM proposed by Davis (1986). ............................................. 19
Figure 11. The final version of TAM proposed by Davis and Venkatesh (1986).......... 20
Figure 12. The TAM2 proposed by Venkatesh and Davis (2000). ................................ 21
Figure 13. The TAM3 proposed by Venkatesh and Bala (2008). .................................. 22
Figure 14. The UTAUT, an integrated model combining eight user acceptance theories.
......................................................................................................................................... 23
Figure 15. The research model employed to address the research question. ................. 26
Figure 16. Example of an inner model in which the relationships between latent
variables are represented. ................................................................................................ 36
Figure 17. Example of an outer model in which the connection between the latent
variables and their indicators are represented. ................................................................ 36
Figure 18. Example of the resulting output obtained with SmartPLS. .......................... 37

Table of figures V
Figure 19. Age distribution in the sample. ..................................................................... 39
Figure 20. Education and occupation description of the sample.................................... 39
Figure 21. Use frequency and experience with VR headsets by participants. ............... 40
Figure 22. Correlation values of BI and PENJ items. .................................................... 41
Figure 23. Number of factors to be extracted according to the Kaiser rule. .................. 42
Figure 24. Possible interpretations of the Scree plot. ..................................................... 42
Figure 25. On the left, the eigenvalues provided by the Parallel analysis. On the right,
the eigenvalues of the Kaiser rule. .................................................................................. 43
Figure 26. On the left, Pattern matrix from the solution with four factors. On the right,
Pattern matrix from the solution with six factors. .......................................................... 43
Figure 27. The Component correlation matrix. ............................................................. 45
Figure 28. Outcome obtained after conducting the PLS algorithm................................ 46
Figure 29. Results from the Bootstrapping algorithm. .................................................. 49
Figure 30. Result from the final model after conducting the PLS algorithm. ................ 49
Figure 31. Distribution of gender and VR headset ownership within the sample of
QUEST1. ......................................................................................................................... 71
Figure 32. Distribution of answers for PU items. .......................................................... 71
Figure 33. Distribution of answers for PEOU items. ..................................................... 72
Figure 34. Distribution of answers for BI items. ........................................................... 72
Figure 35. Distribution of answers for PENJ items. ...................................................... 73
Figure 36. Distribution of answers for PI items. ............................................................ 73
Figure 37. Distribution of answers for PR items. ........................................................... 74
Figure 38. Distribution of answers for ACC items. ....................................................... 74

Table of figures VI
Figure 39. Correlation matrix from the first assessment. ............................................... 75
Figure 40. KMO and Bartlett’s test from the first assessment. ...................................... 75
Figure 41. Table of communalities from the first assessment. ....................................... 76
Figure 42. Correlation values of PENJ items after removing PENJ2 and PENJ4. ........ 76
Figure 43. Table of total variance explained applying the Oblimin rotation technique. 77
Figure 44. Pattern matrix from the solution with five factors. ....................................... 77
Figure 45. KMO and Bartlett’s test from the final assessment. ..................................... 78
Figure 46. Table of communalities from the final assessment. ...................................... 78
Figure 47. Component matrix (left) and Structure matrix (right) from the final
assessment. ...................................................................................................................... 78
Figure 48. Results from the Multigroup analysis of the moderating effect Age. ........... 79
Figure 49. Results from the Multigroup analysis of the moderating element Experience
in using VR headsets (Expertise). ................................................................................... 80
Figure 50. Results from the Multigroup analysis od the moderating element Gender. . 80
Figure 51. Gender and age from the respondents of QUEST2. ..................................... 80
Figure 52. Distribution of primary drivers, car owners, and passengers. ...................... 81
Figure 53. VR headset ownership. ................................................................................. 81
Figure 54. VR headset brands owned by respondents. .................................................. 81
Figure 55. Use frequency of VR headsets and average session duration. ...................... 82
Figure 56. Most popular use cases for VR headset owners. .......................................... 82
Figure 57. Satisfaction ratings from VR headset owners with the VR headset and the
VR experiences. .............................................................................................................. 82
Figure 58. Proportion of respondents that do not own a VR headset but have tried one.
......................................................................................................................................... 83

Table of figures VII
Figure 59. Satisfaction ratings from the respondents that have tried VR but do not own
a VR headset. .................................................................................................................. 83
Figure 60. Proportion of respondents that do not own a VR headset but would buy one.
......................................................................................................................................... 83
Figure 61. Activities that respondents currently do when riding as passengers in the car.
......................................................................................................................................... 84
Figure 62. Use cases preferred by passengers in case a VR headset was available in the
car. ................................................................................................................................... 84
Figure 63. Proportion of car owners that would provide VR headset for their
passengers. ...................................................................................................................... 84

List of tables VIII
List of tables
Table 1. Objectives of the exploratory factor analysis. .................................................. 31
Table 2. Steps to perform an EFA. ................................................................................. 32
Table 3. Extraction methods commonly used in factor analysis (EFA and CFA). ........ 33
Table 4. Topics to be covered when conducting PLS-SEM. .......................................... 37
Table 5. Cronbach’s alpha values for the different variables of the model. ................... 40
Table 6. Variance explained for the different factors. The blue value indicates the total
variance explained. .......................................................................................................... 44
Table 7. Path coefficients between the factors and their significance. ........................... 46
Table 8. Values to assess the different reliability and validity tests. .............................. 47
Table 9. Correlation values between variables. .............................................................. 48
Table 10. AVEs of the factors and their square root. ..................................................... 48
Table 11. R2 values for the factors BI, PEOU, and PU. ................................................. 50
Table 12. Description of the measurement scales of every variable in the model. ........ 64

List of abbreviations IX
List of abbreviations
Abbreviation Description
β Path coefficient between laten variables
2D Two-dimensional
3D Three-dimensional
ACC Accessibility
BI Behavioral intention
CAVE Cave automatic virtual environment
CFA Confirmatory factor analysis
EFA Exploratory factor analysis
H1-H12 Hypothesis 1- Hypothesis 12
HDMI High definition multimedia interface
HMD Head-mounted display
IDT Innovation Diffusion Theory
IVI In-vehicle infotainment
MBA Master of business administration
MIT Massachusetts Institute of technology
MM Motivational Model
MPCU Model of Computer Utilization
PAF Principal axis factoring
PC Personal computer
PCA Principal components analysis
PENJ Perceived enjoyment
PEOU Perceived ease of use
PI Personal innovativeness
PLS Partial least squares
PR Performance risk

List of abbreviations X
PU Perceived usefulness
QUEST1 Questionnaire 1
QUEST2 Questionnaire 2
R2 Coefficient of determination
RQ Research question
SCT Social Cognitive Theory
SEM Structural equation modeling
SUV Sport utility vehicle
TAM Technology Acceptance Model
TPB Theory of Planned Behavior
TRA Theory of Reasoned Action
UTAUT Unified Theory of Acceptance
and use of Technology
VR Virtual reality

1. Introduction Page 1
1. Introduction
1.1 Motivation
Today, people spend a great amount of their time on car journeys. In general, most car
trips occur on a day-to-day basis, e.g. commuting to work. These journeys can become
monotonous and tiresome, leading to a feeling of wasting time (Gardner and Abraham,
2007). This tediousness is also experienced by travelers on long car journeys (McGill et
al., 2017).
Drivers experience this tediousness especially when the driving task is performed
automatically, e.g. everyday trips (Shi et al., 2012). However, the focus on the driving
task can minimize this feeling. In contrast, passengers usually suffer more from boredom
since they do not have any important driving task to perform, increasing the necessity for
entertainment (Wilfinger et al., 2011). Besides, with the arrival of fully autonomous cars,
drivers will be freed from the driving task, meaning they would need to fill their time as
well (McGill et al., 2017).
Automotive manufacturers have already started to explore solutions for those situations
by developing in-vehicle systems that reduce the tediousness of car journeys. One
approach is software that combines information and entertainment, which are commonly
designated as infotainment applications. In-vehicle infotainment (IVI) systems can
provide a wide range of services such as navigation, games, TV, and movies (Shi et al.,
2012).
Companies that do not belong to the automotive industry, such as Apple and Google, are
developing their own IVI systems as well. These platforms, i.e. Apple Car Play and
Android Auto respectively, are specifically designed to support the use of smartphones
inside the car to provide a more personal experience. Nevertheless, these platforms are
more oriented toward drivers and conceived to keep the level of distraction as low as
possible (Rodriguez Garzón, 2012). However, in a future with autonomous cars,
passenger-oriented systems are of greater interest.
In this context, mobile devices represent an optimal alternative to IVI systems since they
contain all the functionalities preferred by the user, for instance, music or navigation
routes (Diewald et al., 2011). As a matter of fact, the new generation of customers relies
on their mobile devices because they represent their own personality and already capture
their preferences and behavior (Wollschläger et al., 2015). They expect to use their mobile
devices anytime anywhere, including inside the car. Drivers can integrate their mobile

1. Introduction Page 2
devices in dock stations or within the IVI systems and passengers can make free use of
them accessing all their applications (Diewald et al., 2011).
However, motion sickness represents a big issue regarding the use of these devices while
being in the car. Many people experience this unpleasant set of symptoms that include
nausea, drowsiness, and even vomiting when they read or watch anything on a screen
while traveling. This constitutes an impediment to use the time spent in the car
productively, which can lead to boredom and tedium journeys (McGill et al., 2017).
Therefore, an issue in the in-car entertainment framework exists. On the one hand, car
users are not really familiar with IVI systems yet. Among other reasons, some of the
systems offered are still very basic, they are usually expensive, and even not available
depending on the car model (Bose et al., 2010). Moreover, they are focused on the driver’s
experience. On the other hand, the use of mobile devices, such as smartphones and tablets,
is more restricted inside the car, for example, due to the limited screen size. Furthermore,
its use usually causes motion sickness. This issue leads to the need to design a new
passenger-oriented entertainment and productivity solution that can, at the same time,
minimize the motion sickness and will be useful in self-driving cars.
1.2 Definition of the problem
Although there is a great variety of solutions for in-car entertainment, none has been
demonstrated to perform optimally for passengers. IVI systems are still in an early phase
of adoption and do not offer all the features the users would like. On the contrary, the use
of mobile devices is more extended inside the car. However, their performance is more
restricted since they are not conceived for this use. Furthermore, they are compounded by
a problem of motion sickness. Finally, with the arrival of autonomous cars, these issues
will grow because the act of driving will be omitted, freeing every occupant from any
driving task and giving them the opportunity to profit the time spent in car journeys.
Recently, an innovative solution has emerged for in-car entertainment. This solution
consists of using virtual reality head-mounted displays (VR HMDs) while driving in the
car. This solution is currently oriented for the backseat passengers, but in the future, it
could also be enjoyed by any occupant of an autonomous car (McGill et al., 2017).
Currently, the use of commercial VR HMDs is becoming more popular because of the
new opportunities they offer in terms of entertainment and productivity. This technology
provides a 360° view display that expands beyond the physical constraints of the vehicle
interior, enabling immersive virtual spaces. Although this technology entails great

1. Introduction Page 3
challenges, such as leading to virtual reality sickness, researchers and developers have
already explored solutions to address these technical issues (McGill et al., 2017).
Based on the latest investigations, automotive manufacturers have already shown their
interest in this innovative solution. For example, Audi demonstrated its own in-car virtual
reality experience for backseat passengers at the Consumer Electronics Show (CES) in
Las Vegas at the beginning of 2019. The experience consisted of a space game in which
the player travels in a spaceship that portrays the real movements of the car (Burns, 2019).
Once it is technically possible to offer this innovative and futuristic in-car entertainment
system, it only remains to determine how automakers are going to offer this service and
develop a consistent business model. Nevertheless, in order to develop a successful
business strategy, it is important to predict customer acceptance of this new service.
Analyzing the user’s beliefs and perceptions about a new technology help to better tailor
it to customers. In that way, automakers can improve what is perceived as a shortcoming
by customers and strengthen the perceived advantages. In the end, it is sought that the
client adopts this new service, therefore it is necessary to offer it in such a way that he or
she wants to adopt it, either because it is perceived as necessary or because it fulfills his
or her requirements. And for that, it is necessary to study the user acceptance.
1.3 The objective of the thesis
The aim of this thesis is to develop a user acceptance model to analyze the backseat
passenger acceptance of using virtual reality head-mounted displays on car journeys for
the purpose of entertainment and productivity.
This model will be supported by the scientific theory known as the Technology
Acceptance Model (TAM) which postulates that a number of factors influence the user’s
intention to accept and adopt new technology (Lee et al., 2003). Consequently, the
objective is to assess which factors predict the intention to use VR HMDs in the backseat
of the car.
To identify relevant factors for this study and build the research model, literature research
will be performed on user acceptance studies of virtual reality applications. Then, the
hypotheses will be constructed about the relationships between factors and their
influence. Finally, the hypotheses and the model will be validated by conducting a
quantitative questionnaire (QUEST1).

1. Introduction Page 4
Hence, the main research question can be stated as follows:
Research question (RQ): What are the factors that predict the user´s decision to adopt
VR HMDs while being backseat passenger inside the car?
On the other hand, it is also interesting to obtain an insight into the customers’ beliefs and
expectations about the subject. Moreover, it is also relevant to observe which use cases
are more meaningful for the customers. Therefore, first assessments will be provided
about user acceptance from the respondents of QUEST1. Additionally, user acceptance
evaluation will be supported by part of a market study conducted in collaboration with a
German automotive manufacturer. Another quantitative questionnaire (QUEST2) is used
for that study.
In summary, the research question will be addressed through a quantitative approach,
employing questionnaire methodology which will be analyzed statistically. The data
obtained through the questionnaire will be used to accept or reject the hypotheses of the
research model, which’s aim is to predict the user’s intention to adopt VR HMDs in the
backseat of the car. Additionally, user acceptance will be discussed on the basis of the
responses from the questionnaire, and a part of the market study.
1.4 Structure of the thesis
The thesis can be split into six main parts. The first part corresponds to the introduction
in which are presented the motivation of the work and the problem. The objectives and
the research question are described as well. In this section, the background is given for
the virtual reality technology, based on a literature review.
The second part explains the theoretical framework of the Technology Acceptance
Model. The factors that are believed to influence the user’s intention to use the innovative
solution are chosen, and hypotheses are formulated about their relationships, constituting
the research model. This part is supported by a literature review on technology acceptance
theories and virtual reality applications.
The third section is intended to describe the methodology employed to test and validate
the research model. First, characteristics of the research are described, and then, the
methods to statistically analyze the model are explained.
In the fourth part, the hypotheses about the relationships between factors are accepted or
rejected, based on the results obtained in the model testing. The final model is given, and
its validity is stated.

1. Introduction Page 5
The fifth section is dedicated to present the findings of user acceptance from the
questionnaire and the market study.
Finally, the implications of the thesis are discussed, and the conclusions are drawn.
Additionally, limitations of the work are remarked, and recommendations for future
research are provided.

2. Virtual reality background Page 6
2. Virtual reality background
2.1 Definition of virtual reality
Researchers have described virtual reality in multiple ways, yet sometimes these
definitions are inconsistent or confusing. As illustrated by Burdea and Coiffet (2003, p.2),
virtual reality is described as a simulation generated by computer graphics to form a
lifelike environment that responses to the user’s actions in real-time. This last
characteristic, the computer’s ability to detect user’s input and modify the virtual world
instantly, is denominated interactivity.
As a further example, Sherman and Craig (2019, pp.6-15) provide a more complex
definition combining five elements: virtual world, immersion, interactivity, the
participants, and the creators of the VR medium. The term virtual world relates to the
outline of the objects in the virtual environment. The second term, immersion, is
differentiated into mental immersion and physical immersion. The former refers to the
sense of presence, the feeling of being involved within the virtual world, whereas the
latter relates to the property of VR systems to influence the participants’ senses via
artificial stimuli. Interactivity has already been outlined. Finally, the latest two elements
comprise the participants, in which minds occur all the VR experience, and the team or
person that creates and implements the virtual application.
As a result, combining the five elements, Sherman and Craig (2019, p.16) define virtual
reality as “a medium composed of interactive computer simulations that sense the
participant’s position and actions and replace or augment the feedback to one or more
senses, giving the feeling of being mentally immersed or present in the simulation (a
virtual world)”.
In summary and despite the multiple definitions, virtual reality is understood as a
computer-generated simulation aimed to create an artificial environment that is perceived
as realistic by the user allowing him or her to interact with it through synthetic stimuli
(Jerald, 2015).
2.2 Immersion and presence
In the virtual reality field, there are two essential concepts: immersion and presence
(Gutierrez Alonso et al., 2008, p.2). Authors have used these concepts in several ways,
even indistinctly, creating confusion within the literature. However, presence and

2. Virtual reality background Page 7
immersion are not synonymous, a conceptual difference exists between them (Cummings
and Bailenson, 2016).
According to Bowmann and McMahan (2007), immersion relates to the objective and
measurable level of sensory accuracy that a VR system can provide. It only depends on
the software and the display technology, and it is considered to be the extent to which the
VR system presents a realistic virtual environment. In other words, it can be explained as
the degree of engagement in the VR experience felt by the user. As a matter of fact, VR
systems can be classified depending on the degree of immersion, which is covered later
in this chapter.
On the other hand, presence is understood as the sensation of “being there”, which is
related to the user’s subjective psychological response to the VR system (Bowmann and
McMahan, 2007). Presence can lead to a change in the user’s emotional state, generating
multiple emotional reactions such as anxiety or happiness. For a given VR system with a
certain degree of immersion, different users can experience different levels of presence
depending on their own perceptions and backgrounds (Cummings and Bailenson, 2016).
In conclusion, a tight relationship exists between presence and immersion. Presence can
be produced by immersion, which does not imply that immersion always induces
presence. However, presence is limited by immersion, i.e. the greater the degree of
immersion, the more likely a user has the perception to feel present in the virtual world
(Jerald, 2015).
2.3 Virtual reality systems
Virtual reality systems are a combination of hardware and operating systems that enable
virtual reality experiences. They act as intermediaries between the computer and the user,
allowing the communication between them (Jerald, 2015, p.30).
Hardware refers to multiple devices such as the display, the input devices activated by
the user, the input devices to monitor the user, and the computer that is responsible for
creating and modeling the virtual world. On the other hand, software consists of a series
of components that make the virtual experience possible, e.g. libraries for simulating
events and connection with the input/output devices (Craig et al., 2009, pp.10-23).
Virtual reality systems are divided into four primary elements: input, application,
rendering, and output. Input gathers data and information from the user, for example,
where the user’s head is located. The application relates to non-rendering aspects of the
virtual environment, such as user interaction and updating objects’ geometry. Rendering,

2. Virtual reality background Page 8
on the other hand, consists of the translation from a computer-format to a format that can
be understood by the user. That includes visual, auditory, and haptic (sense of touch)
aspects. Finally, the output is the final physical representation, which is perceived by the
user through different devices (Jerald, 2015, p.32).
In general, virtual reality systems can be classified following different criteria. One
criterion is the type of visual display (output device) used. In this context, systems are
categorized into head-mounted displays, world-fixed displays, and hand-held displays
(Jerald, 2015, p.33). In relation to that, virtual reality systems are also classified
depending on their degree of immersion: fully immersive systems (using a head-mounted
display), semi-immersive systems (using large projection screens), and non-immersive
systems (using desktop-based systems). Fully immersive systems use head-mounted
displays to isolate the user from the real world, contributing to the credibility of the
simulation. On the other hand, semi-immersive systems provide 3D sound and high-
resolution graphics. An example of this type of system is the CAVE, a multiuser
workplace enclosed with screens in which the virtual world is displayed. Usually, semi-
immersive systems allow sharing the simulation with multiple users. Finally, non-
immersive systems are desktop-based applications such as video-games. The advantages
of this kind of systems are their lower cost, ease of use, and installation (Gutierrez Alonso
et al., 2008, pp.2-3).
Figure 1. Example of HMD (a). Example of CAVE system (b). Example of a desktop-
based application with a video camera (c).
Sources: Craig et al. (2009, p.7) (a) and (b); Sherman and Craig (2019, p.17) (c).
In the specific study scenario of this thesis, only fully immersive systems are considered,
in particular, the head-mounted display. Therefore, from this point on, the thesis only
focuses on these.
(a) (b) (c)

2. Virtual reality background Page 9
2.3.1 The Head-Mounted Display
Head-mounted displays (HMDs) belong to the category of fully immersive virtual
systems, and generally, provide the greatest degree of immersion. They consist of a visual
display that is attached to the user’s head and equipped with earphones. HMDs must track
the movement and position of the head in order to provide an optimal virtual scene in
which the virtual objects stay stable in space. Consequently, for optimal performance,
HMDs must present accurate tracking, low latency, and careful calibration (Jerald, 2015,
pp.32-33).
Latency is defined as the time a system needs to respond to an action performed by the
user. If latency is not low enough, the virtual scenes appear unstable, creating a sensory
conflict to the user (Jerald, 2015, p.177).
Another important factor in VR HMDs is the field of view (FOV), which is defined as
the angular measure of what can be seen at a certain point in time. The total FOV of
human eyes, when the head is fixed, is about 200°. However, when considering the
movements of the head and body, i.e. the field of regard (FOR), it increases to 360°.
Virtual reality HMDs usually have a FOV of 100°, which is lower than natural, but they
reach a FOR of 360° (Jerald, 2015).
Virtual reality head-mounted displays, also named VR headsets, can be classified into
two groups: smartphone-based headsets and headsets intrinsically designed for VR. The
former is a low-cost solution that consists of a frame in which the smartphone is attached.
Its performance only depends on the smartphone. The latter has better features, and it is
more practical and comfortable (Fuchs, 2017, pp.57-59).
Figure 2. Example of a smartphone-based HMD, in particular, a Samsung Gear VR.
Source: Stein (2017).
However, head-mounted displays are not sufficient to interact with the virtual world. The
HMD is used to visualize the virtual system, but in order to interact with it, the user needs
additional input devices. In general, the control over the virtual system, when wearing an

2. Virtual reality background Page 10
HMD, is carried out through gestural interfaces, such as motion controllers, or through
interfaces that can be easily used without relying on the sight, e.g. handheld controller
and tangibles (Billinghurst and Kato, 1999).
Figure 3. Examples of input devices. Steering wheel for driving simulation (a).
Hand-held input controller (b).
Sources: Craig et al. (2009, p.28) (a); Sherman and Craig (2019, p.47) (b).
2.3.2 Commercial VR HMDs
Traditionally, virtual reality was reserved for academic and research purposes. However,
since Ivan Sutherland developed the first HMD in the 1960s, virtual reality technology
has undergone significant development and innovation, enabling the emergence of
commercial VR HMDs (Hou et al., 2017).
Companies such as Oculus, Google, or Samsung are leading the commercial VR HMDs
market offering VR devices with a lower weight, lower latency, better field of view, and
resolution at an affordable price (Jerald, 2015, pp.32-33). Some of the first commercial
HMDs are Sony PlayStation VR, Samsung Gear VR, Oculus Rift, and HTC (Ahn et al.,
2017).
Figure 4. PlayStation VR headset (a). HTC Vive headset with controllers (b).
Sources: Playstation website1 (a); Fuchs (2017, p.65) (b).
Nevertheless, this first generation of VR HMDs must face different challenges to achieve
their full potential. One of the key problems is that an HDMI cable is needed to transfer
1 https://www.playstation.com/es-es/explore/playstation-vr/, Accessed: 02.09.2019.
(a) (b)
(a) (b)

2. Virtual reality background Page 11
data between the headset and the PC or game console. The presence of this cable
represents a limitation of the user’s mobility and interferes with the VR experience.
Moreover, it can create a hazard situation in which the user could trip with the cable since
he or she has the eyes covered (Abari et al., 2017).
This cable is required in PC-based VR headsets such as Oculus Rift and HTC Vive, in
which the content is generated in the PC. On the other hand, Gear devices such as
Samsung VR, do not need a cable because a smartphone attached to the headset generates
the graphics (Abari et al., 2017). Although the latter enables more mobility, the graphics
are not stable with movement and tend to blur (Stein, 2017).
In 2018, Oculus announced its first standalone VR headset, the Oculus Go2. This new
generation of untethered VR HMDs enables the user to move freely without hazards and
gives the possibility to carry the headset anywhere. Rather than depending on a computer,
all content is generated by a processor integrated into the headset. However, this type of
processor still does not have the same capacity to power high-end VR experiences as PC-
based headsets (Knapp, 2018). One year later, Oculus launched a new standalone VR
headset, the Oculus Quest. Although both headsets present similar exterior appearance
and head mounting mechanisms, there is a significant difference in weight. The Quest
weighs 100 grams more than the Go and the Rift, which weights are approximately 470
grams. This weight difference could be noticeable in long sessions. On the contrary, the
Quest processor is more powerful than the Go processor, although it still does not reach
the power level of headsets connected to a computer (Martindale, 2018).
The greatest difference between both standalone headsets is the tracking capabilities and
input options. Whereas the Oculus Go has a series of onboard sensors that deliver three
degrees of freedom, the Oculus Quest presents six degrees of freedom, which enables
room-scale experiences usually associates with PC-based headsets. Regarding input
devices, the controllers of the Oculus Quest are more sophisticated and capable of
tracking complicated motion inputs (Martindale, 2018).
Even though there is still a long way to go before the VR headsets reach their full
potential, Oculus Quest represents a powerful headset that barely presents the
shortcomings of the first headsets released from 2015 (Martindale, 2018).
2 https://www.oculus.com/blog/oculus-go-available-now-our-best-vr-optics-in-our-first-standalone-vr-
headset/?locale=es_ES, Accessed: 22.08.2019.

2. Virtual reality background Page 12
Figure 5. Oculus Go (a). Oculus Quest (b).
Sources: Oculus Go website3 (a); Oculus Quest website4 (b).
2.4 Virtual reality sickness
The use of virtual reality also has adverse effects on the user’s health. These effects
include a wide range of symptoms that may, in the worst-case scenario, cause the user not
to be able to complete the VR experience. Among all symptoms, the feeling of sickness
during and, or after experiencing VR is one of the greatest challenges of virtual reality
(Jerald, 2015, p.159).
The sickness related to virtual reality has been commonly denominated with diverse terms
such as motion sickness, cybersickness, and simulator sickness. Although the symptoms
they cause are similar, including nausea, dizziness, and even vomiting, they are
conceptually different. Motion sickness refers to the series of unpleasant symptoms
associated with motion exposure, which can be real or apparent. That includes the
symptoms suffered, for example, in roller coasters or during car journeys. On the contrary,
cybersickness is a form of motion sickness visually caused by the interaction with a
computer-generated virtual environment. Finally, simulation sickness occurs when a
simulation presents shortcomings. For instance, when the apparent motion does not match
the physical one. Nevertheless, it does not imply exposure to a virtual world (Jerald, 2015,
p.160).
During a virtual experience, the user can suffer from all three types of sickness or just one
of them. In order to refer to sickness in general, including the three types, the term virtual
reality sickness is used in this work.
3 https://www.oculus.com/go/, Accessed 02.09.2019.
4 https://www.oculus.com/quest/, Accessed 02.09.2019.
(a) (b)

2. Virtual reality background Page 13
According to Feiner and Fernandes (2016), high-quality tracking systems can reduce the
VR sickness experienced by moving users. On the other hand, it has been observed that,
generally, VR sickness is minimized when decreasing the display field of view (FOV)
(Lin et al., 2002). Nevertheless, a study conducted by Seay et al. (2001) showed that
reducing the FOV can also decrease the sense of presence perceived by the user, affecting
negatively the VR experience. Researches have worked on multiple techniques and
procedures to minimize VR sickness by reducing the FOV without affecting the sense of
presence (Feiner and Fernandes, 2016).
In summary, virtual reality sickness is one of the greatest challenges that virtual reality is
facing because it affects directly the user during the VR experience. However, developers
and researchers are developing solutions to this issue in order to offer a comfortable and
pleasant experience to the user.
2.5 Virtual reality applications
Virtual reality has been applied in many different areas with the aim of solving problems,
improving human life, or enhancing personal experiences (Craig et al., 2009, p.36).
One of the first applications of virtual reality was flight simulation, which pertains to the
training category. Virtual reality has been demonstrated to be a useful and optimal tool
for training simulations. In these simulations, participants learn and train special skills,
techniques, or other abilities in the virtual world. For example, dangerous tasks or
uncommon practices can be trained without any risk. Then, they can apply their
knowledge and practice acquired to the real world. In addition, the advantage of a
computer-generated medium is that the operator has more control over the simulation and
can alter the scenarios depending on the trainee’s accomplishment (Craig et al., 2009,
p.38).
Figure 6. Astronaut virtually training tasks (a). Surgery training (b).
Sources: Craig et al. (2009, p.32) (a); Sherman and Craig (2019, p.16) (b).
(a) (b)

2. Virtual reality background Page 14
This application is especially interesting for surgery, military, vehicle driving, machinery
maintenance, sports, and games in which technique is important (Earnshaw et al., 1993,
pp.46-47).
Virtual reality also offers important advantages in the prototyping field. Virtual
prototypes have the advantage of saving money and reducing time since any modification
on the product is done virtually on a computer file, which is easier and less expensive
than modifying a physical composition. In addition, virtual prototyping allows evaluating
a product from several perspectives, e.g. ergonomics or aesthetics. A further advantage is
that computer files are easily distributed, enabling design collaboration across large
distances. Finally, it can be widely applied, regardless of size and complexity, to different
products such as appliances or submarines (Craig et al., 2009, p.36).
Data visualization is also enriched with virtual reality, which offers a more comfortable
interface to navigate the data space. Through a 3D virtual reality interface, data is more
efficiently visualized and presented than through the traditional 2D interfaces of desktop
and mouse (Craig et al., 2009, p.37).
Virtual reality has also entered in the entertainment market, becoming a great success.
The cause of its popularity and the difference with respect to other entertainment
technologies is a fully immersive and more realistic experience. In addition, the quality
of graphics has improved, enhancing its performance (Craig et al., 2009, p.38).
Figure 7. A game player in an immersive virtual game.
Source: Craig et al. (2009, p.55).
The medical field has also been highly benefited by the implementation of virtual reality.
Aside from being used to train surgical interventions, virtual reality is also used as a
support in several treatments for physical and mental problems. For example,
rehabilitation can be supported by virtually integrating games and goals in the routinary
exercises. A further example is the treatment of phobias by exposing the patient to the

2. Virtual reality background Page 15
situation, object, or creature that causes fear. Exposing the patient to the real situation can
be impractical, dangerous, or impossible, but a virtual simulation allows a higher control
of the situation and avoids any dangerous exposure. The use of virtual reality has been
demonstrated to be successful in treating the fear of open spaces, heights, public speaking,
spiders, and flying (Mihelj et al., 2014, pp.9-10).
Lastly, virtual reality has also been implemented in other sectors, for instance, for
educational, and artistic purposes. Nevertheless, virtual reality has only been applied to a
part of its endless possible uses. As virtual reality becomes more popular and common,
new applications and tasks for it will emerge (Craig et al., 2009, pp.38-39).
2.6 Virtual reality in the automotive industry
At the end of the 90s, some car manufacturers such as Daimler and Volvo already realized
the potential of virtual reality for driving simulation tests. Still, the real production
application of VR began with the integration of a VR head-mounted display into a driving
simulator at Renault. Later on, multiple projects were carried out to study the integration
of VR into driving simulation systems (Fuchs, 2017, pp.163). At that time, automotive
manufacturers began to investigate the application of virtual reality in vehicle
development and manufacturing processes as well. Their efforts to reduce costs and time
in the design phase led to the development of the virtual prototyping (Mousavi et al.,
2012). Since then, virtual reality has been applied for multiple purposes, including design,
manufacturing, and training (Lawson et al., 2015).
Car design is considered one of the most costly aspects of car production in terms of time
and money. It is a complex process that entails constant adjustments and reviews before
the car is finally launched to production (Lawson et al., 2015). In that context, virtual
prototyping appears to be a really useful tool, reducing time, and costs. In that way,
physical mock-ups can be replaced by virtual ones, avoiding their rebuilding in case of
design errors or modifications (Kim et al., 2011; Kulkarni et al., 2011). That is especially
interesting during the early phase of the design process before costly physical prototypes
are produced (Lawson et al., 2015).
Virtual reality has also been applied to car manufacturing, resulting in the term virtual
manufacturing. Fundamentally, it consists of using virtual reality or computers for
product development (Shukla et al., 1996). The advantages of virtual manufacturing are
several, from the increase of risk measures to higher control of manufacturing processes
(Lee et al., 2001).

2. Virtual reality background Page 16
Regarding virtual training, Borsci et al. (2015) exposed that trainees prefer virtual reality
training of operations over the traditional methods based on observation. In simulated
training, the task completion rate is higher than training on real equipment (Stone, 2011).
In addition, individuals trained with VR present higher retention of information after two
and four weeks, which has been demonstrated for assembly and disassembly tasks (Borsci
et al., 2015).
2.7 In-car virtual reality experiences
In the last years, virtual reality has been widely applied in the automotive industry for the
most diverse purposes. So far, virtual reality has been mainly employed to improve
processes and to reduce costs and time. But recently a new application has emerged in the
field of in-car entertainment.
For the first time, Audi presented its VR in-car entertainment solution at the CES 2019 in
Las Vegas. The demonstration consisted of using an Oculus Go headset while being in
the Audi e-Tron, the company's new SUV, during a trip around Las Vegas at speeds of
90 mph. The experience, which was built in cooperation with Disney, involved a space
game based on The Avengers movie (Burns, 2019).
The solution was developed by Audi Electronics Venture, a subsidiary of the company,
which resulted in a spin-out Startup, Holoride, which owns the technology license. Today,
Holoride is an independent startup that uses an open platform to enable other automakers
and developers to build similar solutions (Burns, 2019).
Figure 8. Holoride virtual reality experience demonstration.
Source: Audi website5.
5 https://www.audi.com/en/experience-audi/mobility-and trends/digitalization/holoride-virtual-reality-
meets-the-real-world.html, Accessed: 02.09.2019.

2. Virtual reality background Page 17
Holoride's solution matches the VR content with the dynamics of the vehicle,
compensating all kinds of movements. In addition, it reduces the VR sickness perceived
when using a VR headset, and the car sickness when traveling in a vehicle. That allows a
more comfortable and less boredom ride. Today, in-car entertainment is limited to size-
reduced screens and motion sickness but this new solution will expand its potential
(Burns, 2019).
After Holoride was spun-out, it has partnered with other automakers to develop in-car
virtual reality solutions. That is the case of Porsche, which presented its project five
months later at the Startup Autobahn Expo Day in Stuttgart. The goal of the project is to
adapt, in real-time, the virtual content to the car’s movements. That is achieved by pairing
the VR headset with the sensors in the vehicle. In that way, the immersion experienced is
higher, and the motion sickness is reduced6.
Nevertheless, not only Holoride is developing VR in-car entertainment solutions, but
other companies and startups have joined this initiative as well. For example, Renault in
partnership with Ubisoft developed a VR experience that can be enjoyed by riding in
Renault’s self-driving concept car (Kuchera, 2018).
In conclusion, virtual reality has begun a new era for in-car entertainment, enhancing its
possibilities beyond the vehicle's physical constraints. The goal of this application is to
address the shortcomings of current IVI systems and introduce it as a future in-car
entertainment solution for autonomous cars. Although the performance of this technology
has been already demonstrated by several automakers, this solution is not open to the
market yet. Car manufacturers have to develop new business models and strategies in
order to offer this service to their customers successfully. They also have to offer content
for all preferences and all user profiles. In that context, customer acceptance is a crucial
element that can provide valuable insights. However, there is little research in the
literature on that topic. Therefore, the aim of this thesis is to provide knowledge on this
subject.
6 https://www.inavateonthenet.net/news/article/in-car-vr-paired-with-vehicle-movements-for-super-
immersive-experience, Accessed: 22.08.2019

3. Theoretical framework Page 18
3. Theoretical framework
3.1 User acceptance of technology
The user acceptance of technology has been a prolific field of research since the 1980s
when the incorporation of computer and information technologies in organizations
increased drastically. At that time, the use of these technologies was intended to improve
productivity, so employees had to accept and adopt them. As a result of this, it was
important to predict and explain the usage of new technology in order to successfully
introduce it in organizations (Venkatesh et al., 2003, p.426).
The latest research has led to the development of multiple theoretical models aimed to
explain the reasons that drive an individual to use new technology. Although there exist
several streams of research, the models usually combine psychology, sociology, and
information systems traits. One direction of research focuses on the individual’s reactions
toward the use of technology, which are believed to influence the individual’s intention
to use, determining the actual usage of the technology. This basic concept is shown in
Figure 9 (Venkatesh et al., 2003, pp.426-427).
Figure 9. The basic concept underlying user acceptance models.
Source: Venkatesh et al. (2003, p.427).
Among all the theories proposed to explain and predict the use of technology, the
Technology Acceptance Model (TAM) is the most influential and commonly employed
model (Tang and Chen, 2011).
3.2 Technology Acceptance Model
The Technology Acceptance Model was originally proposed in 1986 by Fred Davis as
part of his doctoral thesis at the MIT to predict computer utilization behavior (Lai, 2017).
The goal of his model was to describe how the characteristics of computer-based
information systems affect user acceptance. His research had two main objectives: on the
one hand, enhance the comprehension of user acceptance processes; on the other hand,
confer the theoretical foundation for a methodology to analyze new technologies before
their implementation (Davis, 1985, p.7).

3. Theoretical framework Page 19
Davis based his model on the Theory of Reasoned Action, formulated by Fishbein and
Ajzen in 1975, which establishes that the behavioral intention towards usage depends on
two determinants: Attitude toward behavior and Subjective norm (Surendran, 2012).
Behavioral intention is defined as the subjective possibility that an individual will behave
in a specific way, and attitude relates to the degree of affection toward the target behavior.
Finally, the Subjective norm is what the individual perceives regarding what his or her
peers think he or she should do about the specific behavior (Fishbein & Ajzen, 1975,
pp.216-302).
In the original TAM, the actual usage of a system is mainly determined by the Attitude
toward using the system, which in turn is influenced by two core beliefs: Perceived ease
of use (PEOU) and Perceived usefulness (PU). Additionally, PEOU also has an effect on
PU, and both factors are influenced by external variables that correspond to system
characteristics. Davis defined Perceived usefulness as “the degree to which an individual
believes that using a particular system would enhance his or her job performance” and
Perceived ease of use as “the degree to which an individual believes that using a particular
system would be free of physical and mental effort” (Davis, 1985, p.24-26). The original
TAM is represented in the following figure.
Figure 10. The original TAM proposed by Davis (1986).
Source: Lai (2017).
Subsequent studies led Davis to redefine his model in order to include other variables and
modify the relationships that he originally established. The final version of the TAM was
formulated in 1996 by Venkatesh and Davis and included Behavioral intention (BI) as a
new variable to explain the actual use of technology. In addition, it was found that PEOU

3. Theoretical framework Page 20
and PU had a direct effect on BI, thus allowing the removal of the Attitude toward use
construct from the model (Lai, 2017).
Figure 11. The final version of TAM proposed by Davis and Venkatesh (1986).
Source: Lai (2017).
Although the TAM was first used to analyze computer usage behavior, the model has
been applied to predict different technologies, for example, word processors, email, and
web usage. It has been applied under different circumstances, with different control
factors (e.g. gender and size) and different subjects (e.g. MBAs and undergraduate
students), proving its robustness and parsimoniousness (Lee et al., 2003). As a matter of
fact, Lee et al. (2003) found over 700 journal citations of Davis’ two first articles by 2003,
which demonstrates the impressive impact it has had on this field of study (Bagozzi,
2007).
Despite its popularity, the TAM also presents inherent limitations. One of the most
questioned facts is, actually, its parsimony. Some researchers consider that it is unrealistic
to presume that one simple model can fully explain the complex process and behavior
that leads an individual to adopt new technology. Another aspect that has been widely
criticized is that researchers have focused on extending the model rather than deepening
it. In other words, there is little research intended to explain the antecedents of PEOU and
PU, the reasons behind the effects they cause (Bagozzi, 2007).
In the same way that TAM has remarkably contributed to the study of acceptance of
technology, it has also raised concerns in the academic community. As a result of this,
the model has been extended and modified in order to address its shortcomings, resulting
in several derivative theories (Surendran, 2012).
3.3 Derivative theories of TAM
Multiple studies have been conducted, causing the TAM to evolve over time, resulting in
new derivative theories. Researchers have intended to address issues of the original model
by adding new variables or antecedents to the existing constructs (Surendran, 2012). The
most relevant ones are presented in the following.

3. Theoretical framework Page 21
In 2000, Venkatesh and Davis proposed one of the most important extensions, the TAM2.
The new model included additional variables that acted as antecedents to the PU construct
in the TAM. The purpose of these external variables was to explain why users would find
a given system useful, addressing one of the most commented shortcomings of the
original model. The model was tested showing that it performed well in voluntary and
mandatory environments (Lai, 2017).
Figure 12. The TAM2 proposed by Venkatesh and Davis (2000).
Source: Lai (2017).
Later on, Venkatesh proposed the model of determinants, following his interest in
identifying the antecedents of PEOU. These determinants were classified into anchors
and adjustments. The former were contemplated as general beliefs about usage, whereas
the latter were considered as beliefs based on direct experience with the system (Tang
and Chen, 2011).
A further extension of the technology acceptance model was introduced in 2008 by
Venkatesh and Bala. They combined the model of determinants of PEOU with the
TAM2, resulting in the TAM3, a much more complete research model that includes
antecedents to both factors, PEOU and PU, and variables that act as moderators (Lai,
2017).

3. Theoretical framework Page 22
Figure 13. The TAM3 proposed by Venkatesh and Bala (2008).
Source: Lai (2017).
Finally, Venkatesh, Morris, and Davis combined eight existing technology acceptance
theories and models to develop the Unified Theory of Acceptance and Use of Technology
(UTAUT). These included: the Theory of Reasoned Action (TRA), the Technology
Acceptance Model (TAM), the Motivational Model (MM), the Theory of Planned
Behavior (TPB), the Model of Computer Utilization (MPCU), the Innovation Diffusion
Theory (IDT), the Social Cognitive Theory (SCT) and a model integrating the TAM with
the TPB (C-TAM-TPB). This integrated model has four core constructs: Performance
expectancy, Effort expectancy, Social influence, and Facilitating conditions. These
constructs predict the individual’s intention to use technology and also account for
moderating variables such as gender, age, experience, and voluntariness of use (Tang and
Chen, 2011).

3. Theoretical framework Page 23
Figure 14. The UTAUT, an integrated model combining eight user acceptance theories.
Source: Lai (2017).
3.4 Proposed research model
In this part, the research model is presented developed to study which factors can predict
the user acceptance of the utilization of VR HMDs when riding as a backseat passenger
in the car. The hypotheses of the model are included as well.
From the theories mentioned above, the TAM was chosen to ground the research model
since it has been already successfully applied to explain the user acceptance of other
innovative virtual reality applications. Among other studies, TAM has been applied to the
use of VR in tourism (Disztinger et al., 2017), and the use of VR in clinical settings
(Bertrand and Bouchard, 2008).
The basis of the model is built on the core constructs of Davis’ model, i.e. Perceived
usefulness and Perceived ease of use (Davis, 1985). Following the latest version of the
TAM, Attitude toward use has been omitted from the model and Behavioral intention is
considered the end factor that predicts actual usage of the system. According to Davis’
work, the first hypotheses are proposed as follows:
H1: Perceived usefulness (PU) positively influences Behavioral intention (BI) to use VR
HMDs while being a backseat passenger in the car for entertainment and productivity
purposes.

3. Theoretical framework Page 24
H2: Perceived ease of use (PEOU) positively influences Behavioral Intention (BI) to use
VR HMDs while being a backseat passenger in the car for entertainment and productivity
purposes.
H3: Perceived ease of use (PEOU) positively influences Perceived usefulness (PU).
In order to complete the research model and adapt it to the specific study scenario, other
variables have been added to the model. These variables have been selected from prior
studies in which the TAM has been applied to predict the use of virtual reality for different
applications.
The first additional variable introduced in the model is the Perceived Enjoyment (PENJ)
which is defined as the degree to which a technology is perceived to be enjoyable (Davis
et al., 1992). Van der Heijden (2004) observed that PENJ had a significant effect in the
case of hedonic systems, which are fun-oriented systems. Since virtual reality has been
categorized as a hedonic technology (Holsapple and Wu, 2007), it is reasonable to
formulate the following hypotheses, in which PENJ acts as antecedent of PU and PEOU.
H4: Perceived enjoyment (PENJ) positively influences Perceived Usefulness (PU).
H5: Perceived enjoyment (PENJ) positively influences Perceived Usefulness (PEOU).
A further variable is Personal innovativeness (PI) which relates to the individual’s
predisposition to try new technologies (Agarwal and Prasad, 1998). Yusoff et al. (2011)
found out a positive effect of PI in BI in a virtual reality scenario, demonstrating that it’s
a personal trait that influences technology adoption. Furthermore, it is believed that PI
also influences PU, supposing that an individual that is innovative affine would have an
opener perspective to the usefulness of new technology. Additionally, it is also presumed
to influence PEOU, believing that an individual that is innovative affine had prior
experience with other innovative technologies, causing that he or she handles him or
herself with ease with new technologies. Therefore, it is proposed:
H6: Personal innovativeness (PI) positively influences Behavioral Intention (BI) to use
VR HMDs while being a backseat passenger in the car for entertainment and productivity
purposes.
H7: Personal innovativeness (PI) positively influences Perceived usefulness (PU).
H8: Personal innovativeness (PI) positively influences Perceived ease-of-use (PEOU).

3. Theoretical framework Page 25
Performance risk (PR) is also believed to have a significant role in the model. It is defined
as the likelihood that the technology will not perform as expected. Since the adoption of
new technology always involves a risk (Yang et al., 2016) it is formulated:
H9: Performance risk (PR) negatively influences Behavioral intention (BI) to use VR
HMDs while being a backseat passenger in the car for entertainment and productivity
purposes.
H10: Performance risk (PR) negatively influences Perceived usefulness (PU).
The last variable added to the model is Accessibility (ACC), which relates to the extent to
which the technology is perceived affordable (Kothgassner et al., 2012). If the technology
is perceived to have difficult access, either because it is perceived as expensive or difficult
to obtain, it can negatively affect the intention to use the technology (Disztinger et al.,
2017). Thus, the following hypotheses are proposed:
H11: Accessibility (ACC) positively influences Behavioral intention (BI) to use VR
HMDs while being a backseat passenger in the car for entertainment and productivity
purposes.
H12: Accessibility (ACC) positively influences Perceived usefulness (PU).
Finally, moderating elements are also considered in the model. Prior studies, for instance
from Venkatesh et al. (2003), indicate that socio-demographical aspects also have an
impact on the individual’s intention to use and adopt new technology. In this research
model, five elements are taking into account: Gender (MOD1), Age (MOD2), Experience
with VR headsets (Expertise) (MOD3), VR headset ownership (MOD4), and Prior VR
headset usage (MOD5).
H13: Socio-demographical elements moderate the Behavioral Intention (BI) to use VR
HMDs while being a passenger in the car for entertainment and productivity purposes.
Therefore, the research model is formed by seven variables, six from them are presumed
to influence directly or indirectly the Behavioral intention, which in turn predicts the
actual use of this application. Additionally, it is believed that five moderating elements
affect BI.
The structure of the model can be observed in Figure 15, in which the hypotheses are also
represented, indicating the relationships between variables.

3. Theoretical framework Page 26
Figure 15. The research model employed to address the research question.
Source: Own representation.
The structure of the model and its validity will be tested in the following chapters, which
will allow to accept or reject the different hypotheses. In that way, the influence of the
different variables will be evaluated.

4. Methodology Page 27
4. Methodology
In this section, the research methodology employed to validate the research model is
described. It is initiated with the characteristics of the research, i.e. the purpose, the
approach, and the strategy, followed by the sampling, and ends with the description of
data collection and analysis.
4.1 Research purpose
Depending on the objectives of the research, a study can be categorized into four different
groups: exploratory, descriptive, correlational, and explanatory. The exploratory research
aims to search and give new insights into a specific research area in which little research
has been conducted. Descriptive research seeks to systematically describe a situation or
phenomenon. The correlational research, on the other hand, attempts to establish
relationships or interdependencies between variables in a specific situation. Finally, the
explanatory purpose pursuits to explain the causes of the relationships between variables
of a specific phenomenon (Kumar, 2011, pp.10-11).
In this case, the study contains elements from both exploratory and correlational research.
On the one hand, the study is exploratory since there is little research about the user
acceptance of using VR HMDs while riding as a backseat passenger in the car, so one
goal is to provide insights into this topic. On the other hand, the study is correlational
because it attempts to establish the relationships between the different factors of the
research model.
4.2 Research approach
According to Kumar (2011, pp.13-14), there are three basic approaches to conduct
research: quantitatively, qualitatively, and mixed methods. The main difference between
them is the flexibility provided to the researcher in the research process.
The quantitative approach employs a structured and predetermined set of methods to
inquire. It is sustained on large data samples and gives importance to the reliability and
validity of the data. The conclusions drawn from the study can be generalized. The former
can be sub-classified into inferential, experimental, and simulation approaches. The
inferential approach seeks to generate a database from which the researcher can deduce
the characteristics and relationships of the population. Survey research is usually used in
this procedure. Alternatively, in the experimental approach, the control over the research
environment is greater and some of the variables are manipulated to discern their effects

4. Methodology Page 28
on other variables. The simulation approach, on the contrary, involves the creation of an
artificial environment in which data and information of interest are generated (Kothari
and Garg, 2014, p.5).
On the other hand, a qualitative research approach follows unstructured and flexible
procedures to investigate. It focuses on the perceptions and experiences rather than on
their measurements. The results obtained are not communicated in an analytical manner
but rather described or narrated (Kumar, 2011, p.14). In general, the data is collected
through focus groups or in-depth interviews (Kothari and Garg, 2014, p.5).
Finally, mixed methods combine the advantages of both quantitative and qualitative
research. Rather than focus on the quantitative-qualitative distinction, they focus on
selecting the best methods to collect and analyze the data to answer the research questions
(Kumar, 2011, p.14).
The procedure selected for this study is a quantitative approach because it is sought to
generalize the conclusions and give importance to the validity of the data. In particular,
the inferential approach is chosen because the data collection is performed by conducting
a survey. In addition, with this method, the characteristics and relationships of the
population are presented.
4.3 Research strategy
The research strategy is determined by the type of approach chosen, in this case, the
quantitative inferential. As mentioned in the previous subchapter, one of the most
common practices in this kind of approach is conducting a survey.
For this strategy, the researcher collects relevant information from a large sample from
the population of interest. Its wide scope makes it more likely to obtain data that can be
generalized to the population. In addition, the data obtained is empirical, i.e. based on
real-world observations (Kelley et al., 2003). Generally, the data is collected through
questionnaires and interviews, following a standardized form.
Thus, the strategy to be followed is survey research. In particular, a questionnaire
(QUEST1) is conducted to validate the hypotheses of the research model.
4.4 Sampling
The goal of sampling strategies is to obtain a sufficient sample that is representative of
the population. It is often unfeasible and uneconomical to collect data from the entire
4. Methodology Page 29
population of interest, therefore, a subset of the population or sample is used to estimate
the population responses (Kelley et al., 2003).
Two categories of sampling can be identified: probability and non-probability sampling.
In the first category, every individual of the population can be selected through random
procedures to participate in the survey. On the contrary, in non-probability sampling,
subjective methods to select which individuals take part in the survey are employed
(Etikan, 2016).
Another important aspect of a sampling strategy is the sampling size. As stated by Kelley
et al. (2003), there is not a definitive answer to the sample size required for a survey.
Fundamentally, it depends on the available resources, the purpose of the study, and the
statistical quality needed. For instance, in quantitative surveys, the sample needed is
larger than in qualitative surveys.
In the QUEST1, the convenience sampling technique is used. Convenience sampling is a
non-probability sampling technique in which the research participants meet certain
practical criteria. The members of the target population that are easily accessible,
geographically close, available at a certain time, or willing to participate are included in
the study (Etikan, 2016). In that case, respondents belong to a European population.
Although this technique is likely to be biased, it was chosen because it is affordable and
easily accessible to the author.
4.5 Data collection
The sources for data collection can be either primary, secondary, or a combination of
both. Primary data is specifically gathered for a particular study, meaning that it does not
exist prior to the data collection. Thus, the researcher is able to tailor the data collection
strategy to the research problem. Nevertheless, it is a costly and time-consuming
approach. Differently, secondary data collection involves gathering existing data and
theories from sources such as books and journal articles. These data sets are collected by
universities and other research organizations and are archived and released to the research
community (Hox and Boeije, 2005).
In this case, a combination is used of both primary and secondary sources. Secondary data
collection is conducted to describe the background of virtual reality and to present the
Technology Acceptance Model. The main sources used are books and online documents
available on digital libraries. Furthermore, the research model is sustained on other TAM
studies available in journal articles and conferences.

4. Methodology Page 30
In contrast, the data used to validate the research model and extract user acceptance
findings is collected from primary sources. The strategy consists of conducting a
quantitative questionnaire to gather the data to answer the research question presented in
the first chapter.
4.6 Questionnaire design
The QUEST1 is intended to test the theoretical research model aimed to analyze the
technology acceptance of using VR headsets while riding as a backseat passenger in the
car. The data obtained will permit to accept or reject the hypotheses established in the
first chapter.
The questionnaire must follow a standardized structure that is split into two parts. First, a
series of demographical questions will be asked. These questions will serve the purpose
of describing the sample and evaluating some moderating effects on the model. Then,
questions about the variables of the research model will be inquired. For each variable,
there is a psychometric scale composed of four or three items that are measured on a 1-5
point Likert scale. This scale was preferred over the 1-7 point Likert scale since related
works reflect that it is more suitable for the general public. The scales are adapted from
previously validated TAM research to the specific research scenario.
The psychometrics scales and the complete questionnaire can be found in the appendix
section A and B.
4.7 Data analysis
The analysis of the data collected through the questionnaire is conducted with the aid of
two software programs. The first software is SPSS from IBM which is a powerful
statistical program that allows the user to perform analysis of data and test scientific
conjectures. It can perform analysis from basic descriptive statistics to advanced tests
such as multivariate and factor analysis. The second software is SmartPLS, a graphical
program for analysis through structural equation modeling (SEM) using the partial least
squares (PLS) path modeling technique.
The data analysis is presented in two parts corresponding to the use of the two respective
software.

4. Methodology Page 31
4.7.1 Analysis with SPSS
The software SPSS is used to describe the sample and test the structure of the research
model. The sample is described by performing basic descriptive statistics, whereas the
structure is tested through more complex methods.
Before analyzing the model structure, the reliability of measurement scales for each
variable has to be measured in order to ensure validity. In this case, Cronbach’s alphas
are used to analyze the internal consistency of the measurement scales. Internal
consistency relates to the extent to which all the items of the scale measure the same
variable or construct. It describes the interrelations of items within the same variable
(Tavakol and Dennick, 2011).
The value of Cronbach’s alpha ranges from .00 to 1.00, being 1.00 the highest score
achievable. However, high values of alpha (>.90) may indicate redundancies and high
correlations between items. Different studies report that the acceptable values of alpha
are comprised in the interval between .70 and .90 (Tavakol and Dennick, 2011).
In order to test the model structure, an exploratory factor analysis is conducted. Factor
analysis is a suitable statistical method to analyze questionnaires with item scales because
it can identify underlying relationships between the measured items and the variables,
allowing the researcher to test theories. It is a multivariate technique that reduces the total
number of variables into a smaller set of factors and provides the factor validity of scales
(Williams et al., 2010).
This method is widely used in different fields, such as psychology and social sciences.
The most important advantages of factor analysis are listed in Table 1 (Williams et al.,
2010).
Table 1. Objectives of the exploratory factor analysis.
Reduce the number of variables
Examine the structure of relationships between variables
Detection and assessment of unidimensionality of a theoretical construct
Evaluates the construct validity of a scale, test, or instrument
Development of parsimonious (simple) analysis and interpretation
Addresses multicollinearity (two or more variables that are correlated)
Used to develop theoretical constructs
Used to prove/disprove proposed theories
Source: Williams et al. (2010).
Two categories of factor analysis can be identified: Exploratory factor analysis (EFA),
and Confirmatory factor analysis (CFA). The former is used to generate a model from a

4. Methodology Page 32
set of constructs measured by a group of items. On the other hand, the latter is employed
to test a proposed model (it is a form of structural equation modeling). Although in this
study a model is proposed, an EFA is conducted to assess the basic structure of the model,
i.e. identify the factors that best reproduce the variables (Gorsuch, 1983, p.129). The
model fit is validated in the next step with SmartPLS.
In order to perform an EFA, a set of decisions must be taken. These decisions are included
in five steps presented in Table 2 (Goldberg and Velicer, 2006).
Table 2. Steps to perform an EFA.
1. Determine the data and sample suitability for the analysis.
2. Determine the factor extraction method.
3. Determine the criteria to support the factor extraction.
4. Determine the rotational method of extraction.
5. Interpret the factor extraction.
Source: Goldberg and Velicer (2006).
In the first step, several tests must be performed to evaluate the suitability of the data for
the factor analysis. Regarding the sample size, there are multiple opinions and guidelines
within the literature. Some authors suggest that 50 cases are enough, whereas other
academics recommend up to 200 cases. In any case, there are two tests that evaluate the
suitability of data. On the one hand, the Kaiser-Meyer-Olkin test (KMO), which measures
the sampling adequacy, indicates that indexes higher than .50 are considered suitable for
the analysis. On the other hand, Bartlett’s test of Sphericity must have significant value
(p>.05) for the data to be suitable (Williams et al., 2010).
In addition, it is important to avoid multicollinearity issues in order to perform a more
accurate interpretation. That is evaluated in the Correlation matrix. Variables with low
correlation coefficients (r < +/- .03) should be removed from the analysis since they
denote a lack of patterned relationships. On the contrary, variables with high correlation
values (r > .90) may indicate a multicollinearity issue within the dataset and should be
removed as well. The determinant score of the Correlation matrix is also used to evaluate
multicollinearity. The rule of thumb indicates that determinant values above 1.00E-5
denote the absence of this issue (Yong and Pearce, 2013).
Another aspect to be considered is the communality of variables which represents the
amount of the variable's variance related to the number of factors extracted. Communality
values range between .00 and 1.00, being the latter the highest score, meaning that the

4. Methodology Page 33
variable is predicted by the factors. Usually, variables with communality values lower
than .20 are removed from the analysis (Goldberg and Velicer, 2006).
The second step focuses on the factor extraction method. The most common factor
extraction methods are listed in Table 3.
Table 3. Extraction methods commonly used in factor analysis (EFA and CFA).
Principal components analytics (PCA)
Principal axis factoring (PAF)
Maximum likelihood
Unweighted least squares
Generalized least squares
Alpha factoring
Image factoring
Source: Williams et al. (2010).
PCA and PAF are the most frequently used methods. Although they are theoretically
different, some authors argue that the results obtained with both methods are practically
much the same. The association matrix used to establish the relationship between
variables has to be selected as well. The main options are the Covariance matrix and the
Correlation matrix (Goldberg and Velicer, 2006). In this case, the PCA method is chosen
because it is recommended to establish preliminary solutions in the exploratory factor
analysis (Williams et al., 2010). The Correlation matrix is selected because it provides
standardized data (Yong and Pearce, 2013).
The criteria that support the factor extraction are considered in the third step. There exist
multiple guidelines available to simplify factor extraction. However, none will guide the
researcher to the scientifically most satisfactory solution. One of the most widely used
approaches is the Kaiser criterion, which proposes that factors with eigenvalues above
1.00 should be kept in the model. This criterion is usually set as default in statistical
packages as SPSS. Still, it has been criticized for its low reliability (Goldberg and Velicer,
2006).
Another approach is the Scree test, which consists of a graphic that represents the
eigenvalues and the number of factors. In order to inspect a Scree plot, the researcher has
to draw a straight line above the eigenvalues with lower value and identify the point in
which the break or debris occurs. The number of factors above this point should be
retained in the model (Williams et al., 2010). An example of the Scree plot interpretation
is showed in Figure 17. In this case, four factors are retained in the model. However, the
Scree plot might be difficult to interpret due to multiple breaks.

4. Methodology Page 34
Figure 17. Example of the procedure to read a Scree plot.
Source: Yong and Pearce (2013).
Parallel analysis is another method that was proposed to improve the Kaiser rule. This
approach generates a set of random correlation matrices in which the mean of the
eigenvalues are calculated. Then, the mean eigenvalues of the random dataset are
compared with the actual eigenvalues. Factors are retained as long as the value from the
actual data surpasses the value from the random data. This approach is considered to be
rather reliable (Goldberg and Velicer, 2006).
In general, researchers recommend the use of multiple techniques to assist with the
extraction of factors (Williams et al., 2010).
In the fourth step, the rotational method employed is selected. Rotation methods simplify
and facilitate the interpretation by maximizing high item loadings and minimizing low
item loadings. The existing techniques are categorized into orthogonal and oblique
rotations. The former technique is used when the factors are uncorrelated, whereas the
latter is employed when a high correlation between factors exists. Some of the methods
the most commonly used are Varimax and Quartimax for orthogonal rotation, and
Oblimin and Promax for the oblique one. The researcher chooses the rotation method
based on the degree of correlation between factors, and on the best fit to obtain a simple
model to interpret (Williams et al., 2010). In this specific analysis, the factors are believed
to be highly correlated. Therefore, in a first attempt, an oblique rotation is applied, in
particular, the Oblimin method. Then, to determine whether the rotation technique is
appropriate, the off-diagonal elements of the Component transformation matrix

4. Methodology Page 35
(Component correlation in case of non-orthogonal techniques) should be nearly
symmetrical (Yong and Pearce, 2013).
In the last step, the researcher performs the factor interpretation, which is a subjective
process. In general, at least three variables with loading values higher than .32 must load
on a factor in order to be valid. Factors with only two variables are also considered reliable
if the variables are highly correlated with each other (r > .70). Crossloadings, i.e. when
an item loads in more than one factor with loading values of .32, should be few. These
items can be retained or dropped depending on the design of the study (Yong and Pearce,
2013). The factor loading is read in the Pattern Matrix.
Finally, to check whether the model is a good fit, the percentage of non-redundant
residuals at the Reproduced correlation matrix with absolute values higher than .05
should be lower than 50% (Yong and Pearce, 2013).
4.7.2 Analysis with SmartPLS
Partial least squares structural equation path modeling (PLS-SEM) is used to evaluate
the model fit with the program SmartPLS.
SEM is a multivariate analysis approach that is used to analyze the relationships between
latent variables and their observed indicators. Latent variables are variables that cannot
be directly observed and measured. However, they can be measured indirectly through a
set of indicators. In this study, the latent variables are the factors of the model, and the
indicators, the items of each factor. Furthermore, the relationships between latent
variables can also be established (Wong, 2013).
There are several approaches to conduct a SEM analysis. For this study, the partial least
squares approach (PLS) is used. This approach focuses on the analysis of variance (Wong,
2013). In the following, the different steps to perform the PLS-SEM analysis are
described.
Before starting the analysis, it is important to make sure that the sample size is suitable
for the analysis. Although PLS is known for its use with small samples, studies suggest
that sample sizes between 100 and 200 are a reasonable starting point (Hoyle, 1995).
The first step is building the inner model, which represents the relationships between
latent variables. Then, the outer model is built by adding the indicators and linking them
to the respective variables.

4. Methodology Page 36
Figure 16. Example of an inner model in which the relationships between latent variables
are represented.
Source: Wong (2013).
Figure 17. Example of an outer model in which the connection between the latent
variables and their indicators are represented.
Source: Wong (2013).
Once the model is defined in the program, the path modeling method can be conducted.
In an initial assessment, the following topics have to be covered.

4. Methodology Page 37
Table 4. Topics to be covered when conducting PLS-SEM.
Explanation of target variable variance
Inner model path coefficient sizes and significance
Outer model loadings and significance
Indicator reliability
Internal consistency reliability
Convergent validity
Discriminant validity
Checking structural path significance in Bootstrapping
Source: Wong (2013).
The first topic refers to the variance explained by the latent variables. This value is found
in the circles that represent the variables. In the case of a specific variable, the value in
the circle corresponds to the variance explained by the other variables (Wong, 2013).
The inner model path coefficients are the values that appear on the arrows that connect
the latent variables between them. The path relationship is statistically significant when
the path coefficient is greater than .10 (Wong, 2013).
Figure 18. Example of the resulting output obtained with SmartPLS.
Source: Wong (2013).
The outer model loadings relate to the correlations between the latent variables and their
indicators. In order to have an adequate estimation, the algorithm should converge before
reaching the 300 iterations (Wong, 2013).
Another important topic is to evaluate the reliability and validity of the variables. That is
achieved by checking several indexes. In order to assess indicator reliability, the square
of the outer loadings should be higher than .70. However, in an explorative study, a value
of .40 is acceptable (Hulland, 1999). On the other hand, internal consistency is measured
by the composite reliability value that should be higher than .70 (Bagozzi and Yi, 1988).
Regarding validity, convergent validity and discriminant validity are checked. The former

4. Methodology Page 38
is measured through the AVE numbers (Average variance extracted), which should be
greater than .50 (Bagozzi and Yi, 1988). The latter is estimated by combining the AVE
numbers and the latent variables’ correlations. Fornell and Larcker (1981) indicate that
the square root of the AVE of each variable should be higher than the correlation value
between the variables.
The inner and outer models can be significantly tested with t-statistics using the
Bootstrapping procedure. This method provides t-values using a two-tailed t-test with a
significance level of 5% for significance testing of the structural model. In the case of the
inner model, the path coefficients are significant if the t-value is greater than 1.96. This
threshold value also applies to evaluate the significance of the loadings of the outer model.
Finally, the moderating effects on BI of the five socio-demographical elements will be
evaluated using the Multigroup analysis (PLS-MGA). This method compares the path
coefficients across two groups of data by conducting a modified two-independent-
sample-t test. Then, applying the Bootstrapping technique, it can be statistically tested
whether exists a difference between groups. For example, in case of the element VR
headset ownership, the technique will separate the sample into two groups: owners and
no-owners (Wong, 2016).

5. Analysis and discussion of results Page 39
5. Analysis and discussion of results
In this chapter, the results are presented and discussed from the analysis of the data from
QUEST1. The section is divided into three parts. First, the data sample is described. Then,
the results of the exploratory factor analysis are given. Finally, the validity of the model
is discussed.
5.1 Description of the sample
The total number of participants completed 100 valid questionnaires, during the period
between the 8th and the 31st of July 2019. The proportion of men (74%) in the sample is
higher compared to women (25%), and only one case preferred not to disclose the
information. Additionally, the sample belongs mostly to a European population.
Regarding the age range, most of the participants are below 36 years old. The combination
of the age ranges 18-25 and 26-35 represents 65% of the sample.
Figure 19. Age distribution in the sample.
Source: Own representation.
With respect to the education and the occupation of participants, most of them are
graduates of a master's degree and are currently employed.
Figure 20. Education and occupation description of the sample.
Source: Own representation.
Concerning the participants' involvement with virtual reality, only 7% own a VR headset.
Most participants have never experienced virtual reality, 30% participate from time to

5. Analysis and discussion of results Page 40
time in some virtual experience, and those who use virtual reality regularly represent a
very low proportion. In general, participants consider that they do not have experience
with virtual reality.
Figure 21. Use frequency and experience with VR headsets by participants.
Source: Own representation.
5.2 Exploratory factor analysis
In the following, the results of the explorative factor analysis are presented.
5.2.1 Reliability
Cronbach’s alphas were calculated in order to measure the internal consistency of the
measurement scales.
Table 5. Cronbach’s alpha values for the different variables of the model.
Variable Number of items Cronbach’s alpha
ACC 3 0.882
BI 4 0.923
PENJ 4 0.973
PEOU 4 0.869
PI 4 0.746
PR 3 0.766
PU 4 0.868
Source: Own representation, values from SPSS.
As shown in Table 5, all Cronbach’s alpha values are above .60, confirming the reliability
of the measurement scales. However, BI and PENJ present values above .80, which could
indicate high correlations between items. That was further analyzed through the
Correlation matrix.

5. Analysis and discussion of results Page 41
5.2.2 Structure validity
First, the suitability of data was tested. The KMO index obtained was .842, which is
considered acceptable for the EFA. In addition, Bartlett’s test of Sphericity resulted in a
significant value. Therefore, both tests indicated that the sample and data were suitable
for the analysis.
Then the Correlation matrix was analyzed. In this case, all items presented correlation
values greater than .30, at least with two other items, which indicates the presence of
pattern relationships. Nevertheless, PENJ and BI indicators presented high correlation
values (r > .80), denoting a possible multicollinearity issue and confirming the findings
of Cronbach’s alphas. In addition, the determinant of the matrix (1.35E-10) scored a value
lower than 1.00E-5, confirming the multicollinearity issue.
In the following figure, the correlation values for the variables PENJ and BI are exposed.
The complete correlation matrix can be found in appendix section D.
Figure 22. Correlation values of BI and PENJ items.
Source: SPSS.
In order to address the multicollinearity issue, items that presented correlation values
above .90 were removed from the analysis. Hence, PENJ2 and PENJ4 were omitted,
obtaining a correlation matrix with values below .90. However, the determinant value
was still lower than 1.00E-5, but greater than before (2.418E-8).
It must be noted that both rules, the determinant, and the correlation value cut-off, are
rules of thumb and are not scientifically precise. That means that decisions depend on the
design of the study. For example, in the case it was wanted to be rigorous with the
determinant rule, items with high correlation values should be removed until the threshold
value is reached. However, that would mean that variables, such as PENJ, would be only

5. Analysis and discussion of results Page 42
measured through one indicator (PENJ1), which is undesired for this study. As a result of
this, no more items were removed from the analysis.
Regarding the communalities, all variables present values higher than .20 and in most
cases higher than .70, acknowledging that the variables are represented by the factors.
After checking the suitability of data, it was proceeded to select the number of factors to
extract. The Total variance explained table shows that five factors, according to the
Kaiser rule, are extracted. These factors explain 69.89% of the variance, a fairly
acceptable value.
Figure 23. Number of factors to be extracted according to the Kaiser rule.
Source: SPSS.
On the other hand, the Scree plot leads to several interpretations due to the presence of
multiple breaks. The number of factors to be extracted could be four, five, or six.
Figure 24. Possible interpretations of the Scree plot.
Source: SPSS.

5. Analysis and discussion of results Page 43
On the contrary, the Parallel analysis clearly shows that only four factors should be
extracted.
Figure 25. On the left, the eigenvalues provided by the Parallel analysis. On the right,
the eigenvalues of the Kaiser rule.
Source: SPSS.
In order to select the most appropriate number of factors, different numbers were tested
to evaluate possible solutions, two of them are represented in Figure 26. As Yong and
Pearce (2013) stated in their work, the researcher must select the solution that provides
the most desirable rotated factor structure.
Figure 26. On the left, Pattern matrix from the solution with four factors. On the right,
Pattern matrix from the solution with six factors.
Source: SPSS.
In case that four factors were extracted, the variables PU, PEOU, BI, and PENJ would
load together in the same factor. That is undesired since BI, PEOU, and PU are defined
as independent variables in the TAM, which means that they should load in different
factors.

5. Analysis and discussion of results Page 44
Retaining five factors resulted in a better solution, but still BI and PU loaded together.
On the contrary, extracting six factors, as one possible interpretation of the Scree plot
suggests, results in a Pattern matrix that offers a solution that better matches the research
model because BI, PEOU, and PU were loaded in different factors. Therefore, six factors
were retained in the model.
Regarding the new model, the Pattern Matrix in Figure 26 shows the structure of the
factors. In order to only represent the significant factor loadings (high loading
coefficients), a coefficient cut-off of .40 was established.
It must be noted that PI3 was removed from the model because it presented a cross-
loading between factors 4 and 6.
It can be seen, that all variable’s indicators loaded together into the same factor except
PENJ indicators that loaded with PU indicators, conforming a factor together. That means
that for the participants, PU and PENJ were perceived to relate to the same idea. Then,
hypotheses H4 and H5 are omitted.
Although PENJ was thought to have different connotations than PU, it is not unusual that
it was related to PU. Since the purpose of using VR headsets in the backseat of the car is
entertainment, its usefulness lies in the fact that it results in enjoyable for the user in that
specific situation. Hence, it is logical to think that there is a strong relationship between
them.
The factors were named with the name of the original variables. With regard to the factor
conformed by PU and PENJ, the name chosen was PU to maintain the nomenclature of
the TAM. Table 6 shows the percentage of total variance explained by each factor and
the total variance explained by the model, which has a value of 76%, improving the value
obtained at the very beginning.
Table 6. Variance explained for the different factors. The blue value indicates the total
variance explained.
Factor % of Variance Cumulative %
PU 37.823 37.823
ACC 11.501 49.324
PR 9.880 59.204
PI 7.860 67.064
PEOU 4.911 71.975
BI 4.029 76.003
Source: Own representation, values from SPSS.

5. Analysis and discussion of results Page 45
To conclude this first analysis, it was verified that the rotation technique was appropriate
for the analysis and that the structure represented a good fit for the model. The former
was verified looking at the Component correlation matrix. The off-diagonal elements
should be symmetrical, which, as shown in Figure 27, is met in this case. The latter was
verified looking at the Reproduced correlation matrix. The number of non-redundant
residuals with values above .50 should not overpass 50%. The solution has 48 non-
redundant residuals (18%) with an absolute value higher than .05, fulfilling the condition
of model fit. Therefore, it was confirmed that the rotation method chosen was appropriate,
and the model, with six factors, results in a good fit.
Figure 27. The Component correlation matrix.
Source: SPSS.
5.3 SEM-PLS analysis
In the previous analysis, the structure of the model was validated, undergoing some
changes in the model. The model has now six factors instead of seven because PENJ was
merged with PU. Furthermore, some indicators were removed, in particular, PENJ2,
PENJ4, and PI3.
In this part, the model fit and the paths between factors were calculated. First, the inner
model was built by establishing the relationships between factors. Then, the model was
completed with the outer model, in which the indicators were linked to their
corresponding factors. After that, the PLS algorithm was run obtaining the outcome
represented in Figure 28.
In the blue circles that represent the latent variables, it is written the variance explained
of the variable explained by the association of the other ones. For example, in the case of
PU, the factors PEOU and BI together explain 0.541 of the PU variance.

5. Analysis and discussion of results Page 46
Figure 28. Outcome obtained after conducting the PLS algorithm.
Source: SmartPLS.
The values over the arrows represent the path coefficients. The table below lists all paths
indicating whether they are significant or not, in descendent order, i.e., the strongest effect
is listed first. Only values greater than .10 are significant. All paths are significant, except
for ACC PU. Then, hypothesis H12 is rejected.
Table 7. Path coefficients between the factors and their significance.
Path Path coefficient Significance
PU BI 0.437 Significative
PEOU BI 0.240 Significative
PI BI 0.216 Significative
ACC BI 0.183 Significative
PR BI 0.127 Significative
PEOU PU 0.635 Significative
PI PU 0.218 Significative
PR PU 0.103 Significative
ACC PU 0.032 Non-significative
PI PEOU 0.214 Significative
Source: Own representation, values from SmartPLS.
Regarding the outer model, the algorithm converged after seven iterations, indicating the
adequacy of the estimation.

5. Analysis and discussion of results Page 47
After this first assessment, the reliability and validity of the variables were checked.
Several tests were used for this purpose, and the results are presented in Table 8.
Table 8. Values to assess the different reliability and validity tests.
Variable Indicators Loadings
Indicator
reliability
(Loadings2)
Composite
reliability AVE
ACC
ACC1 0.939 0.882
0.922 0.799 ACC2 0.925 0.856
ACC3 0.813 0.661
BI
BI1 0.914 0.835
0.946 0.815 BI2 0.913 0.834
BI3 0.920 0.846
BI4 0.863 0.745
PEOU
PEOU1 0.852 0.726
0.912 0.723 PEOU2 0.865 0.748
PEOU3 0.815 0.664
PEOU4 0.868 0.753
PI
PI1 0.904 0.817
0.873 0.698 PI2 0.787 0.619
PI4 0.810 0.656
PR
PR1 0.918 0.843
0.539 0.373 PR2 0.040 0.002
PR3 0.525 0.276
PU
PU1 0.790 0.624
0.930 0.688
PU2 0.806 0.650
PU3 0.810 0.656
PU4 0.848 0.719
PENJ1 0.866 0.750
PENJ2 0.854 0.729
Source: Own representation, values from SmartPLS.
The indicator's reliability was evaluated by looking at the square of the indicator's
loadings. The value should be higher than .70. That is fulfilled in all cases except PR2
and PR3. The internal consistency of the variables was measured through the composite
reliability. PR does not meet this condition, being its value below .70. The condition of
convergent validity is neither fulfilled by PR which value is lower than 0.50.
Finally, the discriminant validity was evaluated comparing the square root of the AVEs
with the correlation values between variables (diagonal off-elements from Table 9). The
square root of the AVE value for each variable must be higher than all correlation values
with other variables. For example, the square root of PI’s AVE is .914, which is higher

5. Analysis and discussion of results Page 48
than the values in the PI column and row of Table 9. Then, PI fulfills the discriminant
validity condition. All variables meet the discriminant validity condition.
Table 9. Correlation values between variables.
ACC BI PEOU PI PR PU
ACC 0.894
BI 0.302 0.903
PEOU 0.160 0.629 0.850
PI 0.023 0.432 0.214 0.835
PR 0.089 0.238 0.074 0.031 0.611
PU 0.147 0.728 0.695 0.358 0.160 0.829
Source: Own representation, values from SmartPLS.
Table 10. AVEs of the factors and their square root.
Variable AVE Square
root AVE
ACC 0.799 0.945
BI 0.815 0.950
PEOU 0.723 0.922
PI 0.698 0.914
PR 0.373 0.781
PU 0.688 0.912
Source: Own representation, values from SmartPLS.
To conclude the evaluation of reliability and validity, all variables passed all tests except
for PR, which presented issues in factor reliability, internal consistency, and convergent
validity. Furthermore, in Table 7 was already shown that PR had weak effects on PU and
BI. Therefore, it is presumed that its relationship with BI and PU is not significant.
In order to statistically assess whether the paths between variables are significant, t-
statistics were calculated using the Bootstrapping technique, which result is presented in
Figure 29.
The output provided by SmartPLS clearly shows that the paths ACCPU, PRBI, and
PRBI are not significant because their t-values are below 1.96. This last assessment
confirms that PR is not significant in this model, rejecting hypotheses H9 and H10, and
removing the factor PR from the model. The other path (ACCPU), was already
discarded in the first assessment.

5. Analysis and discussion of results Page 49
Figure 29. Results from the Bootstrapping algorithm.
Source: SmartPLS.
The final model, which has five factors, is represented in Figure 30. The factor PU has
the greatest effect on BI with a path coefficient β1=.474, followed by PEOU β2=.222. On
the other hand, PR and ACC have similar effects. PU is highly influenced by PEOU
β3=.645, and to a smaller extent by PI, β4=.211. Finally, PEOU is influenced by PI as
well.
Figure 30. Result from the final model after conducting the PLS algorithm.
Source: SmartPLS.
A R2 value of .627 was obtained for the BI factor, meaning that the other four factors of
the model are able to explain more than 60% of the variance of the predictor of study.
The value obtained is fairly acceptable, confirming the predictive relevance of the model.

5. Analysis and discussion of results Page 50
Table 11. R2 values for the factors BI, PEOU, and PU.
Factor R2 R2 Adjusted
BI 0.627 0.611
PEOU 0.056 0.046
PU 0.525 0.515
Source: Own representation, values from SmartPLS.
Finally, a Multigroup analysis was performed to evaluate the moderating effect of certain
socio-demographic elements. The results obtained show that neither the gender nor the
expertise with VR headsets affects the model. However, age affects the influence of PI
on PEOU, having a stronger effect in the case of young respondents. Unfortunately, the
effect of VR headset ownership and VR headset prior usage could not be evaluated due
to the low proportion of respondents that own a VR headset or had used it before. Then,
H13 could only be partially evaluated.

6. Market study Page 51
6. Market study
This chapter describes the methodology employed to conduct the market study and
presents the study sample. It must be noted that only a part of the market study is included
in the thesis.
6.1 Methodology
In cooperation with a German automotive manufacturer, a market study was conducted
to analyze the beliefs and opinions of car customers about providing VR headsets for
backseat passengers in their cars. Moreover, passengers were also asked about VR content
aspects. A part of this study is used to support the findings on respondents' beliefs
obtained through QUEST1.
A quantitative questionnaire (QUEST2) was employed to collect the data, using the
purposive technique. Purposive sampling is a non-probability technique where the
participants are deliberately chosen due to their characteristics (Etikan, 2016). Since the
market study is intended to describe the customer’s expectations and preferences about
the utilization of VR headsets inside the car, it was interesting to inquire about a
population with high technology affinity and VR headset ownership. Consequently, USA
citizens were used as sample units. USA was chosen due to its high rate of technology
early adoption and its higher VR market penetration (Kennedy and Funk, 2016).
An agency mediated and distributed the questionnaire, and returned the data. It was
expected that between 10 and 20% of the sample would be VR headset owners. In that
way, the influence of VR involvement could be analyzed.
The questionnaire contains mixed type questions. There are screening questions, close
single response, close multiple responses, open response, Likert scale, and contingency
questions. This strategy was chosen to obtain the best quality of responses.
The analysis of the data obtained entails simple statistical techniques, such as descriptive
statistics and frequencies, and cross-tabulations.
6.2 Description of the sample
The questionnaire was conducted during the period comprised between the 23rd of August
and the 2nd of September 2019. The respondents completed 200 valid questionnaires,
resulting in a sample size of n=200.

6. Market study Page 52
The proportion of men and women is highly balanced. The sample is composed of 54%
women, 45% men, and 2% neutral. Regarding the age range distribution, most
respondents are between 30 and 39 years old (34%). However, the largest proportion is
formed by participants from 40 to 69 years old (50%).
Regarding car use, 96% of respondents are primary drivers, and 4% usually drive as
passengers. The major purpose for which they use the car is private use, followed by
commuting to work, holiday, and business travel.
Concerning the involvement of participants with virtual reality, 43% have at least one VR
headset at home, resulting in a higher proportion than expected. The brand that most
participants have is PlayStation VR (35%), followed by Samsung Gear VR (34%), Oculus
Rift (32%), and Oculus Go (17%). Respondents that own a VR headset make an often use
of it, either daily (33%) or several times per week (48%). Sessions last between 15 and
60 min (79%) and, in general, VR headset owners are really satisfied with the VR headset
and VR experiences.
In regard with the content visualized by VR headset owners, the principal use case is 3D
gaming (71%), followed by 3D fast-moving experiences such as rollercoasters (45%), 3D
virtually traveling the world (43%), and TV/video streaming (42%).
With regard to the participants that do not own a VR headset, 44% of them have tried
virtual reality, rating the experience as satisfying in most cases (55%).
All graphics are included in the appendix section F.

7. Insights into user acceptance Page 53
7. Insights into user acceptance
This chapter presents the items’ ratings by the respondents of QUEST1 and the findings
obtained in the market study (QUEST2).
8.1 Findings from QUEST1
Although the questionnaire was intended to validate the research model, the beliefs of the
participants about the topic are interesting too. The ratings for the different factors are
discussed. The graphics with the distribution of responses are collected in the appendix
section C.
Regarding PU, participants did not perceive using VR headsets in the car as a useful
entertainment solution. The items PU1, PU3, and PU4 presented similarities in the
answers. Most of the participants (30-40%) neither agreed or disagreed with the four
statements proposed and the highest proportion disagreed (30-55%). However, in PU2,
40% of participants agreed with the statement. Nevertheless, the general trend is to think
that it is not useful, or participants do not have a formed opinion about it.
Concerning PEOU, the general trend is that participants perceived using VR headsets in
the car easy to use (40-60%). However, a high proportion does not have a proper opinion
about it (35%).
With regard to the behavioral intention to use VR headsets in the car, most participants
are not interested in using them in the car, with a high proportion of disagreeing answers
(40-60%).
Although PENJ was merged with PU in the model, its ratings are also given. The trend is
clearly to consider the use of VR headsets in the car as enjoyable (55-65% ).
With respect to PI, the items PI1, PI3, and PI4 presented similarities in the responses, in
which most participants considered themselves innovation affine (65-80%). The
responses from PI2 are more equally distributed between all the cental options.
The variable PR is not included because it was removed from the model and its ratings
do not contribute anything significant.
Finally, ACC had mostly a greater proportion of disagreeing answers (65%). That means
participants think that the use of VR headsets in the car is not accessible to everyone or
has difficult access.

7. Insights into user acceptance Page 54
On the other hand, it is also interesting to assess whether the answers are influenced by
the fact that the participant owns a VR headset or already had experience with VR
headsets. However, since the proportion of the respondents that meet these conditions is
really low, nothing significant could be deduced.
In conclusion, the participants of the QUEST1 believe that the use of VR headsets in the
car is not useful and accessible to everyone, but it is easy to use and enjoyable. The trend
indicates that user acceptance, in that case, is rather low.
8.2 Findings from QUEST2
In this study, the proportion of respondents that have a VR headset at home, or had already
tried VR headsets, is significantly higher than in QUEST1. That enabled performing
cross-tabulations to analyze the relation between VR involvement and predisposition to
use VR headsets inside the car.
Regarding the willingness to have VR at home, 58% of respondents that do not own a VR
headset would consider buying one. It is interesting to note that the principal reason why
participants are not interested in buying VR headsets is that they do not see their utility
or benefits. That is consistent with the findings obtained in QUEST1 for the factor PU.
The second main reason is that the use of their own smartphones or tablets is enough,
followed by the high price of VR headsets. In relation to that, if VR headsets were less
expensive, respondents would probably buy one, which also relates to the findings of
QUEST1 for the factor ACC.
These results are more positive about the use of VR headsets in general, which results in
a greater interest in using them as a backseat passenger in the car. Findings showed that
50% of car owners would be interested in providing a VR headset in the car, and 75% of
the passengers would like to have a VR headset available in the backseat of the car.
Regarding the virtual content in the car scenario, passengers would like to watch 360°
view movies as principal use case, followed by music streaming and 2D video streaming
such as Netflix. Gaming comes in third place. That is interesting because a low proportion
of passengers currently stream video while driving in the car (10%), and the main use
case for VR, in general, is gaming.
Findings from cross-tabulations showed that VR headset owners are more positive about
the use of this technology inside the car. That also applies to respondents that have tried
VR before. Frequent use of VR and long sessions also have a positive effect on
respondents' opinions.

7. Insights into user acceptance Page 55
To sum up, the acceptance of individuals about using VR headsets while riding as a
backseat passenger in the car is highly related to the previous experience with VR. These
individuals are more positive because they are capable to perceive the usefulness of this
solution.
The contrast between the trends in the answers between the two questionnaires is
significant. Respondents from QUEST1 belong to a European population in which the
penetration of VR in the market is lower. That translates into a higher skepticism about
the utility of using VR HMDs in the car. Although there are people that would adopt it,
the general trend is negative. On the contrary, respondents from the American population
show traits of early-adoption, being more willing to adopt this solution.

8. Conclusion Page 56
8. Conclusion
8.1 Model to predict user acceptance
The aim of this thesis was to develop a model to evaluate the backseat passenger’s
acceptance of using VR HMDs while riding in the car for entertainment and productivity
purposes. For that purpose, the focus of the thesis was to respond to the following research
question: What are the factors that predict the user´s decision to adopt VR HMDs while
being backseat passenger inside the car?
From the thirteen hypotheses originally stated, five have been rejected, corresponding to
the hypotheses associated with the variables PENJ and PR, and one from the variable
ACC. Moreover, the hypothesis associated with the moderating effects could only be
partially evaluated due to shortcomings in the sample.
The final model obtained has five factors and explains about 60% of the variance of the
final predictor Behavioral intention. The factors that predict the user’s decision to adopt
VR HMDs in the car are: Accessibility, Behavioral intention, Perceived ease-of-use,
Personal innovativeness, and Perceived Usefulness.
In the final model, the factor Perceived usefulness is formed by the original PU and PENJ
variables. The results from the exploratory factor analysis suggested that both variables
were loaded into the same factor. This outcome, though unexpected, could be related to
the fact that the main purpose of using VR HMDs inside the car is entertainment.
Therefore, if the system is perceived as enjoyable, it is useful because it achieves its
objective. However, that could also be the consequence of choosing an inappropriate
measurement scale for PENJ.
As the results showed, the principal factor that influences BI is PU with a path coefficient
of β1=.474, followed by PEOU β2=.222. The path between PEOU on PU has the highest
path coefficient β3= .645. These results are consistent with Davis's work (1985) and assess
the basic structure of the model.
Regarding the new factors added for this study scenario, both ACC and PI present similar
path coefficients. ACC has a positive effect on BI (β5=.193), confirming the findings of
Disztinger et al. (2017). With respect to PI, the effect is also significant (β6=.197) in
alignment with the work of Yusoff et al. (2011). It was also interesting to assess that PI
affects, not only BI but also PU and PEOU as it was presumed. Therefore, PI also acts as
an antecedent to PU and PEOU.

8. Conclusion Page 57
Concerning the moderating effects of the socio-demographic elements, it was assessed
that neither the gender nor the expertise in using VR headsets had a significant effect on
the model. On the other hand, the age element was found to affect the path between PI
and PEOU, meaning that the effect is different depending on the age of the user. Finally,
the effects of the remaining elements, i.e. VR ownership and prior VR headset usage,
could not be evaluated due to the low proportion of respondents that met the
correspondent conditions.
8.2 Insights into user acceptance
As an additional contribution, respondents' beliefs were given on the use of VR HMDs in
the car. Some differences are appreciated in the findings obtained through both
questionnaires, which represent a European sample (QUEST1) and an American one
(QUEST2).
Regarding the findings from QUEST1, the major part of respondents does not perceive
the use of VR headsets inside the car as a useful solution for entertainment and
productivity. That could be related to the fact that the market penetration of VR in Europe
is still low. It is a technology perceived as difficult to access and people still feel skeptical
about its benefits and utilities. Moreover, the proportion of respondents that own a VR
headset in QUEST1 is too low, so the effects of virtual reality's previous usage on the
answers could not be analyzed to obtain a representative outcome.
On the contrary, findings from QUEST2 were more positive about the use of VR headsets
inside the car. In that case, respondents feel more positive about using VR headsets in the
car or providing the passengers with VR headsets, which leads to higher user acceptance.
In addition, the proportion of respondents that have a VR headset at home is significantly
higher than in the first questionnaire. That also applies to the number of respondents that
have already tried virtual reality. The results from the cross-tabulations showed that the
willingness to try this new solution is strongly related to the previous usage of virtual
reality.
Concerning the use cases preferred by car passengers, the ratings showed that watching
360° view movies was the favorite. Then, 3D video streaming and music streaming had
the same ratings, followed by gaming. These are the four principal use cases in which the
customers would be interested to visualize when using a VR headset in the car.

8. Conclusion Page 58
8.3 Limitations of the work
Regarding model limitations, several aspects are remarked. First, the sample size of
QUEST1 could be bigger in order to obtain more reliable and representative results. In
addition, for the EFA, greater sample sizes are desired. Furthermore, the moderating
effects of prior VR headset usage and VR headset ownership could not be analyzed in
QUEST1 due to the low proportion of respondents that met the conditions.
On the other hand, the measurement scale of PENJ was probably inappropriate because
high correlation values between items were found, causing the removal from two items.
Moreover, it could also be the cause of PENJ merging with PU into the same factor.
Nevertheless, the greatest limitation of the work is that it was not possible to bring the
questionnaires to individuals that have tried the VR headset in the study scenario, i.e.
while riding as a backseat passenger in the car. It is essential to consider this in order to
take into account other factors that could arise while using the VR headset in the car.
Additionally, it has been seen that prior experience with virtual reality has a key role in
the acceptance of this application. Therefore, answers may be different in case the
respondents have tried VR HMDs in the car before.
8.5 Future lines of research
Future research on this topic includes the improvement of the proposed model. On the
one hand, the measurement scale for the initial variable PENJ has to be modified in order
to evaluate if the variable still loads into the same factor as PU, meaning that it is
perceived as the same idea by respondents. On the other hand, prior VR usage could be
included as a new variable, instead of a moderating element, since it was seen as highly
related to the willingness to make use of this innovative solution.
Another research aspect is to conduct quantitative surveys or qualitative interviews with
individuals that have tried VR headsets in the car in order to substantiate the validity of
the model. Moreover, new factors could arise, such as issues with motion sickness.
Concerning the use cases, deeper questions should be asked in order to asses concretely
what the customers expect from this solution and what type of content for each use case
they would like to have available.
Finally, another research line is concerned with the design of business cases and strategies
for the commercialization of this application, based on user acceptance.

9. Bibliography Page 59
9. Bibliography
Abari, O.; Bharadia, D.; Duffield, A.; Katabi, D. (2017): Enabling High-Quality
Untethered Virtual Reality in: 14th USENIX Symposium on Networked Systems
Design and Implementation, USENIX, 531-544.
Agarwal, R.; Prasad, J. (1998): A Conceptual and Operational Definition of Personal
Innovativeness in the Domain of Information Technology, Information Systems
Research, 9(2), 204–215.
Ahn, J.; Choi, S.; Lee, M.; Kim, K. (2017): Investigating Key User Experience Factors
for Virtual Reality Interactions, Journal of the Ergonomics Society of Korea, 36(4),
267-280.
Bagozzi, R. (2007): The Legacy of the Technology Acceptance Model and a Proposal
for a Paradigm Shift, Journal of the association of information systems, 8(4), 244-
254.
Bagozzi, R.; Yi, Y. (1988): On the evaluation of structural equation models, Journal of
the Academy of Marketing Science, 16(1), 74–94.
Bertrand, M.; Bouchard, S. (2008): Applying the technology acceptance model to VR
with people who are Favorable to its use, Journal of Cybertherapy & Rehabilitation,
1(2), 200-210.
Billinghurst, M.; Kato, H. (1999): Collaborative Mixed Reality in: First International
Symposium on Mixed Reality, Seattle, WA, USA, Springer, 261-284.
Borsci, S.; Lawson, G.; Broome, S. (2015): Empirical evidence, evaluation criteria and
challenges for the effectiveness of virtual and mixed reality tools for training
operators of car service maintenance, Computers in Industry, 67, 17-26.
Bose, R.; Brakensiek, J.; Park, K-Y. (2010): Terminal Mode-Transforming Mobile
Devices into Automotive Application Platforms in: 2nd International Conference on
Automotive User Interfaces and Interactive Vehicular Applications, November 11-
12, 2010, Pittsburgh, Pennsylvania, USA, ACM.
Bowmann, D.; McMahan, R. (2007): Virtual Reality: How much immersion is enough?
IEEE Computer Society, 40(7), 36–43.
Burdea, G.; Coiffet, P. (2003): Virtual reality technology, 2nd edition, New York, NY,
USA, Wiley, 2.
Burns, M. (2019): I used VR in a car going 90 mph and didn’t get sick, TechCrunch,
https://techcrunch.com/2019/01/07/i-used-vr-in-a-car-going-90mph-and-didnt-get-
sick/?renderMode=ie11, Accessed 22.08.2019.
Craig, A.; Sherman, W; Will, J. (2009): Developing Virtual Reality Applications:
Foundations of effective design, Burlington, MA, USA, Morgan Kaufmann
Publishers, 10-39.
Cummings, J.; Bailenson, J. (2016): How Immersive Is Enough? A Meta-Analysis of
the Effect of Immersive Technology on User Presence, Media Psychology, 19(2),
272–309.

9. Bibliography Page 60
Davis, F. (1985): A technology acceptance model for empirically testing new end-user
information systems, Massachusetts, USA, MIT, 7-26.
Davis, F.; Bagozzi, R.; Warshaw, P. (1992): Extrinsic and intrinsic motivation to use
computers in the workplace, Journal of Applied Social Psychology, 22(14), 1111–
1132.
Diewald, S.; Möller, A.; Roalter, L.; Kranz, M. (2011): Mobile Device Integration and
Interaction in the Automotive Domain, AutomotiveUI’11.
Disztinger, P.; Schlögl, S.; Groth, A. (2017): Technology Acceptance of Virtual Reality
for Travel Planning, Information and Communication Technologies in Tourism
2017, 255-268.
Earnshaw, R.; Gigante, M.; Jones, H. (1993): Virtual reality systems, London, UK,
Academic Press Limited, 46-47.
Etikan, I. (2016): Comparison of Convenience Sampling and Purposive Sampling,
American Journal of Theoretical and Applied Statistics, 5(1), 1.
Feiner, S.; Fernandes, A. (2016): Combating VR Sickness through Subtle Dynamic
Field-Of-View Modification in: 2016 IEEE Symposium on 3D User Interfaces,
March 2016, Greenville, South Carolina, USA, IEEE, 19-20.
Fornell, C.; Larcker, D. (1981): Evaluating structural equation models with
unobservable variables and measurement error, Journal of Marketing Research, 18
(1), 39-50.
Fishbein, M.; Ajzen, I. (1975): Belief, Attitude, Intention and Behaviour: An
Introduction to Theory and Research, Boston, USA, Inc. Addison-Wesley
Publishing Co, 216-302.
Fuchs, P. (2017): Virtual reality headsets. London, UK, CRC Press/Balkema, 57-163.
Gardner, B.; Abraham, C. (2007): What drives car use? A grounded theory analysis of
commuters’ reasons for driving, Transportation Research Part F: Traffic
Psychology and Behaviour, 10(3), 187–200.
Goldberg, L.; Velicer, W. (2006): Principles of exploratory factor analysis, In Strack, S.
(Ed.): Differentiating normal and abnormal personality: Second edition, New York,
NY, Springer, 209-237.
Gorsuch, R. (1983): Factor analysis, 2nd edition, Hillsdale, NJ, Lawrence Erlbaum,
129.
Gutierrez Alonso, M.; Vexo, F.; Thalmann, D. (2008): Stepping into virtual reality.
London, UK, Springer, 2-3.
Holsapple, C.; Wu, J. (2007): User acceptance of virtual worlds, ACM SIGMIS
Database, 38(4), 86.
Hou, X.; Lu, Y.; Dey, S. (2017): Wireless VR/AR with Edge/Cloud Computing in: 2017
26th International Conference on Computer Communications and Networks
(ICCCN), July 31-August, 2017, Vancouver, Canada, IEEE.

9. Bibliography Page 61
Hox, J.; Boeije, H. (2005): Data Collection, Primary vs. Secondary, Encyclopedia of
Social Measurement, 1, 593-599.
Hoyle, R. (1995): Structural Equation Modeling: concepts, issues and applications.
Thousand Oaks, CA, USA, SAGE Publications Inc.
Hulland, J. (1999): Use of partial least squares (PLS) in strategic management research:
a review of four recent studies, Strategic Management Journal, 20(2), 195–204.
Jerald, J. (2015). The VR Book: Human-Centered Design for Virtual Reality, New York,
NY, USA, Association for Computing Machinery and Morgan & Claypool, 1-177.
Kelley, K.; Clark, B.; Brown, V.; Sitzia, J. (2003): Good practice in the conduct and
reporting of survey research, International journal for quality in health care journal
of the International Society for Quality in Health Care, 15(3), 261–266.
Kennedy, B.; Funk, C. (2016): 28% of Americans are “strong” early adopters of
technology, Pew Research Center, https://www.pewresearch.org/fact-
tank/2016/07/12/28-of-americans-are-strong-early-adopters-of-technology/,
Accessed 07.05.2019.
Kim, C.; Lee, C.; Lehto, M.; Yun, M. (2011): Affective evaluation of user impressions
using virtual product prototyping, Human Factors and Ergonomics in
Manufacturing & Service Industries, 21(1), 1-13.
Knapp, M. (2018): Oculus Go vs Oculus Rift: should you switch to the standalone VR
headset?, TechRadar, https://www.techradar.com/news/oculus-go-vs-oculus-rift,
Accessed 22.08.2019.
Kothari, C.; Garg, G. (2014): Research methodology: methods and techniques, 3rd
edition, New Delhi, India, New Age International (P) Ltd, 5.
Kothgassner, O.; Felnhofer, A.; Hauk, N.; Kastenhofer, E.; Gomm, J.; Kryspin-Exner, I.
(2012): Technology Usage Inventory (TUI): Manual: Fragebogen und Manua,
Wien, Austria.
Kuchera, B. (2018): VR and self-driving cars are a fascinating, scary combo, Polygon,
https://www.polygon.com/virtual-reality/2018/1/5/16854034/ubisoft-vr-virtual-
reality-renault-autonomous-cars-driving, Accessed 22.08.2019.
Kulkarni, A.; Kapoor, A.; Iyer, M.; Kosse, V. (2011): Virtual prototyping used as
validation tool in automotive design in: Chan, F.; Marinova, D.; Anderssen, R. (eds):
19th International Congress on Modelling and Simulation. Modelling and Simulation
Society of Australia and New Zealand, Perth, Australia, 12-16 December 2011, 419-
425.
Kumar, R. (2011): Research methodology: A step-by-step guide for beginners, 3rd
edition, New Delhi, India, SAGE Publications Ltd., 10-14.
Lai, P. (2017): The literature review of technology adoption models and theories for the
novelty technology, Journal of Information Systems and Technology Management,
14(1), 21-38.

9. Bibliography Page 62
Lawson, G.; Salanitri, D.; Waterfield, B. (2015): The future of Virtual Reality in the
automotive industry in: 17th International Conference, HCI International 2015, Los
Angeles, CA, USA, September 2015.
Lee, W.; Cheung, C.; Li, J. (2001): Applications of virtual manufacturing in materials
processing, Journal of Materials Processing Technology, 113(1-3), 416-423.
Lee, Y.; Kozar, K.; Larsen, K. (2003): The Technology Acceptance Model: Past,
Present, and Future, Communications of the Association for Information Systems,
12(1), 752-780.
Lin, J.; Duh, H.; Parker, D.; Rached, H.; Furness, T. (2002): Effects of field of view on
presence, enjoyment, memory, and simulator sickness in a virtual environment in:
IEEE Virtual Reality 2002, March 24-28, 2002, Orlando, Florida, USA, IEEE
Computer Society, 164–171.
Martindale, J. (2018): The Oculus Quest and Go both let you play without a PC, but
which is better?, Digital Trends, https://www.digitaltrends.com/virtual-
reality/oculus-quest-vs-oculus-go/, Accessed 22.08.2019.
McGill, M.; Ng, A.; Brewster, S. (2017): I Am The Passenger: How Visual Motion
Cues Can Influence Sickness For In-Car VR in: Mark, G.; Fussell, S.; Lampe, C.;
Schraefel, M.; Hourcade, J.; Appert, C.; (eds): 2017 Conference on Human Factors
in Computing Systems, New York, NY, USA, ACM Press, 5655–5668.
Mihelj, M.; Novak, D.; Begus, S. (2014): Virtual reality technology and applications,
Dordrecht, Netherlands, Springer, 9-10.
Mousavi, M.; Aziz, F.; Ismail, N. (2012): Opportunities and Constraints of Virtual
Reality Application in International and Domestic Car Companies of Malaysia in:
14th International Conference on Computer Modelling and Simulation, 273-277.
Rodriguez Garzón, S. (2012): Intelligent In-Car-Infotainment Systems: A Contextual
Personalized Approach in: 2012 Eighth International Conference on Intelligent
Environments, IEEE, 315–318.
Seay, A.; Krum, D.; Hodges, L.; Ribarsky, W. (2001): Simulator sickness and presence
in a high FOV virtual environment in: Proceedings IEEE Virtual Reality 2001,
March 13-17, Yokohama, Japan, IEEE Computer Society, 299–300.
Sherman, W.; Craig, A. (2019): Understanding virtual reality: interface, application
and design, 2nd edition, Cambridge, MA, USA, Morgan Kaufmann Publishers Inc.,
6-16.
Shi, C.; Lee, H.; Kurczak, J.; Lee, A. (2012): Routine Driving Infotainment App:
Gamification of Performance Driving in: 4th International Conference on
Automotive User Interfaces and Interactive Vehicular Applications, October 17-19,
2012, Portsmouth, NH, USA.
Shukla, C.; Vazquez, M.; Frank Chen, F. (1996): Virtual manufacturing: An
overview, Computers & Industrial Engineering, 31(1-2), 79-82.
Stein, S. (2017): Gear VR: A ticket to virtual reality with a smartphone, CNET,
http://www.cnet.com/products/samsung-gear-vr/, Accessed 22.08.2019.

9. Bibliography Page 63
Stone, R. (2001): Virtual reality for interactive training: an industrial practitioner's
viewpoint, International Journal of Human-Computer Studies, 55(4), 699-711.
Stone, R.; Grønhaug, K. (1993): Perceived Risk: Further Considerations for the
Marketing Discipline, European Journal of Marketing, 27(3), 39-50.
Surendran, P. (2012): Technology Acceptance Model: A Survey of Literature,
International Journal of Business and Social Research (IJBSR), 2(4), 175-178.
Tang, D.; Chen, L. (2011): A review of the evolution of research on information
Technology Acceptance Model in: 011 International Conference on Business
Management and Electronic Information, Guangzhou, 2011, 588-591.
Tavakol, M.; Dennick, R. (2011): Making sense of Cronbach's alpha. International
Journal of Medical Education, 2, 53-55.
Van der Heijden, H. (2004): User Acceptance of Hedonic Information Systems, MIS
Quarterly, 28(4), 695-704.
Venkatesh, V.; Brown, S.; Maruping, L.; Bala, H. (2008): Predicting Different
Conceptualizations of System Use: The Competing Roles of Behavioral Intention,
Facilitating Conditions, and Behavioral Expectation, MIS Quarterly, 32(3), 483-502.
Venkatesh, V.; Morris, M.; Davis, G.; Davis, F. (2003): User Acceptance of
Information Technology: Toward a Unified View, MIS Quarterly, 27(3), 425-478.
Wilfinger, D.; Meschtscherjakov, A.; Murer, M. (2011): Are We There Yet? A Probing
Study to Inform Design for the Rear Seat of Family Cars in: Campos, P.; Graham,
N.; Jorge, J.; Nunes, N.; Palanque, P.; Winckler, M. (eds): Human-Computer
Interaction–INTERACT 2011, Springer, 657-674.
Williams, B.; Onsman, A.; Brown, T. (2010): Exploratory factor analysis: A five-step
guide for novices, Australasian Journal of Paramedicine, 8(3), 1-13.
Wollschläger, D.; Foden, M.; Cave, R.; Stent, M. (2015): Digital disruption and the
future of the automotive industry: Mapping new routes for customer-centric
connected journeys, IBM Center for Applied Insights.
Wong, K. (2013): Partial Least Squares Structural Equation Modeling (PLS-SEM)
Techniques Using SmartPLS, The Marketing Bulletin, 24(1), 1-32.
Wong, K. (2016): TECHNICAL NOTE: Mediation analysis, categorical moderation
analysis, and higher-order constructs modeling in Partial Least Squares Structural
Equation Modeling (PLS-SEM), The Marketing Bulletin, 26, 1-22.
Yang, H.; Yu, J.; Zo, H.; Choi, M. (2016): User acceptance of wearable devices: An
extended perspective of perceived value, Telematics and Informatics, 33, 256–269.
Yong, A.; Pearce, S. (2013): A Beginner’s Guide to Factor Analysis: Focusing on
Exploratory Factor Analysis, Tutorials in Quantitative Methods for Psychology,
9(2), 79-94.
Yusoff, R.; Zaman, H.; Ahmad, A. (2011): Evaluation of user acceptance of mixed
reality technology, Australasian Journal of Educational Technology, 27(8).

Appendix Page 64
Appendix
A Measurement scales
In the first section of the appendix, the measurement scales employed to measure the
variables of the model are presented.
Table 12. Description of the measurement scales of every variable in the model.
Variable Item Description Sources
PU PU1 I believe using a VR headset while being
rear seat passenger inside the car would
help me to be more productive.
Davis (1985)
PU2 I believe using a VR headset inside the car
would help me to be more effective in
entertaining myself.
PU3 I believe using a VR headset inside the car
would be useful in my life.
PU4 I believe using a VR headset inside the car
would improve my life.
PEOU PEOU1 I believe it would be easy for me to use a
VR headset inside the car.
Davis (1985)
PEOU2 I believe it would be easy to perform any
desired activity with a VR headset inside
the car.
PEOU3 I believe the utilization of a VR headset
inside the car would be clear and
understandable.
PEOU4 It would be easy for me to become skillful
at using VR headsets inside the car.
BI BI1 There is a high likelihood that I will use a
VR headset inside the car within the
foreseeable future.
Venkatesh et
al. (2008)
BI2 I intend to use a VR headset inside the car
within the foreseeable future.
BI3 I will use a VR headset inside the car within
the foreseeable future.
BI4 Using a VR headset inside the car in the
foreseeable future is important to me.
PENJ PENJ1 I believe I would find enjoyable to use a VR
headset inside the car.
Davis et al.
(1992)
PENJ2 I believe I would have fun using a VR
headset inside the car.
PENJ3 I believe using a VR headset inside the car
would be exciting.
PENJ4 I believe using a VR headset inside the car
would be enjoyable.
PI PI1 If I heard about a new technology, I would
look for ways to experiment with it.
Agarwal and
Prasad (1998)
PI2 Among my peers, I am usually the first to
try out new technologies.

Appendix Page 65
PI3 In general, I am not hesitant to try out new
technologies.
PI4 I like to experiment with new technologies.
PR PR1 I think it is uncertain that VR headsets will
work satisfactorily inside the car.
Stone and
Grønhaug
(1993)
PR2 I worry about whether the use of VR
headsets inside the car will not provide the
level of benefits I expect.
PR3 I think it is uncertain that a VR headset will
perform the functions that were described
inside the car.
ACC ACC1 I think that almost everyone can afford
using a VR headset inside the car.
Disztinger et
al. (2017)
ACC2 I think that using a VR headset inside the
car is basically accessible to everyone.
ACC3 I think it is easy to acquire this technology.
Source: Own representation.
B QUEST1
Thank you for taking part in this questionnaire for my Master's thesis, which is
supervised by the technical University of Munich and carried out in cooperation with
a German automotive manufacturer.
The goal of this questionnaire is to analyze the user acceptance of the utilization of
virtual reality headsets (VR glasses) while being rear seat passenger in the car for
entertainment and productivity purposes. This study is grounded on the Technology
Acceptance Model (TAM).
Please take a look at the following pictures to have a better understanding of the
scenario.
Answer this questionnaire will take less than 10 min. This questionnaire is anonymous
and all the information will be confidential and only used as an aggregated data.
SOCIO-DEMOGRAPHICAL QUESTIONS
1. Gender
a) Female
b) Male
c) Neutral
d) Prefer not to say

Appendix Page 66
2. Age
a) Under 18
b) 18-25
c) 26-35
d) 36-45
e) 46-55
f) Above 56
3. Highest degree of education achieved
a) Less than High School
b) High School
c) College
d) Bachelor's Degree
e) Master's Degree
f) Higher than Master's Degree
g) Other
4. Job/Occupation
a) Unemployed
b) Housewife/-man
c) Student
d) Employed
e) Employed (leading/executive position)
f) Self-employed
g) Retired
h) Other
5. Monthly household net income
a) Less than 500 €
b) 500-1.000 €
c) 1.000-2.000 €
d) 2.000-3.000 €
e) 3.000-4.000 €
f) 4.000-5.000 €
g) More than 5.000 €
6. I have experience using VR headsets
a) Strongly disagree
b) Disagree
c) Neither agree nor disagree
d) Agree
e) Strongly agree.
7. I own a virtual reality headset
a) Yes
b) No
8. How often I use VR headsets? (At home, in exhibitions, etc.)
a) Never
b) 1-2 times per semester
c) 1-2 times per month
d) 1-2 times per week
e) 3+ times per week

Appendix Page 67
All the following questions refer to the study scenario: using VR headsets while being
rear seat passenger inside the car. However, to avoid stating it in every question, it is
shorten by use of VR headsets inside the car.
PERCEIVED USEFULNESS
PU1: I believe using a VR headset while being rear seat passenger inside the car
would help me to be more productive.
a) Strongly disagree
b) Disagree
c) Neither agree nor disagree
d) Agree
e) Strongly agree.
PU2: I believe using a VR headset inside the car would help me to be more
effective in entertaining myself.
a) Strongly disagree
b) Disagree
c) Neither agree nor disagree
d) Agree
e) Strongly agree.
PU3: Using a VR headset inside the car would be useful in my life.
a) Strongly disagree
b) Disagree
c) Neither agree nor disagree
d) Agree
e) Strongly agree.
PU4: I believe using a VR headset inside the car would improve my life.
a) Strongly disagree
b) Disagree
c) Neither agree nor disagree
d) Agree
e) Strongly agree.
PERCEIVED EASE OF USE
PEOU1: I believe using a VR headset inside the car would be easy for me.
1) Strongly disagree
2) Disagree
3) Neither agree nor disagree
4) Agree
5) Strongly agree.
PEOU2: I believe it would be easy to perform any desired activity with a VR
headset inside the car.
1) Strongly disagree
2) Disagree
3) Neither agree nor disagree
4) Agree
5) Strongly agree.

Appendix Page 68
PEOU3: I believe the utilization of a VR headset inside the car would be clear and
understandable.
1) Strongly disagree
2) Disagree
3) Neither agree nor disagree
4) Agree
5) Strongly agree.
PEOU3: It would be easy for me to become skillful at using VR headsets inside the
car.
1) Strongly disagree
2) Disagree
3) Neither agree nor disagree
4) Agree
5) Strongly agree.
BEHAVIORAL INTENTION
BI1: There is a high likelihood that I will use a VR headset inside the car within
the foreseeable future.
1) Strongly disagree
2) Disagree
3) Neither agree nor disagree
4) Agree
5) Strongly agree.
BI2: I intend to use a VR headset inside the car within the foreseeable future.
1) Strongly disagree
2) Disagree
3) Neither agree nor disagree
4) Agree
5) Strongly agree.
BI3: I will use a VR headset inside the car within the foreseeable future.
1) Strongly disagree
2) Disagree
3) Neither agree nor disagree
4) Agree
5) Strongly agree.
BI4: Using a VR headset inside the car in the foreseeable future is important to
me.
1) Strongly disagree
2) Disagree
3) Neither agree nor disagree
4) Agree
5) Strongly agree.
PERCEIVED ENJOYMENT
PENJ1: I believe I would find enjoyable to use a VR headset inside the car.
1) Strongly disagree
2) Disagree
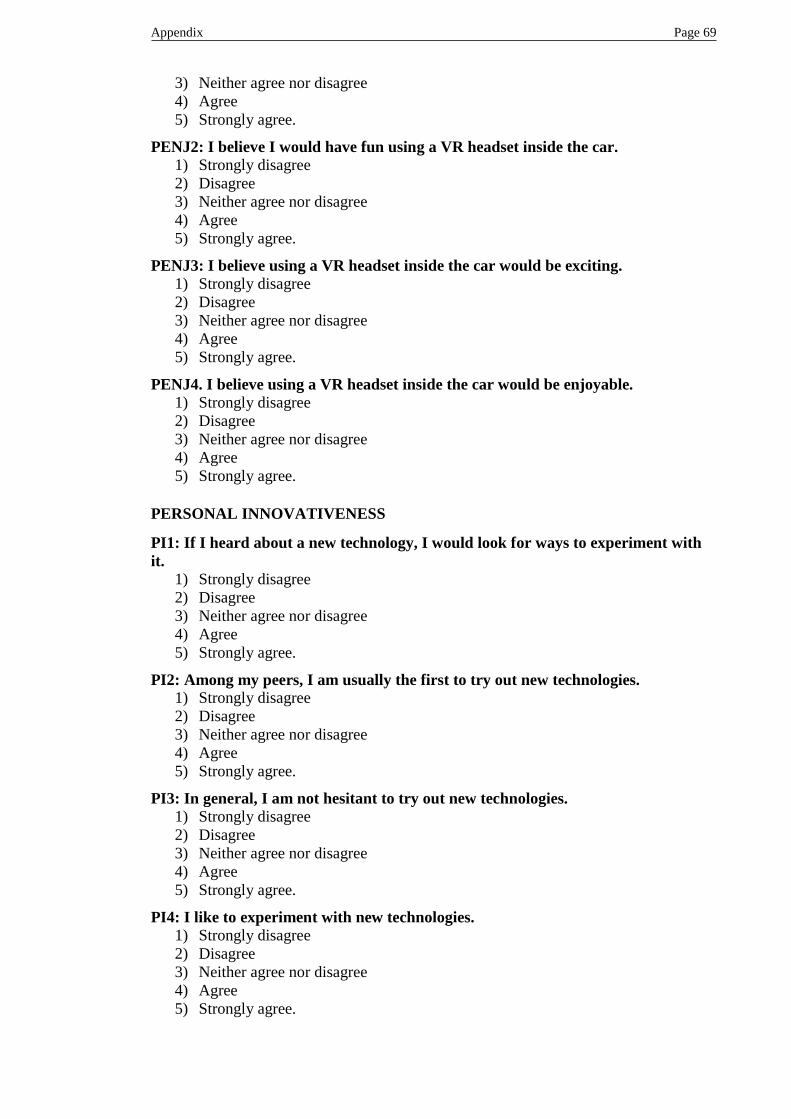
Appendix Page 69
3) Neither agree nor disagree
4) Agree
5) Strongly agree.
PENJ2: I believe I would have fun using a VR headset inside the car.
1) Strongly disagree
2) Disagree
3) Neither agree nor disagree
4) Agree
5) Strongly agree.
PENJ3: I believe using a VR headset inside the car would be exciting.
1) Strongly disagree
2) Disagree
3) Neither agree nor disagree
4) Agree
5) Strongly agree.
PENJ4. I believe using a VR headset inside the car would be enjoyable.
1) Strongly disagree
2) Disagree
3) Neither agree nor disagree
4) Agree
5) Strongly agree.
PERSONAL INNOVATIVENESS
PI1: If I heard about a new technology, I would look for ways to experiment with
it.
1) Strongly disagree
2) Disagree
3) Neither agree nor disagree
4) Agree
5) Strongly agree.
PI2: Among my peers, I am usually the first to try out new technologies.
1) Strongly disagree
2) Disagree
3) Neither agree nor disagree
4) Agree
5) Strongly agree.
PI3: In general, I am not hesitant to try out new technologies.
1) Strongly disagree
2) Disagree
3) Neither agree nor disagree
4) Agree
5) Strongly agree.
PI4: I like to experiment with new technologies.
1) Strongly disagree
2) Disagree
3) Neither agree nor disagree
4) Agree
5) Strongly agree.

Appendix Page 70
PERFORMANCE RISK
PR1: I think it is uncertain that VR headsets will work satisfactorily inside the
car.
1) Strongly disagree
2) Disagree
3) Neither agree nor disagree
4) Agree
5) Strongly agree.
PR2: I worry about whether the use of VR headsets inside the car will not provide
the level of benefits I expect.
1) Strongly disagree
2) Disagree
3) Neither agree nor disagree
4) Agree
5) Strongly agree.
PR3: I think it is uncertain that a VR headset will perform the functions that were
described inside the car.
1) Strongly disagree
2) Disagree
3) Neither agree nor disagree
4) Agree
5) Strongly agree.
ACCESSIBILITY
ACC1: I think that almost everyone can afford using a VR headset inside the car.
1) Strongly disagree
2) Disagree
3) Neither agree nor disagree
4) Agree
5) Strongly agree.
ACC2: I think that using a VR headset inside the car is basically accessible to
everyone.
1) Strongly disagree
2) Disagree
3) Neither agree nor disagree
4) Agree
5) Strongly agree.
ACC3: I think it is easy to acquire this technology.
1) Strongly disagree
2) Disagree
3) Neither agree nor disagree
4) Agree
5) Strongly agree.
Thanks for your attention!

Appendix Page 71
C Results from QUEST1
In the following, the data obtained with the QUEST1 is exposed.
Figure 31. Distribution of gender and VR headset ownership within the sample of
QUEST1.
Source: Own representation.
Figure 32. Distribution of answers for PU items.
Source: Own representation.

Appendix Page 72
Figure 33. Distribution of answers for PEOU items.
Source: Own representation.
Figure 34. Distribution of answers for BI items.
Source: Own representation.

Appendix Page 73
Figure 35. Distribution of answers for PENJ items.
Source: Own representation.
Figure 36. Distribution of answers for PI items.
Source: Own representation.

Appendix Page 74
Figure 37. Distribution of answers for PR items.
Source: Own representation.
Figure 38. Distribution of answers for ACC items.
Source: Own representation.

Appendix Page 75
D Exploratory factor analysis
In this section, multiple figures are included representing the results from the EFA.
Figure 39. Correlation matrix from the first assessment.
Figure 40. KMO and Bartlett’s test from the first assessment.
Source: SPSS.
Source: SPSS.

Appendix Page 76
Figure 41. Table of communalities from the first assessment.
Source: SPSS.
The following figures relate to the results obtained after removing the items PENJ2 and
PENJ4.
Figure 42. Correlation values of PENJ items after removing PENJ2 and PENJ4.
Source: SPSS.

Appendix Page 77
Figure 43. Table of total variance explained applying the Oblimin rotation technique.
Source: SPSS.
Figure 44. Pattern matrix from the solution with five factors.
Source: SPSS.

Appendix Page 78
Figure 45. KMO and Bartlett’s test from the final assessment.
Source: SPSS.
Figure 46. Table of communalities from the final assessment.
Source: SPSS.
Figure 47. Component matrix (left) and Structure matrix (right) from the final
assessment.
Source: SPSS.

Appendix Page 79
E SmartPLS analysis
In section E of the appendix, some figures from the analysis with SmartPLS are included.
Figure 48. Results from the Multigroup analysis of the moderating effect Age.
Source: SmartPLS.

Appendix Page 80
Figure 49. Results from the Multigroup analysis of the moderating element Experience
in using VR headsets (Expertise).
Source: SmartPLS.
Figure 50. Results from the Multigroup analysis od the moderating element Gender.
Source: SmartPLS.
F Market study
This section is dedicated to the graphics from the QUEST2. It must be noted that the
questionnaire and other data could not be included due to confidentiality matters.
Figure 51. Gender and age from the respondents of QUEST2.
Source: Own representation.

Appendix Page 81
Figure 52. Distribution of primary drivers, car owners, and passengers.
Source: Own representation.
Figure 53. VR headset ownership.
Source: Own representation.
Figure 54. VR headset brands owned by respondents.
Source: Own representation.

Appendix Page 82
Figure 55. Use frequency of VR headsets and average session duration.
Source: Own representation.
Figure 56. Most popular use cases for VR headset owners.
Source: Own representation.
Figure 57. Satisfaction ratings from VR headset owners with the VR headset and the VR
experiences.
Source: Own representation.

Appendix Page 83
Figure 58. Proportion of respondents that do not own a VR headset but have tried one.
Source: Own representation.
Figure 59. Satisfaction ratings from the respondents that have tried VR but do not own a
VR headset.
Source: Own representation.
Figure 60. Proportion of respondents that do not own a VR headset but would buy one.
Source: Own representation.

Appendix Page 84
Figure 61. Activities that respondents currently do when riding as passengers in the car.
Source: Own representation.
Figure 62. Use cases preferred by passengers in case a VR headset was available in the
car.
Source: Own representation.
Figure 63. Proportion of car owners that would provide VR headset for their passengers.
Source: Own representation.

Declaration of Authorship
I hereby declare that the thesis submitted is my own unaided work. All direct or indirect
sources used are acknowledged as references.
I am aware that the thesis in digital form can be examined for the use of unauthorized aid
and in order to determine whether the thesis as a whole or parts incorporated in it may be
deemed as plagiarism. For the comparison of my work with existing sources, I agree that
it shall be entered in a database where it shall also remain after examination, to enable
comparison with future theses submitted. Further rights of reproduction and usage,
however, are not granted here.
This paper was not previously presented to another examination board and has not been
published.