Embed Size (px)
Citation preview
1
Vegetation-wave interactions in salt marshes under storm surge 1
conditions 2
3
Rupprecht F1*, Möller I2,3, Paul M4,8, Kudella M4, Spencer T2, van Wesenbeeck BK5,6, Wolters G5, Jensen 4
K1, Bouma TJ7, Miranda-Lange M4 & Schimmels S4. 5
6
1 Applied Plant Ecology, Biocenter Klein Flottbek, University of Hamburg, Ohnhorststr. 18, 22609 7
Hamburg, Germany 8
2 Cambridge Coastal Research Unit, Department of Geography, University of Cambridge, Downing 9
Place, Cambridge CB2 3EN, UK 10
3 Fitzwilliam College, Storey’s Way, Cambridge CB3 0DG, UK 11
4 Forschungszentrum Küste (FZK), Merkurstr. 11, 30419 Hannover, Germany 12
5 Deltares, Boussinesqweg 1, 2629 HV Delft, Netherlands 13
6 Department of Hydraulic Engineering, Delft University of Technology, P.O. Box 5048, 2600 GA Delft, 14
The Netherlands 15
16
7 Yerseke Spatial Ecology, Netherlands Institute for Sea Research (NIOZ), Korringaweg 7, 4401 NT, 17
Yerseke, Netherlands 18
8 present address: Environmental Systems Analysis, Institute of Geoecology, Technische 19
Universität Braunschweig, Langer Kamp 19c, 38106 Braunschweig, Germany 20
21
22
*Corresponding author. E-mail address: [email protected], 23 Phone: +49 (0)40-42816-272 24 25
26
27
28
29
30
31
32
33
2
34
35
36
37
38
39
40
Highlights 41
- Salt marsh vegetation can reduce near-bed orbital velocities during storm surges 42
- Vegetation effect on orbital velocities varies with biophysical properties 43
- Flexible low-growing plant canopies show high resilience to storm surge conditions 44
- More rigid and tall grasses experience stem folding and breakage 45
- The contribution of vegetation to wave dissipation is plant species specific 46
47
3
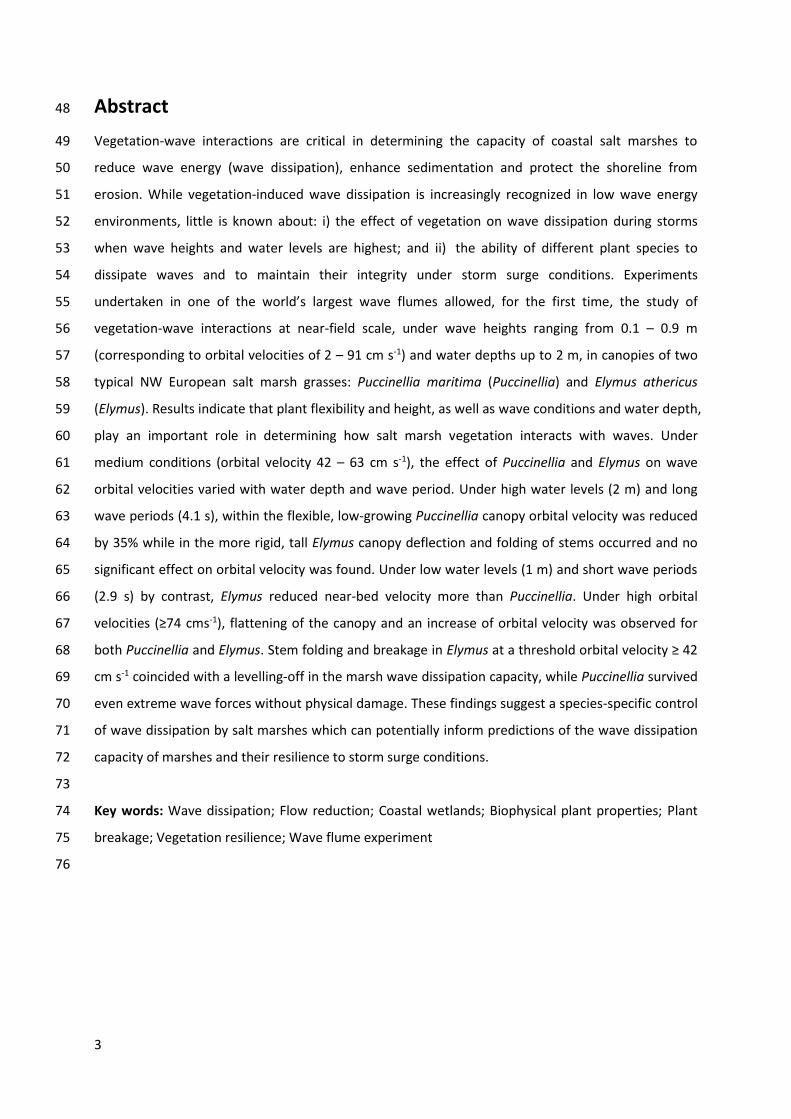
Abstract 48
Vegetation-wave interactions are critical in determining the capacity of coastal salt marshes to 49
reduce wave energy (wave dissipation), enhance sedimentation and protect the shoreline from 50
erosion. While vegetation-induced wave dissipation is increasingly recognized in low wave energy 51
environments, little is known about: i) the effect of vegetation on wave dissipation during storms 52
when wave heights and water levels are highest; and ii) the ability of different plant species to 53
dissipate waves and to maintain their integrity under storm surge conditions. Experiments 54
undertaken in one of the world’s largest wave flumes allowed, for the first time, the study of 55
vegetation-wave interactions at near-field scale, under wave heights ranging from 0.1 – 0.9 m 56
(corresponding to orbital velocities of 2 – 91 cm s-1) and water depths up to 2 m, in canopies of two 57
typical NW European salt marsh grasses: Puccinellia maritima (Puccinellia) and Elymus athericus 58
(Elymus). Results indicate that plant flexibility and height, as well as wave conditions and water depth, 59
play an important role in determining how salt marsh vegetation interacts with waves. Under 60
medium conditions (orbital velocity 42 – 63 cm s-1), the effect of Puccinellia and Elymus on wave 61
orbital velocities varied with water depth and wave period. Under high water levels (2 m) and long 62
wave periods (4.1 s), within the flexible, low-growing Puccinellia canopy orbital velocity was reduced 63
by 35% while in the more rigid, tall Elymus canopy deflection and folding of stems occurred and no 64
significant effect on orbital velocity was found. Under low water levels (1 m) and short wave periods 65
(2.9 s) by contrast, Elymus reduced near-bed velocity more than Puccinellia. Under high orbital 66
velocities (≥74 cms-1), flattening of the canopy and an increase of orbital velocity was observed for 67
both Puccinellia and Elymus. Stem folding and breakage in Elymus at a threshold orbital velocity ≥ 42 68
cm s-1 coincided with a levelling-off in the marsh wave dissipation capacity, while Puccinellia survived 69
even extreme wave forces without physical damage. These findings suggest a species-specific control 70
of wave dissipation by salt marshes which can potentially inform predictions of the wave dissipation 71
capacity of marshes and their resilience to storm surge conditions. 72
73
Key words: Wave dissipation; Flow reduction; Coastal wetlands; Biophysical plant properties; Plant 74
breakage; Vegetation resilience; Wave flume experiment 75
76
4
1. Introduction 77
78
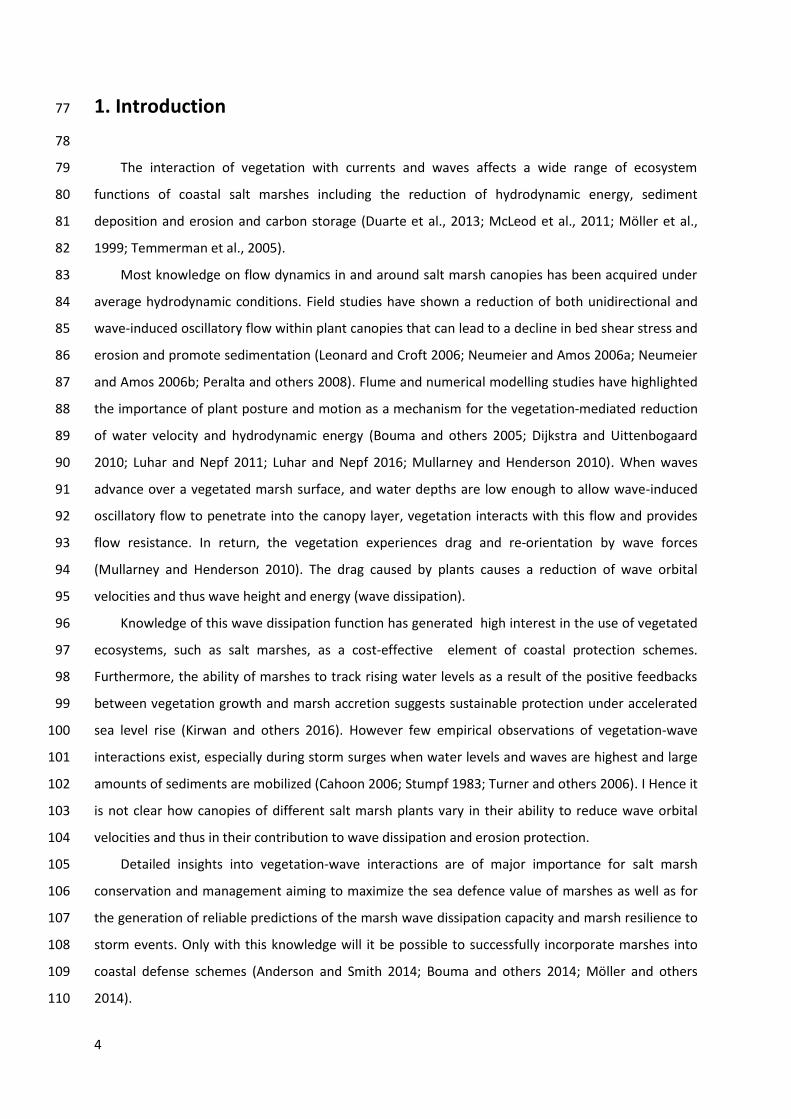
The interaction of vegetation with currents and waves affects a wide range of ecosystem 79
functions of coastal salt marshes including the reduction of hydrodynamic energy, sediment 80
deposition and erosion and carbon storage (Duarte et al., 2013; McLeod et al., 2011; Möller et al., 81
1999; Temmerman et al., 2005). 82
Most knowledge on flow dynamics in and around salt marsh canopies has been acquired under 83
average hydrodynamic conditions. Field studies have shown a reduction of both unidirectional and 84
wave-induced oscillatory flow within plant canopies that can lead to a decline in bed shear stress and 85
erosion and promote sedimentation (Leonard and Croft 2006; Neumeier and Amos 2006a; Neumeier 86
and Amos 2006b; Peralta and others 2008). Flume and numerical modelling studies have highlighted 87
the importance of plant posture and motion as a mechanism for the vegetation-mediated reduction 88
of water velocity and hydrodynamic energy (Bouma and others 2005; Dijkstra and Uittenbogaard 89
2010; Luhar and Nepf 2011; Luhar and Nepf 2016; Mullarney and Henderson 2010). When waves 90
advance over a vegetated marsh surface, and water depths are low enough to allow wave-induced 91
oscillatory flow to penetrate into the canopy layer, vegetation interacts with this flow and provides 92
flow resistance. In return, the vegetation experiences drag and re-orientation by wave forces 93
(Mullarney and Henderson 2010). The drag caused by plants causes a reduction of wave orbital 94
velocities and thus wave height and energy (wave dissipation). 95
Knowledge of this wave dissipation function has generated high interest in the use of vegetated 96
ecosystems, such as salt marshes, as a cost-effective element of coastal protection schemes. 97
Furthermore, the ability of marshes to track rising water levels as a result of the positive feedbacks 98
between vegetation growth and marsh accretion suggests sustainable protection under accelerated 99
sea level rise (Kirwan and others 2016). However few empirical observations of vegetation-wave 100
interactions exist, especially during storm surges when water levels and waves are highest and large 101
amounts of sediments are mobilized (Cahoon 2006; Stumpf 1983; Turner and others 2006). I Hence it 102
is not clear how canopies of different salt marsh plants vary in their ability to reduce wave orbital 103
velocities and thus in their contribution to wave dissipation and erosion protection. 104
Detailed insights into vegetation-wave interactions are of major importance for salt marsh 105
conservation and management aiming to maximize the sea defence value of marshes as well as for 106
the generation of reliable predictions of the marsh wave dissipation capacity and marsh resilience to 107
storm events. Only with this knowledge will it be possible to successfully incorporate marshes into 108
coastal defense schemes (Anderson and Smith 2014; Bouma and others 2014; Möller and others 109
2014). 110
5
Vegetation-wave interactions, and the resulting wave dissipation, are a function of biophysical 111
plant properties such as flexibility, density, biomass and height as well as hydrodynamic conditions 112
such as incident wave height, wave period and water depth (Anderson and others 2011; Paul and 113
others 2016). 114
Plant flexibility determines how much, and in what way, plants move and hence the magnitude 115
of drag forces experienced (Luhar and Nepf 2016; Mullarney and Henderson 2010; Paul and others 116
2016). Under wave forcing two types of plant movement need to be distinguished: 117
Swaying is an oscillatory plant movement throughout the wave cycle with symmetric bending in 118
the both directions of water flow under wave motion. Whip-like movement is characterized by a fast 119
flipping over from a short backward bending of the plants, to an extended ‘forward’ bending and 120
wide stem extension in the dominant direction of wave-induced oscillatory flow (in general the 121
direction of wave travel). The latter motion results in flattening of the canopy, a loss of flow 122
resistance and high orbital velocity for part of the wave cycle. A transition from swaying to whip-like 123
movement can occur for a species when wave height and energy increases, with the point of 124
transition depending on the stiffness of the plant and the ratio of plant height to wave orbital 125
excursion (Manca 2010; Paul and others 2012). 126
Numerical models simulating the motion of flexible aquatic vegetation under wave orbital 127
velocities use primarily two dimensionless parameters to describe plant movement and predict drag 128
forces acting on vegetation: (i) the Cauchy number, Ca, which represents the ratio of the 129
hydrodynamic forcing to the restoring force due to plant stiffness; and (ii) the ratio of plant height to 130
wave orbital excursion, L (Luhar and Nepf 2016). A value of Ca < 1 implies an upright plant posture 131
under wave-induced oscillatory flow, as hydrodynamic forces are much smaller than the restoring 132
force due to stiffness. When Ca > 1, plants start to bend with increasing values of Ca indicating a 133
decrease of flow resistance and drag acting on vegetation due to increasing plant bending under 134
wave forces. For L > 1, a swaying plant movement with moderate bending angles can be assumed. 135
When L < 1, the high orbital velocities are expected to cause an extended ‘forward’ bending and a 136
flattening of the canopy and low flow resistance for part of the wave cycle (Luhar and Nepf 2016), i.e. 137
a plant behaviour typically occurring under a whip like canopy movement. For flexible aquatic 138
vegetation the buoyancy parameter B, representing the ratio of restoring forces due to buoyancy and 139
stiffness, also affects plant bending (Luhar and Nepf 2011). However, B can be neglected in the case 140
of the terrestrial salt marsh plants that exhibit high stiffness compared to seagrasses or macroalgae 141
(Rupprecht et al., 2015a). 142
Salt marsh plants show a wide variability of stem flexibility, both between different species and 143
the different stem parts of specimens of one species. Little is known on how this variability affects 144
vegetation-wave interactions (Rupprecht and others 2015a). Previous studies on plants of tidal 145
6
marshes (Bouma and others 2005; Heuner and others 2015; Silinski and others 2015) but also on 146
freshwater macrophytes (Aberle and Jarvela 2013; Robionek and others 2015; Sand-Jensen 2003) 147
and macroalgae (Gaylord and Denny 1997; Stewart 2006) have shown that drag experienced by 148
plants under hydrodynamic forcing is inversely related to their flexibility. Flexible plants show an 149
avoidance strategy and minimize the risk of folding and breakage through reconfiguration; stiff plants 150
by contrast maximize the resistance to physical damage (tolerance strategy) but may break if 151
hydrodynamic forces increase beyond a critical level (Heuner and others 2015; Puijalon and others 152
2011; Silinski and others 2015). For plants characterized byswaying movement, a positive correlation 153
between stem stiffness and vegetation-induced wave dissipation has been observed (Bouma and 154
others 2005). When comparing two salt marsh grasses with different stem flexibility and stem 155
density, Bouma et al. (2010) found that an increase in stem density and biomass can counteract the 156
reduced wave dissipation capacity of flexible plants. 157
Apart from stem flexibility, density and biomass, the wave dissipation capacity of salt marsh 158
canopies is affected by the ratio of water depth to canopy height (submergence ratio) (Möller and 159
others 1997; Möller and others 1999; Yang and others 2012). The effectiveness of vegetation in 160
dissipating waves has been shown to increase with the percentage of the water column that it 161
occupies, i.e. with decreasing submergence ratio (Augustin et al., 2009; Paul et al., 2012).. 162
Beyond a critical combination of orbital velocities and water depth, changes in type and 163
magnitude of vegetation-wave interactions are likely to result in a significant alteration of 164
vegetation-induced wave dissipation. The existence of hydrodynamic thresholds determining the 165
transition from wave regimes with vegetation-induced wave modification and wave dissipation to 166
those regimes characterized by a flexing, folding or breakage of plants under wave orbital velocities 167
and a decline in vegetation-induced wave dissipation has been suggested by various authors (Gedan 168
et al., 2011; Koch et al., 2009; Möller et al., 1999; Yang et al., 2012), but remains to be demonstrated. 169
This is because the quantification of such hydrodynamic thresholds either by field studies, flume 170
experiments or by numerical modelling is extremely challenging. Field studies suffer from the 171
unpredictable nature and high temporal variability of wave conditions and difficulties in deploying 172
instrumentation under higher energy wave events. Laboratory flume studies offer controlled wave 173
conditions, but are often hampered by limits to the water depths and waves that can be generated. It 174
has proved difficult to build realistic small-scale physical models of vegetated surfaces (Fonseca and 175
Cahalan 1992; Mendez and Losada 2004). 176
Numerical models of wave dissipation can simulate a wide range of wave conditions (Mendez 177
and Losada 2004; Riffe et al., 2011) but in the absence of suitably representative flume or field 178
calibration data suffer from the difficulty of realistically representing vegetation as well as its effect 179
on wave orbital velocities. 180

7
In this paper we report results from a unique experiment on wave dissipation over coastal salt 181
marshes conducted in one of the world’s largest wave flumes at a near field scale (for details see 182
Möller et al., 2014). We analyzed vegetation-wave interactions in canopies of two salt marsh grasses, 183
the low growing and flexible Puccinellia maritima and the tall, less flexible Elymus athericus, over a 184
wide range of wave conditions and corresponding orbital velocities to answer the following questions: 185
186
(1) How do plant canopies of different biophysical properties (flexible and low-growing vs. 187
stiff and tall) affect wave orbital velocities under rising wave energy and water depths? 188
189
(2) Does physical damage to vegetation under increasing wave energy differ between flexible, 190
low-growing canopies and stiff, tall canopies? If so – is there a threshold in orbital velocity 191
beyond which differences in plant susceptibility to folding and breakage become apparent? 192
193
2. Methods 194
2.1 Study species and biophysical properties 195
We investigated two grasses commonly occurring in NW European salt marshes, Puccinellia maritima 196
(Hudson) Parl. and Elymus athericus L.; hereafter referred to as Puccinellia and Elymus(Fig. 1). 197
Puccinellia is typical of marshes at low to mid elevations in the tidal frame and characteristic of early- 198
to mid-successional stages of salt marsh vegetation development. Where sandy soils are present, it 199
can also be found in the lower-lying pioneer zone. Puccinellia is also a characteristic species of grazed 200
salt marshes, as the species is tolerant to trampling, biomass loss and waterlogging and can 201
reproduce by clonal growth. 202
In contrast to Puccinellia, Elymus needs aerated soils and is sensitive to grazing. In many salt marshes 203
of NW Europe, it forms monospecific dense stands in the high marshes and represents a late-204
successional stage of salt marsh vegetation. In recent decades, Elymus has rapidly colonized 205
mainland salt marshes along the North Sea coast and the Atlantic coast where it can be found not 206
only in the high marsh but also in mid and sometimes low marshes (Bockelmann and Neuhaus 1999; 207
Valéry et al., 2004). The expansion of Elymus has been related to the abandonment of grazing, high 208
vertical accretion rates and marsh age as well as the species ability to reproduce clonally by rhizomes 209
(Rupprecht et al., 2015b; Veeneklaas et al., 2013). 210
Puccinellia and Elymus differ with respect to their biophysical properties, such as plant stem 211
flexibility, stem density and stem height, which have relevance for flow and wave dissipation. 212
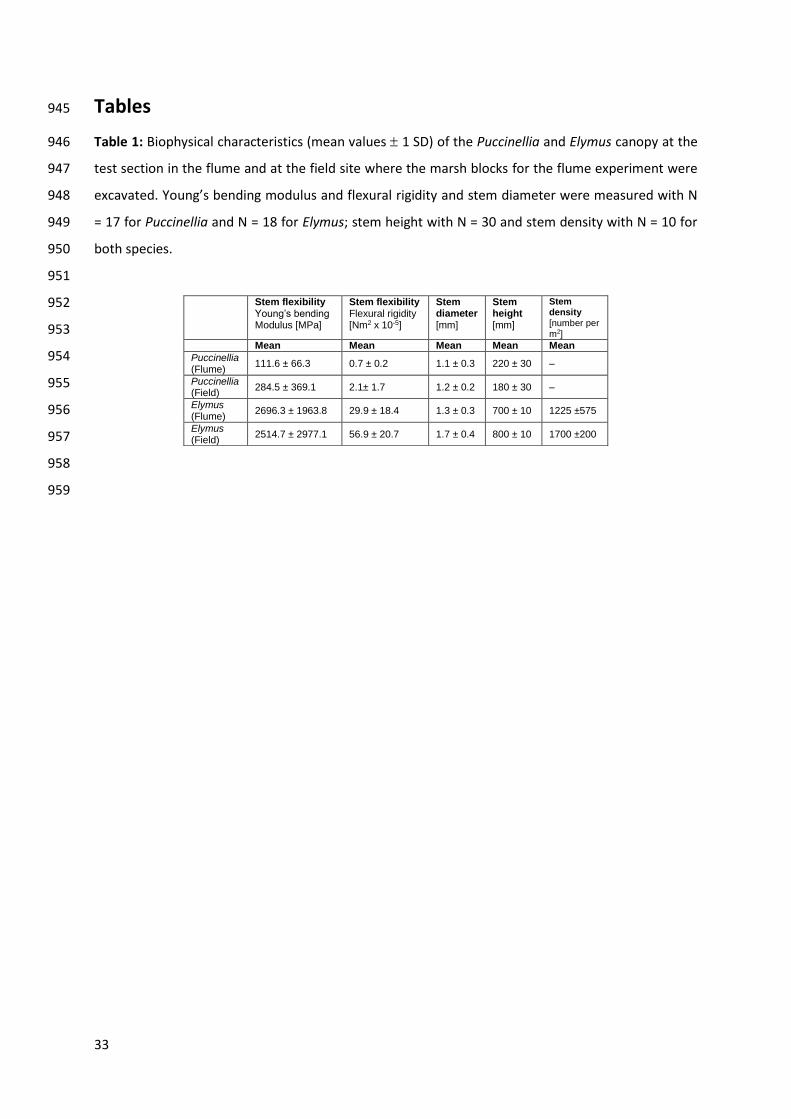
Puccinellia canopies are characterized by a high stem flexibility, high stem density and low canopy 213

8
height (around 0.2 m, Table 1). Canopies of Elymus show a low stem flexibility and stem density and a 214
canopy height (around 0.8 m) that is four times greater than that of Puccinellia (Table 1). Previous 215
measurements of stem flexibility in salt marsh grasses have shown that variation of stem flexibility 216
between the bottom (more rigid) and the middle and top (more flexible) stem parts of Elymus is 217
much higher than in Puccinellia (Rupprecht et al., 2015a). 218
As measures of stem flexibility, the Young’s bending modulus and flexural rigidity of Puccinellia 219
and Elymus stems were determined of 17 and 18 samples, respectively, using a three-point-bending 220
test ( for methodology see Rupprecht et al. (2015a)). Prior to performing the tests, stem length up to 221
the onset of the youngest leaf was measured and stems were divided into three equal parts (bottom, 222
middle, top). The test section was cut from the middle of each part of the stem. 223
Stem height was measured with a folding rule for 30 randomly chosen stems. Stem density of 224
Elymus was measured by counting the number of stems in 15 quadrats of a size of 20 x 20 cm 225
randomly distributed across the vegetated test section in the flume. For Puccinellia, the very high 226
stem density (N/m² >1000) and the low stem diameter meant that a quantitative assessment of stem 227
density was not feasible in the framework of the present study. 228
We compared biophysical properties of the Puccinellia and the Elymus canopy between the flume 229
test section and the field site from where the salt marsh for the flume experiment was excavated 230
(see also section 2.2). No statistical difference was found in the Young’s bending modulus; t-test; p > 231
0.05. However flexural rigidity of Puccinellia and Elymus stems was significantly lower in the flume 232
than in the field (t-test; p < 0.01). This indicates that stems of Puccinellia and Elymus in the flume 233
were more flexible than stems at the field site, when accounting for varying stem diameter. The 234
lower nutrient supply and less mechanical stress experienced during the one year storage period of 235
the vegetation prior to the start of the experiment (for detailed information see Möller et al., 2014), 236
as compared to the regular flood of in situ marshes, may explain these differences. 237
Stem height of Puccinellia was significantly higher in the flume than in the field (t-test; p < 0.05). 238
For Elymus, no significant differences of stem height and stem density were found between the 239
flume and the field site (t-test; p > 0.05). 240
#Figure 1 241
#Table 1 242
243
2.2 Experimental set-up 244
The study was carried out in conjunction with an experiment on wave dissipation over natural 245
salt marsh transplants under storm surge conditions (Möller et al., 2014). This experiment was 246
conducted in the 5 m wide, 7 m deep and approx. 310 m long Large Wave Flume (GWK) of the 247
Forschungszentrum Küste (FZK) in Hannover, Germany and lasted 17 days (15 – 31 October 2013). . A 248
9
detailed description of the excavation of the salt marsh and its installation within the flume, the 249
experimental set-up and the employed instrumentation to measure wave dissipation is given in 250
Möller et al. (2014). 251
An elevated vegetated test section of 40 m length was constructed approx. 115 m from the wave 252
paddle on top of a 1.2 m high sand base covered by a geotextile layer. This was necessary to ensure 253
sufficient water depth at the wave paddle to generate the desired waves and to allow waves to fully 254
develop before reaching the vegetated test section. At the front and rear end of the vegetated test 255
section a concrete berm, followed by a slope of 1:10 was built to allow the waves to shoal and/or 256
break, as would be the case in a natural shallow water marsh setting (Fig. 2 a). Wave breaking at the 257
1:6 asphalt slope at the end of the flume minimized wave reflection and active wave absorption of 258
the wave maker. 259
The vegetated test section consisted of a coherent patchwork of marsh blocks, each with a size 260
of approximately 0.8 x 1.2 x 0.3 m. The blocks were vegetated with either Puccinellia, Elymus or the 261
herbaceous forb Atriplex prostrata. 262
An underwater observation window in the flume wall 6 meters from the start of the vegetated 263
test section allowed the video capture of individual Elymus and Puccinellia movement during the 264
experiment. Four marsh blocks with Puccinellia and four marsh blocks with Elymus were deployed 265
next to each other in front of this window covering an area of 4 m2 respectively. Two 2D-266
Electromagnetic current meters (EMCMs) were positioned on both sides of the underwater 267
observation window approximately 15 cm above the bed, one in the canopy of Puccinellia and one in 268
the canopy of Elymus (Fig. 2b). During wave tests, the EMCMs recorded wave orbital velocities with a 269
frequency of 100 Hz and a precision of ± 10 cm s-1. In the immediate vicinity of the EMCMs, water 270
pressure oscillation was recorded with a PTX1830 pressure wave gauge at the same sampling 271
frequency as the EMCMs (100 Hz). 272
The marsh canopy was submerged for 2 – 3 days at a time for wave tests. After each two day 273
period of submergence the vegetation was exposed for at least 12 hours to allow plants regular gas 274
exchange. As wave dissipation can be induced through both wave-plant and wave-sediment bottom 275
interactions, a number of tests were conducted with initially intact and then removed (mowed) 276
vegetation (height of remaining plant stems after mowing approx. 2 – 3 cm). This enabled us to 277
quantify the effect of vegetation on the observed wave dissipation. During the course of the 278
experiment the entire vegetated test section was illuminated for the benefit of the plants by a total 279
of 60 lamps (GE 750W 400V PSL or equivalent) mounted along the upper margins of the flume. 280
#Fig. 2 281
#Table 2 282
283
10
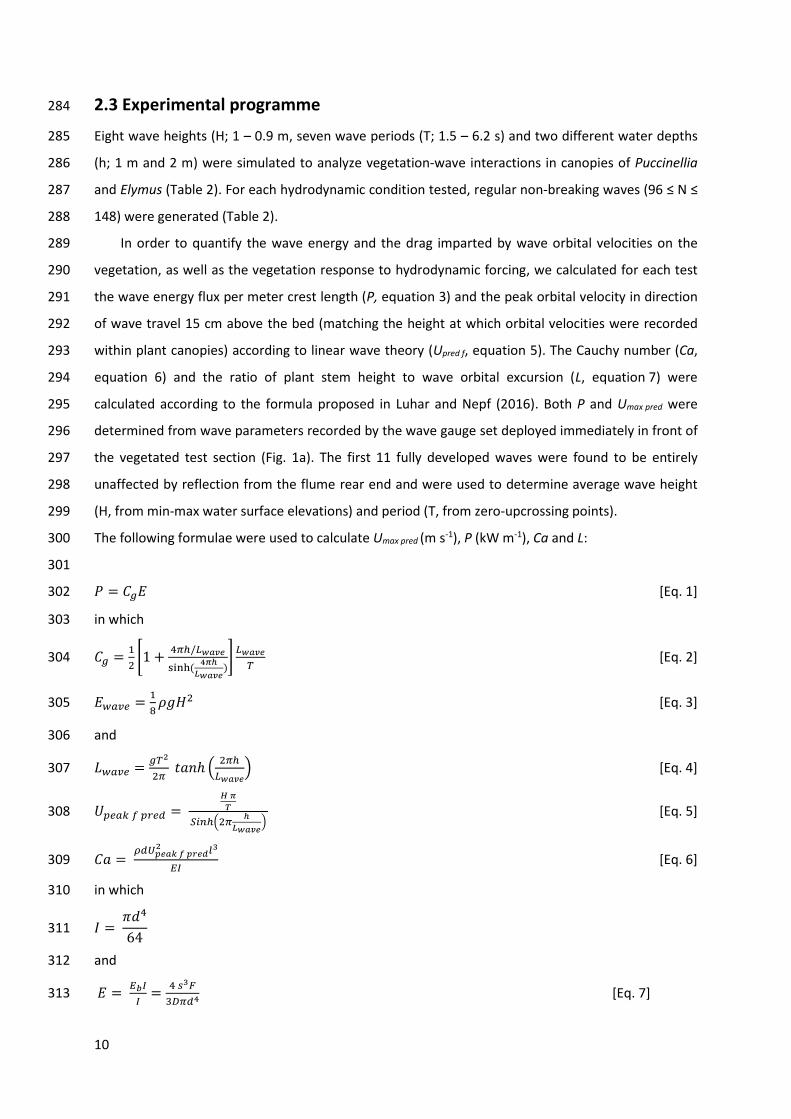
2.3 Experimental programme 284
Eight wave heights (H; 1 – 0.9 m, seven wave periods (T; 1.5 – 6.2 s) and two different water depths 285
(h; 1 m and 2 m) were simulated to analyze vegetation-wave interactions in canopies of Puccinellia 286
and Elymus (Table 2). For each hydrodynamic condition tested, regular non-breaking waves (96 ≤ N ≤ 287
148) were generated (Table 2). 288
In order to quantify the wave energy and the drag imparted by wave orbital velocities on the 289
vegetation, as well as the vegetation response to hydrodynamic forcing, we calculated for each test 290
the wave energy flux per meter crest length (P, equation 3) and the peak orbital velocity in direction 291
of wave travel 15 cm above the bed (matching the height at which orbital velocities were recorded 292
within plant canopies) according to linear wave theory (Upred f, equation 5). The Cauchy number (Ca, 293
equation 6) and the ratio of plant stem height to wave orbital excursion (L, equation 7) were 294
calculated according to the formula proposed in Luhar and Nepf (2016). Both P and Umax pred were 295
determined from wave parameters recorded by the wave gauge set deployed immediately in front of 296
the vegetated test section (Fig. 1a). The first 11 fully developed waves were found to be entirely 297
unaffected by reflection from the flume rear end and were used to determine average wave height 298
(H, from min-max water surface elevations) and period (T, from zero-upcrossing points). 299
The following formulae were used to calculate Umax pred (m s-1), P (kW m-1), Ca and L: 300
301
𝑃 = 𝐶𝑔𝐸 [Eq. 1] 302
in which 303
𝐶𝑔 =1
2[1 +
4𝜋ℎ/𝐿𝑤𝑎𝑣𝑒
sinh(4𝜋ℎ
𝐿𝑤𝑎𝑣𝑒)]
𝐿𝑤𝑎𝑣𝑒
𝑇 [Eq. 2] 304
𝐸𝑤𝑎𝑣𝑒 =1
8𝜌𝑔𝐻2 [Eq. 3] 305
and 306
𝐿𝑤𝑎𝑣𝑒 =𝑔𝑇2
2𝜋 𝑡𝑎𝑛ℎ (
2𝜋ℎ
𝐿𝑤𝑎𝑣𝑒) [Eq. 4] 307
𝑈𝑝𝑒𝑎𝑘 𝑓 𝑝𝑟𝑒𝑑 = 𝐻 𝜋
𝑇
𝑆𝑖𝑛ℎ(2𝜋ℎ
𝐿𝑤𝑎𝑣𝑒)
[Eq. 5] 308
𝐶𝑎 = 𝜌𝑑𝑈𝑝𝑒𝑎𝑘 𝑓 𝑝𝑟𝑒𝑑
2 𝑙3
𝐸𝐼 [Eq. 6] 309
in which 310
𝐼 = 𝜋𝑑4
64 311
and 312
𝐸 = 𝐸𝑏𝐼
𝐼=
4 𝑠3𝐹
3𝐷𝜋𝑑4 [Eq. 7] 313
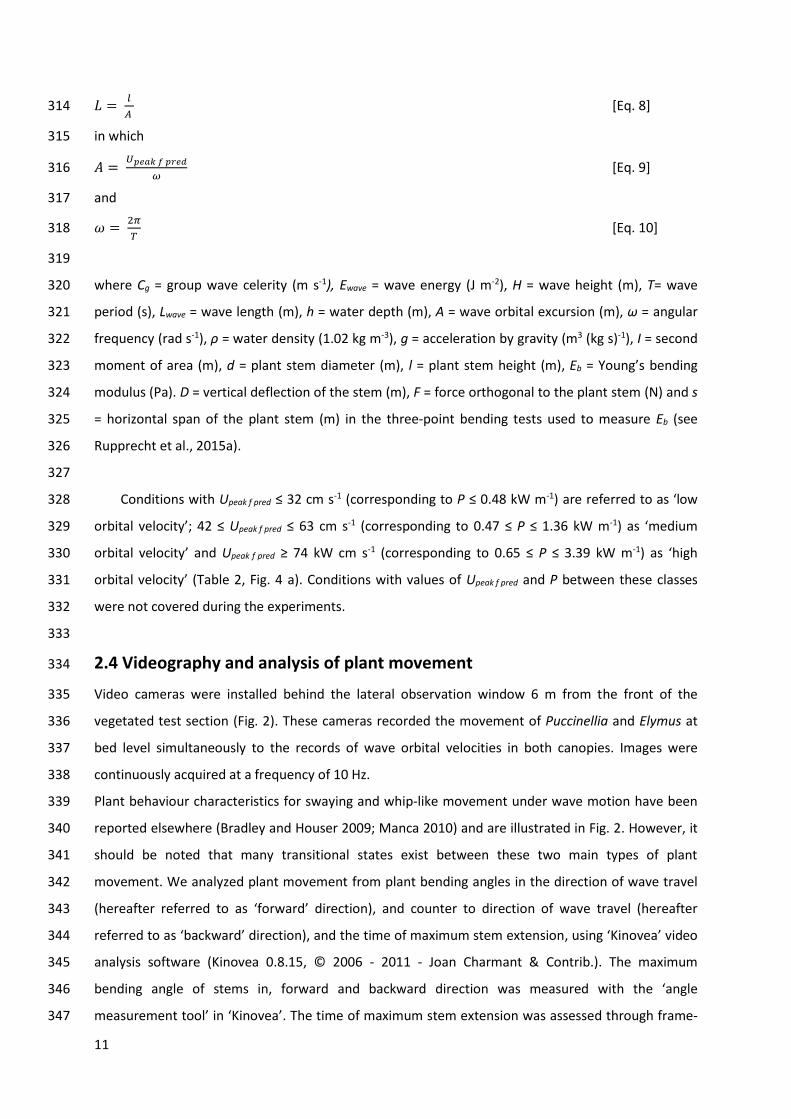
11
𝐿 = 𝑙
𝐴 [Eq. 8] 314
in which 315
𝐴 = 𝑈𝑝𝑒𝑎𝑘 𝑓 𝑝𝑟𝑒𝑑
𝜔 [Eq. 9] 316
and 317
𝜔 = 2𝜋
𝑇 [Eq. 10] 318
319
where Cg = group wave celerity (m s-1), Ewave = wave energy (J m-2), H = wave height (m), T= wave 320
period (s), Lwave = wave length (m), h = water depth (m), A = wave orbital excursion (m), ω = angular 321
frequency (rad s-1), ρ = water density (1.02 kg m-3), g = acceleration by gravity (m3 (kg s)-1), I = second 322
moment of area (m), d = plant stem diameter (m), l = plant stem height (m), Eb = Young’s bending 323
modulus (Pa). D = vertical deflection of the stem (m), F = force orthogonal to the plant stem (N) and s 324
= horizontal span of the plant stem (m) in the three-point bending tests used to measure Eb (see 325
Rupprecht et al., 2015a). 326
327
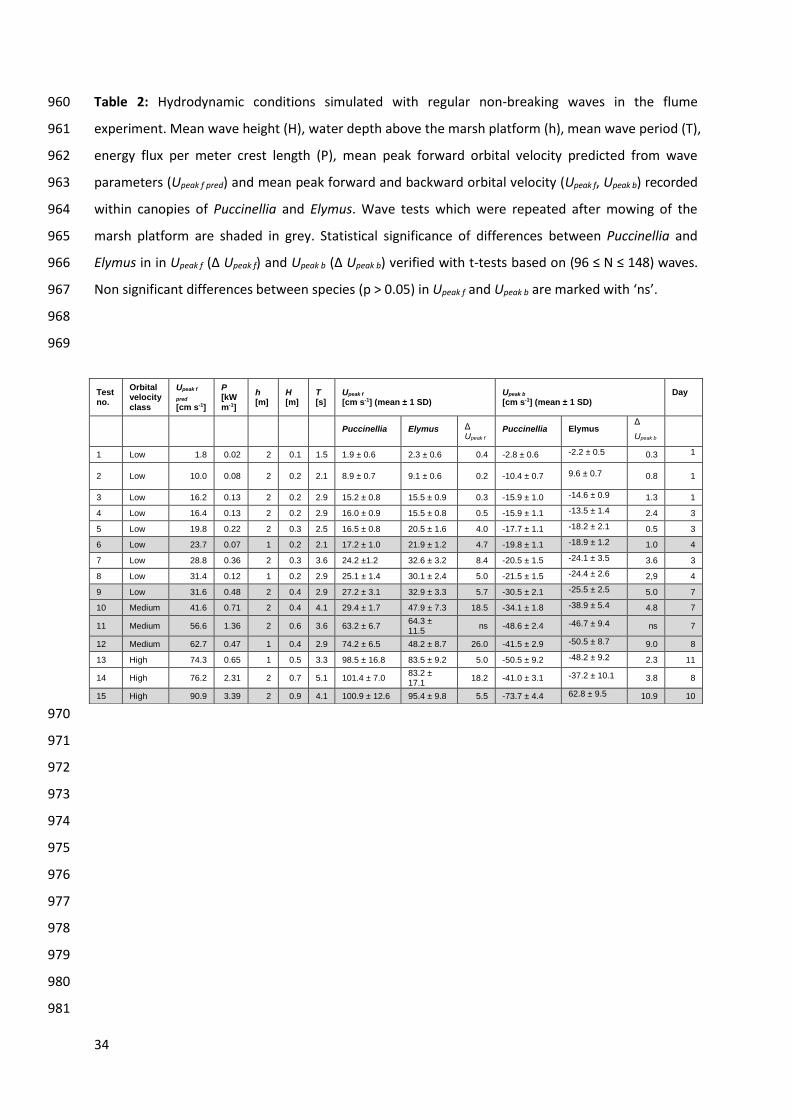
Conditions with Upeak f pred ≤ 32 cm s-1 (corresponding to P ≤ 0.48 kW m-1) are referred to as ‘low 328
orbital velocity’; 42 ≤ Upeak f pred ≤ 63 cm s-1 (corresponding to 0.47 ≤ P ≤ 1.36 kW m-1) as ‘medium 329
orbital velocity’ and Upeak f pred ≥ 74 kW cm s-1 (corresponding to 0.65 ≤ P ≤ 3.39 kW m-1) as ‘high 330
orbital velocity’ (Table 2, Fig. 4 a). Conditions with values of Upeak f pred and P between these classes 331
were not covered during the experiments. 332
333
2.4 Videography and analysis of plant movement 334
Video cameras were installed behind the lateral observation window 6 m from the front of the 335
vegetated test section (Fig. 2). These cameras recorded the movement of Puccinellia and Elymus at 336
bed level simultaneously to the records of wave orbital velocities in both canopies. Images were 337
continuously acquired at a frequency of 10 Hz. 338
Plant behaviour characteristics for swaying and whip-like movement under wave motion have been 339
reported elsewhere (Bradley and Houser 2009; Manca 2010) and are illustrated in Fig. 2. However, it 340
should be noted that many transitional states exist between these two main types of plant 341
movement. We analyzed plant movement from plant bending angles in the direction of wave travel 342
(hereafter referred to as ‘forward’ direction), and counter to direction of wave travel (hereafter 343
referred to as ‘backward’ direction), and the time of maximum stem extension, using ‘Kinovea’ video 344
analysis software (Kinovea 0.8.15, © 2006 - 2011 - Joan Charmant & Contrib.). The maximum 345
bending angle of stems in, forward and backward direction was measured with the ‘angle 346
measurement tool’ in ‘Kinovea’. The time of maximum stem extension was assessed through frame-347

12
by-frame tracking of individual plant stems. In ‘Kinovea’ tracking of objects (here plant stems) is a 348
semi-automatic process. After manually choosing a well distinguishable point on a plant stem, the 349
point location is computed automatically by recording x (horizontal) and y (vertical) coordinates in 350
pixels. The tracking process can be interrupted and manually adjusted at any time. In each wave test, 351
we recorded stem movement for an interval of 10 – 20 s at the same location in the canopy, thus 352
capturing plant movement under at least four waves. In tests with medium and high hydrodynamic 353
energy, fast canopy movement and high water turbidity, the point location needed to be manually 354
adjusted several times during the tracking process. This may have caused a lower precision of the 355
video analysis in these wave tests. In addition to the analysis of plant movement, the minimum 356
height of the submerged canopy (i.e. canopy height resulting from the maximum bending angle of 357
stems in direction of wave travel) was determined using a measuring tape fixed to the observation 358
window of the flume. 359
360
2.5 Quantification of wave orbital velocities 361
Time-series data of orbital velocity under regular non-breaking waves were used to evaluate the 362
effect of canopy movement of Puccinellia and Elymus (observed with the video cameras) on orbital 363
velocities near the sediment bed. The mean peak velocity, both in the direction of wave travel i.e. in 364
‘forward’ direction (mean peak forward velocity, Upeak f) and counter to the direction of wave travel 365
i.e. in ‘backward’ direction (mean peak backward velocity, Upeak b), were quantified from the 366
horizontal velocity component (component in direction of wave travel) recorded with the EMCMs at 367
a height of 15 cm above the bed. Tt do so, the peak velocities, both in forward and backward 368
direction, were identified for each wave cycle within the complete time series and then averaged 369
over all waves recorded during the respective test (96 ≤ N ≤ 148). 370
In shallow water environments, wave shape changes with increasing wave height and wave 371
period, from a symmetric sinusoidal pattern to an asymmetric trochoidal shape characterized by 372
steep wave crests and shallower wave troughs. This change leads to asymmetry in forward and 373
backward orbital velocity. The maximum drag force that can be imparted by the waves on the 374
vegetation canopy under a specific level of wave energy is driven by the stronger orbital velocity in 375
forward direction under the wave crests. For this reason, we focused on Umax recorded within 376
canopies of Puccinellia and Elymus when comparing the responses of the different canopies to wave 377
forcing in terms of movement and their capacities to lessen orbital velocities. 378
To assess the effect of the presence of Puccinellia and Elymus on orbital velocities as opposed to 379
unvegetated conditions, we compared Upeak f measured within both canopies with Upeak f when the 380
canopies were mowed. Differences in orbital velocities between Puccinellia and Elymus, as well as 381

13
between vegetated and mowed conditions, were analyzed for each wave test (96 ≤ N ≤ 148) with t-382
tests calculated in R 3.1.0 (R Development Core Team, Vienna, AT). 383
384
385
2.6 Quantification of physical damage of the vegetation canopy 386
To assess the physical damage occurring to the vegetated test section as a whole, all floating biomass 387
was collected by net (1 cm mesh) from the water surface at the end of each test, dried and weighed. 388
After the last wave test under vegetated conditions, the whole vegetated test section was mowed to 389
a stem height of 2 – 3 cm (see also section 2.2). To quantify the total dry weight of biomass on the 390
test section, the dry weight of the mowed biomass was added to the dry weight of the floating 391
biomass recovered over ithe course of the experiment. 392
To assess the physical damage to the Elymus canopy, the number of Elymus stems remaining 393
was counted each time when the flume was drained and the plants emergent. The prerequisite of a 394
stem to be counted was that it was not broken, i.e. stems that were folded but not broken were also 395
counted. Stems were counted at 18 quadrats of 10 x 10 cm located within a distance of 0.7 m into 396
the vegetated test section from the flume side wall. The quadrats were distributed in six sets of three 397
replicates from the front to the rear end of the vegetated test section with two of these sets (i.e. six 398
quadrats) located in the front, middle and rear part of the vegetated test section and accessed from 399
a small walkway along one of the flume side walls. The assessment of physical damage to the Elymus 400
canopy as described here was conducted separately from the quantification of stem density for the 401
quantification of biophysical properties of Elymus (see section 2.1). 402
Physical damage to the Puccinellia canopy was assessed from photographs of the Puccinellia 403
canopy each time the flume was drained at a location close to where the EMCM in the Puccinellia 404
canopy was deployed. 405
406
3 Results 407
3.1 Canopy movement and orbital velocity in Puccinellia and Elymus 408
At low orbital velocity both the Puccinellia and Elymus canopy showed a swaying movement under 409
wave motion with similar mean peak forward orbital velocitiy (Upeak f) and mean peak backward 410
orbital velocity (Upeak b) (Fig. 4, Table 3). 411
At medium orbital velocity, larger differences in Upeak f occurred between Puccinellia and Elymus. 412
These differences were associated with the folding of Elymus stems, the transition of swaying to 413
whip-like movement in Puccinellia and long wave periods (4 – 5 s). 414

14
Folding of Elymus stems was first observed at Upeak f pred = 42 cm s-1, corresponding to a wave 415
height of 0.4 m and a wave period of 4.1 s (Fig. 4, wave test 10 in Table 2). Here the bottom stem 416
parts bent to around 30°, while the upper more flexible stem parts folded over at around 8 cm above 417
the bed, resulting in a wide bending angle (80 – 90°) of the Elymus canopy as a whole. In comparison, 418
Puccinellia showed a bending angle of 50° (Table 3). The more upright posture of the Puccinellia 419
canopy resulted in a greater flow resistance and an 18 cm s-1 (37%) lower orbital velocity under wave 420
forward motion than in Elymus. Time trace analysis of plant stem movement indicated a phase 421
difference of around 20 – 40° between canopy movement and wave motion in both the Puccinellia 422
and the Elymus canopy (for an illustration of canopy movement and water motion see Appendix Fig. 423
A.1). At Upeak f pred = 62 cm s-1 the transition from swaying to whip-like movement occurred in 424
Puccinellia (Fig. 4, wave test 12 in Table 2). The wide bending angles in the direction of wave travel 425
(approximately 60°) and the long duration of maximum stem extension (approximately 1.5 s) allowed 426
the flow to pass unimpeded over the deflected canopy the top of which was at a height of around 427
9 cm above the sediment bed for a large part of the wave cycle. In contrast, Elymus showed a 428
swaying movement with folding of stems approx. 6 cm above the bed (for an illustration of canopy 429
movement and water motion see Appendix Fig. A.2). Whip-like movement of Puccinellia and hence a 430
decrease in flow resistance led to a 26 cm s-1 (54%) higher orbital velocity under wave forward 431
motion in comparison to Elymus (Table 2). 432
At high orbital velocity both Puccinellia and Elymus exhibited a whip-like movement (Table 3). 433
Upeak f in Puccinellia exceeded Upeak f in Elymus by 5 – 18 cm s-1 (6 – 22%; Fig. 4, wave test 14 in Table 434
2). During wave forward motion, both canopies were in a flattened ‘shielding posture’ (canopy height 435
above the bed = 7 cm in Puccinellia, 5 cm in Elymus) and presumably provided low flow resistance. In 436
both Puccinellia and Elymus a phase difference occurred between canopy movement and wave 437
motion. In Elymus the phase difference was much larger (around 90°) than in Puccinellia (around 30 – 438
40°, for an illustration of canopy movement and water motion see Appendix Fig. A.3). 439
# Fig. 4 440
#Table 3 441
442
The Cauchy number Ca ranged in Puccinellia from 0.3 – 671 and in Elymus from 0.4 – 994 (Fig. 4, 443
Table 4). Small differences (≤ 39) of Ca in both canopies at low orbital velocity reflect their similar 444
response to hydrodynamic forcing in terms of canopy movement. From medium orbital velocity 445
onwards differences of Ca in Puccinellia and Elymus increased (68 ≤ X ≤ 322) (Table 4) with higher 446
values of Ca in Elymus compared to Puccinellia. The ratio of canopy height to wave orbital excursion L 447
ranged in the low-growing Puccinellia from 42.9 – 0.3 and in the tall Elymus from 166.9 – 1.2. The 448
onset of whip-like movement was at L = 0.6 in Puccinellia and at L = 1.8 in the Elymus canopy. 449
15
#Table 4 450
451
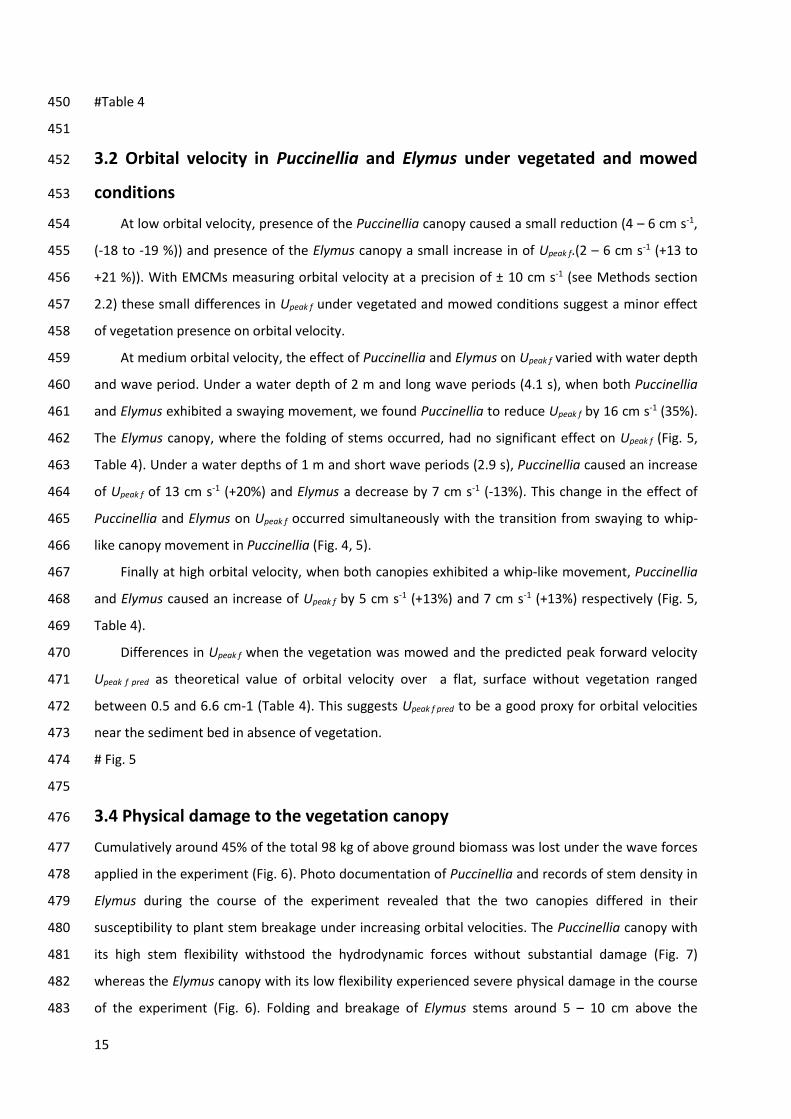
3.2 Orbital velocity in Puccinellia and Elymus under vegetated and mowed 452
conditions 453
At low orbital velocity, presence of the Puccinellia canopy caused a small reduction (4 – 6 cm s-1, 454
(-18 to -19 %)) and presence of the Elymus canopy a small increase in of Upeak f.(2 – 6 cm s-1 (+13 to 455
+21 %)). With EMCMs measuring orbital velocity at a precision of ± 10 cm s-1 (see Methods section 456
2.2) these small differences in Upeak f under vegetated and mowed conditions suggest a minor effect 457
of vegetation presence on orbital velocity. 458
At medium orbital velocity, the effect of Puccinellia and Elymus on Upeak f varied with water depth 459
and wave period. Under a water depth of 2 m and long wave periods (4.1 s), when both Puccinellia 460
and Elymus exhibited a swaying movement, we found Puccinellia to reduce Upeak f by 16 cm s-1 (35%). 461
The Elymus canopy, where the folding of stems occurred, had no significant effect on Upeak f (Fig. 5, 462
Table 4). Under a water depths of 1 m and short wave periods (2.9 s), Puccinellia caused an increase 463
of Upeak f of 13 cm s-1 (+20%) and Elymus a decrease by 7 cm s-1 (-13%). This change in the effect of 464
Puccinellia and Elymus on Upeak f occurred simultaneously with the transition from swaying to whip-465
like canopy movement in Puccinellia (Fig. 4, 5). 466
Finally at high orbital velocity, when both canopies exhibited a whip-like movement, Puccinellia 467
and Elymus caused an increase of Upeak f by 5 cm s-1 (+13%) and 7 cm s-1 (+13%) respectively (Fig. 5, 468
Table 4). 469
Differences in Upeak f when the vegetation was mowed and the predicted peak forward velocity 470
Upeak f pred as theoretical value of orbital velocity over a flat, surface without vegetation ranged 471
between 0.5 and 6.6 cm-1 (Table 4). This suggests Upeak f pred to be a good proxy for orbital velocities 472
near the sediment bed in absence of vegetation. 473
# Fig. 5 474
475
3.4 Physical damage to the vegetation canopy 476
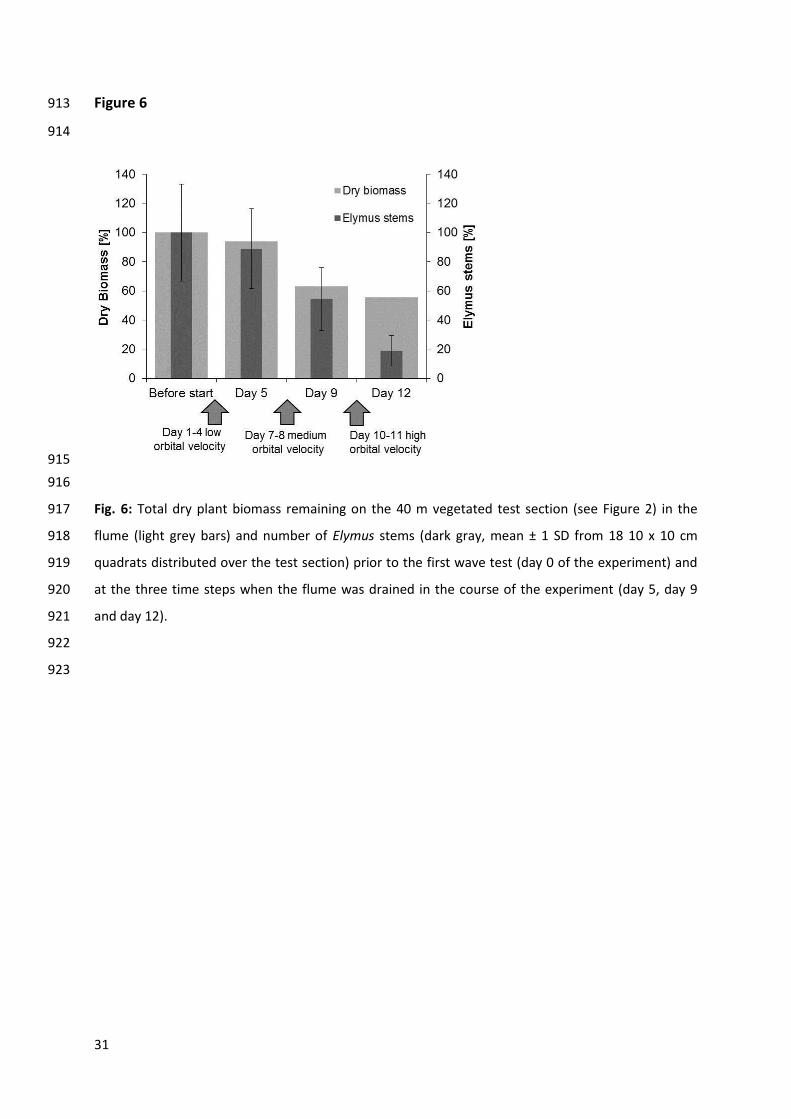
Cumulatively around 45% of the total 98 kg of above ground biomass was lost under the wave forces 477
applied in the experiment (Fig. 6). Photo documentation of Puccinellia and records of stem density in 478
Elymus during the course of the experiment revealed that the two canopies differed in their 479
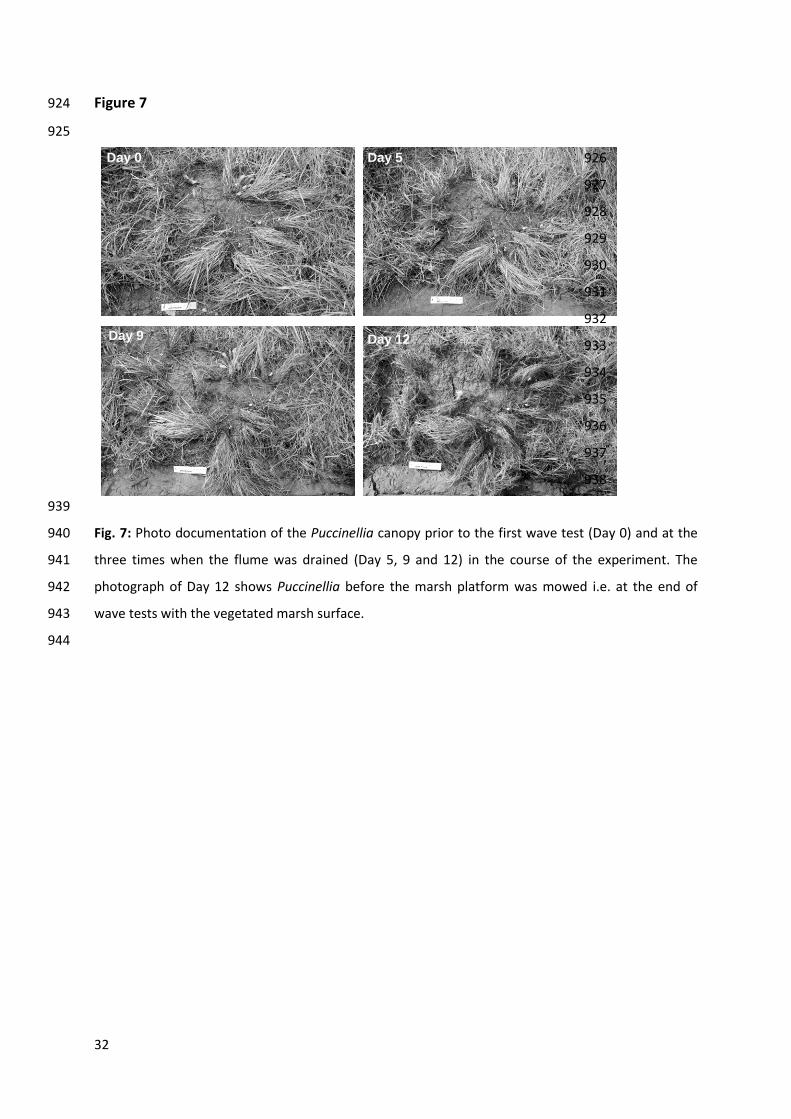
susceptibility to plant stem breakage under increasing orbital velocities. The Puccinellia canopy with 480
its high stem flexibility withstood the hydrodynamic forces without substantial damage (Fig. 7) 481
whereas the Elymus canopy with its low flexibility experienced severe physical damage in the course 482
of the experiment (Fig. 6). Folding and breakage of Elymus stems around 5 – 10 cm above the 483
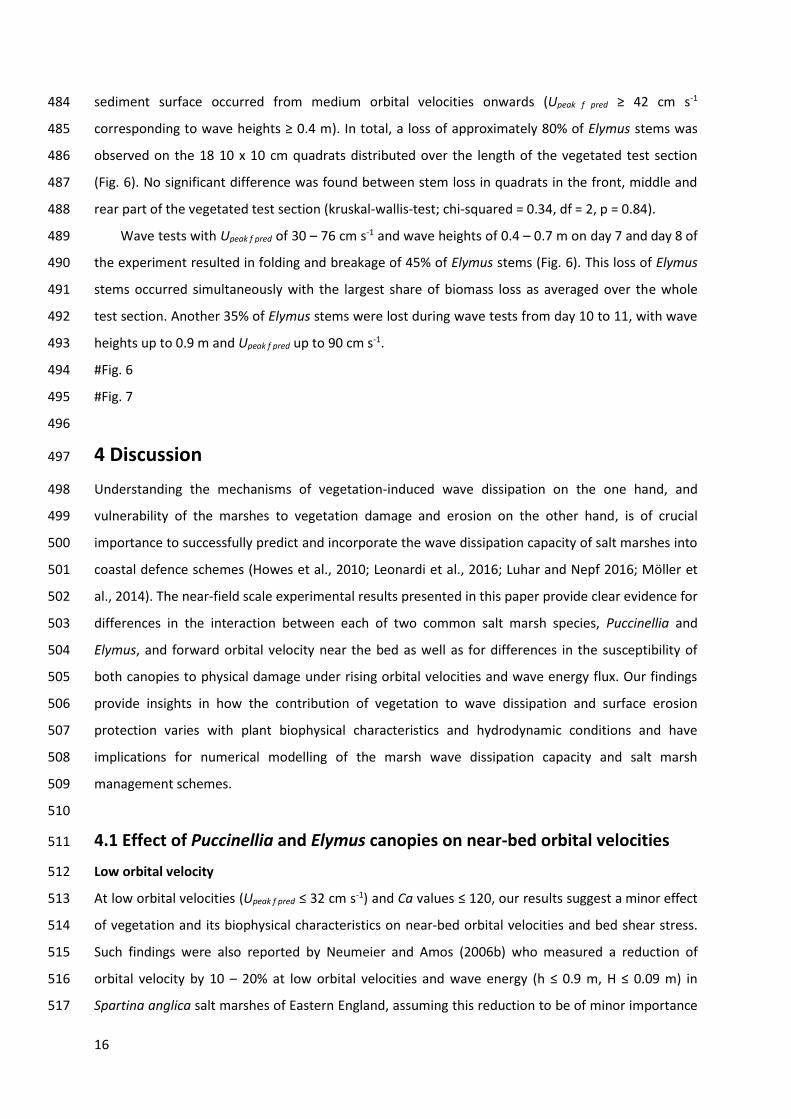
16
sediment surface occurred from medium orbital velocities onwards (Upeak f pred ≥ 42 cm s-1 484
corresponding to wave heights ≥ 0.4 m). In total, a loss of approximately 80% of Elymus stems was 485
observed on the 18 10 x 10 cm quadrats distributed over the length of the vegetated test section 486
(Fig. 6). No significant difference was found between stem loss in quadrats in the front, middle and 487
rear part of the vegetated test section (kruskal-wallis-test; chi-squared = 0.34, df = 2, p = 0.84). 488
Wave tests with Upeak f pred of 30 – 76 cm s-1 and wave heights of 0.4 – 0.7 m on day 7 and day 8 of 489
the experiment resulted in folding and breakage of 45% of Elymus stems (Fig. 6). This loss of Elymus 490
stems occurred simultaneously with the largest share of biomass loss as averaged over the whole 491
test section. Another 35% of Elymus stems were lost during wave tests from day 10 to 11, with wave 492
heights up to 0.9 m and Upeak f pred up to 90 cm s-1. 493
#Fig. 6 494
#Fig. 7 495
496
4 Discussion 497
Understanding the mechanisms of vegetation-induced wave dissipation on the one hand, and 498
vulnerability of the marshes to vegetation damage and erosion on the other hand, is of crucial 499
importance to successfully predict and incorporate the wave dissipation capacity of salt marshes into 500
coastal defence schemes (Howes et al., 2010; Leonardi et al., 2016; Luhar and Nepf 2016; Möller et 501
al., 2014). The near-field scale experimental results presented in this paper provide clear evidence for 502
differences in the interaction between each of two common salt marsh species, Puccinellia and 503
Elymus, and forward orbital velocity near the bed as well as for differences in the susceptibility of 504
both canopies to physical damage under rising orbital velocities and wave energy flux. Our findings 505
provide insights in how the contribution of vegetation to wave dissipation and surface erosion 506
protection varies with plant biophysical characteristics and hydrodynamic conditions and have 507
implications for numerical modelling of the marsh wave dissipation capacity and salt marsh 508
management schemes. 509
510
4.1 Effect of Puccinellia and Elymus canopies on near-bed orbital velocities 511
Low orbital velocity 512
At low orbital velocities (Upeak f pred ≤ 32 cm s-1) and Ca values ≤ 120, our results suggest a minor effect 513
of vegetation and its biophysical characteristics on near-bed orbital velocities and bed shear stress. 514
Such findings were also reported by Neumeier and Amos (2006b) who measured a reduction of 515
orbital velocity by 10 – 20% at low orbital velocities and wave energy (h ≤ 0.9 m, H ≤ 0.09 m) in 516
Spartina anglica salt marshes of Eastern England, assuming this reduction to be of minor importance 517
17
for the deposition and erosion of sediments. Wave damping was also observed to be lower for waves 518
of smaller height than for more energetic waves in Maza et al.’s (2015) laboratory experiment, in 519
which Spartina anglica and Puccinellia maritima species were subjected to waves of between 0.12 520
and 0.2 m height in < 1.0 m water depth. 521
Medium orbital velocity 522
At medium orbital velocities (Upeak f pred 42 ≤ Upeak f pred ≤ 63 cm s-1) and 141 ≤ Ca ≤ 473 we found 523
larger differences in the effect of Puccinellia and Elymus on orbital velocity, caused by a different 524
degree of ‘canopy flattening’ and different susceptibility to stem folding between the two canopies. 525
Differences in the response of Puccinellia and Elymus to medium orbital velocities are also reflected 526
by larger differences in values of Ca between both canopies, compared to low orbital velocities. 527
Lower values of Ca in Puccinellia in comparison to Elymus imply a greater ability of Puccinellia to re-528
orientation after bending and hence a higher flow resistance. This holds true under a water depth of 529
2 m and long wave periods (4.1 s), when stem folding was observed for the first time in Elymus. Here 530
we found no significant effect of Elymus on orbital velocity. By contrast, Puccinellia caused a 531
considerable decline in orbital velocity (-35%), a decrease that may enhance sediment deposition and 532
decrease bed shear stress. In the field, reduction of orbital velocity by Puccinellia could even be 533
higher given the lower stem flexibility of Puccinellia in the field compared to the flume (Table 1). In 534
all of the other tests at medium orbital velocity however, higher orbital velocity in Puccinellia 535
suggests a lower flow resistance compared to Elymus. This is presumably because the onset of whip-536
like movement occurred in Puccinellia at lower (medium) orbital velocity than in Elymus, an effect 537
that could not be captured by the calculation of Ca. 538
The transition from swaying to whip-like movement occurred in Puccinellia at a value of Ca = 319 539
and L = 0.6 and hence at a greater wave orbital excursion and higher orbital velocities as assumed for 540
flexible aquatic vegetation, where properties of whip-like movement are postulated to only start to 541
occur at L values of = 1 (Luhar and Nepf, 2016). In Elymus the transition to whip-like movement 542
occurred at Ca = 664 and L = 1.8, suggesting that folding of stems may favour the onset of whip-like 543
movement. 544
High orbital velocity 545
At high orbital velocities (Upeak f pred ≥ 74 cm s-1) and 449 ≤ Ca ≤ 994 both Puccinellia and Elymus 546
caused an increase of orbital velocity compared to mowed conditions and exhibited a whip-like 547
movement. The reconfiguration of canopies to a flattened ‘shielding’ posture, close to the soil 548
surface for a large part of the wave cycle, can be expected to protect the bed from erosive processes. 549
However, high orbital velocities above the canopy may reduce the chance of sediment particles 550
settling on the bed, thus leading to a passive protective role of the canopy rather than an active 551
sediment-enhancing role (Neumeier and Ciavola 2004; Peralta et al., 2008). 552
18
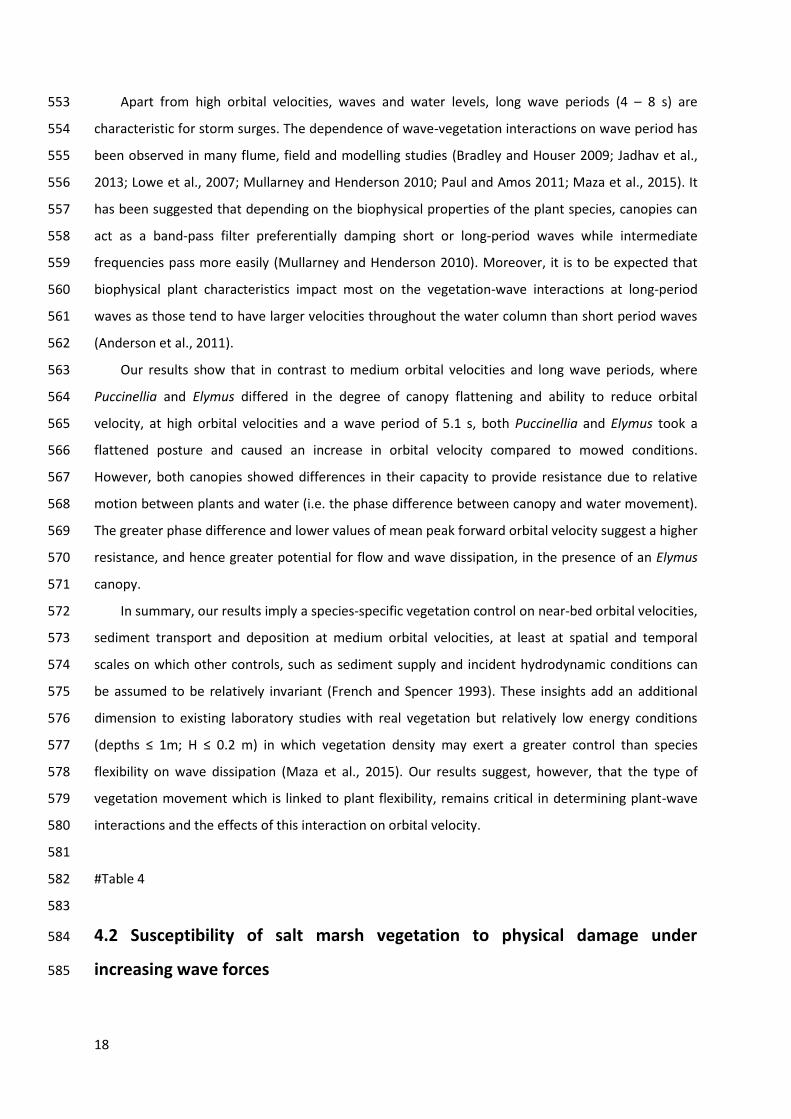
Apart from high orbital velocities, waves and water levels, long wave periods (4 – 8 s) are 553
characteristic for storm surges. The dependence of wave-vegetation interactions on wave period has 554
been observed in many flume, field and modelling studies (Bradley and Houser 2009; Jadhav et al., 555
2013; Lowe et al., 2007; Mullarney and Henderson 2010; Paul and Amos 2011; Maza et al., 2015). It 556
has been suggested that depending on the biophysical properties of the plant species, canopies can 557
act as a band-pass filter preferentially damping short or long-period waves while intermediate 558
frequencies pass more easily (Mullarney and Henderson 2010). Moreover, it is to be expected that 559
biophysical plant characteristics impact most on the vegetation-wave interactions at long-period 560
waves as those tend to have larger velocities throughout the water column than short period waves 561
(Anderson et al., 2011). 562
Our results show that in contrast to medium orbital velocities and long wave periods, where 563
Puccinellia and Elymus differed in the degree of canopy flattening and ability to reduce orbital 564
velocity, at high orbital velocities and a wave period of 5.1 s, both Puccinellia and Elymus took a 565
flattened posture and caused an increase in orbital velocity compared to mowed conditions. 566
However, both canopies showed differences in their capacity to provide resistance due to relative 567
motion between plants and water (i.e. the phase difference between canopy and water movement). 568
The greater phase difference and lower values of mean peak forward orbital velocity suggest a higher 569
resistance, and hence greater potential for flow and wave dissipation, in the presence of an Elymus 570
canopy. 571
In summary, our results imply a species-specific vegetation control on near-bed orbital velocities, 572
sediment transport and deposition at medium orbital velocities, at least at spatial and temporal 573
scales on which other controls, such as sediment supply and incident hydrodynamic conditions can 574
be assumed to be relatively invariant (French and Spencer 1993). These insights add an additional 575
dimension to existing laboratory studies with real vegetation but relatively low energy conditions 576
(depths ≤ 1m; H ≤ 0.2 m) in which vegetation density may exert a greater control than species 577
flexibility on wave dissipation (Maza et al., 2015). Our results suggest, however, that the type of 578
vegetation movement which is linked to plant flexibility, remains critical in determining plant-wave 579
interactions and the effects of this interaction on orbital velocity. 580
581
#Table 4 582
583
4.2 Susceptibility of salt marsh vegetation to physical damage under 584
increasing wave forces 585
19
Throughout the experiment the salt marsh vegetation canopy as a whole experienced moderate 586
physical damage and the sediment surface withstood large wave forces without substantial erosion 587
(Möller et al., 2014; Spencer et al., 2016). This suggests a high resilience of sediment surfaces under a 588
vegetated salt marsh canopy to storm surge conditions. With the root mat remaining intact, damage 589
to the vegetation canopy reported in this paper can be considered to be of a temporary nature 590
meaning that recovery may be expected during the next growing season. This is especially valid for 591
plant species that can reproduce by clonal growth, a characteristic of both the grass species 592
investigated in this study. However, recovery is unlikely to occur between storms clustered over a 593
short interval in the order of weeks, particularly likely in northern winter months when most storm 594
surges occur (Cusack, 2016). The latter may have implications for the coastal protection value of the 595
marsh for reoccurring storms or storms of longer duration (several days). Indeed a recent global 596
analysis on salt marsh erosion and wave measurements by Leonardi et al., (2016) revealed that most 597
of salt marsh deterioration is caused by moderate storms of a monthly frequency while violent 598
storms and hurricanes occurring at a decadal timescale contribute less than 1% to long-term salt 599
marsh erosion rates. Moreover interior marsh surfaces as investigated in our study have been shown 600
to be much less responsive to wave action than fringing marshes (Fagherazzi 2013; Fagherazzi et al., 601
2013; Feagin et al., 2009). Further studies are needed to investigate the links between vegetation 602
and root system characteristics, organic matter dynamics and the erosion stability of marsh edges. 603
The canopies of Puccinellia and Elymus differed in their susceptibility to stem folding and 604
breakage under increasing orbital velocities and wave energy flux. The very low amount of physical 605
damage occurring to Puccinellia can be attributed to its very flexible stems allowing reconfiguration 606
of the canopy to a flat shielding posture close to the bed under high orbital velocities (cf. 607
observations in Bouma et al. 2010; Bouma et al. 2013). A similar strategy to survive under high flow 608
and wave-induced velocities by avoiding high drag forces through reconfiguration is also known for 609
flexible sea grasses (Infantes et al., 2011; Peralta et al., 2008) and freshwater macrophytes (O'Hare et 610
al., 2007; Puijalon et al., 2011; Robionek et al., 2015). 611
Providing low flow resistance, the direct contribution to hydrodynamic energy dissipation by 612
very flexible plants is small. At the water-sediment interface, however, the flattened plant canopies 613
under high velocities, reduce friction forces and contribute, along with plant roots and sediment 614
organic matter content, to the stabilization of sediment surface and long-term marsh stability 615
(Neumeier and Ciavola 2004; Peralta et al., 2008). 616
In contrast to Puccinellia, the less flexible and tall Elymus canopy experienced folding and 617
subsequent breakage of stems from medium orbital velocities and above. Turbulence around stumps 618
remaining on the marsh surface after stem breakage can increase bed shear stress and bed erosion 619
through local scour. This is confirmed by a study of Spencer et al., (2016) who investigated soil 620
20
surface elevation change in the framework of the present flume experiment. They found surfaces 621
covered by the flattened canopy of Puccinellia experienced a lower and less variable elevation loss 622
than those characterized by Elymus. The susceptibility of Elymus stems to breakage in the field under 623
high orbital velocity may be even higher than that observed in this experiment. On the other hand, 624
the cumulative effects of wave forces on the Elymus canopy could also imply that the stem loss 625
experienced at medium orbital velocities enhanced the susceptibility of Elymus to folding and 626
breakage at high orbital velocities compared to similar velocities under field conditions. 627
Physical damage and hence a decline in flow resistance of Elymus from medium orbital velocities 628
onwards observed in this study coincided with a leveling-off in the wave-dissipation capacity of the 629
vegetated test section as a whole (Möller et al., 2014). With Elymus covering the largest part of the 630
vegetated test section (around 70%) in this flume experiment, this result suggests that changes in 631
vegetation-wave interactions may exert an important control on wave dissipation by salt marshes 632
under increasing orbital velocities and wave energy flux. 633
634
5 Conclusions 635
In this paper, we investigated salt marsh vegetation-wave interactions over a wide range of wave 636
conditions, from low to high wave orbital velocities and wave energy flux and in a near-field scale 637
flume experiment. The results of our study show that canopy height and flexibility, as well as incident 638
wave heights, wave periods and water depth, play an important role in the way vegetation interacts 639
with waves. Furthermore, for the conditions and plant species tested here, the ability of vegetation 640
to reduce near-bed wave orbital velocities and vegetation susceptibility to breakage varied with plant 641
biophysical characteristics from an orbital velocity of 42 cm s-1 onwards. To profit from the benefits 642
that plant species differing in biophysical characteristics provide in terms of wave dissipation and 643
surface erosion protection under storm surge conditions, management schemes should aim for the 644
maintenance of plant species diversity. Given the large variability in biophysical properties between 645
salt marsh plant species (Feagin et al., 2011; Rupprecht et al., 2015a) it is recommended that further 646
studies focus on the behavior of a wider range of salt marsh canopies, ideally under the full range of 647
water depth and wave conditions that can be expected to occur on coasts periodically impacted by 648
severe storms. While Elymus athericus and Puccinellia maritima are common species in the NW 649
European region, the occurrence of mono-specific stands of Spartina anglica and Spartina 650
alterniflora along the coastline of the United States and China, as well as NW Europe, calls for a 651
separate investigation of vegetation-wave interactions in these types of marshes. Such studies are 652
needed because these species often feature in coastal wetland creation schemes (Borsje et al., 2011; 653
Kabat et al., 2009; Temmerman et al., 2013). Knowledge on species-specific thresholds of orbital 654
velocities and wave energy flux marking changes in flow resistance, as well as future studies 655
21
providing such thresholds for mixed canopies, might then inform modelling studies generating 656
predictions of marsh stability and resilience over longer time-scales, feeding into the growing body of 657
knowledge that will ultimately allow salt marshes to be fully and effectively incorporated into coastal 658
protection schemes. 659
660
Acknowledgements 661
We thank all of the staff at the Großer Wellenkanal as well as B. Evans, J. Tempest, K. Milonidis and C. 662
Edwards, Cambridge University, and D. Schulze, Hamburg University, for their invaluable logistical 663
assistance, Fitzwilliam College for supporting the research time of I.M., and C. Rolfe, Cambridge 664
University, for the soil analysis and Deltares for the support by the Strategic Research Programme on 665
dikes, levees and dams. M.P. acknowledges funding by the German Science Foundation (grant no. PA 666
2547/1-1). The work described in this publication was supported by the European Community’s 7th 667
Framework Programme through the grant to the budget of the Integrating Activity HYDRALAB IV, 668
Contract no. 261529 and by a grant from The Isaac Newton Trust, Trinity College, Cambridge. 669
670
22
References 671
Aberle, J.; Jarvela, J. Flow resistance of emergent rigid and flexible floodplain vegetation. J Hydraul 672 Res. 51:33-45; 2013 673
Anderson, M.E.; Smith, J.M. Wave attenuation by flexible, idealized salt marsh vegetation. Coastal 674 Engineering. 83:82-92; 2014 675
Anderson, M.E.; Smith McKee, J.; Keyle McKay, S. Wave Dissipation by Vegetation.Coastal and 676 Hydraulics Engineering Technical Note ERDC/CHL CHETN-I-82, Vicksburg MS, U.S. Army 677 Engineer Research and Development Center; 2011 678
Augustin, L.N.; Irish, J.L.; Lynett, P. Laboratory and numerical studies of wave damping by emergent 679 and near-emergent wetland vegetation. Coastal Engineering. 56:332-340; 2009 680
Bockelmann, A.C.; Neuhaus, R. Competitive exclusion of Elymus athericus from a high-stress habitat 681 in a European salt marsh. Journal of Ecology. 87:503-513; 1999 682
Borsje, B.W.; van Wesenbeeck, B.K.; Dekker, F.; Paalvast, P.; Bouma, T.J.; van Katwijk, M.M.; de Vries, 683 M.B. How ecological engineering can serve in coastal protection. Ecological Engineering. 684 37:113-122; 2010 685
Bouma, T.J.; De Vries, M.B.; Herman, P.M.J. Comparing ecosystem engineering efficiency of two plant 686 species with contrasting growth strategies. Ecology. 91:2696-2704; 2010 687
Bouma, T.J.; De Vries, M.B.; Low, E.; Peralta, G.; Tanczos, C.; Van de Koppel, J.; Herman, P.M.J. Trade-688 offs related to ecosystem engineering: A case study on stiffness of emerging macrophytes. 689 Ecology. 86:2187-2199; 2005 690
Bouma, T.J.; van Belzen, J.; Balke, T.; Zhu, Z.; Airoldi, L.; Blight, A.J.; Davies, A.J.; Galvan, C.; Hawkins, 691 S.J.; Hoggart, S.P.G.; Lara, J.L.; Losada, I.J.; Maza, M.; Ondiviela, B.; Skov, M.W.; Strain, E.M.; 692 Thompson, R.C.; Yang, S.; Zanuttigh, B.; Zhang, L.; Herman, P.M.J. Identifying knowledge gaps 693 hampering application of intertidal habitats in coastal protection: Opportunities & steps to 694 take. Coastal Engineering. 87:147-157; 2014 695
Bradley, K.; Houser, C. Relative velocity of seagrass blades: Implications for wave attenuation in low-696 energy environments. Journal of Geophysical Research-Earth Surface. 114; 2009 697
Cahoon, D.R. A review of major storm impacts on coastal wetland elevations. Estuaries and Coasts. 698 29:889-898; 2006 699
Chen, S.-N.; Sanford, L.P.; Koch, E.W.; Shi, F.; North, E.W. A nearshore model to investigate the 700 effects of seagrass bed geometry on wave attenuation and suspended sediment transport. 701 Estuaries and Coasts. 30:296-310; 2007 702
Dijkstra, J.T.; Uittenbogaard, R.E. Modeling the interaction between flow and highly flexible aquatic 703 vegetation. Water Resources Research. 46; 2010 704
Duarte, C.M.; Losada, I.J.; Hendriks, I.E.; Mazarrasa, I.; Marbà, N. The role of coastal plant 705 communities for climate change mitigation and adaptation. Nature Climate Change. 3:961-706 968; 2013 707
Fagherazzi, S. The ephemeral life of a salt marsh. Geology. 41:943-944; 2013 708 Fagherazzi, S.; Mariotti, G.; Wiberg, P.L.; McGlathery, K.J. Marsh collapse does not require sea level 709
rise. Oceanography. 26:70-77; 2013 710 Feagin, R.A.; Irish, J.L.; Möller, I.; Williams, A.M.; Colon-Rivera, R.J.; Mousavi, M.E. Short 711
communication: Engineering properties of wetland plants with application to wave 712 attenuation. Coastal Engineering. 58:251-255; 2011 713
Feagin, R.A.; Lozada-Bernard, S.M.; Ravens, T.M.; Moeller, I.; Yeager, K.M.; Baird, A.H. Does 714 vegetation prevent wave erosion of salt marsh edges? Proceedings Of The National Academy 715 Of Sciences Of The United States Of America. 106:10109-10113; 2009 716
Fonseca, M.S.; Cahalan, J.A. A preliminary evaluation of wave attenuation by four species of seagrass. 717 Estuarine Coastal and Shelf Science. 35:565-576; 1992 718
French, J.R.; Spencer, T. Dynamics of sedimentation in a tide-dominated backbarrier salt-marsh, 719 Norfolk, UK. Marine Geology. 110:315-331; 1993 720
23
Gaylord, B.; Denny, M.W. Flow and flexibility - I. Effects of size, shape and stiffness in determining 721 wave forces on the stipitate kelps Eisenia arborea and Pterygophora californica. Journal of 722 Experimental Biology. 200:3141-3164; 1997 723
Gedan, K.B.; Kirwan, M.L.; Wolanski, E.; Barbier, E.B.; Silliman, B.R. The present and future role of 724 coastal wetland vegetation in protecting shorelines: answering recent challenges to the 725 paradigm. Climatic Change. 106:7-29; 2011 726
Heuner, M.; Silinski, A.; Schoelynck, J.; Bouma, T.J.; Puijalon, S.; Troch, P.; Fuchs, E.; Schroder, B.; 727 Schroder, U.; Meire, P.; Temmerman, S. Ecosystem Engineering by Plants on Wave-Exposed 728 Intertidal Flats Is Governed by Relationships between Effect and Response Traits. Plos One. 729 10; 2015 730
Howes, N.C.; FitzGerald, D.M.; Hughes, Z.J.; Georgiou, I.Y.; Kulp, M.A.; Miner, M.D.; Smith, J.M.; 731 Barras, J.A. Hurricane-induced failure of low salinity wetlands. Proceedings of the National 732 Academy of Sciences of the United States of America. 107:14014-14019; 2010 733
Infantes, E.; Orfila, A.; Bouma, T.J.; Simarro, G.; Terrados, J. Posidonia oceanica and Cymodocea 734 nodosa seedling tolerance to wave exposure. Limnology and Oceanography. 56:2223-2232; 735 2011 736
Jadhav, R.S.; Chen, Q.; Smith, J.M. Spectral distribution of wave energy dissipation by salt marsh 737 vegetation. Coastal Engineering. 77:99-107; 2013 738
Kabat, P.; Fresco, L.O.; Stive, M.J.F.; Veerman, C.P.; van Alphen, J.S.L.J.; Parmet, B.W.A.H.; Hazeleger, 739 W.; Katsman, C.A. Dutch coasts in transition. Nature Geoscience. 2:450-452; 2009 740
Kirwan, M.L.; Temmerman, S.; Skeehan, E.E.; Guntenspergen, G.R.; Fagherazzi, S. Overestimation of 741 marsh vulnerability to sea level rise. Nature Climate Change. 6:253-260; 2016 742
Koch, E.W.; Barbier, E.B.; Silliman, B.R.; Reed, D.J.; Perillo, G.M.E.; Hacker, S.D.; Granek, E.F.; 743 Primavera, J.H.; Muthiga, N.; Polasky, S.; Halpern, B.S.; Kennedy, C.J.; Kappel, C.V.; Wolanski, 744 E. Non-linearity in ecosystem services: temporal and spatial variability in coastal protection. 745 Frontiers in Ecology and the Environment. 7:29-37; 2009 746
Leonard, L.A.; Croft, A.L. The effect of standing biomass on flow velocity and turbulence in Spartina 747 alterniflora canopies. Estuarine Coastal and Shelf Science. 69:325-336; 2006 748
Leonard, L.A.; Reed, D.J. Hydrodynamics and Sediment Transport Through Tidal Marsh Canopies. 749 Journal of Coastal Research:459-469; 2002 750
Leonardi, N.; Ganju, N.K.; Fagherazzi, S. A linear relationship between wave power and erosion 751 determines salt-marsh resilience to violent storms and hurricanes. Proceedings of the 752 National Academy of Sciences of the United States of America. 113:64-68; 2016 753
Lowe, R.J.; Falter, J.L.; Koseff, J.R.; Monismith, S.G.; Atkinson, M.J. Spectral wave flow attenuation 754 within submerged canopies: Implications for wave energy dissipation. J Geophys Res-Oceans. 755 112; 2007 756
Luhar, M.; Nepf, H.M. Flow-induced reconfiguration of buoyant and flexible aquatic vegetation. 757 Limnology and Oceanography. 56:2003-2017; 2011 758
Luhar, M.; Nepf, H.M. Wave-induced dynamics of flexible blades. Journal of Fluids and Structures. 759 61:20-41; 2016 760
Manca, E. Effects of Posidonia oceanica seagrass on nearshore waves and wave-induced flows. PhD 761 thesis, University of Southampton. Southampton, UK.: University of Southampton; 2010 762
McLeod, E.; Chmura, G.L.; Bouillon, S.; Salm, R.; Bjork, M.; Duarte, C.M.; Lovelock, C.E.; Schlesinger, 763 W.H.; Silliman, B.R. A blueprint for blue carbon: toward an improved understanding of the 764 role of vegetated coastal habitats in sequestering CO2. Frontiers in Ecology and the 765 Environment. 9:552-560; 2011 766
Mendez, F.J.; Losada, I.J. An empirical model to estimate the propagation of random breaking and 767 nonbreaking waves over vegetation fields. Coastal Engineering. 51:103-118; 2004 768
Möller, I.; Kudella, M.; Rupprecht, F.; Spencer, T.; Paul, M.; van Wesenbeeck, B.K.; Wolters, G.; 769 Jensen, K.; Bouma, T.J.; Miranda-Lange, M.; Schimmels, S. Wave attenuation over coastal salt 770 marshes under storm surge conditions. Nature Geoscience. 7:727-731; 2014 771
24
Möller, I.; Spencer, T.; French, J.R. Wind Wave Attenuation over Saltmarsh Surfaces: Preliminary 772 Results from Norfolk, England. Journal of Coastal Research. 12:1009-1016; 1997 773
Möller, I.; Spencer, T.; French, J.R.; Leggett, D.J.; Dixon, M. Wave transformation over salt marshes: A 774 field and numerical modelling study from north Norfolk, England. Estuarine, Coastal and 775 Shelf Science. 49:411-426; 1999 776
Mullarney, J.C.; Henderson, S.M. Wave-forced motion of submerged single-stem vegetation. J 777 Geophys Res-Oceans. 115:C12061. doi:12010.11029/12010JC006448; 2010 778
Neumeier, U.; Amos, C.L. The influence of vegetation on turbulence and flow velocities in European 779 salt-marshes. Sedimentology. 53:259-277; 2006a 780
Neumeier, U.; Amos, C.L. Turbulence reduction by the canopy of coastal Spartina salt-marshes. 781 Journal of Coastal Research. SI39:433-439; 2006b 782
Neumeier, U.; Ciavola, P. Flow resistance and associated sedimentary processes in a Spartina 783 maritima salt-marsh. Journal of Coastal Research. 20:435-447; 2004 784
O'Hare, M.T.; Hutchinson, K.A.; Clarke, R.T. The drag and reconfiguration experienced by five 785 macrophytes from a lowland river. Aquatic Botany. 86:253-259; 2007 786
Paul, M.; Amos, C.L. Spatial and seasonal variation in wave attenuation over Zostera noltii. J Geophys 787 Res-Oceans. 116:C08019; 2011 788
Paul, M.; Bouma, T.J.; Amos, C.L. Wave attenuation by submerged vegetation: combining the effect 789 of organism traits and tidal current. Marine Ecology Progress Series. 444:31-41; 2012 790
Paul, M.; Rupprecht, F.; Möller, I.; Bouma, T.J.; Spencer, T.; Kudella, M.; Wolters, G.; van 791 Wesenbeeck, B.K.; Jensen, K.; Miranda-Lange, M.; Schimmels, S. Plant stiffness and biomass 792 as drivers for drag forces under extreme wave loading: A flume study on mimics. Coastal 793 Engineering. 117:70–78; 2016 794
Peralta, G.; van Duren, L.A.; Morris, E.P.; Bouma, T.J. Consequences of shoot density and stiffness for 795 ecosystem engineering by benthic macrophytes in flow dominated areas: a hydrodynamic 796 flume study. Marine Ecology Progress Series. 368:103-115; 2008 797
Puijalon, S.; Bouma, T.J.; Douady, C.J.; van Groenendael, J.; Anten, N.P.R.; Martel, E.; Bornette, G. 798 Plant resistance to mechanical stress: evidence of an avoidance-tolerance trade-off. New 799 Phytologist. 191:1141-1149; 2011 800
Riffe, K.C.; Henderson, S.M.; Mullarney, J.C. Wave dissipation by flexible vegetation. Geophysical 801 Research Letters. 38; 2011 802
Robionek, A.; Banas, K.; Chmara, R.; Szmeja, J. The avoidance strategy of environmental constraints 803 by an aquatic plant Potamogeton alpinus in running waters. Ecol Evol. 5:3327-3337; 2015 804
Rupprecht, F.; Möller, I.; Evans, B.; Spencer, T.; Jensen, K. Biophysical properties of salt marsh 805 canopies - Quantifying plant stem flexibility and above ground biomass Coastal Engineering 806 DOI: 10.1016/j.coastaleng.2015.1003.1009; 2015a 807
Rupprecht, F.; Wanner, A.; Stock, M.; Jensen, K. Succession in salt marshes – large-scale and long-808 term patterns after abandonment of grazing and drainage. Applied Vegetation Science. 809 18:86-98; 2015b 810
Sand-Jensen, K. Drag and reconfiguration of freshwater macrophytes. Freshwater Biology. 48:271-811 283; 2003 812
Schuerch, M.; Vafeidis, A.; Slawig, T.; Temmerman, S. Modeling the influence of changing storm 813 patterns on the ability of a salt marsh to keep pace with sea level rise. Journal of Geophysical 814 Research-Earth Surface. 118:84-96; 2013 815
Silinski, A.; Heuner, M.; Schoelynck, J.; Puijalon, S.; Schroder, U.; Fuchs, E.; Troch, P.; Bouma, T.J.; 816 Meire, P.; Temmerman, S. Effects of Wind Waves versus Ship Waves on Tidal Marsh Plants: A 817 Flume Study on Different Life Stages of Scirpus maritimus. Plos One. 10:16; 2015 818
Spencer, T.; Moller, I.; Rupprecht, F.; Bouma, T.J.; van Wesenbeeck, B.K.; Kudella, M.; Paul, M.; 819 Jensen, K.; Wolters, G.; Miranda-Lange, M.; Schimmels, S. Salt marsh surface survives true-to-820 scale simulated storm surges. Earth Surface Processes and Landforms. 41:543-552; 2016 821
Stewart, H.L. Hydrodynamic consequences of flexural stiffness and buoyancy for seaweeds: a study 822 using physical models. Journal of Experimental Biology. 209:2170-2181; 2006 823
25
Stumpf, R.P. The process of sedimentation on the surface of a salt-marsh. Estuarine Coastal and Shelf 824 Science. 17:495-508; 1983 825
Temmerman, S.; Bouma, T.J.; Govers, G.; Wang, Z.B.; De Vries, M.B.; Herman, P.M.J. Impact of 826 vegetation on flow routing and sedimentation patterns: Three-dimensional modeling for a 827 tidal marsh. Journal of Geophysical Research-Earth Surface. 110:F04019; 2005 828
Temmerman, S.; Meire, P.; Bouma, T.J.; Herman, P.M.J.; Ysebaert, T.; De Vriend, H.J. Ecosystem-829 based coastal defence in the face of global change. Nature. 504:79-83; 2013 830
Turner, R.E.; Baustian, J.J.; Swenson, E.M.; Spicer, J.S. Wetland sedimentation from Hurricanes 831 Katrina and Rita. Science. 314:449-452; 2006 832
Valéry, L.; Bouchard, V.; Lefeuvre, J.C. Impact of the invasive native species Elymus athericus on 833 carbon pools in a salt marsh. Wetlands. 24:268-276; 2004 834
Veeneklaas, R.M.; Dijkema, K.S.; Hecker, N.; Bakker, J.P. Spatio-temporal dynamics of the invasive 835 plant species Elytrigia atherica on natural salt marshes. Applied Vegetation Science. 16:205-836 216; 2013 837
Yang, S.L.; Shi, B.W.; Bouma, T.J.; Ysebaert, T.; Luo, X.X. Wave attenuation at a salt marsh margin: A 838 case study of an exposed coast on the Yangtze Estuary. Estuaries and Coasts. 35:169-182; 839 2012 840
841
842
843
26
Figures 844
Figure 1 845
846
847
848
849
850
851
852
853
854
855
856
857
858
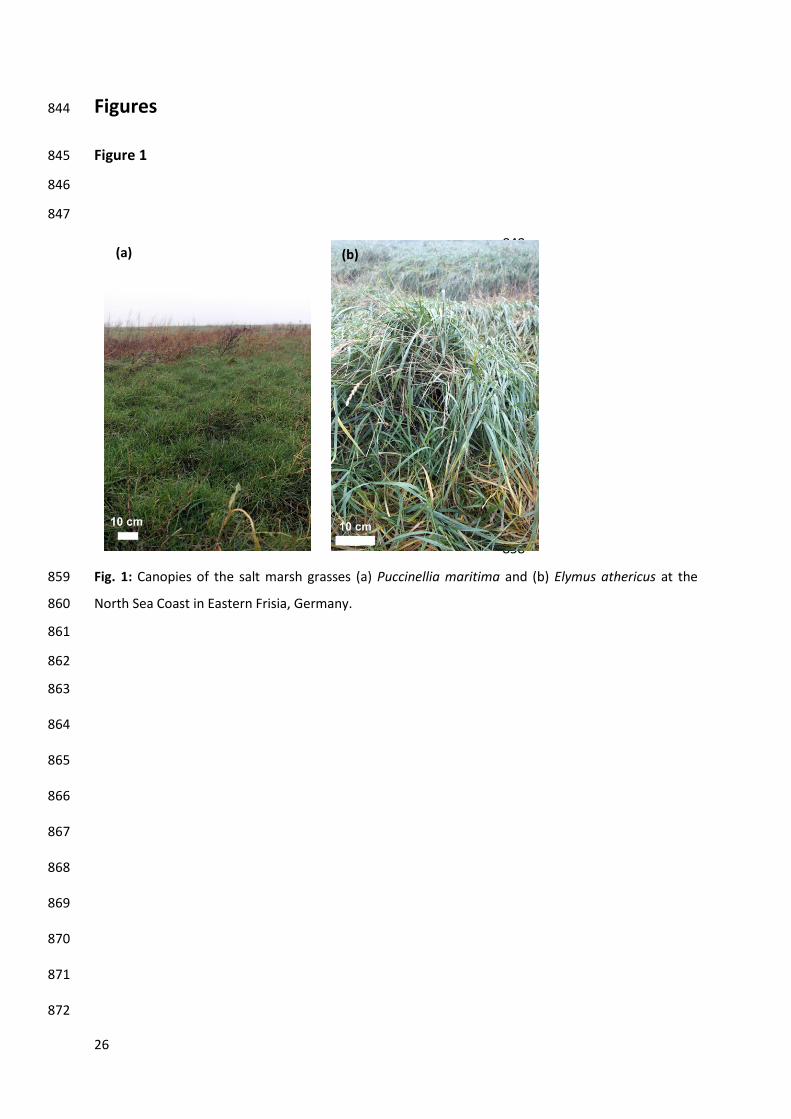
Fig. 1: Canopies of the salt marsh grasses (a) Puccinellia maritima and (b) Elymus athericus at the 859
North Sea Coast in Eastern Frisia, Germany. 860
861
862
863
864
865
866
867
868
869
870
871
872
(a) (b)

27
Figure 2 873
874
875
Fig. 2: Large scale flume experiment conducted by Möller et al. (2014). (a) General experimental 876
setup in the GWK (Großer Wellenkanal, Hannover) wave flume, (b) top view of the flume section 877
where vegetation-wave interactions in the canopy of Puccinellia and Elymus were analyzed. 878
879
880
28
Figure 3 881
882
883
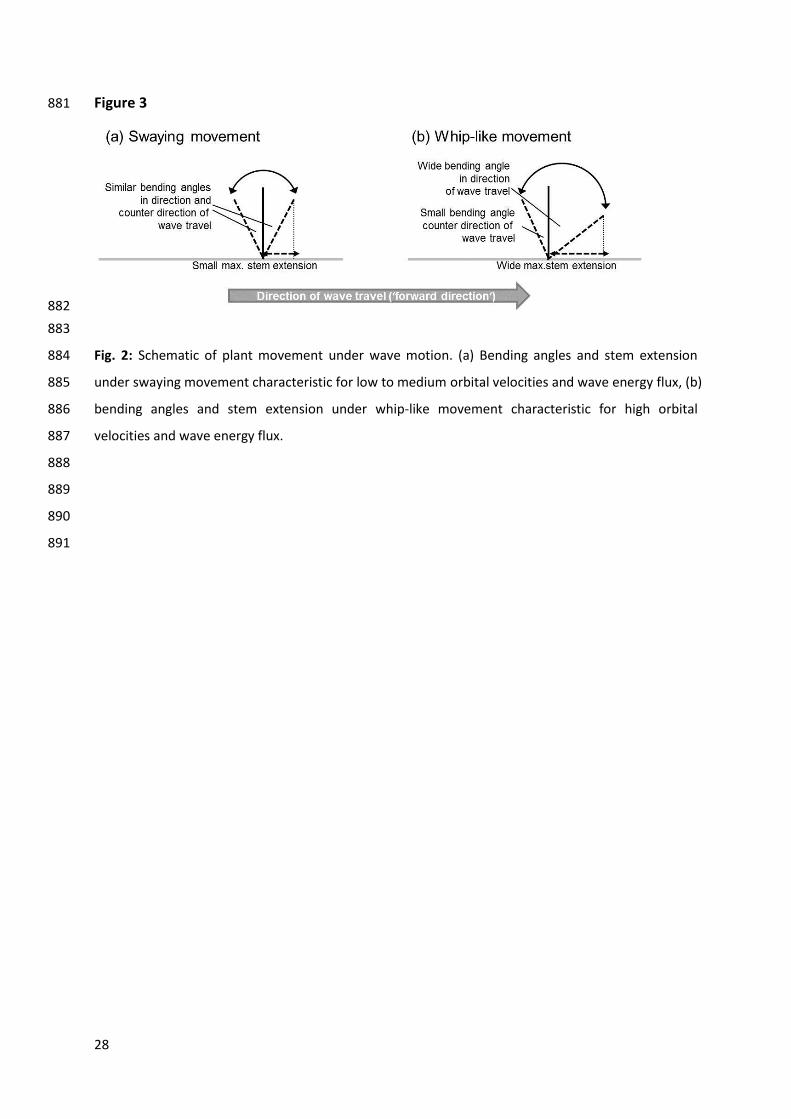
Fig. 2: Schematic of plant movement under wave motion. (a) Bending angles and stem extension 884
under swaying movement characteristic for low to medium orbital velocities and wave energy flux, (b) 885
bending angles and stem extension under whip-like movement characteristic for high orbital 886
velocities and wave energy flux. 887
888
889
890
891
29
Figure 4 892
893
894
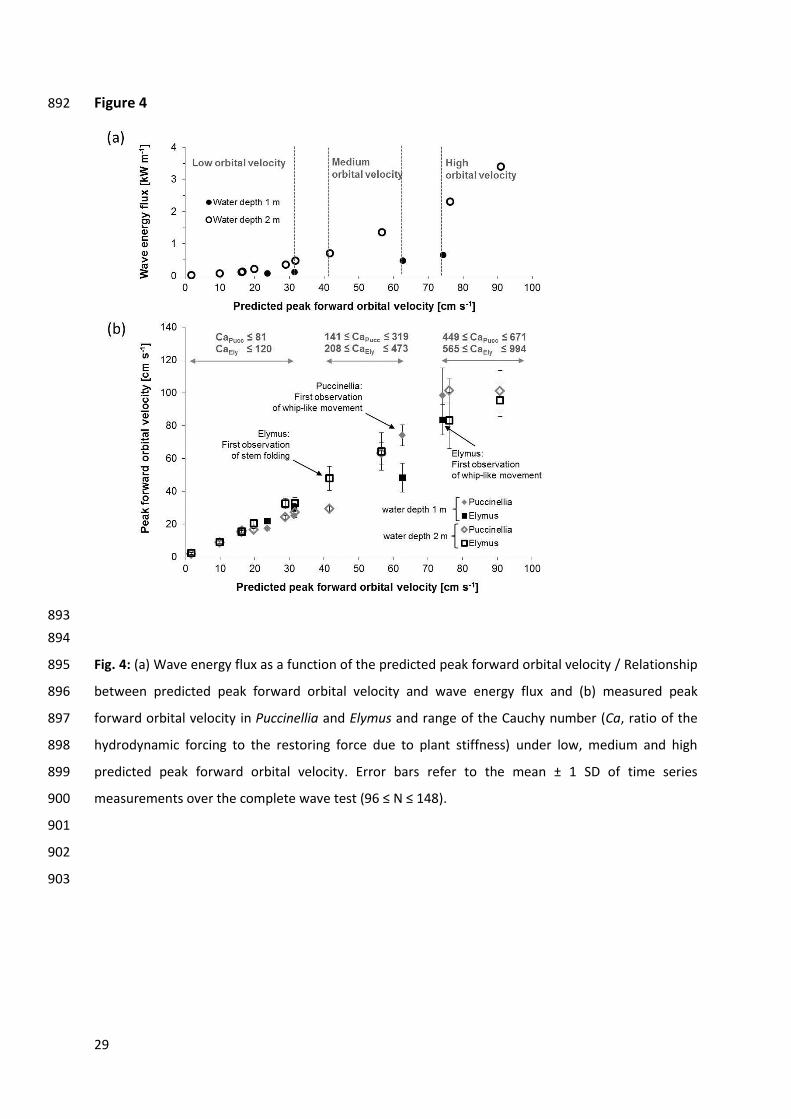
Fig. 4: (a) Wave energy flux as a function of the predicted peak forward orbital velocity / Relationship 895
between predicted peak forward orbital velocity and wave energy flux and (b) measured peak 896
forward orbital velocity in Puccinellia and Elymus and range of the Cauchy number (Ca, ratio of the 897
hydrodynamic forcing to the restoring force due to plant stiffness) under low, medium and high 898
predicted peak forward orbital velocity. Error bars refer to the mean ± 1 SD of time series 899
measurements over the complete wave test (96 ≤ N ≤ 148). 900
901
902
903
30
Figure 5 904
905
906
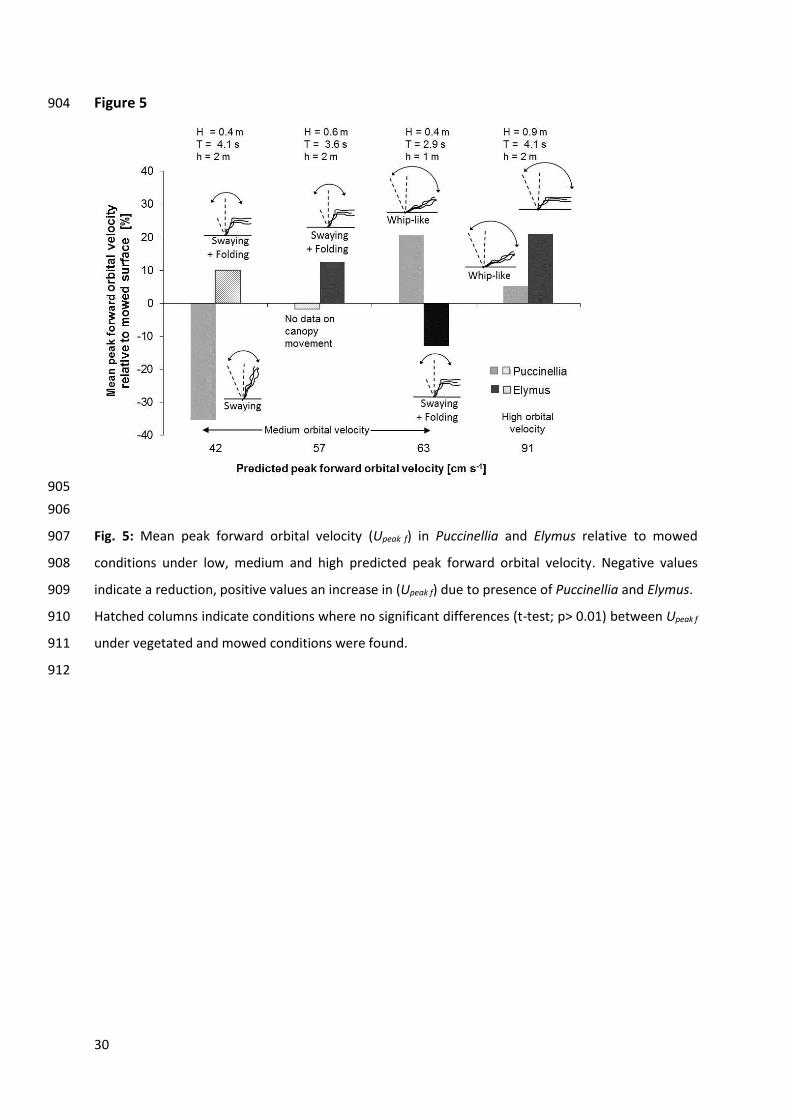
Fig. 5: Mean peak forward orbital velocity (Upeak f) in Puccinellia and Elymus relative to mowed 907
conditions under low, medium and high predicted peak forward orbital velocity. Negative values 908
indicate a reduction, positive values an increase in (Upeak f) due to presence of Puccinellia and Elymus. 909
Hatched columns indicate conditions where no significant differences (t-test; p> 0.01) between Upeak f 910
under vegetated and mowed conditions were found. 911
912
31
Figure 6 913
914
915
916
Fig. 6: Total dry plant biomass remaining on the 40 m vegetated test section (see Figure 2) in the 917
flume (light grey bars) and number of Elymus stems (dark gray, mean ± 1 SD from 18 10 x 10 cm 918
quadrats distributed over the test section) prior to the first wave test (day 0 of the experiment) and 919
at the three time steps when the flume was drained in the course of the experiment (day 5, day 9 920
and day 12). 921
922
923
32
Day 0 Day 5
Day 9 Day 12
Figure 7 924
925
926
927
928
929
930
931
932
933
934
935
936
937
938
939
Fig. 7: Photo documentation of the Puccinellia canopy prior to the first wave test (Day 0) and at the 940
three times when the flume was drained (Day 5, 9 and 12) in the course of the experiment. The 941
photograph of Day 12 shows Puccinellia before the marsh platform was mowed i.e. at the end of 942
wave tests with the vegetated marsh surface. 943
944
33
Tables 945
Table 1: Biophysical characteristics (mean values 1 SD) of the Puccinellia and Elymus canopy at the 946
test section in the flume and at the field site where the marsh blocks for the flume experiment were 947
excavated. Young’s bending modulus and flexural rigidity and stem diameter were measured with N 948
= 17 for Puccinellia and N = 18 for Elymus; stem height with N = 30 and stem density with N = 10 for 949
both species. 950
951
952
953
954
955
956
957
958
959
Stem flexibility Young’s bending Modulus [MPa]
Stem flexibility Flexural rigidity [Nm2 x 10-5]
Stem diameter [mm]
Stem height [mm]
Stem density [number per m2]
Mean Mean Mean Mean Mean
Puccinellia (Flume)
111.6 ± 66.3 0.7 ± 0.2 1.1 ± 0.3 220 ± 30 –
Puccinellia (Field)
284.5 ± 369.1 2.1± 1.7 1.2 ± 0.2 180 ± 30 –
Elymus (Flume)
2696.3 ± 1963.8 29.9 ± 18.4 1.3 ± 0.3 700 ± 10 1225 ±575
Elymus (Field)
2514.7 ± 2977.1 56.9 ± 20.7 1.7 ± 0.4 800 ± 10 1700 ±200
34
Table 2: Hydrodynamic conditions simulated with regular non-breaking waves in the flume 960
experiment. Mean wave height (H), water depth above the marsh platform (h), mean wave period (T), 961
energy flux per meter crest length (P), mean peak forward orbital velocity predicted from wave 962
parameters (Upeak f pred) and mean peak forward and backward orbital velocity (Upeak f, Upeak b) recorded 963
within canopies of Puccinellia and Elymus. Wave tests which were repeated after mowing of the 964
marsh platform are shaded in grey. Statistical significance of differences between Puccinellia and 965
Elymus in in Upeak f (Δ Upeak f) and Upeak b (Δ Upeak b) verified with t-tests based on (96 ≤ N ≤ 148) waves. 966
Non significant differences between species (p > 0.05) in Upeak f and Upeak b are marked with ‘ns’. 967
968
969
970
971
972
973
974
975
976
977
978
979
980
981
Test no.
Orbital velocity class
Upeak f
pred
[cm s-1]
P [kW m-1]
h [m]
H [m]
T [s]
Upeak f
[cm s-1] (mean ± 1 SD) Upeak b
[cm s-1] (mean ± 1 SD) Day
Puccinellia Elymus Δ Upeak f
Puccinellia Elymus Δ
Upeak b
1 Low 1.8 0.02 2 0.1 1.5 1.9 ± 0.6 2.3 ± 0.6 0.4 -2.8 ± 0.6 -2.2 ± 0.5 0.3 1
2 Low 10.0 0.08 2 0.2 2.1 8.9 ± 0.7 9.1 ± 0.6 0.2 -10.4 ± 0.7 9.6 ± 0.7 0.8 1
3 Low 16.2 0.13 2 0.2 2.9 15.2 ± 0.8 15.5 ± 0.9 0.3 -15.9 ± 1.0 -14.6 ± 0.9 1.3 1
4 Low 16.4 0.13 2 0.2 2.9 16.0 ± 0.9 15.5 ± 0.8 0.5 -15.9 ± 1.1 -13.5 ± 1.4 2.4 3
5 Low 19.8 0.22 2 0.3 2.5 16.5 ± 0.8 20.5 ± 1.6 4.0 -17.7 ± 1.1 -18.2 ± 2.1 0.5 3
6 Low 23.7 0.07 1 0.2 2.1 17.2 ± 1.0 21.9 ± 1.2 4.7 -19.8 ± 1.1 -18.9 ± 1.2 1.0 4
7 Low 28.8 0.36 2 0.3 3.6 24.2 ±1.2 32.6 ± 3.2 8.4 -20.5 ± 1.5 -24.1 ± 3.5 3.6 3
8 Low 31.4 0.12 1 0.2 2.9 25.1 ± 1.4 30.1 ± 2.4 5.0 -21.5 ± 1.5 -24.4 ± 2.6 2,9 4
9 Low 31.6 0.48 2 0.4 2.9 27.2 ± 3.1 32.9 ± 3.3 5.7 -30.5 ± 2.1 -25.5 ± 2.5 5.0 7
10 Medium 41.6 0.71 2 0.4 4.1 29.4 ± 1.7 47.9 ± 7.3 18.5 -34.1 ± 1.8 -38.9 ± 5.4 4.8 7
11 Medium 56.6 1.36 2 0.6 3.6 63.2 ± 6.7 64.3 ± 11.5
ns -48.6 ± 2.4 -46.7 ± 9.4 ns 7
12 Medium 62.7 0.47 1 0.4 2.9 74.2 ± 6.5 48.2 ± 8.7 26.0 -41.5 ± 2.9 -50.5 ± 8.7 9.0 8
13 High 74.3 0.65 1 0.5 3.3 98.5 ± 16.8 83.5 ± 9.2 5.0 -50.5 ± 9.2 -48.2 ± 9.2 2.3 11
14 High 76.2 2.31 2 0.7 5.1 101.4 ± 7.0 83.2 ± 17.1
18.2 -41.0 ± 3.1 -37.2 ± 10.1 3.8 8
15 High 90.9 3.39 2 0.9 4.1 100.9 ± 12.6 95.4 ± 9.8 5.5 -73.7 ± 4.4 62.8 ± 9.5 10.9 10

35
Table 3: Observed characteristics of vegetation-wave interactions, Cauchy number (Ca; ratio of the 982
hydrodynamic forcing to the restoring force due to plant stiffness), ratio of canopy height to wave 983
orbital excursion (L) and effect of vegetation on peak forward orbital velocity (Upeak f) in Puccinellia 984
(Pucc) and Elymus (Ely). Wave tests that were repeated after mowing of the marsh platform are 985
shaded in grey. Due to high water turbidity bending angles could not be measured for either 986
Puccinellia or Elymus in the wave test 13 nor for Puccinellia in the wave test 11. 987
988
989
Test no.
Orbital velocity class
Upeak f
pred
[cm s-1]
h [m]
H [m]
T [s]
Movement Bending angle in/counter wave travel
Ca L Effect on Upeak f compared to mowed conditions
Pucc Ely Pucc Ely Pucc Ely Δ Ca Pucc Ely Pucc Ely
1 Low 1.8 2 0.1 1.5 No No
upright canopy
upright canopy
0.3 0.4 0.1 42.9 166.9 - -
2 Low 10.0 2 0.2 2.1 SW SW 10°/10° 5°/5° 8.0 11.4
3.9 5.4 21.0 - -
3 Low 16.2 2 0.2 2.9 SW SW 20°/20° 10°/10°
21.5 31.8 10.3 2.4 9.3 - -
4 Low 16.2 2 0.2 2.9 SW SW 20°/20° 10°/10°
21.8 32.3 10.5 2.4 9.2 - -
5 Low 19.8 2 0.3 2.5 SW SW 20°/20° 10°/10°
31.9 47.2 15.3 2.3 8.9 - -
6 Low 23.7 1 0.2 2.1 SW SW 20°/20° 10°/10°
45.6 67.5 21.9 2.3 8.8 RED INC
7 Low 28.8 2 0.3 3.6 SW SW 35°/35° 25°/25°
67.80 100.4 32.6 1.1 4.2 - -
8 Low 31.4 1 0.2 2.9 SW SW 35°/35° 15°/15°
80.00 118.5 38.5 1.2 4.8 - -
9 Low 31.6 2 0.4 2.9 SW SW 40°/40° 20°/20°
81.4 120.5 39.1 1.2 4.8 RED INC
10 Medium 41.6 2 0.4 4.1 SW SW 50°/50°
Stem folding
140.6 208.2 67.5 0.7 2.6 RED NS
11 Medium 56.6 2 0.6 3.6 - SW -
Stem folding
260.9 386.1 125.3
0.6 2.2 NS INC
12 Medium 62.7 1 0.4 2.9 WP SW 60°/35°
Stem folding
319.3 472.6 153.3
0.6 2.4 INC RED
13 High 74.3 1 0.5 3.3 WP WP - -
448.9 664.5 215.6
0.5 1.8 - -
14 High 76.2 2 0.7 5.1 WP WP 60°/25°
Stem folding
472.5 699.4 226.9
0.3 1.1 - -
15 High 90.9 2 0.9 4.1 WP WP 60°/25°
Stem folding
671.4 993.7 322.4
0.3 1.2 INC INC
Abbreviations used in Table: SW = Swaying movement; WP = Whip-like movement; RED = reduction; INC = increase; 990 NS = no significant effect 991 992
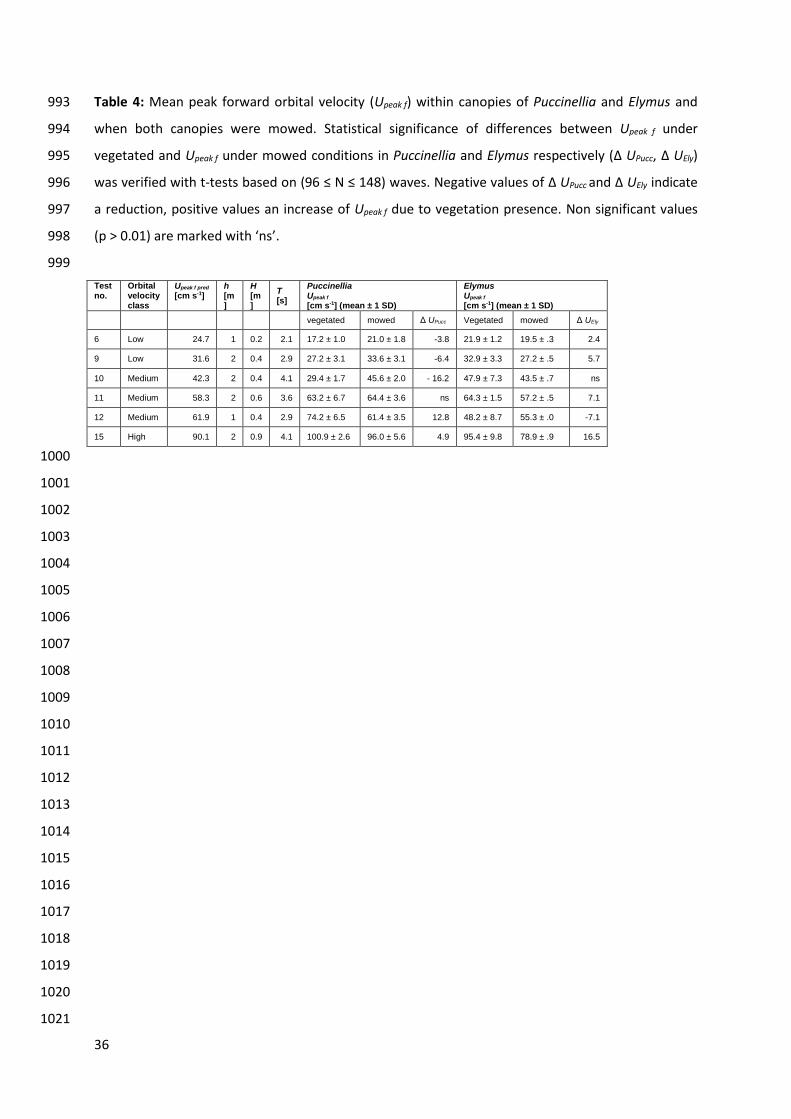
36
Table 4: Mean peak forward orbital velocity (Upeak f) within canopies of Puccinellia and Elymus and 993
when both canopies were mowed. Statistical significance of differences between Upeak f under 994
vegetated and Upeak f under mowed conditions in Puccinellia and Elymus respectively (Δ UPucc, Δ UEly) 995
was verified with t-tests based on (96 ≤ N ≤ 148) waves. Negative values of Δ UPucc and Δ UEly indicate 996
a reduction, positive values an increase of Upeak f due to vegetation presence. Non significant values 997
(p > 0.01) are marked with ‘ns’. 998
999
Test no.
Orbital velocity class
Upeak f pred
[cm s-1] h [m]
H [m]
T [s]
Puccinellia Upeak f
[cm s-1] (mean ± 1 SD)
Elymus Upeak f
[cm s-1] (mean ± 1 SD) vegetated mowed Δ UPucc Vegetated mowed Δ UEly
6 Low 24.7 1 0.2 2.1 17.2 ± 1.0 21.0 ± 1.8 -3.8 21.9 ± 1.2 19.5 ± .3 2.4
9 Low 31.6 2 0.4 2.9 27.2 ± 3.1 33.6 ± 3.1 -6.4 32.9 ± 3.3 27.2 ± .5 5.7
10 Medium 42.3 2 0.4 4.1 29.4 ± 1.7 45.6 ± 2.0 - 16.2 47.9 ± 7.3 43.5 ± .7 ns
11 Medium 58.3 2 0.6 3.6 63.2 ± 6.7 64.4 ± 3.6 ns 64.3 ± 1.5 57.2 ± .5 7.1
12 Medium 61.9 1 0.4 2.9 74.2 ± 6.5 61.4 ± 3.5 12.8 48.2 ± 8.7 55.3 ± .0 -7.1
15 High 90.1 2 0.9 4.1 100.9 ± 2.6 96.0 ± 5.6 4.9 95.4 ± 9.8 78.9 ± .9 16.5
1000
1001
1002
1003
1004
1005
1006
1007
1008
1009
1010
1011
1012
1013
1014
1015
1016
1017
1018
1019
1020
1021
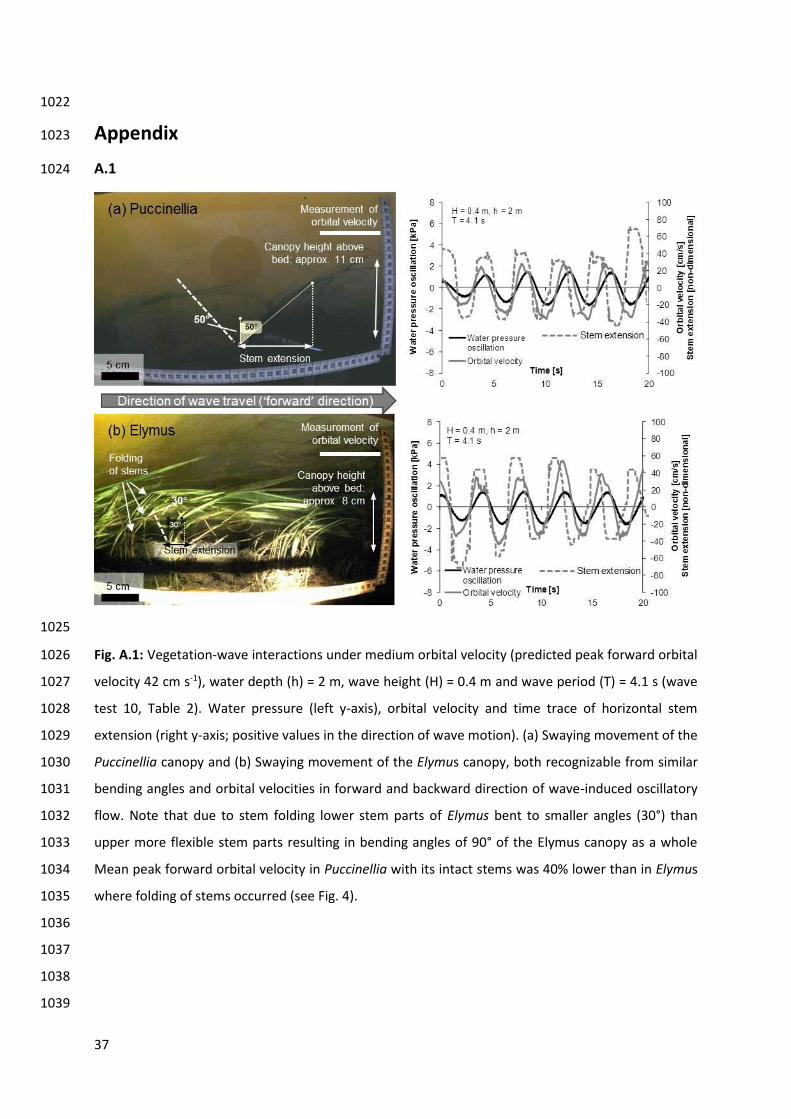
37
1022
Appendix 1023
A.1 1024
1025
Fig. A.1: Vegetation-wave interactions under medium orbital velocity (predicted peak forward orbital 1026
velocity 42 cm s-1), water depth (h) = 2 m, wave height (H) = 0.4 m and wave period (T) = 4.1 s (wave 1027
test 10, Table 2). Water pressure (left y-axis), orbital velocity and time trace of horizontal stem 1028
extension (right y-axis; positive values in the direction of wave motion). (a) Swaying movement of the 1029
Puccinellia canopy and (b) Swaying movement of the Elymus canopy, both recognizable from similar 1030
bending angles and orbital velocities in forward and backward direction of wave-induced oscillatory 1031
flow. Note that due to stem folding lower stem parts of Elymus bent to smaller angles (30°) than 1032
upper more flexible stem parts resulting in bending angles of 90° of the Elymus canopy as a whole 1033
Mean peak forward orbital velocity in Puccinellia with its intact stems was 40% lower than in Elymus 1034
where folding of stems occurred (see Fig. 4). 1035
1036
1037
1038
1039

38
A.2 1040
1041
Fig. A.2: Vegetation-wave interactions under medium orbital velocity (predicted peak forward orbital 1042
velocity 63 cm s-1) water depth (h) = 1 m, wave height (H) = 0.4 m and wave period (T) = 2.9 s (wave 1043
test 12, Table 2). Water pressure (left y-axis), orbital velocity and time trace of horizontal stem 1044
extension (right y-axis; positive values in direction of wave motion). (a) Whip-like movement of the 1045
Puccinellia canopy recognizable from wide bending angles and high orbital velocity in forward 1046
direction of wave-induced oscillatory flow. (b) Swaying movement of the Elymus canopy recognizable 1047
from similar bending angles and orbital velocities in forward and backward direction of wave-induced 1048
oscillatory flow. Note that due to stem folding lower stem parts of Elymus bent to smaller angles (45°) 1049
than upper more flexible stem parts resulting in bending angles of 90° of the Elymus canopy as a 1050
whole. Following its whip-like movement mean peak forward orbital velocity in Puccinellia was 1051
approx. 50% higher than in Elymus (see Fig. 4). 1052
1053
1054
1055
1056
1057
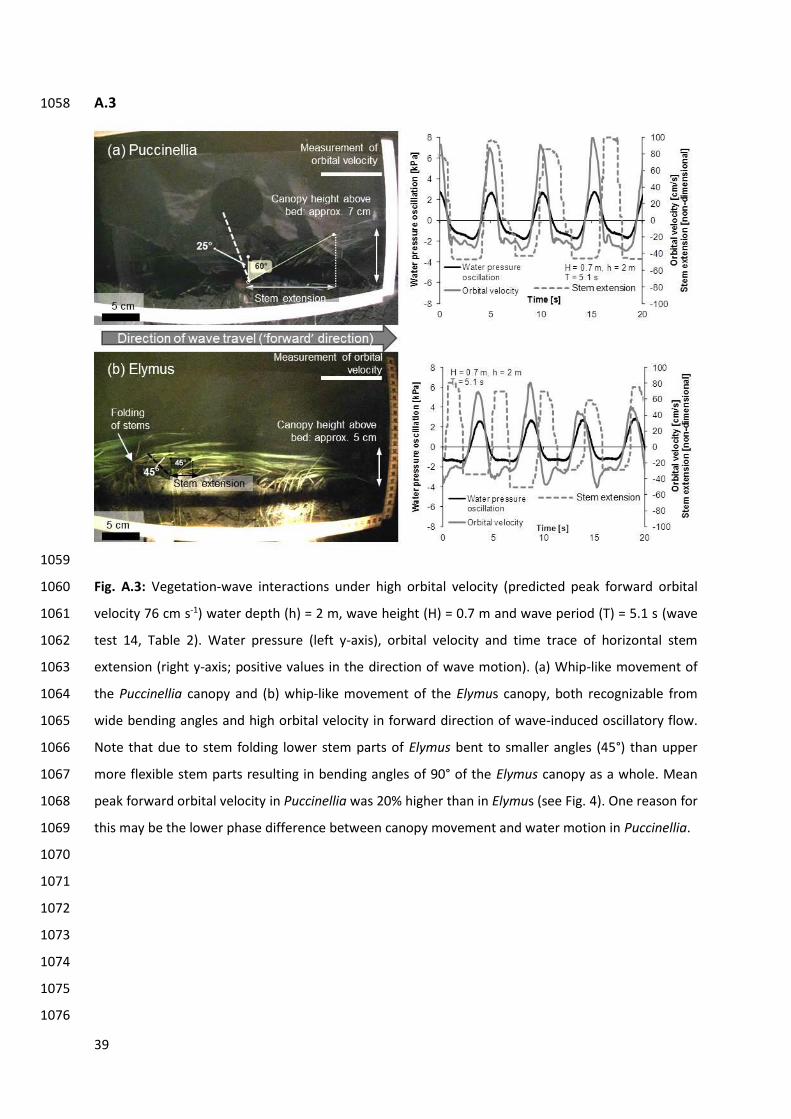
39
A.3 1058
1059
Fig. A.3: Vegetation-wave interactions under high orbital velocity (predicted peak forward orbital 1060
velocity 76 cm s-1) water depth (h) = 2 m, wave height (H) = 0.7 m and wave period (T) = 5.1 s (wave 1061
test 14, Table 2). Water pressure (left y-axis), orbital velocity and time trace of horizontal stem 1062
extension (right y-axis; positive values in the direction of wave motion). (a) Whip-like movement of 1063
the Puccinellia canopy and (b) whip-like movement of the Elymus canopy, both recognizable from 1064
wide bending angles and high orbital velocity in forward direction of wave-induced oscillatory flow. 1065
Note that due to stem folding lower stem parts of Elymus bent to smaller angles (45°) than upper 1066
more flexible stem parts resulting in bending angles of 90° of the Elymus canopy as a whole. Mean 1067
peak forward orbital velocity in Puccinellia was 20% higher than in Elymus (see Fig. 4). One reason for 1068
this may be the lower phase difference between canopy movement and water motion in Puccinellia. 1069
1070
1071
1072
1073
1074
1075
1076