Embed Size (px)
Citation preview

Coastal Engineering 95 (2015) 66–76
Contents lists available at ScienceDirect
Coastal Engineering
j ourna l homepage: www.e lsev ie r .com/ locate /coasta leng
A numerical study of vegetation impact on reducing storm surge bywetlands in a semi-enclosed estuary
Kelin Hu a,⁎, Qin Chen a,b, Hongqing Wang c
a Center for Computation and Technology, Louisiana State University, Baton Rouge, LA 70803, USAb Department of Civil and Environmental Engineering, Louisiana State University, Baton Rouge, LA 70803, USAc U.S. Geological Survey, National Wetlands Research Center, Coastal Restoration Assessment Branch, Baton Rouge, LA 70803, USA
⁎ Corresponding author. Tel.: +1 225 578 8990.E-mail address: [email protected] (K. Hu).
http://dx.doi.org/10.1016/j.coastaleng.2014.09.0080378-3839/© 2014 Elsevier B.V. All rights reserved.
a b s t r a c t
a r t i c l e i n f oArticle history:Received 2 June 2014Received in revised form 26 September 2014Accepted 29 September 2014Available online 30 October 2014
Keywords:Storm surgeVegetation-induced surge reductionNumerical experimentsHurricane IsaacCoastal wetlands
Coastalwetlands play a unique role in extremehurricane events. The impact ofwetlands on storm surge dependson multiple factors including vegetation, landscape, and storm characteristics. The Delft3D model, in whichvegetation effects on flow and turbulence are explicitly incorporated, was applied to the semi-enclosed BretonSound (BS) estuary in coastal Louisiana to investigate thewetland impact. Guidedby extensivefield observations,a series of numerical experiments were conducted based on variations of actual vegetation properties and stormparameters from Hurricane Isaac in 2012. Both the vegetation-induced maximum surge reduction (MSR) andmaximum surge reduction rate (MSRR) increased with stem height and stem density, and were more sensitiveto stem height. The MSR and MSRR decreased significantly with increasing wind intensity. The MSRR was thehighest with a fast-moving weak storm. It was also found that the MSRR varied proportionally to the expressioninvolving the maximum bulk velocity and surge over the area of interest, and was more dependent on the max-imum bulk surge. BothMSR andMSRR appeared to increase when the area of interest decreased from the wholeBS estuary to the upper estuary. Within the range of the numerical experiments, the maximum simulated MSRand MSRR over the upper estuary were 0.7 m and 37%, respectively.
© 2014 Elsevier B.V. All rights reserved.
1. Introduction
Coastal wetlands play a unique role in extreme events such astropical storms and hurricanes. They act as a buffer to protect coastalcommunities by attenuating strong winds, waves and storm surges.On the other hand, they may enhance surges seaward of the wetlandsas storm tides are blocked by them, especially at the beginning of aflooding process (Chen et al., 2012). In southern Louisiana, wetland res-toration and protection in the Mississippi Delta becomemore challeng-ingwith the aftermath of Hurricanes Katrina andRita in 2005 (Day et al.,2007; Stokstad, 2005). It is of importance to understand and predict theeffect of vegetation during extreme events. This study focused on quan-tifying the role of coastal wetland vegetation in reducing storm surgeunder realistic field conditions. Often, a constant storm surge attenua-tion rate, such as 1 m per 14.5 km has been used to demonstrate the re-duction of storm surge by coastal wetlands (USACE, 1963). However,such a constant attenuation rate is not accurate as pointed out byResio and Westerink (2008). In fact, the impact of coastal wetlands onstorm surge depends onmany factors, including vegetation biomechan-ical properties (e.g., stem height, diameter, density, and coverage),landscape characteristics (e.g., land/water configuration, bathymetry,
topography, local geometry, levee, channels and other features), andstorm parameters (e.g., storm track, storm size, duration, forwardspeed, and wind intensity) as well as the interaction of these factors(Chen et al., 2008; Rego and Li, 2009; Resio and Westerink, 2008;Sheng et al., 2012; Wamsley et al., 2010; Zhao and Chen, 2013).
Numerical models can be an effective tool for examining the impactof coastal wetlands on storm surge under complicated configurationsof vegetation, landscape, and storm characteristics. There are nu-merous models that have been applied to storm surge modeling, in-cluding the Sea, Lake, and Overland Surges from Hurricanes (SLOSH)(Jelesnianski et al., 1992) and the ADvanced CIRCulationmodel (ADCIRC)(Dietrich et al., 2011; Luettich et al., 1992), and general process-basedhydrodynamic and transport models such as the Finite-Volume Commu-nity Ocean Model (FVCOM) (Chen et al., 2003; Rego and Li, 2010), theRegional Ocean Modeling System (ROMS) (Shchepetkin andMcWilliams, 2005; Wang et al., 2008), the Curvilinear-grid Hydro-dynamics three-dimensional model (CH3D) (Sheng et al., 2010), DHISoftware (Madsen and Jakobsen, 2004; Warren and Bach, 1992), andDelft3DbyDeltares (Hu et al., 2009; Lesser et al., 2004). Vegetation effectsare commonly taken into account in the bottom friction term in opera-tional models. For instance, the Manning's n friction coefficient canbe assigned according to the specific land cover class, e.g., provided bythe U.S. Geological Survey (USGS) National Land Cover Dataset(NLCD). With this representation, Wamsley et al. (2010) studied the

67K. Hu et al. / Coastal Engineering 95 (2015) 66–76
potential of wetlands in southern Louisiana in reducing storm surgeandwaves under two landscape configurations through a few represen-tative hurricanes. Liu et al. (2013) studied the effects of mangroves onreducing storm surge and flooding in southern Florida by changinghurricane characteristics. In this method, the drag of vegetation stemsacting on the flow is treated as a bottom friction and may cause anoverestimation of bottom shear stress that is used to suspend sedimentsfrom bed in the modeling of sediment transport. By contrast, anothermethod treats vegetation directly as a series of rigid cylindrical struc-tures, which adds extra terms of drag force in themomentumequationsand turbulence equations, such as those implemented in CH3D (Shenget al., 2012) and Delft3D (Temmerman et al., 2005). This method issuitable for simulating three-dimensional flows with vertical variationsin vegetation characteristics. Temmerman et al. (2007) took intoaccount the growth andmortality of vegetation by coupling the Delft3Dmodel with an external plant routine, which is applicable to long-termsimulations of morphological change.
Few studies have been carried out to investigate the impact ofvegetation on storm surge under combined realistic conditions of vege-tation, landscape, and storm properties. Most of the existing studieshave focused on evaluating storm surges with varying storm parame-ters (e.g., Nielsen, 2009; Rego and Li, 2009). Due to multiple factorsinfluencing the effect of vegetation on storm surge and their interaction,more comprehensive numerical experiments are needed to simulta-neously account for the influences of various vegetation, landscape,and storm features. Conclusions from studies using an idealized domainwith simple coverage of vegetation (e.g., Sheng et al., 2012) may not beapplicable to real wetlands where landscape characteristics, such asland and water configuration, topography and bathymetry, levees, and
Longiude (
Latit
ude
(deg
)
PLA−019Mississ
Breton Sound
−90 −89.9 −89.8 −89.7 −89.6 −8
29.3
29.4
29.5
29.6
29.7
29.8
29.9
Fresh marshIntermediate marshBrackish marshSaline marsh
Vegetation Coverage
BelleChasse
R2
R4
R5R6
R7
Fig. 1. Bathymetry and vegetation coverage (subfigure) in the Breton Sound estuary. R0–R7domain-decomposition (DD) boundaries (pink lines). See legends for other symbols.
channel systems, could vary even at a local scale. In this study, weapplied the Delft3D model, in which vegetation effects on flow andturbulence are explicitly taken into account, to the Breton Sound (BS)estuary in southeastern Louisiana. We investigated the impact of vege-tation on storm surge by examining the effects of changing stem height,density, wind intensity and storm forward speed through a series ofnumerical experiments based on extensive field observations collectedduring Hurricane Isaac in 2012.
2. Study area and Hurricane Isaac (2012)
The BS estuary is a semi-enclosed estuary in southeasternLouisiana. As shown in Fig. 1, it is bounded on the south and on thewest by the levees of the Mississippi River, and on the north in partby the ridges of the Mississippi River Gulf Outlet that was closed in2009. It is open to the Gulf of Mexico on the southeast. The estuaryencompasses approximately 2740 km2, of which 750 km2 are wet-lands. Bathymetries are very complicated with numerous bays,lakes, bayous, canals and marshes. The BS estuary is economicallyimportant because it is the home to several of the largest public oys-ter seed grounds and private leases for the Gulf coast (LDWF, 2012;Soniat et al., 2013). Storm surges could cause salt water intrusionand result in increased estuarine salinity, thus affecting oystergrowth and production. The major vegetation types in the estuaryare fresh, intermediate, brackish, and saline marshes (Sasser et al.,2008; Visser et al., 2003). Their distributions based on a coast-wideaerial survey in 2007 (Sasser et al., 2008) are shown in Fig. 1. Domi-nant species are Panicum hemitomon, Polygonum punctatum Elliot,and Sagittaria lancifolia for freshmarsh; S. lancifolia, Eleocharis albida,
deg)
CoastlinesLeveesLevees in Delft3DRiver boundaryDD boundariesUSGS stationippi River Gulf Outlet
Estuary
Bathymetry (m)
9.5 −89.4 −89.3 −89.2 −89.1−2
−1
0
1
2
3
4
R1
R0R3
denote eight sub-domains in the regional domain, respectively, which are connected by

68 K. Hu et al. / Coastal Engineering 95 (2015) 66–76
and Spartina patens for intermediate and brackish marshes; andSpartina alterniflora and Juncus roemerianus for saline marsh, respec-tively (Sasser et al., 2008; Visser et al., 2003). The biophysical fea-tures of these vegetation types used in this study are listed in Table 1.
Hurricane Isaac originated from a tropical wave that moved off thecoast of Africa on 16 August, 2012, and entered the southeastern Gulfof Mexico early on 27 August. It gradually strengthened while movingacross the Gulf of Mexico and became a Category I hurricane when lo-cated 140 km southeast of the mouth of the Mississippi River around1200 UTC 28 August. It slowed down considerably to about 10 km/hwhile it approached the coast of Louisiana with winds of 130 km/hand lowest pressure of 965 mb, which prolonged the strong winds,dangerous storm surge, and heavy rains along the northern Gulf coast.According to the measurements by the USGS, the storm surge atthe upper BS estuary reached over 4 m (see http://ga.water.usgs.gov/flood/hurricane/isaac/sites/charts/SSS-LA-PLA-019WL.html). Isaac madetwo landfalls along the coast of Louisiana, the first one at SouthwestPass on the mouth of the Mississippi River around 0000 UTC 29 Augustand the second one at just west of Port Fourchon around 0800 UTC 29August. Isaac then gradually weakened and dissipated inland. Referto theNational Hurricane Center's report on Isaac (Berg, 2013) for details.
3. Methods
An asymmetric parametric hurricane wind model (Hu et al., 2012a,2012b), which is integrated with background winds, was employed togenerate surface wind fields. The hurricane wind model has the abilityto maintain the consistency of the input and output (e.g., maximumwind speeds and wind radii for 34-, 50- and 64-knot thresholds ineach quadrant). Changing the hurricane parameters (e.g., forwardspeed and wind intensity) in our numerical experiments is straightfor-ward using this wind model. We can adjust the interval of hurricanebest track data to get different forward speeds, and scale inputs ofmaximumwind speed and specifiedwind speeds to changewind inten-sity while keeping its wind structure.
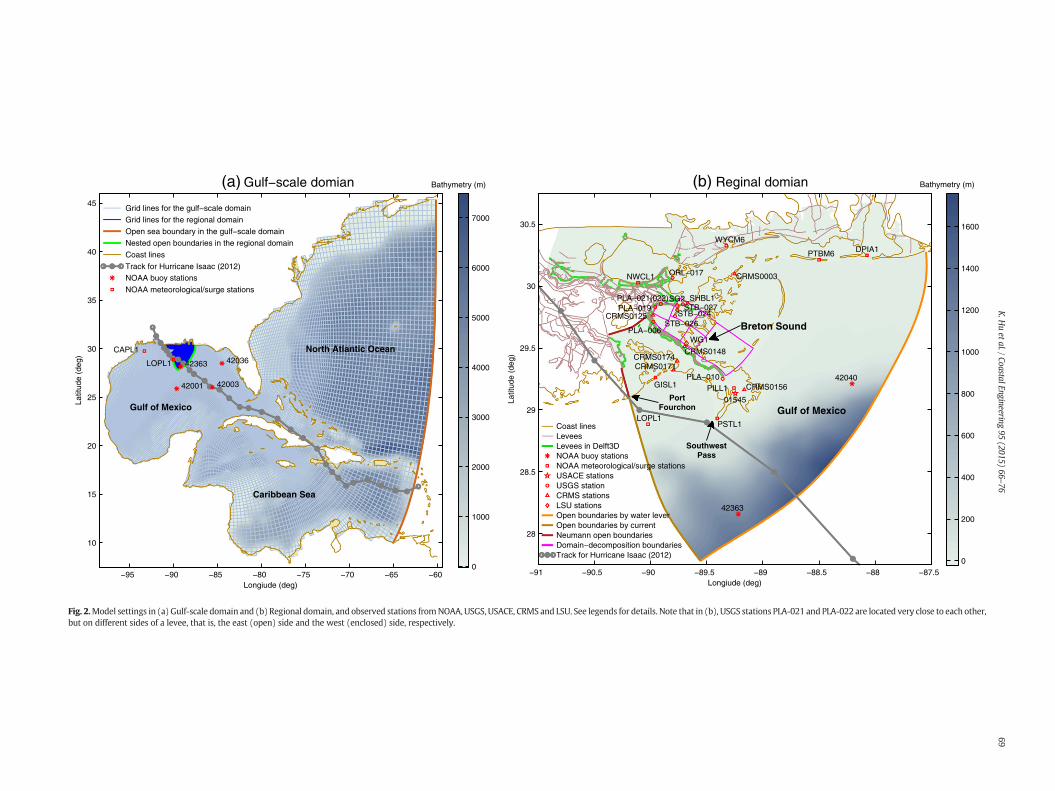
We applied the Delft3D model, which has been used widely forstudies of coastal processes (e.g., Dykes et al., 2003; Hu et al., 2009), toexamine the effect of coastal vegetation on reducing storm surge.Nested computational domains were designed and set up in Fig. 2.The Gulf-scale domain, which covered the Gulf of Mexico, CaribbeanSea and part of North Atlantic Ocean, provided boundary conditions(water levels and currents) for the regional domain. These two bound-ary conditions were applied to the major open boundaries at thesoutheast and southwest, respectively, in the nested domain to avoidstability issues that the use of the same boundary type may induce. Inorder to resolve the complex bathymetry/topography in the BS estuary,a domain decomposition technique in Delft3D, which allows localrefinement, was adopted in the nested domain. There were eight sub-domains (R0 to R7) in the regional domain (Figs. 1 and 2b). Theywere connected by internal domain decomposition (DD) boundarieswith the capability of two-way communication of water level andcurrent. Our area of interest, the BS estuary, was covered by R1 to
Table 1The biophysical characteristics of various vegetation types.
Vegetation type Average stemheight (m)
Average stemdiameter (mm)e
Average stemdensity (m−2)e
Fresh marsh 0.76a 5.59 578Intermediate marsh 0.50b 2.03 2095Brackish marsh 0.50c 1.50 740Saline marsh 0.40d 3.67 341
a United States Department of Agriculture (USDA) natural Resources ConservationServices (NRCS) herbaceous plant online database (http://plants.usda.gov/java/factSheet).
b No data for Intermediate marsh, assumed the same as Brackish marsh.c Randall and Foote (2005).d McKee et al. (2006).e Visser (2007).
R7 with ~50 m grid resolution. The highest resolution reached 20 m inthe upper BS (R6 and R7). This high grid resolution ensured therepresentation of small channels/bayous in the model domain. TheMississippi River levee system was represented by the sub-grid struc-ture of local weirs in Delft3D. From a tidal constituent database(Mukai et al., 2002), seven dominant constituents (O1, K1, Q1, M2, N2,S2 and K2) were considered to determine tidal levels at the open-seaboundary in the Gulf-scale domain. Observed Mississippi River dis-charges at Belle Chasse from the USGS (http://waterdata.usgs.gov/usa/nwis/uv?07374525) were added in sub-domain R0 (see Fig. 1). In addi-tion, two Neumann boundaries were set to let storm surge freely flowout of the regional domain (see Fig. 2b). Vertically, seven sigma layers,of which thicknesses were 5, 10, 20, 30, 20, 10 and 5% of total waterdepth, respectively, were selected for 3Dmodelingwith high resolutionboth at the bottomand at the surface.We obtained thebathymetric dataand Manning's n coefficients for bottom friction from the LouisianaCoastal Protection and Restoration Authority (CPRA). Topography inthe BS estuary was updated based on the 5 m-resolution NationalElevation Dataset in 2011 from the USGS (http://ned.usgs.gov/). Notethat waves were not coupled with the storm surge model in this studybecause numerical tests and wave measurements showed that thegradient of radiation stresses was small in wetlands and wave setupwas less than 5% of the storm surge in the BS estuary during HurricaneIsaac.
The effect of vegetation on hydrodynamics in areas other than theBS estuary was represented by an increased Manning's coefficient inthe quadratic bottom friction term. In the BS area (R1–R7), Manning'sn coefficient was set to 0.025 to represent the friction of an un-vegetated bottom, and the vegetation-induced drag was explicitlytaken into account by the 3D influence of rigid cylindrical structureson drag and turbulence. Based on the work of Uittenbogaard (2003),three extra terms were added into the model: a source term of dragforce that represents the influence of vegetation in the momentumequations, a source term of turbulent kinetic energy (k), and a sourceterm of turbulent energy dissipation (ε), which represent the influenceof vegetation on turbulences in the k− ε equations (e.g., Rodi, 1993), re-spectively. Detailed expressions of those terms can be found inUittenbogaard (2003) and Temmerman et al. (2005). This vegetationmodule has been validated extensively against laboratory flume exper-iments (e.g., Baptist, 2003; Borsje et al., 2009), and against field data onflow patterns in salt marshes (Temmerman et al., 2005), and intertidalflats and sandy sites (Bouma et al., 2007). The main limitation of thismodule is the assumption that vegetation is rigid. In vegetated areas,some vegetation types, such as marsh plants, will substantially benddue to the force of the flow or high wind. Zhao and Chen (2013) deter-mined the deflected vegetation stem height by iteration for modelingthe attenuation of storm surge in wetlands. Similar to other studies(Kuiper, 2010; Monden, 2010), the flexibility of vegetation is takeninto account through reducing the stem height, in this study, by 60%according to the values in Table 1. The sensitivity of stem height willbe discussed in the next section.
We set up two groups of numerical experiments: vegetation-varyingand hurricane-varying, to study the impact of vegetation on stormsurge. In the vegetation-varying experiments, stem density and stemheight were changed from 50% of their values in the base case to 200%with an interval of 25%. Note that the vegetation module uses stemheight and the product of stem density and stem diameter, and there-fore the variation of stem density is equivalent to the same relative var-iation of stem diameter in this study if the density is kept unchanged. Inthe hurricane-varying experiments, a series of “Isaac-like” hurricaneswere generated through changing the wind intensity (maximum windspeed and specifiedwind speed) and forward speed. Thewind intensitywas changed from 75% of the values in the base case to 175% with aninterval of 25%, that is, from a tropical storm to a Category 4 Hurricaneaccording to the Saffir–Simpson Hurricane Wind Scale. By setting thetime interval to 8, 6, 5 and 4 h, respectively, the forward speed was
Longiude (deg)
Latit
ude
(deg
)
(a) Gulf−scale domian
Grid lines for the gulf−scale domain
Grid lines for the regional domain
Open sea boundary in the gulf−scale domain
Nested open boundaries in the regional domain
Coast lines
Track for Hurricane Isaac (2012)
NOAA buoy stations
NOAA meteorological/surge stations
42001 42003
4203642363LOPL1
CAPL1
Bathymetry (m)
Gulf of Mexico
Caribbean Sea
North Atlantic Ocean
−95 −90 −85 −80 −75 −70 −65 −60
10
15
20
25
30
35
40
45
0
1000
2000
3000
4000
5000
6000
7000
Longiude (deg)
Latit
ude
(deg
)
(b) Reginal domian
42040
42363
GISL1
NWCL1
SHBL1
PSTL1
PILL1
WYCM6DPIA1PTBM6
LOPL1
WG1
SG2
01545
ORL−017
PLA−006
PLA−010
PLA−019PLA−021(022)
STB−024STB−026
STB−027
CRMS0003
CRMS0125
CRMS0148
CRMS0156
CRMS0171CRMS0174
Coast linesLeveesLevees in Delft3DNOAA buoy stationsNOAA meteorological/surge stationsUSACE stationsUSGS stationCRMS stationsLSU stationsOpen boundaries by water leverOpen boundaries by currentNeumann open boundariesDomain−decomposition boundariesTrack for Hurricane Isaac (2012)
Bathymetry (m)
−91 −90.5 −90 −89.5 −89 −88.5 −88 −87.5
28
28.5
29
29.5
30
30.5
0
200
400
600
800
1000
1200
1400
1600
Gulf of Mexico
Breton Sound
PortFourchon
SouthwestPass
Fig. 2.Model settings in (a) Gulf-scale domain and (b) Regional domain, and observed stations fromNOAA, USGS, USACE, CRMS and LSU. See legends for details. Note that in (b), USGS stations PLA-021 and PLA-022 are located very close to each other,but on different sides of a levee, that is, the east (open) side and the west (enclosed) side, respectively.
69K.H
uetal./CoastalEngineering
95(2015)
66–76

70 K. Hu et al. / Coastal Engineering 95 (2015) 66–76
changed from 75% of the values in the base case to 150%, that is, aboutfrom 2.5 m/s to 5.0 m/s near the Louisiana coast.
In order to quantify the vegetation impact on storm surge, we intro-duce the maximum surge reduction (MSR) and the correspondingmaximum surge reduction rate (MSRR) in terms of water volume for aspecific area (i.e., area of interest or AOI) during an event, as follows:
Snv;max ¼∬
AOILnv x; y; tð Þdxdy
� �max
−∬AOI
Lnv x; y;0ð Þdxdy∬
AOIdxdy
ð1Þ
Sv;max ¼∬
AOILv x; y; tð Þdxdy
� �max
−∬AOI
Lv x; y;0ð Þdxdy∬
AOIdxdy
ð2Þ
MSR ¼ Snv;max−Sv;max ð3Þ
MSRR ¼ MSRSnv;max
¼ Snv;max−Sv;max
Snv;maxð4Þ
where L(x,y,t) is the water level for a specific location and time, S is thebulk surge for the AOI, the subscripts nv and v indicate the absence andthe presence of vegetation, respectively, and the subscriptmax denotesthe maximum value of water volume or bulk surge over the wholeevent. This kind of definition is similar to that used in Sheng et al.(2012). Both are area-based instead of single-location-based, whichavoids the spiky spatial variation in the definition for a single location.
4. Model validation
Within our study region, there exist permanent meteorologicaland tide stations from the U.S. National Oceanic and AtmosphericAdministration (NOAA), the U.S. Army Corps of Engineers (USACE)and the Louisiana Coastwide Reference Monitoring System (CRMS,http://lacoast.gov/crms2/). In addition, the USGS deployed a numberof temporary surge gages for Hurricane Isaac. Our research team atLouisiana State University (LSU) deployed several wave and surgegages in BS as well prior to Hurricane Isaac landfall. In this study, multi-ple sources of observed data (see Fig. 2 for the locations of observedstations) were used for Hurricane Isaac's wind and surge validation.
Comparisons of wind speed/wind direction with measurementsat 15 stations are shown in Fig. 3. It is seen that the modeled windsare in good agreement with the observed data. At Buoy 42040, windmodel captured the highest wind speed, near 30 m/s. At Stations LOPL1and PSTL1, the significant changes of wind speed were reproducedvery well when Hurricane Isaac passed by closely. Statistically, the root-mean-square error (RMSE) of wind speed at all stations is 2.8 m/s witha correlation coefficient (r) of 0.8694.
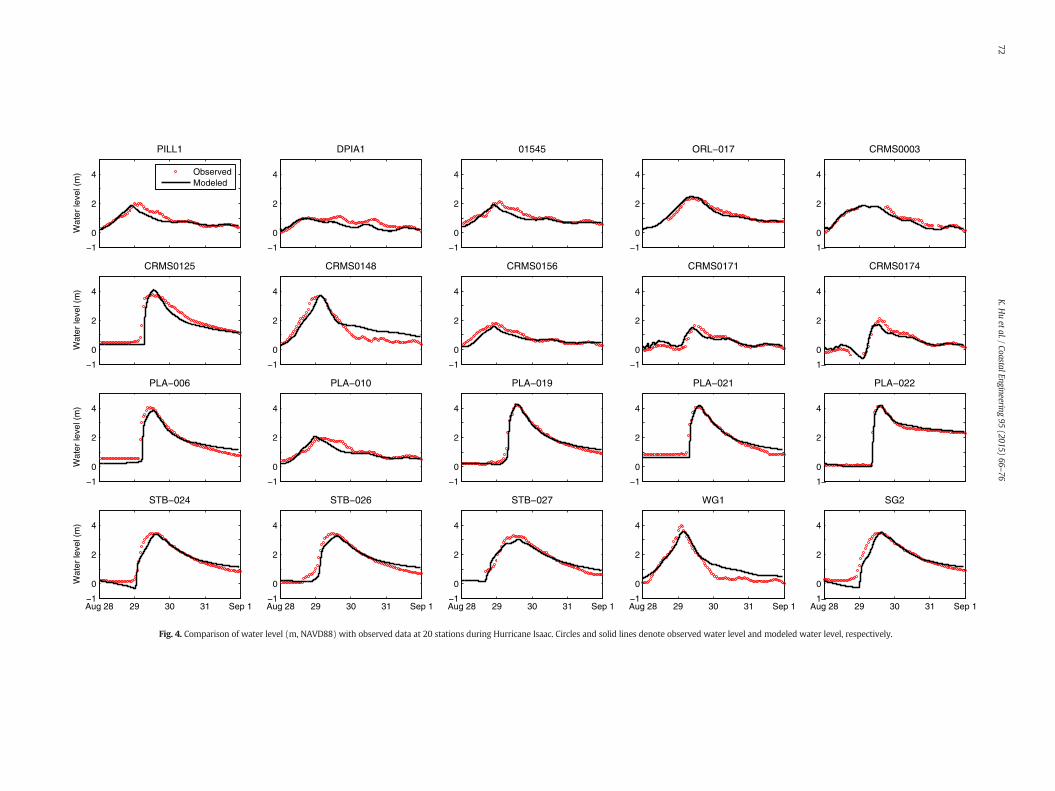
Water level comparisons are shown in Fig. 4. It can be seen fromboth measurements and model results that Hurricane Isaac inducedover 4 m of storm surge at the upper BS estuary (see Stations PLA-019, PLA-021 and PLA-022). Model results present the differentretreating patterns of surge processes at Stations PLA-021 and PLA-022 which are located very close to each other but on differentsides of the levee. The RMSE of water levels at 20 stations is 0.3 mwith r= 0.9528. In all, model results agree well with the field observa-tions, especially at stations in the BS.
5. Results of numerical experiments and discussion
Fig. 5a shows the distribution of maximum water levels in the BSinduced by Hurricane Isaac. Hurricane Isaac passed through to thesouth and southwest of the BS area, and maintained southeasterly and
easterly winds blowing over the BS for about one day, which forcedwater from the Gulf of Mexico continuously into this area. The semi-closed geometry and man-made levees sufficiently kept and blockedwater from flowing over to the west of the Mississippi River. Therewere two regionswith high storm surges. Onewas located at themiddleestuary. At that time, easterly winds pushed water into this region. Thesouthwest side of the BS was blocked by the levees. Simultaneously,wetlands prevented surge flooding further upstream. As time went on,the wind direction changed to southeasterly. The wetlands in theupper BS were finally flooded, and the surge in the uppermost estuary,blocked by levees, kept rising up to more than 4 m (see Figs. 4 and 5a).
In order to understand how multiple factors would affect stormsurge in the BS, we conducted a few tests prior to the detailed investiga-tion of vegetation impacts. Fig. 5b shows the time series of water level atStation PLA-019 for field measurements and six modeled scenarios.The modeled scenarios were base case, cases with no vegetation, slowmoving (by 25% comparing to base case), fast moving (by 20%), weakintensity (by 25%) and strong intensity (by 25%), Isaac-like hurricanes,respectively. We expected higher storm surge in BS with the conditionsof: 1) no vegetation and/or 2) strong wind intensity and/or 3) a slow-moving hurricane; and lower storm surge with the conditions of1) weak wind intensity and/or 2) a fast-moving hurricane. Simulationsshowed that not only the wind intensity, but also the duration of windforcing, contributed to the final surge height, especially in a semi-closed estuary. Among those factors, the wind intensity was the mostdeterminative one that controls the maximum surge height in theupper BS. The effect of wind intensity in this study was consistentwith numerical experiment results of Rego and Li (2009) based on Hur-ricane Rita (2005) in southwestern Louisiana.
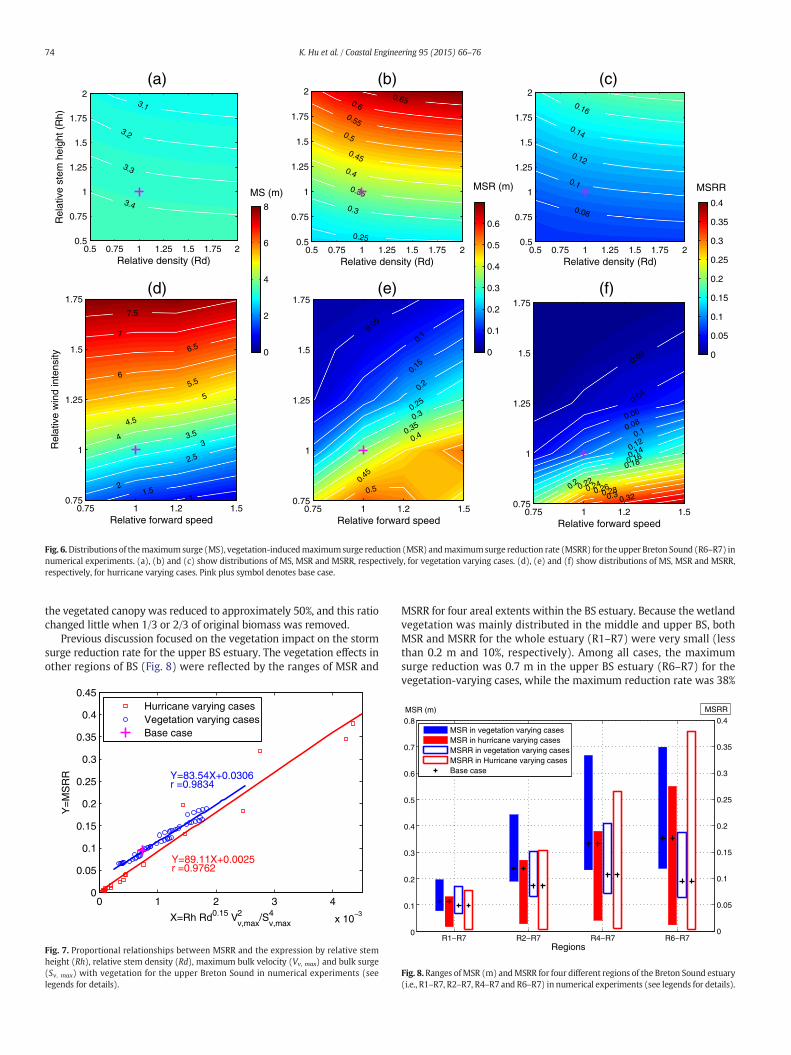
The distributions of the maximum surge (MS) with vegetation(Sv,max), MSR and MSRR by numerical experiments for the upper BS(R6–R7) are shown in Fig. 6. In the vegetation-varying experiments,the MS without vegetation (Snv,max) is invariable, about 3.7 m(Fig. 6a–c). It is clear that the MS with vegetation decreases withhigher stem heights and densities, and the resultant MSR (orMSRR) has an inverse distribution. The change of MS or MSR withdifferent vegetation parameters is about 0.45 m, while the changeof MSRR is about 12.4% from 6.4% to 18.8%. In the hurricane-varying experiments, the MS increases with higher wind intensitiesand lower forward speeds (Fig. 6d). When the relative forwardspeed is fixed to 1, the MS significantly increases from less than1.5 m to more than 7.5 m as the relative wind intensity varies from0.75 to 1.75. When the relative wind intensity is fixed to 1, the MSdecreases from 3.8 m to 2.4 m as the relative forward speed variesfrom 0.75 to 1.5. A faster forward speed means a shorter durationof a hurricane that induces a lower storm surge in the BS. The distri-butions of MSR and MSRR show that the effect of height-limitedvegetation is more significant with a smaller inundation depth (Fig. 6eand f). For instance, when the MS is less than 3 m, the MSR and MSRRare larger than 0.4 m and 12%, respectively. The MSRR reaches its max-imum value (38%)when theMS is extremely low (less than 1m), whilethe absolute surge reduction does not reach its maximum simulta-neously.Whenwind intensity is increased, storm surge increases quick-ly, which dramatically weakens the effect of vegetation, to less than0.1 m and 2% in regard to MSR and MSRR, respectively. Comparing thevegetation-varying cases and the hurricane-varying cases, it can beseen that the range of MS by changing hurricane winds is dramaticallywider than that by changing vegetation. In other words, hurricaneparameters control the maximum surge. Regarding vegetation effectson reducing storm surge, the extreme value of MSR in the vegetation-varying cases is larger than that in the hurricane-varying cases, butwith the MSRR the opposite occurs.
Our result of the trend of MSRR changing with the forward speedof a hurricane is consistent with the findings of Sheng et al. (2012)and Liu et al. (2013). With regard to the MSRR changing with thewind intensity, our result is also consistent with Liu et al. (2013), but

0
10
20
30
Win
d sp
eed
(m/s
)
0
90
180
270
36042001
Observed wind directionModeled wind directionObserved wind speedModeled wind speed
0
10
20
30
0
90
180
270
36042003
0
10
20
30
0
90
180
270
36042036
0
10
20
30
0
90
180
270
360
Win
d di
rect
ion
(deg
)
42040
0
10
20
30
Win
d sp
eed
(m/s
)
0
90
180
270
360CAPL1
0
10
20
30
0
90
180
270
360LOPL1
0
10
20
30
0
90
180
270
360GISL1
0
10
20
30
0
90
180
270
360
Win
d di
rect
ion
(deg
)
NWCL1
0
10
20
30
Win
d sp
eed
(m/s
)
0
90
180
270
360SHBL1
0
10
20
30
0
90
180
270
36042363
0
10
20
30
0
90
180
270
360PSTL1
0
10
20
30
08/26 27 28 29 30 31 09/010
90
180
270
360
Win
d di
rect
ion
(deg
)
PILL1
0
10
20
30
Win
d sp
eed
(m/s
)
08/26 27 28 29 30 31 09/010
90
180
270
360WYCM6
0
10
20
30
08/26 27 28 29 30 31 09/010
90
180
270
360PTBM6
0
10
20
30
08/26 27 28 29 30 31 09/010
90
180
270
360
Win
d di
rect
ion
(deg
)
DPIA1
Fig. 3. Comparisons of wind speed and wind direction with observed data at 15 stations during Hurricane Isaac. Pluses, circles, light solid lines and solid lines denote observed wind direction, observed wind speed, modeled wind direction andmodeled wind speed, respectively.
71K.H
uetal./CoastalEngineering
95(2015)
66–76
−1
0
2
4
PILL1
Wat
er le
vel (
m) Observed
Modeled
−1
0
2
4
DPIA1
−1
0
2
4
01545
−1
0
2
4
ORL−017
−1
0
2
4
CRMS0003
−1
0
2
4
CRMS0125
Wat
er le
vel (
m)
−1
0
2
4
CRMS0148
−1
0
2
4
CRMS0156
−1
0
2
4
CRMS0171
−1
0
2
4
CRMS0174
−1
0
2
4
PLA−006
Wat
er le
vel (
m)
−1
0
2
4
PLA−010
−1
0
2
4
PLA−019
−1
0
2
4
PLA−021
−1
0
2
4
PLA−022
Aug 28 29 30 31 Sep 1−1
0
2
4
STB−024
Wat
er le
vel (
m)
Aug 28 29 30 31 Sep 1−1
0
2
4
STB−026
Aug 28 29 30 31 Sep 1−1
0
2
4
STB−027
Aug 28 29 30 31 Sep 1−1
0
2
4
WG1
Aug 28 29 30 31 Sep 1−1
0
2
4
SG2
Fig. 4. Comparison of water level (m, NAVD88) with observed data at 20 stations during Hurricane Isaac. Circles and solid lines denote observed water level and modeled water level, respectively.
72K.H
uetal./CoastalEngineering
95(2015)
66–76

Longitude (deg)
Latit
ude
(deg
)
−90 −89.9 −89.8 −89.7 −89.6 −89.5 −89.4 −89.3 −89.2 −89.1
29.3
29.4
29.5
29.6
29.7
29.8
29.9
0
0.5
1
1.5
2
2.5
3
3.5
4
4.5
5
Aug 28 29 30 31 Sep 1
0
2
4
6
Date (2012)
Wat
er le
vel (
NA
VD
88, m
)
(b)
(a)
Observed
Base case
No vegetation
Slow moving
Fast moving
Weak wind
Strong wind
PLA−019
Water level(m, NAVD88)
Fig. 5. (a) Distribution ofmaximumwater levels (m, NAVD88) during Hurricane Isaac (2012) in the Breton Sound estuary. (b) Simulated time series of water levels (m, NAVD88) at USGSStation PLA-019 for six different cases (see legends for details) and field measurements (thick red line).
73K. Hu et al. / Coastal Engineering 95 (2015) 66–76
contradicts Sheng et al. (2012). There are two major differences be-tween our study and Sheng et al.'s (2012). Our study area is a realsemi-enclosed estuary with distributions of four marsh types ratherthan their idealized, mild-slope, open coast with a strip distribution ofone Spartina-like marsh type. Additionally, in calculations of MSRR inthis study or Vegetation Dissipation Potential in Sheng et al. (2012),our integral area is fixed, while they used ‘landward area’, which varieswith the surge height.
It is generally acknowledged that the impact of vegetation on stormsurge reduction tends to be greater under the conditions of higher flowvelocity and lower water depth. By using the results in the hurricane-varying experiments, we further examined the relationship betweenMSRR and maximum bulk velocity (Vv,max, defined as the square rootof total kinematic energy divided by half of the total mass) and maxi-mum bulk surge (i.e., Sv,max, defined as total potential energy dividedby half of the product of total mass and gravitational acceleration) ofthe AOI with vegetation. The following relationship was found:
MSRR∝V2v;max
Sαv;maxð5Þ
where the power α indicates the contribution of Sv,max to MSRR. Theoptimized α value is achieved when the correlation coefficient (r) is
closest to 1 (exact linear relationship). As shown in Fig. 7, we obtainedα = 4 with r = 0.9762. The high value of r verifies the proportionalityof Eq. (5). A higher order of Sv,max than that of Vv,max (i.e., α N 2) inEq. (5) implies that the maximum surge height for the AOI is a signifi-cant indicator of MSRR. For instance, an increase in the wind intensitycauses an increased surge height (see Fig. 6d), and results in a decreasedMSRR (see Fig. 6f); on the other hand, a speedup of a hurricane causes adecreased surge height, and results in an increased MSRR. Note thatEq. (5) is a general expression. The specific linear relationship changeswith different AOIs, estuaries and landscapes.
Vegetation properties were shown to affect MSRR substantially;therefore, Eq. (5) was applied to the vegetation-varying experimentsas well. An extra coefficient determined by the relative stem density(Rd) and relative stem height (Rh) was added into the right side ofEq. (5). After optimization with r, we obtained the expression ofRh•Rd0.15 for the extra coefficient, along with r = 0.9834 (Fig. 7). Thesmaller power of 0.15 for Rd, compared to the power of 1 for Rh, sug-gests that MSRR is much more sensitive to the change of stem heightthan that of stem density. In other words, the variation of stem densityis less important to the surge reduction rate. This is consistent with theexperiment of Leonard and Croft (2006) in which S. alterniflora wasused to examine the effect of standing biomass on flow velocity and tur-bulence. Leonard and Croft (2006) found that the mean velocity within
Relative density (Rd)
Rel
ativ
e st
em h
eigh
t (R
h)
(a) (b) (c)3.1
3.2
3.3
3.4
0.5 0.75 1 1.25 1.5 1.75 20.5
0.75
1
1.25
1.5
1.75
2
0
2
4
6
8
Relative forward speed
Rel
ativ
e w
ind
inte
nsity
11.5
2
2.5
33.54
4.5
5
5.56
6.5
7
7.5
0.75 1 1.2 1.50.75
1
1.25
1.5
1.75
Relative density (Rd)
0.25
0.3
0.35
0.4
0.45
0.5
0.55
0.60.65
0.5 0.75 1 1.25 1.5 1.75 20.5
0.75
1
1.25
1.5
1.75
2
0
0.1
0.2
0.3
0.4
0.5
0.6
Relative forward speed
0.05
0.1
0.15
0.2
0.25
0.3
0.35
0.4
0.45
0.5
0.75 1 1.2 1.50.75
1
1.25
1.5
1.75
Relative density (Rd)
0.08
0.1
0.12
0.14
0.16
0.5 0.75 1 1.25 1.5 1.75 20.5
0.75
1
1.25
1.5
1.75
2
0
0.05
0.1
0.15
0.2
0.25
0.3
0.35
0.4
Relative forward speed
0.02
0.04
0.06
0.08
0.1
0.12
0.140.160.18
0.20.220.24
0.260.28
0.3 0.32
0.75 1 1.2 1.50.75
1
1.25
1.5
1.75
MSRRMS (m)MSR (m)
(d) (e) (f)
Fig. 6.Distributions of themaximumsurge (MS), vegetation-inducedmaximumsurge reduction (MSR) andmaximumsurge reduction rate (MSRR) for theupper Breton Sound (R6–R7) innumerical experiments. (a), (b) and (c) show distributions of MS, MSR and MSRR, respectively, for vegetation varying cases. (d), (e) and (f) show distributions of MS, MSR and MSRR,respectively, for hurricane varying cases. Pink plus symbol denotes base case.
74 K. Hu et al. / Coastal Engineering 95 (2015) 66–76
the vegetated canopy was reduced to approximately 50%, and this ratiochanged little when 1/3 or 2/3 of original biomass was removed.
Previous discussion focused on the vegetation impact on the stormsurge reduction rate for the upper BS estuary. The vegetation effects inother regions of BS (Fig. 8) were reflected by the ranges of MSR and
0 1 2 3 4
x 10−3
0
0.05
0.1
0.15
0.2
0.25
0.3
0.35
0.4
0.45
X=Rh Rd0.15 Vv,max2 /S
v,max4
Y=
MS
RR
r =0.9762Y=89.11X+0.0025
r =0.9834Y=83.54X+0.0306
Hurricane varying casesVegetation varying casesBase case
Fig. 7. Proportional relationships between MSRR and the expression by relative stemheight (Rh), relative stem density (Rd), maximum bulk velocity (Vv, max) and bulk surge(Sv. max) with vegetation for the upper Breton Sound in numerical experiments (seelegends for details).
MSRR for four areal extents within the BS estuary. Because the wetlandvegetation was mainly distributed in the middle and upper BS, bothMSR and MSRR for the whole estuary (R1–R7) were very small (lessthan 0.2 m and 10%, respectively). Among all cases, the maximumsurge reduction was 0.7 m in the upper BS estuary (R6–R7) for thevegetation-varying cases, while the maximum reduction rate was 38%
R1−R7 R2−R7 R4−R7 R6−R70
0.05
0.1
0.15
0.2
0.25
0.3
0.35
0.4
Regions
MSR in vegetation varying casesMSR in hurricane varying casesMSRR in vegetation varying casesMSRR in Hurricane varying casesBase case
0.8
0.7
0.6
0.5
0.4
0.3
0.2
0.1
0
MSR (m) MSRR
Fig. 8.Ranges ofMSR (m) andMSRR for four different regions of the Breton Sound estuary(i.e., R1–R7, R2–R7, R4–R7 and R6–R7) in numerical experiments (see legends for details).

75K. Hu et al. / Coastal Engineering 95 (2015) 66–76
for the hurricane-varying cases in the same region. There is a trend thatthe maximum values of both MSR and MSRR increase as the AOIdecreases and moves toward the upper estuary, except that in thevegetation-varying cases,where themaximumMSRR in R4–R7 is slight-ly greater than that in R6–R7. Comparing between two groups, themaximumvalue ofMSRR in the hurricane-varying experiments is largerthan that in the vegetation-varying experiments for most regionsexcept R1–R7. On the contrary, the maximum value of MSR in thevegetation-varying experiments is larger than that in the hurricane-varying experiments for all regions, which shows the importance ofvegetation parameters on absolute surge reduction and implies thatwetland restoration in the lower BS estuary could enhance wetland'srole in protecting a coastal community from storm surge.
6. Summary and conclusions
The impact of vegetation on reducing storm surge by wetlands wasinvestigated in the BS estuary by applying a 3D hydrodynamic modelwhere vegetation was represented by cylindrical structures. After thevalidation of storm surge generated by Hurricane Isaac (2012), a seriesof numerical experiments were carried out based on variations ofrealistic vegetation properties and hurricane parameters within fourareal extents in the BS estuary. Effects of vegetation stem height, stemdensity, wind intensity and forward speed of a hurricane were studied.All four factors affect the maximum storm surge, vegetation-inducedmaximum surge reduction and reduction rate in the area of interest.In the vegetation-varying cases for the upper BS, the maximum surgechanged slightly (less than0.5m)with different vegetation parameters;the vegetation-induced reduction and reduction rate increasedwith thestem height and stem density, and were more sensitive to the stemheight. In the hurricane-varying cases for the upper BS, the maximumsurge changed significantly from less than 1 m to more than 7.5 mwith different hurricane parameters. The vegetation-induced reductionand reduction rate decreased remarkably with an increase in the windintensity; and the reduction rate increased with an increase in theforward speed or a decrease in the wind intensity. It was found thatthe vegetation-induced maximum surge reduction rate varied propor-tionally to the expression involving the maximum bulk velocity andsurge over the area of interest with vegetation, and was more depen-dent on the maximum bulk surge. Vegetation-induced reduction andreduction rate have an increasing trend when the area of interestshrinks from the whole BS estuary to the upper estuary. Among allexperiments, the maximum values of vegetation-induced maximumsurge reduction and reduction rate were 0.7 m in the vegetation-varying cases and 37% in the hurricane-varying cases, respectively, forthe upper BS.
It should be noted that only limited factors were discussed in thispaper. The main limitation of this study is that the flexibility of vegeta-tion is not taken into account explicitly in themodel. Moreover, accord-ing to the CRMS monitoring data, the vegetation type in a specific sitein the BS estuary can change periodically from one marsh type toanother (Visser et al., 2013), thus resulting in changes of spatial dis-tribution of these vegetation types. In terms of hurricane parameters,we fixed the track of Hurricane Isaac and studied Isaac-like hurricanesor tropical storms with different wind intensities and forward speeds.Landfall locations and approaching directions, however, would alsoplay an important role (e.g., Rego and Li, 2009; Wamsley et al., 2010).As such, more comprehensive and accurate studies are required forfurther understanding of vegetation impact on storm surge in estuarineand coastal areas.
Acknowledgments
The study was supported in part by the U.S. National Oceanic andAtmospheric Administration (NOAA) through Louisiana Sea Grant(grant R/OA-15) and by the U.S. National Science Foundation (NSF)
(grants 1115527 and 1010640). Computational resources were provid-ed by the Louisiana Optical Network Initiative (LONI) and LouisianaState University. We would like to thank Eric Swain and two anony-mous reviewers for their constructive review for improving this manu-script. Any opinions, findings, and conclusions or recommendationsexpressed in this paper are those of the authors and do not necessarilyreflect the views of the NOAA and NSF. Any use of trade, product, orfirmnames is for descriptive purposes only and does not imply endorse-ment by the U.S. Government.
References
Baptist, M.J., 2003. A flume experiment on sediment transport with flexible, submergedvegetation. International Workshop on Riparian Forest Vegetated Channels:Hydraulic, Morphological and Ecological Aspects. International Association for Hy-draulic Research, Trento, Italy, pp. 20–22 (Trento, Italy).
Berg, R., 2013. Hurricane Isaac (AL092012) 21 August–1 September 2012. Tropical CycleReport. NOAA National Hurricane Center, Miami, Florida (available at http://www.nhc.noaa.gov/data/tcr/AL092012_Isaac.pdf).
Borsje, B.W., Hulscher, S.J.M.H., Herman, P.M.J., de Vries, M.B., 2009. On the parameteriza-tion of biological influences on offshore sand wave dynamics. Ocean Dynam. 59 (5),659–670.
Bouma, T.J., Van Duren, L.A., Temmerman, S., Claverie, T., Blanco-Garcia, A., Ysebaert, T.,Herman, P.M.J., 2007. Spatial flow and sedimentation patterns within patches ofepibenthic structures: combining field, flume and modelling experiments. Cont.Shelf Res. 27 (8), 1020–1045.
Chen, C., Liu, H., Beardsley, R.C., 2003. An unstructured grid, finite-volume, three-dimensional, primitive equations ocean model: application to coastal ocean andestuaries. J. Atmos. Ocean. Technol. 20 (1), 159–186.
Chen, Q., Wang, L., Tawes, R., 2008. Hydrodynamic response of northeastern Gulf ofMexico to hurricanes. Estuar. Coasts 31 (6), 1098–1116.
Chen, Q., Zhao, H., Liu, D., 2012. Modeling surge-dependent vegetation effects onhurricane-generated waves. Proceedings of the 33rd International Conference onCoastal Engineering, Spain.
Day Jr., J.W., Boesch, D.F., Clairain, E.J., Kemp, G.P., Laska, S.B., Mitsch, W.J., Orth, K.,Mashriqui, H., Reed, D.J., Shabman, L., Simenstad, C.A., Streever, B.J., Twilley, R.R.,Watson, C.C., Wells, J.T., Whigham, D.F., 2007. Restoration of the Mississippi Delta:lessons from hurricanes Katrina and Rita. Science 315 (5819), 1679–1684.
Dietrich, J.C., Zijlema, M., Westerink, J.J., Holthuijsen, L.H., Dawson, C., Luettich Jr., R.A.,Jensen, R.E., Simth, J.M., Stelling, G.S., Stone, G.W., 2011. Modeling hurricane wavesand storm surge using integrally-coupled, scalable computations. Coast. Eng. 58 (1),45–65.
Dykes, J.D., Hsu, Y.L., Kaihatu, J.M., 2003. Application of Delft3D in the nearshore zone.Proc. 5th AMS Coastal Conf, pp. 57–61.
Hu, K., Ding, P., Wang, Z., Yang, S., 2009. A 2D/3D hydrodynamic and sediment transportmodel for the Yangtze Estuary. J. Mar. Syst. 77 (1), 114–136.
Hu, K., Chen, Q., Kimball, K.S., 2012a. Consistency in hurricane surface wind forecasting:an improved parametric model. Nat. Hazards 61 (3), 1029–1050.
Hu, K., Chen, Q., Fitzpatrick, P., 2012b. Assessment of a parametric hurricane surface windmodel for tropical cyclones in the Gulf of Mexico. In: Hickey, K. (Ed.), Advances inHurricane Research — Modelling, Meteorology, Preparedness and Impacts. InTech.ISBN: 978-953-51-0867-2.
Jelesnianski, C.P., Chen, J., Shaffer, W.A., 1992. SLOSH: sea, lake, and overland surges fromhurricanes. NOAA Technical Report, NWS 48. Silver Springs, Maryland.
Kuiper, S.N., 2010. Cross-Shore Morphological Response on Chaland Headland due toHurricanes Gustav and Ike(M.S. thesis) Dept. of Hydraul. Eng., Delft Univ. ofTechnol., Delft, the Netherlands.
Leonard, L.A., Croft, A.L., 2006. The effect of standing biomass on flow velocity andturbulence in Spartina alterniflora canopies. Estuar. Coast. Shelf Sci. 69 (3), 325–336.
Lesser, G.R., Roelvink, J.A., van Kester, J.A.T.M., Stelling, G.S., 2004. Development andvalidation of a three-dimensional morphological model. Coast. Eng. 51 (8),883–915.
Liu, H., Zhang, K., Li, Y., Xie, L., 2013. Numerical study of the sensitivity of mangroves inreducing storm surge and flooding to hurricane characteristics in southern Florida.Cont. Shelf Res. 64, 51–65.
Louisiana Department of Wildlife and Fisheries (LDWF), 2012. Oyster stock assessmentreport of the public oyster areas in Louisiana seed grounds and seed reservations.Oyster Data Report Series. Louisiana Department of Wildlife and Fisheries, BatonRouge, LA (94 pp.).
Luettich, R.A., Westerink, J.J., Scheffner, N.W., 1992. ADCIRC: an advanced three-dimensional circulation model for shelves, coasts and estuaries, Report 1: theoryand methodology of ADCIRC-2DDI & ADCIRC-3DL. Report 1: Theory and Methodolo-gy of ADCIRC-2DDI & ADCIRC-3DL. Technical Report, DRP-92-6. Army Corps ofEngineers, U.S.
Madsen, H., Jakobsen, F., 2004. Cyclone induced storm surge and flood forecasting in thenorthern Bay of Bengal. Coast. Eng. 51 (4), 277–296.
McKee, K.L., Mendelssohn, I.A., Materne, M.D., 2006. Salt marsh dieback in coastal Louisi-ana: survey of plant and soil conditions in Barataria and Terrebonne basins, June2000–September 2001. USGS Open-File Report 2006-1167 (available at http://pubs.usgs.gov/of/2006/1167/).
Monden, M., 2010. Modeling the Interaction Between Morphodynamics and Vegetationin the Nisqually River Estuary(M.S. thesis) Dept. of Hydraul. Eng., Delft Univ. ofTechnol., Delft, the Netherlands.

76 K. Hu et al. / Coastal Engineering 95 (2015) 66–76
Mukai, A., Westerink, J.J., Luettick Jr., R., Mark, D., 2002. Eastcoast 2001: a tidal constituentdatabase for the Western North Atlantic, Gulf of Mexico, and Caribbean Sea. Tech.Rep. ERDC/CHL TR-02-24. U.S. Army Corps of Engineers, (201 pp.).
Nielsen, P., 2009. How storm size matters for surge height. Coast. Eng. 56 (9), 1002–1004.Randall, L.A.J., Foote, A.L., 2005. Effects of managed impoundments and herbivory on
wetland plant production and stand structure. Wetlands 25 (1), 38–50.Rego, J.L., Li, C., 2009. On the importance of the forward speed of hurricanes in storm
surge forecasting: a numerical study. Geophys. Res. Lett. 36, L07609.Rego, J.L., Li, C., 2010. Storm surge propagation in Galveston bay during hurricane Ike. J.
Mar. Syst. 82 (4), 265–279.Resio, D.T., Westerink, J.J., 2008. Modeling the physics of storm surges. Phys. Today 61 (9),
33–38.Rodi, W., 1993. Turbulance Models and Their Application in Hydraulics: A State-of-the-
Art Review. Taylor & Francis Group.Sasser, C.E., Visser, J.M., Mouton, E., Linscombe, J., Hartley, S.B., 2008. Vegetation types in
coastal Louisiana in 2007. U.S. Geological Survey Open-File Report 2008-1224 (avail-able at http://pubs.usgs.gov/of/2008/1224/).
Shchepetkin, A.F., McWilliams, J.C., 2005. The regional oceanic modeling system (ROMS):a split-explicit, free-surface, topography-following-coordinate oceanic model. OceanModell. 9 (4), 347–404.
Sheng, Y.P., Alymov, V., Paramygin, V.A., 2010. Simulation of storm surge, wave, currents,and inundation in the Outer Banks and Chesapeake Bay during Hurricane Isabel in2003: the importance of waves. J. Geophys. Res. 115, C04008.
Sheng, Y.P., Lapetina, A., Ma, G., 2012. The reduction of storm surge by vegetationcanopies: three-dimensional simulations. Geophys. Res. Lett. 39, L20601.
Soniat, T.M., Cozelmann, C.P., Byrd, J.D., Roszell, D.P., Bridevaux, J.L., Suir, K.J., Colley, S.B.,2013. Predicting the effects of proposedMississippi River diversions on oyster habitatquality: application of an oyster habitat suitability index model. J. Shellfish Res. 32(3), 629–638.
Stokstad, E., 2005. After Katrina: Louisiana's wetlands struggle for survival. Science 310(5752), 1264.
Temmerman, S., Bouma, T.J., Govers, G., Wang, Z., de Vries, M.B., Herman, P.M.J., 2005. Im-pact of vegetation on flow routing and sedimentation patterns: three-dimensionalmodeling for a tidal marsh. J. Geophys. Res. 110, F04019.
Temmerman, S., Bouma, T.J., van de Koppel, J., van der Wal, D., de Vries, M.B., Herman,P.M.J., 2007. Vegetation causes channel erosion in a tidal landscape. Geology 35 (7),631–634.
Uittenbogaard, R., 2003. Modelling turbulence in vegetated aquatic flows. InternationalWorkshop on RIParian FORest Vegetated Channels: Hydraulic, Morphological andEcological Aspects, pp. 20–22.
US Army Corps of Engineers (USACE), 1963. Interim Survey Report, Morgan city,Louisiana and Vicinity, serial No. 63. US Army Engineer District, New Orleans, LA.
Visser, J.M., 2007. Hydrologic characteristics of Louisiana's coastal wetland vegetation.Literature Summary for URS Group, Inc. Louisiana State University, Baton Rouge, LA,p. 70810.
Visser, J.M., Reed, D., Steyer, G.D., Callaway, J., Swenson, E.M., Suir, G.M., Suhayda, J., 2003.Wetland nourishment module. In: Twilley, R.R. (Ed.), Coastal Louisiana EcosystemAssessment and Restoration (CLEAR) Model of Louisiana Coastal Area (LCA) Compre-hensive Ecosystem Restoration Plan. Volume I: Tasks 1–8, Final Report to Departmentof Natural Resources, Coastal Restoration Division, Baton Rouge, LA.
Visser, J.M., Duke-Sylvester, S.M., Carter, J., Broussard III, W.P., 2013. A computer model toforecast wetland vegetation changes resulting from restoration and protection incoastal Louisiana. J. Coastal Res. 67 (SI), 51–59.
Wamsley, T.V., Cialone, M.A., Smith, J.M., Atkinson, J.H., Rosati, J.D., 2010. The potential ofwetlands in reducing storm surge. Ocean Eng. 37 (1), 59–68.
Wang, S., McGrath, R., Hanafin, J., Lynch, P., Semmler, T., Nolan, P., 2008. The impact ofclimate change on storm surges over Irish waters. Ocean Modell. 25 (1), 83–94.
Warren, I.R., Bach, H.K., 1992. MIKE 21: a modelling system for estuaries, coastal watersand seas. Environ. Softw. 7 (4), 229–240.
Zhao, H., Chen, Q., 2013. Modeling attenuation of storm surge over deformable vegeta-tion: methodology and verification. J. Eng. Mech. http://dx.doi.org/10.1061/(ASCE)EM.1943-7889.0000704,04014090,04014090.


![Priority Queuesrs/AlgsDS07/06PriorityQueues.pdfPriority Queue Applications • Event-driven simulation. [customers in a line, colliding particles] • Numerical computation. [reducing](https://img.dokumen.tips/doc/110x75/6107e723070cdf40a532e7bf/priority-rsalgsds0706priorityqueuespdf-priority-queue-applications-a-event-driven.jpg)