Embed Size (px)
Citation preview

1
Validation of HyspIRI-TIR On Orbit Calibration
Simon J. Hook, William Johnson, Glynn Hulley, Marc Foote, Robert Radocinski

2
Introduction• “The great strength of satellites, their overarching view of the planet, is
counterbalanced by their great weakness: They are far from the substances (air, land, water) they are trying to measure. Scientifically, the best combination is often to use the satellite and an in situ sensor (one that is in the air or the ocean), with the satellite painting a broad and comprehensive picture and the in situ sensors providing calibration and necessary detail.” -(MacDonald, A. E., The Wild Card in the Climate Change Debate, Issues in Science and Technology Online, 2001.)
• “Scenarios examined in this Assessment, which assume no major interventions to reduce continued growth of world greenhouse gasemissions,indicate that temperatures in the US will rise by about 5-9°F (3-5°C) on average in the next 100 years, which is more than the projected global increase.” - National Assessment Synthesis Team, Climate Change Impacts on the United States: The Potential Consequences of Climate Variability and Change, 2001

3
Outline• Level 1 Validation Framework• Example results from existing sites• Lake Tahoe Site: Layout and Measurements• Salton Sea Site: Layout and Measurements• Field Instrument Calibration and Cross-Cal.• Data Reduction Methodology and Error Budgets• MODIS results• ASTER results• Cross Comparison of ASTER, MODIS and other
instruments• Related work• Publications, Conclusions and Future Plans

4
Validation Framework
• Multi-Component Approach• Monitoring of instrument outputs (BB
performance etc)• Cross comparison of HyspIRI radiance with
other instruments (airborne and spaceborne, emphasize HyTES)
• Validation against in situ targets (Tahoe and Salton Sea)

5
Objectives• Validate the ASTER and MODIS Thermal Infrared Data
and Products (radiance at sensor, surface radiance, surface temperature, surface emissivity)
• Validate the products over the entire EOS mission and provide an absolute reference on product accuracy
• Provide validation continuity between MODIS and VIIRS
• Enable inter-comparison of ASTER and MODIS data with similar data from other instruments, e.g. AATSR, MTI, Landsat (5 and ETM+)

6
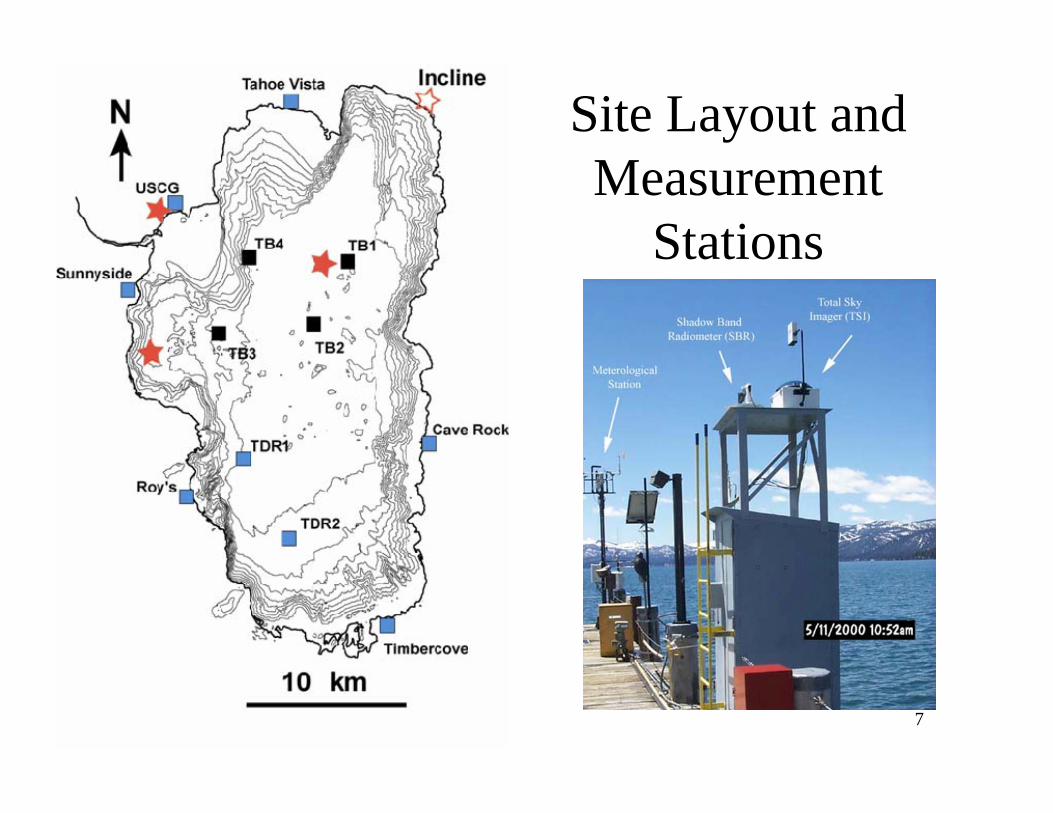
Why Lake Tahoe?
• Large 35 km x 16 km• High 2 km• Available year round (does not freeze in winter).• Homogenous compared with land.• Large annual temperature range 5-25 C.• Freshwater (kind to instruments!)• Good infrastructure and easy access.
7
Site Layout and Measurement
Stations

8
TB3 Installed 11-04-2002
Skin temperature
Air temperature & Rel. Humidity Wind Speed
& Direction
LoggingSystem
BatteriesBulk WaterTemperature
3m

9
Google Earth!
Tb1
Tb2

10
Salton Sea, Platform

11
Radiometer Calibration and Cross-Cal

12
Cross Comparison of Radiometers at Miami
New CEOS sponsored comparison early 2009 (March-May)

13
Means and standard deviations of the estimated skin SST differences between pairs of radiometers for the entire cruise period, and for each half of the cruise
Time 150.50 to 152.00 150.50 to 151.25 151.25 to 152.00Radiometer
Pair Mean (K)
Std.Dev (K)
N Mean (K)
Std.Dev (K)
N Mean (K)
Std.Dev (K)
N
MAE-ISA 0.002 0.135 80 0.005 0.135 69 –0.015 0.135 11 MAE-SIS 0.046 0.066 144 0.046 0.066 74 0.045 0.068 70 MAE-JPL 0.007 0.114 148 0.052 0.111 77 -0.042 0.096 71
MAE-DAR -0.008 0.076 149 0.022 0.071 78 -0.041 0.067 71 ISA-SIS 0.038 0.101 79 0.030 0.101 67 0.085 0.093 12 ISA-JPL 0.026 0.142 81 0.027 0.141 70 0.018 0.150 11
ISA-DAR 0.007 0.114 80 0.019 0.112 69 -0.064 0.107 11 SIS-JPL -0.048 0.099 144 -0.009 0.103 74 -0.088 0.078 70
SIS-DAR -0.053 0.074 144 -0.019 0.054 74 -0.088 0.076 70 JPL-DAR -0.014 0.103 148 -0.028 0.102 77 0.000 0.102 71
14
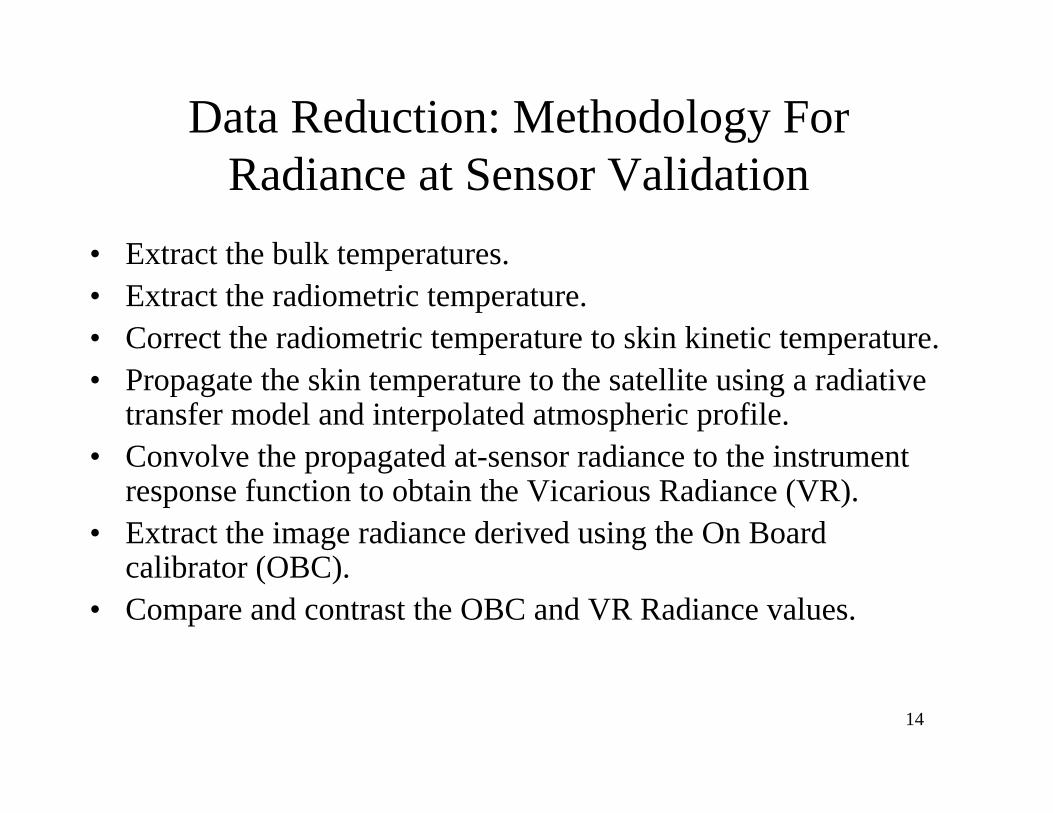
Data Reduction: Methodology For Radiance at Sensor Validation
• Extract the bulk temperatures. • Extract the radiometric temperature.• Correct the radiometric temperature to skin kinetic temperature.• Propagate the skin temperature to the satellite using a radiative
transfer model and interpolated atmospheric profile.• Convolve the propagated at-sensor radiance to the instrument
response function to obtain the Vicarious Radiance (VR).• Extract the image radiance derived using the On Board
calibrator (OBC).• Compare and contrast the OBC and VR Radiance values.

15
2000-09-20-D
MODIS RESULTS

16
MODIS Terra Vicarious and OBC Thermal Infrared Derived Radiances at Lake Tahoe CY2000-2008, v4-5.x
2.0
3.0
4.0
5.0
6.0
7.0
8.0
9.0
2.0 3.0 4.0 5.0 6.0 7.0 8.0 9.0Vicarious Radiance (W/m2.µm.sr)
OB
C R
adia
nce
(W/m
2.µm
.sr)
Band 28 (7.43 µm)Band 29 (8.53 µm)Band 30 (9.73 µm)Band 31 (11.01 µm)Band 32 (12.03 µm)Band 33 (13.37 µm)1x1 line

17
MODIS Terra Vicarious and OBC Thermal Infrared Derived Radiances at Lake Tahoe CY2000-2008, v4-5.x
y = 1.0084x - 0.0394R2 = 0.9918
y = 1.0289x - 0.2031R2 = 0.992
y = 1.0327x - 0.2347R2 = 0.9891
5.5
6.0
6.5
7.0
7.5
8.0
8.5
9.0
5.5 6.0 6.5 7.0 7.5 8.0 8.5 9.0Vicarious Radiance (W/m2.µm.sr)
OB
C R
adia
nce
(W/m
2.µm
.sr)
Band 29 (8.53 µm)Band 31 (11.01 µm)Band 32 (12.03 µm)1x1 lineLinear (Band 29 (8.53 µm))Linear (Band 31 (11.01 µm))Linear (Band 32 (12.03 µm))
Band 29 Band 30 Band 31

18
% Radiance Change in TIR Channels for MODIS Terra at Lake Tahoe CY2000-2008 vz0-7 v4-5.x
-2
-1.5
-1
-0.5
0
0.5
1
1.5
2
2000 2001 2002 2003 2004 2005 2006 2007 2008 All Years
Year
Avg
% R
adia
nce
Diff
(v-o
)/v *
100
b29b31b32
b31,32 spec
other MODIS tir bands
Band 31: 11.01 μm 1% radiance change ≈ 0.65K
In previous presentations only showed nadir data (461 match ups as above) due to manual processing, now have more automated system allowing all clear data to be processed (5219 match ups)

19
% Radiance Change in TIR Channels for MODIS Terra at Lake Tahoe CY2000-2008 v4-5.x
-2
-1.5
-1
-0.5
0
0.5
1
1.5
2
2000 2001 2002 2003 2004 2005 2006 2007 2008 All Years
Year
Avg
% R
adia
nce
Diff
(v-o
)/v *
100
b29b31b32
b31,32 spec
other MODIS tir bands
Band 31: 11.01 μm 1% radiance change ≈ 0.65K
5219 match ups, all viewing angles, some differences associated with incl. extreme viewing angles.

20
% Radiance Change in TIR Channels for MODIS Terra with Mirror AOI at Lake Tahoe CY2000-2008 v4-5.x
-2
-1.5
-1
-0.5
0
0.5
1
1.5
2
10-20 20-30 30-40 40-50 50-60 60-70
Angle of incidence on Mirror
Avg
% R
adia
nce
Diff
(v-o
)/v *
100
b29 b31 b32
Poly. (b29) Poly. (b31) Poly. (b32)
Low and high angle of incidences correspond to low and high viewing zeniths

21
% Radiance Change in TIR Channels for MODIS Terra with Instrument Zenith at Lake Tahoe CY2000-2008, v4-5.x
-2
-1.5
-1
-0.5
0
0.5
1
1.5
2
0-7 7-18 18-28 28-37 37-43 43-51 51-56
Instrument Zenith
Avg
% R
adia
nce
Diff
(v-o
)/v *
100
b29 b31 b32
Poly. (b29) Poly. (b31) Poly. (b32)
Band 31: 11.01 μm 1% radiance change ≈ 0.65K
Error increases with view angle. Most likely cause is change in emissivity with viewing zenith. Note increased path length in atmospheric correction was corrected.

22
MODIS Terra Night Only Vicarious and OBC Mid Infrared Derived Radiances at Lake Tahoe CY2000-2008, v4-5.x
y = 1.0023x + 0.0021R2 = 0.9938
y = 1.0075x + 0.0027R2 = 0.9939
y = 1.0001x + 0.0028R2 = 0.9954
0.1
0.2
0.3
0.4
0.5
0.6
0.1 0.2 0.3 0.4 0.5 0.6Vicarious Radiance (W/m2.µm.sr)
OB
C R
adia
nce
(W/m
2.µm
.sr)
Band 20 (3.79 µm)Band 22 (3.97 µm)Band 23 (4.06 µm)1x1 lineLinear (Band 20 (3.79 µm))Linear (Band 22 (3.97 µm))Linear (Band 23 (4.06 µm))
Band 20 Band 22 Band 23
Can also look at the MIR channels but only use nighttime data to avoid the effects of reflected solar radiation in the mid infrared.

23
% Radiance Change in MIR Channels for MODIS Terra at Lake Tahoe CY2000-2008, v4-5.x
-6
-5
-4
-3
-2
-1
0
1
2
2000 2001 2002 2003 2004 2005 2006 2007 2008
Year
Avg
% R
adia
nce
Diff
(v-o
)/v *
100
b20 b22 b23
In MODIS-Terra MIR channels see small bias, not seen in MODIS-Aqua cause is currently unknown
24
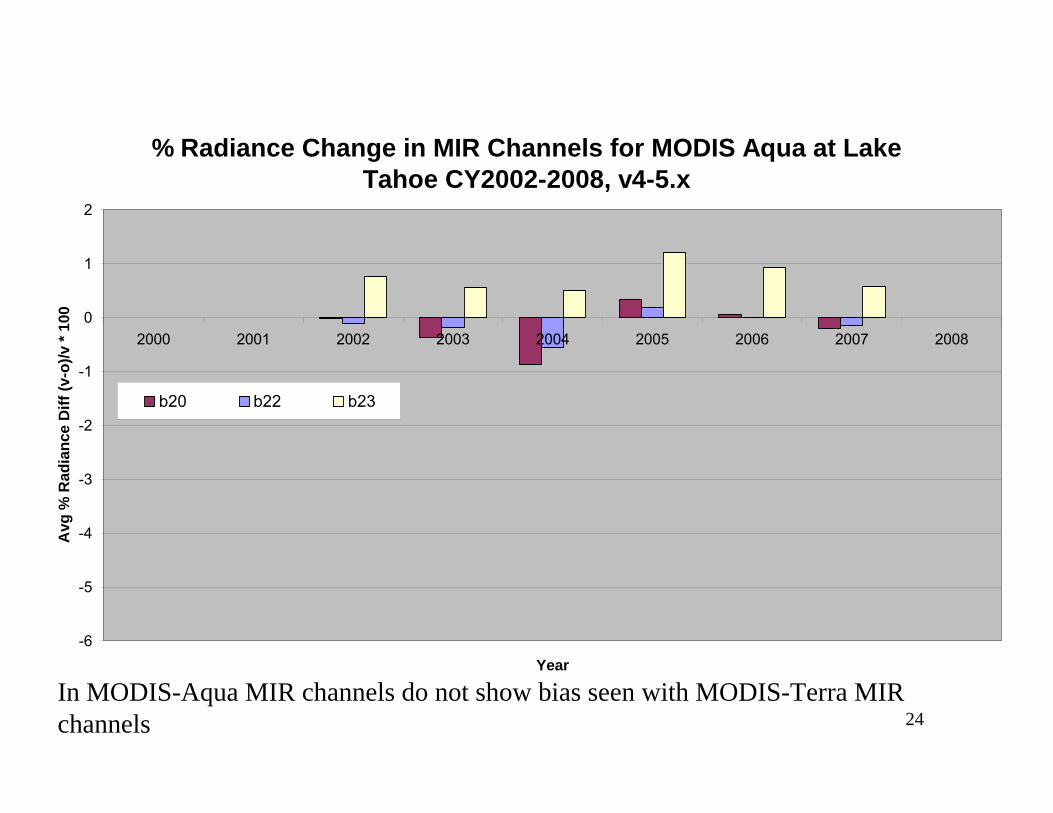
% Radiance Change in MIR Channels for MODIS Aqua at Lake Tahoe CY2002-2008, v4-5.x
-6
-5
-4
-3
-2
-1
0
1
2
2000 2001 2002 2003 2004 2005 2006 2007 2008
Year
Avg
% R
adia
nce
Diff
(v-o
)/v *
100
b20 b22 b23
In MODIS-Aqua MIR channels do not show bias seen with MODIS-Terra MIR channels

25
% Radiance Change in TIR Channels for MODIS Aqua at Lake Tahoe CY2002-2008 v4-5.x
-2
-1.5
-1
-0.5
0
0.5
1
1.5
2
2000 2001 2002 2003 2004 2005 2006 2007 2008 All Years
Year
Avg
% R
adia
nce
Diff
(v-o
)/v *
100
b29b31b32
b31,32 spec
Other MODIS tir bands
Band 31: 11.01 μm 1% radiance change ≈ 0.65K
In MODIS-Aqua TIR Channels are well calibrated, similar to MODIS-Terra

26
CIR Composite of ASTER Bands 321 as RGB
2000-11-07

27
ASTER Vicarious and OBC Thermal Infrared Derived Radiances at Lake Tahoe CY2000-2008, v3.0x
5.5
6.0
6.5
7.0
7.5
8.0
8.5
9.0
5.5 6.0 6.5 7.0 7.5 8.0 8.5 9.0Vicarious Radiance (W/m2.µm.sr)
OB
C R
adia
nce
(W/m
2.µm
.sr)
Band 10 (8.29 µm)Band 11 (8.63 µm)Band 12 (9.08 µm)Band 13 (10.66 µm)Band 14 (11.29 µm)1x1 line

28
ASTER 3x3 pixel % Radiance Difference between Vicarious and OBC Derived Radiances (without correction) -- Band 13 (v2.01-2.21)
-2.0
-1.5
-1.0
-0.5
0.0
0.5
1.0
1.5
2.0
(1/1
4/20
02n)
(2/6
/200
2noo
s)
(6/6
/200
2d)
(6/7
/200
2n)
(6/2
2/20
02d)
(9/2
/200
2noo
s)
(9/1
0/20
02d)
(9/2
6/20
02d)
(10/
12/2
002d
)
(11/
4/20
02do
os)
(11/
29/2
002d
)
(11/
30/2
002n
)
Overpass Date
% R
adia
nce
Diff
eren
ce
(Vic
-OB
C)/V
ic*1
00
Band 13 (10.66 µm)

29
C1 of online RCC DB
7.00 10 -3
7.50 10 -3
8.00 10 -3
8.50 10 -3
9.00 10 -3
0 200 400 600 800 1000 1200
C1
Days
v1.0x
v2.05
v2.06
v2.09
Band 12

30
0.007
0.0075
0.008
0.0085
0.009
0.0095
0.01
0 500 1000 1500 2000 2500
C1 measured by LTCC1 estimated by regression
C1
Coe
ffici
ent
Days Since the Launch
1st Period 2nd Period
Day 1919
New Method for ASTER Coeff.

31
0
1
2
3
4
0 500 1000 1500 2000 2500
Calibration error (Band 12)
V2_300KV2_320KV2_340KV3_300KV3_320KV3_340K
Cal
ibra
tion
erro
r [K
]
Day since Launch
-0.5
0
0.5
1
1.5
2
2.5
0 500 1000 1500 2000 2500
Calibration error (Band 13)
V2_300KV2_320KV2_340KV3_300KV3_320KV3_340K
Calib
ratio
n er
ror [
K]
Day since Launch
Charts from Tonooka-San (ASTER Science Team

32Provided the Tonooka-san correction is performed, ASTER absolute radiometric accuracy is a little worse than MODIS
% Radiance Change in TIR Channels for ASTER at Lake Tahoe CY2000-2008, Filtered, v3.x
-2
-1.5
-1
-0.5
0
0.5
1
1.5
2
2000 2001 2002 2003 2004 2005 2006 2007 2008 All Years
Year
Avg
% R
adia
nce
Diff
(v-o
)/v *
100
b10 b11 b12 b13 b14
MODIS other TIR bands
Band 31: 11.01 μm 1% radiance change ≈ 0.65K
ASTER specification is 1K for at sensor temps between 270-340K

33
Other Instruments being validated at Lake Tahoe CA/NV
Landsat 5
Landsat ETM+

34
6
7
8
9
10
11
12
13
6 7 8 9 10 11 12 13
ETM+ Band 6 Low Gain VC/Image Comparison For Lake Tahoe, Salton Sea And Railroad Valley Playa From June 2004 Through September 2005
y = -0.56277 + 1.0758x R= 0.99779
VC
Der
ived
ASR
(W
/m^
2/sr
/µm
)
Image Derived ASR Low Gain (W/m^2/sr/µm)
26 Dates103 Individual Estimates
RRV
SS
LT Blue line is one-to-one
Recent Results for ETM+

35
Landsat 7, Channel 6 Delta Temperature between Vicarious and OBC BT's at Lake Tahoe CA/NV 2001-2008
-1.50
-1.00
-0.50
0.00
0.50
1.00
1.50
2001 2002 2003 2004 2005 2006 2007 2008
Time
Vica
rious
-OB
C T
empe
ratu
re
Yearly Average

36
Summary and Conclusions• Lake Tahoe CA/NV automated validation site used to assess radiometric accuracy
of ASTER and MODIS Mid and TIR data and products. Site established in 1999 as part of EOS. These sites will be used for HyspIRI with similar sites if available.
• New automated validation approach has been implemented allowing all clear scenes to be validated (1000’s of scenes). Validation covers a broad surface temperature range (4-25°C) and provides a long-term validation dataset for ASTER and MODIS (Terra and Aqua) for the entire duration of the mission.
• Results indicate that– The absolute radiometric calibration of the MODIS TIR bands (Aqua and
Terra) has been met or improved upon each year for entire duration of mission.
– The absolute radiometric calibration of MODIS MIR bands for Aqua has been met or improved upon each year for the duration of the mission but the MODIS-Terra MIR bands show a small bias (~1.5% MODIS is too warm).
– The problem with the ASTER radiometric calibration coefficient updates has been addressed for version 3.x with new software and the change to on-demand Level 1B. Further checking required when each new fit equation is introduced. Users need to be aware of Tonooka-san adjustment.
• A second validation site has been established at Salton Sea allowing much higher temperatures to be validated. Results will be reported out at the next site review.