Embed Size (px)
Citation preview
HyspIRI Thermal & ECOSTRESS
Presented at:
HyspIRI Symposium
Simon J. Hook and the HyspIRI and ECOSTRESS Teams,
NASA/Jet Propulsion Laboratory
Jet Propulsion Laboratory, California Institute of Technology, Pasadena, CA
© 2015 California Institute of Technology. Government sponsorship acknowledged.

• HyspIRI Thermal
• ECOSTRESS (ECOsystem Spaceborne Thermal Radiometer Experiment on Space Station)
• Summary and Conclusions
Outline
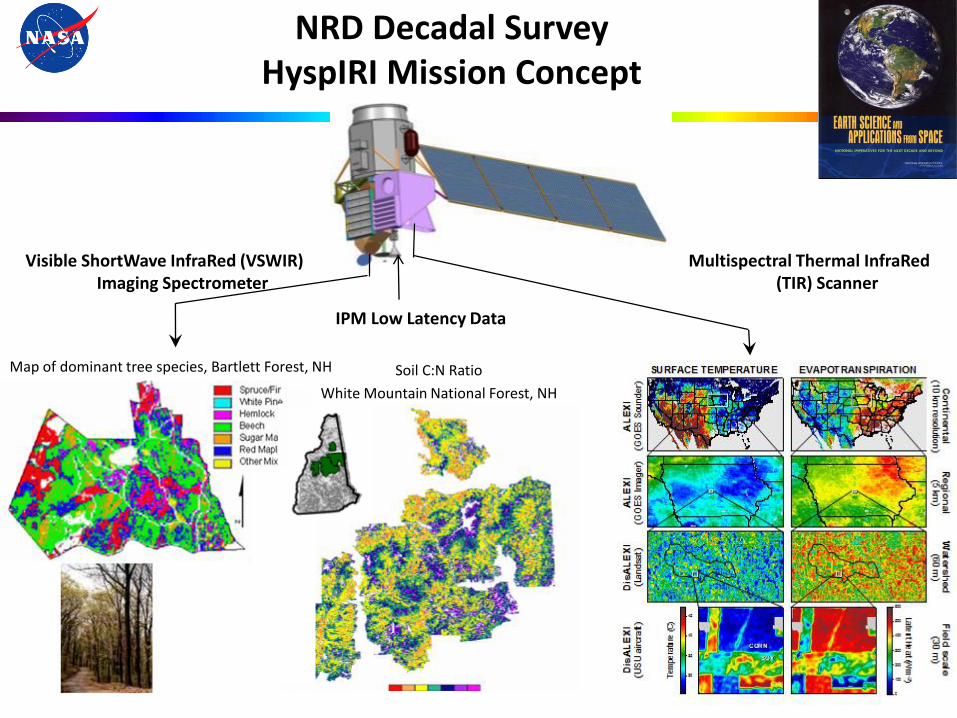
Visible ShortWave InfraRed (VSWIR) Imaging Spectrometer
Map of dominant tree species, Bartlett Forest, NH Soil C:N Ratio
White Mountain National Forest, NH
Multispectral Thermal InfraRed(TIR) Scanner
NRD Decadal SurveyHyspIRI Mission Concept
IPM Low Latency Data
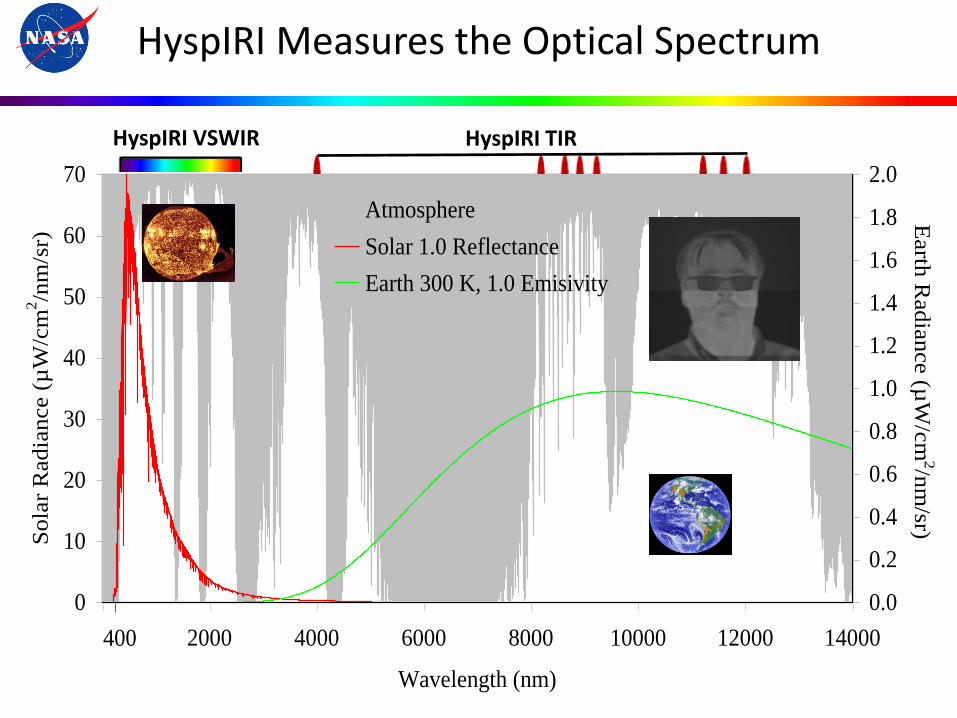
HyspIRI Measures the Optical Spectrum
0
10
20
30
40
50
60
70
0 2000 4000 6000 8000 10000 12000 14000
Wavelength (nm)
Sola
r R
adia
nce (
µW
/cm
2/n
m/s
r)
0.0
0.2
0.4
0.6
0.8
1.0
1.2
1.4
1.6
1.8
2.0
Atmosphere
Solar 1.0 Reflectance
Earth 300 K, 1.0 Emisivity
Earth
Radia
nce (µ
W/c
m2/n
m/sr)
HyspIRI VSWIR HyspIRI TIR
0
10
20
30
40
50
60
70
0 2000 4000 6000 8000 10000 12000 14000
Wavelength (nm)
Sola
r R
ad
ian
ce (
µW
/cm
2/n
m/s
r)
0.0
0.2
0.4
0.6
0.8
1.0
1.2
1.4
1.6
1.8
2.0
Atmosphere
Solar 1.0 Reflectance
Earth 300 K, 1.0 Emisivity
Earth
Rad
ian
ce (µ
W/c
m2/n
m/sr)
5
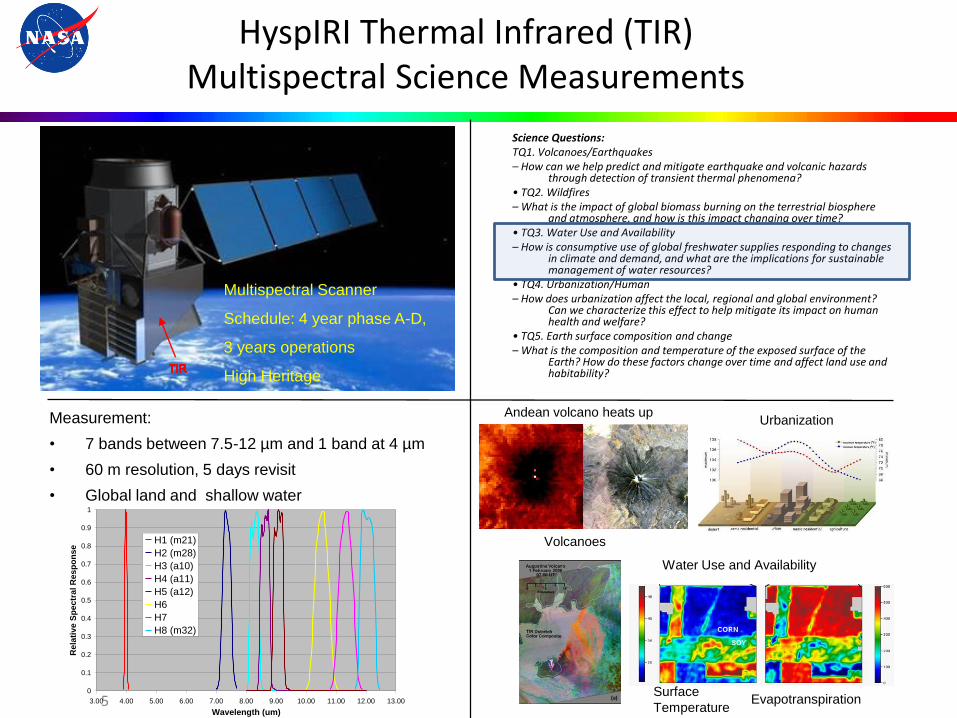
Science Questions:TQ1. Volcanoes/Earthquakes– How can we help predict and mitigate earthquake and volcanic hazards
through detection of transient thermal phenomena?• TQ2. Wildfires– What is the impact of global biomass burning on the terrestrial biosphere
and atmosphere, and how is this impact changing over time?• TQ3. Water Use and Availability– How is consumptive use of global freshwater supplies responding to changes
in climate and demand, and what are the implications for sustainable management of water resources?
• TQ4. Urbanization/Human– How does urbanization affect the local, regional and global environment?
Can we characterize this effect to help mitigate its impact on human health and welfare?
• TQ5. Earth surface composition and change– What is the composition and temperature of the exposed surface of the
Earth? How do these factors change over time and affect land use and habitability?
Measurement:
• 7 bands between 7.5-12 µm and 1 band at 4 µm
• 60 m resolution, 5 days revisit
• Global land and shallow water
Volcanoes
Urbanization
Water Use and Availability
Surface
TemperatureEvapotranspiration
Andean volcano heats up
0
0.1
0.2
0.3
0.4
0.5
0.6
0.7
0.8
0.9
1
3.00 4.00 5.00 6.00 7.00 8.00 9.00 10.00 11.00 12.00 13.00
Wavelength (um)
Rela
tive S
pectr
al R
esp
on
se
H1 (m21)
H2 (m28)
H3 (a10)
H4 (a11)
H5 (a12)
H6
H7
H8 (m32)
Multispectral Scanner
Schedule: 4 year phase A-D,
3 years operations
High Heritage
HyspIRI Thermal Infrared (TIR) Multispectral Science Measurements
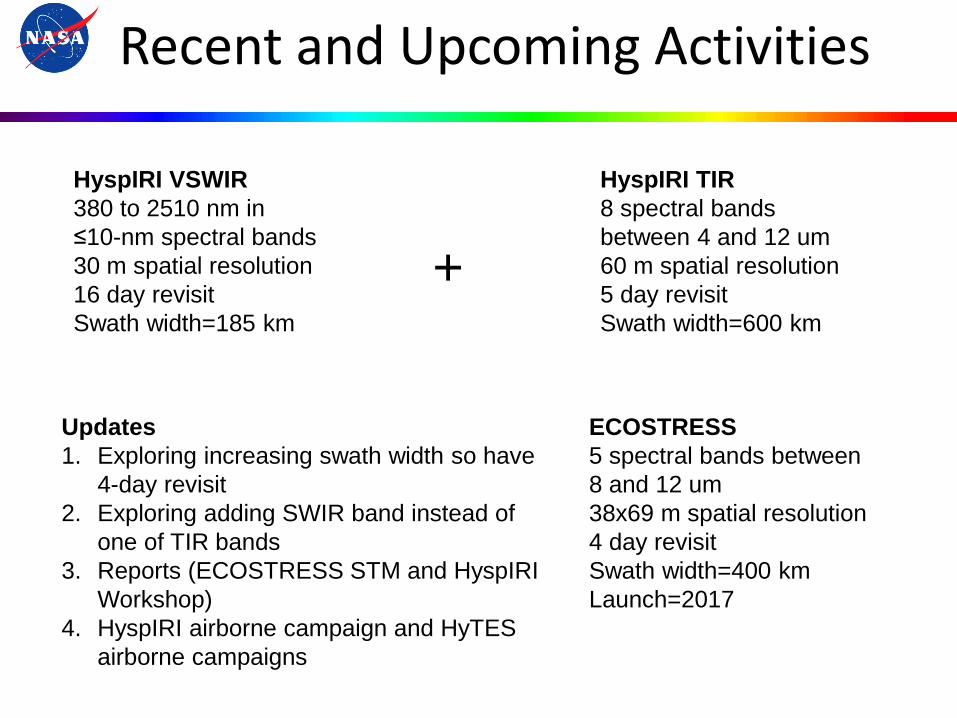
HyspIRI VSWIR
380 to 2510 nm in
≤10-nm spectral bands
30 m spatial resolution
16 day revisit
Swath width=185 km
HyspIRI TIR
8 spectral bands
between 4 and 12 um
60 m spatial resolution
5 day revisit
Swath width=600 km
ECOSTRESS
5 spectral bands between
8 and 12 um
38x69 m spatial resolution
4 day revisit
Swath width=400 km
Launch=2017
Updates
1. Exploring increasing swath width so have
4-day revisit
2. Exploring adding SWIR band instead of
one of TIR bands
3. Reports (ECOSTRESS STM and HyspIRI
Workshop)
4. HyspIRI airborne campaign and HyTES
airborne campaigns
Recent and Upcoming Activities
+
ECOsystem Spaceborne Thermal Radiometer Experiment on Space
Station
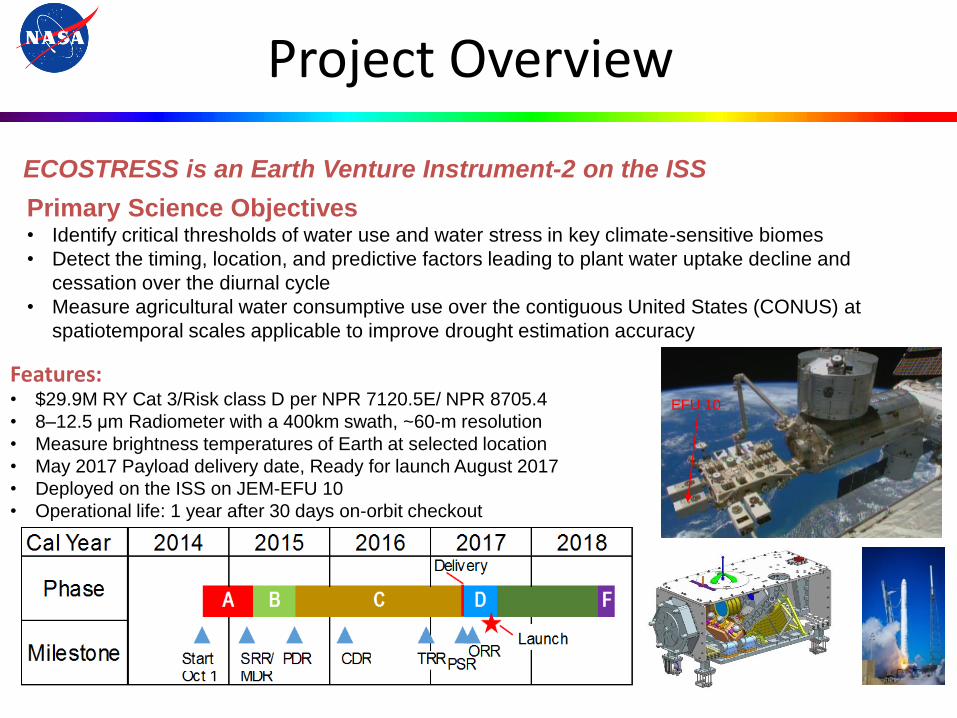
Project Overview
Features:• $29.9M RY Cat 3/Risk class D per NPR 7120.5E/ NPR 8705.4
• 8–12.5 μm Radiometer with a 400km swath, ~60-m resolution
• Measure brightness temperatures of Earth at selected location
• May 2017 Payload delivery date, Ready for launch August 2017
• Deployed on the ISS on JEM-EFU 10
• Operational life: 1 year after 30 days on-orbit checkout
Primary Science Objectives• Identify critical thresholds of water use and water stress in key climate-sensitive biomes
• Detect the timing, location, and predictive factors leading to plant water uptake decline and
cessation over the diurnal cycle
• Measure agricultural water consumptive use over the contiguous United States (CONUS) at
spatiotemporal scales applicable to improve drought estimation accuracy
ECOSTRESS is an Earth Venture Instrument-2 on the ISS
EFU 10

Mission Concept
ECOSTRESS Payload Installation on JEM-EF
Data Collection
MOS and Ground and Space NetworkScience Data Processing
EOL Payload disposal via
Dragon Trunk re-entry
Dragon-Trunk Falcon-9 LV
M3
Relay
FPA
M1 Baffle
Vacuum
Window
Fold Mirror
Lyot Stop
and 60K BaffleNadir 51o Field of View
Scan
Mirror
Nadir
Baffle
Spectral Filters
M1
M2
Scan
Mirror
M1M2
Vacuum
Enclosure Cover
Yoke
Prototype PHyTIR
Instrument
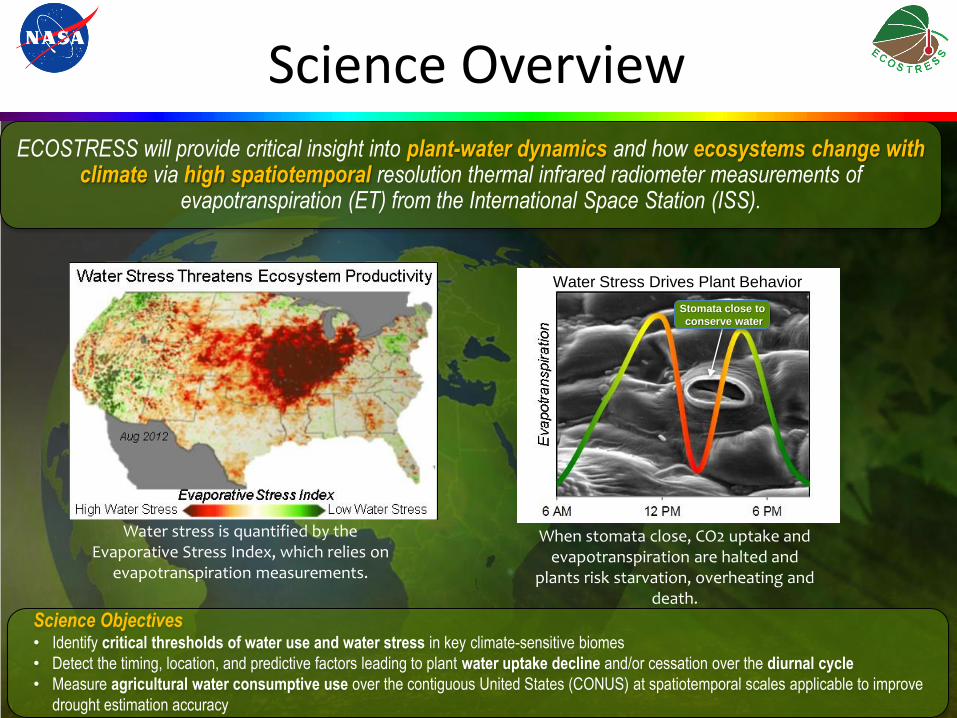
Science Overview
ECOSTRESS will provide critical insight into plant-water dynamics and how ecosystems change with climate via high spatiotemporal resolution thermal infrared radiometer measurements of
evapotranspiration (ET) from the International Space Station (ISS).
Water stress is quantified by the Evaporative Stress Index, which relies on
evapotranspiration measurements.
When stomata close, CO2 uptake and evapotranspiration are halted and
plants risk starvation, overheating and death.
Stomata close to
conserve water
Science Objectives• Identify critical thresholds of water use and water stress in key climate-sensitive biomes
• Detect the timing, location, and predictive factors leading to plant water uptake decline and/or cessation over the diurnal cycle
• Measure agricultural water consumptive use over the contiguous United States (CONUS) at spatiotemporal scales applicable to improve
drought estimation accuracy
Water Stress Drives Plant Behavior
Boreal Forests
Agriculture
Tropical/DryTransition Forests
0 0.005Uncertainty in WUE (GPP/ET)
(1901-2009)
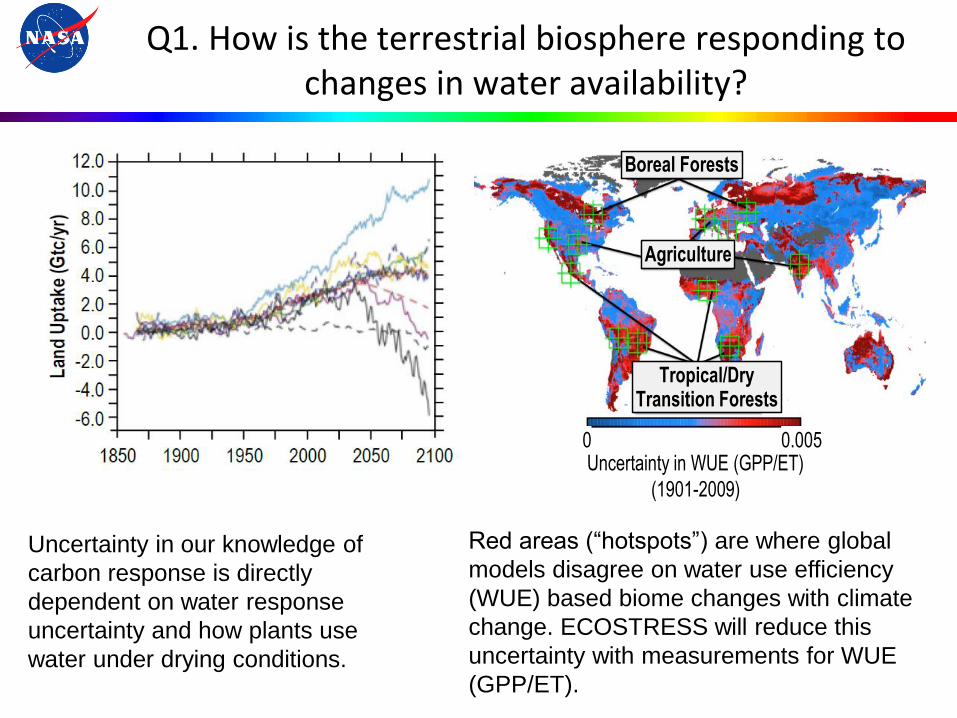
Q1. How is the terrestrial biosphere responding to changes in water availability?
Uncertainty in our knowledge of
carbon response is directly
dependent on water response
uncertainty and how plants use
water under drying conditions.
Red areas (“hotspots”) are where global
models disagree on water use efficiency
(WUE) based biome changes with climate
change. ECOSTRESS will reduce this
uncertainty with measurements for WUE
(GPP/ET).
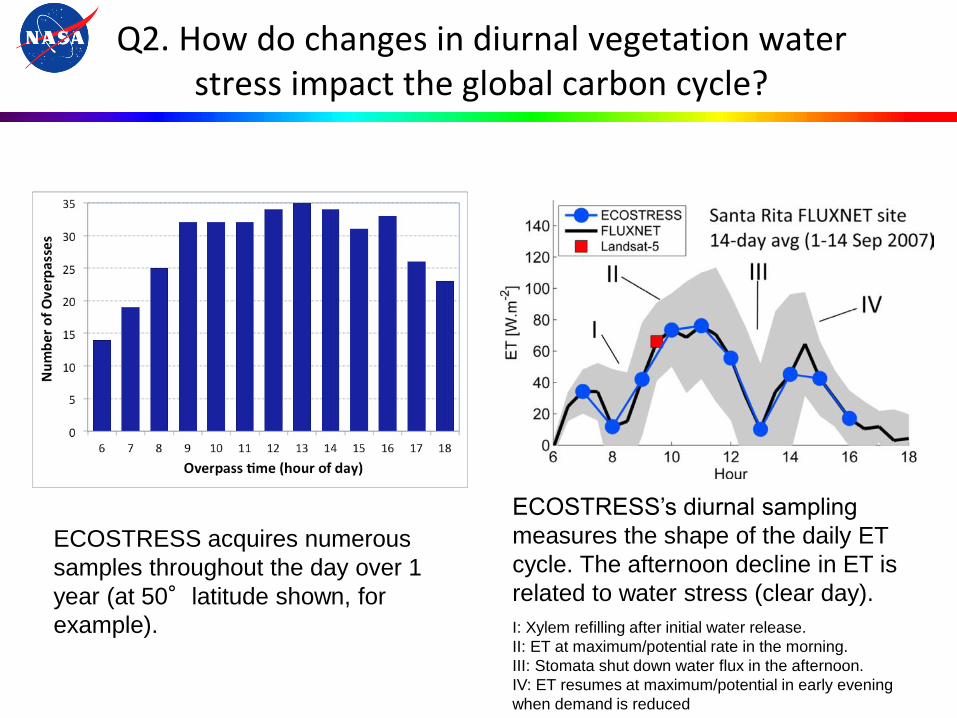
Q2. How do changes in diurnal vegetation water stress impact the global carbon cycle?
I: Xylem refilling after initial water release.
II: ET at maximum/potential rate in the morning.
III: Stomata shut down water flux in the afternoon.
IV: ET resumes at maximum/potential in early evening
when demand is reduced
ECOSTRESS acquires numerous
samples throughout the day over 1
year (at 50°latitude shown, for
example).
ECOSTRESS’s diurnal sampling
measures the shape of the daily ET
cycle. The afternoon decline in ET is
related to water stress (clear day).

Q3. Can agricultural vulnerability be reduced through advanced monitoring of agricultural water consumptive use
and improved drought estimation?
Probability of producing valid ET
estimates when satellite revisit time is 16
days (lower-right inset) vs. 4 days
ECOSTRESS’s spatial resolution will
distinguish fine-scale landscape
heterogeneity such as agricultural systems
(top) and riparian corridors (bottom) similar
to Landsat (left), whereas MODIS (right)
does not.
ECOSTRESS’s temporal
resolution provides a 9-fold
decrease in ET error relative to
Landsat.
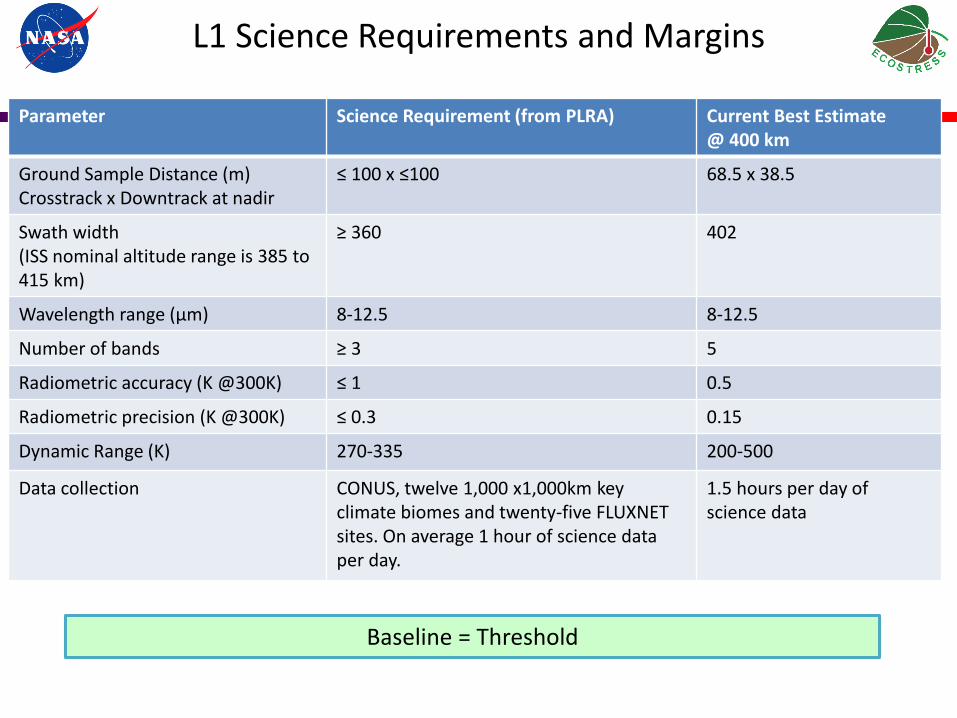
L1 Science Requirements and Margins
Parameter Science Requirement (from PLRA) Current Best Estimate @ 400 km
Ground Sample Distance (m) Crosstrack x Downtrack at nadir
≤ 100 x ≤100 68.5 x 38.5
Swath width (ISS nominal altitude range is 385 to 415 km)
≥ 360 402
Wavelength range (µm) 8-12.5 8-12.5
Number of bands ≥ 3 5
Radiometric accuracy (K @300K) ≤ 1 0.5
Radiometric precision (K @300K) ≤ 0.3 0.15
Dynamic Range (K) 270-335 200-500
Data collection CONUS, twelve 1,000 x1,000km key climate biomes and twenty-five FLUXNET sites. On average 1 hour of science data per day.
1.5 hours per day of science data
Baseline = Threshold

ECOSTRESS Science Data Products
Data Product
Description
Initial Availability to NASA DAAC
Median Latency in Product Availability to NASA DAAC after Initial Delivery
NASA DAAC Location
Level 0 Raw collected telemetry 6 months after IOC 12 weeks To be assigned by NASA SMD/ESD
Level 1 Calibrated GeolocatedRadiances
6 months after IOC 12 weeks To be assigned by NASA SMD/ESD
Level 2 Surface temperature and emissivity
6 months after Level 1 data products are available
12 weeks To be assigned by NASA SMD/ESD
Level 3 Evapotranspiration 2 months after Level 2 data products are available
12 weeks To be assigned by NASA SMD/ESD
Level 4 Water use efficiency and evaporative stress index
2 months after Level 3 data products are available
12 weeks To be assigned by NASA SMD/ESD
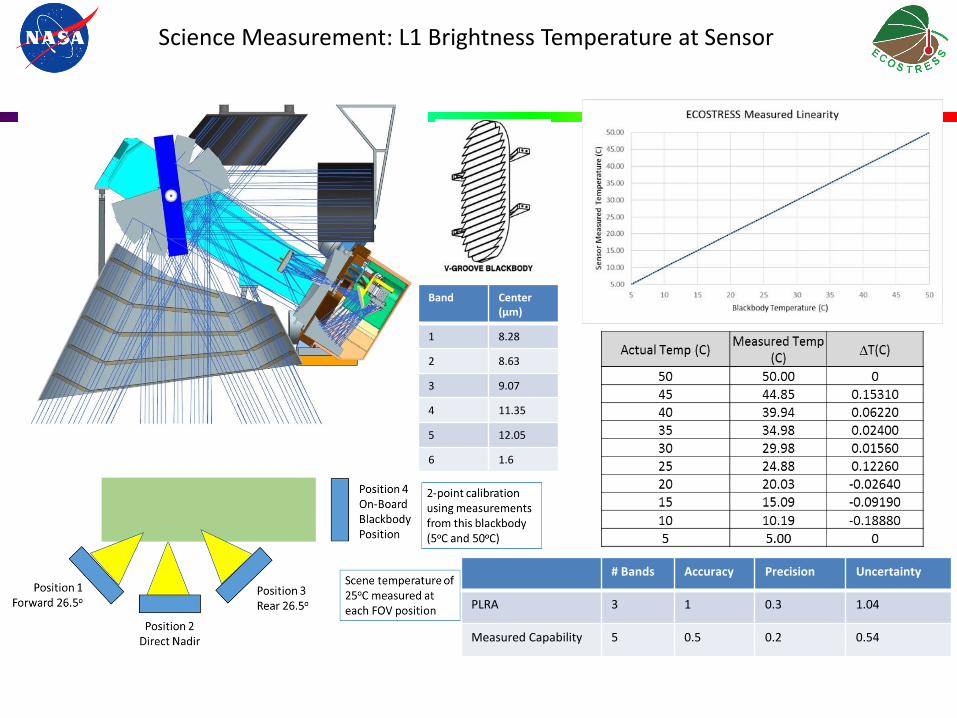
Science Measurement: L1 Brightness Temperature at Sensor
Band Center(µm)
1 8.28
2 8.63
3 9.07
4 11.35
5 12.05
6 1.6
# Bands Accuracy Precision Uncertainty
PLRA 3 1 0.3 1.04
Measured Capability 5 0.5 0.2 0.54
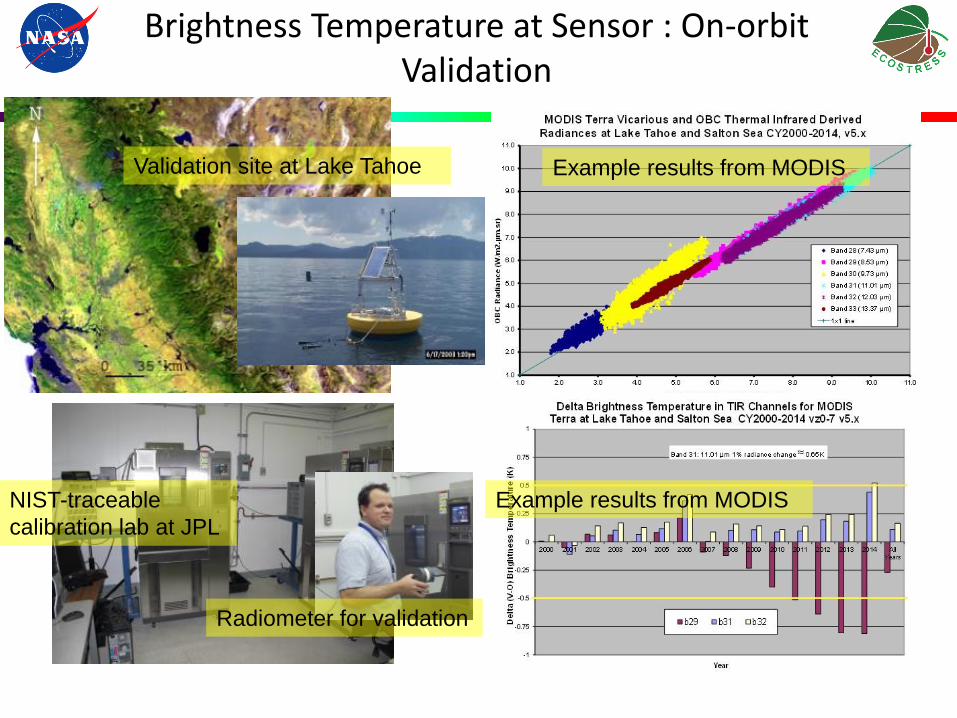
Brightness Temperature at Sensor : On-orbit Validation
NIST-traceable
calibration lab at JPL
Radiometer for validation
Validation site at Lake Tahoe Example results from MODIS
Example results from MODIS

Calibration
Atmospheric Correction
T-E SeparationDay/Night or
TES
Atmospheric Profiles
Water vapor scaling
L2 Temperature and Emissivity
Emissivity Calibration
L1 Brightness Temperature at Sensor
Input Parameter Input Uncertainty (Accuracy, Precision, Uncertainty) [K]
Air temperature 1.5K (0.15, 0.01, 0.15)
Relative humidity 20% (0.21, 0.18, 0.28)
Ozone x2 (0.11, 0.02, 0.11)
T-E separation 0.1 K NET (0.10, 0.11, 0.15)
Modeled case (0.30, 0.21, 0.37)
Nominal Capability (2.00, 0.30, 2.02)
Science Measurement: L2 Surface Temperature and Emissivity
Emissivity CalibrationRadiative Transfer
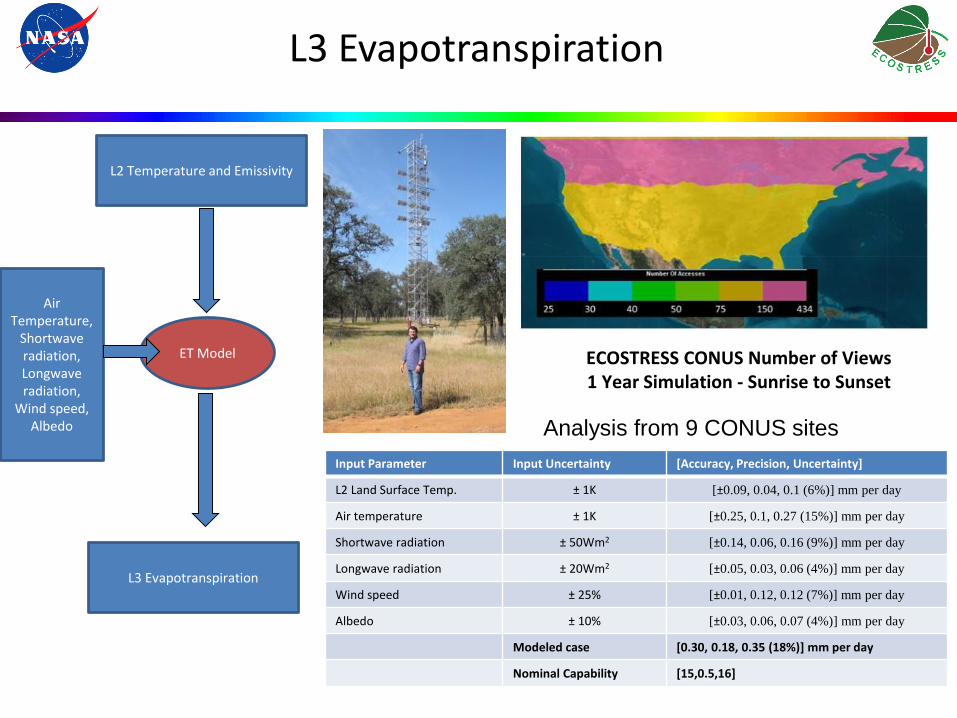
ET Model
Air Temperature,
Shortwave radiation,Longwave radiation,
Wind speed,Albedo
L2 Temperature and Emissivity
L3 Evapotranspiration
Input Parameter Input Uncertainty [Accuracy, Precision, Uncertainty]
L2 Land Surface Temp. ± 1K [±0.09, 0.04, 0.1 (6%)] mm per day
Air temperature ± 1K [±0.25, 0.1, 0.27 (15%)] mm per day
Shortwave radiation ± 50Wm2 [±0.14, 0.06, 0.16 (9%)] mm per day
Longwave radiation ± 20Wm2 [±0.05, 0.03, 0.06 (4%)] mm per day
Wind speed ± 25% [±0.01, 0.12, 0.12 (7%)] mm per day
Albedo ± 10% [±0.03, 0.06, 0.07 (4%)] mm per day
Modeled case [0.30, 0.18, 0.35 (18%)] mm per day
Nominal Capability [15,0.5,16]
L3 Evapotranspiration
Analysis from 9 CONUS sites
ECOSTRESS CONUS Number of Views1 Year Simulation - Sunrise to Sunset

HyTES Validation
HyTES Image Acquired on 9 JUL 2014
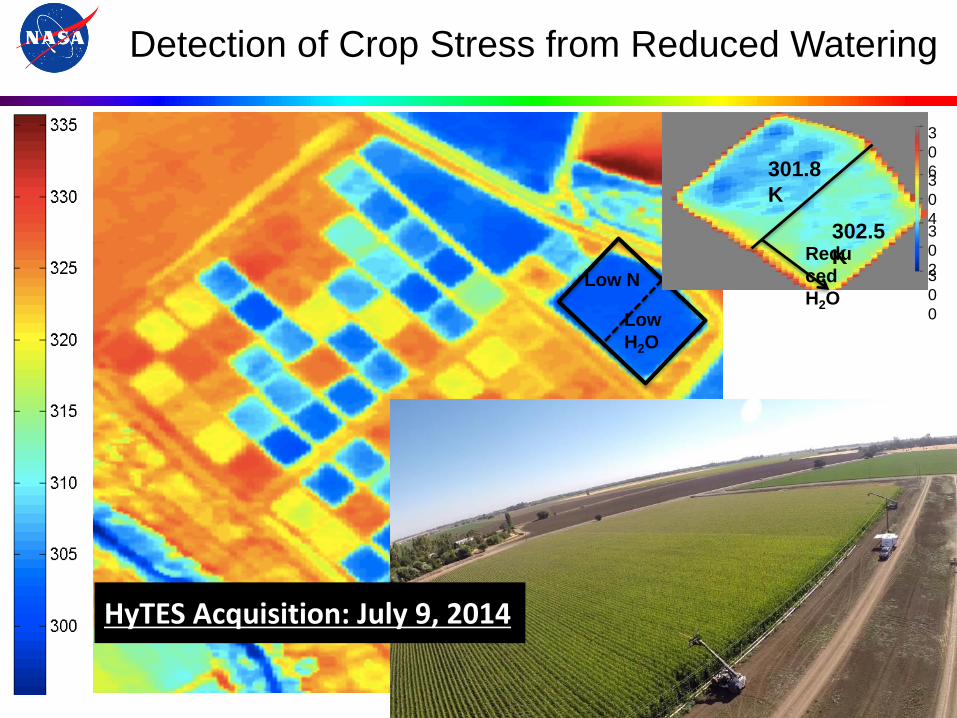
Low N
Low
H2O
3
0
63
0
43
0
23
0
0
Redu
ced
H2O
301.8
K
302.5
K
HyTES Acquisition: July 9, 2014
Detection of Crop Stress from Reduced Watering
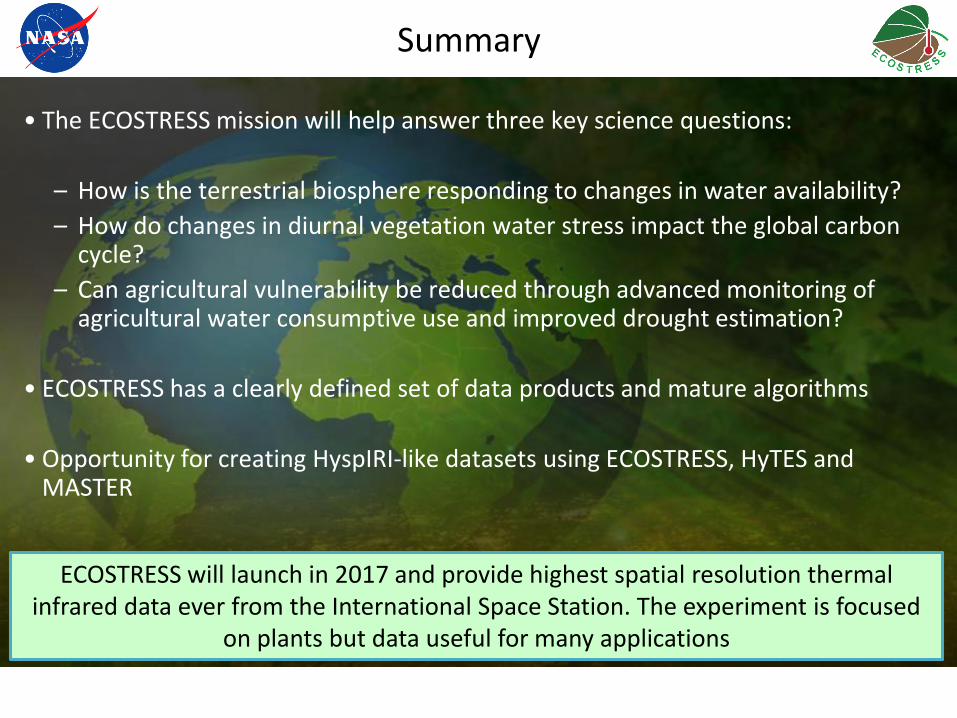
Summary
• The ECOSTRESS mission will help answer three key science questions:
– How is the terrestrial biosphere responding to changes in water availability?
– How do changes in diurnal vegetation water stress impact the global carbon cycle?
– Can agricultural vulnerability be reduced through advanced monitoring of agricultural water consumptive use and improved drought estimation?
• ECOSTRESS has a clearly defined set of data products and mature algorithms
• Opportunity for creating HyspIRI-like datasets using ECOSTRESS, HyTES and MASTER
ECOSTRESS will launch in 2017 and provide highest spatial resolution thermal infrared data ever from the International Space Station. The experiment is focused
on plants but data useful for many applications
Movie Time