Embed Size (px)
Citation preview

HyspIRI VSWIR Science Measurement and Instrument Concept Baseline
Robert O. Green*, Carl Bruce*, Elizabeth Middleton** and The HyspIRI Team
23 August 2011
*Jet Propulsion Laboratory, California Institute of Technology
**Goddard Space Flight Center

Visible ShortWave InfraRed (VSWIR) Imaging Spectrometer
Map of dominant tree species, Bartlett Forest, NH Soil C:N Ratio White Mountain National Forest, NH
Multispectral Thermal InfraRed (TIR) Scanner
NRD Decadal Survey HyspIRI Mission Concept
IPM Low Latency Data

HyspIRI Measures the Optical Spectrum
0
10
20
30
40
50
60
70
0 2000 4000 6000 8000 10000 12000 14000
Wavelength (nm)
Sola
r Rad
ianc
e (µ
W/c
m2 /n
m/s
r)
0.0
0.2
0.4
0.6
0.8
1.0
1.2
1.4
1.6
1.8
2.0AtmosphereSolar 1.0 ReflectanceEarth 300 K, 1.0 Emisivity
Earth R
adiance (µW/cm
2/nm/sr)
HyspIRI VSWIR HyspIRI TIR
0
10
20
30
40
50
60
70
0 2000 4000 6000 8000 10000 12000 14000
Wavelength (nm)
Sola
r Rad
ianc
e (µ
W/c
m2 /n
m/s
r)
0.0
0.2
0.4
0.6
0.8
1.0
1.2
1.4
1.6
1.8
2.0AtmosphereSolar 1.0 ReflectanceEarth 300 K, 1.0 Emisivity
Earth R
adiance (µW/cm
2/nm/sr)

• Key HyspIRI climate objectives from the Decadal Survey and IPCC – Ecosystem Measurement for Climate Feedback – Black Carbon/Dust Effects on Snow and Ice – Carbon Release from Biomass Burning – Evapotranspiration and Water Use and Availability – Critical Volcanic Eruption Parameters
• Imaging Spectrometer (VSWIR) – Pattern and Spatial Distribution of Ecosystems and their Components – Ecosystem Function, Physiology and Seasonal Activity – Biogeochemical Cycles – Changes in Disturbance Activity – Ecosystem and Human Health – Earth Surface and Shallow Water Substrate Composition
• Combined Imaging Spectrometer and Multi-Spectral Thermal Science – Coastal habitats, and inland aquatic environments – Wildfires – Volcanoes – Ecosystem Function and Diversity – Land surface composition and change – Human Health and Urbanization
HyspIRI VSWIR Decadal Survey Science and Decadal Survey Climate Science

Example: Imaging Spectroscopy Mapping Wetland Dominants 2010 LA
Vegetation mapped cleanly across scene boundaries • Phragmites (phau) • Spartina alterniflora (spal) • Spartina patens (sppa) • Vigna luteola (vilu) D. Roberts, UCSB
AVIRIS Vegeta5on Spectra

Spectroscopy for Species/Functional-type, Biogeochemistry and Physiological Condition
PLSR wavelength selection for one species PLSR weighting for foliar Nitrogen
Measuring spectral shift from Lignin : Cellulose ratio

7
Surface Compositional Derived with Imaging Spectrometer Measurements

Nepal Himalaya
1956
2007
What is causing the downwasting and retreat of Himalayan glaciers and
elsewhere? For snow and ice in the Himalaya, increasing temperatures and increasing dust and soot combine in unknown proportions to accelerate melt through their changes in albedo. Imaging Spectrosocpy is the only approach that allows us to attribute changes in albedo into effects from temperature and dust/black carbon and at a f ine enough spatial resolut ion that heterogeneous terrain can be resolved. Multi-band sensors such as NPOESS VIIRS have neither capacity.
Kaspari et al. in prep
Required Measurement: Global glacial covered area, full solar spectrum, < 100 m spatial, <20 days revisit
Albedo and Black Carbon/Dust Effects on Snow/Ice
Dust/BC Temp/grain sizeDust/BC Temp/grain size

HyspIRI: Coral, Benthic Composition, and Aquatic Vegetation
Variation in shallow water HyspIRI-type spectral signatures in coral environments.
Emergent vegetation signatures are well suited to the HyspIRI measurement. For example mapping in the Gulf of Mexico coastal region with AVIRIS measurements.
400 450 500 550 600 650 700 7500
0.005
0.01
0.015
0.02
0.025
0.03
Wavelength (nm)
R rs (sr‐1)
Andros mud, 5.4 mOrganic sand, 5.2 mSpare seagrass, 5.5 mGrapestone light, 5.6 mDense Seagrass, 5.3 mRed macroalgae, 5.6 mBrown macroalgae, 5.3 mGrapestone dark, 5.7 m
Variation in shallow water HyspIRI-type spectral signatures in seagrass beds and benthic habitat materials
Variation in HyspIRI-type spectral signatures of floating aquatic vegetation (e.g. Kelp)

HyspIRI VSWIR Science Measurements HyspIRI is a global mission, measuring land and shallow aquatic habitats at 60 meters and deep oceans and ice sheets at 1km every 19 days (VSWIR) HyspIRI’s VSWIR imaging spectrometer directly measures the full solar reflected spectrum of the Earth from 380 – 2500nm at 10 nm.
VSWIR at 60 m
1000 m

HyspIRI VSWIR SNR and Uniformity Characteristics
Wavelength
Cross Track Sample Depiction -Grids are the detectors -Dots are the IFOV centers -Colors are the wavelengths Requirement Spectral Cross-Track >95% cross-track uniformity {<0.5 nm min-max over swath} Spectral-IFOV-Variation >95% spectral IFOV uniformity {<5% variation over spectral range}
Benchmark Radiances
Uniformity Requirement
Signal-to-Noise Ratio

Seasonal and Annual Cloud Probability Maps Validate the HyspIRI Coverage Requirements
12

HyspIRI VSWIR Coverage
Sites with 10 and more EO-1 collectsLocation of EO-1 collects MSO study sites
MSO
Other
GLS
• EO-1 Hyperion acquisitions in 10 years. Technology demonstration sampling mission with deep ESTO contribution.
• HyspIRI VSWIR provides complete terrestrial coverage every 19 days.
• It would take Hyperion 100 years to acquire what HyspIRI measures in 1 year.
OUTLINE
1. Introduction 2. Key Requirements &
Performance 3. VSWIR Concept 4. Technology Readiness &
Heritage
VSWIR - Instrument Concept
Mass (CBE) 55Kg Power (Ave.) 41Watts
HyspIRI – VSWIR

Key VSWIR Requirements
Radiometric Requirement Status
Range & Sampling 0 to 1.5 x benchmark radiance, 14 bits Demonstrated via analysis and 14 bit ADC bread board electronics
Accuracy >95% absolute radiometric, 98% on‐orbit reflectance, 99.5% stability
Demonstrated – AVIRIS, MaRS
Precision (SNR) See spectral plots at benchmark radiances Demonstrated via analysis
Linearity >99% characterized to 0.1 % Demonstrated via test, MaRS and CAO-VSWIR
Polarization <2% sensi5vity, characterized to 0.5 % Demonstrated via analysis of design and test data on the grating
Scattered Light <1:200 characterized to 0.1% Demonstrated in MaRS and CAO-VSWIR
Spectral Requirement Status
Range 380 to 2500 nm (solar reflected spectrum) Demonstrated – AVRIS, MaRS, M3
Sampling <= 10 nm {uniform over range} Demonstrated – MaRS, M3
Response <= 13 nm (FWHM) {uniform over range} Demonstrated – MaRS, M3
Accuracy <0.5 nm Demonstrated – MaRS, M3, CAO-VSWIR

Key VSWIR Requirements Spa*al Requirement Status
Range >145 km Demonstrated by design and analysis (150 km)
X‐track Sampling >2400 Demonstrated by design and analysis (2500)
Sampling <= 60m (Nadir) Demonstrated by design and analysis
Response <= 1.2X sampling (FWHM) Demonstrated by MaRS and M3
Uniformity
Spectral Cross‐Track >95% cross‐track uniformity {<0.5 nm min‐max over swath}
Demonstrated by MaRS and M3
Spectral‐IFOV‐Varia5on
>95% spectral IFOV uniformity {<5% varia5on over spectral range}
Demonstrated by MaRS and M3
Other Key Requirement Status
Data rate ~ 300 Mbits per second Met by preliminary architecture and parts selection – all required parts are at or above TRL 6
Compression 3:1 lossless Met by algorithm test on MaRS data. Algorithms implemented in breadboard electronics and flight FPGA
Pointing Knowledge 60m radius (3σ) Met by analysis and the use of ground tie points
Mass <55 kg Met by current design with 30% margin – working to increase margin

Instrument Approach • Selected: Offner spectrometer (Hyperion, CRISM, M3, ARTEMIS, COMPASSair, NGair)
– Full range from 380 to 2500 nm demonstrated. Efficiency for high SNR optimized with multiple blaze grating demonstrated. Uniformity from design through alignment demonstrated. Snapshot acquisition detector. Dispersion efficiency tunable to optimize use of detector.
• Prism dispersion spectrometer – Dispersion is non-uniform. Cross-track and spectral-IFOV uniformity not inherent in optical design.
Dispersion efficiency not tunable in detail to optimize use of detector full well. • Wedge/Linear-variable filter spectrometer
– Full spectral range coverage from 380 to 2500 nm has not been demonstrated maintaining 10 nm spectral sampling and response function. Filter uniformity is a concern over wide spectral and spatial domain. Fast, high throughput, beams interplay with filter spectral bandpass undermines uniformity.
• Fourier Transform Spectrometer – Dispersion is non constant with wavelength. Not typically built to operate below 1 micron. Detector
dynamic range and photon shot noise concern. Architecture for > 2000 cross track elements and >200 spectral channels not identified. Not well suited for wide or moderate field of view. Requires IMC.
• Liquid Crystal Tunable & Acousto-Optical Tunable – Time sequential acquisition undermines uniformity. Low TRL, polarization sensitive. Limited
spectral range. Requires IMC.

HyspIRI VSWIR Concept
Spectrometers (2x) • 2 identical Offner spectrometers
• Each contains: - E-Beam grating - Si air slits - FPA assembly
Optics • Front End Telescope consists of a primary spherical mirror and a secondary aspherical mirror • Back End Spectrometers consist of 2 optimized Offner spectrometers
Radiator • Area 0.6m2
• M3 technology heritage
Electronics • M3 Derivative 4x
• Electronic concept is based upon available flight approved parts
• Ins. control, Data Compression, mode control FP A (2x)
• Mount is adjustable in 6 DOF
• Thermal strap connects mount to radiator
• Includes integral OSF
Detectors • Teledyne 6604b detectors, scaled from 6604a detectors flown on M3
• Analog output
• Each spectrum readout as snapshot, so that there is no time delay, yaw, or jitter impact to the spectral-IFOV-uniformity.
Baffle/Cover/Cal Panel • Launch cover • Used as a solar reflectance calibration target • Hyperion Heritage

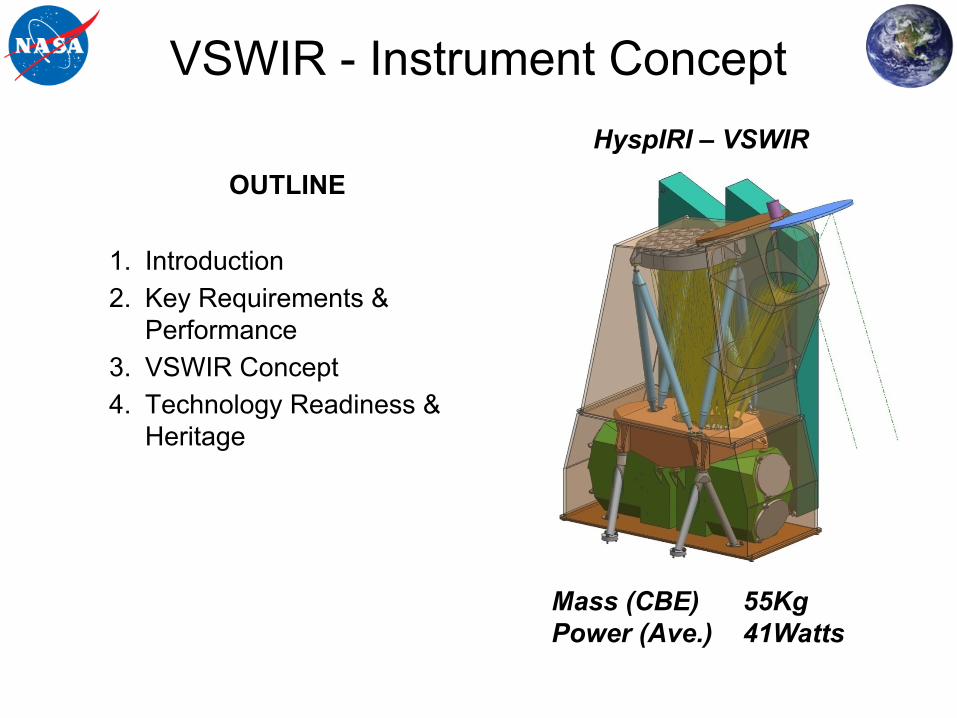
Concept Technologies are Proven Work Continues to Lower Risk
1) Uniform Offner spectrometer (Mouroulis Design)
2) Finely adjustable optics and detector mounts that can be locked within fraction of a micron (0.1 microns)
3) Electron beam fabricated gratings (large ruling period)
4) Electron beam fabricated air slits (non-uniformity < .05 microns)
5) Alignment and calibration sources and methodologies to achieve and verify requirements.

• Key HyspIRI climate objectives from the Decadal Survey and IPCC – Ecosystem Measurement for Climate Feedback – Black Carbon/Dust Effects on Snow and Ice – Carbon Release from Biomass Burning – Evapotranspiration and Water Use and Availability – Critical Volcanic Eruption Parameters
• Imaging Spectrometer (VSWIR) – Pattern and Spatial Distribution of Ecosystems and their Components – Ecosystem Function, Physiology and Seasonal Activity – Biogeochemical Cycles – Changes in Disturbance Activity – Ecosystem and Human Health – Earth Surface and Shallow Water Substrate Composition
• Combined Imaging Spectrometer and Multi-Spectral Thermal Science – Coastal habitats, and inland aquatic environments – Wildfires – Volcanoes – Ecosystem Function and Diversity – Land surface composition and change – Human Health and Urbanization
The HyspIRI VSWIR Concept Enables the Full Set of Decadal Survey Science and Science
Applications and Climate Science

Questions?

Backup
Concept Technologies are Proven Work Continues to Lower Risk
1) Uniform Offner spectrometer (Mouroulis Design)
2) Finely adjustable optics and detector mounts that can be locked within fraction of a micron (0.1 microns)
3) Electron beam fabricated gratings (large ruling period)
4) Electron beam fabricated air slits (non-uniformity < .05 microns)
5) Alignment and calibration sources and methodologies to achieve and verify requirements.