Embed Size (px)
Citation preview
CALIFORNIA ENVIRONMENTAL PROTECTION AGENCY
REGIONAL WATER QUALITY CONTROL BOARD CENTRAL VALLEY REGION
Upper Sacramento River TMDL for Cadmium,
Copper & Zinc
Final Report
April 2002
STA
TE OF CALIFORNIA
RE
GIO
NA
LW
ATER QUALITY CONTRO
LB
OA
RD
★ ★
CENTRALVALLEYREGION
State of California
California Environmental Protection Agency
REGIONAL WATER QUALITY CONTROL BOARD CENTRAL VALLEY REGION
Robert Schneider, Chair
Karl E. Longley, Vice Chair Beverly Alves, Member Alson Brizard, Member
Christopher Cabaldon, Member Mark Salvaggio, Member Robert K. Fong, Member
Cher A. Kablanow, Member
Gary M. Carlton, Executive Officer
3443 Routier Road, Suite A Sacramento, California 95827-3003
Phone: (916) 255-3000
CalNet: 8-494-3000
D I S C L A I M E R
This publication is a technical report by staff of the California Regional Water Quality Control Board, Central Valley Region.
No policy or regulation is either expressed or intended.
CALIFORNIA ENVIRONMENTAL PROTECTION AGENCY
REGIONAL WATER QUALITY CONTROL BOARD CENTRAL VALLEY REGION
Upper Sacramento River TMDL for Cadmium,
Copper & Zinc
Final Report
April 2002
REPORT PREPARED BY:
SACRAMENTO RIVER TMDL UNIT

Page intentionally left blank.
Upper Sacramento River TMDL for Metals April 2002 i
EXECUTIVE SUMMARY
The Central Valley Regional Water Quality Control Board (Regional Board) has determined that the
25-mile segment of the upper Sacramento River between Keswick Dam and Cottonwood Creek near Balls
Ferry in Shasta County is impaired because the water periodically contains levels of dissolved cadmium,
copper, and zinc that exceed water quality standards developed to protect aquatic life. Historically, the
elevated metals levels resulted in anadromous (chinook salmon and steelhead trout) fish mortality (“fish
kills”). The elevated metal concentrations also contributed to progressive declines in anadromous fish
populations in the Sacramento River. The impairment results primarily from discharges of acid mine
drainage (AMD) – with elevated levels of cadmium, copper, and zinc – from inactive mines in the upper
Sacramento River watershed, predominantly from the Iron Mountain Mines (IMM) site upstream of
Keswick Dam and other mines upstream of Shasta Dam.
The Regional Board has developed a Total Maximum Daily Load (TMDL) program for dissolved
cadmium, copper, and zinc loading into the upper Sacramento River because of these exceedances of
water quality standards. A TMDL represents the maximum load of a pollutant that a waterbody can
receive and still meet water quality standards. A TMDL report describes the reductions needed to meet
water quality standards and allocates those reductions among the sources in the watershed. Regional
Board staff proposes implementing the water quality objectives listed in Table 1 as numeric targets for
this TMDL.
Table 1. Proposed Numeric Targets for Dissolved Cadmium, Copper, and Zinc (a)
Metal Acute Numeric Target
(micrograms per liter [µg/l]) Chronic Numeric Target (µg/l)
Cadmium 0.22 (b) 0.22 (b)
Copper 5.6 (b) 4.1 (c)
Zinc 16 (b) 16 (b)
(a) The proposed numeric targets are hardness dependent; the numbers in this table are based on a hardness of 40 milligrams per liter as calcium carbonate.
(b) Central Valley Region Water Quality Control Plan trace element water quality objectives (maximum concentrations) for Sacramento River and its tributaries above State Highway 32 Bridge at Hamilton City (CVRWQCB, 1998a).
(c) California Toxics Rule Criteria for Freshwater Aquatic Life Protection (4-day continuous concentration criteria, not to be exceeded more than once every three year period) for priority toxic pollutants in the State of California for inland surface waters (USEPA, 2000a).
According to recent water quality studies, the number of exceedances of the numeric targets has notably
decreased during the past ten years. These decreases reflect the improvements made to water quality by
remedial actions at the IMM site and other mines and improved coordination of Spring Creek Reservoir
Upper Sacramento River TMDL for Metals April 2002 ii
(built to provide some limited control of releases from the IMM site) and Keswick Reservoir releases.
However, metal loading at times remains high enough to cause periodic exceedances of the water quality
objectives. Exceedances of the dissolved copper numeric targets have occurred during each of the past
six years on the Sacramento River below Keswick Dam, and during three of the past six years on the
Sacramento River below Shasta Dam. Exceedances of the dissolved cadmium and zinc numeric targets
have occasionally occurred on the Sacramento River below Shasta and Keswick Dams. The exceedances
typically corresponded to times of heavy rainfall runoff during the December-to-April period that cause
the Spring Creek Reservoir to reach capacity and/or times that the Shasta Reservoir or Spring Creek
Power Plant dilution releases are reduced for the purposes of storage and flood control. In addition,
occasional exceedances below Keswick Dam are driven by Shasta Dam releases that have elevated
concentrations of dissolved copper and/or zinc.
Regional Board staff expects that the proposed remediation activities scheduled for IMM and other mine
sites during the next five years will address exceedances of the proposed numeric targets below Keswick
Dam. Staff based this determination on the following:
1. The U.S. Environmental Protection Agency (USEPA) Superfund Program’s water quality modeling indicated that the proposed remediation activities at the IMM site − in coordination with current site remediation activities − would control more than 95% of total IMM site releases and therefore result in significantly decreasing the frequency of numeric target exceedances below Keswick Dam.
2. Anticipated load reductions resulting from ongoing and proposed remediation activities at mines in the Shasta Lake area would improve the water quality of both the Shasta Dam and Keswick Dam releases.
For these reasons, staff proposes the following 5-year TMDL water management strategy in accordance
with this TMDL report and other USEPA and Regional Board remediation plans:
• During the summer of 2001, the USEPA Superfund Program began implementation of proposed remediation activities that include the collection and treatment of AMD-contaminated surface water discharges from the area sources in the Slickrock Creek watershed at the IMM site; the activities will take approximately two years to complete.
• Responsible parties will conduct ongoing and proposed remediation activities at mines in the Shasta Lake area.
• Regional Board staff will increase monitoring in Shasta Lake to determine the sources and variability of dissolved metal concentrations in Shasta Dam releases during the past three years. Staff will develop mine remediation and other activities as needed to address Shasta Dam release concentrations that exceed 1.3 µg/l dissolved copper and 3.9 µg/l dissolved zinc.
• Regional Board staff will require NPDES-permitted dischargers to monitor dissolved cadmium, copper, and zinc, and flow to quantify their dissolved metal loads, and if
Upper Sacramento River TMDL for Metals April 2002 iii
significant loads are detected, staff will establish effluent limits and continuous monitoring in renewed permits.
• U.S. Bureau of Reclamation (USBR), USEPA, Regional Board, and other regional agencies will continue monitoring water quality conditions in upper Sacramento River water.
• Regional Board staff will evaluate the ambient metal concentration data collected by its staff, other agencies, and dischargers to determine whether the remediations enable dissolved metal concentrations in Sacramento River water to comply with the proposed numeric targets. In addition, staff will evaluate dissolved metal loads contributed by NPDES dischargers downstream of Keswick Dam. Staff will coordinate TMDL reviews with USEPA’s 5-Year Reviews for the IMM site scheduled for 2003 and 2008.
• After three years of monitoring data have been collected following the completion of remediation activities at Slickrock Creek, Regional Board staff will work with the USBR, USEPA, California Department of Fish and Game, and State Water Resources Control Board to modify the USBR dam operations Memorandum of Understanding established in 1980 (1980 MOU) to ensure maximum efficiency in managing releases from the Spring Creek Debris Dam (SCDD).
Regional Board staff bases this strategy on the following assumptions:
• Pending revision of the 1980 MOU, the USBR will continue to operate the SCDD and related facilities in a reasonable and prudent manner in compliance with operations criteria set forth in the 1980 MOU, 1992 Central Valley Project Operations Criteria and Plan, and 1993 Biological Opinion for the Operation of the Federal Central Valley Project and the California State Water Project.
• The existing AMD collection and treatment facilities at IMM will be operated to provide maximum removal of metals in accordance with a court-approved consent decree.
• Regional Board staff will enforce existing permits on mines in the Shasta Lake areas to assure maximum removal or containment of heavy metals.
• Responsible parties will increase remediation efforts at mines in the Shasta Lake area as needed during the next five to ten years.
Based on the evaluation of the magnitude and frequency of exceedance (if any) during the three years
following the completion of the USEPA’s Slickrock Creek remediation activities, Regional Board staff
will consider whether to recommend the removal of the upper Sacramento River from the
CWA 303(d) List.
Upper Sacramento River TMDL for Metals April 2002 iv
TABLE OF CONTENTS
Executive Summary .......................................................................................................................................... i Table of Contents............................................................................................................................................ iv List of Appendices .......................................................................................................................................... vi List of Tables .................................................................................................................................................. vi List of Figures ................................................................................................................................................vii List of Acronyms ..........................................................................................................................................viii 1 Introduction.............................................................................................................................................. 1 2 Problem Statement ................................................................................................................................... 4
2.1 Definition of a Problem Statement ................................................................................................... 4 2.2 The Problem ..................................................................................................................................... 4 2.3 Recent Water Quality Data and Water Quality Standards ............................................................... 5
2.3.1 Decrease in Frequency of Exceedances over Time................................................................ 5 2.3.2 Seasonal Variability ............................................................................................................... 7 2.3.3 Water Quality Characteristics of Downstream Reach ........................................................... 8
3 Background .............................................................................................................................................. 9 3.1 Watershed Characteristics ................................................................................................................ 9
3.1.1 Physiography & Geology ...................................................................................................... 9 3.1.2 Climate and Hydrology........................................................................................................ 10 3.1.3 Land Use & Critical Habitat ................................................................................................ 13
3.2 Mining and Acid Mine Drainage in the Upper Sacramento River Watershed ............................... 14 3.2.1 Acid Mine Drainage............................................................................................................. 14 3.2.2 Brief History of Mining in the Upper Sacramento River Watershed................................... 15
3.3 Effects of Dams and Diversions on Sacramento River Hydrology ................................................ 21 3.3.1 Dams and Diversions in the Iron Mountain Mines Region ................................................. 21 3.3.2 Red Bluff Diversion Dam and Anderson-Cottonwood Irrigation District Dam .................. 27
4 Effects of Cadmium, Copper, and Zinc on Aquatic Life ....................................................................... 29 4.1 Physical Characteristics of Cadmium, Copper, and Zinc............................................................... 29
4.1.1 Cadmium.............................................................................................................................. 29 4.1.2 Copper ................................................................................................................................ 29 4.1.3 Zinc ................................................................................................................................ 29
4.2 General Effects on Biota ................................................................................................................ 30 4.2.1 Accumulation in Aquatic Organisms................................................................................... 30 4.2.2 Toxicity of Heavy Metals to Aquatic Organisms ................................................................ 31 4.2.3 Bioavailability and Mixture Interactions ............................................................................. 31
4.3 Effects on Biota in the Upper Sacramento River ........................................................................... 32 4.3.1 Documented Fish Kills ........................................................................................................ 33 4.3.2 Salmonid Population Decline .............................................................................................. 33 4.3.3 Effects on Other Species...................................................................................................... 34
5 Source Analysis...................................................................................................................................... 35 5.1 Introduction .................................................................................................................................... 35 5.2 Sources of Cadmium, Copper, and Zinc in the Upper Sacramento River Watershed.................... 35 5.3 Available Data................................................................................................................................ 39
Upper Sacramento River TMDL for Metals April 2002 v
5.4 Source Load Calculation Methods ................................................................................................. 42 5.5 Evaluation of Source Loads ........................................................................................................... 43
5.5.1 Dissolved Copper Source Loads.......................................................................................... 44 5.5.2 Dissolved Zinc Loads .......................................................................................................... 48 5.5.3 Dissolved Cadmium Loads .................................................................................................. 51
5.6 Evaluation of Dissolved Metal Mass Balances and Water Balances ............................................. 54 5.6.1 Mass Balances for Keswick Reservoir................................................................................. 55 5.6.2 Mass Balances for the Sacramento River (Keswick Dam to Bend Bridge)......................... 57
6 Numeric Targets..................................................................................................................................... 60 6.1 Definition of a Numeric Target ...................................................................................................... 60 6.2 Identification of the Target Media.................................................................................................. 60 6.3 Target Levels.................................................................................................................................. 61
6.3.1 Basin Plan Water Quality Objectives .................................................................................. 62 6.3.2 California Toxics Rule Criteria............................................................................................ 64 6.3.3 Proposed Numeric Targets................................................................................................... 65
6.4 Comparison of Numeric Targets to Historical Conditions............................................................. 66 6.5 Compliance with Federal and State Antidegradation Policy.......................................................... 66
7 Linkage Analysis.................................................................................................................................... 68 7.1 Introduction .................................................................................................................................... 68 7.2 Conceptual Relationships ............................................................................................................... 68
7.2.1 Assimilative Capacity of the Sacramento River Upstream of Keswick Dam...................... 70 7.2.2 Assimilative Capacity of the Sacramento River Downstream of Keswick Dam................. 72
7.3 Numeric Modeling ......................................................................................................................... 74 7.3.1 Modeling of Current Conditions.......................................................................................... 76 7.3.2 Modeling of Anticipated Conditions ................................................................................... 77
8 Load Reduction Allocations................................................................................................................... 80 8.1 Definition of Allocations................................................................................................................ 80 8.2 Load Reduction Allocation for Sources above Keswick Dam....................................................... 80
8.2.1 Load Reduction for Iron Mountain Mines Site.................................................................... 80 8.2.2 Load Reduction for Mine Sites Upstream of Shasta Dam ................................................... 83
8.3 Allocation for Sources between Keswick Dam and Red Bluff ...................................................... 85 9 Margin of Safety, Seasonal Variation, & Critical Conditions................................................................ 86
9.1 Margin of Safety............................................................................................................................. 86 9.2 Seasonal Variation & Critical Conditions ...................................................................................... 87
10 Implementation ...................................................................................................................................... 89 10.1 USEPA Superfund Remediation Activities at the IMM Site ......................................................... 90 10.2 Remediation Activities at Mines in the Shasta Lake Watershed.................................................... 93 10.3 Pollution Control Activities for Sources between Keswick Dam and Red Bluff........................... 93 10.4 USBR Dam Operations .................................................................................................................. 95 10.5 Monitoring ..................................................................................................................................... 95
11 Public Participation ................................................................................................................................ 97 12 References .............................................................................................................................................. 98
Upper Sacramento River TMDL for Metals April 2002 vi
LIST OF APPENDICES
Appendix A. Plots of Dissolved Metal Concentrations in the Upper Sacramento River Watershed Appendix B. History of Shasta Lake Watershed Mines Appendix C. Cadmium-Copper-Zinc Mixture Interactions Appendix D. Load Calculations for Afterthought Mine & Municipal Stormwater Discharges Appendix E. Plots of Dissolved Metals Loads in the Upper Sacramento River Watershed Appendix F. Dissolved Metal Balances and Water Balances for Keswick Reservoir & Sacramento River
Between Keswick Dam and Bend Bridge Appendix G. Plots of Dissolved Metal Assimilative Capacity & Loads for the Sacramento River below
Shasta Dam and Keswick Dam & Above Bend Bridge Appendix H. Responses to Comments Received on the Upper Sacramento River TMDL for Cadmium,
Copper & Zinc Draft Report
LIST OF TABLES
Table 1. Proposed Numeric Targets for Dissolved Cadmium, Copper, and Zinc................................. i Table 3-1. Dams and Diversions in the Upper Sacramento River Basin .............................................. 22 Table 3-2. 1980 USBR-SWRCB-CDFG MOU and Basin Plan Objectives ......................................... 25 Table 5-1. Potential Metal Dischargers in the Upper Sacramento River Watershed ............................ 36 Table 5-2. Dissolved Metal Concentration Data Coverage for the Upper Sacramento River............... 41 Table 5-3. Flow Data Coverage for the Upper Sacramento River ........................................................ 41 Table 6-1. Existing and Potential Beneficial Uses of the Sacramento River, Shasta Dam to Colusa
Basin Drain .......................................................................................................................... 61 Table 6-2. Proposed Numeric Targets................................................................................................... 65 Table 8-1. Metal Loads Before and Anticipated Loads After Proposed IMM Site
Remediation Activities ........................................................................................................ 81 Table 10-1. Permit Types and Proposed Future Remediation Activities for
Shasta Lake Area Mines ...................................................................................................... 94
Upper Sacramento River TMDL for Metals April 2002 vii
LIST OF FIGURES
Figure 1-1. Upper Sacramento River Watershed ...................................................................................... 2 Figure 2-1. Dissolved Copper Concentrations in the Sacramento River Compared to the
Basin Plan Water Quality Objective and the CTR Chronic Criterion.................................... 6 Figure 3-1. Daily and Annual (Water Year) Precipitation at Shasta Dam.............................................. 10 Figure 3-2. Hydrology of the Upper Sacramento River ......................................................................... 12 Figure 3-3. Geographic Features of the Iron Mountain Mine Region .................................................... 18 Figure 3-4. Hydrologic Features of the Iron Mountain Mine Region near Redding, California ............ 19 Figure 5-1. Approximate Locations of Metal Sources within the Upper Sacramento
River Watershed................................................................................................................... 38 Figure 5-2. Load Calculation Example................................................................................................... 42 Figure 5-3. Comparison of Flows and Load for Shasta Dam Releases & Spring Creek
Debris Dam Releases ........................................................................................................... 46 Figure 5-4. Dissolved Copper Loads for Sources Downstream of Keswick Dam.................................. 47 Figure 5-5. Estimated Maximum Dissolved Copper Loads for Afterthought Mine AMD and
City of Redding, Lake Shasta City, and Anderson Stormwater Runoff............................... 48 Figure 5-6. Comparison of Dissolved Copper Loading Patterns Downstream of Keswick Dam........... 48 Figure 5-7. Dissolved Zinc Loads for Sources Downstream of Keswick Dam ...................................... 50 Figure 5-8. Estimated Maximum Dissolved Zinc Loads for Afterthought Mine AMD and
City of Redding, Lake Shasta City, and Anderson Stormwater Runoff............................... 51 Figure 5-9. Comparison of Dissolved Zinc Loading Patterns Downstream of Keswick Dam ............... 51 Figure 5-10. Dissolved Cadmium Loads for Sources Downstream of Keswick Dam.............................. 53 Figure 5-11. Estimated Maximum Dissolved Cadmium Loads for Afterthought Mine AMD,
City of Redding, Lake Shasta City, and Anderson Stormwater Runoff, and Cottonwood Creek ............................................................................................................... 54
Figure 5-12. Dissolved Cadmium Loading Pattern for Sources Downstream of Keswick Dam.............. 54 Figure 7-1. Metals Cycling in Freshwater Habitats ................................................................................ 69 Figure 7-2. Example of Assimilative Capacity Calculation.................................................................... 70 Figure 7-3. Copper Loads, Concentrations, and Assimilative Capacity Upstream of Keswick
Dam in January 1995 ........................................................................................................... 71 Figure 7-4. Assimilative Capacity of the Sacramento River below Keswick Dam and above
Bend Bridge ......................................................................................................................... 73 Figure 7-5. Total Copper Loads from Iron Mountain Mines Site........................................................... 78 Figure 8-1. Metal Loads before and Anticipated Loads after Proposed IMM Site
Remediation Activities......................................................................................................... 82 Figure 8-2. Shasta Dam Releases – Dissolved Copper Concentration and Flow Data........................... 84
Upper Sacramento River TMDL for Metals April 2002 viii
LIST OF ACRONYMS
µg/l micrograms per liter 1980 MOU Memorandum of Understanding Among the State Water Resources Control Board,
United States Water and Power Resources Service, and Department of Fish and Game to Implement Actions to Protect the Sacramento River System from Heavy Metal Pollution from Spring Creek and Adjacent Watersheds
ACIDD Anderson-Cottonwood Irrigation District Dam Basin Plan Central Valley Region Water Quality Control Plan – Sacramento River and San Joaquin
River Basins C carbon Ca calcium CaCO3 calcium carbonate Cd cadmium CDFG California Department of Fish and Game cfs cubic feet per second CO3 carbonate CRA CERES California Resources Agency, California Environmental Resources Evaluation System CTR California Toxics Rule Cu copper CVO USBR’s Central Valley Operations Office CVP Central Valley Project CVRWQCB Central Valley Regional Water Quality Control Board CWA Federal Clean Water Act DWR California Department of Water Resources, Northern District Fe iron fish kills fish mortality episodes H hydrogen HDS high density sludge (treatment plant) in/yr inches per year kg/day kilograms per day MCLs California/USEPA drinking water standards maximum contaminant levels MDL laboratory method detection limit mg/l milligrams per liter msl mean sea level NOAA National Oceanic and Atmospheric Administration O oxygen OMR California Department of Conservation, Office of Mine Reclamation, Abandoned Mine
Lands Unit pers. comm. personal communication (either meeting or telephone)
Upper Sacramento River TMDL for Metals April 2002 ix
PRPs potentially responsible parties RI/FS Remedial Investigation/Feasibility Study ROD USEPA Record of Decision S sulfur SCAKR Spring Creek Arm of Keswick Reservoir SCDD Spring Creek Debris Dam SCPP Spring Creek Power Plant SRCRD Slickrock Creek Retention Dam State Board State Water Resources Control Board TMDL Total Maximum Daily Load TMDL Report Upper Sacramento River TMDL for Cadmium, Copper, and Zinc Report USBR U.S. Bureau of Reclamation USEPA U.S. Environmental Protection Agency USFWS U.S. Fish and Wildlife Service USGS U.S. Geological Survey Zn Zinc
Upper Sacramento River TMDL for Metals April 2002 1
1 INTRODUCTION
Section 303(d) of the Federal Clean Water Act (CWA) requires States to:
1. Identify those waters not attaining water quality standards (referred to as the “303(d) List”).
2. Set priorities for addressing the identified pollution problems.
3. Establish a “Total Maximum Daily Load” (TMDL) for each identified waterbody’s pollutant(s) to attain water quality standards.
The Central Valley Regional Water Quality Control Board (Regional Board) prepares the 303(d) List for
the Central Valley with oversight and approval from the State Water Resources Control Board (State
Board) and the U.S. Environmental Protection Agency (USEPA). The Regional Board includes
waterbodies on the 303(d) List if the waterbodies are not expected to meet water quality standards even if
dischargers of point sources comply with their current discharge permit requirements. A TMDL
represents the maximum load (usually expressed as a rate, such as kilograms per day [kg/day]) of a
pollutant that a waterbody can receive and still meet applicable water quality standards. A TMDL report
describes the reductions needed to meet water quality standards and allocates those reductions among the
sources in the watershed.
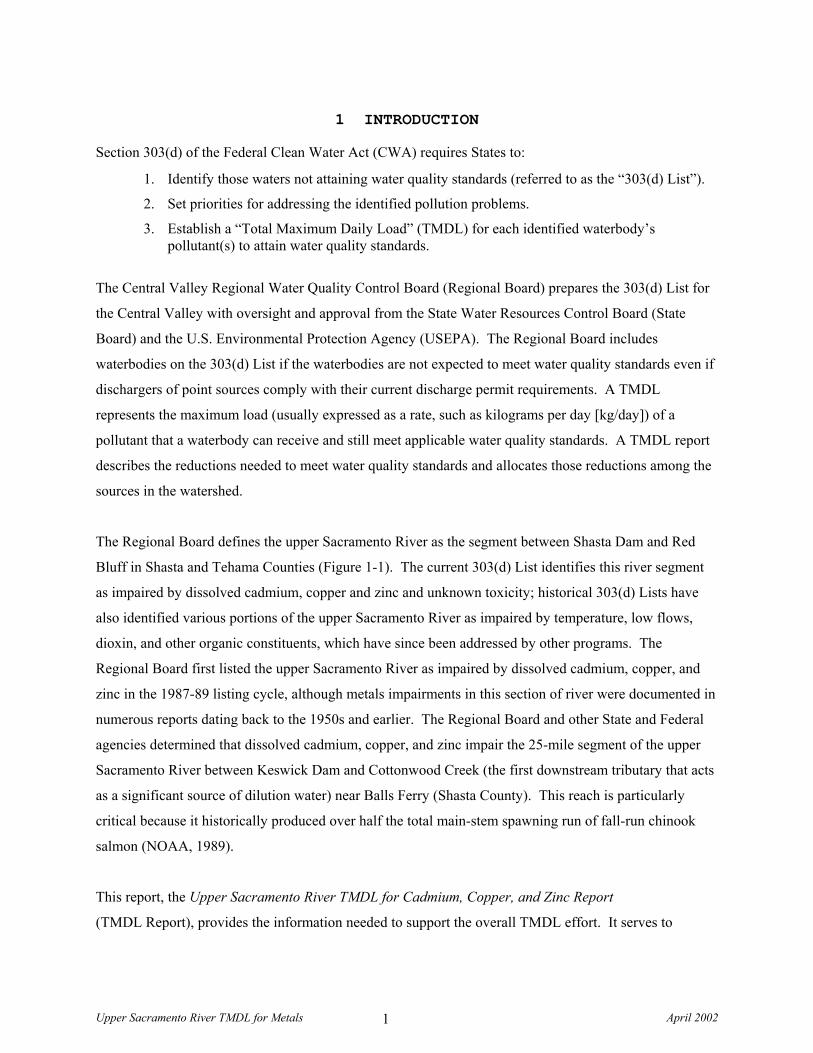
The Regional Board defines the upper Sacramento River as the segment between Shasta Dam and Red
Bluff in Shasta and Tehama Counties (Figure 1-1). The current 303(d) List identifies this river segment
as impaired by dissolved cadmium, copper and zinc and unknown toxicity; historical 303(d) Lists have
also identified various portions of the upper Sacramento River as impaired by temperature, low flows,
dioxin, and other organic constituents, which have since been addressed by other programs. The
Regional Board first listed the upper Sacramento River as impaired by dissolved cadmium, copper, and
zinc in the 1987-89 listing cycle, although metals impairments in this section of river were documented in
numerous reports dating back to the 1950s and earlier. The Regional Board and other State and Federal
agencies determined that dissolved cadmium, copper, and zinc impair the 25-mile segment of the upper
Sacramento River between Keswick Dam and Cottonwood Creek (the first downstream tributary that acts
as a significant source of dilution water) near Balls Ferry (Shasta County). This reach is particularly
critical because it historically produced over half the total main-stem spawning run of fall-run chinook
salmon (NOAA, 1989).
This report, the Upper Sacramento River TMDL for Cadmium, Copper, and Zinc Report
(TMDL Report), provides the information needed to support the overall TMDL effort. It serves to
Litt
le
Cow
Creek
SH
AS
TA
CO
.
McCloudRiver
Battle
Spring
WhiskeytownLake
River
Creek
Bear
SACRAMENTORIVER
SACRAMENTORIVER
Clear
Creek
Creek
Pit
Cre
ek
TR
INIT
YC
O.
Cle
ar
Cre
ek
Creek
Creek
Cottonwood
Antelope
ShastaLake
5
5
5
5
299
36
36
99
44
299
BallsFerry
Redding
Anderson
Red Bluff
SHASTACOUNTY
TEHAMACOUNTY
City ofShasta Lake
USGS GageAbove
Bend Bridge
Anderson-CottonwoodIrrigation District Dam
Spring CreekTunnel &
Power Plant
ShastaDam
KeswickDam
SpringCreek
Debris Dam
Red BluffDiversion Dam
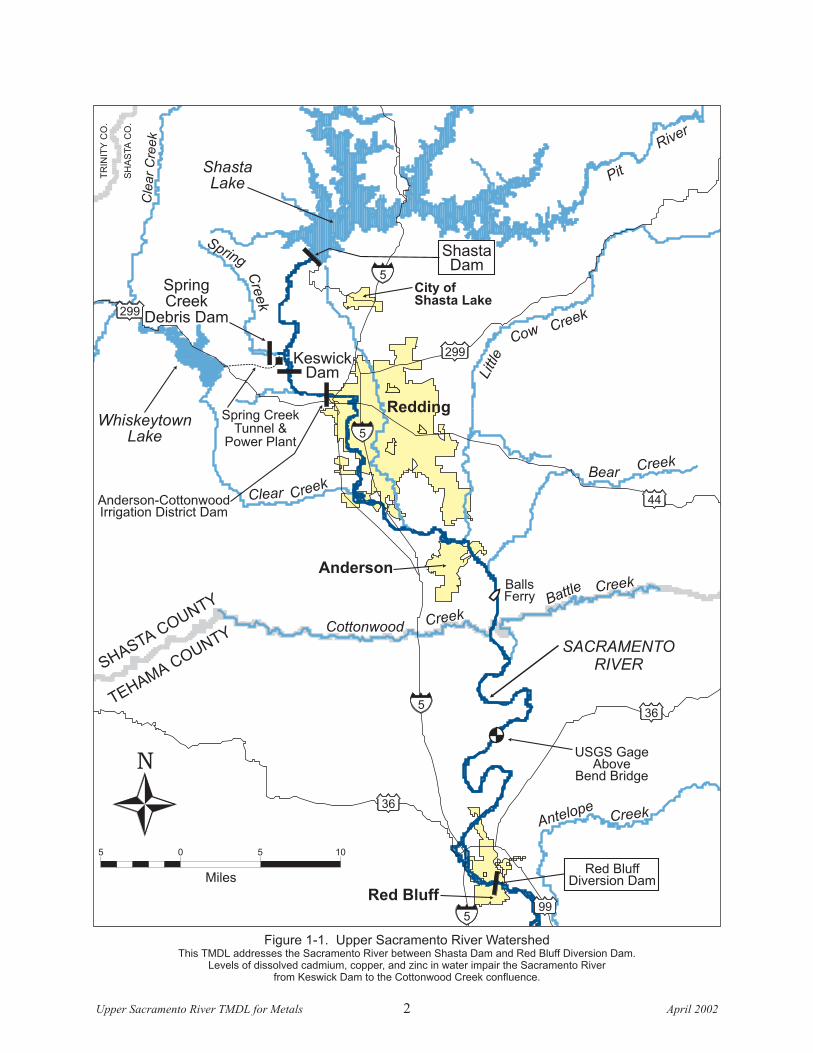
Figure 1-1. Upper Sacramento River WatershedThis TMDL addresses the Sacramento River between Shasta Dam and Red Bluff Diversion Dam.
Levels of dissolved cadmium, copper, and zinc in water impair the Sacramento Riverfrom Keswick Dam to the Cottonwood Creek confluence.
N
Miles
05 5 10
Upper Sacramento River TMDL for Metals 20022 April
Upper Sacramento River TMDL for Metals April 2002 3
document the current conditions on the upper Sacramento River and the plans for implementation of
remediation activities and monitoring. To meet State and Federal requirements, Regional Board staff
prepared this report with the following elements:
• problem statement (Chapter 2);
• background information (Chapters 3 and 4);
• identification and quantification of sources and source loads (Chapter 5);
• numerical water quality targets (Chapter 6);
• determination of the maximum load of cadmium, copper, and zinc that will not adversely impact beneficial uses and the mathematical linkage between the water quality target and amount of contaminant (Chapter 7);
• allocation of portions of the necessary load reduction to the various sources (Chapter 8);
• margin of safety that takes into account uncertainties and consideration of seasonal variations (Chapter 9);
• implementation plans (Chapter 10), and
• public participation (Chapter 11).
Based on the available information presented in this report, Regional Board staff expects that remediation
activities scheduled for the IMM site and other mine sites in the Shasta Lake watershed during the next
five years will address the water quality impairments. As discussed in detail later in this report, the
TMDL water management strategy includes remediation activities at the IMM site and other mine sites in
the watershed, continued monitoring by regional and Federal agencies, increased Regional Board
monitoring of Shasta Lake to identify causes of periodic increases in dissolved metals concentrations in
Shasta Dam releases, and additional monitoring by NPDES dischargers during the next five years. If
water quality standards are not exceeded during the three years following the completion of the proposed
IMM site remediations, which will require approximately two years to complete, Regional Board staff
would consider the removal of the upper Sacramento River from the CWA 303(d) List (i.e., “delist” the
river).
Although Keswick Reservoir is part of the Shasta Dam to Red Bluff segment of the upper Sacramento
River, this report does not address it because a separate TMDL will focus on that reach of the river.
Keswick Reservoir encompasses almost the entire segment of the Sacramento River between Shasta Dam
and Keswick Dam; therefore, this TMDL focuses on the river segment between Keswick Dam and Red
Bluff Diversion Dam. In addition, another TMDL will address individual metal sources upstream of
Shasta Dam.
Upper Sacramento River TMDL for Metals April 2002 4
2 PROBLEM STATEMENT
2.1 Definition of a Problem Statement
A problem statement identifies the context for TMDL development and describes the water quality
standards issue(s) that prompted development of the TMDL. A problem statement includes the following
elements:
• name(s) and location(s) of waterbody segments for which the TMDL is being developed,
• the pollutant(s) for which the TMDL is being developed and information about why the pollutant(s) are being addressed,
• the specific applicable water quality standard(s) for those pollutants,
• a description of the water quality impairment or threat which necessitated TMDL development, and
• adequate background information about the watershed setting for the TMDL to help the reader understand the key water quality, pollutant discharge, land use, and resource protection issues in the watershed.
The following sections in this chapter describe each of these elements, except the more detailed
background information and associated citations. Chapter 3 provides background information about the
watershed, including a description of historical mining activities and dams operations in the upper
Sacramento River watershed. Chapter 4 provides information about the effects of cadmium, copper, and
zinc on aquatic organisms, with a focus on their effects on anadromous fish.
2.2 The Problem
The Regional Board has determined that the 25-mile segment of the upper Sacramento River between
Keswick Dam and Cottonwood Creek (the first downstream tributary that acts as a significant source of
dilution water) near Balls Ferry in Shasta County is impaired by dissolved cadmium, copper, and zinc
because the water has frequently contained levels of dissolved metals that exceed water quality standards
developed to protect aquatic organisms. Historically, the elevated metal levels resulted in anadromous
(chinook salmon and steelhead trout) fish mortality (“fish kills”) and contributed to progressive declines
in anadromous fish populations in the Sacramento River. The metals impairment results primarily from
discharges of acid mine drainage (AMD) – with elevated levels of cadmium, copper, and zinc – from
inactive mines in the upper Sacramento River watershed, predominantly from the Iron Mountain Mines
(IMM) site and other mines upstream of Shasta Dam.
Upper Sacramento River TMDL for Metals April 2002 5
Federal and State agencies have been monitoring the upper Sacramento River watershed since the early
part of the 20th century. Documented deaths of fish were common in water below Keswick Dam during
the mid-20th century (i.e., 1940 to 1986). Numerous salmon and steelhead trout fish kills took place in the
upper Sacramento River between Keswick Dam and Balls Ferry, California. Since the late 1970s, major
adult fish kills have ceased. However, metals concentrations still frequently exceed water quality
standards developed to protect aquatic life.
2.3 Recent Water Quality Data and Water Quality Standards
Since the 1940s, Federal and State agencies have collected thousands of water samples from the upper
Sacramento River and several of its tributaries for the analysis of total metals. Long-term data are
available for the Sacramento River below Shasta Dam and Keswick Dam. Agencies began to analyze
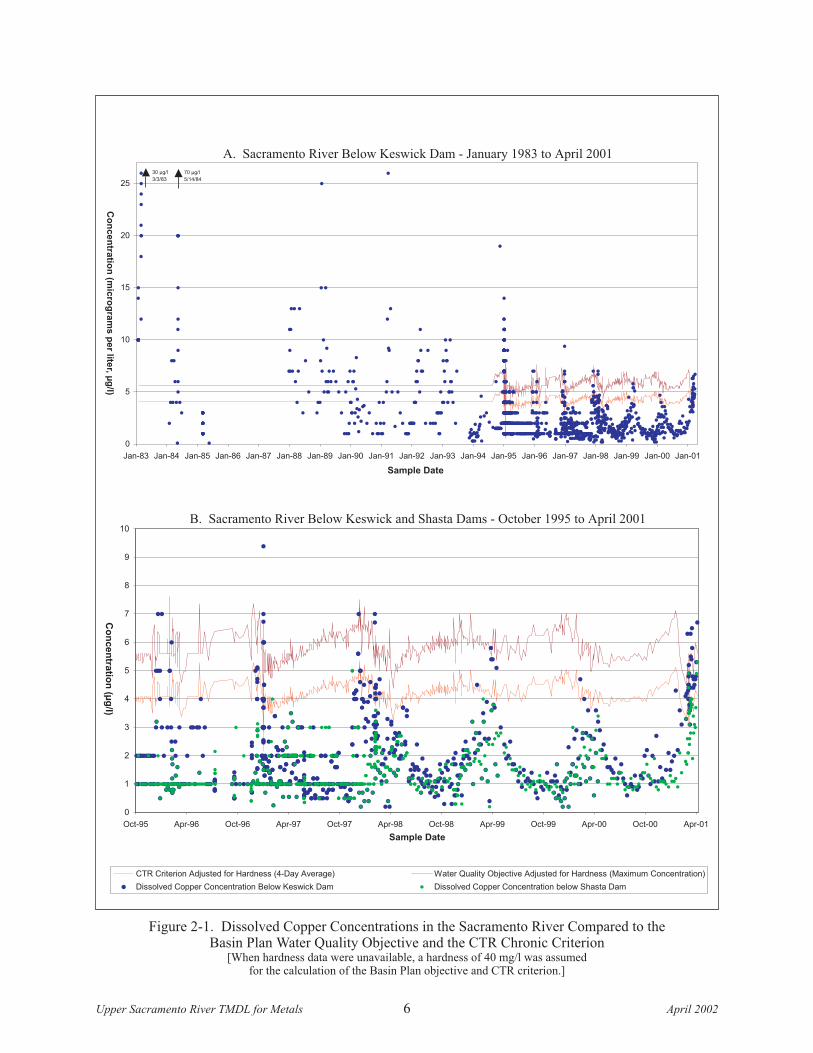
water samples for dissolved metals more frequently during the 1980s. Figure 2-1A illustrates dissolved
copper concentrations in the Sacramento River below Keswick Dam for the period 1983 to 2001, and
Figure 2-1B illustrates dissolved copper concentrations in the Sacramento River below Keswick Dam and
Shasta Dam for the period 1995 to 2000. Appendix A provides plots of all available concentration data
for dissolved cadmium, copper, and zinc in the Sacramento River below Shasta Dam and Keswick Dam,
and above Bend Bridge near Red Bluff.
Regional Board staff derived the data displayed on Figure 2-1 and the plots in Appendix A from a variety
of agency databases. Researchers used several methods to collect and analyze the water samples;
therefore, there were varying quality control methods used in the field and several different analytical
method detection limits. However, the abundance of data enables the illustration of several key
characteristics of upper Sacramento River water quality. Chapters 3 and 4 provide the background
information needed to put the following water quality characteristics in context.
2.3.1 Decrease in Frequency of Exceedances over Time
Historical levels of dissolved cadmium, copper, and zinc in the Sacramento River below Shasta and
Keswick Dams frequently exceeded two sets of water quality standards developed for the protection of
aquatic life:
1. Central Valley Region Water Quality Control Plan (Basin Plan) water quality objectives (maximum concentration criteria), and
0
1
2
3
4
5
6
7
8
9
10
Oct-95 Apr-96 Oct-96 Apr-97 Oct-97 Apr-98 Oct-98 Apr-99 Oct-99 Apr-00 Oct-00 Apr-01
Sample Date
Co
nc
en
tratio
n(m
icro
gra
ms
pe
rlite
r,u
g/L
)
CTR Criterion Adjusted for Hardness (4-Day Average) Water Quality Objective Adjusted for Hardness (Maximum Concentration)
Dissolved Copper Concentration Below Keswick Dam Dissolved Copper Concentration below Shasta Dam
Figure 2-1. Dissolved Copper Concentrations in the Sacramento River Compared to theBasin Plan Water Quality Objective and the CTR Chronic Criterion
[When hardness data were unavailable, a hardness of 40 mg/l was assumedfor the calculation of the Basin Plan objective and CTR criterion.]
0
5
10
15
20
25
Jan-83 Jan-84 Jan-85 Jan-86 Jan-87 Jan-88 Jan-89 Jan-90 Jan-91 Jan-92 Jan-93 Jan-94 Jan-95 Jan-96 Jan-97 Jan-98 Jan-99 Jan-00 Jan-01
Sample Date
Co
nc
en
tratio
n(m
icro
gra
ms
pe
rlite
r,µ
g/l)
70 µg/l
5/14/84
30 µg/l
3/3/83
A. Sacramento River Below Keswick Dam - January 1983 to April 2001
B. Sacramento River Below Keswick and Shasta Dams - October 1995 to April 2001
0
1
2
3
4
5
6
7
8
9
10
Oct-95 Apr-96 Oct-96 Apr-97 Oct-97 Apr-98 Oct-98 Apr-99 Oct-99 Apr-00 Oct-00 Apr-01
Sample Date
Co
ncen
tratio
n(µ
g/l)
Upper Sacramento River TMDL for Metals 20026 April
Upper Sacramento River TMDL for Metals April 2002 7
2. California Toxics Rule (CTR) Criteria for Freshwater Aquatic Life Protection (4-day continuous concentration criteria).
However, notable reductions in the frequency and magnitude of exceedances have occurred during the
past ten years. The timing of these reductions corresponds to load reductions resulting from remediations
completed at mine sites in the Shasta Lake region, especially at the IMM site (e.g., operation of a
temporary lime neutralization plant during the high-flow seasons of 1989-1993, and continuous year-
round treatment since 1994), and from changes in regional dam operations that improved coordination of
AMD releases from the Spring Creek Debris Dam (SCDD) on Spring Creek downstream of the IMM site.
(Refer to Chapter 3 for a description of remediation activities and dam operations.)
The Regional Board staff’s review of tabular historical and recent total cadmium, copper, and zinc
concentrations for the Sacramento River below Shasta Dam and Keswick Dam indicated that the
concentrations of these metals rarely, if ever, exceeded the California/USEPA drinking water standards
established for the protection of human health (maximum contaminant levels [MCLs]). Total cadmium
concentrations exceeded the cadmium MCL of 5.0 micrograms per liter (µg/l) on three occasions in the
early 1980s below Keswick Dam, and on one occasion in 1988 below Shasta Dam. Total copper
concentrations exceeded the copper MCL of 1,300 µg/l on several occasions during the 1940s. Total zinc
concentrations apparently have yet to exceed the MCL of 5,000 µg/l at either location. No MCL
exceedances have occurred since 1988.
2.3.2 Seasonal Variability
Data collected during the 1990s indicate that dissolved copper and zinc concentrations1 have considerable
seasonal variability; higher concentrations often occurred during the wet season. Even though notable
reductions in the frequency and magnitude of exceedances of Basin Plan objectives and CTR criteria have
occurred during the past ten years, occasional exceedances still occur each year on the Sacramento River
below Keswick Dam, most often during the December-to-April period. The exceedances typically
correspond to times of heavy rainfall runoff that cause the Spring Creek Reservoir to reach capacity
and/or times that the Shasta Reservoir or Spring Creek Power Plant dilution releases are reduced for the
purposes of storage and flood control. Occasionally, the exceedances below Keswick Dam are driven by
Shasta Dam releases that have unusually high concentrations of dissolved copper and/or zinc.
1 Not enough dissolved cadmium concentration data were available to determine whether dissolved cadmium concentrations
experience seasonal variability in the same manner as dissolved copper and zinc concentrations.
Upper Sacramento River TMDL for Metals April 2002 8
2.3.3 Water Quality Characteristics of Downstream Reach
Dissolved metal concentration data for the Sacramento River at Bend Bridge (see Figure 1-1) collected
from the mid-1990s to 2001 indicate no exceedances of the Basin Plan objectives for dissolved copper,
zinc, and cadmium, or the CTR criteria for dissolved zinc and cadmium. There was only one possible
exceedance of the 4-day CTR criterion for dissolved copper of 4.1 µg/l (4.4 µg/l recorded on
December 12, 1996). However, this apparent lack of exceedances may result primarily from the scarcity
of data for downstream areas; few sampling dates for the Sacramento River at Bend Bridge corresponded
to times of water quality standard exceedances at Keswick Dam during the mid-1990s to 2001 period.
For example, of the 39 sampling dates at Bend Bridge, only four occurred within a day of exceedances of
dissolved copper criteria at Keswick Dam; two of those dates had dissolved copper concentrations at
Bend Bridge that approached (3.92 µg/l) or exceeded (4.4 µg/l) the CTR criterion. The one possible
exceedance observed at Bend Bridge corresponded to an observed exceedance at Keswick Dam.
The USEPA’s review of historical data indicated that when AMD spills occur from the SCDD,
exceedances of water quality standards also can occur on the Sacramento River as far downstream as
Bend Bridge (Michny, 2001; Sugarek, 2002). Available data indicate that when the SCDD is controlling
releases of IMM AMD into the Sacramento River, metal concentrations downstream of Keswick Dam
comply with water quality standards. In addition, the USEPA’s review of historical data and the Regional
Board’s review of recent data indicate that the dilution effect of tributary inputs between Keswick Dam
and Red Bluff can mitigate Keswick Dam releases with high metal concentrations; Cottonwood Creek is
the first downstream tributary that acts as a significant source of dilution water.
Upper Sacramento River TMDL for Metals April 2002 9
3 BACKGROUND
3.1 Watershed Characteristics
3.1.1 Physiography & Geology
The upper Sacramento River is a perennial drainage in Shasta and Tehama Counties that has a length of
approximately 61 miles from Shasta Dam to Red Bluff Diversion Dam (Figure 1-1). The upper
Sacramento River basin includes portions of the Sacramento Valley, and all of the Klamath Mountains,
the Coast Ranges, the Modoc Plateau, and the Cascade Mountains physiographic regions
(Domagalski et al., 2000). These physiographic provinces are largely based on geologic factors,
including rock types and tectonic setting. The Sacramento Valley is the low-lying part of the basin. The
Sacramento Valley equates to the northern third of the Central Valley, which constitutes a structural
downwarp and nearly flat alluvial plain extending more than 400 miles from Redding on the north to the
Tehachapi Mountains on the south; it has an average width of 40 miles and spans 15,000 square miles
(1/10th of the State) (Poland and Everson, 1966). Elevations of the alluvial plain are generally just a few
hundred feet above sea level with extremes ranging from a few feet below sea level to about 1,000 feet
above sea level (Hackel, 1966). Drainage from the Sacramento Valley is southward through the
Sacramento River to its confluence with the San Joaquin River, near Suisun Bay, and then westward
through San Francisco Bay to the Pacific Ocean.
The valley floor is divided into four geomorphic units: (1) dissected uplands, (2) low alluvial plains and
fans, (3) river flood plains and channels, and (4) overflow lands and lake bottoms (Poland and
Evenson, 1966). The deposits containing fresh groundwater are principally unconsolidated continental
deposits of Pliocene to Recent Age that extend to depths ranging from less than a 100 to more than 3,500
feet. The unconsolidated continental deposits consist chiefly of alluvium but in some areas include
widespread lacustrine, marsh, and estuarine sediments. Consolidated rocks form the boundaries beneath
and on the flanks of the productive groundwater reservoir in the unconsolidated deposits. Groundwater
occurs under both confined (artesian) and unconfined (water table) conditions in the Central Valley.
Recharge to the groundwater reservoir is by infiltration of rainfall, infiltration from streams, canals, and
ditches, by infiltration of excess irrigation water, and by underflow entering the valley from tributary
stream canyons. In the Sacramento Valley, water for irrigation, public supply, and industry is obtained
primarily from surface water sources, but also in part from groundwater wells.
Upper Sacramento River TMDL for Metals April 2002 10
The predominant economic deposits in the upper Sacramento River basin include gold, silver, copper,
zinc, iron, limestone, and aggregate deposits. Section 3.2 and Appendix B describe the history of mining
activities associated with these mineral deposits.
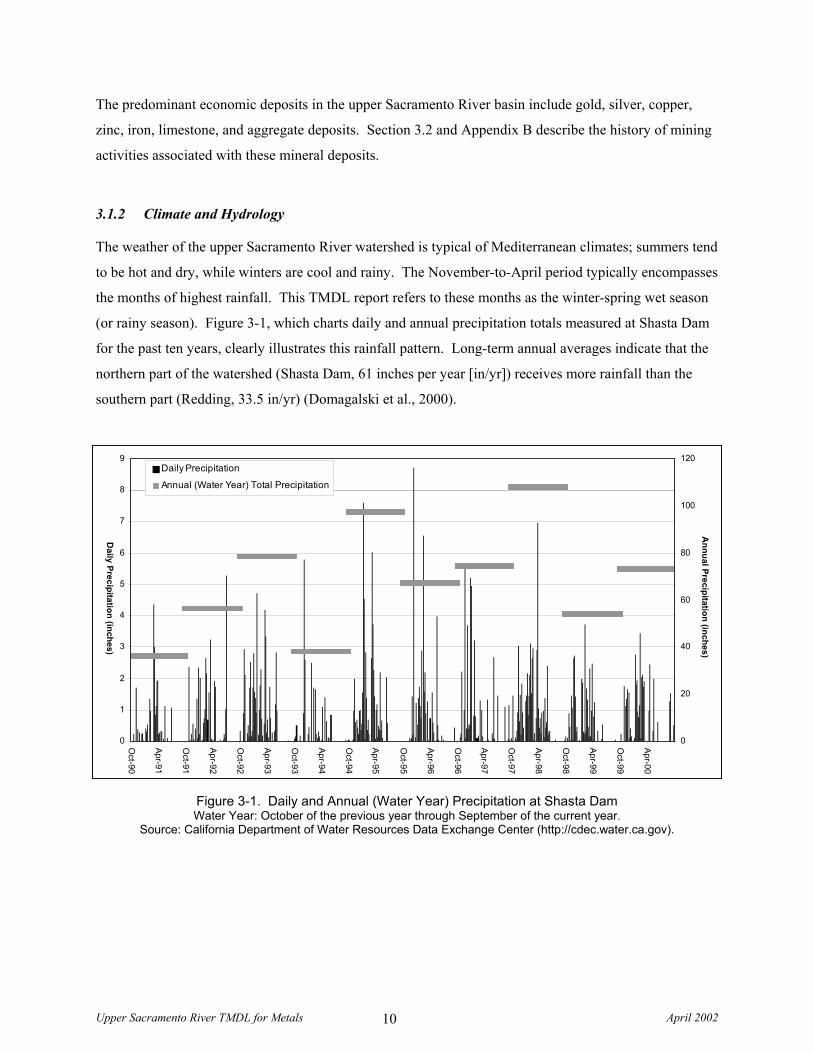
3.1.2 Climate and Hydrology
The weather of the upper Sacramento River watershed is typical of Mediterranean climates; summers tend
to be hot and dry, while winters are cool and rainy. The November-to-April period typically encompasses
the months of highest rainfall. This TMDL report refers to these months as the winter-spring wet season
(or rainy season). Figure 3-1, which charts daily and annual precipitation totals measured at Shasta Dam
for the past ten years, clearly illustrates this rainfall pattern. Long-term annual averages indicate that the
northern part of the watershed (Shasta Dam, 61 inches per year [in/yr]) receives more rainfall than the
southern part (Redding, 33.5 in/yr) (Domagalski et al., 2000).
Figure 3-1. Daily and Annual (Water Year) Precipitation at Shasta Dam Water Year: October of the previous year through September of the current year.
Source: California Department of Water Resources Data Exchange Center (http://cdec.water.ca.gov).
0
1
2
3
4
5
6
7
8
9
Oct-90
Apr-91
Oct-91
Apr-92
Oct-92
Apr-93
Oct-93
Apr-94
Oct-94
Apr-95
Oct-95
Apr-96
Oct-96
Apr-97
Oct-97
Apr-98
Oct-98
Apr-99
Oct-99
Apr-00
Daily Precipitation (inches)
0
20
40
60
80
100
120
Annual Precipitation (inches)
Daily Precipitation
Annual (Water Year) Total Precipitation
Upper Sacramento River TMDL for Metals April 2002 11
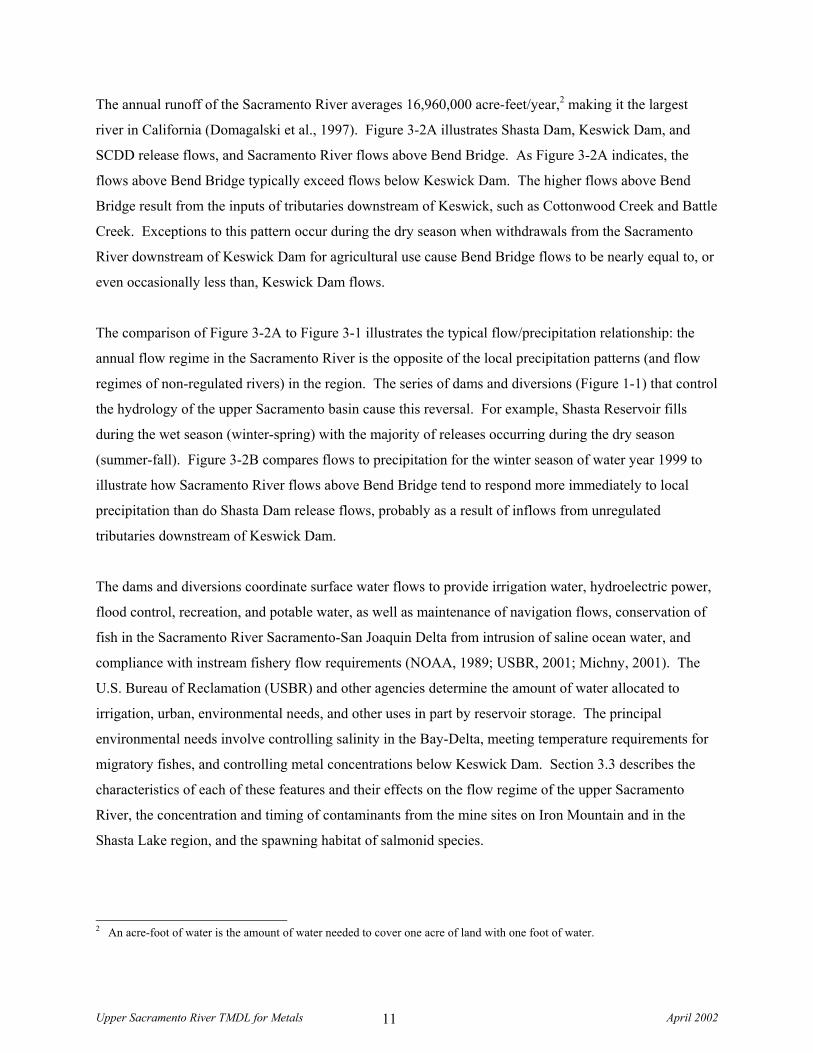
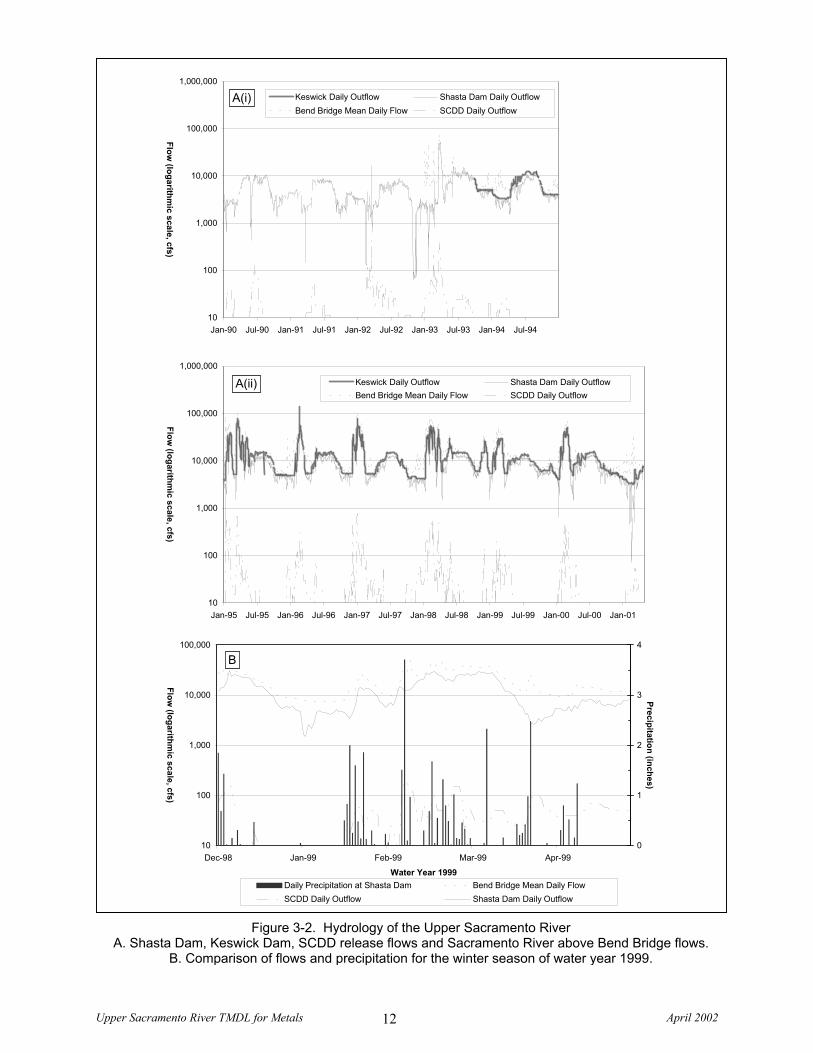
The annual runoff of the Sacramento River averages 16,960,000 acre-feet/year,2 making it the largest
river in California (Domagalski et al., 1997). Figure 3-2A illustrates Shasta Dam, Keswick Dam, and
SCDD release flows, and Sacramento River flows above Bend Bridge. As Figure 3-2A indicates, the
flows above Bend Bridge typically exceed flows below Keswick Dam. The higher flows above Bend
Bridge result from the inputs of tributaries downstream of Keswick, such as Cottonwood Creek and Battle
Creek. Exceptions to this pattern occur during the dry season when withdrawals from the Sacramento
River downstream of Keswick Dam for agricultural use cause Bend Bridge flows to be nearly equal to, or
even occasionally less than, Keswick Dam flows.
The comparison of Figure 3-2A to Figure 3-1 illustrates the typical flow/precipitation relationship: the
annual flow regime in the Sacramento River is the opposite of the local precipitation patterns (and flow
regimes of non-regulated rivers) in the region. The series of dams and diversions (Figure 1-1) that control
the hydrology of the upper Sacramento basin cause this reversal. For example, Shasta Reservoir fills
during the wet season (winter-spring) with the majority of releases occurring during the dry season
(summer-fall). Figure 3-2B compares flows to precipitation for the winter season of water year 1999 to
illustrate how Sacramento River flows above Bend Bridge tend to respond more immediately to local
precipitation than do Shasta Dam release flows, probably as a result of inflows from unregulated
tributaries downstream of Keswick Dam.
The dams and diversions coordinate surface water flows to provide irrigation water, hydroelectric power,
flood control, recreation, and potable water, as well as maintenance of navigation flows, conservation of
fish in the Sacramento River Sacramento-San Joaquin Delta from intrusion of saline ocean water, and
compliance with instream fishery flow requirements (NOAA, 1989; USBR, 2001; Michny, 2001). The
U.S. Bureau of Reclamation (USBR) and other agencies determine the amount of water allocated to
irrigation, urban, environmental needs, and other uses in part by reservoir storage. The principal
environmental needs involve controlling salinity in the Bay-Delta, meeting temperature requirements for
migratory fishes, and controlling metal concentrations below Keswick Dam. Section 3.3 describes the
characteristics of each of these features and their effects on the flow regime of the upper Sacramento
River, the concentration and timing of contaminants from the mine sites on Iron Mountain and in the
Shasta Lake region, and the spawning habitat of salmonid species.
2 An acre-foot of water is the amount of water needed to cover one acre of land with one foot of water.
Upper Sacramento River TMDL for Metals April 2002 12
Figure 3-2. Hydrology of the Upper Sacramento River A. Shasta Dam, Keswick Dam, SCDD release flows and Sacramento River above Bend Bridge flows.
B. Comparison of flows and precipitation for the winter season of water year 1999.
10
100
1,000
10,000
100,000
1,000,000
Jan-90 Jul-90 Jan-91 Jul-91 Jan-92 Jul-92 Jan-93 Jul-93 Jan-94 Jul-94
Flow (logarithm
ic scale, cfs)
Keswick Daily Outflow Shasta Dam Daily OutflowBend Bridge Mean Daily Flow SCDD Daily Outflow
A(i)
10
100
1,000
10,000
100,000
1,000,000
Jan-95 Jul-95 Jan-96 Jul-96 Jan-97 Jul-97 Jan-98 Jul-98 Jan-99 Jul-99 Jan-00 Jul-00 Jan-01
Flow (logarithm
ic scale, cfs)
Keswick Daily Outflow Shasta Dam Daily OutflowBend Bridge Mean Daily Flow SCDD Daily Outflow
A(ii)
10
100
1,000
10,000
100,000
Dec-98 Jan-99 Feb-99 Mar-99 Apr-99
Water Year 1999
Flow (logarithm
ic scale, cfs)
0
1
2
3
4
Precipitation (inches)
Daily Precipitation at Shasta Dam Bend Bridge Mean Daily FlowSCDD Daily Outflow Shasta Dam Daily Outflow
B
Upper Sacramento River TMDL for Metals April 2002 13
3.1.3 Land Use & Critical Habitat
Notable cities located adjacent to the upper Sacramento River include the City of Redding to the north
and City of Red Bluff to the south. The major land uses in the upper Sacramento River basin are
agriculture, forestry, urban development, and mining. In addition, the upper Sacramento River provides
recreation opportunities, wildlife habitat, and aquatic habitat. The river supports a diversity of benthic
invertebrates, aquatic flora, and fish species. As described in Chapter 4, elevated levels of dissolved
metals have had measurable impacts on several aquatic species present in the Sacramento River,
particularly the anadromous fish species.
Anadromous Fish Habitat
The river’s substrate consists of gravel, cobble, and bedrock, which provide spawning and nursery habitat
for anadromous3 chinook salmon and steelhead trout. The river is the largest and most important
salmonid stream in California, providing more spawning habitat for chinook salmon than any other river
in California (NOAA, 1989). Elevated levels of dissolved cadmium, copper, and zinc in the upper
Sacramento River adversely affect fish habitat. Researchers have linked the elevated metals levels to
AMD from mines in the Shasta Lake and Iron Mountain regions. The segment of the river most impacted
is the 25-mile segment between Keswick Dam and Cottonwood Creek near Balls Ferry, a reach that
historically produced over half the total main-stem spawning run of fall-run chinook salmon
(NOAA, 1989). Impacts include numerous documented fish kills and effects on salmonids and other
aquatic species populations (see Chapter 4).
There are four distinct spawning populations of chinook salmon in the Sacramento River, which are
designated as the fall-run (the largest of the four runs), late fall-run, winter-run, and spring-run, according
to the time of year when sexually mature adults begin to migrate from the Pacific Ocean through the
Golden Gate into San Francisco Bay and then upstream in the Sacramento River to spawn (NOAA, 1989).
Adult steelhead trout migrate into the upper Sacramento River primarily between July and the middle of
the following March, and spawning occurs from late December to April. Fry and juvenile stages of the
steelhead trout are present in the upper Sacramento River over the entire year, and juvenile steelhead may
spend up to four years in the river before out-migration. Because of the overlapping reproductive cycles
of the chinook salmon and steelhead trout runs, spawning adults, developing eggs, and early juvenile
3 Anadromous fish have a life history pattern in which the fish spawn in freshwater, then fry migrate to sea to mature.
Upper Sacramento River TMDL for Metals April 2002 14
stages may be found in the Sacramento River during all months of the year. Eggs and early
developmental stages – the most sensitive life stages to trace metals contamination – of the four salmon
runs and steelhead run are present during the wet season (November through April), the period during
which the largest volumes of AMD are discharged from Iron Mountain (NOAA, 1989).
Recreational and Commercial Value of Fisheries
Recreational fisheries in the upper Sacramento River are present for fall-run and spring-run chinook
salmon and steelhead trout; harvesting of winter-run fish is prohibited (NOAA, 1989). In addition,
chinook salmon from the upper Sacramento River make a substantial contribution to the eastern Pacific
Ocean commercial fishery (NOAA, 1989). The U.S. Fish and Wildlife Service (USFWS) and the USBR
estimated the net economic value and associated benefits of the Sacramento River chinook salmon and
steelhead trout originating above the Red Bluff Diversion Dam (including both wild and hatchery-reared
stocks) and determined that the decline in the upper Sacramento River salmonid populations affects the
commercial harvest by the ocean fishery (NOAA, 1989). Due to intermingling of different salmon stocks
in the ocean, the commercial harvest rate in the ocean fishery is restricted to protect the weakest
populations, which are the upper Sacramento River populations (NOAA, 1989). Therefore, if the upper
Sacramento River stocks were stronger, the commercial fishery would have a larger allowable catch.
Compliance with protective water quality standards, river flow regulation, temperature control, fish
passage improvements, and the current restrictions on ocean fishing, are elements of ongoing fishery
restoration efforts designed to re-establish the strength and numbers of the Sacramento River fishery
(Michny, 2001).
3.2 Mining and Acid Mine Drainage in the Upper Sacramento River Watershed
3.2.1 Acid Mine Drainage
Historic mining activity in the upper Sacramento River watershed exposed minerals to surface water,
percolating groundwater, rain, and oxygen. Acid mine drainage is produced primarily by the oxidation of
pyrite, a common iron disulfide mineral; when pyrite is exposed to moisture and oxygen, sulfuric acid
forms (Nordstrom and Alpers, 1999). The sulfuric acid runs through the metal-rich areas and leaches out
copper, cadmium, zinc, and other heavy metals. This AMD flows out of mine seeps and portals. Mining
has the overall effect of dramatically increasing sulfide oxidation rates and metals release orders of
magnitude faster than natural rates by:
• providing greater accessibility of air through mine workings, waste rock, and tailings;
Upper Sacramento River TMDL for Metals April 2002 15
• creating greater surface area exposure through blasting, grinding and crushing; and
• concentrating sulfides in tailings.
Mine wastes and acid discharges from historic mining of the massive sulfide deposits have resulted in
AMD that has caused extreme metal contamination in Boulder Creek, Slickrock Creek, Spring Creek,
Little Backbone Creek, and West Squaw Creek (Alpers et al., 2000). Although cadmium, copper, and
zinc in the upper Sacramento River derive from several sources, AMD from the IMM site (transported to
the upper Sacramento River by Spring Creek) and from Shasta Lake outflow are the largest sources (see
Chapter 5). The following section provides a brief history of mining activities in the Shasta Lake region,
with particular attention to the IMM site.
3.2.2 Brief History of Mining in the Upper Sacramento River Watershed
Countless mines and prospects with a variety of extraction products are located in the upper Sacramento
River watershed and Lake Shasta region. Metals have been mined from locations in the Klamath
Mountains, the Sierra Nevada, and the Coast Ranges provinces (Alpers et al., 2000; OMR, 2000). Gold
was mined in the Klamath Mountains, an area that is second only to the Sierra Nevada for gold
production in California. Placer gold was recovered from ancient and modern stream deposits both in the
Klamath Mountains and in the Sierra Nevada; “lode” gold (or hardrock) also was mined from both
locations (Alpers et al., 2000; OMR, 2000). Lode gold was first mined in the 1860s from gossans
overlying sulphide ores in the West Shasta Copper-Zinc District, which is located in the Klamath
Mountains near Shasta Lake. Although this region is now better known for copper and zinc production,
considerable quantities of gold and silver were produced (OMR, 2000). However, it became unprofitable
to specifically mine for gold and silver in the West Shasta mining district because, beginning in the
1890s, large amounts of gold and silver were being produced as a by-product of the smelting of copper
ore.
Copper was the principal commodity in the Shasta Lake region; copper mined from the West and East
Shasta Districts accounted for more than half of the State’s total production (OMR, 2000). The mining
districts contain several massive sulfide copper-zinc deposits with historic production. The massive
sulfide deposits (as much as 200 feet thick) formed approximately 400 million years ago when sea-floor
vents deposited sulfide minerals. The deposits consist of millions of tons of the minerals chalcopyrite
(CuFeS2), sphalerite [(Zn,Fe,Cd)S], and pyrite (FeS2) hosted by hydrothermally altered volcanic rocks
with minimal capacity for neutralization of sulfuric acid (H2SO4) solutions formed during weathering
Upper Sacramento River TMDL for Metals April 2002 16
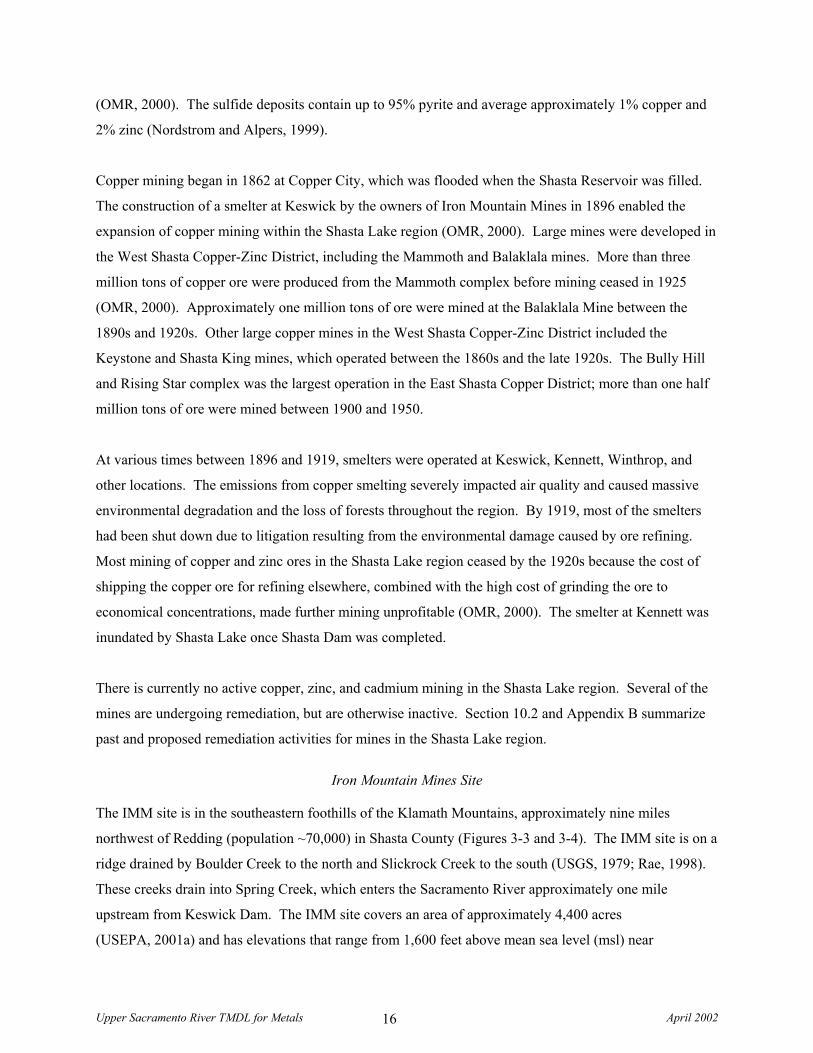
(OMR, 2000). The sulfide deposits contain up to 95% pyrite and average approximately 1% copper and
2% zinc (Nordstrom and Alpers, 1999).
Copper mining began in 1862 at Copper City, which was flooded when the Shasta Reservoir was filled.
The construction of a smelter at Keswick by the owners of Iron Mountain Mines in 1896 enabled the
expansion of copper mining within the Shasta Lake region (OMR, 2000). Large mines were developed in
the West Shasta Copper-Zinc District, including the Mammoth and Balaklala mines. More than three
million tons of copper ore were produced from the Mammoth complex before mining ceased in 1925
(OMR, 2000). Approximately one million tons of ore were mined at the Balaklala Mine between the
1890s and 1920s. Other large copper mines in the West Shasta Copper-Zinc District included the
Keystone and Shasta King mines, which operated between the 1860s and the late 1920s. The Bully Hill
and Rising Star complex was the largest operation in the East Shasta Copper District; more than one half
million tons of ore were mined between 1900 and 1950.
At various times between 1896 and 1919, smelters were operated at Keswick, Kennett, Winthrop, and
other locations. The emissions from copper smelting severely impacted air quality and caused massive
environmental degradation and the loss of forests throughout the region. By 1919, most of the smelters
had been shut down due to litigation resulting from the environmental damage caused by ore refining.
Most mining of copper and zinc ores in the Shasta Lake region ceased by the 1920s because the cost of
shipping the copper ore for refining elsewhere, combined with the high cost of grinding the ore to
economical concentrations, made further mining unprofitable (OMR, 2000). The smelter at Kennett was
inundated by Shasta Lake once Shasta Dam was completed.
There is currently no active copper, zinc, and cadmium mining in the Shasta Lake region. Several of the
mines are undergoing remediation, but are otherwise inactive. Section 10.2 and Appendix B summarize
past and proposed remediation activities for mines in the Shasta Lake region.
Iron Mountain Mines Site
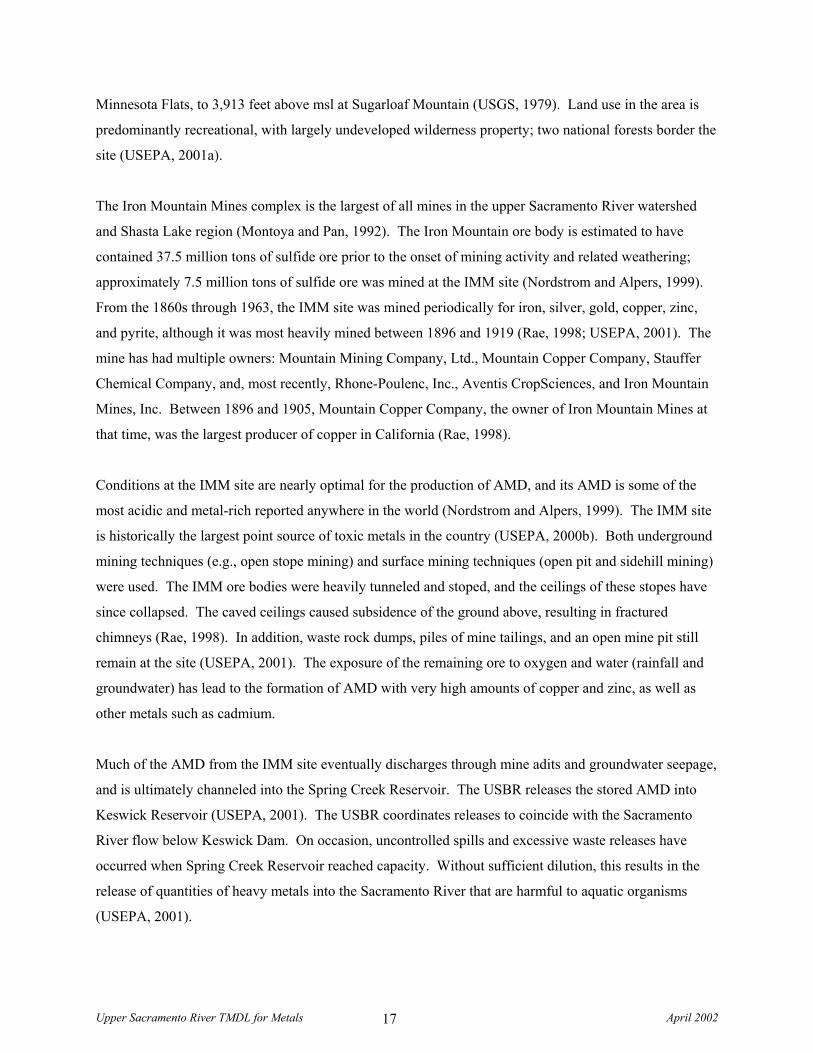
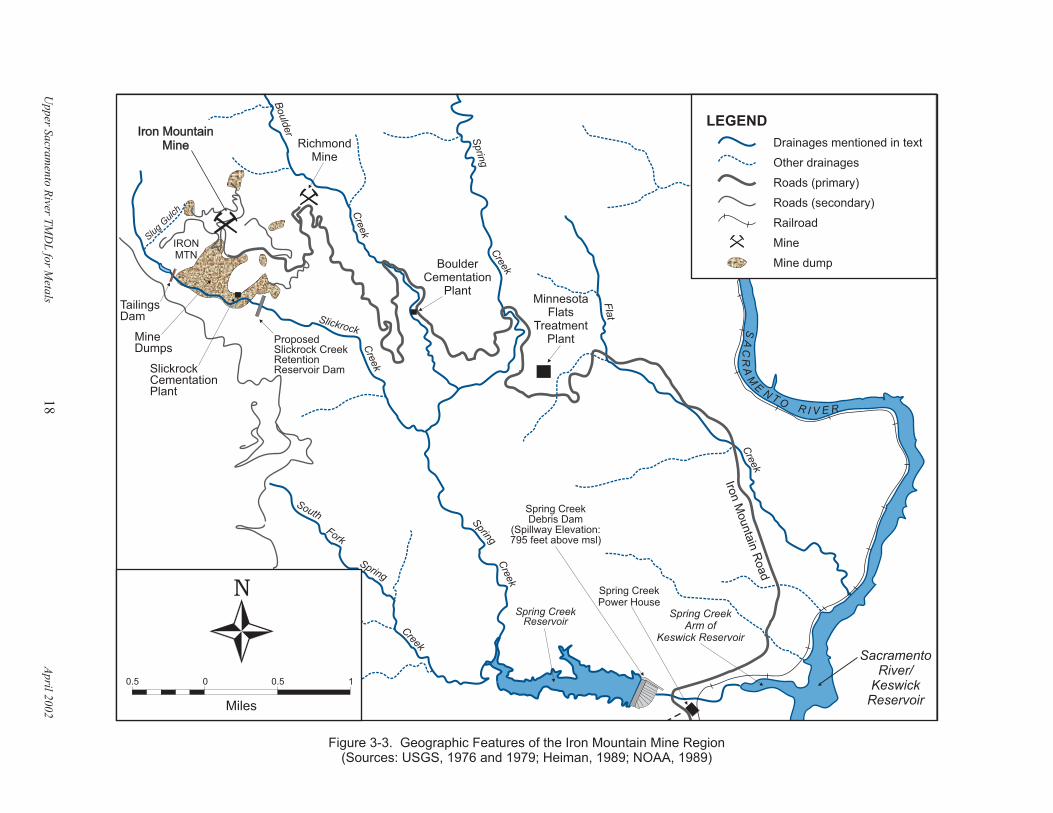
The IMM site is in the southeastern foothills of the Klamath Mountains, approximately nine miles
northwest of Redding (population ~70,000) in Shasta County (Figures 3-3 and 3-4). The IMM site is on a
ridge drained by Boulder Creek to the north and Slickrock Creek to the south (USGS, 1979; Rae, 1998).
These creeks drain into Spring Creek, which enters the Sacramento River approximately one mile
upstream from Keswick Dam. The IMM site covers an area of approximately 4,400 acres
(USEPA, 2001a) and has elevations that range from 1,600 feet above mean sea level (msl) near
Upper Sacramento River TMDL for Metals April 2002 17
Minnesota Flats, to 3,913 feet above msl at Sugarloaf Mountain (USGS, 1979). Land use in the area is
predominantly recreational, with largely undeveloped wilderness property; two national forests border the
site (USEPA, 2001a).
The Iron Mountain Mines complex is the largest of all mines in the upper Sacramento River watershed
and Shasta Lake region (Montoya and Pan, 1992). The Iron Mountain ore body is estimated to have
contained 37.5 million tons of sulfide ore prior to the onset of mining activity and related weathering;
approximately 7.5 million tons of sulfide ore was mined at the IMM site (Nordstrom and Alpers, 1999).
From the 1860s through 1963, the IMM site was mined periodically for iron, silver, gold, copper, zinc,
and pyrite, although it was most heavily mined between 1896 and 1919 (Rae, 1998; USEPA, 2001). The
mine has had multiple owners: Mountain Mining Company, Ltd., Mountain Copper Company, Stauffer
Chemical Company, and, most recently, Rhone-Poulenc, Inc., Aventis CropSciences, and Iron Mountain
Mines, Inc. Between 1896 and 1905, Mountain Copper Company, the owner of Iron Mountain Mines at
that time, was the largest producer of copper in California (Rae, 1998).
Conditions at the IMM site are nearly optimal for the production of AMD, and its AMD is some of the
most acidic and metal-rich reported anywhere in the world (Nordstrom and Alpers, 1999). The IMM site
is historically the largest point source of toxic metals in the country (USEPA, 2000b). Both underground
mining techniques (e.g., open stope mining) and surface mining techniques (open pit and sidehill mining)
were used. The IMM ore bodies were heavily tunneled and stoped, and the ceilings of these stopes have
since collapsed. The caved ceilings caused subsidence of the ground above, resulting in fractured
chimneys (Rae, 1998). In addition, waste rock dumps, piles of mine tailings, and an open mine pit still
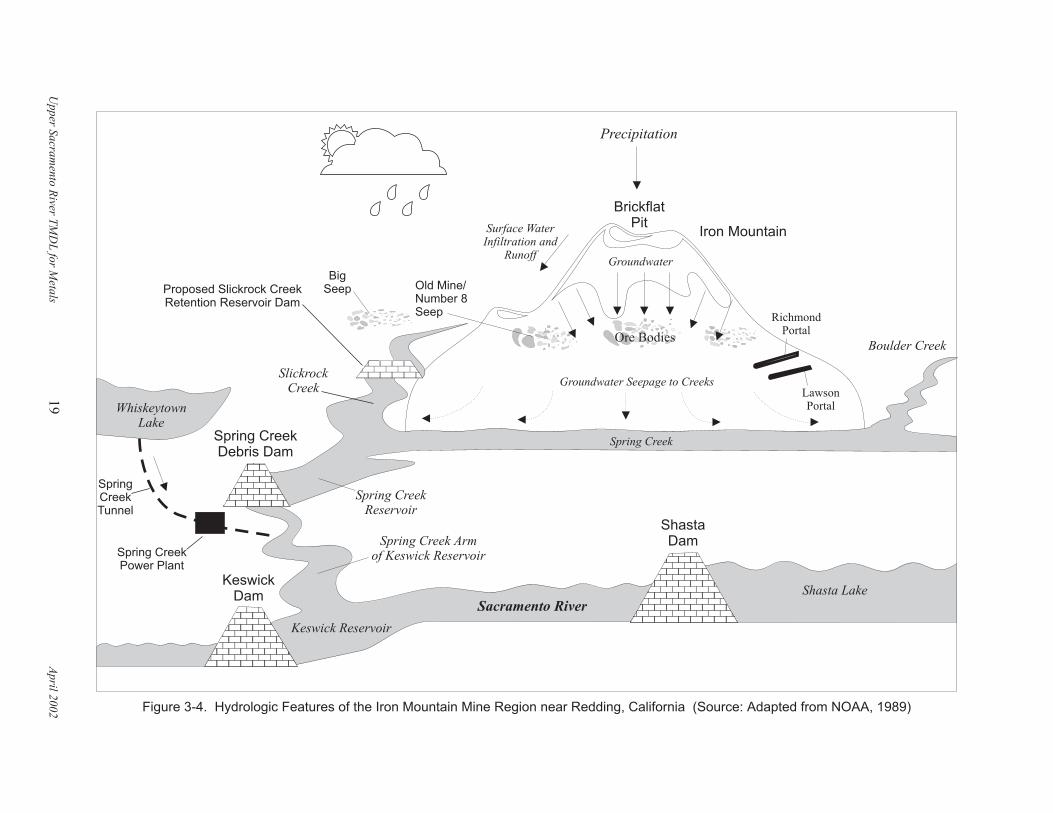
remain at the site (USEPA, 2001). The exposure of the remaining ore to oxygen and water (rainfall and
groundwater) has lead to the formation of AMD with very high amounts of copper and zinc, as well as
other metals such as cadmium.
Much of the AMD from the IMM site eventually discharges through mine adits and groundwater seepage,
and is ultimately channeled into the Spring Creek Reservoir. The USBR releases the stored AMD into
Keswick Reservoir (USEPA, 2001). The USBR coordinates releases to coincide with the Sacramento
River flow below Keswick Dam. On occasion, uncontrolled spills and excessive waste releases have
occurred when Spring Creek Reservoir reached capacity. Without sufficient dilution, this results in the
release of quantities of heavy metals into the Sacramento River that are harmful to aquatic organisms
(USEPA, 2001).
Iron MountainMine
Iron MountainMine
IRONMTN
BoulderCementation
Plant
RichmondMine
TailingsDam
MinnesotaFlats
TreatmentPlantMine
DumpsProposedSlickrock CreekRetentionReservoir Dam
Slug
Gul
ch
Slickrock
Cre
ek
Bould
er
Cre
ek
Sprin
gC
reek
Spring
Cre
ek
South
Fork
Spring
Creek
Spring CreekDebris Dam
(Spillway Elevation:795 feet above msl)
Fla
t
Cre
ek
SacramentoRiver/
KeswickReservoir
Spring CreekReservoir
Spring CreekPower House
SA
CR
AM
EN
T OR I V E R
Spring CreekArm of
Keswick Reservoir
Iron
Mounta
inR
oad
Figure 3-3. Geographic Features of the Iron Mountain Mine Region(Sources: USGS, 1976 and 1979; Heiman, 1989; NOAA, 1989)
00.5 0.5 1
Miles
N
SlickrockCementationPlant
LEGEND
Drainages mentioned in text
Other drainages
Roads (primary)
Roads (secondary)
Railroad
Mine
Mine dump
Upper
Sacra
men
toR
iverT
MD
Lfo
rM
etals
2002
18
April
������������������������
Figure 3-4. Hydrologic Features of the Iron Mountain Mine Region near Redding, California (Source: Adapted from NOAA, 1989)
������������������������������������������������������
Groundwater
Ore Bodies
Iron Mountain
����������������������������������������
ShastaDam
Spring CreekDebris Dam
KeswickDam
BigSeep Old Mine/
Number 8Seep
Surface WaterInfiltration and
Runoff
Precipitation
BrickflatPit
Richmond
Portal
SpringCreekTunnel
Spring CreekPower Plant
Spring CreekReservoir
Spring Creek Armof Keswick Reservoir
Shasta Lake
Sacramento River
Keswick Reservoir
Spring Creek
Lawson
Portal
Boulder Creek
Groundwater Seepage to Creeks
WhiskeytownLake
������������
SlickrockCreek
Proposed Slickrock CreekRetention Reservoir Dam
Upper
Sacra
men
toR
iverT
MD
Lfo
rM
etals
2002
19
April
Upper Sacramento River TMDL for Metals April 2002 20
In addition, AMD from the IMM site results in the deposition of contaminated sediments in Keswick
Reservoir. When the acidic, metal-laden waters of Spring Creek enter the neutral Keswick Reservoir
waters, the pH rises and causes metal precipitates to drop out of solution (Rae, 1998). Researchers have
characterized three distinct sediment piles containing high levels of copper, zinc, and iron in the Spring
Creek Arm of Keswick Reservoir (SCAKR), with total volume estimates currently as high as
230,000 cubic yards. A fourth pile exists in the main channel of Keswick Reservoir.
There have been several phases of remediation efforts at the IMM site, some of which are ongoing.
Current remediation activities control on average 83% of total IMM site copper discharges and 89% of
zinc discharges. However, even taking into account the response actions completed to date, IMM AMD
is expected to cause regular annual exceedances of protective water quality standards in Keswick
Reservoir, continued exceedances in the Sacramento River under certain storm conditions, and the
continued release of 25,000 to 70,000 pounds per year of copper and 40,000 to 90,000 pounds of zinc to
Keswick Reservoir and the main stem of the Sacramento River in normal to wet water years
(USEPA, 1997b). Therefore, the remediation activities proposed for the next two years (see
Chapters 7 and 10) are particularly relevant to this TMDL.
The USEPA developed a numerical water quality model to predict the effectiveness of various remedial
alternatives for the IMM site with respect to limiting the frequency of SCDD spills and exceedances of
the water quality standards below Keswick Reservoir (USEPA, 1997b). Based on the results of their
modeling efforts and public review, the USEPA determined that the construction of the Slickrock Creek
Retention Dam (SRCRD) would enable the treatment of Slickrock Creek drainage, which comprises
approximately 60 to 70% of the remaining uncontrolled copper and 40 to 50% of the remaining
uncontrolled zinc and cadmium site discharges. This action, when combined with the current remedies,
would control more than 95% of total IMM site releases (USEPA, 2000b). Construction of the SRCRD
began during the summer of 2001. Through a court ordered settlement, Aventis CropSciences (a former
owner and operator), has arranged for a private contractor to operate and maintain the site remedies
(USEPA’s Record of Decision (RODs) 1-4) over the next 30 years, and to pay to the federal and State
governments to fund future site costs (USEPA, 2000b). In addition, the USEPA continues to study
potential remedial approaches for the area source (non-portal) AMD discharges from the Boulder Creek
drainage (the remaining 5% of total site releases) and the removal of sediment that has accumulated in the
SCAKR, Spring Creek Reservoir, and the main channel of Keswick Reservoir (Rae, 1998; USEPA, 2001;
Sugarek, 2001).
Upper Sacramento River TMDL for Metals April 2002 21
Chapter 7 (Linkage Analysis) provides a more detailed review of the USEPA’s water quality modeling
results and the linkages between metal loads from the IMM site. The USEPA’s ROD4 issued on
September 30, 1997, provides a detailed description of part IMM operations and past and ongoing
remediation activities at the IMM site.
3.3 Effects of Dams and Diversions on Sacramento River Hydrology
A series of dams and diversions control the hydrology of the upper Sacramento River basin:
• Red Bluff Diversion Dam, Anderson-Cottonwood Irrigation District Dam, Keswick Dam, and Shasta Dam are on the upper Sacramento River;
• Spring Creek Tunnel directs water from Whiskeytown Lake to the Spring Creek Power Plant (SCPP) and Spring Creek; and
• Spring Creek Debris Dam is on Spring Creek.
Table 3-1 summarizes the characteristics of each of these features. Figure 1-1 illustrates the features’
locations. These dams and diversions coordinate surface water flows to provide irrigation water,
hydroelectric power, flood control, recreation, and potable water, as well as to maintain navigation flows,
to protect fish in the Sacramento River Sacramento-San Joaquin Delta from intrusion of saline ocean
water, to control temperature in the Sacramento River, to comply with instream fishery flow
requirements, and to provide for other environmental needs (e.g., federal and State Endangered Species
Acts) (NOAA, 1989; USBR, 2001; Michny, 2001). This flow coordination results in a complex water
management system that greatly influences the concentration and timing of contaminants from the IMM
site that enter the Sacramento River and dramatically affects the spawning habitat of salmonid species.
3.3.1 Dams and Diversions in the Iron Mountain Mines Region
Shasta Dam, completed in 1945, is the keystone of the Central Valley Project (CVP); it impounds Shasta
Lake, which has a capacity of 4.5 million acre-feet (Rae, 1998; USBR, 2001). The penstock inlet is at the
mid-level of the dam and normally releases colder, deeper waters, except for occasional periods when the
reservoir is at low levels due to drought or reduced river inflow. A temperature control device enables
reservoir withdrawals from various elevations. The elevation is determined by temperature operations for
the chinook salmon in the Sacramento River; withdrawals are typically made from higher elevations
during the spring season, and progressively lower elevations throughout the summer and fall seasons
(Michny, 2001).
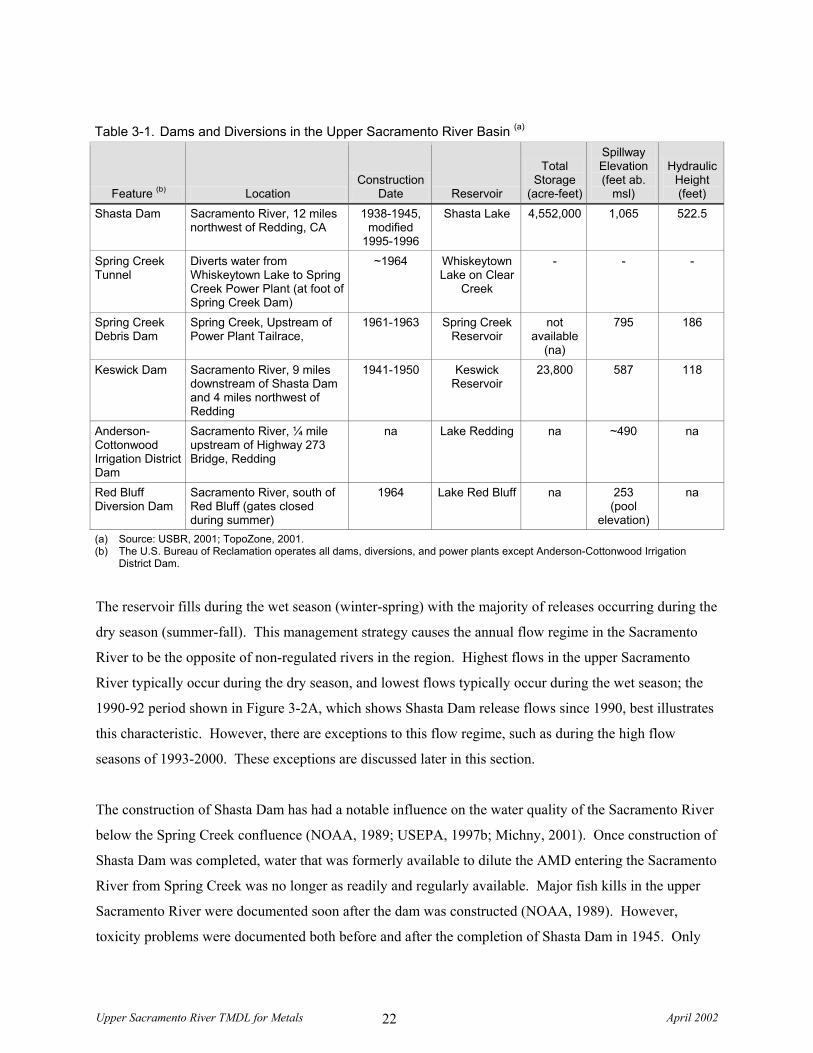
Upper Sacramento River TMDL for Metals April 2002 22
Table 3-1. Dams and Diversions in the Upper Sacramento River Basin (a)
Feature (b) Location Construction
Date Reservoir
Total Storage
(acre-feet)
Spillway Elevation (feet ab.
msl)
Hydraulic Height (feet)
Shasta Dam Sacramento River, 12 miles northwest of Redding, CA
1938-1945, modified
1995-1996
Shasta Lake 4,552,000 1,065 522.5
Spring Creek Tunnel
Diverts water from Whiskeytown Lake to Spring Creek Power Plant (at foot of Spring Creek Dam)
~1964 Whiskeytown Lake on Clear
Creek
- - -
Spring Creek Debris Dam
Spring Creek, Upstream of Power Plant Tailrace,
1961-1963 Spring Creek Reservoir
not available
(na)
795 186
Keswick Dam Sacramento River, 9 miles downstream of Shasta Dam and 4 miles northwest of Redding
1941-1950 Keswick Reservoir
23,800 587 118
Anderson-Cottonwood Irrigation District Dam
Sacramento River, ¼ mile upstream of Highway 273 Bridge, Redding
na Lake Redding na ~490 na
Red Bluff Diversion Dam
Sacramento River, south of Red Bluff (gates closed during summer)
1964 Lake Red Bluff na 253 (pool
elevation)
na
(a) Source: USBR, 2001; TopoZone, 2001. (b) The U.S. Bureau of Reclamation operates all dams, diversions, and power plants except Anderson-Cottonwood Irrigation
District Dam.
The reservoir fills during the wet season (winter-spring) with the majority of releases occurring during the
dry season (summer-fall). This management strategy causes the annual flow regime in the Sacramento
River to be the opposite of non-regulated rivers in the region. Highest flows in the upper Sacramento
River typically occur during the dry season, and lowest flows typically occur during the wet season; the
1990-92 period shown in Figure 3-2A, which shows Shasta Dam release flows since 1990, best illustrates
this characteristic. However, there are exceptions to this flow regime, such as during the high flow
seasons of 1993-2000. These exceptions are discussed later in this section.
The construction of Shasta Dam has had a notable influence on the water quality of the Sacramento River
below the Spring Creek confluence (NOAA, 1989; USEPA, 1997b; Michny, 2001). Once construction of
Shasta Dam was completed, water that was formerly available to dilute the AMD entering the Sacramento
River from Spring Creek was no longer as readily and regularly available. Major fish kills in the upper
Sacramento River were documented soon after the dam was constructed (NOAA, 1989). However,
toxicity problems were documented both before and after the completion of Shasta Dam in 1945. Only
Upper Sacramento River TMDL for Metals April 2002 23
limited water quality information is available from the pre-Shasta Dam period; however, water quality
modeling and the limited available data indicate that, prior to the construction of the Shasta Dam, the
IMM discharges caused metal levels in the Sacramento River to exceed levels that are safe for aquatic life
for more than 330 days each year on average, even after the discharges became fully mixed with
Sacramento River waters downstream of the confluence of Spring Creek and the Sacramento River
(USEPA, 1997b).
Keswick Dam, completed in 1950, is the regulating dam located on the Sacramento River approximately
nine miles downstream of Shasta Dam (Rae, 1998). The USBR constructed the dam to buffer fluctuations
in discharges from Shasta Dam and SCPP and to control runoff from the 45 square miles of drainage area
between Shasta Dam and Keswick Dam, while also producing electricity (NOAA, 1989; Michny, 2001).
Once USBR completed the Shasta and Keswick Dams, salmon and steelhead were restricted to spawning
grounds in areas downstream of Keswick Dam, and were unable to migrate past the area impacted by
AMD discharges from Iron Mountain and other mines in the Shasta Lake region (Rae, 1998; Michny,
2001).
Spring Creek tunnel diverts water from Whiskeytown Lake to the SCPP, which is on the south bank of
Spring Creek between the SCDD and the SCAKR (see Figure 1-1).4 The USBR completed the SCDD
in 1963 to control sedimentation to protect the SCPP tailrace channel, and to control IMM AMD to
protect Sacramento River fisheries. The SCDD is located on Spring Creek just above its confluence with
the SCAKR. Construction of the SCDD reduced the frequency and massiveness of fish kills. However,
during extreme storm events, the SCDD has filled beyond capacity, spilling toxic levels of AMD into the
Sacramento River on an average of every two to three years, causing episodes when emerging fry were
killed (Rae, 1998; Michny, 2001).
AMD from the IMM site is presently controlled, to some extent, by coordinated dilution in the
Sacramento River (NOAA, 1989). Optimally, the USBR releases contaminated water from the SCDD
when the discharge from Shasta Dam is high, thereby allowing maximum dilution of the contaminated
4 From 1896 until 1907, the Keswick smelter operated in the vicinity of the present Spring Creek Reservoir, and caused much of
the surrounding area to be denuded of vegetation as a result of toxic smelter fumes. The deforestation caused by the smelter resulted in extremely high sedimentation rates in the Spring Creek basin, and within nine years after the completion of Keswick Dam, a delta had formed in the Spring Creek Arm of Keswick Reservoir containing an estimated 750,000 cubic yards of material. As SCPP neared construction, the USBR evaluated alternatives for sediment control for the tailrace channel. The USBR and officials from other agencies recognized an opportunity to also achieve some protection for the Sacramento River fisheries with the construction of a debris dam that would retain water contaminated by AMD. This resulted in the approval for the construction of SCDD in 1960 (Rae, 1998; NOAA, 1989).
Upper Sacramento River TMDL for Metals April 2002 24
water. However, AMD amounts are highly variable from season to season and year to year. In addition,
the water levels in the Whiskeytown and Shasta reservoirs, which are a function in part of the rain pattern
of prior years, impacts the ability of the system to operate in a manner that assures that the metal
concentrations remain below levels that pose a risk to aquatic organisms (Smith and Sugarek, 2001).
Shasta Lake cannot always provide an adequate volume of dilution water because Shasta Dam does not
typically release large volumes of water during the wet season when the greatest runoff from the IMM
site occurs (NOAA, 1989). In particular, the flows in the Sacramento River available at the onset of
major early season storm events cannot generally provide adequate dilution of the IMM contaminants at
current levels of metals discharges (USEPA, 1997b). Storm inflows into the Spring Creek Reservoir
frequently occur at several hundred to 2,000 cubic feet per second (cfs); Sacramento River flows are
frequently near minimum legal flows during the first storm of the season, and are not generally more than
10,000 cfs. In addition, large uncontrolled releases of water from SCDD have occurred when heavy rains
cause the Spring Creek Reservoir to fill and overflow; these overflows have occurred during the wet
season when regulated flows in the Sacramento River were low (NOAA, 1989; Pedri, 2001).
1980 Memorandum of Understanding & Dam Operations
Prior to 1980, the California Department of Fish and Game (CDFG) and Regional Board staff periodically
provided information to the USBR on toxicity criteria and dilution ratios or equations, for the USBR’s
use in determining SCDD releases. In 1980, the USBR entered into a memorandum of understanding
with CDFG and the State Water Resources Control Board, acting on behalf of the Regional Board (1980
MOU) (SWRCB et al., 1980).5 In the 1980 MOU, the parties agreed on, among other things: 1) new
interim toxicity criteria for copper and zinc to be met below Keswick Reservoir, and 2) new interim
dilution ratios or equations for USBR’s use in operating SCDD. The USBR still manages SCDD
operations according to the 1980 MOU (and two other documents, see below). The authoring agencies
designed the 1980 MOU to be an interim document, describing protective operations until alternative
solutions to the Spring Creek toxicity problem could be achieved. The 1980 MOU provides for reservoir
and Sacramento River monitoring at a frequency based upon reservoir elevation, so that as the reservoir
rises, USBR staff conducts operational monitoring more frequently. USBR staff uses the monitoring data
to calculate allowable SCDD releases based on Keswick Reservoir release volumes, the concentration of
copper and zinc in Spring Creek, and a presumed precipitation factor. The staff calculates the SCDD
5 The 1980 MOU is entitled “Memorandum of Understanding Among the State Water Resources Control Board [on behalf of
the Regional Board], United States Water and Power Resources Service [former name of the USBR], and Department of Fish and Game to Implement Actions to Protect the Sacramento River System from Heavy Metal Pollution from Spring Creek and Adjacent Watersheds” (SWRCB et al. 1980).
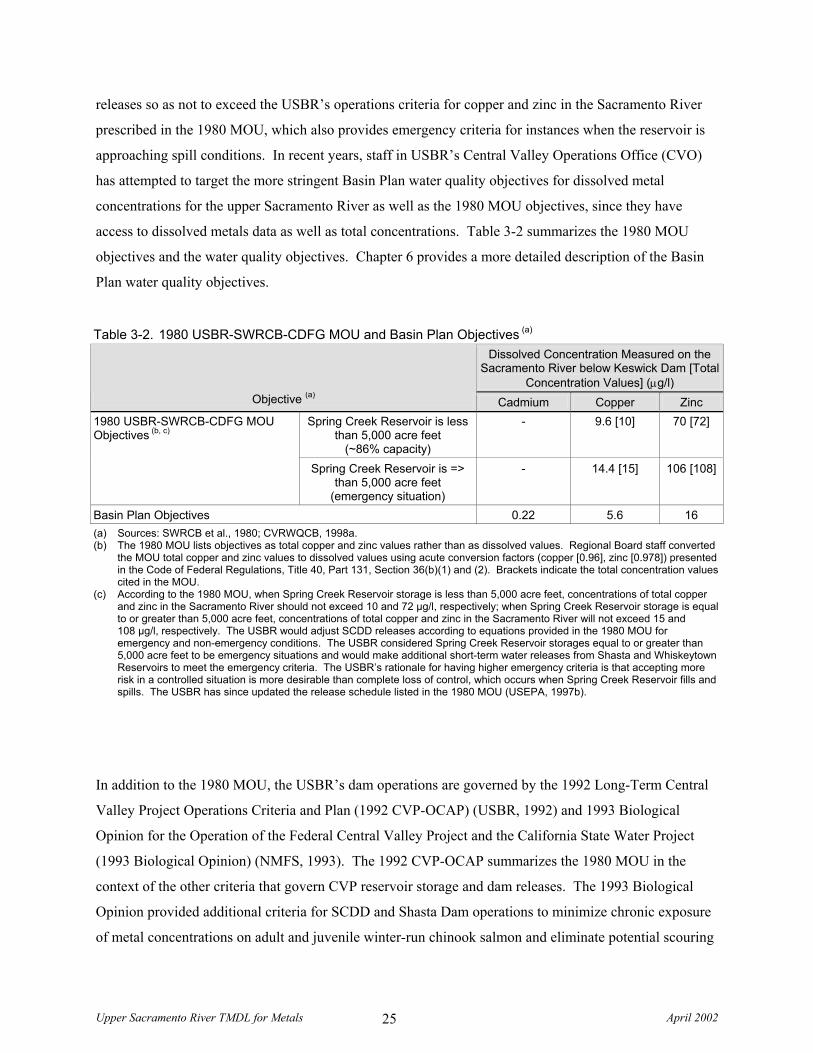
Upper Sacramento River TMDL for Metals April 2002 25
releases so as not to exceed the USBR’s operations criteria for copper and zinc in the Sacramento River
prescribed in the 1980 MOU, which also provides emergency criteria for instances when the reservoir is
approaching spill conditions. In recent years, staff in USBR’s Central Valley Operations Office (CVO)
has attempted to target the more stringent Basin Plan water quality objectives for dissolved metal
concentrations for the upper Sacramento River as well as the 1980 MOU objectives, since they have
access to dissolved metals data as well as total concentrations. Table 3-2 summarizes the 1980 MOU
objectives and the water quality objectives. Chapter 6 provides a more detailed description of the Basin
Plan water quality objectives.
Table 3-2. 1980 USBR-SWRCB-CDFG MOU and Basin Plan Objectives (a) Dissolved Concentration Measured on the
Sacramento River below Keswick Dam [Total Concentration Values] (µg/l)
Objective (a) Cadmium Copper Zinc Spring Creek Reservoir is less
than 5,000 acre feet (~86% capacity)
- 9.6 [10] 70 [72] 1980 USBR-SWRCB-CDFG MOU Objectives (b, c)
Spring Creek Reservoir is => than 5,000 acre feet
(emergency situation)
- 14.4 [15] 106 [108]
Basin Plan Objectives 0.22 5.6 16 (a) Sources: SWRCB et al., 1980; CVRWQCB, 1998a. (b) The 1980 MOU lists objectives as total copper and zinc values rather than as dissolved values. Regional Board staff converted
the MOU total copper and zinc values to dissolved values using acute conversion factors (copper [0.96], zinc [0.978]) presented in the Code of Federal Regulations, Title 40, Part 131, Section 36(b)(1) and (2). Brackets indicate the total concentration values cited in the MOU.
(c) According to the 1980 MOU, when Spring Creek Reservoir storage is less than 5,000 acre feet, concentrations of total copper and zinc in the Sacramento River should not exceed 10 and 72 µg/l, respectively; when Spring Creek Reservoir storage is equal to or greater than 5,000 acre feet, concentrations of total copper and zinc in the Sacramento River will not exceed 15 and 108 µg/l, respectively. The USBR would adjust SCDD releases according to equations provided in the 1980 MOU for emergency and non-emergency conditions. The USBR considered Spring Creek Reservoir storages equal to or greater than 5,000 acre feet to be emergency situations and would make additional short-term water releases from Shasta and Whiskeytown Reservoirs to meet the emergency criteria. The USBR’s rationale for having higher emergency criteria is that accepting more risk in a controlled situation is more desirable than complete loss of control, which occurs when Spring Creek Reservoir fills and spills. The USBR has since updated the release schedule listed in the 1980 MOU (USEPA, 1997b).
In addition to the 1980 MOU, the USBR’s dam operations are governed by the 1992 Long-Term Central
Valley Project Operations Criteria and Plan (1992 CVP-OCAP) (USBR, 1992) and 1993 Biological
Opinion for the Operation of the Federal Central Valley Project and the California State Water Project
(1993 Biological Opinion) (NMFS, 1993). The 1992 CVP-OCAP summarizes the 1980 MOU in the
context of the other criteria that govern CVP reservoir storage and dam releases. The 1993 Biological
Opinion provided additional criteria for SCDD and Shasta Dam operations to minimize chronic exposure
of metal concentrations on adult and juvenile winter-run chinook salmon and eliminate potential scouring
Upper Sacramento River TMDL for Metals April 2002 26
of toxic metal-laden sediments in Keswick Reservoir (NMFS, 1993). The 1993 Biological Opinion
directs the USBR to:
1. Utilize a real-time flow-monitoring device at the weir below the SCDD to provide an accurate measurement of outflow.
2. Utilize analytical instruments capable of detecting copper and zinc at concentrations equal to that specified by the Basin Plan and methods consistent with USEPA quality assurances and quality control guidelines.
3. Increase the sampling frequency of copper and zinc concentrations in the SCDD outflow and Keswick Dam outflow during and immediately following all major storm events, or when malfunctions at the AMD treatment facilities upstream of SCDD cause metal concentrations to change, and provide the water quality data to the National Marine Fisheries Service (NMFS).
4. During the dry season, utilize the results of the real-time flow monitoring device and analytical tests to reduce metal concentrations in the Sacramento River to levels as low as the SCDD evacuation period will allow and target the Basin Plan water quality objectives (except during critical water years when Keswick Dam releases are too low under this schedule to accommodate full evacuation of SCDD).
5. Maintain Keswick Reservoir at or above the normal operating level during all operation of the SCPP to prevent the scouring of toxic metal-laden sediments in Keswick Reservoir.
CVO staff continues to cooperate with CDFG and Regional Board staff members, who periodically call
with requests for additional releases from Shasta and Keswick Dams. USBR has been as responsive as
possible to these requests although USBR always evaluates project needs and downstream flooding
before considering such requests. Although Shasta Dam releases periodically contain a notable amount of
heavy metals (refer to Chapter 5, Source Assessment), flows released by the Shasta Dam and/or Spring
Creek Power Plant plus accretion flows directly into Keswick Reservoir typically serve to dilute metal-
laden Spring Creek waters to reduce toxicity downstream of Keswick Reservoir (Cooke and
Connor, 1998). In addition, there have been numerous instances in past years when the USBR has
released water from Shasta Dam to dilute uncontrollable AMD spills or to allow large releases from
SCDD in anticipation of large inflows to Spring Creek Reservoir. Figure 3-2B, which illustrates Shasta
Dam and SCDD release flows for the winter season of water year 1999, clearly illustrates examples of
such instances. Such coincident releases are not mandated, but have become accepted practice per the
1980 MOU. If flooding is occurring downstream, however, the USBR does not release water from Shasta
Lake (Cooke and Connor, 1998; Michny, 2001).
The USBR also manages SCPP operations to minimize mobilization of contaminated sediments and metal
precipitates (Rae, 1998; NMFS, 1993). As noted in the previous section, when the acidic, metal-laden
waters of Spring Creek enter the neutral Keswick Reservoir waters, the pH rises and causes metal
Upper Sacramento River TMDL for Metals April 2002 27
precipitates to drop out of solution. The USBR based the 1980 MOU on the assumption that 50% of the
dissolved metals will form precipitates in the SCAKR and Keswick Reservoir; more recent USEPA
studies indicate that the precipitation rate is approximately 35% under most conditions (USEPA, 1997b).
The SCDD releases some contaminated water into the SCAKR on a continuous basis.6 Because flows in
the Sacramento River poorly flush the SCAKR, contaminants can accumulate to high concentrations in
the SCAKR. Intermittent discharges from the SCPP can then rapidly flush these accumulations of
contaminated water and precipitates into the main stem of the river (NOAA, 1989). When the USBR
makes releases from the SCDD, the USBR maintains a minimum flow of 250 cfs (“Speed No Load”)
from SCPP to minimize mobilization of contaminated sediments and metal precipitates in the SCAKR. If
USBR makes SCDD releases but SCPP has not operated recently and power generation is scheduled, the
USBR typically runs the SCPP units at “Speed No Load” for several hours before beginning power
generation. Maintenance of the minimum flow from SCPP provides a “gentle flushing” flow that reduces
the risk of AMD collecting in the SCAAKR and flowing out as an unregulated pulse (“slugging”) when
the SCPP comes online to generate power (NOAA, 1989; Michny, 2001). In addition, the 1993
Biological Opinion directs the USBR to maintain Keswick Reservoir at or above the normal operating
level during all SCPP operations to help prevent the mobilization of the SCAKR contaminated sediments
and metal precipitates (NMFS, 1993; Michny, 2001).
3.3.2 Red Bluff Diversion Dam and Anderson-Cottonwood Irrigation District Dam
Red Bluff Diversion Dam and Anderson-Cottonwood Irrigation District Dam (ACIDD) are located on the
Sacramento River downstream of Keswick Dam. These dams have more of an effect on fish passage than
water quality. Lake Red Bluff is a seasonal lake (May 16 through September 14) formed on the
Sacramento River by the closure of the gates at Red Bluff Diversion Dam (USBR, 2001). The dam is a
feature of the Central Valley Project. Lake Red Bluff is approximately 3 miles long with approximately
200 surface acres. The lake provides a coldwater fishery for trout, steelhead, and salmon. However, the
Red Bluff Diversion Dam inhibits passage of adult chinook salmon and steelhead trout. There is an
agreement between the USBR and the CDFG to keep the dam open during salmonid spawning runs,
except during emergency situations (NOAA, 1989).
6 In general, the SCDD releases contaminated water into the SCAKR on a continuous basis. The SCDD typically releases only
when SCPP is operating, but the SCPP may not be generating at all times while the SCDD is releasing water. When there is water in Spring Creek Reservoir, the gates of the SCDD can be closed, but there is minor leakage. When the reservoir is empty or near empty, there is essentially no release (Michny, 2001).
Upper Sacramento River TMDL for Metals April 2002 28
The ACIDD is less than ¼ mile upstream of the Highway 273 Bridge in Redding. The ACIDD is a
component of the Anderson-Cottonwood Irrigation District’s diversion works used to acquire, transport,
and distribute irrigation water to its customers, generally beginning in the spring season and concluding in
the fall season, since the early 1920s (CRA CERES, 2001). The Anderson-Cottonwood Irrigation District
Dam has fish passage facilities.
Upper Sacramento River TMDL for Metals April 2002 29
4 EFFECTS OF CADMIUM, COPPER, AND ZINC ON AQUATIC LIFE
4.1 Physical Characteristics of Cadmium, Copper, and Zinc
The following is a brief description of the physical characteristics of cadmium, copper, and zinc.7
4.1.1 Cadmium
Cadmium is a soft, white, easily fusible metal similar to and commonly associated with zinc and lead. It
is readily soluble in acid and is highly toxic. Compared to other metals, cadmium is relatively mobile in
aquatic environments and may be transported in solution either as hydrated cations or as organic or
inorganic complexes. Cadmium ion precipitates from solution as a carbonate, hydroxide, or sulfide, and
forms soluble complexes with other anions.
Cadmium is strongly adsorbed to clays, mud, humic and organic materials, and some hydrous oxides, all
of which tend to remove it from the water column by precipitation. In polluted waters, complexing with
organic materials is the most important factor in determining the aquatic fate and transport of cadmium.
Sorption processes account for removal of dissolved cadmium to bed sediments and are increasingly
effective as pH increases. Increased hardness and/or alkalinity have been demonstrated to decrease the
toxicity of cadmium.
4.1.2 Copper
Copper is a reddish, malleable metal that occurs in nature in its native form and as sulfides, oxides, and
carbonates. Copper is an essential trace element in plants and animals. Because copper forms chemical
complexes with the anions present, the toxicity of copper to aquatic life depends on the level of alkalinity.
At lower alkalinity, copper is generally more toxic to wildlife.
4.1.3 Zinc
Zinc is usually found in nature as sulfide associated with sulfides of other metals. Because compounds of
zinc are generally soluble in neutral and acidic solution, zinc is readily transported in most natural waters
7 The text for this summary was obtained from a California Department of Water Resources report prepared for the Regional
Board (DWR, 1985). The report derived its descriptions from two USEPA documents (USEPA, 1976 and 1980).
Upper Sacramento River TMDL for Metals April 2002 30
and is one of the most mobile of the heavy metals. Hardness, dissolved oxygen, temperature, and
synergistic effects with other compounds all affect the toxicity of zinc to aquatic life.
4.2 General Effects on Biota
The following sections provide a general description of the effects of cadmium, copper, and zinc on
aquatic organisms. This TMDL report focuses on aquatic organisms for the following reasons:
• Concentrations of cadmium, copper, and zinc in upper Sacramento River water have frequently exceeded water quality standards developed to protect aquatic organisms.
• There is historical evidence of acute heavy metals toxicity to aquatic organisms in the upper Sacramento River (e.g., fish kills).
• Concentrations of cadmium, copper, and zinc have not exceeded water quality criteria designed for the protection of humans during the 1990s.
• There is no current evidence of acute or chronic heavy metals toxicity to humans due to consumption of water or fish from the upper Sacramento River.
4.2.1 Accumulation in Aquatic Organisms
Dietary and waterborne routes expose aquatic organisms to cadmium, copper, and zinc and other metals.
Waterborne routes include uptake of metals released from sediments into the water column, metals in
solution, and metals in sediments. Low trophic level8 species such as phytoplankton obtain most heavy
metals directly from the water. Bioconcentration describes the net accumulation of metals directly from
water. The bioconcentration factor is the ratio of metal concentration in an organism to metal
concentration in water. A bioaccumulation factor describes the degree to which metals accumulate from
water and prey, relative to metal concentration in the water. Compounds bioaccumulate when rates of
uptake are greater than rates of elimination. Because rates of uptake are generally much greater than rates
of elimination, heavy metals may concentrate within organisms. Repeated consumption and
accumulation of metals from contaminated food sources results in tissue concentrations of metals that are
higher in each successive level of the food chain. This process is termed biomagnification. Studies
8 Trophic levels are the hierarchical strata of a food web characterized by organisms that are the same number of steps removed
from the primary producers. The USEPA’s 1997 Mercury Study Report to Congress (USEPA, 1997a) used the following criteria to designate trophic levels based on an organism’s feeding habits:
Trophic level 1: Phytoplankton. Trophic level 2: Zooplankton and benthic invertebrates. Trophic level 3: Organisms that consume zooplankton, benthic invertebrates and phytoplankton. Trophic level 4: Organisms that consume trophic level 3 organisms.
Upper Sacramento River TMDL for Metals April 2002 31
(e.g., Seiti et al., 1995) have found that aquatic food chains exposed to AMD in the upper Sacramento
River have accumulated cadmium, copper, and zinc without evidence of biomagnification.
4.2.2 Toxicity of Heavy Metals to Aquatic Organisms
Aquatic organisms exhibit several types of detrimental effects from chronic and acute exposures to
cadmium, copper, and zinc. Cadmium is of concern because it is known to be toxic to aquatic organisms
and it readily bioaccumulates in aquatic organisms. Among fish, salmonids appear to be the most
vulnerable to cadmium toxicity (NOAA, 1989). A cadmium concentration of 1.1 µg/l can be acutely
toxic to juvenile chinook salmon, depending on water hardness (Reyes, 1994). Copper and zinc are
essential trace elements that can be toxic at high concentrations. Copper and zinc concentrations of less
than 7.4 µg/l and 84 µg/l, respectively, can be acutely toxic to chinook salmon, depending on water
hardness (Reyes, 1994). Chronic effects of these heavy metals include:
• reproductive impairment and developmental abnormalities (fish, invertebrates, and algae);
• reduction in growth (fish, invertebrates, and algae);
• behavioral effects, such as avoidance of areas with elevated copper and zinc, lethargy, decreased food consumption, and changes in foraging behavior (fish);
• increased susceptibility to infection (fish);
• decreased abundance and diversity (invertebrates) and changes in community (algae);
• reduction in photosynthesis and effects on morphology (algae); and
• varying effects on hematology and physiology (fish).
Section 4.3 provides a summary of effects observed in aquatic organisms in the upper Sacramento River.
4.2.3 Bioavailability and Mixture Interactions
Cadmium, copper, and zinc (heavy metals) are bioavailable if they are present in forms organisms can
ingest and metabolize (Reyes, 1994). Most water quality criteria for the heavy metals relate to total
recoverable concentrations; however, the USEPA now recommends the use of dissolved metal
concentrations to set and measure compliance with aquatic life water quality standards because dissolved
metal concentrations more closely approximate the bioavailable fraction of the metal in the water column
than do total recoverable metal concentrations (USEPA, 2000a).
Upper Sacramento River TMDL for Metals April 2002 32
Water hardness has been the only physical/chemical water quality parameter incorporated in deriving the
criteria (Reyes, 19949). Chronic and acute zinc and cadmium toxicity decrease with increased hardness;
acute toxicity of copper appears to decrease with increased hardness. Researchers have found that other
factors such as metal speciation and pH also modify metal toxicity and affect bioavailability. In general,
the toxicity of cadmium and zinc increases with increases in pH, while copper toxicity increases with
decreases in pH. When bound to an organic compound, copper does not contribute toxicity. In contrast,
researchers have reported that inorganic copper compounds (e.g., hydroxide copper species, CuOH+ and
[Cu(OH2)]2+) are toxic. However, carbonate species (e.g., CuCO3) do not make a significant contribution
to copper toxicity. The same principles may be applied to other cationic metals, including zinc and
cadmium. Biological and physical factors – such quantity of organisms, water temperature, and
environmental variability – might also affect bioavailability of heavy metals.
Water quality criteria for cadmium, copper, and zinc relate to individual metals and do not address
mixture interactions. However, toxicants generally occur as mixtures in ambient water. Metal mixture
interactions are described as additive, more than additive (“synergistic”, more toxic than the sum of the
individual components), or less than additive (“antagonistic”, less toxic than the components). Table C-1
in Appendix C summarizes the variety of effects of metal mixture interactions.
4.3 Effects on Biota in the Upper Sacramento River
The continuous release of metals from the IMM site and other mine sites has resulted in historical fish
kills and has contributed to a progressive decline in the fisheries population in the Sacramento River
(USEPA, 2001b; Rae, 1998; Schwarzbach, 1993; CH2M Hill, 1992; NOAA, 1989). Toxicity to fish is of
particular concern because, as noted earlier, the most important salmon habitat in California lies directly
downstream of Keswick Dam. Because of the winter-run chinook salmon decline, in May 1989 the
NMFS took emergency action to list the winter run chinook salmon as “threatened” under the Federal
Endangered Species Act and to designate the Sacramento River from Red Bluff Diversion Dam to
Keswick Dam as a critical habitat (USEPA, 2001a). The State of California then classified the winter-run
chinook salmon as “endangered” (NOAA, 1989). In January 1994, the NMFS issued its final rule
reclassifying the winter-run chinook salmon as an endangered species. The following sections provide a
9 In late 1994, Regional Board staff conducted an extensive literature review of cadmium, copper, and zinc toxicity in
freshwater aquatic organisms and compiled a report that summarized the literature and tabulated available data in appendices (Reyes, 1994). The reader should refer to the 1994 staff report for original citations.
Upper Sacramento River TMDL for Metals April 2002 33
more detailed description of the documented fish kills, salmonid population decline, and effects on other
species.
4.3.1 Documented Fish Kills
Deaths of fish were common in water below Keswick Dam during the mid-20th century (NOAA, 1989;
Cooke and Connor, 1998; CH2M Hill, 1992; Michny, 2001). According to actual observations and
bioassay-based calculations, more than twenty reported and estimated salmon and steelhead trout fish
kills took place in the upper Sacramento River between Keswick Dam and Balls Ferry, California
between 1940 (shortly after the construction of the Shasta Dam) and 1986 (CH2M Hill, 1992; NOAA,
198910). In addition, river toxicity testing in the late 1930s indicated near lethal concentrations of copper
in the Sacramento River upstream of the IMM sites and lethal concentrations of copper downstream of the
IMM site (Michny, 2001). The fish kills and river toxicity were associated with acid mine drainage –
loaded with cadmium, copper, and zinc – from the Iron Mountain Mines site (NOAA, 1989). There have
also been indications that, following an uncontrolled spillage of contaminated water into the Sacramento
River, there is a corresponding reduction in the number of adult salmon returning to spawn three to four
years after the spillage.
Construction of the SCDD in 1963 reduced the frequency of fish kills, but during extreme storm events,
the SCDD can fill beyond capacity, spilling toxic levels of AMD into the Sacramento River (Rae, 1998).
Since the late 1970s, major adult fish kills have ceased. However, metals concentrations may be high
enough to have sublethal effects on adult fish and to kill eggs and larvae11 (Cooke and Connor, 1998).
4.3.2 Salmonid Population Decline
Historically, metal contamination from the Iron Mountain Mines sites contributed to the progressive
decline of spawning populations of chinook salmon and steelhead trout in the upper Sacramento River
from the late 1960s to mid-1980s. Other factors have also contributed to the decline of salmonid
populations: poor fish passage over the Red Bluff Diversion Dam and high water temperatures in the river
10 On July 28, 1989, the National Oceanic and Atmospheric Administration (NOAA) released a Findings of Fact for Iron
Mountain Mine that reviewed the literature and available data that described the effects of cadmium, copper, and zinc toxicity in freshwater aquatic organisms in the upper Sacramento River below Spring Creek (NOAA, 1989). In addition, the USEPA updated the documentation of fish kills near Redding (1899 to 1986) in their 1992 Endangerment Assessment for IMM (CH2M Hill, 1992). The reader should refer to these documents for the citations for the fish kill data.
Upper Sacramento River TMDL for Metals April 2002 34
are the primary factors; difficult fish passage over the Anderson-Cottonwood Irrigation District Dam, loss
of gravel for spawning habitat below Keswick Dam, and predation by hatchery-released steelhead trout
and warm water squawfish are probably minor factors.
The fall-run chinook population declined 11.6% between the late 1960s and mid-1980s, and the winter-
run population declined 96.8% over the same period; steelhead trout runs have declined by 84.3% during
the same period (NOAA, 1989). The greatest decline in salmon spawning populations between 1959 and
1982 occurred in the reach below the Keswick Dam, between the Anderson-Cottonwood Irrigation
District Dam in Redding and Balls Ferry (NOAA, 1989). In contrast, spawning from Balls Ferry to the
Red Bluff Diversion Dam remained relatively stable during this period and spawning below the diversion
dam increased.
The winter-run chinook salmon experienced the most precipitous decline of all salmon populations in the
upper Sacramento River (NOAA, 1989). Unlike most salmon that spawn when they reach the spawning
ground, the winter-run chinook salmon hold over for several months before they begin spawning
(Schwarzbach, 1993). The combination of the several month hold-over and coincidence of any spring-
time AMD releases potentially exposes the adults of winter-run salmon to greater metal contamination
while on the spawning grounds in the Sacramento River than other salmon runs. Winter-run salmon
spawning further downstream at Red Bluff may be at less risk because of the dilution effect of large
tributary streams (Schwarzbach, 1993).
4.3.3 Effects on Other Species
Researchers have attributed decreased abundance and diversity of benthic invertebrates and aquatic flora
in the Sacramento River downstream from the mouth of Spring Creek and changes in benthic invertebrate
and changes in benthic invertebrate communities in the Sacramento River near Redding to elevated levels
of trace metals in the system (NOAA, 1989). There is no current evidence of acute or chronic heavy
metals toxicity to humans due to consumption of water or fish from the upper Sacramento River.
11 Direct evidence is difficult to find in fast-flowing waters (Cooke and Connor, 1998). Cooke and Connor’s review of water
quality data and toxicity tests in laboratory settings indicates that metals concentrations in the upper Sacramento River are high enough to kill eggs and larvae.
Upper Sacramento River TMDL for Metals April 2002 35
5 SOURCE ANALYSIS
5.1 Introduction
The source analysis evaluates pollutant sources and documents estimates of the various pollutant loads to
the impaired waterbody. The Regional Board staff’s source analysis has the following components:
• Identification of dissolved cadmium, copper, and zinc sources in the upper Sacramento River watershed.
• Identification of available flow and dissolved metal concentration data.
• Development of methods used to estimate the source contributions.
• Quantification of dissolved metal source contributions to the upper Sacramento River.
This chapter addresses the daily dissolved copper, cadmium, and zinc loads each source contributes to the
upper Sacramento River. Chapter 7 describes the relationship between the sources’ daily dissolved metal
loads, dissolved metal concentrations in the upper Sacramento River, and the exceedance of water quality
objectives.
5.2 Sources of Cadmium, Copper, and Zinc in the Upper Sacramento River Watershed
Regional Board staff conducted a search of available project and permit files, published literature, and
USGS topographic maps to identify the potential sources of cadmium, copper, and zinc to the upper
Sacramento River. Staff identified several types of potential cadmium, copper, and zinc sources in the
watershed:
Point sources:
• Metal mine sites with AMD such as portals and tailings. • Treated effluent from municipal wastewater treatment plants. • Industrial dischargers within municipal service areas. • Other National Pollutant Discharge Elimination System (NPDES) dischargers.
Nonpoint sources:
• Acid seeps from abandoned mines and other diffuse sources. • Municipal stormwater runoff. • Erosion of naturally occurring metals-enriched soils.
Table 5-1 lists potential metal dischargers and their receiving waters and Figure 5-1 illustrates the
locations of potential sources. Regional Board staff included on Table 5-1 only those mines known to
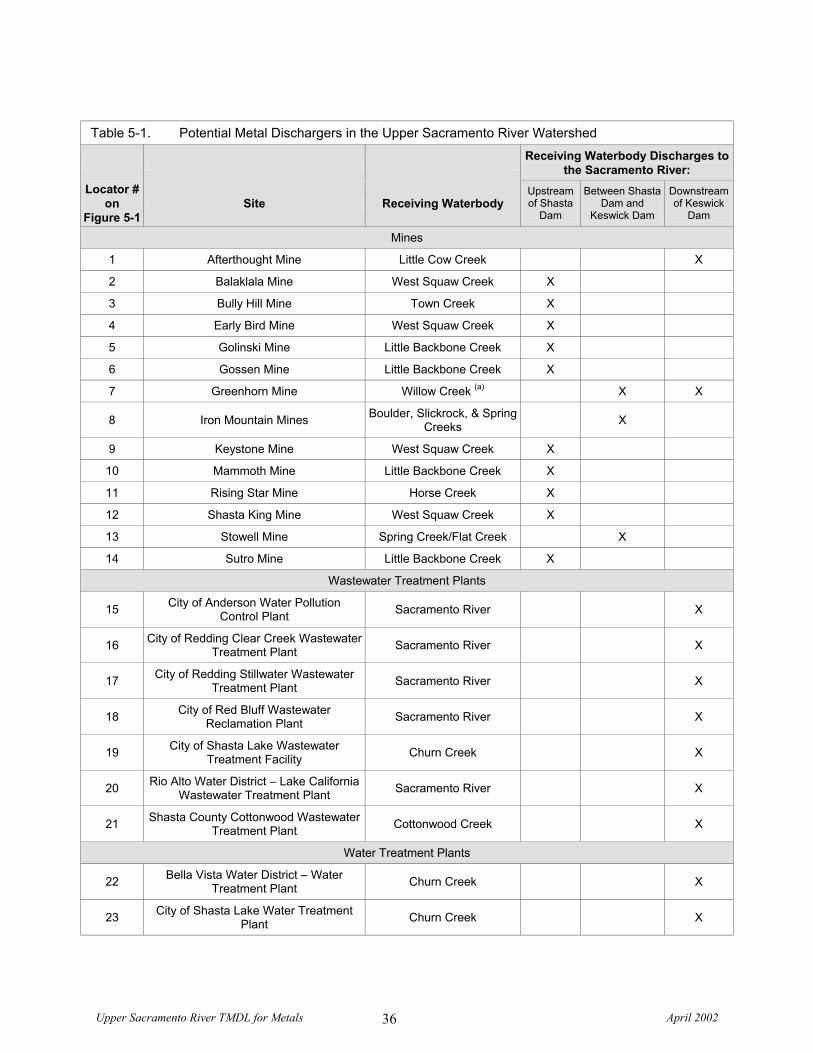
Upper Sacramento River TMDL for Metals April 2002 36
Table 5-1. Potential Metal Dischargers in the Upper Sacramento River Watershed
Receiving Waterbody Discharges to the Sacramento River:
Locator # on
Figure 5-1 Site Receiving Waterbody
Upstream of Shasta
Dam
Between Shasta Dam and
Keswick Dam
Downstream of Keswick
Dam
Mines
1 Afterthought Mine Little Cow Creek X
2 Balaklala Mine West Squaw Creek X
3 Bully Hill Mine Town Creek X
4 Early Bird Mine West Squaw Creek X
5 Golinski Mine Little Backbone Creek X
6 Gossen Mine Little Backbone Creek X
7 Greenhorn Mine Willow Creek (a) X X
8 Iron Mountain Mines Boulder, Slickrock, & Spring Creeks X
9 Keystone Mine West Squaw Creek X
10 Mammoth Mine Little Backbone Creek X
11 Rising Star Mine Horse Creek X
12 Shasta King Mine West Squaw Creek X
13 Stowell Mine Spring Creek/Flat Creek X
14 Sutro Mine Little Backbone Creek X
Wastewater Treatment Plants
15 City of Anderson Water Pollution Control Plant Sacramento River X
16 City of Redding Clear Creek Wastewater Treatment Plant Sacramento River X
17 City of Redding Stillwater Wastewater Treatment Plant Sacramento River X
18 City of Red Bluff Wastewater Reclamation Plant Sacramento River X
19 City of Shasta Lake Wastewater Treatment Facility Churn Creek X
20 Rio Alto Water District – Lake California Wastewater Treatment Plant Sacramento River X
21 Shasta County Cottonwood Wastewater Treatment Plant Cottonwood Creek X
Water Treatment Plants
22 Bella Vista Water District – Water Treatment Plant Churn Creek X
23 City of Shasta Lake Water Treatment Plant Churn Creek X
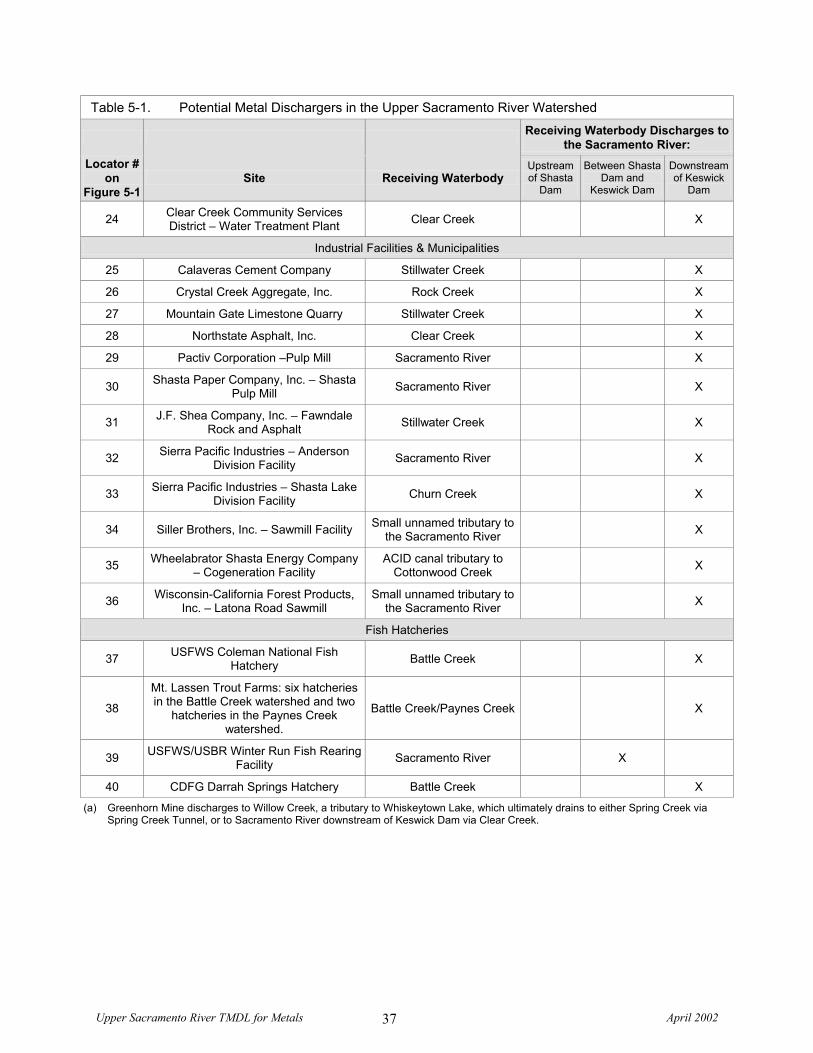
Upper Sacramento River TMDL for Metals April 2002 37
Table 5-1. Potential Metal Dischargers in the Upper Sacramento River Watershed
Receiving Waterbody Discharges to the Sacramento River:
Locator # on
Figure 5-1 Site Receiving Waterbody
Upstream of Shasta
Dam
Between Shasta Dam and
Keswick Dam
Downstream of Keswick
Dam
24 Clear Creek Community Services District – Water Treatment Plant Clear Creek X
Industrial Facilities & Municipalities
25 Calaveras Cement Company Stillwater Creek X
26 Crystal Creek Aggregate, Inc. Rock Creek X
27 Mountain Gate Limestone Quarry Stillwater Creek X
28 Northstate Asphalt, Inc. Clear Creek X
29 Pactiv Corporation –Pulp Mill Sacramento River X
30 Shasta Paper Company, Inc. – Shasta Pulp Mill Sacramento River X
31 J.F. Shea Company, Inc. – Fawndale Rock and Asphalt Stillwater Creek X
32 Sierra Pacific Industries – Anderson Division Facility Sacramento River X
33 Sierra Pacific Industries – Shasta Lake Division Facility Churn Creek X
34 Siller Brothers, Inc. – Sawmill Facility Small unnamed tributary to the Sacramento River X
35 Wheelabrator Shasta Energy Company – Cogeneration Facility
ACID canal tributary to Cottonwood Creek X
36 Wisconsin-California Forest Products, Inc. – Latona Road Sawmill
Small unnamed tributary to the Sacramento River X
Fish Hatcheries
37 USFWS Coleman National Fish Hatchery Battle Creek X
38
Mt. Lassen Trout Farms: six hatcheries in the Battle Creek watershed and two
hatcheries in the Paynes Creek watershed.
Battle Creek/Paynes Creek X
39 USFWS/USBR Winter Run Fish Rearing Facility Sacramento River X
40 CDFG Darrah Springs Hatchery Battle Creek X
(a) Greenhorn Mine discharges to Willow Creek, a tributary to Whiskeytown Lake, which ultimately drains to either Spring Creek via Spring Creek Tunnel, or to Sacramento River downstream of Keswick Dam via Clear Creek.
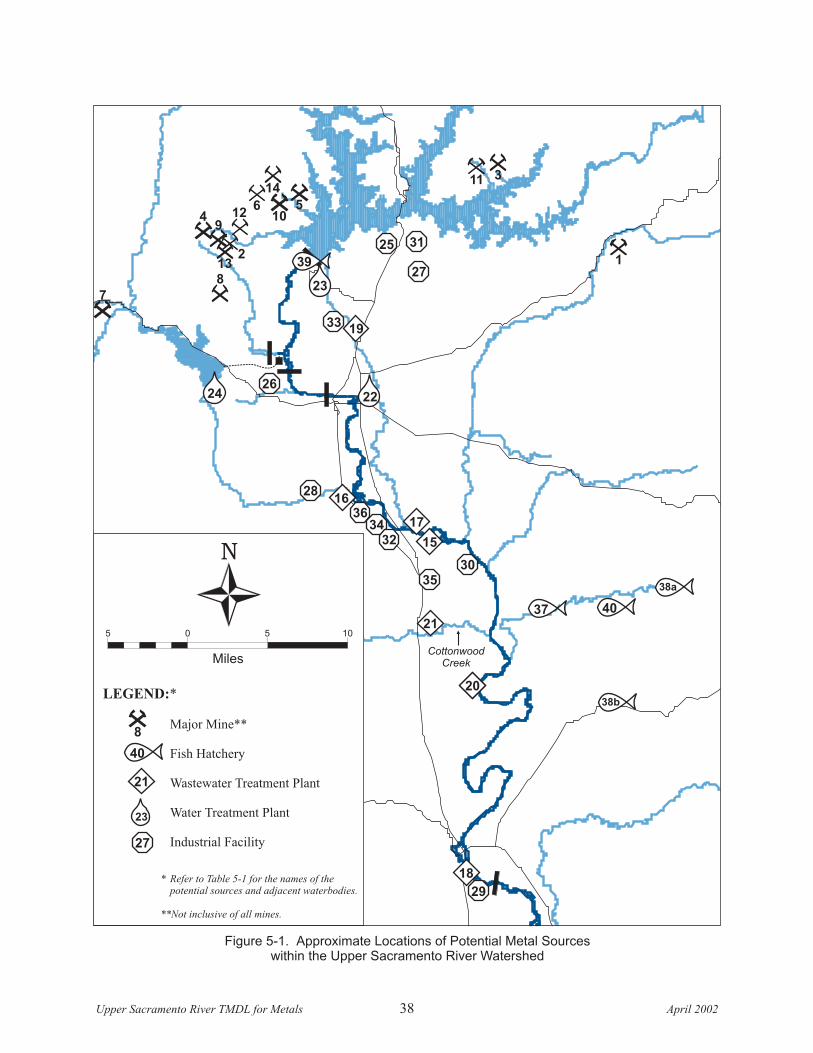
27
25 31
39
16
19
23
24 22
18
17
15
21
21
1
40
29
3436
32
35
30
26
28
33
20
49
132
12
14
105
311
6
38b
38a
7
8
Cottonwood
Creek
7
37
LEGEND:*
Major Mine**
Fish Hatchery
Wastewater Treatment Plant
Water Treatment Plant
Industrial Facility
* Refer to Table 5-1 for the names of thepotential sources and adjacent waterbodies.
**Not inclusive of all mines.
8
27
21
23
40
Figure 5-1. Approximate Locations of Potential Metal Sourceswithin the Upper Sacramento River Watershed
N
Miles
05 5 10
Upper Sacramento River TMDL for Metals 200238 April
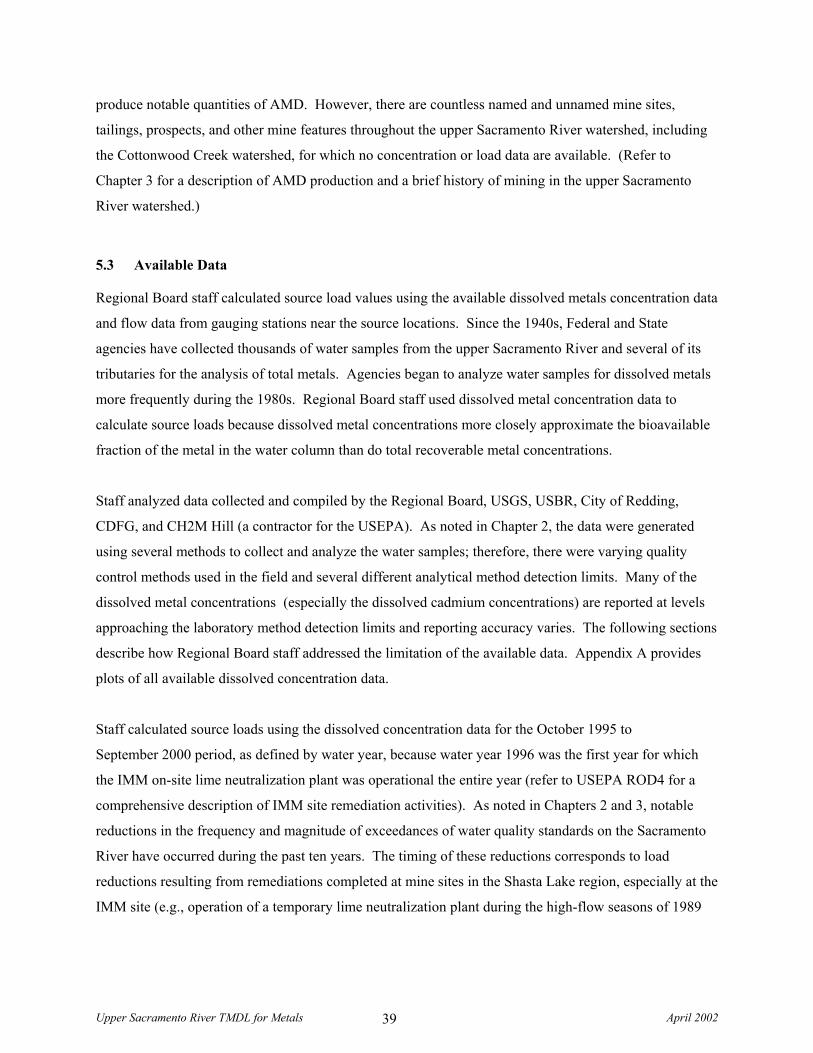
Upper Sacramento River TMDL for Metals April 2002 39
produce notable quantities of AMD. However, there are countless named and unnamed mine sites,
tailings, prospects, and other mine features throughout the upper Sacramento River watershed, including
the Cottonwood Creek watershed, for which no concentration or load data are available. (Refer to
Chapter 3 for a description of AMD production and a brief history of mining in the upper Sacramento
River watershed.)
5.3 Available Data
Regional Board staff calculated source load values using the available dissolved metals concentration data
and flow data from gauging stations near the source locations. Since the 1940s, Federal and State
agencies have collected thousands of water samples from the upper Sacramento River and several of its
tributaries for the analysis of total metals. Agencies began to analyze water samples for dissolved metals
more frequently during the 1980s. Regional Board staff used dissolved metal concentration data to
calculate source loads because dissolved metal concentrations more closely approximate the bioavailable
fraction of the metal in the water column than do total recoverable metal concentrations.
Staff analyzed data collected and compiled by the Regional Board, USGS, USBR, City of Redding,
CDFG, and CH2M Hill (a contractor for the USEPA). As noted in Chapter 2, the data were generated
using several methods to collect and analyze the water samples; therefore, there were varying quality
control methods used in the field and several different analytical method detection limits. Many of the
dissolved metal concentrations (especially the dissolved cadmium concentrations) are reported at levels
approaching the laboratory method detection limits and reporting accuracy varies. The following sections
describe how Regional Board staff addressed the limitation of the available data. Appendix A provides
plots of all available dissolved concentration data.
Staff calculated source loads using the dissolved concentration data for the October 1995 to
September 2000 period, as defined by water year, because water year 1996 was the first year for which
the IMM on-site lime neutralization plant was operational the entire year (refer to USEPA ROD4 for a
comprehensive description of IMM site remediation activities). As noted in Chapters 2 and 3, notable
reductions in the frequency and magnitude of exceedances of water quality standards on the Sacramento
River have occurred during the past ten years. The timing of these reductions corresponds to load
reductions resulting from remediations completed at mine sites in the Shasta Lake region, especially at the
IMM site (e.g., operation of a temporary lime neutralization plant during the high-flow seasons of 1989
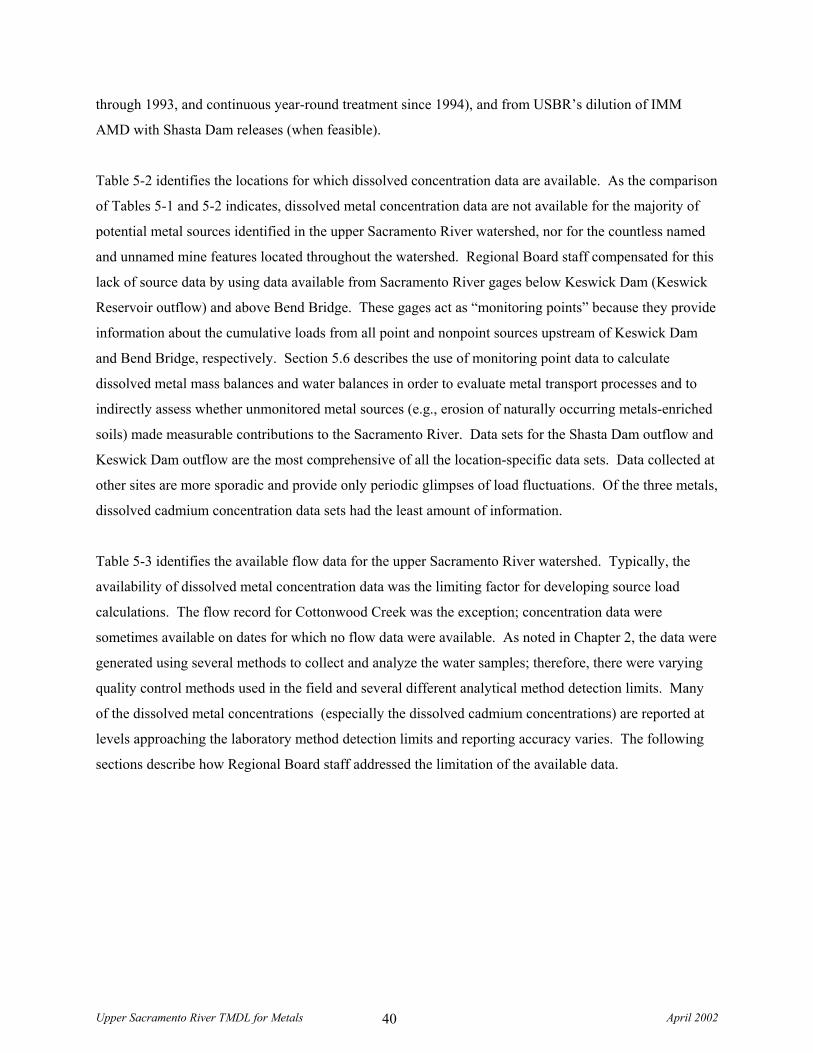
Upper Sacramento River TMDL for Metals April 2002 40
through 1993, and continuous year-round treatment since 1994), and from USBR’s dilution of IMM
AMD with Shasta Dam releases (when feasible).
Table 5-2 identifies the locations for which dissolved concentration data are available. As the comparison
of Tables 5-1 and 5-2 indicates, dissolved metal concentration data are not available for the majority of
potential metal sources identified in the upper Sacramento River watershed, nor for the countless named
and unnamed mine features located throughout the watershed. Regional Board staff compensated for this
lack of source data by using data available from Sacramento River gages below Keswick Dam (Keswick
Reservoir outflow) and above Bend Bridge. These gages act as “monitoring points” because they provide
information about the cumulative loads from all point and nonpoint sources upstream of Keswick Dam
and Bend Bridge, respectively. Section 5.6 describes the use of monitoring point data to calculate
dissolved metal mass balances and water balances in order to evaluate metal transport processes and to
indirectly assess whether unmonitored metal sources (e.g., erosion of naturally occurring metals-enriched
soils) made measurable contributions to the Sacramento River. Data sets for the Shasta Dam outflow and
Keswick Dam outflow are the most comprehensive of all the location-specific data sets. Data collected at
other sites are more sporadic and provide only periodic glimpses of load fluctuations. Of the three metals,
dissolved cadmium concentration data sets had the least amount of information.
Table 5-3 identifies the available flow data for the upper Sacramento River watershed. Typically, the
availability of dissolved metal concentration data was the limiting factor for developing source load
calculations. The flow record for Cottonwood Creek was the exception; concentration data were
sometimes available on dates for which no flow data were available. As noted in Chapter 2, the data were
generated using several methods to collect and analyze the water samples; therefore, there were varying
quality control methods used in the field and several different analytical method detection limits. Many
of the dissolved metal concentrations (especially the dissolved cadmium concentrations) are reported at
levels approaching the laboratory method detection limits and reporting accuracy varies. The following
sections describe how Regional Board staff addressed the limitation of the available data.
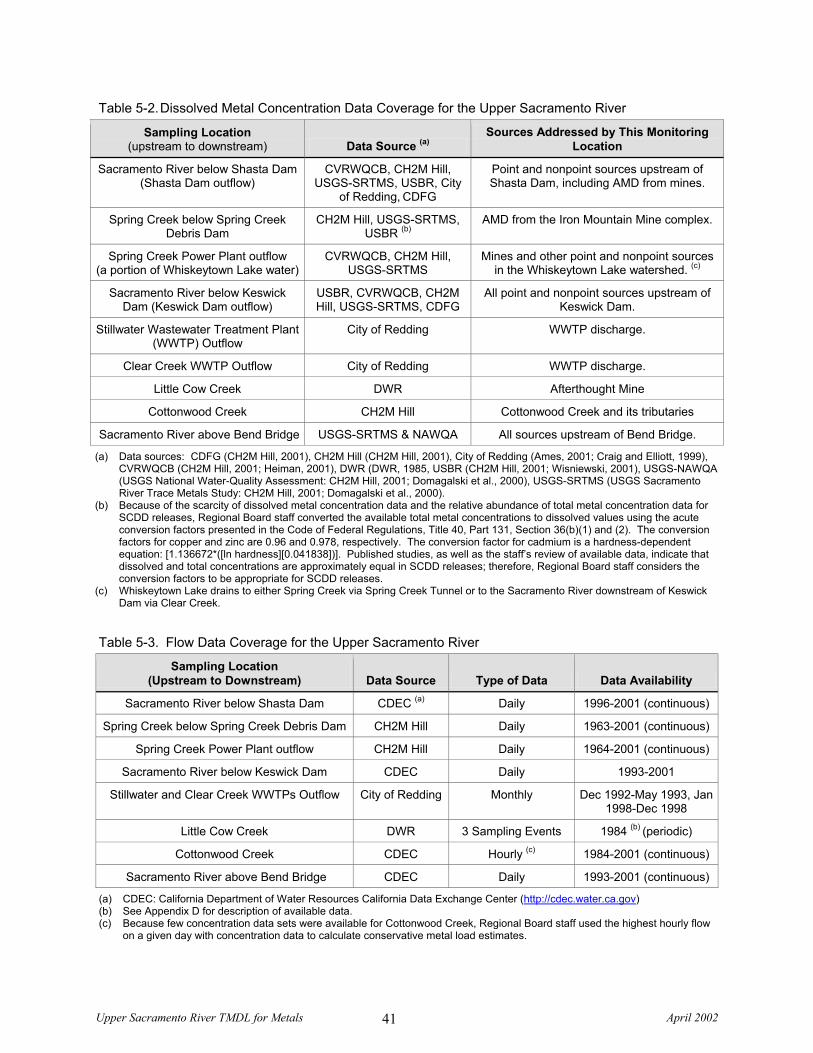
Upper Sacramento River TMDL for Metals April 2002 41
Table 5-2. Dissolved Metal Concentration Data Coverage for the Upper Sacramento River
Sampling Location (upstream to downstream) Data Source (a)
Sources Addressed by This Monitoring Location
Sacramento River below Shasta Dam (Shasta Dam outflow)
CVRWQCB, CH2M Hill, USGS-SRTMS, USBR, City
of Redding, CDFG
Point and nonpoint sources upstream of Shasta Dam, including AMD from mines.
Spring Creek below Spring Creek Debris Dam
CH2M Hill, USGS-SRTMS, USBR (b)
AMD from the Iron Mountain Mine complex.
Spring Creek Power Plant outflow (a portion of Whiskeytown Lake water)
CVRWQCB, CH2M Hill, USGS-SRTMS
Mines and other point and nonpoint sources in the Whiskeytown Lake watershed. (c)
Sacramento River below Keswick Dam (Keswick Dam outflow)
USBR, CVRWQCB, CH2M Hill, USGS-SRTMS, CDFG
All point and nonpoint sources upstream of Keswick Dam.
Stillwater Wastewater Treatment Plant (WWTP) Outflow
City of Redding WWTP discharge.
Clear Creek WWTP Outflow City of Redding WWTP discharge.
Little Cow Creek DWR Afterthought Mine
Cottonwood Creek CH2M Hill Cottonwood Creek and its tributaries
Sacramento River above Bend Bridge USGS-SRTMS & NAWQA All sources upstream of Bend Bridge.
(a) Data sources: CDFG (CH2M Hill, 2001), CH2M Hill (CH2M Hill, 2001), City of Redding (Ames, 2001; Craig and Elliott, 1999), CVRWQCB (CH2M Hill, 2001; Heiman, 2001), DWR (DWR, 1985, USBR (CH2M Hill, 2001; Wisniewski, 2001), USGS-NAWQA (USGS National Water-Quality Assessment: CH2M Hill, 2001; Domagalski et al., 2000), USGS-SRTMS (USGS Sacramento River Trace Metals Study: CH2M Hill, 2001; Domagalski et al., 2000).
(b) Because of the scarcity of dissolved metal concentration data and the relative abundance of total metal concentration data for SCDD releases, Regional Board staff converted the available total metal concentrations to dissolved values using the acute conversion factors presented in the Code of Federal Regulations, Title 40, Part 131, Section 36(b)(1) and (2). The conversion factors for copper and zinc are 0.96 and 0.978, respectively. The conversion factor for cadmium is a hardness-dependent equation: [1.136672*([ln hardness][0.041838])]. Published studies, as well as the staff’s review of available data, indicate that dissolved and total concentrations are approximately equal in SCDD releases; therefore, Regional Board staff considers the conversion factors to be appropriate for SCDD releases.
(c) Whiskeytown Lake drains to either Spring Creek via Spring Creek Tunnel or to the Sacramento River downstream of Keswick Dam via Clear Creek.
Table 5-3. Flow Data Coverage for the Upper Sacramento River
Sampling Location (Upstream to Downstream) Data Source Type of Data Data Availability
Sacramento River below Shasta Dam CDEC (a) Daily 1996-2001 (continuous)
Spring Creek below Spring Creek Debris Dam CH2M Hill Daily 1963-2001 (continuous)
Spring Creek Power Plant outflow CH2M Hill Daily 1964-2001 (continuous)
Sacramento River below Keswick Dam CDEC Daily 1993-2001
Stillwater and Clear Creek WWTPs Outflow City of Redding Monthly Dec 1992-May 1993, Jan 1998-Dec 1998
Little Cow Creek DWR 3 Sampling Events 1984 (b) (periodic)
Cottonwood Creek CDEC Hourly (c) 1984-2001 (continuous)
Sacramento River above Bend Bridge CDEC Daily 1993-2001 (continuous)
(a) CDEC: California Department of Water Resources California Data Exchange Center (http://cdec.water.ca.gov) (b) See Appendix D for description of available data. (c) Because few concentration data sets were available for Cottonwood Creek, Regional Board staff used the highest hourly flow
on a given day with concentration data to calculate conservative metal load estimates.
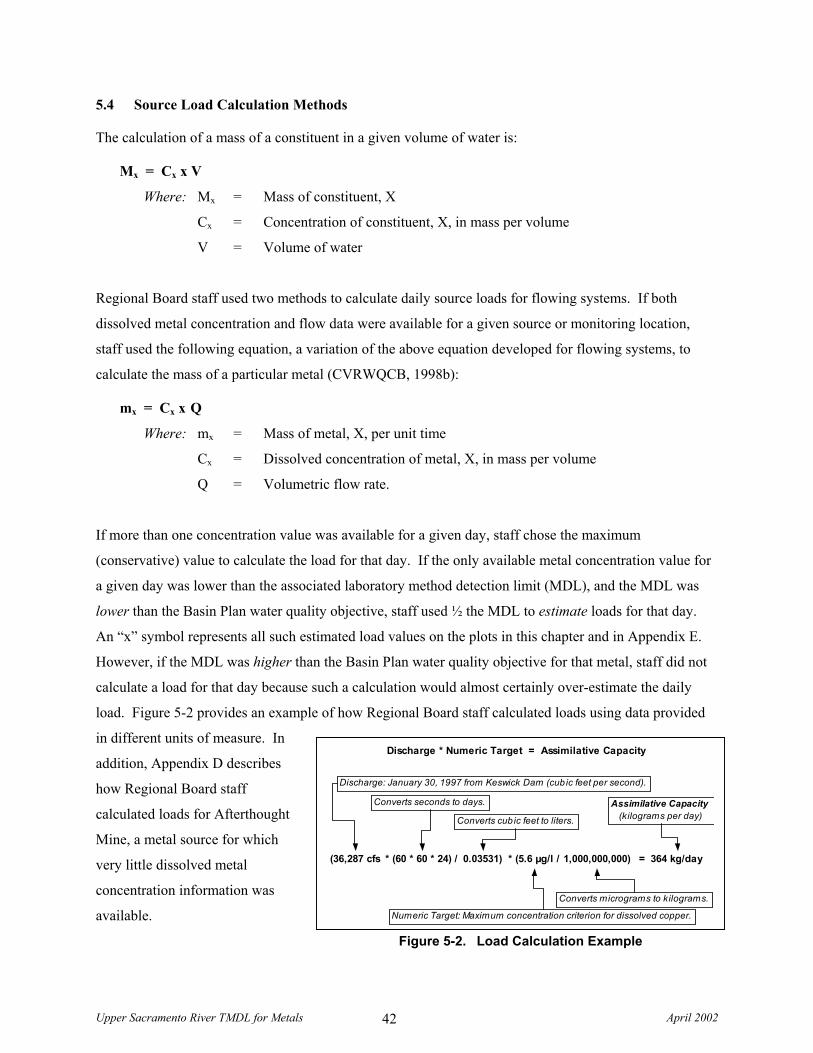
Upper Sacramento River TMDL for Metals April 2002 42
5.4 Source Load Calculation Methods
The calculation of a mass of a constituent in a given volume of water is:
Mx = Cx x V
Where: Mx = Mass of constituent, X
Cx = Concentration of constituent, X, in mass per volume
V = Volume of water
Regional Board staff used two methods to calculate daily source loads for flowing systems. If both
dissolved metal concentration and flow data were available for a given source or monitoring location,
staff used the following equation, a variation of the above equation developed for flowing systems, to
calculate the mass of a particular metal (CVRWQCB, 1998b):
mx = Cx x Q
Where: mx = Mass of metal, X, per unit time
Cx = Dissolved concentration of metal, X, in mass per volume
Q = Volumetric flow rate.
If more than one concentration value was available for a given day, staff chose the maximum
(conservative) value to calculate the load for that day. If the only available metal concentration value for
a given day was lower than the associated laboratory method detection limit (MDL), and the MDL was
lower than the Basin Plan water quality objective, staff used ½ the MDL to estimate loads for that day.
An “x” symbol represents all such estimated load values on the plots in this chapter and in Appendix E.
However, if the MDL was higher than the Basin Plan water quality objective for that metal, staff did not
calculate a load for that day because such a calculation would almost certainly over-estimate the daily
load. Figure 5-2 provides an example of how Regional Board staff calculated loads using data provided
in different units of measure. In
addition, Appendix D describes
how Regional Board staff
calculated loads for Afterthought
Mine, a metal source for which
very little dissolved metal
concentration information was
available.
Discharge: January 30, 1997 from Keswick Dam (cubic feet per second).
Converts seconds to days.
Converts cubic feet to liters.
Assimilative Capacity(kilograms per day)
Converts micrograms to kilograms.
Numeric Target: Maximum concentration criterion for dissolved copper.
Discharge * Numeric Target = Assimilative Capacity
(36,287 cfs * (60 * 60 * 24) / 0.03531) * (5.6 µg/l / 1,000,000,000) 364 kg/day =
Figure 5-2. Load Calculation Example
Upper Sacramento River TMDL for Metals April 2002 43
Regional Board staff used a different method to estimate stormwater metal loads for the municipalities of
Redding, Lake Shasta City, and Anderson because no concentration or runoff information was available
for calculating loads using the above equation. Staff instead had to estimate stormwater runoff and metal
loads using the following equations:
Qe = Rf x A x RC
Where: Qe = Estimated volumetric runoff rate
Rf = Daily rainfall amount typically associated with intense (but not worst-case) storms in the watershed.
A = Municipal area
RC = Runoff coefficient
me = CSac x Qe
Where: me-x = Estimated mass of constituent, X, per unit time
CSac-x = Maximum dissolved concentration of constituent, X, in mass per volume (as measured by the Sacramento Stormwater Program for the Sacramento region)
Qe = Estimated volumetric runoff rate
Appendix D provides a more detailed description of the stormwater load calculations and includes the
staff’s assumptions inherent in the calculations.
5.5 Evaluation of Source Loads
As noted earlier, dissolved metal concentration data were not available for the majority of metal sources
identified in the upper Sacramento River. Regional Board staff had dissolved metal concentration and
flow data for the following sources:
• Shasta Dam reservoir;
• IMM site via SCDD;
• Whiskeytown Lake releases via Spring Creek Tunnel/Power Plant (SCPP);
• City of Redding Stillwater and Clear Creek Wastewater Treatment Plants;
• Afterthought Mine; and
• Cottonwood Creek.
In addition, staff estimated load values for City of Redding, Lake Shasta City, and Anderson stormwater
discharges. The following text describes the source load values that Regional Board staff calculated and
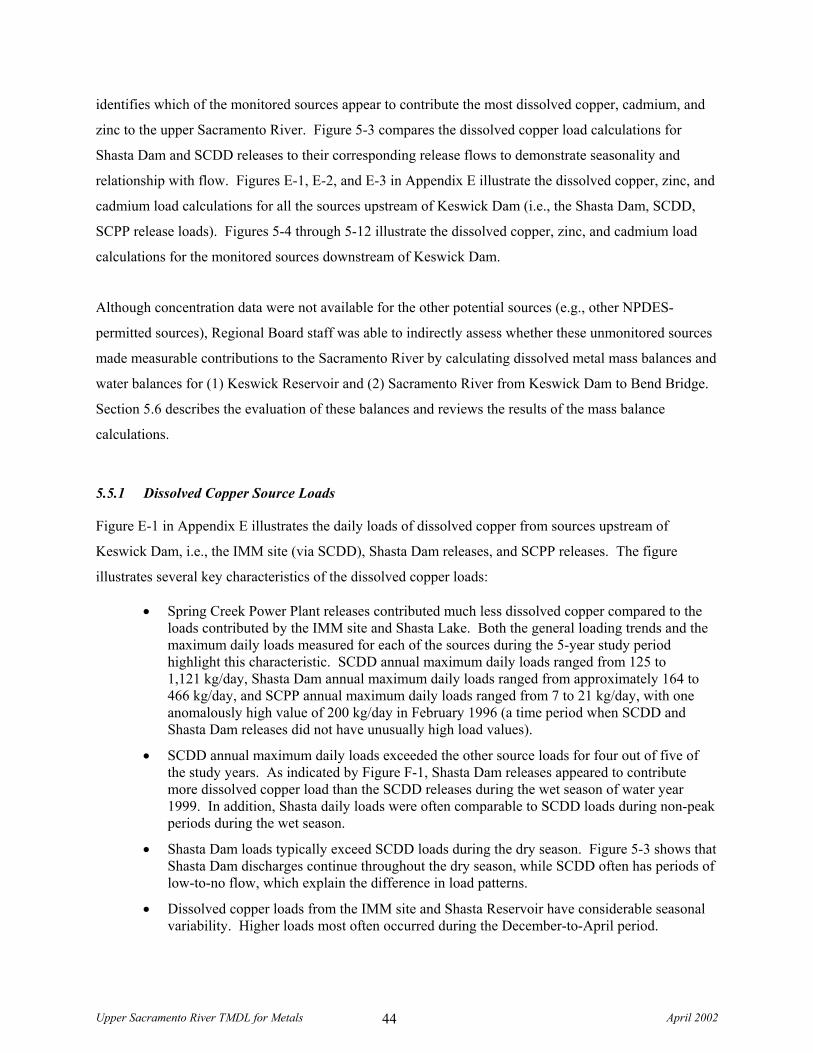
Upper Sacramento River TMDL for Metals April 2002 44
identifies which of the monitored sources appear to contribute the most dissolved copper, cadmium, and
zinc to the upper Sacramento River. Figure 5-3 compares the dissolved copper load calculations for
Shasta Dam and SCDD releases to their corresponding release flows to demonstrate seasonality and
relationship with flow. Figures E-1, E-2, and E-3 in Appendix E illustrate the dissolved copper, zinc, and
cadmium load calculations for all the sources upstream of Keswick Dam (i.e., the Shasta Dam, SCDD,
SCPP release loads). Figures 5-4 through 5-12 illustrate the dissolved copper, zinc, and cadmium load
calculations for the monitored sources downstream of Keswick Dam.
Although concentration data were not available for the other potential sources (e.g., other NPDES-
permitted sources), Regional Board staff was able to indirectly assess whether these unmonitored sources
made measurable contributions to the Sacramento River by calculating dissolved metal mass balances and
water balances for (1) Keswick Reservoir and (2) Sacramento River from Keswick Dam to Bend Bridge.
Section 5.6 describes the evaluation of these balances and reviews the results of the mass balance
calculations.
5.5.1 Dissolved Copper Source Loads
Figure E-1 in Appendix E illustrates the daily loads of dissolved copper from sources upstream of
Keswick Dam, i.e., the IMM site (via SCDD), Shasta Dam releases, and SCPP releases. The figure
illustrates several key characteristics of the dissolved copper loads:
• Spring Creek Power Plant releases contributed much less dissolved copper compared to the loads contributed by the IMM site and Shasta Lake. Both the general loading trends and the maximum daily loads measured for each of the sources during the 5-year study period highlight this characteristic. SCDD annual maximum daily loads ranged from 125 to 1,121 kg/day, Shasta Dam annual maximum daily loads ranged from approximately 164 to 466 kg/day, and SCPP annual maximum daily loads ranged from 7 to 21 kg/day, with one anomalously high value of 200 kg/day in February 1996 (a time period when SCDD and Shasta Dam releases did not have unusually high load values).
• SCDD annual maximum daily loads exceeded the other source loads for four out of five of the study years. As indicated by Figure F-1, Shasta Dam releases appeared to contribute more dissolved copper load than the SCDD releases during the wet season of water year 1999. In addition, Shasta daily loads were often comparable to SCDD loads during non-peak periods during the wet season.
• Shasta Dam loads typically exceed SCDD loads during the dry season. Figure 5-3 shows that Shasta Dam discharges continue throughout the dry season, while SCDD often has periods of low-to-no flow, which explain the difference in load patterns.
• Dissolved copper loads from the IMM site and Shasta Reservoir have considerable seasonal variability. Higher loads most often occurred during the December-to-April period.
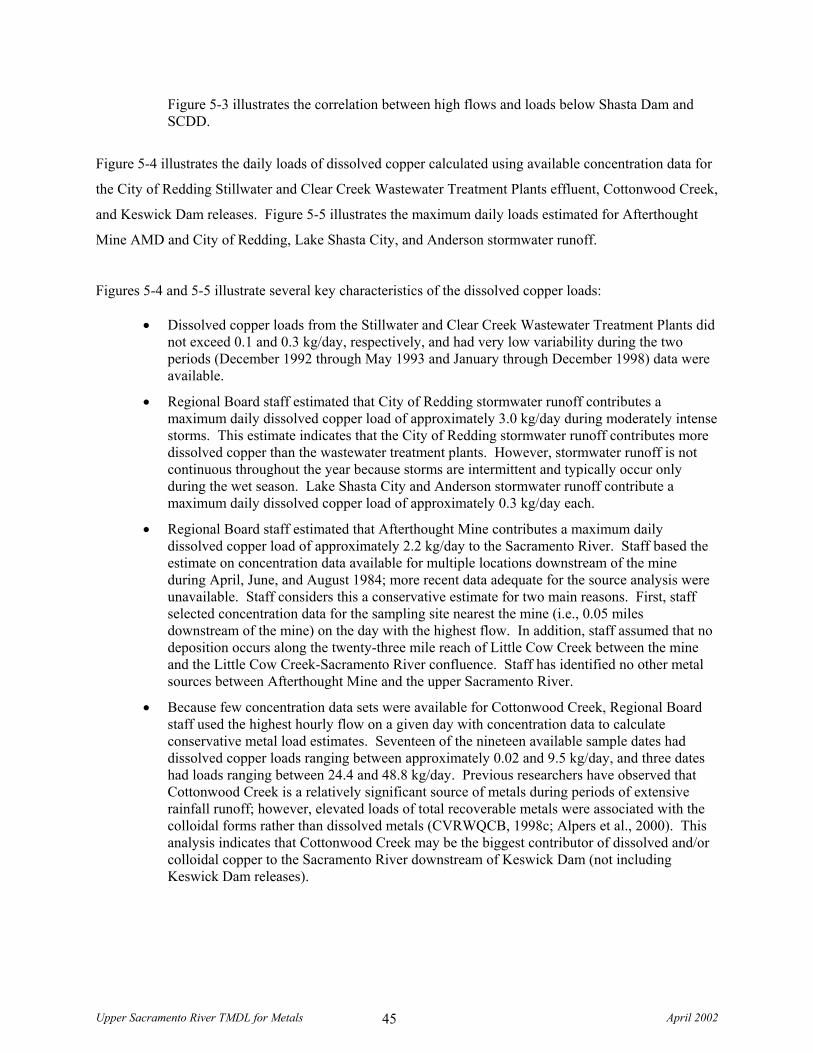
Upper Sacramento River TMDL for Metals April 2002 45
Figure 5-3 illustrates the correlation between high flows and loads below Shasta Dam and SCDD.
Figure 5-4 illustrates the daily loads of dissolved copper calculated using available concentration data for
the City of Redding Stillwater and Clear Creek Wastewater Treatment Plants effluent, Cottonwood Creek,
and Keswick Dam releases. Figure 5-5 illustrates the maximum daily loads estimated for Afterthought
Mine AMD and City of Redding, Lake Shasta City, and Anderson stormwater runoff.
Figures 5-4 and 5-5 illustrate several key characteristics of the dissolved copper loads:
• Dissolved copper loads from the Stillwater and Clear Creek Wastewater Treatment Plants did not exceed 0.1 and 0.3 kg/day, respectively, and had very low variability during the two periods (December 1992 through May 1993 and January through December 1998) data were available.
• Regional Board staff estimated that City of Redding stormwater runoff contributes a maximum daily dissolved copper load of approximately 3.0 kg/day during moderately intense storms. This estimate indicates that the City of Redding stormwater runoff contributes more dissolved copper than the wastewater treatment plants. However, stormwater runoff is not continuous throughout the year because storms are intermittent and typically occur only during the wet season. Lake Shasta City and Anderson stormwater runoff contribute a maximum daily dissolved copper load of approximately 0.3 kg/day each.
• Regional Board staff estimated that Afterthought Mine contributes a maximum daily dissolved copper load of approximately 2.2 kg/day to the Sacramento River. Staff based the estimate on concentration data available for multiple locations downstream of the mine during April, June, and August 1984; more recent data adequate for the source analysis were unavailable. Staff considers this a conservative estimate for two main reasons. First, staff selected concentration data for the sampling site nearest the mine (i.e., 0.05 miles downstream of the mine) on the day with the highest flow. In addition, staff assumed that no deposition occurs along the twenty-three mile reach of Little Cow Creek between the mine and the Little Cow Creek-Sacramento River confluence. Staff has identified no other metal sources between Afterthought Mine and the upper Sacramento River.
• Because few concentration data sets were available for Cottonwood Creek, Regional Board staff used the highest hourly flow on a given day with concentration data to calculate conservative metal load estimates. Seventeen of the nineteen available sample dates had dissolved copper loads ranging between approximately 0.02 and 9.5 kg/day, and three dates had loads ranging between 24.4 and 48.8 kg/day. Previous researchers have observed that Cottonwood Creek is a relatively significant source of metals during periods of extensive rainfall runoff; however, elevated loads of total recoverable metals were associated with the colloidal forms rather than dissolved metals (CVRWQCB, 1998c; Alpers et al., 2000). This analysis indicates that Cottonwood Creek may be the biggest contributor of dissolved and/or colloidal copper to the Sacramento River downstream of Keswick Dam (not including Keswick Dam releases).
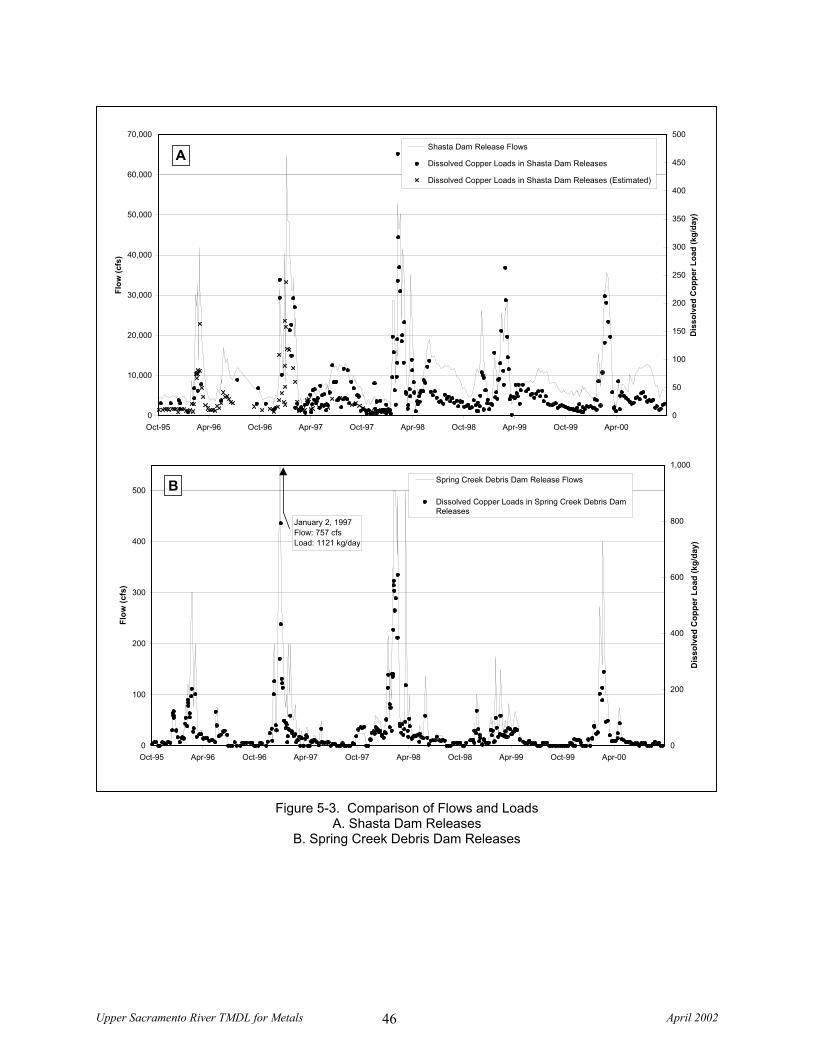
Upper Sacramento River TMDL for Metals April 2002 46
Figure 5-3. Comparison of Flows and Loads A. Shasta Dam Releases
B. Spring Creek Debris Dam Releases
0
10,000
20,000
30,000
40,000
50,000
60,000
70,000
Oct-95 Apr-96 Oct-96 Apr-97 Oct-97 Apr-98 Oct-98 Apr-99 Oct-99 Apr-00
Flow
(cfs
)
0
50
100
150
200
250
300
350
400
450
500
Dis
solv
ed C
oppe
r Loa
d (k
g/da
y)
Shasta Dam Release Flows
Dissolved Copper Loads in Shasta Dam Releases
Dissolved Copper Loads in Shasta Dam Releases (Estimated)
A
January 2, 1997Flow: 757 cfsLoad: 1121 kg/day
0
100
200
300
400
500
Oct-95 Apr-96 Oct-96 Apr-97 Oct-97 Apr-98 Oct-98 Apr-99 Oct-99 Apr-00
Flow
(cfs
)
0
200
400
600
800
1,000
Dis
solv
ed C
oppe
r Loa
d (k
g/da
y)
Spring Creek Debris Dam Release Flows
Dissolved Copper Loads in Spring Creek Debris DamReleases
B

Upper Sacramento River TMDL for Metals April 2002 47
Figure 5-4. Dissolved Copper Loads for Sources Downstream of Keswick Dam A. Clear Creek and Stillwater Wastewater Treatment Plants, B. Cottonwood Creek,
& C. Keswick Dam Releases.
0.0
0.1
0.2
0.3
Mar-92 Sep-92 Mar-93 Sep-93 Mar-94 Sep-94 Mar-95 Sep-95 Mar-96 Sep-96 Mar-97 Oct-97 Apr-98 Oct-98 Apr-99
Load
(kg/
day)
0.0
0.1
0.2
0.3
Load
(kg/
l)
Clear Creak Wastewater Treatment Plant
Stillwater Wastewater Treatment PlantA
0
10,000
20,000
30,000
40,000
50,000
Oct-95 Apr-96 Nov-96 May-97 Dec-97 Jun-98 Jan-99 Aug-99 Feb-00 Sep-00
Flow
(cfs
)
0
5
10
15
20
25
30
35
40
45
50
Load
(kg/
day)
Cottonwood Creek Flow (cfs)
Cottonwood Creek Dissolved Copper Load
Cottonwood Creek Dissolved Copper Load(Estimated)
B
0
20,000
40,000
60,000
80,000
Oct-95 Apr-96 Oct-96 Apr-97 Oct-97 Apr-98 Oct-98 Apr-99 Oct-99 Apr-00
Flow
(cfs
)
0
200
400
600
800
1,000
1,200
Load
(kg/
day)
Keswick Dam Release Flow
Keswick Dam Release Dissolved Copper Load
Keswick Dam Release Dissolved Copper Load(Estimated)
C
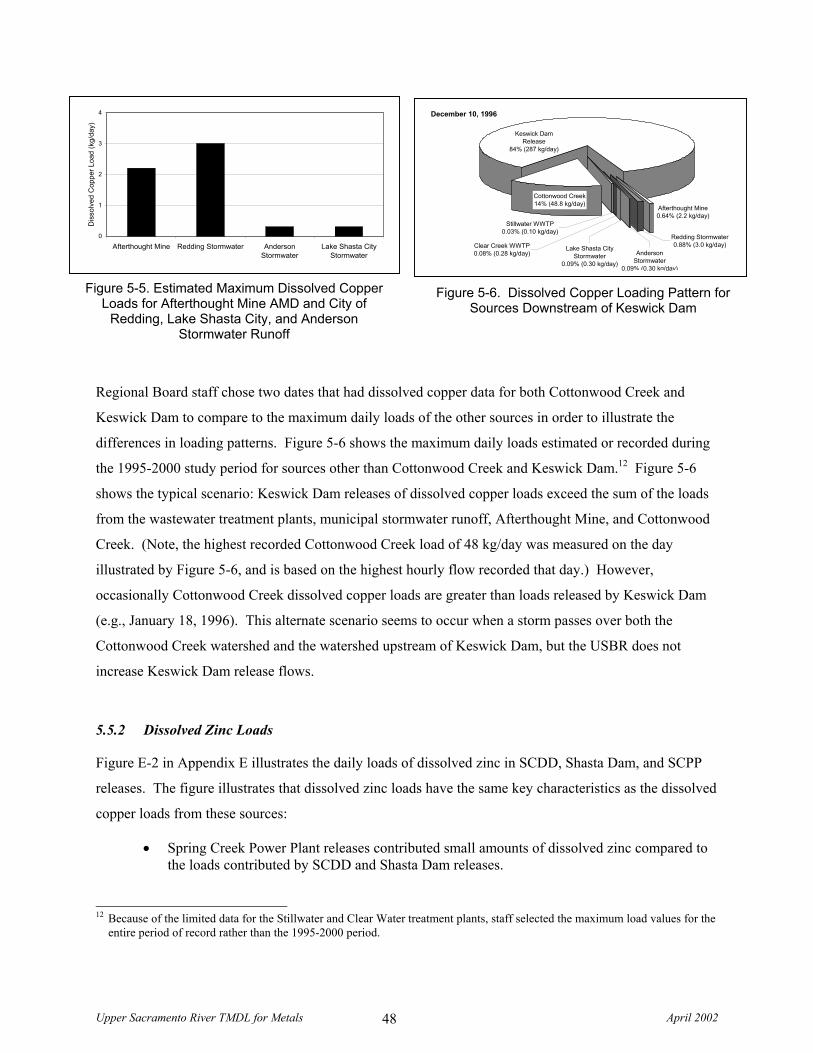
Upper Sacramento River TMDL for Metals April 2002 48
Regional Board staff chose two dates that had dissolved copper data for both Cottonwood Creek and
Keswick Dam to compare to the maximum daily loads of the other sources in order to illustrate the
differences in loading patterns. Figure 5-6 shows the maximum daily loads estimated or recorded during
the 1995-2000 study period for sources other than Cottonwood Creek and Keswick Dam.12 Figure 5-6
shows the typical scenario: Keswick Dam releases of dissolved copper loads exceed the sum of the loads
from the wastewater treatment plants, municipal stormwater runoff, Afterthought Mine, and Cottonwood
Creek. (Note, the highest recorded Cottonwood Creek load of 48 kg/day was measured on the day
illustrated by Figure 5-6, and is based on the highest hourly flow recorded that day.) However,
occasionally Cottonwood Creek dissolved copper loads are greater than loads released by Keswick Dam
(e.g., January 18, 1996). This alternate scenario seems to occur when a storm passes over both the
Cottonwood Creek watershed and the watershed upstream of Keswick Dam, but the USBR does not
increase Keswick Dam release flows.
5.5.2 Dissolved Zinc Loads
Figure E-2 in Appendix E illustrates the daily loads of dissolved zinc in SCDD, Shasta Dam, and SCPP
releases. The figure illustrates that dissolved zinc loads have the same key characteristics as the dissolved
copper loads from these sources:
• Spring Creek Power Plant releases contributed small amounts of dissolved zinc compared to the loads contributed by SCDD and Shasta Dam releases.
12 Because of the limited data for the Stillwater and Clear Water treatment plants, staff selected the maximum load values for the
entire period of record rather than the 1995-2000 period.
Figure 5-5. Estimated Maximum Dissolved Copper Loads for Afterthought Mine AMD and City of
Redding, Lake Shasta City, and Anderson Stormwater Runoff
0
1
2
3
4
Afterthought Mine Redding Stormwater AndersonStormwater
Lake Shasta CityStormwater
Dis
solv
ed C
oppe
r Loa
d (k
g/da
y)
Cottonwood Creek14% (48.8 kg/day)
Stillwater WWTP0.03% (0.10 kg/day)
Lake Shasta City Stormwater
0.09% (0.30 kg/day)
Clear Creek WWTP0.08% (0.28 kg/day)
Redding Stormwater0.88% (3.0 kg/day)
Afterthought Mine0.64% (2.2 kg/day)
Keswick Dam Release
84% (287 kg/day)
Anderson Stormwater
0.09% (0.30 kg/day)
December 10, 1996
Figure 5-6. Dissolved Copper Loading Pattern for Sources Downstream of Keswick Dam
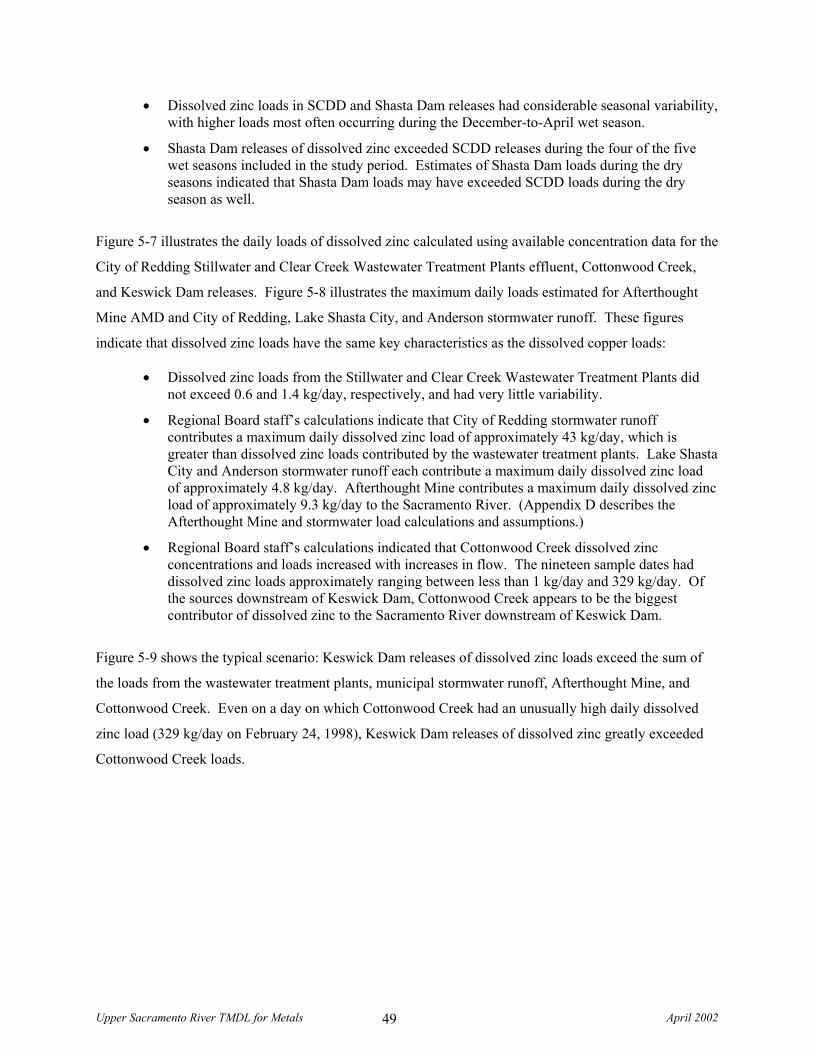
Upper Sacramento River TMDL for Metals April 2002 49
• Dissolved zinc loads in SCDD and Shasta Dam releases had considerable seasonal variability, with higher loads most often occurring during the December-to-April wet season.
• Shasta Dam releases of dissolved zinc exceeded SCDD releases during the four of the five wet seasons included in the study period. Estimates of Shasta Dam loads during the dry seasons indicated that Shasta Dam loads may have exceeded SCDD loads during the dry season as well.
Figure 5-7 illustrates the daily loads of dissolved zinc calculated using available concentration data for the
City of Redding Stillwater and Clear Creek Wastewater Treatment Plants effluent, Cottonwood Creek,
and Keswick Dam releases. Figure 5-8 illustrates the maximum daily loads estimated for Afterthought
Mine AMD and City of Redding, Lake Shasta City, and Anderson stormwater runoff. These figures
indicate that dissolved zinc loads have the same key characteristics as the dissolved copper loads:
• Dissolved zinc loads from the Stillwater and Clear Creek Wastewater Treatment Plants did not exceed 0.6 and 1.4 kg/day, respectively, and had very little variability.
• Regional Board staff’s calculations indicate that City of Redding stormwater runoff contributes a maximum daily dissolved zinc load of approximately 43 kg/day, which is greater than dissolved zinc loads contributed by the wastewater treatment plants. Lake Shasta City and Anderson stormwater runoff each contribute a maximum daily dissolved zinc load of approximately 4.8 kg/day. Afterthought Mine contributes a maximum daily dissolved zinc load of approximately 9.3 kg/day to the Sacramento River. (Appendix D describes the Afterthought Mine and stormwater load calculations and assumptions.)
• Regional Board staff’s calculations indicated that Cottonwood Creek dissolved zinc concentrations and loads increased with increases in flow. The nineteen sample dates had dissolved zinc loads approximately ranging between less than 1 kg/day and 329 kg/day. Of the sources downstream of Keswick Dam, Cottonwood Creek appears to be the biggest contributor of dissolved zinc to the Sacramento River downstream of Keswick Dam.
Figure 5-9 shows the typical scenario: Keswick Dam releases of dissolved zinc loads exceed the sum of
the loads from the wastewater treatment plants, municipal stormwater runoff, Afterthought Mine, and
Cottonwood Creek. Even on a day on which Cottonwood Creek had an unusually high daily dissolved
zinc load (329 kg/day on February 24, 1998), Keswick Dam releases of dissolved zinc greatly exceeded
Cottonwood Creek loads.
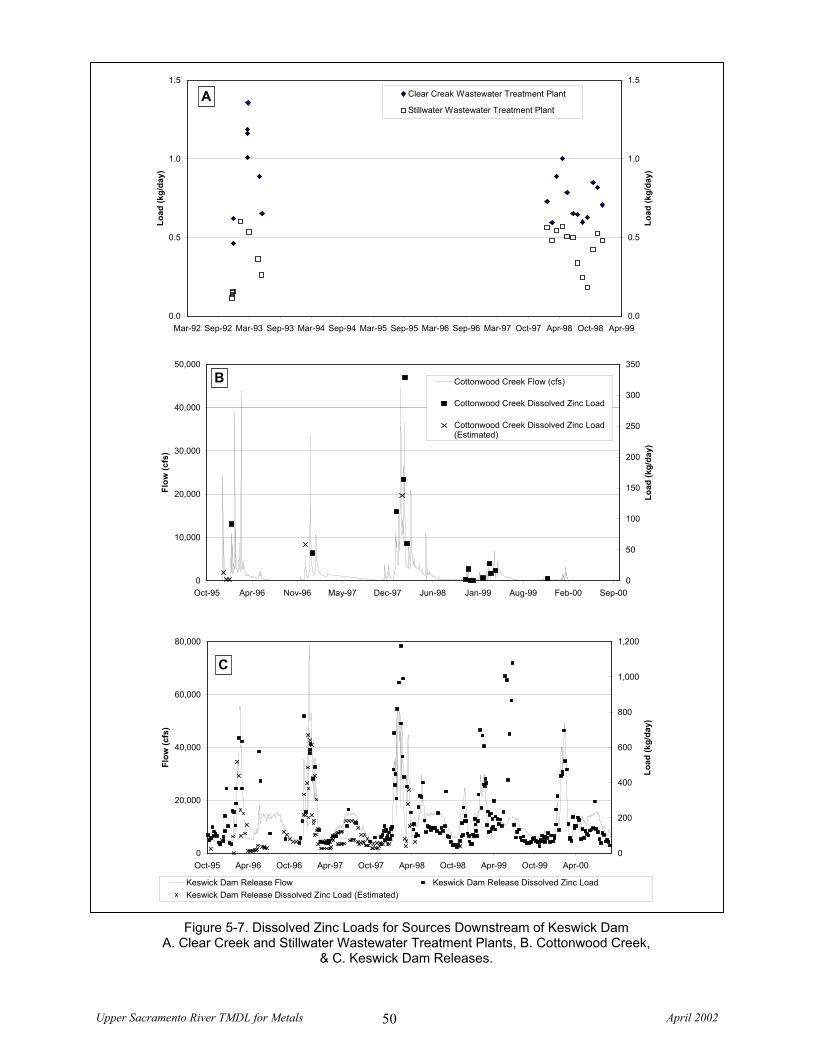
Upper Sacramento River TMDL for Metals April 2002 50
Figure 5-7. Dissolved Zinc Loads for Sources Downstream of Keswick Dam A. Clear Creek and Stillwater Wastewater Treatment Plants, B. Cottonwood Creek,
& C. Keswick Dam Releases.
0.0
0.5
1.0
1.5
Mar-92 Sep-92 Mar-93 Sep-93 Mar-94 Sep-94 Mar-95 Sep-95 Mar-96 Sep-96 Mar-97 Oct-97 Apr-98 Oct-98 Apr-99
Load
(kg/
day)
0.0
0.5
1.0
1.5
Load
(kg/
day)
Clear Creak Wastewater Treatment Plant
Stillwater Wastewater Treatment PlantA
0
10,000
20,000
30,000
40,000
50,000
Oct-95 Apr-96 Nov-96 May-97 Dec-97 Jun-98 Jan-99 Aug-99 Feb-00 Sep-00
Flow
(cfs
)
0
50
100
150
200
250
300
350
Load
(kg/
day)
Cottonwood Creek Flow (cfs)
Cottonwood Creek Dissolved Zinc Load
Cottonwood Creek Dissolved Zinc Load(Estimated)
B
0
20,000
40,000
60,000
80,000
Oct-95 Apr-96 Oct-96 Apr-97 Oct-97 Apr-98 Oct-98 Apr-99 Oct-99 Apr-00
Flow
(cfs
)
0
200
400
600
800
1,000
1,200Lo
ad (k
g/da
y)
Keswick Dam Release Flow Keswick Dam Release Dissolved Zinc LoadKeswick Dam Release Dissolved Zinc Load (Estimated)
C
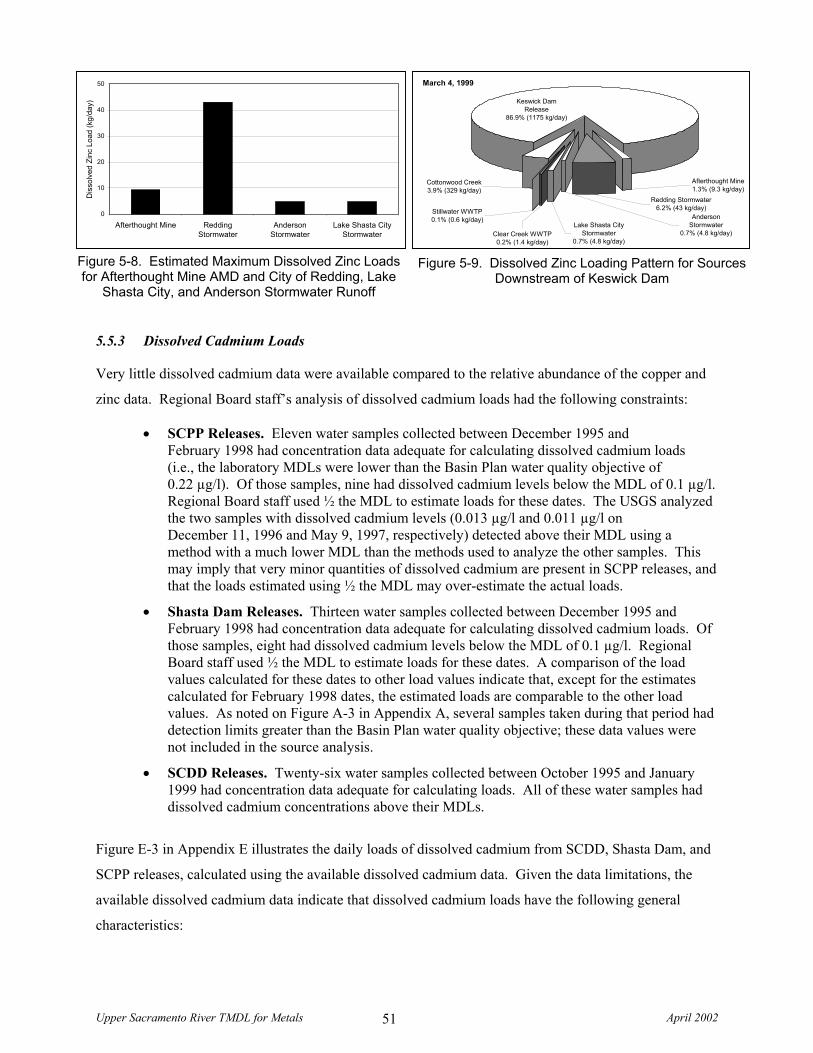
Upper Sacramento River TMDL for Metals April 2002 51
5.5.3 Dissolved Cadmium Loads
Very little dissolved cadmium data were available compared to the relative abundance of the copper and
zinc data. Regional Board staff’s analysis of dissolved cadmium loads had the following constraints:
• SCPP Releases. Eleven water samples collected between December 1995 and February 1998 had concentration data adequate for calculating dissolved cadmium loads (i.e., the laboratory MDLs were lower than the Basin Plan water quality objective of 0.22 µg/l). Of those samples, nine had dissolved cadmium levels below the MDL of 0.1 µg/l. Regional Board staff used ½ the MDL to estimate loads for these dates. The USGS analyzed the two samples with dissolved cadmium levels (0.013 µg/l and 0.011 µg/l on December 11, 1996 and May 9, 1997, respectively) detected above their MDL using a method with a much lower MDL than the methods used to analyze the other samples. This may imply that very minor quantities of dissolved cadmium are present in SCPP releases, and that the loads estimated using ½ the MDL may over-estimate the actual loads.
• Shasta Dam Releases. Thirteen water samples collected between December 1995 and February 1998 had concentration data adequate for calculating dissolved cadmium loads. Of those samples, eight had dissolved cadmium levels below the MDL of 0.1 µg/l. Regional Board staff used ½ the MDL to estimate loads for these dates. A comparison of the load values calculated for these dates to other load values indicate that, except for the estimates calculated for February 1998 dates, the estimated loads are comparable to the other load values. As noted on Figure A-3 in Appendix A, several samples taken during that period had detection limits greater than the Basin Plan water quality objective; these data values were not included in the source analysis.
• SCDD Releases. Twenty-six water samples collected between October 1995 and January 1999 had concentration data adequate for calculating loads. All of these water samples had dissolved cadmium concentrations above their MDLs.
Figure E-3 in Appendix E illustrates the daily loads of dissolved cadmium from SCDD, Shasta Dam, and
SCPP releases, calculated using the available dissolved cadmium data. Given the data limitations, the
available dissolved cadmium data indicate that dissolved cadmium loads have the following general
characteristics:
Figure 5-9. Dissolved Zinc Loading Pattern for Sources Downstream of Keswick Dam
Clear Creek WWTP0.2% (1.4 kg/day)
Stillwater WWTP0.1% (0.6 kg/day)
Lake Shasta City Stormwater
0.7% (4.8 kg/day)
Anderson Stormwater
0.7% (4.8 kg/day)
Redding Stormwater6.2% (43 kg/day)
Afterthought Mine1.3% (9.3 kg/day)
Keswick Dam Release
86.9% (1175 kg/day)
Cottonwood Creek3.9% (329 kg/day)
March 4, 1999
Figure 5-8. Estimated Maximum Dissolved Zinc Loads for Afterthought Mine AMD and City of Redding, Lake
Shasta City, and Anderson Stormwater Runoff
0
10
20
30
40
50
Afterthought Mine ReddingStormwater
AndersonStormwater
Lake Shasta CityStormwater
Dis
solv
ed Z
inc
Load
(kg/
day)
Upper Sacramento River TMDL for Metals April 2002 52
• SCPP releases contributed less dissolved cadmium than SCDD and Shasta Dam releases.
• SCDD peak load values were typically higher than Shasta Dam load values. However, Shasta Dam and SCDD releases appear to discharge comparable amounts of dissolved cadmium to Keswick Reservoir during non-peak times.
As with the sources upstream of Keswick Dam, a very small quantity of dissolved cadmium data was
available for downstream sources. Only three water samples from Cottonwood Creek were analyzed for
dissolved cadmium. CH2M Hill collected the water samples from Cottonwood Creek during the
1995-1996 water year. All three samples had cadmium levels below laboratory MDLs, which were well
below the Basin Plan water quality objective (0.22 µg/l). Regional Board staff used ½ the detection limit
to estimate loads for the three sample dates.
Figure 5-10 illustrates the daily loads of dissolved cadmium calculated using available concentration data
for the City of Redding Stillwater and Clear Creek Wastewater Treatment Plants effluent, and Keswick
Dam releases. Figure 5-11 illustrates the maximum daily loads estimated for Afterthought Mine AMD
and City of Redding, Lake Shasta City, and Anderson stormwater runoff, and Cottonwood Creek.
Figure 5-12 compares the downstream source loads to Keswick Dam release loads. The figures indicate
the following characteristics:
• Maximum daily dissolved cadmium loads calculated for the Stillwater and Clear Creek Wastewater Treatment Plants were approximately 0.025 and 0.009 kg/day, respectively. In January 1998, the City of Redding began using “clean” sampling techniques (Ames, 2001; Craig and Elliott, 1999), which, as illustrated on Figure 5-10A, appeared to cause a decrease in the variability and magnitude of dissolved cadmium loads. The maximum daily load measured during the more recent sampling efforts for both treatment plants was 0.002 kg/day.
• Regional Board staff’s calculations indicate that City of Redding stormwater runoff contributes a maximum daily dissolved cadmium load of approximately 0.097 kg/day, which is greater than dissolved cadmium loads contributed by the wastewater treatment plants. Lake Shasta City and Anderson stormwater runoff each contribute a maximum daily dissolved cadmium load of approximately 0.011 kg/day. Afterthought Mine contributes a maximum daily dissolved cadmium load of approximately 0.08 kg/day to the Sacramento River. (Appendix D describes the Afterthought Mine and stormwater load calculations and assumptions.)
• The maximum daily load estimated for Cottonwood Creek was 0.16 kg/day, indicating that it may be the biggest contributor of dissolved cadmium downstream of Keswick Dam. However, because Regional Board staff used ½ the detection limit to estimate dissolved cadmium loads, the estimates for dissolved cadmium loads in Cottonwood Creek may be skewed high by the creek’s high discharges. Regional Board staff estimated the following loads (with corresponding dates and flows) for Cottonwood Creek for the three days that had dissolved cadmium concentration data:
- 0.160 kg/day (12/14/1995, 1311 cfs);
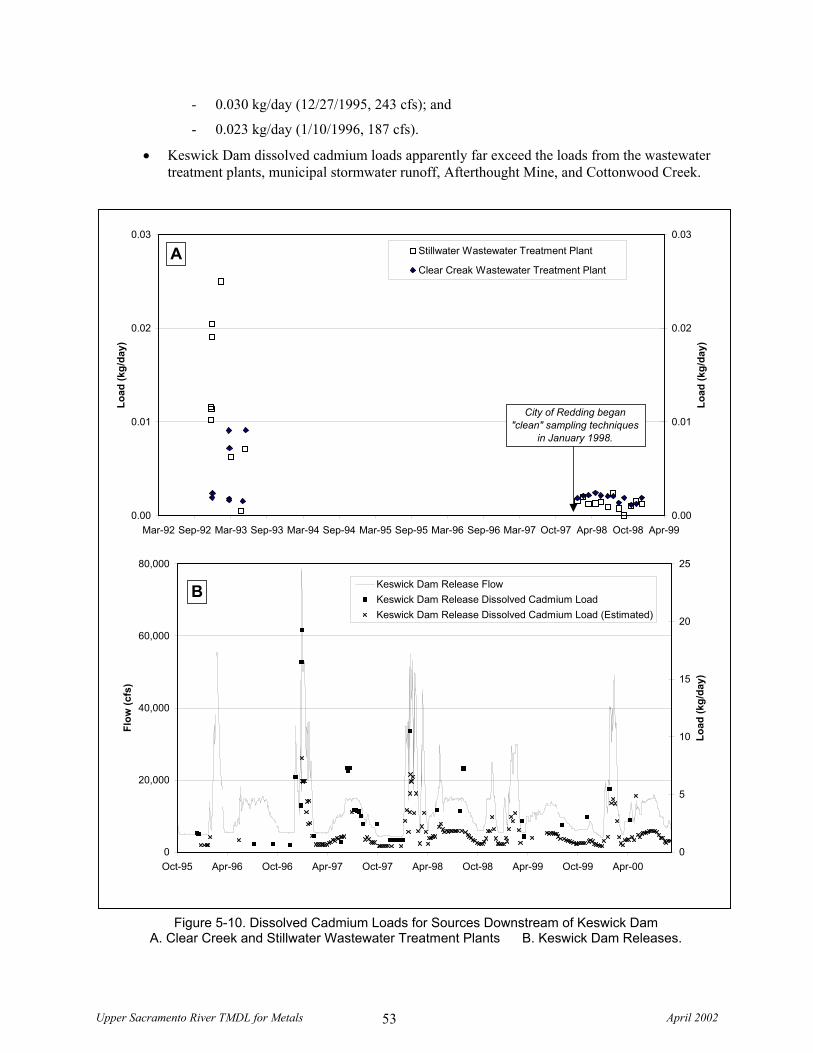
Upper Sacramento River TMDL for Metals April 2002 53
- 0.030 kg/day (12/27/1995, 243 cfs); and
- 0.023 kg/day (1/10/1996, 187 cfs).
• Keswick Dam dissolved cadmium loads apparently far exceed the loads from the wastewater treatment plants, municipal stormwater runoff, Afterthought Mine, and Cottonwood Creek.
Figure 5-10. Dissolved Cadmium Loads for Sources Downstream of Keswick Dam A. Clear Creek and Stillwater Wastewater Treatment Plants B. Keswick Dam Releases.
0.00
0.01
0.02
0.03
Mar-92 Sep-92 Mar-93 Sep-93 Mar-94 Sep-94 Mar-95 Sep-95 Mar-96 Sep-96 Mar-97 Oct-97 Apr-98 Oct-98 Apr-99
Load
(kg/
day)
0.00
0.01
0.02
0.03
Load
(kg/
day)
Stillwater Wastewater Treatment Plant
Clear Creak Wastewater Treatment PlantA
City of Redding began "clean" sampling techniques
in January 1998.
0
20,000
40,000
60,000
80,000
Oct-95 Apr-96 Oct-96 Apr-97 Oct-97 Apr-98 Oct-98 Apr-99 Oct-99 Apr-00
Flow
(cfs
)
0
5
10
15
20
25
Load
(kg/
day)
Keswick Dam Release FlowKeswick Dam Release Dissolved Cadmium LoadKeswick Dam Release Dissolved Cadmium Load (Estimated)
B
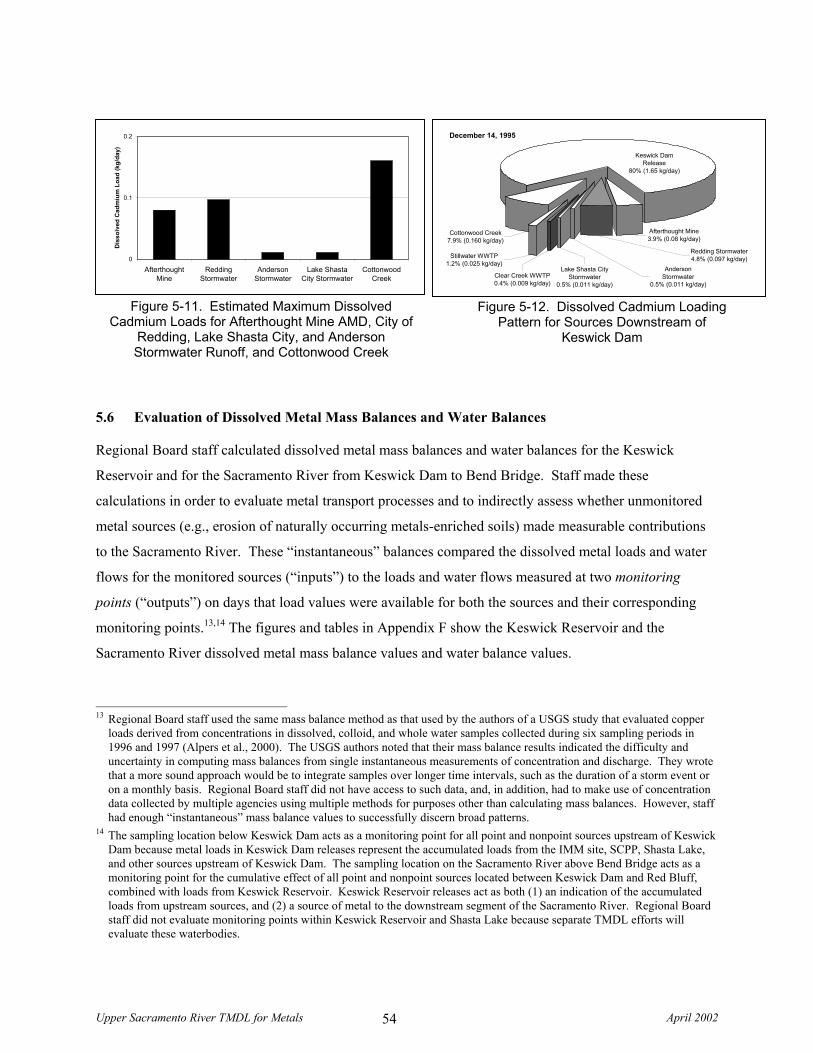
Upper Sacramento River TMDL for Metals April 2002 54
5.6 Evaluation of Dissolved Metal Mass Balances and Water Balances
Regional Board staff calculated dissolved metal mass balances and water balances for the Keswick
Reservoir and for the Sacramento River from Keswick Dam to Bend Bridge. Staff made these
calculations in order to evaluate metal transport processes and to indirectly assess whether unmonitored
metal sources (e.g., erosion of naturally occurring metals-enriched soils) made measurable contributions
to the Sacramento River. These “instantaneous” balances compared the dissolved metal loads and water
flows for the monitored sources (“inputs”) to the loads and water flows measured at two monitoring
points (“outputs”) on days that load values were available for both the sources and their corresponding
monitoring points.13,14 The figures and tables in Appendix F show the Keswick Reservoir and the
Sacramento River dissolved metal mass balance values and water balance values.
13 Regional Board staff used the same mass balance method as that used by the authors of a USGS study that evaluated copper
loads derived from concentrations in dissolved, colloid, and whole water samples collected during six sampling periods in 1996 and 1997 (Alpers et al., 2000). The USGS authors noted that their mass balance results indicated the difficulty and uncertainty in computing mass balances from single instantaneous measurements of concentration and discharge. They wrote that a more sound approach would be to integrate samples over longer time intervals, such as the duration of a storm event or on a monthly basis. Regional Board staff did not have access to such data, and, in addition, had to make use of concentration data collected by multiple agencies using multiple methods for purposes other than calculating mass balances. However, staff had enough “instantaneous” mass balance values to successfully discern broad patterns.
14 The sampling location below Keswick Dam acts as a monitoring point for all point and nonpoint sources upstream of Keswick Dam because metal loads in Keswick Dam releases represent the accumulated loads from the IMM site, SCPP, Shasta Lake, and other sources upstream of Keswick Dam. The sampling location on the Sacramento River above Bend Bridge acts as a monitoring point for the cumulative effect of all point and nonpoint sources located between Keswick Dam and Red Bluff, combined with loads from Keswick Reservoir. Keswick Reservoir releases act as both (1) an indication of the accumulated loads from upstream sources, and (2) a source of metal to the downstream segment of the Sacramento River. Regional Board staff did not evaluate monitoring points within Keswick Reservoir and Shasta Lake because separate TMDL efforts will evaluate these waterbodies.
Figure 5-12. Dissolved Cadmium Loading Pattern for Sources Downstream of
Keswick Dam
Cottonwood Creek7.9% (0.160 kg/day)
Keswick Dam Release
80% (1.65 kg/day)
Afterthought Mine3.9% (0.08 kg/day)
Redding Stormwater4.8% (0.097 kg/day)
Anderson Stormwater
0.5% (0.011 kg/day)
Lake Shasta City Stormwater
0.5% (0.011 kg/day)
Stillwater WWTP1.2% (0.025 kg/day)
Clear Creek WWTP0.4% (0.009 kg/day)
December 14, 1995
Figure 5-11. Estimated Maximum Dissolved Cadmium Loads for Afterthought Mine AMD, City of
Redding, Lake Shasta City, and Anderson Stormwater Runoff, and Cottonwood Creek
0
0.1
0.2
AfterthoughtMine
ReddingStormwater
AndersonStormwater
Lake ShastaCity Stormwater
CottonwoodCreek
Dis
solv
ed C
adm
ium
Loa
d (k
g/da
y)
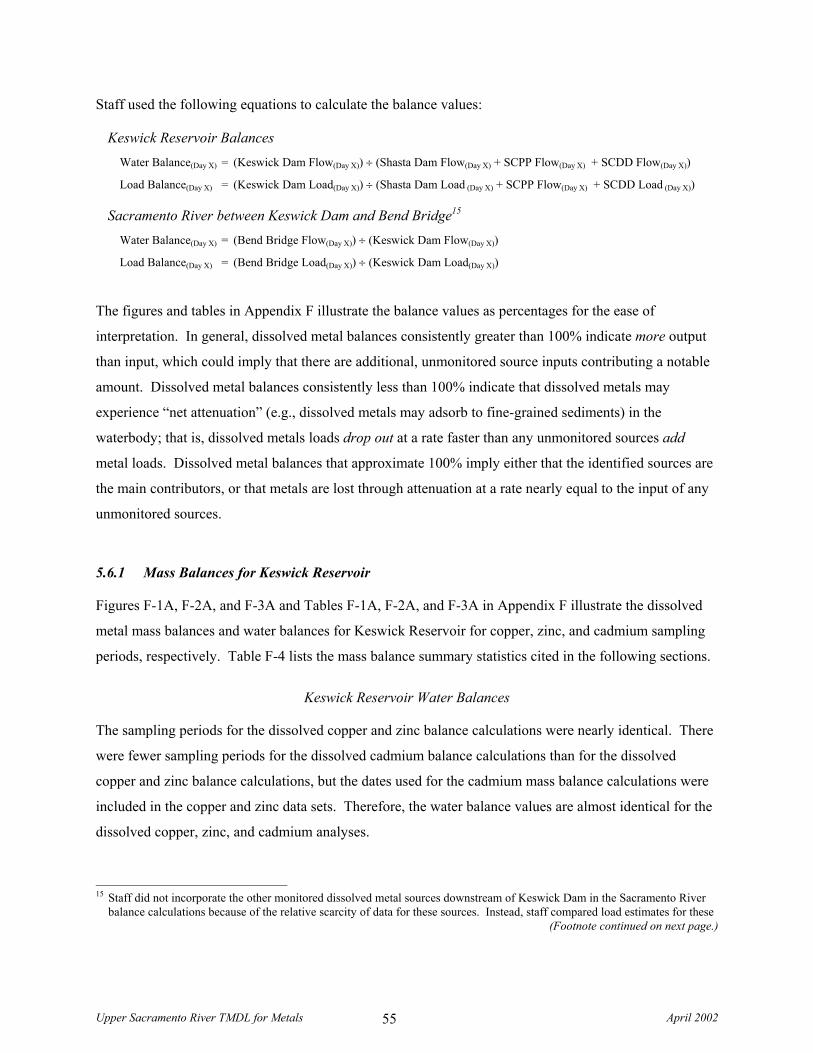
Upper Sacramento River TMDL for Metals April 2002 55
Staff used the following equations to calculate the balance values:
Keswick Reservoir Balances Water Balance(Day X) = (Keswick Dam Flow(Day X)) ÷ (Shasta Dam Flow(Day X) + SCPP Flow(Day X) + SCDD Flow(Day X))
Load Balance(Day X) = (Keswick Dam Load(Day X)) ÷ (Shasta Dam Load (Day X) + SCPP Flow(Day X) + SCDD Load (Day X))
Sacramento River between Keswick Dam and Bend Bridge15 Water Balance(Day X) = (Bend Bridge Flow(Day X)) ÷ (Keswick Dam Flow(Day X))
Load Balance(Day X) = (Bend Bridge Load(Day X)) ÷ (Keswick Dam Load(Day X))
The figures and tables in Appendix F illustrate the balance values as percentages for the ease of
interpretation. In general, dissolved metal balances consistently greater than 100% indicate more output
than input, which could imply that there are additional, unmonitored source inputs contributing a notable
amount. Dissolved metal balances consistently less than 100% indicate that dissolved metals may
experience “net attenuation” (e.g., dissolved metals may adsorb to fine-grained sediments) in the
waterbody; that is, dissolved metals loads drop out at a rate faster than any unmonitored sources add
metal loads. Dissolved metal balances that approximate 100% imply either that the identified sources are
the main contributors, or that metals are lost through attenuation at a rate nearly equal to the input of any
unmonitored sources.
5.6.1 Mass Balances for Keswick Reservoir
Figures F-1A, F-2A, and F-3A and Tables F-1A, F-2A, and F-3A in Appendix F illustrate the dissolved
metal mass balances and water balances for Keswick Reservoir for copper, zinc, and cadmium sampling
periods, respectively. Table F-4 lists the mass balance summary statistics cited in the following sections.
Keswick Reservoir Water Balances
The sampling periods for the dissolved copper and zinc balance calculations were nearly identical. There
were fewer sampling periods for the dissolved cadmium balance calculations than for the dissolved
copper and zinc balance calculations, but the dates used for the cadmium mass balance calculations were
included in the copper and zinc data sets. Therefore, the water balance values are almost identical for the
dissolved copper, zinc, and cadmium analyses.
15 Staff did not incorporate the other monitored dissolved metal sources downstream of Keswick Dam in the Sacramento River
balance calculations because of the relative scarcity of data for these sources. Instead, staff compared load estimates for these (Footnote continued on next page.)
Upper Sacramento River TMDL for Metals April 2002 56
The water balance values for the dissolved copper, zinc and cadmium sampling periods closely
approximated 100%. This indicates that the Shasta Dam, SCDD, and SCPP releases were the primary
source of water to Keswick Reservoir. That is, there were no additional water sources that consistently
added substantial quantities of water to the reservoir.
Keswick Reservoir Dissolved Metal Balances
The dissolved metal mass balances indicated that dissolved copper, zinc, and cadmium experience net
attenuation in Keswick Reservoir. That is, apparently dissolved metals loads typically drop out in the
reservoir at a rate faster than any unmonitored sources add metal loads to the reservoir.
The dissolved copper balances span a range of values both above and below 100%. However, 86 of the
99 sampling periods (87% of the sampling periods) had balance values less than 100%, indicating that net
attenuation typically occurs. A USGS study that evaluated copper loads derived from concentrations in
dissolved, colloid, and whole water samples collected during six sampling periods in 1996 and 1997 had
similar mass balance calculations for Keswick Reservoir (Alpers et al., 2000). The authors of the USGS
study hypothesized that increased sorption of copper during transport through Keswick Reservoir could
cause the apparent copper attenuation.
The dissolved zinc and cadmium mass balance values are similar to, but not exactly the same as, the
copper balance values, probably as a result of differing copper:zinc:cadmium ratios of source
contributions, different chemical properties, and the use of estimated load values in the balance
calculations.16 Seventy-one of the 100 dissolved zinc sampling periods (71% of the sampling periods)
had balance values less than 100%, which indicates an apparent net attenuation of dissolved zinc in the
reservoir, although not so attenuated as dissolved copper. The USGS study that evaluated 1996 and 1997
metal loads noted that dissolved zinc was less attenuated than dissolved copper in Keswick reservoir
(Alpers et al., 2000).
All seven of the dissolved cadmium sampling periods had balance values less than 100%. Six of the
seven sampling periods used for calculating the dissolved cadmium balances had corresponding dissolved
monitored source loads to the resulting differences between the loads calculated for the Keswick Dam and Bend Bridge sampling locations, as discussed later in the text.
16 A comparison of estimated dissolved zinc load values plotted on Figure f-2 in Appendix F to the other load values calculated for adjacent days indicates that the estimates are comparable, or even less than, the other values. This indicates that the estimates may underestimate the load values.
Upper Sacramento River TMDL for Metals April 2002 57
copper balance values less 100%, and four of the seven sampling periods had dissolved zinc balance
values less than 100%. This indicates that dissolved cadmium may attenuate more than dissolved copper
and zinc in Keswick Reservoir. The USGS study that evaluated 1996 and 1997 metal loads indicated that
three of the five dissolved cadmium sampling periods for the USGS study (which were different from the
sampling periods used in this source analysis) had dissolved cadmium balance values less than 100%
(Alpers et al., 2000).
Approximately 13% and 29% of the sampling periods had dissolved copper and zinc balance values,
respectively, greater than 100%. This could indicate that during these sampling periods, unmonitored
sources of copper and zinc may be making contributions to Keswick Reservoir that are greater than the
amount that typically drops out. The USGS study considered the remobilization of accumulated
precipitates in the SCAKR to be the most likely source of additional dissolved copper
(Alpers et al., 2000). Regional Board staff reviewed the small amount of published load data for Flat
Creek, which receives water from upper Spring Creek via a diversion and discharges to Keswick
Reservoir upstream of the SCAKR. Flat Creek apparently contributes amounts too small (e.g., in the
range of 0.0016 to 0.081 kg/day of dissolved copper (Alpers et al., 2000)) to explain the balance values
greater than 100%.
5.6.2 Mass Balances for the Sacramento River (Keswick Dam to Bend Bridge)
Figures F-1B, F-2B, and F-3B and Tables F-1B, F-2B, and F-3B in Appendix F illustrate the dissolved
metal mass balances and water balances for the Sacramento River between Keswick Dam and Bend
Bridge for copper, zinc, and cadmium sampling periods, respectively. Table F-4 lists the mass balance
summary statistics cited in the following sections.
Sacramento River Water Balances
The water balance values for the 26 sampling periods for dissolved copper and zinc, and the 12 sampling
periods for dissolved cadmium, all exceeded 100%. This indicates that there are additional water sources
that consistently add to water released from Keswick Reservoir.
Sacramento River Dissolved Metal Balances
The dissolved metal mass balances indicate that dissolved zinc and cadmium loads typically experience
net attenuation, while dissolved copper loads typically experience a net increase, in the Sacramento River
between Keswick Dam and Bend Bridge. That is, apparently dissolved zinc and cadmium loads drop out
Upper Sacramento River TMDL for Metals April 2002 58
(e.g., by adsorption to fine-grained sediments) at a rate faster than the downstream monitored and
unmonitored sources add dissolved zinc and cadmium. In contrast, downstream monitored and
unmonitored sources typically add dissolved copper at a rate faster than dissolved copper loads drop out.
Monitored sources may account for the majority of the net increase in dissolved copper loads in the
Sacramento River downstream of Keswick Dam.
The dissolved copper balances span a range of values both above and below 100%. However, 18 of the
26 sampling periods (69%) had balances that exceeded 100%, which indicates an apparent net increase in
dissolved copper loads in the Sacramento River between Keswick Dam and Bend Bridge.17 A review of
Table F-4 indicates that the differences between Keswick Dam loads and Bend Bridge loads were less
than 42 kg/day for 16 of the 18 sampling periods with a mass balance greater than 100%. As noted
earlier, the sum of the estimated maximum daily dissolved copper loads for the monitored sources may be
as high as 50.1 kg/day, indicating that the monitored sources may account for the majority of the net
increase in dissolved copper loads in the Sacramento River downstream of Keswick Dam. Approximately
31% of the sampling periods had dissolved copper balances less than 100%, which indicates that a net
attenuation of dissolved copper occurs during some periods, even though the corresponding water
balances for these periods were greater than 100%.
The dissolved zinc balances span a range of values both above and below 100%. However, in contrast to
the dissolved copper balance values, 20 of the 26 sampling periods (77%) had balances less than 100%,
which indicates an apparent net attenuation in dissolved zinc loads in the Sacramento River between
Keswick Dam and Bend Bridge. The USGS study that evaluated metal loads during six sampling periods
in 1996 and 1997 also observed a net attenuation in dissolved zinc loads between Keswick Dam and Bend
Bridge (Alpers et al., 2000).
Eleven of the 12 dissolved cadmium sampling periods (92%) had balance values less than 100%, which
indicates an apparent net attenuation in dissolved cadmium loads in the Sacramento River between
Keswick Dam and Bend Bridge. In comparison, 9 of those same 12 sampling periods had dissolved zinc
balances less than 100%, while only two of those 12 periods had dissolved copper balance values less
100%. This indicates that dissolved cadmium loads may attenuate more than zinc, and that both dissolved
17 The USGS study that evaluated metal loads during six sampling periods in 1996 and 1997 determined that dissolved copper
loads measured for Keswick Dam releases were sometimes slightly greater than, and other times slightly less than, loads at Bend Bridge; in comparison, the USGS study determined that total copper loads typically increased between Keswick Dam and Bend Bridge (Alpers et al., 2000).
Upper Sacramento River TMDL for Metals April 2002 59
cadmium and zinc loads attenuate more than dissolved copper loads in the Sacramento River between
Keswick Dam and Bend Bridge. The USGS study that evaluated metal loads during six sampling periods
in 1996 and 1997 also observed a net attenuation in dissolved cadmium loads between Keswick Dam and
Bend Bridge (Alpers et al., 2000).
Upper Sacramento River TMDL for Metals April 2002 60
6 NUMERIC TARGETS
6.1 Definition of a Numeric Target
Numeric targets are the specific instream goals for the TMDL that will enable the full protection of the
upper Sacramento River’s beneficial uses. The development of numeric targets involves the following
elements:
• Identification of the target media and the basis for using the selected target media to interpret or apply applicable water quality standards.
• Identification of target levels for the selected target media and the technical basis for the target levels.
• Comparison of historical or existing conditions and desired future conditions for the target media selected for the TMDL.
6.2 Identification of the Target Media
The target media should address as directly as possible whether remediation actions are enabling the
attainment of beneficial uses. Figure II-1 and Table II-1 of the Basin Plan identify the designated existing
and potential beneficial uses of surface waters in the Sacramento and San Joaquin Basins (CVRWQCB,
1998a). The upper Sacramento River provides water for fisheries, wildlife habitat, domestic, municipal,
and agricultural uses within its watershed. Table 6-1 lists additional beneficial uses identified in the
Basin Plan. The beneficial uses most impacted by copper, cadmium, and zinc in the upper Sacramento
River (Shasta Dam to Red Bluff) are warm and cold freshwater habitat.18
Other characteristics to be considered for the target media include:
• whether variability in the target media can be modeled and causes of variability are understood; and
• whether measurements of the target media would reflect mass load reductions in a timely manner.
18 As noted earlier, Spring Creek enters the Sacramento River system in the Spring Creek arm of Keswick Reservoir,
approximately two miles upstream of Keswick Dam. The City of Redding is approximately four miles downstream of Keswick Dam. Although the City of Redding obtains its drinking water from the Sacramento River, the metals from Iron Mountain and from sources in the Shasta Lake region do not pose a significant threat to this water supply because of dilution effects and the effectiveness of the City’s water-treatment plant (Jorgenson, 2000). In the event of an uncontrolled release of metal-rich drainage from the IMM site, the City of Redding has a contingency plan to switch to alternate groundwater sources.
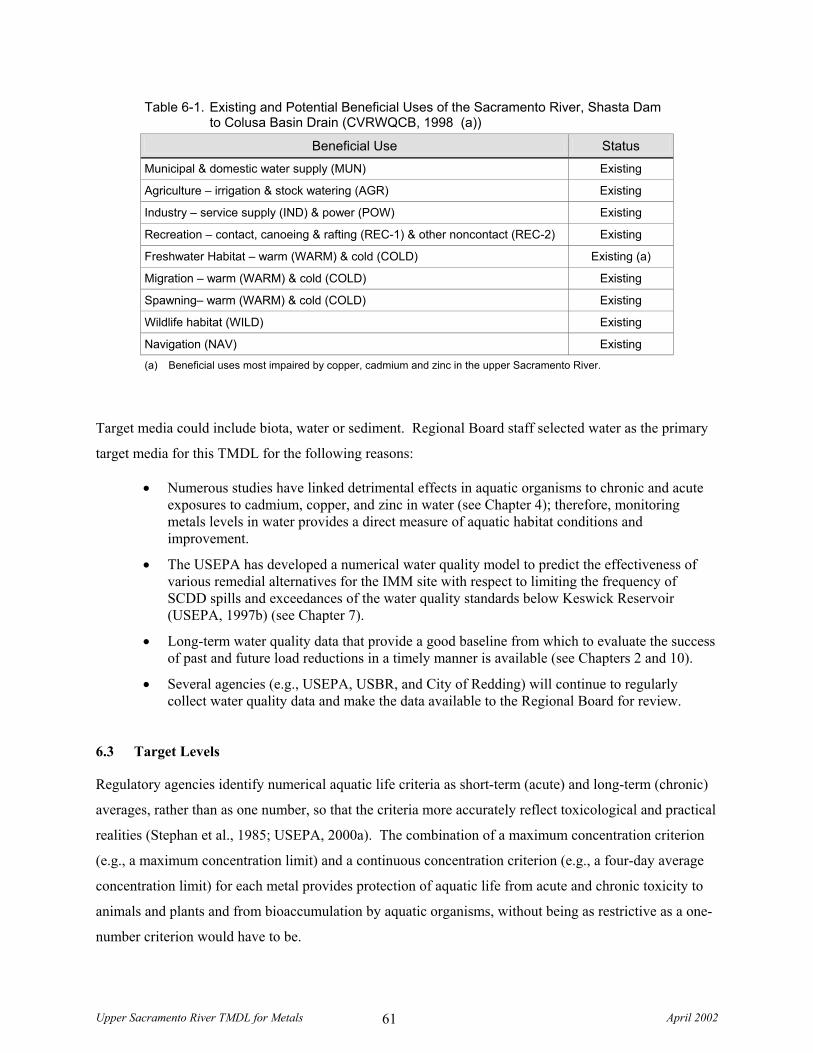
Upper Sacramento River TMDL for Metals April 2002 61
Table 6-1. Existing and Potential Beneficial Uses of the Sacramento River, Shasta Dam to Colusa Basin Drain (CVRWQCB, 1998 (a))
Beneficial Use Status Municipal & domestic water supply (MUN) Existing
Agriculture – irrigation & stock watering (AGR) Existing
Industry – service supply (IND) & power (POW) Existing
Recreation – contact, canoeing & rafting (REC-1) & other noncontact (REC-2) Existing
Freshwater Habitat – warm (WARM) & cold (COLD) Existing (a)
Migration – warm (WARM) & cold (COLD) Existing
Spawning– warm (WARM) & cold (COLD) Existing
Wildlife habitat (WILD) Existing
Navigation (NAV) Existing
(a) Beneficial uses most impaired by copper, cadmium and zinc in the upper Sacramento River.
Target media could include biota, water or sediment. Regional Board staff selected water as the primary
target media for this TMDL for the following reasons:
• Numerous studies have linked detrimental effects in aquatic organisms to chronic and acute exposures to cadmium, copper, and zinc in water (see Chapter 4); therefore, monitoring metals levels in water provides a direct measure of aquatic habitat conditions and improvement.
• The USEPA has developed a numerical water quality model to predict the effectiveness of various remedial alternatives for the IMM site with respect to limiting the frequency of SCDD spills and exceedances of the water quality standards below Keswick Reservoir (USEPA, 1997b) (see Chapter 7).
• Long-term water quality data that provide a good baseline from which to evaluate the success of past and future load reductions in a timely manner is available (see Chapters 2 and 10).
• Several agencies (e.g., USEPA, USBR, and City of Redding) will continue to regularly collect water quality data and make the data available to the Regional Board for review.
6.3 Target Levels
Regulatory agencies identify numerical aquatic life criteria as short-term (acute) and long-term (chronic)
averages, rather than as one number, so that the criteria more accurately reflect toxicological and practical
realities (Stephan et al., 1985; USEPA, 2000a). The combination of a maximum concentration criterion
(e.g., a maximum concentration limit) and a continuous concentration criterion (e.g., a four-day average
concentration limit) for each metal provides protection of aquatic life from acute and chronic toxicity to
animals and plants and from bioaccumulation by aquatic organisms, without being as restrictive as a one-
number criterion would have to be.
Upper Sacramento River TMDL for Metals April 2002 62
The USEPA document, Guidance for Developing TMDLs in California, noted that it is appropriate to set
TMDL numeric targets equal to existing numeric water quality standards (Smith, 2000). Federal and
State agencies have developed narrative and numeric criteria for metals in water for both human health
and wildlife protection. As noted in Chapter 2, two sets of water quality standards developed for the
protection of aquatic life are relevant for this TMDL. The Regional Board’s Basin Plan water quality
objectives for dissolved cadmium, copper, and zinc provide maximum concentration criteria (acute
criteria) for the Sacramento River above Highway 32 Bridge at Hamilton City. The USEPA’s CTR
provides continuous concentration criteria (chronic criteria) for all waterbodies in California including
the upper Sacramento River.
Because aquatic organisms such as fish are much more sensitive than humans to trace metals such as
copper, zinc, and cadmium, the water-quality criteria for aquatic life protection that are enforced by the
Regional Board and the USEPA are much more stringent than criteria established for human health
protection. Dissolved metal concentrations in the upper Sacramento River are less than the
California/USEPA drinking water standards established for the protection of human health (MCLs). The
following sections provide a more detailed review of the Regional Board’s Basin Plan objectives and the
USEPA’s CTR criteria.
6.3.1 Basin Plan Water Quality Objectives
In 1985, the State Board, with approval from the USEPA, adopted site-specific maximum concentration
(acute) criteria for cadmium, copper and zinc in the Sacramento River (and tributaries) upstream of
Hamilton City (CVRWQCB, 1998a; USEPA, 2000a). The water quality objectives cited in the Basin
Plan are 0.22 µg/l, 5.6 µg/l and 16 µg/l, for cadmium, copper, and zinc, respectively, all in the dissolved
form using a hardness of 40 milligrams per liter (mg/l) as calcium carbonate (CaCO3). The allowable
metal concentrations change in relation to the hardness, or alkalinity, of the water. If deviations in
hardness occur, the objectives are determined using the following formulas:
Copper objective (µg/l) = e (0.905)(ln hardness [mg/l]) -1.612
Zinc objective (µg/l) = e (0.830)(ln hardness [mg/l]) -0.289
Cadmium objective (µg/l) = e (1.160)(ln hardness [mg/l]) -5.777
Where: ln = natural logarithm e = exponent
Upper Sacramento River TMDL for Metals April 2002 63
Components of alkalinity, such as carbonate and bicarbonate, will combine with some toxic heavy metals
and reduce their toxicity. Therefore, in general: the harder the water, the higher the allowable
concentration of metals.
The Basin Plan water quality objectives are based on continual-flow toxicity tests conducted on juvenile19
chinook salmon in a laboratory setting by the CDFG (Finlayson and Wilson, 1989). CDFG determined
median lethal concentrations during 4 days (96-hour LC50 values20) and recommended “safe”
concentrations of metals as one tenth of the 96-hour LC50 values (Finlayson and Verrue, 1982). Onsite
toxicity tests that exposed juvenile chinook salmon and steelhead trout to Spring Creek acid-mine waste
for 96 hours and 240 hours resulted in 96-hour LC50 values similar to those from the laboratory tests that
used metal sulfate mixtures with similar ratios, indicating that the effects of Spring Creek AMD on
salmonids are reproducible and comparable to the laboratory results and confirming that these metals are
the major toxic components of the waste (Finlayson and Wilson, 1989). Copper toxicity studies
conducted for the California Office of the Attorney General observed comparable copper toxicity values
for swim-up steelhead trout and chinook salmon fry in surface waters in the vicinity of IMM (Hagler and
Bailley Consulting, 1996 & 1998). The 1989 CDFG study also determined that there were no significant
differences between the mean 96-hour and mean 240-hour LC50 values for either the salmon or trout,
indicating that acutely lethal effects of waste occur within 96 hours. In addition, the study determined
that there were no significant differences between the mean LC50 values for salmon and steelhead trout.
CDFG’s tests indicated antagonistic toxicity for the three-metal mixtures; therefore, results for the metals
tested individually were used as the basis for the Basin Plan water quality objectives. USEPA equations
for average allowable dissolved metal concentrations were adjusted to equal one tenth of the 96-hour LC50
values for juvenile chinook salmon at a hardness of 20 mg/l CaCO3, and then adjusted upward for the
40 mg/l CaCO3 hardness of the Sacramento River below Keswick Dam (Finlayson and Wilson, 1989).
In recognition of the need for site-specific protective criteria, the USEPA allows for the development of
criteria for the protection of fish and aquatic life using either one species or a group of aquatic organisms
when it has been demonstrated that they are important (e.g., recreationally or commercially) and are more
sensitive to the toxicant. The Basin Plan water quality objectives are based on metals toxicity to chinook
19 Eggs and fry are the most sensitive life stage of the salmonid species. 20 LC50: median lethal concentration., the lethal concentration calculated for 50% of the organisms tested.
Upper Sacramento River TMDL for Metals April 2002 64
salmon and steelhead trout because these fish appear to meet these specifications for the upper
Sacramento River (Finlayson and Wilson, 1989; Hagler Bailley, 1996 & 1998).
6.3.2 California Toxics Rule Criteria
As noted earlier, the USEPA approved the maximum concentration criteria that were included in the
Basin Plan as water quality objectives. However, the USEPA Administrator made a finding that it was
still necessary to develop separate chronic criteria for copper, cadmium, and zinc for the Sacramento
River (and tributaries) above Hamilton City, as part of the statewide criteria promulgated in the CTR
(USEPA, 2000a).
The CTR Criteria for Freshwater Aquatic Life Protection include 4-day continuous concentration criteria
of 1.1 µg/l, 4.1 µg/l and 54 µg/l, for cadmium, copper, and zinc, respectively, all in the dissolved form
using a hardness of 40 mg/l as CaCO3. The USEPA selected the 4-day averaging period based on the
shortest duration in which chronic test effects are sometimes observed for certain species and toxicants.
Freshwater aquatic species are not expected to be affected unacceptably if the 4-day average
concentration of an individual metal does not exceed its CTR continuous concentration criterion more
than once every three-year period (USEPA, 1996b & 2000a). If deviations in hardness occur, the criteria
are determined using the following formulas:
Copper criterion (µg/l) = (e (0.8545) (ln hardness [mg/l]) – 1.702) x (0.960)
Zinc criterion (µg/l) = (e (0.8473) (ln hardness [mg/l]) + 0.884) x (0.986)
Cadmium criterion (µg/l) = (e (0.7852) (ln hardness [mg/l]) – 2.715) x (1.101672 – {[ln hardness] x 0.041838})
Where: e = exponent ln = natural logarithm
The continuous concentration criterion for cadmium is based on the results of flow-through chronic
toxicity tests conducted on a wide variety of aquatic species (USEPA, 1996b). Because insufficient
chronic copper and zinc toxicity data were available, the continuous concentration criteria for copper and
zinc were adapted from the CTR maximum concentration criteria using acute-chronic ratios developed for
selected fish and invertebrate species.21, 22
21 The CTR maximum concentration criteria for cadmium, copper, and zinc are 1.6 µg/l, 5.7 µg/l, and 54 µg/l, respectively, with
a hardness of 40 mg/l. The CTR maximum and continuous criteria for metals were originally calculated using the Water Quality Criteria Documents; Availability – Appendix B-Guidelines for Deriving Water Quality Criteria for the Protection of Aquatic Life and Its Uses (45 Federal Register 79341, November 28, 1980), as amended by the Guidelines for Deriving Numerical national Water Quality Criteria for the Protection of Aquatic Organisms and Their Uses (Stephan et al., 1985).
(Footnote continued on next page.)
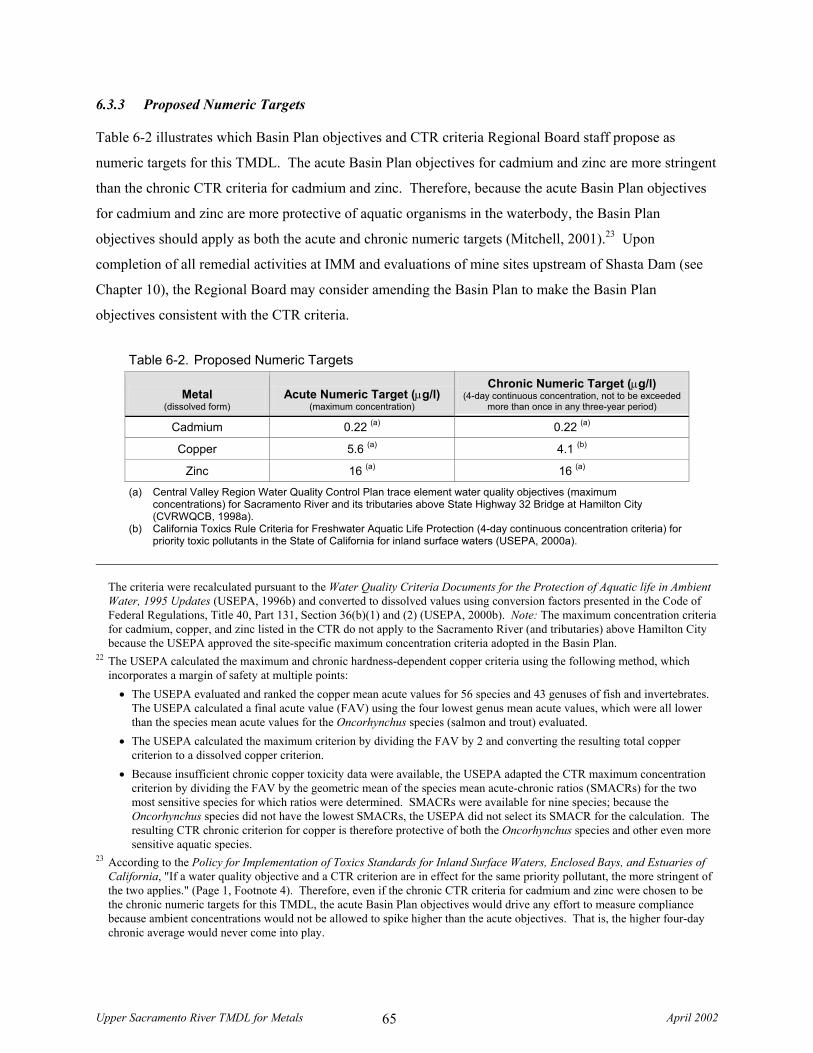
Upper Sacramento River TMDL for Metals April 2002 65
6.3.3 Proposed Numeric Targets
Table 6-2 illustrates which Basin Plan objectives and CTR criteria Regional Board staff propose as
numeric targets for this TMDL. The acute Basin Plan objectives for cadmium and zinc are more stringent
than the chronic CTR criteria for cadmium and zinc. Therefore, because the acute Basin Plan objectives
for cadmium and zinc are more protective of aquatic organisms in the waterbody, the Basin Plan
objectives should apply as both the acute and chronic numeric targets (Mitchell, 2001).23 Upon
completion of all remedial activities at IMM and evaluations of mine sites upstream of Shasta Dam (see
Chapter 10), the Regional Board may consider amending the Basin Plan to make the Basin Plan
objectives consistent with the CTR criteria.
Table 6-2. Proposed Numeric Targets
Metal (dissolved form)
Acute Numeric Target (µg/l) (maximum concentration)
Chronic Numeric Target (µg/l) (4-day continuous concentration, not to be exceeded
more than once in any three-year period)
Cadmium 0.22 (a) 0.22 (a)
Copper 5.6 (a) 4.1 (b)
Zinc 16 (a) 16 (a)
(a) Central Valley Region Water Quality Control Plan trace element water quality objectives (maximum concentrations) for Sacramento River and its tributaries above State Highway 32 Bridge at Hamilton City (CVRWQCB, 1998a).
(b) California Toxics Rule Criteria for Freshwater Aquatic Life Protection (4-day continuous concentration criteria) for priority toxic pollutants in the State of California for inland surface waters (USEPA, 2000a).
The criteria were recalculated pursuant to the Water Quality Criteria Documents for the Protection of Aquatic life in Ambient Water, 1995 Updates (USEPA, 1996b) and converted to dissolved values using conversion factors presented in the Code of Federal Regulations, Title 40, Part 131, Section 36(b)(1) and (2) (USEPA, 2000b). Note: The maximum concentration criteria for cadmium, copper, and zinc listed in the CTR do not apply to the Sacramento River (and tributaries) above Hamilton City because the USEPA approved the site-specific maximum concentration criteria adopted in the Basin Plan.
22 The USEPA calculated the maximum and chronic hardness-dependent copper criteria using the following method, which incorporates a margin of safety at multiple points:
• The USEPA evaluated and ranked the copper mean acute values for 56 species and 43 genuses of fish and invertebrates. The USEPA calculated a final acute value (FAV) using the four lowest genus mean acute values, which were all lower than the species mean acute values for the Oncorhynchus species (salmon and trout) evaluated.
• The USEPA calculated the maximum criterion by dividing the FAV by 2 and converting the resulting total copper criterion to a dissolved copper criterion.
• Because insufficient chronic copper toxicity data were available, the USEPA adapted the CTR maximum concentration criterion by dividing the FAV by the geometric mean of the species mean acute-chronic ratios (SMACRs) for the two most sensitive species for which ratios were determined. SMACRs were available for nine species; because the Oncorhynchus species did not have the lowest SMACRs, the USEPA did not select its SMACR for the calculation. The resulting CTR chronic criterion for copper is therefore protective of both the Oncorhynchus species and other even more sensitive aquatic species.
23 According to the Policy for Implementation of Toxics Standards for Inland Surface Waters, Enclosed Bays, and Estuaries of California, "If a water quality objective and a CTR criterion are in effect for the same priority pollutant, the more stringent of the two applies." (Page 1, Footnote 4). Therefore, even if the chronic CTR criteria for cadmium and zinc were chosen to be the chronic numeric targets for this TMDL, the acute Basin Plan objectives would drive any effort to measure compliance because ambient concentrations would not be allowed to spike higher than the acute objectives. That is, the higher four-day chronic average would never come into play.
Upper Sacramento River TMDL for Metals April 2002 66
6.4 Comparison of Numeric Targets to Historical Conditions
The long-term water quality data sets for Sacramento River below Shasta Dam and Keswick Dam indicate
that, historically, dissolved concentrations of cadmium, copper, and zinc frequently exceeded both the
chronic CTR criteria and acute Basin Plan water quality objectives (see Chapter 2 and Appendix A). A
notable decrease in the frequency of exceedances is evident during the 1980s and 1990s, which correlates
to (1) load reductions resulting from remediations completed at mine sites in the Shasta Lake region and
at the Iron Mountain Mines site, and (2) improved coordination of releases from Spring Creek Debris
Dam, Spring Creek Power Plant, Shasta Dam, and Keswick Dam. However, exceedances still can occur
during the high flow season (November to April). Additional reductions in loads resulting from proposed
remediation activities at the IMM site and other mine sites in the Shasta Lake area should enable the
consistent attainment of water quality objectives and the full protection of the upper Sacramento River’s
beneficial uses. Refer to Chapters 7, 8, and 10 for more detailed descriptions of anticipated reductions in
metals loads.
6.5 Compliance with Federal and State Antidegradation Policy
Any proposed numeric targets must comply with Federal and State antidegradation policies. The
USEPA's antidegradation regulations (Code of Federal Regulations, Title 40, Part 131, Section 12)
require States to adopt antidegradation policies that establish three levels of protection (Grubbs, 2000):
• Tier 1: Water quality necessary to support existing uses is maintained.
• Tier 2: Where water quality is better than the minimum level necessary to support protection and propagation of fish, shellfish and wildlife, and recreation in and on the water ("fishable/swimmable"), that water quality is also maintained and protected unless, through a public process, some lowering water quality is deemed necessary to accommodate important economic or social development.
• Tier 3: Where waterbodies are of exceptional recreational or ecological significance, water quality is maintained and protected.
The State of California antidegradation policy, adopted in 1968, requires the maintenance of existing high
quality water to the maximum extent possible, except under specific circumstances documented by the
policy (SWRCB, 1968). The antidegradation policy requires that, “wherever the existing quality of water
is better than the quality established in policies as of the date on which such policies become effective,
such existing high quality will be maintained until it has been demonstrated to the State that any change
will be consistent with maximum benefit to the people of the State, will not unreasonably affect present
Upper Sacramento River TMDL for Metals April 2002 67
and anticipated beneficial use of such water and will not result in water quality less than that prescribed in
the policies.”
At the time of the State’s policy adoption, levels of cadmium, copper and zinc in the upper Sacramento
River frequently exceeded levels required to enable attainment of designated beneficial uses because the
most effective remediation activities had not yet taken place. Since then, the frequency of exceedances of
such levels has decreased as a result of load reductions resulting from remediations completed at mine
sites in the Shasta Lake region and at Iron Mountain Mines and improved coordination of releases from
Spring Creek Debris Dam, Spring Creek Power Plant, Shasta Dam, and Keswick Dam. Compliance with
the numeric targets proposed in Table 6-2 will comply with the antidegradation policy because metals
concentrations will be lower than concentrations in the upper Sacramento River have been since 1968.
Therefore, compliance with the proposed numeric targets will also enable compliance with the State of
California antidegradation policy.
Upper Sacramento River TMDL for Metals April 2002 68
7 LINKAGE ANALYSIS
7.1 Introduction
The linkage analysis defines the cause-and-effect relationship between numeric targets, selected target
media, and identified sources. Understanding this relationship enables the estimation of load reductions
so that Federal and State agencies can design remediation activities that effectively decrease dissolved
metal concentrations to levels below the desired numeric targets and thereby protect beneficial uses. This
chapter first expresses the linkage relationship qualitatively in the form of conceptual models.
Quantitative tools complete the linkage. This TMDL relies on USEPA’s numeric model of the
IMM discharges to quantify load reductions at IMM that are required to meet numeric targets.
7.2 Conceptual Relationships
The beneficial uses most impacted by cadmium, copper, and zinc in the upper Sacramento River are
warm and cold freshwater habitats. Chinook salmon and steelhead trout fisheries downstream of Keswick
Dam have been particularly impacted. Figure 7-1 provides a conceptual model of the relationship
between beneficial uses and sources. Continual-flow toxicity tests conducted on juvenile chinook salmon
and other aquatic species have established the link between dissolved cadmium, copper, and zinc
concentrations in water and acute and chronic health effects on aquatic species (see Chapter 4 (Effects of
Cadmium, Copper, and Zinc on Aquatic Life) and Chapter 6 (Numeric Targets)). The numeric targets
indicated in Chapter 6 identify levels of dissolved cadmium, copper, and zinc in water that are non-toxic
to aquatic life.
Exceedances of numeric targets occur when the metal loads exceed the loading capacity of a waterbody.
A waterbody's loading capacity, also called its assimilative capacity, represents the maximum rate of
loading of a pollutant that the waterbody can assimilate without violating water quality standards (Code
of Federal Regulations, Title 40, Part 130, Section 2(f)). Figure 7-2 illustrates the equation used to
calculate the assimilative capacity. By definition, numeric target exceedances occur when metal loads
exceed the assimilative capacity because the numeric target is a component of the assimilated capacity
calculation. When metal loads are much less than the assimilative capacity, there is an availability of
excess assimilative capacity (i.e., more metal can be added without causing an exceedance of a numeric
target). Figures G-1A through G-2C in Appendix G compare assimilative capacity to maximum daily
loads of dissolved copper, cadmium, and zinc in Shasta Dam and Keswick Dam releases and in the
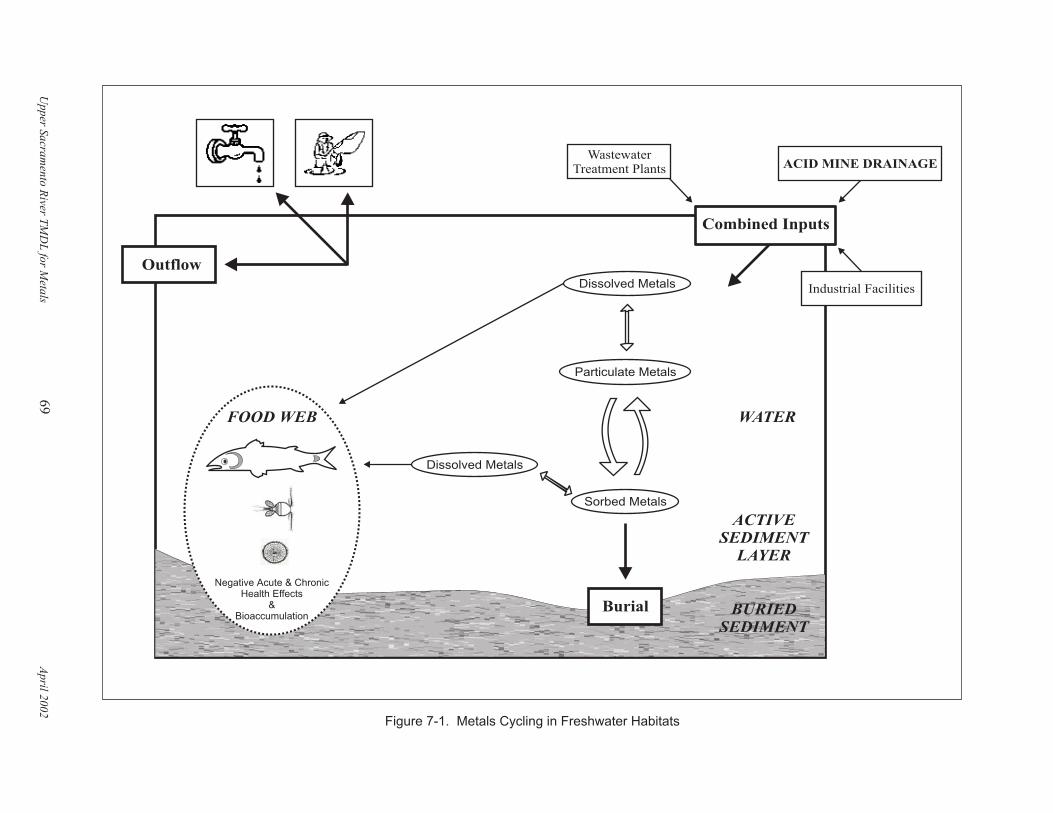
WATER
ACTIVE
SEDIMENT
LAYER
BURIED
SEDIMENT
Outflow
Particulate Metals
Burial
Dissolved Metals
Sorbed Metals
Dissolved Metals
FOOD WEB
Negative Acute & ChronicHealth Effects
&Bioaccumulation
Wastewater
Treatment PlantsACID MINE DRAINAGE
Combined Inputs
Industrial Facilities
Figure 7-1. Metals Cycling in Freshwater Habitats
Upper
Sacra
men
toR
iverT
MD
Lfo
rM
etals
2002
69
April
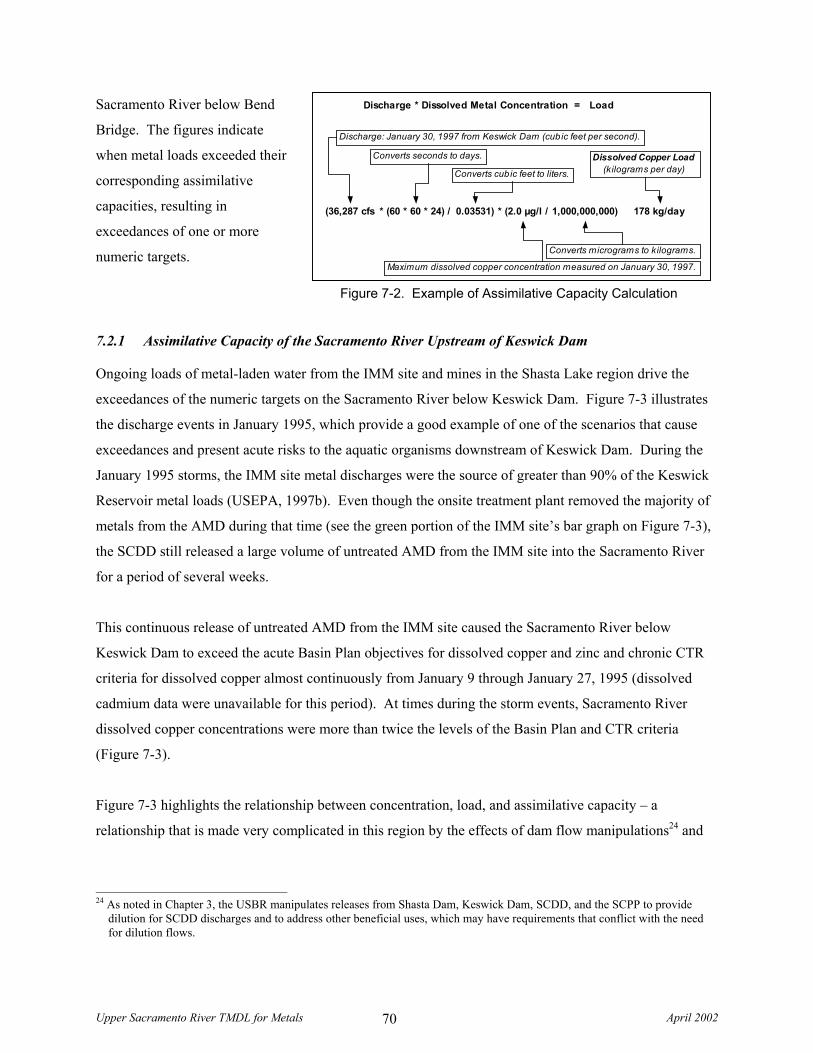
Upper Sacramento River TMDL for Metals April 2002 70
Sacramento River below Bend
Bridge. The figures indicate
when metal loads exceeded their
corresponding assimilative
capacities, resulting in
exceedances of one or more
numeric targets.
7.2.1 Assimilative Capacity of the Sacramento River Upstream of Keswick Dam
Ongoing loads of metal-laden water from the IMM site and mines in the Shasta Lake region drive the
exceedances of the numeric targets on the Sacramento River below Keswick Dam. Figure 7-3 illustrates
the discharge events in January 1995, which provide a good example of one of the scenarios that cause
exceedances and present acute risks to the aquatic organisms downstream of Keswick Dam. During the
January 1995 storms, the IMM site metal discharges were the source of greater than 90% of the Keswick
Reservoir metal loads (USEPA, 1997b). Even though the onsite treatment plant removed the majority of
metals from the AMD during that time (see the green portion of the IMM site’s bar graph on Figure 7-3),
the SCDD still released a large volume of untreated AMD from the IMM site into the Sacramento River
for a period of several weeks.
This continuous release of untreated AMD from the IMM site caused the Sacramento River below
Keswick Dam to exceed the acute Basin Plan objectives for dissolved copper and zinc and chronic CTR
criteria for dissolved copper almost continuously from January 9 through January 27, 1995 (dissolved
cadmium data were unavailable for this period). At times during the storm events, Sacramento River
dissolved copper concentrations were more than twice the levels of the Basin Plan and CTR criteria
(Figure 7-3).
Figure 7-3 highlights the relationship between concentration, load, and assimilative capacity – a
relationship that is made very complicated in this region by the effects of dam flow manipulations24 and
24 As noted in Chapter 3, the USBR manipulates releases from Shasta Dam, Keswick Dam, SCDD, and the SCPP to provide
dilution for SCDD discharges and to address other beneficial uses, which may have requirements that conflict with the need for dilution flows.
Figure 7-2. Example of Assimilative Capacity Calculation
Discharge: January 30, 1997 from Keswick Dam (cubic feet per second).
Converts seconds to days.
Converts cubic feet to liters.
Dissolved Copper Load(kilograms per day)
Converts micrograms to kilograms.
Maximum dissolved copper concentration measured on January 30, 1997.
Discharge * Dissolved Metal Concentration = Load
(36,287 cfs * (60 * 60 * 24) / 0.03531) * (2.0 µg/l / 1,000,000,000) 178 kg/day
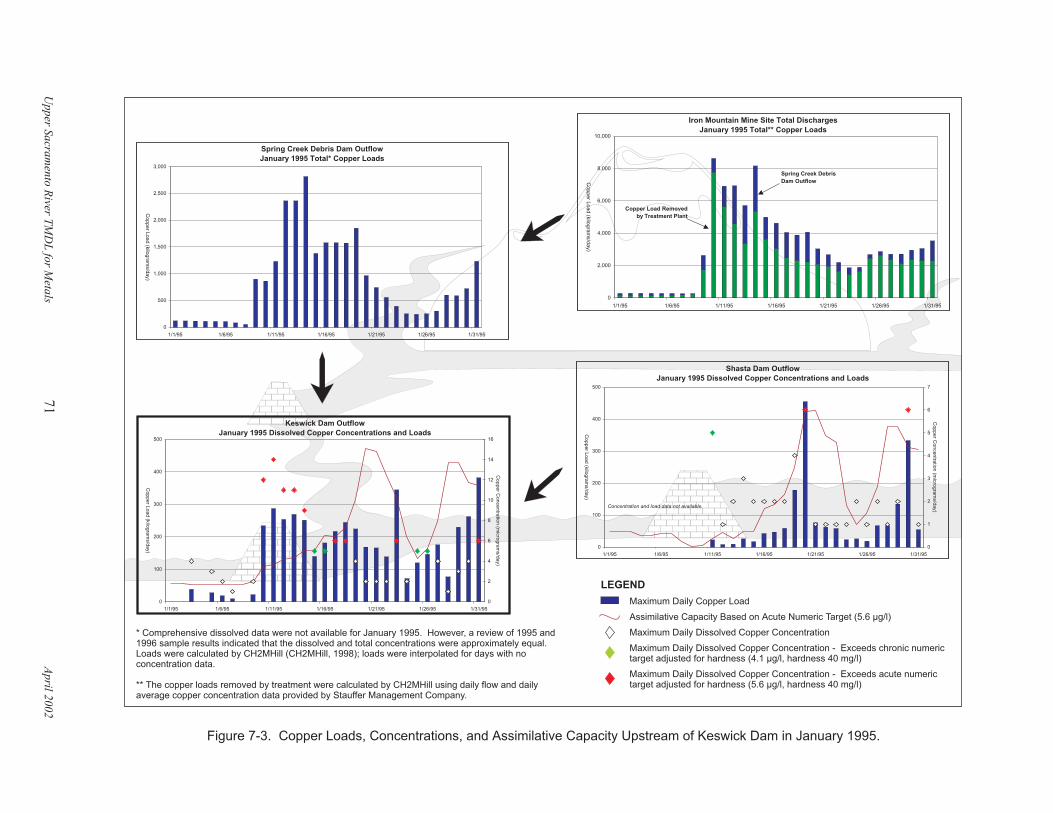
������������������������
������������������������������������������������������
����������������������������������������
Figure 7-3. Copper Loads, Concentrations, and Assimilative Capacity Upstream of Keswick Dam in January 1995.
LEGEND
Maximum Daily Copper Load
Assimilative Capacity Based on Acute Numeric Target
Maximum Daily Dissolved Copper Concentration - Exceeds chronic numerictarget adjusted for hardness (4.1 µg/l, hardness 40 mg/l)
(5.6 µg/l)
Maximum Daily Dissolved Copper Concentration
Maximum Daily Dissolved Copper Concentration - Exceeds acute numerictarget adjusted for hardness (5.6 µg/l, hardness 40 mg/l)
Iron Mountain Mine Site Total Discharges
January 1995 Total** Copper Loads
0
2,000
4,000
6,000
8,000
10,000
1/1/95 1/6/95 1/11/95 1/16/95 1/21/95 1/26/95 1/31/95
Copper
Load
(kilo
gra
ms/d
ay)
Spring Creek Debris
Dam Outflow
Copper Load Removed
by Treatment Plant
Spring Creek Debris Dam Outflow
January 1995 Total* Copper Loads
0
500
1,000
1,500
2,000
2,500
3,000
1/1/95 1/6/95 1/11/95 1/16/95 1/21/95 1/26/95 1/31/95
Copper
Load
(kilo
gra
ms/d
ay)
* Comprehensive dissolved data were not available for January 1995. However, a review of 1995 and1996 sample results indicated that the dissolved and total concentrations were approximately equal.Loads were calculated by CH2MHill (CH2MHill, 1998); loads were interpolated for days with noconcentration data.
** The copper loads removed by treatment were calculated by CH2MHill using daily flow and dailyaverage copper concentration data provided by Stauffer Management Company.
Shasta Dam Outflow
January 1995 Dissolved Copper Concentrations and Loads
0
100
200
300
400
500
1/1/95 1/6/95 1/11/95 1/16/95 1/21/95 1/26/95 1/31/95
Copper
Load
(kilo
gra
ms/d
ay)
0
1
2
3
4
5
6
7
Copper
Concentra
tion
(mic
rogra
ms/d
ay)
Concentration and load data not available.
Keswick Dam Outflow
January 1995 Dissolved Copper Concentrations and Loads
0
100
200
300
400
500
1/1/95 1/6/95 1/11/95 1/16/95 1/21/95 1/26/95 1/31/95
Copper
Load
(kilo
gra
ms/d
ay)
0
2
4
6
8
10
12
14
16
Copper
Concentra
tion
(mic
rogra
ms/d
ay)
Upper
Sacra
men
toR
iverT
MD
Lfo
rM
etals
2002
71
April
Upper Sacramento River TMDL for Metals April 2002 72
depositional processes in Keswick Reservoir.25 In January 1995, metal loads from the IMM site via
SCDD drove the exceedances that occurred on the Sacramento River below Keswick Dam, especially
during the January 10-15 period when Shasta Dam releases were low (see Figure 3-2A) and had little
assimilative capacity (see Figure 7-3) to dilute the IMM site metal loads.
As noted in Chapter 5, Shasta Dam releases sometimes act as a significant source of metal loads in the
upper Sacramento River, although the metal concentrations rarely exceed the numeric targets. For
example, during the period October 1995 to September 2000 (the period analyzed by the source
assessment), dissolved copper concentrations in Shasta Dam releases did not exceed the acute numeric
target level for copper (5.6 µg/l), and only exceeded the chronic numeric target level for brief periods
(i.e., less than four days). However, exceptions to this normal situation can occur, as illustrated by
Figures 2-1B and 7-3, and Figures G-1A through G-1C, which show data for Shasta Dam for early 1995
and 2001. Available data indicate that Shasta Dam releases had dissolved copper and zinc concentrations
that exceeded the proposed acute and chronic numeric targets on three days in January 1995. In March
and April 2001, Shasta Dam releases had dissolved copper concentrations that exceeded the chronic
numeric target of 4.1 µg/l and approached the acute numeric target of 5.6 µg/l; dissolved copper
concentrations in Keswick Dam releases exceeded the numeric targets almost continuously during this
time period.26 Figures G-1 and G-2 illustrate how these exceedances relate to the daily loads and
assimilative capacity of Shasta Dam and Keswick Dam releases.
7.2.2 Assimilative Capacity of the Sacramento River Downstream of Keswick Dam
The dissolved metal assimilative capacity and load calculations for Keswick Dam releases and for the
Sacramento River above Bend Bridge reflect the water and dissolved metal transport processes described
in Chapter 5. Figure 7-4 compares the Keswick Dam and Bend Bridge dissolved copper assimilative
25 As described in Chapter 3, studies indicate that approximately 35 to 50% of dissolved metals form precipitates in the SCAKR
and Keswick Reservoir; i.e., Keswick Dam does not typically immediately release the entire metal load that comes into the Keswick Reservoir. However, intermittent discharges from the SCPP can flush accumulations of contaminated water and precipitates from the SCAKR into the main stem of the river; therefore, there are times that Keswick Dam may release more metal load than the amount recently received from upstream sources.
26 The unusually high dissolved copper concentrations measured in Shasta Dam releases in early 2001 probably resulted from the combination of two factors. First, a controlled release from a mine in the Shasta Lake area occurred during the summer of 2000; the effects of the release would not be observed in Shasta Dam releases for several months (Pedri, 2001). In addition, Shasta Dam flows were exceptionally low during March and April 2001 (see Figure 3-2A), which could have affected the metal concentrations below Shasta and Keswick Dams by drawing water from Shasta Lake’s thermocline, a level of Shasta Lake’s water column that experiences higher metal concentrations (Bruns, pers. comm.), and decreasing the assimilative capacity of downstream waters by decreasing the amount of available dilution flow.
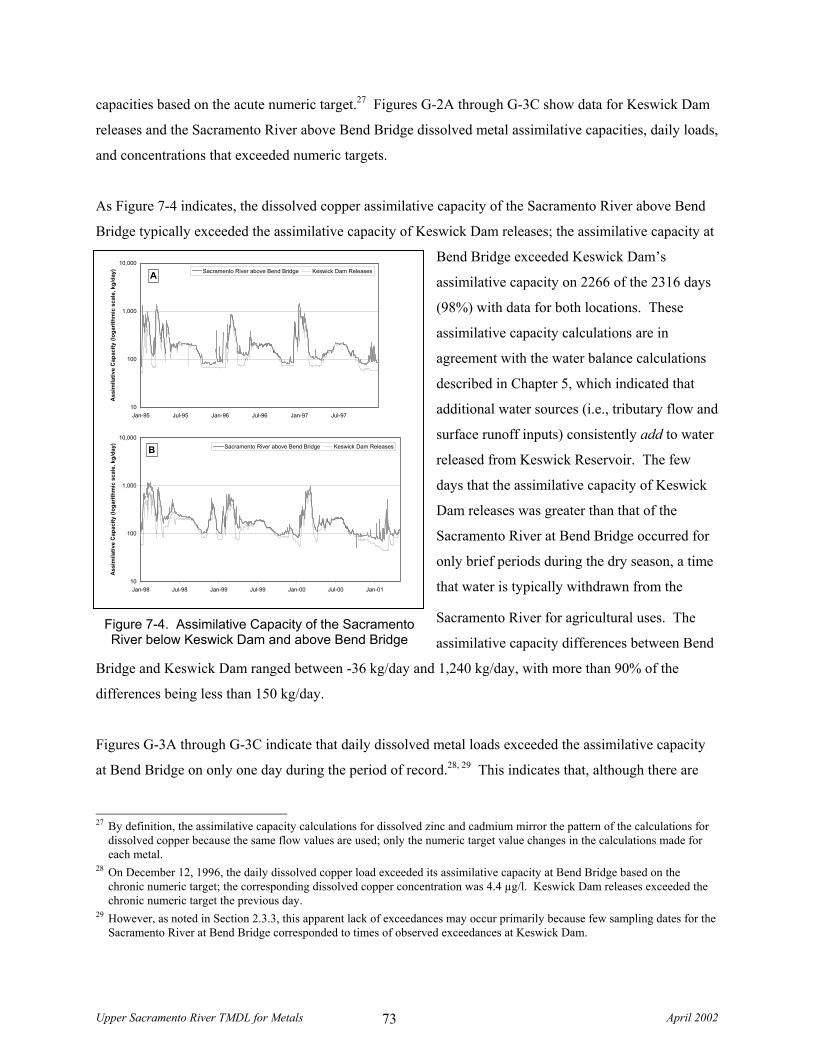
Upper Sacramento River TMDL for Metals April 2002 73
capacities based on the acute numeric target.27 Figures G-2A through G-3C show data for Keswick Dam
releases and the Sacramento River above Bend Bridge dissolved metal assimilative capacities, daily loads,
and concentrations that exceeded numeric targets.
As Figure 7-4 indicates, the dissolved copper assimilative capacity of the Sacramento River above Bend
Bridge typically exceeded the assimilative capacity of Keswick Dam releases; the assimilative capacity at
Bend Bridge exceeded Keswick Dam’s
assimilative capacity on 2266 of the 2316 days
(98%) with data for both locations. These
assimilative capacity calculations are in
agreement with the water balance calculations
described in Chapter 5, which indicated that
additional water sources (i.e., tributary flow and
surface runoff inputs) consistently add to water
released from Keswick Reservoir. The few
days that the assimilative capacity of Keswick
Dam releases was greater than that of the
Sacramento River at Bend Bridge occurred for
only brief periods during the dry season, a time
that water is typically withdrawn from the
Sacramento River for agricultural uses. The
assimilative capacity differences between Bend
Bridge and Keswick Dam ranged between -36 kg/day and 1,240 kg/day, with more than 90% of the
differences being less than 150 kg/day.
Figures G-3A through G-3C indicate that daily dissolved metal loads exceeded the assimilative capacity
at Bend Bridge on only one day during the period of record.28, 29 This indicates that, although there are
27 By definition, the assimilative capacity calculations for dissolved zinc and cadmium mirror the pattern of the calculations for
dissolved copper because the same flow values are used; only the numeric target value changes in the calculations made for each metal.
28 On December 12, 1996, the daily dissolved copper load exceeded its assimilative capacity at Bend Bridge based on the chronic numeric target; the corresponding dissolved copper concentration was 4.4 µg/l. Keswick Dam releases exceeded the chronic numeric target the previous day.
29 However, as noted in Section 2.3.3, this apparent lack of exceedances may occur primarily because few sampling dates for the Sacramento River at Bend Bridge corresponded to times of observed exceedances at Keswick Dam.
Figure 7-4. Assimilative Capacity of the Sacramento River below Keswick Dam and above Bend Bridge
10
100
1,000
10,000
Jan-95 Jul-95 Jan-96 Jul-96 Jan-97 Jul-97
Ass
imila
tive
Cap
acity
(log
arith
mic
sca
le, k
g/da
y) Sacramento River above Bend Bridge Keswick Dam ReleasesA
10
100
1,000
10,000
Jan-98 Jul-98 Jan-99 Jul-99 Jan-00 Jul-00 Jan-01
Ass
imila
tive
Cap
acity
(log
arith
mic
sca
le, k
g/da
y) Sacramento River above Bend Bridge Keswick Dam ReleasesB
Upper Sacramento River TMDL for Metals April 2002 74
downstream sources of dissolved metals, there is enough dilution tributary flow and surface runoff inputs,
and/or attenuation of dissolved metals from the Sacramento River, between Keswick Dam and Bend
Bridge to counter the additional metal inputs. As noted in Chapter 5, the mass values for the 26 sampling
periods in water years 1996 through 2000 for dissolved copper and zinc, and the 12 sampling periods for
dissolved cadmium indicated that dissolved zinc and cadmium loads typically experienced net attenuation
in the Sacramento River between Keswick Dam and Bend Bridge. That is, apparently dissolved zinc and
cadmium loads decreased (probably by adsorption to fine-grained sediments) at a rate faster than the
downstream monitored and unmonitored sources added dissolved zinc and cadmium. The attenuation of
dissolved zinc and cadmium, combined with tributary flow and surface runoff water inputs, caused
dissolved zinc and cadmium concentrations above Bend Bridge to be lower than the numeric targets. In
contrast, dissolved copper loads typically experienced a net increase in the Sacramento River between
Keswick Dam and Bend Bridge. However, tributary flow and surface runoff inputs still diluted the
dissolved copper loads in the river to an extent that, but for the one day in December 1996, the dissolved
copper concentrations above Bend Bridge did not exceed numeric targets.
7.3 Numeric Modeling
The source and linkage analyses indicated that:
• Dissolved metal loads from the IMM site released by SCDD typically cause exceedances of numeric targets (especially for dissolved copper) in Keswick Dam releases. Shasta Dam releases typically (but not always) act as sources of dilution for SCDD releases.
• Keswick Dam releases are the dominant source of dissolved metal loads to the Sacramento River between Keswick Dam and Bend Bridge.
Because the IMM site is the dominant contributor of dissolved metals to the Sacramento River, the
USEPA developed a numerical water quality model to predict the effectiveness of various remedial
alternatives with respect to limiting the frequency of SCDD spills and exceedances of the numeric targets
in the Sacramento River below Keswick Dam. The USEPA developed its model as part of its 1994 Water
Management Feasibility Study30 and 1996 Water Management Feasibility Study Addendum31 (USEPA,
1997b). The model used a mass balance approach to account for heavy metals as they are carried in the
streams (Boulder Creek, Slickrock Creek, and Spring Creek) through Spring Creek Reservoir into
Keswick Reservoir and mixed with Sacramento River water released from Shasta Lake. The model takes
30 USEPA’s Water Management Feasibility Study. June 1994. 31 USEPA’s Water Management Feasibility Study Addendum. April 9, 1996. See also: Iron Mountain Mine Water Quality
Model Version 2 – Documentation with Diskette. May 1996.
Upper Sacramento River TMDL for Metals April 2002 75
into account all the remedial actions implemented to date and calculates (1) the frequency at which the
Basin Plan objectives and the CTR criteria would be exceeded in the main stem of the Sacramento River
below Keswick Dam over the 31-year study period (1965 to 1995), and (2) the Sacramento River flow
required to ensure the dilution of IMM-contaminated SCR waters to meet water quality standards. The
USEPA determined that the model is capable of taking into account the uncertainties inherent in real-time
operation of Central Valley Project facilities.
For the modeling conducted in 1996, the USEPA generally assumed that uncertainties could be addressed
by targeting SCDD operations to meet a value equal to 75% of the Basin Plan objectives and CTR
criteria. Comments submitted by the USBR indicate that this assumption might be overly optimistic,
which would cause the model to understate the frequency and duration of exceedances. In response to
this comment, comments from the responsible parties regarding other specific model assumptions, and
other information obtained since May 1996, in 1997 the USEPA conducted an additional modeling
analysis of the difficulties inherent in trying to predict metal concentrations below the SCDD in real-time
under highly variable conditions. As part of the most recent analysis, USEPA conducted new model runs
using:
• water quality and flow data obtained since the 1996 modeling effort;
• new flow projections from the USBR;
• CTR chronic criteria;32
• additional information regarding the operational efficiency of the SCDD.
In particular, the model relied on the assumption that Shasta Dam releases have an average dissolved
copper concentration of 1.3 µg/l and dissolved zinc concentration of 3.9 µg/l (Sugarek, 2002; CH2M Hill,
1997). The model incorporated dissolved metals concentration data for 54 samples collected between
1994 and 1997. To calculate average concentrations, the USEPA used ½ the detection limit for the
samples with metal concentrations below the MDL and the actual concentrations for the remaining
samples.33
The USEPA determined that the additional analysis confirmed the reliability and reasonableness of the
1996 IMM water quality model to predict, with reasonable accuracy, the types of conditions that would
32 At the time of the USEPA’s modeling efforts, the CTR criteria were considered to be “proposed” criteria, not final criteria. 33 Regional Board staff collected samples in 1993 that had an average concentration of 1.9 µg/l dissolved copper and 3.9 µg/l
dissolved zinc, indicating some variability in the copper concentrations over time (CH2M Hill, 1997; Sugarek, 2001).
Upper Sacramento River TMDL for Metals April 2002 76
cause SCDD spills and exceedances of the numeric targets (USEPA, 1997b).34 The analysis indicated
that, even if significant resources are expended to perform an intensive monitoring program and make
frequent operational adjustments, achieving a 75% SCDD operational efficiency under all conditions
could be an overly optimistic assumption. The USEPA therefore considered a range of operational
efficiencies in evaluating the probability of future SCDD spills under variable hydrologic conditions,
including a straight 75% assumption and a split operational efficiency that varies the assumed efficiency
from 50 to 75% depending on the Spring Creek Reservoir inflows (75% was used for Spring Creek
Reservoir inflows less than 50 cfs and 50% was used for Spring Creek Reservoir inflows greater
than 50 cfs).
7.3.1 Modeling of Current Conditions
Under current conditions (i.e., with treatment of the three major IMM sources and in the absence of
further response actions), the USEPA's modeling analysis indicated the following:
• The model consistently indicated that exceedances of the numeric targets in the winter would continue to occur on a regular and frequent basis below Keswick Dam, even assuming that the USBR would always be able to precisely define the appropriate releases during highly variable storm conditions (USEPA, 1997b). Using a more realistic estimate of SCDD operations would increase the frequency of the predicted exceedances. Uncontrolled spills of IMM contaminants would continue to occur every 3 to 4 years if the SCDD were operated to target the Basin Plan objectives below Keswick Dam and every 2 to 3 years if the SCDD were operated to target the CTR criteria below Keswick Dam. IMM site releases also would continue to affect natural resources below the SCDD by discharging large loads of heavy metals that form precipitates that contaminate downstream sediments.
• The two most important factors that currently make it impossible for SCDD to permit dilution of IMM AMD in a manner that maintains the numeric targets below Keswick Dam in the Sacramento River are: (1) the storm inflows to the Spring Creek Reservoir are highly contaminated, and (2) storms that cause these contaminated waters to fill the reservoir within a few days will likely occur every 5 to 10 years. More frequent SCDD spills (on the order of one spill every 3 to 4 years) would occur because of other factors such as preceding drought conditions that will limit the flow in the Sacramento River.
• Significant further remediation of the IMM area source discharges, such as reducing dissolved copper concentrations in Spring Creek Reservoir to 100 µg/l or less, is required to ensure that continued operations of SCDD would be able to safely release any continuing uncontrolled IMM discharges to protect the Sacramento River below Keswick Dam. Reducing metal loads to the Spring Creek Reservoir would permit the IMM AMD to be evacuated from the SCDD at a faster rate, which in turn would decrease the frequency of SCDD spills and exceedances of numeric targets.
34 See also: USEPA’s Response to Comments on Water Management Feasibility Study and Addendum (September 30, 1997) and
(Footnote continued on next page.)
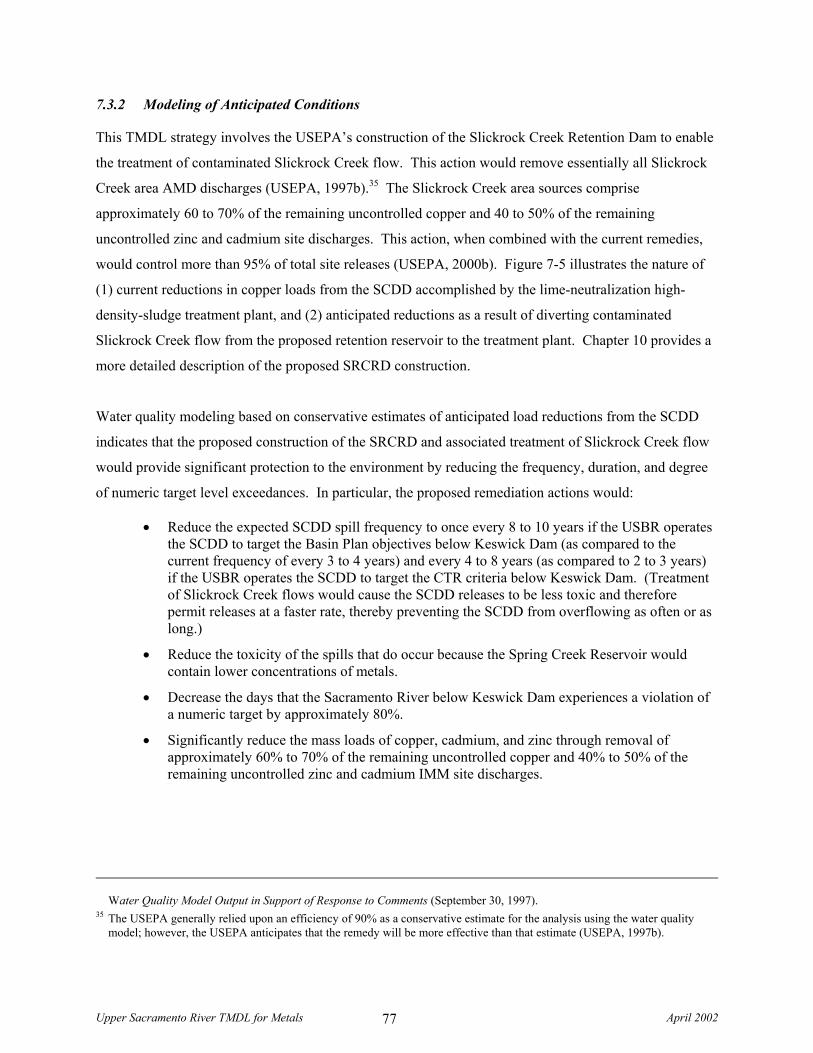
Upper Sacramento River TMDL for Metals April 2002 77
7.3.2 Modeling of Anticipated Conditions
This TMDL strategy involves the USEPA’s construction of the Slickrock Creek Retention Dam to enable
the treatment of contaminated Slickrock Creek flow. This action would remove essentially all Slickrock
Creek area AMD discharges (USEPA, 1997b).35 The Slickrock Creek area sources comprise
approximately 60 to 70% of the remaining uncontrolled copper and 40 to 50% of the remaining
uncontrolled zinc and cadmium site discharges. This action, when combined with the current remedies,
would control more than 95% of total site releases (USEPA, 2000b). Figure 7-5 illustrates the nature of
(1) current reductions in copper loads from the SCDD accomplished by the lime-neutralization high-
density-sludge treatment plant, and (2) anticipated reductions as a result of diverting contaminated
Slickrock Creek flow from the proposed retention reservoir to the treatment plant. Chapter 10 provides a
more detailed description of the proposed SRCRD construction.
Water quality modeling based on conservative estimates of anticipated load reductions from the SCDD
indicates that the proposed construction of the SRCRD and associated treatment of Slickrock Creek flow
would provide significant protection to the environment by reducing the frequency, duration, and degree
of numeric target level exceedances. In particular, the proposed remediation actions would:
• Reduce the expected SCDD spill frequency to once every 8 to 10 years if the USBR operates the SCDD to target the Basin Plan objectives below Keswick Dam (as compared to the current frequency of every 3 to 4 years) and every 4 to 8 years (as compared to 2 to 3 years) if the USBR operates the SCDD to target the CTR criteria below Keswick Dam. (Treatment of Slickrock Creek flows would cause the SCDD releases to be less toxic and therefore permit releases at a faster rate, thereby preventing the SCDD from overflowing as often or as long.)
• Reduce the toxicity of the spills that do occur because the Spring Creek Reservoir would contain lower concentrations of metals.
• Decrease the days that the Sacramento River below Keswick Dam experiences a violation of a numeric target by approximately 80%.
• Significantly reduce the mass loads of copper, cadmium, and zinc through removal of approximately 60% to 70% of the remaining uncontrolled copper and 40% to 50% of the remaining uncontrolled zinc and cadmium IMM site discharges.
Water Quality Model Output in Support of Response to Comments (September 30, 1997).
35 The USEPA generally relied upon an efficiency of 90% as a conservative estimate for the analysis using the water quality model; however, the USEPA anticipates that the remedy will be more effective than that estimate (USEPA, 1997b).
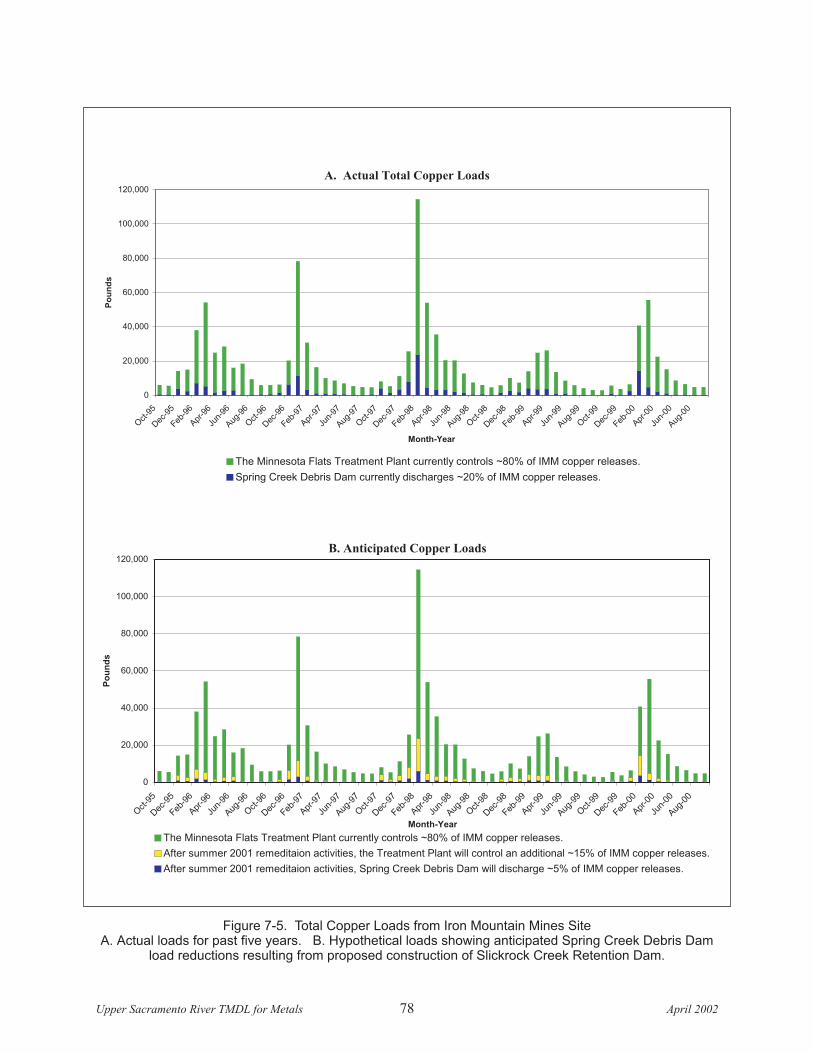
A. Actual Total Copper Loads
0
20,000
40,000
60,000
80,000
100,000
120,000
Oct
-95
Dec
-95
Feb-9
6
Apr
-96
Jun-
96
Aug
-96
Oct
-96
Dec
-96
Feb-9
7
Apr
-97
Jun-
97
Aug
-97
Oct
-97
Dec
-97
Feb-9
8
Apr
-98
Jun-
98
Aug
-98
Oct
-98
Dec
-98
Feb-9
9
Apr
-99
Jun-
99
Aug
-99
Oct
-99
Dec
-99
Feb-0
0
Apr
-00
Jun-
00
Aug
-00
Month-Year
Po
un
ds
The Minnesota Flats Treatment Plant currently controls ~80% of IMM copper releases.
Spring Creek Debris Dam currently discharges ~20% of IMM copper releases.
Figure 7-5. Total Copper Loads from Iron Mountain Mines SiteA. Actual loads for past five years. B. Hypothetical loads showing anticipated Spring Creek Debris Dam
load reductions resulting from proposed construction of Slickrock Creek Retention Dam.
0
20,000
40,000
60,000
80,000
100,000
120,000
Oct
-95
Dec
-95
Feb-9
6
Apr-9
6
Jun-
96
Aug-9
6
Oct
-96
Dec
-96
Feb-9
7
Apr-9
7
Jun-
97
Aug-9
7
Oct
-97
Dec
-97
Feb-9
8
Apr-9
8
Jun-
98
Aug-9
8
Oct
-98
Dec
-98
Feb-9
9
Apr-9
9
Jun-
99
Aug-9
9
Oct
-99
Dec
-99
Feb-0
0
Apr-0
0
Jun-
00
Aug-0
0
Month-Year
Po
un
ds
The Minnesota Flats Treatment Plant currently controls ~80% of IMM copper releases.
After summer 2001 remeditaion activities, the Treatment Plant will control an additional ~15% of IMM copper releases.
After summer 2001 remeditaion activities, Spring Creek Debris Dam will discharge ~5% of IMM copper releases.
B. Anticipated Copper Loads
Upper Sacramento River TMDL for Metals April 200278
Upper Sacramento River TMDL for Metals April 2002 79
Reducing metal loads from the IMM site via the SCDD also produces ancillary environmental benefits by
reducing the need for special dilution releases (USEPA, 1997b). For example, if special releases of water
are required for dilution of IMM AMD, those releases reduce the amounts of water in storage that would
otherwise be available for temperature control in the Sacramento River or other environmental needs. An
additional ancillary benefit can be realized with reduced reliance on the current use of the Spring Creek
Power Plant discharges to ensure regular flushing of the heavy metals from SCAKR. Demand for water
from the Trinity River and upper Clear Creek would be reduced, increasing its availability for beneficial
uses in those watersheds.
Upper Sacramento River TMDL for Metals April 2002 80
8 LOAD REDUCTION ALLOCATIONS
8.1 Definition of Allocations
A TMDL typically represents the sum of all individual allocations of the waterbody’s assimilative
capacity. The TMDL must be less than or equal to the assimilative capacity; it is equal to the assimilative
capacity only if the entire assimilative capacity is allocated. Allocations can be made to point sources
(wasteload allocations) or nonpoint sources (load allocations). Federal regulations define a load
allocation as:
“The portion of a receiving water’s loading capacity that is attributed either to one of its existing or future nonpoint sources of pollution or to natural background sources. Load allocations are best estimates of the loading, which may range from reasonably accurate estimates or to gross allotments, depending on the availability of data and appropriate techniques for predicting loading. Wherever possible, natural and nonpoint source loads should be distinguished.” (Code of Federal Regulations, Title 40, Part 130, Section 2(g))
This TMDL presents allocations in terms of the existing assimilative capacity of the Sacramento River
below Keswick Dam and above Bend Bridge (the two monitoring points for this TMDL), as described
below. Load reductions are assigned to IMM and Shasta Dam releases.
8.2 Load Reduction Allocation for Sources above Keswick Dam
Figures G-2A through G-2C in Appendix G illustrate the daily loads, assimilative capacity, and dissolved
concentrations for copper, zinc, and cadmium36 in Keswick Dam releases. Keswick Dam releases
represent the accumulated discharges from the IMM site, SCPP, Shasta Lake, and other point and
nonpoint sources. As noted in Chapter 5 (Source Assessment), the IMM site and Shasta Lake dissolved
metal discharges during the wet season account for the majority of metal loads discharged from Keswick
Dam, as well as the exceedances of numeric targets below Keswick Dam.
8.2.1 Load Reduction for Iron Mountain Mines Site
As noted in Chapter 7 (Linkage Analysis), the USEPA developed a numerical water quality model to
predict the effectiveness of various remedial alternatives with respect to reducing loads from IMM site to
limit the frequency of SCDD spills and exceedances of the numeric targets below Keswick Dam. The
USEPA’s method involved determining (1) the reduction in metals loads (which occur almost entirely in
36 See Chapter 7 (Linkage Analysis) for a discussion of the relationship between assimilative capacity, concentration, and load.
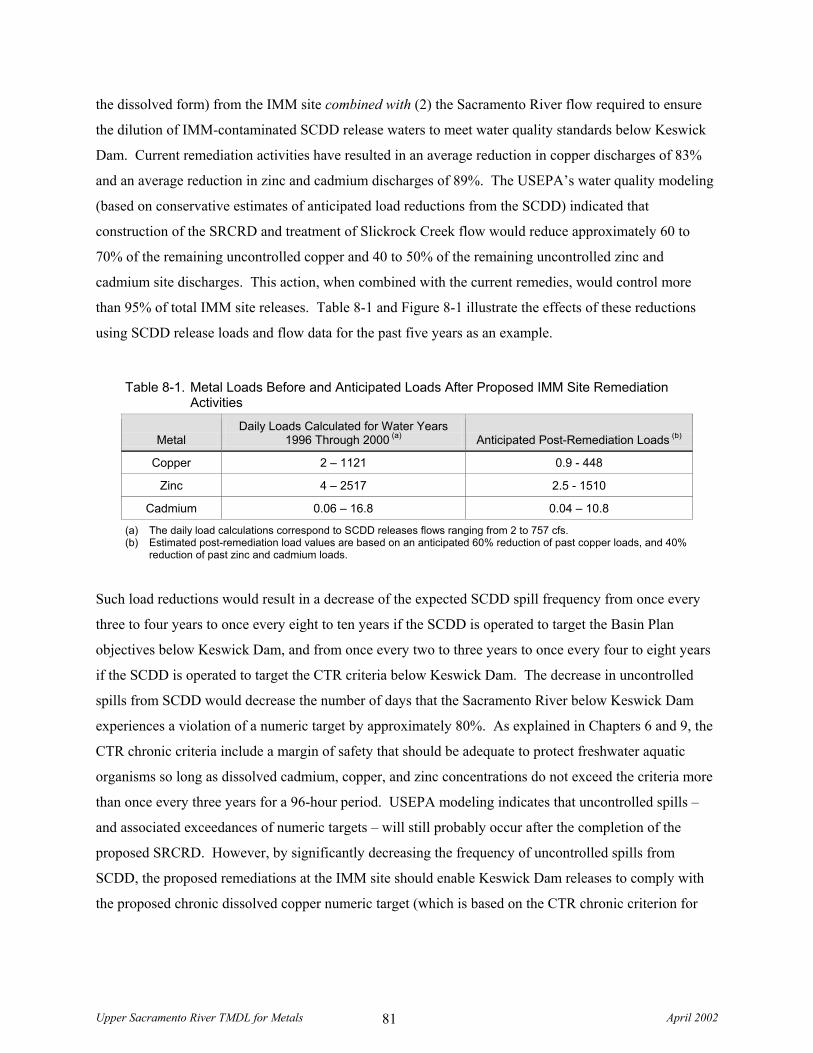
Upper Sacramento River TMDL for Metals April 2002 81
the dissolved form) from the IMM site combined with (2) the Sacramento River flow required to ensure
the dilution of IMM-contaminated SCDD release waters to meet water quality standards below Keswick
Dam. Current remediation activities have resulted in an average reduction in copper discharges of 83%
and an average reduction in zinc and cadmium discharges of 89%. The USEPA’s water quality modeling
(based on conservative estimates of anticipated load reductions from the SCDD) indicated that
construction of the SRCRD and treatment of Slickrock Creek flow would reduce approximately 60 to
70% of the remaining uncontrolled copper and 40 to 50% of the remaining uncontrolled zinc and
cadmium site discharges. This action, when combined with the current remedies, would control more
than 95% of total IMM site releases. Table 8-1 and Figure 8-1 illustrate the effects of these reductions
using SCDD release loads and flow data for the past five years as an example.
Table 8-1. Metal Loads Before and Anticipated Loads After Proposed IMM Site Remediation Activities
Metal Daily Loads Calculated for Water Years
1996 Through 2000 (a) Anticipated Post-Remediation Loads (b)
Copper 2 – 1121 0.9 - 448
Zinc 4 – 2517 2.5 - 1510
Cadmium 0.06 – 16.8 0.04 – 10.8
(a) The daily load calculations correspond to SCDD releases flows ranging from 2 to 757 cfs. (b) Estimated post-remediation load values are based on an anticipated 60% reduction of past copper loads, and 40%
reduction of past zinc and cadmium loads.
Such load reductions would result in a decrease of the expected SCDD spill frequency from once every
three to four years to once every eight to ten years if the SCDD is operated to target the Basin Plan
objectives below Keswick Dam, and from once every two to three years to once every four to eight years
if the SCDD is operated to target the CTR criteria below Keswick Dam. The decrease in uncontrolled
spills from SCDD would decrease the number of days that the Sacramento River below Keswick Dam
experiences a violation of a numeric target by approximately 80%. As explained in Chapters 6 and 9, the
CTR chronic criteria include a margin of safety that should be adequate to protect freshwater aquatic
organisms so long as dissolved cadmium, copper, and zinc concentrations do not exceed the criteria more
than once every three years for a 96-hour period. USEPA modeling indicates that uncontrolled spills –
and associated exceedances of numeric targets – will still probably occur after the completion of the
proposed SRCRD. However, by significantly decreasing the frequency of uncontrolled spills from
SCDD, the proposed remediations at the IMM site should enable Keswick Dam releases to comply with
the proposed chronic dissolved copper numeric target (which is based on the CTR chronic criterion for
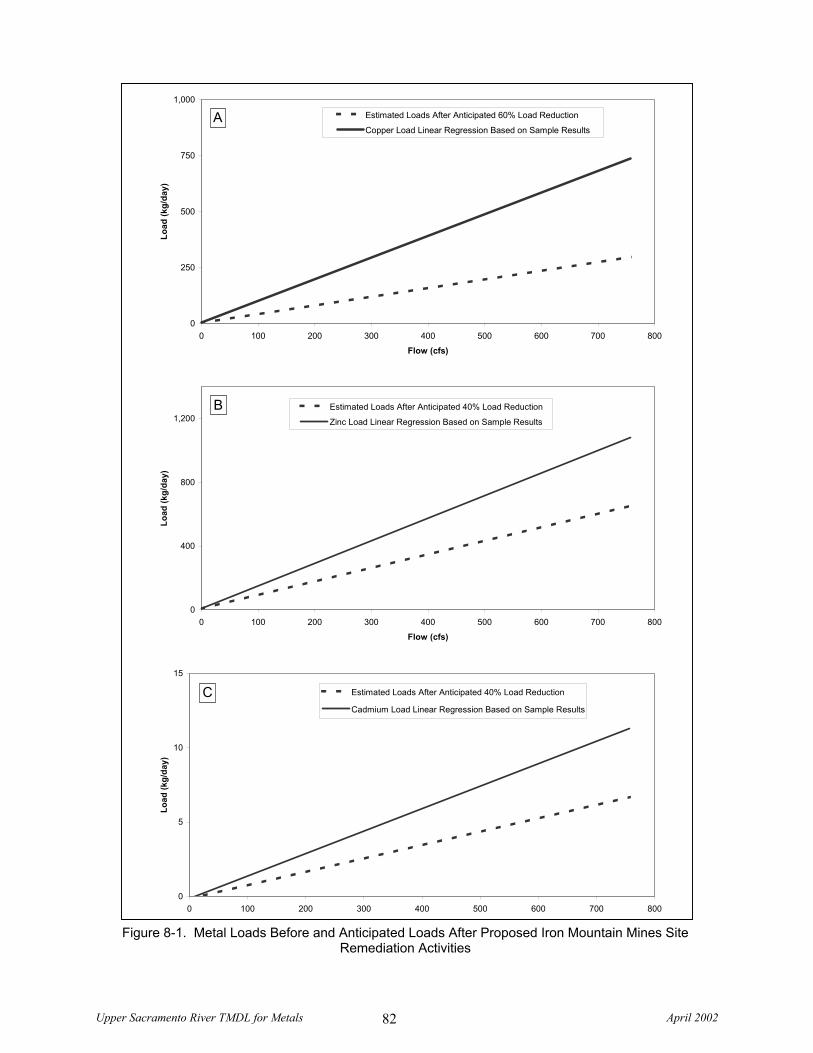
Upper Sacramento River TMDL for Metals April 2002 82
Figure 8-1. Metal Loads Before and Anticipated Loads After Proposed Iron Mountain Mines Site Remediation Activities
0
250
500
750
1,000
0 100 200 300 400 500 600 700 800
Flow (cfs)
Load
(kg/
day)
Estimated Loads After Anticipated 60% Load Reduction
Copper Load Linear Regression Based on Sample ResultsA
0
400
800
1,200
0 100 200 300 400 500 600 700 800
Flow (cfs)
Load
(kg/
day)
Estimated Loads After Anticipated 40% Load Reduction
Zinc Load Linear Regression Based on Sample Results
B
0
5
10
15
0 100 200 300 400 500 600 700 800
Load
(kg/
day)
Estimated Loads After Anticipated 40% Load Reduction
Cadmium Load Linear Regression Based on Sample Results
C
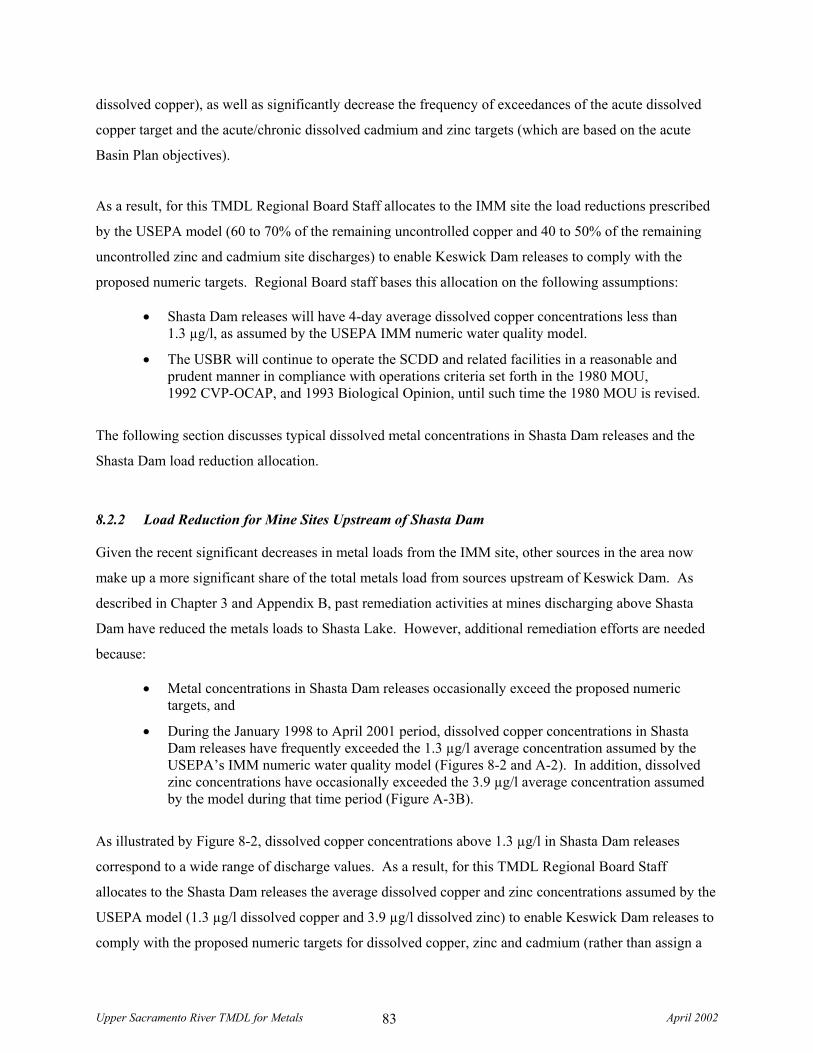
Upper Sacramento River TMDL for Metals April 2002 83
dissolved copper), as well as significantly decrease the frequency of exceedances of the acute dissolved
copper target and the acute/chronic dissolved cadmium and zinc targets (which are based on the acute
Basin Plan objectives).
As a result, for this TMDL Regional Board Staff allocates to the IMM site the load reductions prescribed
by the USEPA model (60 to 70% of the remaining uncontrolled copper and 40 to 50% of the remaining
uncontrolled zinc and cadmium site discharges) to enable Keswick Dam releases to comply with the
proposed numeric targets. Regional Board staff bases this allocation on the following assumptions:
• Shasta Dam releases will have 4-day average dissolved copper concentrations less than 1.3 µg/l, as assumed by the USEPA IMM numeric water quality model.
• The USBR will continue to operate the SCDD and related facilities in a reasonable and prudent manner in compliance with operations criteria set forth in the 1980 MOU, 1992 CVP-OCAP, and 1993 Biological Opinion, until such time the 1980 MOU is revised.
The following section discusses typical dissolved metal concentrations in Shasta Dam releases and the
Shasta Dam load reduction allocation.
8.2.2 Load Reduction for Mine Sites Upstream of Shasta Dam
Given the recent significant decreases in metal loads from the IMM site, other sources in the area now
make up a more significant share of the total metals load from sources upstream of Keswick Dam. As
described in Chapter 3 and Appendix B, past remediation activities at mines discharging above Shasta
Dam have reduced the metals loads to Shasta Lake. However, additional remediation efforts are needed
because:
• Metal concentrations in Shasta Dam releases occasionally exceed the proposed numeric targets, and
• During the January 1998 to April 2001 period, dissolved copper concentrations in Shasta Dam releases have frequently exceeded the 1.3 µg/l average concentration assumed by the USEPA’s IMM numeric water quality model (Figures 8-2 and A-2). In addition, dissolved zinc concentrations have occasionally exceeded the 3.9 µg/l average concentration assumed by the model during that time period (Figure A-3B).
As illustrated by Figure 8-2, dissolved copper concentrations above 1.3 µg/l in Shasta Dam releases
correspond to a wide range of discharge values. As a result, for this TMDL Regional Board Staff
allocates to the Shasta Dam releases the average dissolved copper and zinc concentrations assumed by the
USEPA model (1.3 µg/l dissolved copper and 3.9 µg/l dissolved zinc) to enable Keswick Dam releases to
comply with the proposed numeric targets for dissolved copper, zinc and cadmium (rather than assign a
Upper Sacramento River TMDL for Metals April 2002 84
load-based allocation). Regional Board staff bases this allocation on the assumption that the USBR will
continue to operate the SCDD and related facilities in a reasonable and prudent manner in compliance
with operations criteria set forth in the 1980 MOU, 1992 CVP-OCAP, and 1993 Biological Opinion, until
such time the 1980 MOU is revised.
Figure 8-2. Shasta Dam Releases – Dissolved Copper Concentration and Flow Data for 1995-2001 A. All Available Dissolved Copper Concentration Data for Shasta Dam Releases.
B. Dissolved Copper Concentration Versus Flow. Sources of dissolved cadmium, copper, and zinc to Shasta Lake may include both surface mines and
inundated smelter sites. As noted earlier, another TMDL will address individual sources of dissolved
0
2
4
6
8
10
Oct-95 Apr-96 Oct-96 Apr-97 Oct-97 Apr-98 Oct-98 Apr-99 Oct-99 Apr-00 Oct-00 Apr-01Sample Date
Con
cent
ratio
n (µ
g/l)
USEPA's IMM Water Quality Model AssumptionCTR Criterion Adjusted for Hardness (4-Day Average)Water Quality Objective Adjusted for Hardness (Maximum Concentration)Dissolved Copper Concentration below Shasta DamDissolved Copper Concentration - Estimated (1/2 MDL)
A
0
1
2
3
4
5
6
0 10,000 20,000 30,000 40,000 50,000 60,000 70,000
Flow (cfs)
Con
cent
ratio
n (µ
g/l)
B
Concentration estimated using 1/2 the method detection limit.
Upper Sacramento River TMDL for Metals April 2002 85
cadmium, copper, and zinc to Shasta Lake. Because the assignment of load reductions to individual
mines sites upstream of Shasta Dam will be part of this separate TMDL, Regional Board staff assigns the
metals allocation to Shasta Dam releases; Shasta Dam acts as a monitoring point for the accumulated
loads from all point and nonpoint sources upstream of the dam. Chapter 10 (Implementation Plan)
describes the activities planned for determining the causes of seasonal variations in metals concentrations
in Shasta Dam releases and remediation activities planned for the mines in the Shasta Lake watershed.
8.3 Allocation for Sources between Keswick Dam and Red Bluff
At this time, Regional Board staff does not assign allocations for point and nonpoint sources downstream
of Keswick Dam for this TMDL for three reasons:
1. As described in Chapter 5 (Source Assessment), discharges from Keswick Dam account for the majority of dissolved cadmium, copper, and zinc loads measured in the upper Sacramento River above Bend Bridge. Reductions in metals loads in Keswick Dam releases resulting from remediations at the IMM site, in combination with remediation activities at mines in the Shasta Lake area, are expected to reduce dissolved metal loads and concentrations measured in the Sacramento River between Keswick Dam and Bend Bridge.
2. As demonstrated by Figure 7-4, the Sacramento River below the confluence with Cottonwood and Battle Creeks has a higher assimilative capacity than the river immediately below Keswick Dam because of the addition of dilution water from tributaries downstream of Keswick Dam, and the apparent attenuation of dissolved metals. Figure 7-4 also demonstrates that there is an availability of excess assimilative capacity in the Sacramento River below Cottonwood and Battle Creeks.
3. NPDES Permits, Waste Discharge Requirements, Cleanup and Abatement Orders, and other regulations require the point and nonpoint source dischargers to operate using best management practices. The dischargers are expected to meet effluent limits in these requirements.
As described in Chapter 10, Regional Board staff will require NPDES-permitted dischargers to monitor
for dissolved metals. Staff will evaluate the monitoring results and assign wasteload allocations as
needed to ensure that the Sacramento River between Keswick Dam and Red Bluff complies with the
proposed numeric targets.
Upper Sacramento River TMDL for Metals April 2002 86
9 MARGIN OF SAFETY, SEASONAL VARIATION, & CRITICAL CONDITIONS
9.1 Margin of Safety
The TMDL process involves the establishment of a margin of safety (MOS) to account for data
uncertainty, growth, and critical conditions. The MOS can be derived implicitly, through conservative
assumptions about numeric targets, or explicitly, through reservation of unallocated load. This technical
TMDL incorporates two types of implicit MOSs.
The first set of implicit MOSs is incorporated in the numeric targets:
• The proposed acute and chronic cadmium and zinc numeric targets, and acute copper numeric target, are equivalent to the Basin Plan water quality objectives, which are based on 4-day toxicity tests conducted on aquatic species by CDFG. These targets have two types of implicit MOS. First, the objectives are based on 4-day (chronic) toxicity tests, rather than instantaneous (acute) toxicity tests. Second, the objectives are equal to one tenth of the median lethal concentrations during 4 days (96-hour LC50 values). CDFG determined that such objectives would safely reflect maximum (instantaneous) metal concentrations tolerated for unimpaired aquatic life (Finlayson and Verrue, 1982; Finlayson and Wilson, 1989).
• The proposed chronic copper numeric target is equivalent to the CTR chronic criterion for copper, which the USEPA adapted from the CTR maximum concentration criteria using an acute-chronic ratio developed for sensitive fish and invertebrate species (USEPA, 1996b). The USEPA incorporated a MOS in both the calculation of the maximum concentration criteria and the acute-chronic ratio (refer to Footnote #23 in Section 6.3.2). The USEPA determined that the chronic CTR copper criterion would provide a MOS adequate to protect freshwater aquatic organisms so long as the four-day average concentration of copper does not exceed the chronic copper criterion more than once every three-year period (USEPA, 2000a).
• As noted in Chapter 6, the chronic cadmium and zinc numeric targets for this TMDL are equivalent to the acute Basin Plan water quality objectives for cadmium and zinc because the Basin Plan objectives are lower (i.e., more protective of aquatic species) than the chronic CTR criteria for cadmium and zinc. As with the chronic copper criterion, the USEPA determined that chronic CTR cadmium and zinc criteria would provide a MOS adequate to protect freshwater aquatic organisms so long as the four-day average concentrations of cadmium and zinc do not exceed the chronic cadmium and zinc criterion more than once every three years (USEPA, 2000a). Presumably, the Basin Plan objectives would be equally protective.
The second implicit MOS is incorporated in the USEPA’s numerical water quality model designed to
predict the effectiveness of various remedial alternatives at the IMM site with respect to limiting the
frequency of SCDD spills and exceedances of the numeric targets below Keswick Reservoir:
• The USEPA generally assumed that uncertainties inherent in real-time operation of Central Valley Project facilities could be addressed by targeting SCDD operations to meet a split
Upper Sacramento River TMDL for Metals April 2002 87
operational efficiency that varies the assumed efficiency from 50 to 75% depending on the Spring Creek Reservoir inflows of the Basin Plan objectives and CTR criteria.
• The USEPA anticipates that the collection and treatment of baseflow from Slickrock Creek would remove essentially all Slickrock Creek area source AMD discharge load. However, the USEPA’s water quality model generally relied upon an efficiency of 90% as a conservative estimate; the USEPA anticipates that the remedy will be more effective than that estimate.
9.2 Seasonal Variation & Critical Conditions
Data collected in the 1990s indicate that dissolved copper and zinc concentrations have considerable
seasonal variability. Occasional exceedances of water quality standards occur each year on the
Sacramento River below Shasta and Keswick Dams, most often during the December-to-April period.
The exceedances typically corresponded to the concurrent occurrence of three critical short-term
conditions:
1. Times of heavy rainfall runoff that causes the Spring Creek Reservoir to reach capacity and SCDD to have an uncontrolled spill.
2. Times that Shasta Dam releases higher than normal concentrations of dissolved cadmium, copper, and zinc. For example, in March and April 2001, Shasta Dam releases had dissolved copper concentrations that exceeded the CTR criterion of 4.1 µg/l and approached the Basin Plan objective of 5.6 µg/l. In addition, Shasta Dam releases that have metal concentrations exceeding the levels assumed by the USEPA’s IMM numeric water quality model may lead to exceedances of the proposed numeric targets downstream of Keswick Dam.
3. Times that the Shasta Dam or Spring Creek Power Plant dilution releases are reduced for the purposes of storage and flood control.
Chapters 8 (Load Reductions Allocations) and 10 (Implementation Plan) describe how the frequency of
these critical conditions can be decreased, and how, when the conditions do occur, they can be mediated
to prevent an exceedance of the numeric targets. The proposed construction of the SRCRD and treatment
of Slickrock Creek baseflow at the IMM site would significantly reduce the likelihood of the first critical
condition (uncontrolled spills) occurring in the future. Chapter 10 provides a description of the USEPA’s
construction schedule for the SRCRD and related remediation components. Chapter 10 also describes the
activities planned for determining the causes of seasonal variations in metals concentrations in Shasta
Dam releases and remediation activities planned for mines upstream of Shasta Dam. These activities will
significantly reduce the likelihood of the second critical condition (higher than normal metal
concentrations in Shasta Dam releases) occurring in the future. The second critical condition possibly
may be avoided by selecting Shasta Dam withdrawals at different levels.
Upper Sacramento River TMDL for Metals April 2002 88
Other potential critical conditions include interruptions in AMD treatment (particularly at the IMM site),
accidents, natural catastrophes (e.g., earthquakes), and willful malicious acts (e.g., acts of terrorism and
illegal dumping). The 1980 MOU, which outlines dam operations necessary to minimize Spring Creek
toxicity problems, addresses these other critical conditions. On several occasions, the USBR has been
able to coordinate releases from Shasta Dam and SCPP to prevent exceedances of the Basin Plan
objectives during the past few years when there have been uncontrolled spills from SCDD. Chapter 10
evaluates the 1980 MOU measures that may need to be updated, depending upon the effectiveness of the
proposed remediation activities during the next five years.
Upper Sacramento River TMDL for Metals April 2002 89
10 IMPLEMENTATION
Regional Board staff expects that the proposed remediation activities scheduled for IMM and other mine
sites during the next five years will address exceedances of the proposed numeric targets on the
Sacramento River below Keswick Dam. Staff based this determination on the following:
1. The U.S. Environmental Protection Agency (USEPA) Superfund Program’s water quality modeling indicated that the proposed remediation activities at the IMM site − in coordination with current site remediation activities − would control more than 95% of total IMM site releases and therefore result in significantly decreasing the frequency of numeric target exceedances below Keswick Dam.
2. Anticipated load reductions resulting from ongoing and proposed remediation activities at mines in the Shasta Lake area would improve the water quality of both the Shasta Dam and Keswick Dam releases.
For these reasons, staff proposes the following 5-year TMDL water management strategy in accordance
with this TMDL report and other USEPA and Regional Board remediation plans:
• During the summer of 2001, the USEPA Superfund Program began implementation of proposed remediation activities that include the collection and treatment of AMD-contaminated surface water discharges from the area sources in the Slickrock Creek watershed at the IMM site; the activities will take approximately two years to complete (Sugarek, 2001; Pedri, 2001; USEPA, 1997b).
• Responsible parties will conduct ongoing and proposed remediation activities at mines in the Shasta Lake area.
• Regional Board staff will increase monitoring in Shasta Lake to determine the sources and variability of dissolved metal concentrations in Shasta Dam releases during the past three years. Staff will develop mine remediation and other activities as needed to address Shasta Dam release concentrations that exceed 1.3 µg/l dissolved copper and 3.9 µg/l dissolved zinc.
• Regional Board staff will require NPDES-permitted dischargers to monitor dissolved cadmium, copper, and zinc, and flow to quantify their dissolved metal loads, and if significant loads are detected, staff will establish effluent limits and continuous monitoring in renewed permits.
• USBR, USEPA, Regional Board, and other regional agencies will continue monitoring water quality conditions in upper Sacramento River water.
• Regional Board staff will evaluate the ambient metal concentration data collected by its staff, other agencies, and dischargers to determine whether the remediations enable dissolved metal concentrations in Sacramento River water to comply with the proposed numeric targets. In addition, staff will evaluate dissolved metal loads contributed by NPDES dischargers downstream of Keswick Dam. Staff will coordinate TMDL reviews with USEPA’s 5-Year Reviews for the IMM site scheduled for 2003 and 2008.
• After three years of monitoring data have been collected following the completion of remediation activities at Slickrock Creek, Regional Board staff will work with the USBR,
Upper Sacramento River TMDL for Metals April 2002 90
USEPA, California Department of Fish and Game, and State Water Resources Control Board to revise the 1980 MOU to ensure maximum efficiency in managing releases from the SCDD.
Regional Board staff bases this strategy on the following assumptions:
• The USBR will continue to operate the SCDD and related facilities in a reasonable and prudent manner in compliance with operations criteria set forth in the 1980 MOU, 1992 CVP-OCP, and 1993 Biological Opinion, until such time the 1980 MOU is revised.
• The existing AMD collection and treatment facilities at IMM will be operated to provide maximum removal of metals in accordance with a court-approved consent decree.
• Regional Board staff will enforce existing permits on mines in the Shasta Lake areas to assure maximum removal or containment of heavy metals.
• Responsible parties will increase remediation efforts at mines in the Shasta Lake areas as needed during the next five to ten years.
Based on the evaluation of the magnitude and frequency of exceedance (if any) during the three years
following the completion of the USEPA’s Slickrock Creek remediation activities, Regional Board staff
will consider whether to recommend the removal of the upper Sacramento River from the CWA 303(d)
List (i.e., “delist” the river).
There are several components for implementing and monitoring the control measures required by the
watershed management strategy proposed in this TMDL. The following sections describe these
components in more detail.
10.1 USEPA Superfund Remediation Activities at the IMM Site
The remediation activities described in USEPA’s ROD4 began at the IMM site in the summer of 2001;
the activities will take approximately two years to complete (Sugarek, 2001; Pedri, 2001). The estimated
cost of the remediation is $21.2 million (USEPA, 1997b). Through a court ordered settlement, Aventis
CropSciences (a former owner and operator), has arranged for a private contractor to operate and maintain
the site remedies (RODs 1-4) over the next 30 years, and to pay to the federal and state governments $514
million in 2030 to fund future site costs (USEPA, 2000b). Currently, Iron Mountain Mines, Inc., is the
site owner; the USEPA is the lead oversight agency, and the State is the support agency, for remediation
activities (Sugarek, 2001).
The selected remedy relies on the collection and treatment of additional AMD-contaminated surface water
discharges from the area sources in the Slickrock Creek watershed (USEPA, 1997b). The proposed
Upper Sacramento River TMDL for Metals April 2002 91
remediation should enable treatment of essentially all IMM AMD from the Slickrock Creek area sources,
which comprise approximately 60 to 70% of the remaining uncontrolled copper and 40 to 50% of the
remaining uncontrolled zinc and cadmium releases from the IMM site. Treatment of the Slickrock Creek
AMD should neutralize the acidity of the water and remove more than 99% of the metals. The
concentrations of Slickrock Creek discharges are expected to decrease proportionately under all
hydrologic conditions. The USEPA considers the proposed remediation to be an interim remedy; the
USEPA does not expect that this remediation will address all of the remaining sources of metal releases
from the IMM site.
The proposed remediation has the following components (USEPA, 1997b):
• Construct the Slickrock Creek Retention Dam (SRCRD) and necessary surface water diversion facilities to ensure the collection and storage of contaminated surface runoff and groundwater in the Slickrock Creek watershed.
• Construct facilities to provide controlled releases of contaminated waters from the SRCRD to the AMD conveyance pipeline to the Minnesota Flats treatment plant.
• Construct facilities to divert relatively uncontaminated surface water from the area upstream from the highly disturbed mining area of the Slickrock Creek basin and convey that water around the Slickrock Creek Retention Reservoir. The diversion would also divert stormwater around the retention reservoir and the water from the unmined side of the Slickrock Creek watershed.
• Integrate the collection and conveyance of the Old/No. 8 Mine Seep AMD to the treatment plant into the operation of the reservoir, including consideration of emergency failure scenarios.
• Construct an erosion control structure for the hematite piles37 consistent with California mining waste requirements.
• Construct one or more sedimentation basin(s) or other USEPA approved control structures in the Slickrock Creek watershed to minimize sedimentation of the Slickrock Creek Retention Reservoir and to ensure proper functioning of the controlled release facilities.
• Upgrade the hydraulic capacity of the existing pipeline (or if necessary construct a new pipeline) from Slickrock Creek to the Boulder Creek crossing as required to ensure adequate reliable capacity to convey Slickrock Creek and Old/No. 8 Mine Seep AMD.
• Construct an additional pipeline to reliably convey Slickrock Creek and Old/No. 8 Mine Seep AMD from the Boulder Creek Crossing to the treatment plant.
37 Significant portions of the gossan cap on Iron Mountain were mined to recover gold and silver in a heap leaching operation.
The finely crushed wastes from the heap leaching operations were dumped into Hogtown Gulch (a tributary to Slickrock Creek), forming the enormous waste piles that are commonly called “the hematite piles”. The hematite piles are actively eroding into Slickrock Creek and contribute approximately 1% of the metals in Slickrock Creek (USEPA, 1997b)
Upper Sacramento River TMDL for Metals April 2002 92
• Modify the Minnesota Flats treatment plant to ensure proper treatment, of the Slickrock Creek area AMD discharges in conjunction with AMD flows collected from other IMM areas.
• Construct a tunnel to provide for gravity discharge of the high volumes of effluent from the Minnesota Flats treatment plant to Spring Creek below the upper Spring Creek diversion to Flat Creek.
• Construct facilities to assure collection of significant identified sources (including but not limited to seeps from Brick Flat Pit and the hematite piles) and convey those releases to the Slickrock Creek Retention Reservoir.
• Perform long-term operations and maintenance of all components.
The SRCRD and reservoir would be within the Slickrock Creek drainage on Iron Mountain, directly
downstream of the most heavily disturbed mining area in the watershed (USEPA, 1997b). Inflows
include:
• surface-water runoff from the highly disturbed mining areas,
• flows from the former open pit mine and current sludge disposal site,
• flows from Slickrock Creek,
• flows from the Old No. 8 Mine Seep, and
• flows from the hematite pile area.
The SRCRD would be located approximately 200 feet upstream of the hematite piles. A dam at this
location would collect drainage from an area of approximately 546 acres; however, 387 acres of this
drainage area would be intercepted by a clean-water diversion (modified as necessary) and discharged
into Slickrock Creek below the proposed SRCRD. An additional 44 acres of drainage above Brick Flat
Pit (an open pit to be filled with dewatered sludge and tailings to prevent accumulation of water) is also
currently collected and diverted into Slickrock Creek below the proposed SRCRD. The potential AMD-
generating area of the Slickrock Creek drainage is therefore approximately 115 acres. The reservoir
developed behind the SRCRD will temporarily store AMD before it is conveyed by pipeline to the
Minnesota Flats treatment plant. The SRCRD will be sized to contain 100-year storms, which would
require a reservoir capacity of at least 170 acre-feet. Preliminary information indicates that the SRCRD
would be approximately 105 feet high (75 feet above the existing streambed).
The USEPA will continue to evaluate the need for, and technical feasibility of, additional remediation
activities to address area source AMD discharges from the Boulder Creek drainage (the remaining 5% of
total site releases). In addition, the USEPA has begun preliminary work in support of what is anticipated
to be the next Remedial Investigation/Feasibility Study for the site, which is to evaluate the removal of
Upper Sacramento River TMDL for Metals April 2002 93
sediment that has accumulated in the SCAKR, the Spring Creek Reservoir, and the main channel of
Keswick Reservoir (Rae, 1998; USEPA, 2001a; Sugarek, 2001).
10.2 Remediation Activities at Mines in the Shasta Lake Watershed
Table 10-1 summarizes the status of remediation activities at Shasta Lake area mines. Appendix B
provides more information about past and proposed future remediation activities for these mines. In
addition, Regional Board staff will increase monitoring in Shasta Lake (e.g., at multiple depths and
location throughout the lake pool) to determine any additional metal sources and to better define metal
transport in the lake. Regional Board staff will develop additional mine remediation and other activities
as needed to address metal concentrations in Shasta Dam releases that exceed 1.3 µg/l dissolved copper
and 3.9 µg/l dissolved zinc.
10.3 Pollution Control Activities for Sources between Keswick Dam and Red Bluff
Afterthought Mine discharges to Little Cow Creek approximately 23 miles upstream of the Little Cow
Creek – upper Sacramento River confluence, which is approximately 2.5 miles east of Anderson.
Greenhorn Mine discharges to Willow Creek, a tributary to Whiskeytown Lake, which ultimately drains
to either Spring Creek via Spring Creek Tunnel, or to Sacramento River downstream of Keswick Dam via
Clear Creek. The Regional Board has issued NPDES Permits and Cease and Desist Orders to these
mines. Because of the responsible parties’ inaction, the Regional Board will pursue enforcement actions
to achieve some level of remediation (Woodward, 2001).
Regional Board staff will continue to review monitoring data collected by the City of Redding for its
municipal treatment plants. As noted in Chapter 5, little-to-no monitoring information was available for
other NPDES-permitted dischargers. Regional Board staff will require selected NPDES-permitted
dischargers to monitor dissolved cadmium, copper, and zinc, and flow to better quantify loads.
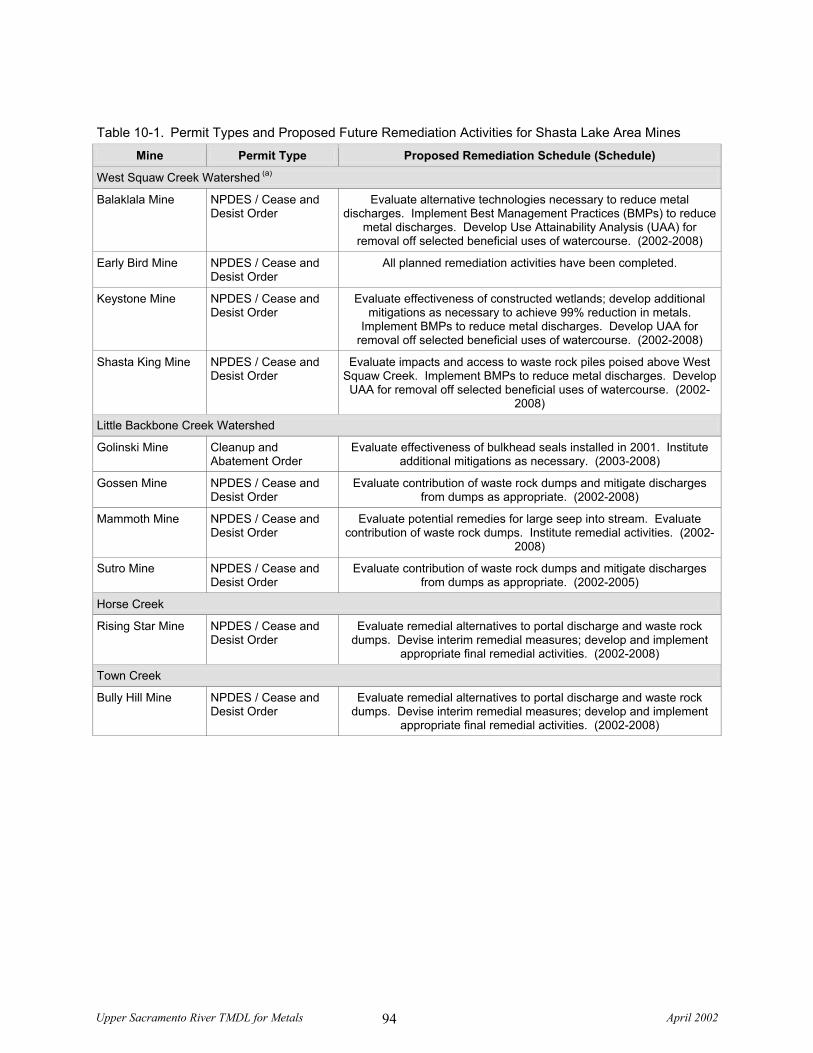
Upper Sacramento River TMDL for Metals April 2002 94
Table 10-1. Permit Types and Proposed Future Remediation Activities for Shasta Lake Area Mines Mine Permit Type Proposed Remediation Schedule (Schedule)
West Squaw Creek Watershed (a)
Balaklala Mine NPDES / Cease and Desist Order
Evaluate alternative technologies necessary to reduce metal discharges. Implement Best Management Practices (BMPs) to reduce
metal discharges. Develop Use Attainability Analysis (UAA) for removal off selected beneficial uses of watercourse. (2002-2008)
Early Bird Mine NPDES / Cease and Desist Order
All planned remediation activities have been completed.
Keystone Mine NPDES / Cease and Desist Order
Evaluate effectiveness of constructed wetlands; develop additional mitigations as necessary to achieve 99% reduction in metals.
Implement BMPs to reduce metal discharges. Develop UAA for removal off selected beneficial uses of watercourse. (2002-2008)
Shasta King Mine NPDES / Cease and Desist Order
Evaluate impacts and access to waste rock piles poised above West Squaw Creek. Implement BMPs to reduce metal discharges. Develop UAA for removal off selected beneficial uses of watercourse. (2002-
2008)
Little Backbone Creek Watershed
Golinski Mine Cleanup and Abatement Order
Evaluate effectiveness of bulkhead seals installed in 2001. Institute additional mitigations as necessary. (2003-2008)
Gossen Mine NPDES / Cease and Desist Order
Evaluate contribution of waste rock dumps and mitigate discharges from dumps as appropriate. (2002-2008)
Mammoth Mine NPDES / Cease and Desist Order
Evaluate potential remedies for large seep into stream. Evaluate contribution of waste rock dumps. Institute remedial activities. (2002-
2008)
Sutro Mine NPDES / Cease and Desist Order
Evaluate contribution of waste rock dumps and mitigate discharges from dumps as appropriate. (2002-2005)
Horse Creek
Rising Star Mine NPDES / Cease and Desist Order
Evaluate remedial alternatives to portal discharge and waste rock dumps. Devise interim remedial measures; develop and implement
appropriate final remedial activities. (2002-2008)
Town Creek
Bully Hill Mine NPDES / Cease and Desist Order
Evaluate remedial alternatives to portal discharge and waste rock dumps. Devise interim remedial measures; develop and implement
appropriate final remedial activities. (2002-2008)
Upper Sacramento River TMDL for Metals April 2002 95
10.4 USBR Dam Operations
The 1980 MOU between the USBR, SWRCB, and CDFG may not be adequate for the following reasons:
• The 1980 MOU operations objectives are higher (i.e., less protective of aquatic life) than the numeric targets proposed in this TMDL, which are based on the Basin Plan water quality objectives for copper and zinc, and the chronic CTR criterion for copper.
• The 1980 MOU does not include operations objectives for cadmium.
• The 1980 MOU is based on the assumption that 50% of the dissolved metals will form precipitates in the SCAKR and Keswick Reservoir; recent USEPA studies indicate that the precipitation rate is approximately 35% under most conditions.
However, in recent years, USBR staff has voluntarily targeted the more stringent Basin Plan water quality
objectives for dissolved metal concentrations for the upper Sacramento River in addition to the
1980 MOU objectives. USBR staff also has consulted with other federal and state agencies in order to
improve SCDD operations and target the Basin Plan objectives when CVP operations allow. In addition,
the USBR has developed an operations strategy for the SCPP to minimize mobilization of contaminated
sediments and metal precipitates. The USBR continues to operate the SCDD, Shasta Dam, and SCPP to
maximize the dilution of SCDD releases to the extent feasible, in compliance with operations criteria set
forth in the 1980 MOU, 1992 CVP-OCAP, and 1993 Biological Opinion.
Nevertheless, the USBR will continue to have water management goals (e.g., flood control and other CVP
requirements) for Shasta Lake and Whiskeytown Lake releases that could conflict with the requirement of
diluting AMD in the upper Sacramento River in an effort to comply with the Basin Plan water quality
objectives and CTR criteria for dissolved metal concentrations below Keswick Dam and downstream
reaches. After three years of monitoring data have been collected following the completion of
remediation activities at Slickrock Creek, the USBR will work with the Regional Board staff, USEPA,
CDFG, and the State Water Resources Control Board to revise the 1980 MOU to take into account the
performance of the USEPA remedies in RODs 1-4, new technology, and new information (e.g., the
Regional Board staff evaluation of the variability of dissolved metal concentrations in Shasta Dam
releases; see below). The purpose of revisions to the 1980 MOU would be to ensure maximum efficiency
in managing releases from the SCDD.
10.5 Monitoring
Regional Board staff will review the monitoring data collected by the USBR, City of Redding, USEPA,
and Regional Board staff on an annual basis to ensure dissolved metals concentrations in the upper
Upper Sacramento River TMDL for Metals April 2002 96
Sacramento River comply with this TMDL. Regional Board staff will also increase sampling in Shasta
Lake to identify within the lake the extent of increased dissolved metal concentrations. In addition, staff
will (1) evaluate dissolved metal loads contributed by NPDES dischargers downstream of Keswick Dam
and (2) continue to assess discharges from mine sites throughout the watershed (e.g., under NPDES
Permits and Cease and Desist Orders). Staff expects that the remediation activities described in this
chapter will enable dissolved metal concentrations in the upper Sacramento River between Keswick Dam
and Red Bluff Diversion Dam to comply with the proposed numeric targets. If dissolved metal
concentrations still exceed the criteria after the implementation of this five-year water management
strategy, staff will work with the USEPA, USBR, and responsible parties to develop additional
remediation activities.
Upper Sacramento River TMDL for Metals April 2002 97
11 PUBLIC PARTICIPATION
Regional Board staff received data and background information from the USEPA, USGS, USBR, and the
City of Redding. In addition, staff solicited public participation during public comment periods by:
• Notifying interested parties (e.g., State, federal and local agencies, mine owners, NPDES-permitted dischargers, and other interested persons) and distributing copies of the draft TMDL.
• Posting the draft report to the Regional Board website.
• Responding to the public’s written and verbal comments.
Staff incorporated relevant comments and additional data received during the public comment periods in
this final TMDL report. Appendix H presents responses to comments and copies of the written
comments.
Upper Sacramento River TMDL for Metals April 2002 98
12 REFERENCES
Alpers, C.N., R.C. Antweiler, H.E. Taylor, P.D. Dileanis, and J.L. Domagalski, 2000. Metals sources downstream of Keswick Dam. In Metals Transport in the Sacramento River, California, 1996-1997, Volume2:Interpretation of Metals Loads. U.S. Geological Survey Water-Resources Investigation Report 00-4002. Sacramento, CA.
Ames, M. 2001. Unpublished data (electronic and hardcopy) mailed by Marcia Ames (Industrial Waste Analyst, City of Redding Public Works Department) to Pat Vellines (Engineering Geologist, California Regional Water Quality Control Board, Central Valley Region, Sacramento Office) from April to May, 2001, regarding low level dissolved metal concentrations for the Sacramento River at Caldwell Park and the City of Redding's WWTPs effluents.
CH2M Hill. 1992. Public Comment Environmental Endangerment Assessment – Iron Mountain Mine, Redding, California. Report prepared by CH2M Hill (Redding, California) for the U.S. Environmental Protection Agency (Region 9, San Francisco). May 1992.
CH2M Hill. 1998. Site Evaluation – Iron Mountain Mine. Technical memorandum prepared for Richard Sugarek (Remedial Project Manager, USEPA Region 9 Superfund Division) by John Spitzley (Project Manager, CH2M Hill) on September 25, 1998.
CH2M Hill. 1997. Metal Concentration in Spring Creek Powerhouse and Shasta Dam Releases. Technical memorandum prepared for Richard Sugarek (Remedial Project Manager, USEPA Region 9 Superfund Division) by John Spitzley (Project Manager, CH2M Hill). In Response to Comments on the Water Management Feasibility Study and Addendum, Iron Mountain Mine, California, Volume 2 of 5. Prepared by CH2M Hill (Redding, California) for U.S. Environmental Protection Agency (Region 9, San Francisco), September 30, 1997.
CH2M Hill. 2001. Access database that compiles upper Sacramento River water quality data collected by CH2M Hill, U.S. Bureau of Reclamation, Central Valley Regional Water Quality Control Board, and California Department of Fish and Game. Database prepared by CH2M Hill for USEPA Superfund Program, Region 9 (San Francisco). Database on compact disc mailed by CH2M Hill (John Spitzley, Project Manager, Redding) to Central Valley Regional Water Quality Control Board (Michelle Wood, Environmental Scientist, Sacramento) on April 24, 2001.
Cooke, J. and V. Connor. Toxicants in Surface Waters of the Sacramento River Watershed. Staff report prepared for the Central Valley Regional Water Quality Control Board by the Central Valley Regional Water Quality Control Board and the University of California, Davis. December 1998.
Craig, S.J. and R.A. Elliott. 1999. City of Redding Low Level Metals Monitoring. Report prepared for the Central Valley Regional Water Quality Control Board by the City of Redding Public Works Department, Field Operations Division, summarizing low level dissolved metal concentrations for the Sacramento River at Caldwell Park and the City of Redding's WWTPs effluents. July 29, 1999.
CRA CERES. 2001. Department of Fish and Game, Plaintiff and Appellant, versus Anderson-Cottonwood Irrigation District, Defendant and Respondent. 8 Cal.App.4th 1554, No. C012197, Court of Appeal, Third District, California. August 24, 1992. California Resources Agency, California Environmental Resources Evaluation System (CRA CERES). Available: http://www.ceres.ca.gov/theme/env_law/water_law/cases/Anderson-Cottonwood.html. Accessed: May 18, 2001
CVRWQCB. 1997. Waste Discharge Requirements for Millennium Holding, Inc. – Bully Hill and Rising Star Mines, Shasta County (Order No. 97-214, NPDES No. CA0084212). Central Valley Regional Water Quality Control Board (CVRWQCB). Redding, CA.
Upper Sacramento River TMDL for Metals April 2002 99
CVRWQCB. 1998a. The Water Quality Control Plan (Basin Plan) for the California Regional Water Quality Control Board - Central Valley Region. Fourth Edition. Central Valley Regional Water Quality Control Board (CVRWQCB). Sacramento, CA. October 24, 1997.
CVRWQCB. 1998b. Loads of Salt, Boron, and Selenium in the Grassland Watershed and Lower San Joaquin River, October 1985 to September 1995, Volume I: Load Calculation. Central Valley Regional Water Quality Control Board (CVRWQCB). Sacramento, CA.
CVRWQCB. 1998c. Metals Concentrations, Loads and Toxicity Assessment in the Sacramento/San Joaquin Delta: 1993-1995. Central Valley Regional Water Quality Control Board (CVRWQCB). Sacramento, CA.
Domagalski, J.L., P.D. Dileanis, D.L. Knifong, and C.N. Alpers. 2000. Description of the Sacramento River Basin and ongoing studies. In Metals Transport in the Sacramento River, California, 1996-1997, Volume 1: Methods and Data. U.S. Geological Survey Water-Resources Investigation Report 99-4286. C.N. Alpers, H.E. Taylor, and J.L. Domagalski (editors). Sacramento, CA.
DWR. 1985. The Greenhorn and Afterthought Mines – A Plan for the Control and Abatement of Acid and Heavy Metal Pollution; Shasta County, California. California Department of Water Resources, Northern District (DWR), memorandum report prepared for the Central Valley Regional Water Quality Control Board. July 1985.
Finlayson, B.J. and K.M. Verrue. 1982. Toxicities of copper, zinc, and cadmium mixtures to juvenile chinook salmon. Transactions of the American Fisheries Society. 111: 645-650.
Finlayson, B.J. and D.C. Wilson. 1989. Evaluation of lethal levels, release criteria, and water quality objectives for an acid-mine waste. In Aquatic Toxicology and Environmental Fate: Eleventh Volume. ASTM STP 1007. G.W. Suter II and M.A. Lewis (editors). Philadelphia: American Society for Testing and Materials, pp. 189-203.
Grubbs, G. 2000. Letter from Geoffrey H. Grubbs (Director, Office of Science and Technology, U.S. Environmental Protection Agency, Washington D.C.) to Michael T. Llewelyn, (Administrator, Water Quality Division, Department of Environmental Quality, Portland, Oregon) dated August 24, 2000, providing clarification on the applicability of the Clean Water Act requirement for States to adopt and implement an antidegradation policy. Available: http://www.epa.gov/waterscience/library/wqstandards/antidegrad.html. Revised: October 31, 2000. Accessed: May 15, 2001.
Hackel, O. 1966. Summary of the geology of the Great Valley. In Geology of Northern California. Bulletin 190. E.H. Bailey (editor). San Francisco: California Division of Mines and Geology, pp. 217-238.
Hagler Bailley Consulting, Inc. 1996. Preliminary Toxicological Evaluation, U.S. v. Iron Mountain Mines, Inc. – Volume 1: Data Report. Report prepared for the California Office of the Attorney General. December 12, 1996.
Hagler Bailley Services, Inc. 1998. Data Report: Acute Copper Toxicity to Salmonids in the Surface Water in the Vicinity of the Iron Mountain Mine, California – Volume 1: Study Objectives, Methods Summary, Water Chemistry Characterization and Toxicity Test Results. Report prepared for the California Office of the Attorney General. July 27, 1996.
Heiman, D.R. 1989. Iron Mountain Mines Monitoring Report – July 1988 Through June 1989. Central Valley Regional Water Quality Control Board, Redding Office, Staff Report. October 12, 1989.
Heiman, D.R. 2001. Microsoft Excel files on diskettes with upper Sacramento River water quality data collected by the Central Valley Regional Water Quality Control Board, Redding Office. Diskettes
Upper Sacramento River TMDL for Metals April 2002 100
mailed by Dennis Heiman (Environmental Scientist) to Patricia Vellines (Engineering Geologist, Central Valley Regional Water Quality Control Board, Sacramento Office), April 2001.
Jorgenson, P. 2000. World’s Most Acidic Waters Are Found Near Redding, California. U.S. Geological Survey press release. March 17, 2000. Available: http://ca.water.usgs.gov/acid/. Accessed: April 10, 2001.
Manuel, K.. 2001. E-mail correspondence between Kent Manuel (Senior Planner, City of Redding Planning Division) and Patricia Vellines (Engineering Geologist, California Regional Water Quality Control Board, Central Valley Region, Sacramento Office) via Mey Wong (Associate Water Resource Control Engineer, California Regional Water Quality Control Board, Central Valley Region, Redding Office) on June 4, 2001, regarding the City of Redding Land Classifications for Stormwater Calculations.
Michny, F. 2001. Letter from Frank Michny (Regional Environmental Officer, Mid-Pacific Regional Office) to Patricia Vellines (Engineering Geologist, Regional Board Sacramento River Mercury TMDL Unit) dated November 20, 2001, providing comments on the September 2001 Upper Sacramento River TMDL for Cadmium, Copper and Zinc Draft Report.
Mitchell, M. 2001. E-mail correspondence between Matthew Mitchell (U.S. Environmental Protection Agency, Region 9 Clean Water Act, Criteria and Standards Branch, San Francisco) and Betty Yee (Environmental Scientist, California Regional Water Quality Control Board, Central Valley Region, Sacramento Office) on May 15, 2001, regarding the comparison and use of Basin Plan water quality objectives and USEPA CTR criteria.
Montoya, B. and X. Pan. 1992. Inactive Mine Drainage in the Sacramento Valley, California. California Regional Water Quality Control Board, Central Valley Region. Sacramento, CA. Staff report. July 1992.
NMFS. 1993. Biological Opinion for the Operation of the Federal Central Valley Project and the California State Water Project. National Marine Fisheries Service. February 12, 1993.
NOAA. 1989. Iron Mountain Mines – Findings of Fact. National Oceanic and Atmospheric Administration (NOAA). Preliminary Natural Resource Survey. July 28, 1989.
Nordstrom, D.K. and C.N. Alpers. 1999. Negative pH, efflorescent mineralogy, and consequences for environmental restoration at the Iron Mountain Mines Superfund site, California. Paper presented at the National Academy of Sciences colloquium, Geology, Mineralogy, and Human Welfare, November 8-9, 1998, Irvine, California. Available: PNAS Online, http://www.pnas.org/cgi/content/abstract/96/7/3455. Accessed: April 10, 2001.
OMR. 2000. California’s Abandoned Mines – A Report on the Magnitude and Scope of the Issue in the State. California Department of Conservation, Office of Mine Reclamation, Abandoned Mine Lands Unit (OMR). Sacramento, CA. June 2000.
Pedri, J. 2001. Meeting between James Pedri (Executive Officer, Regional Water Quality Control Board, Central Valley Region, Redding Office), Jerrold Bruns (Environmental Program Manager, California Regional Water Quality Control Board, Central Valley Region, Sacramento Office), and other Regional Board staff on August 10, 2001, regarding the status of the upper Sacramento River TMDL and implementation measures.
Poland, J.F. and R.E. Evenson. 1966. In Geology of Northern California. Bulletin 190. E.H. Bailey (editor). San Francisco: California Division of Mines and Geology, pp. 239-248.
Rae, K. 1998. Reclamation and the Iron Mountain Mines Superfund Site. U.S. Bureau of Reclamation (USBR) paper in Proceedings from the Non-Point Source Water Quality Pollution Conference,
Upper Sacramento River TMDL for Metals April 2002 101
September 2-4, 1998, Portland, Oregon. Conference and proceedings sponsored by USBR. Available: http://www.usbr.gov/wquality/wqhome/Conference/. Accessed: February 20, 2001.
Reyes, E. 1994. A Review of Copper, Cadmium, and Zinc Toxicity in Aquatic Organisms. Central Valley Regional Water Quality Control Board. Sacramento, CA. Staff Report. October 1994.
Schwarzbach, S. 1993. Copper, Zinc, and Cadmium in livers of Adult Winter-Run Chinook Salmon (Oncorhynchus tshawytscha) Collected from the Sacramento River in 1991. U.S. forest Fish and Wildlife Service, Ecological Services, Sacramento Field Office. Draft staff report. March 1993.
SHN. 2001. Use Attainability Analysis – West Squaw Creek Watershed, Shasta County, California. Report prepared by SHN Consulting Engineers & Geologists, Inc. (SHN) for Mining Remedial Recovery Company. Redding, CA. January 2001.
SMI. 1996. Preliminary Characterization of Water Quality and Sources of Metals, West Squaw Creek, Shasta County, California. Report prepared by Shepard Miller, Inc. (SMI) for Mining Remedial Recovery Company. Fort Collins, CO. July 1, 1996.
Smith, D. 2000. Guidance for Developing TMDLs in California. U.S. Environmental Protection Agency, Region 9. San Francisco, CA. January 7, 2000.
Smith, D. and R. Sugarek. 2001. Letter from David Smith (TMDL Team Leader, USEPA Region 9 Water Division) and Richard Sugarek (Remedial Project Manager, USEPA Region 9 Superfund Division) to Patrick Morris (Senior WRC Engineer, Regional Board Sacramento River Mercury TMDL Unit) dated December 18, 2001, providing comments on the September 2001 Upper Sacramento River TMDL for Cadmium, Copper and Zinc Draft Report.
Stephan, C.E., D.I. Mount, D.J. Hansen, J.H. Gentile, G.A. Chapman, and W.A. Brungs. 1985. Guidelines for Deriving Numerical National Water Quality Criteria for the Protection of Aquatic Organisms and Their Uses. U.S. Environmental Protection Agency, Office of Research and Development, Environmental Research Laboratories. Duluth, MN, Narragansett, RI, and Corvallis, OR.
Sugarek, R. 2001. Telephone conversation between Rick Sugarek (Superfund Project Manager, U.S. Environmental Protection Agency, Region 9, San Francisco) and Michelle Wood (Environmental Scientist, California Regional Water Quality Control Board, Central Valley Region, Sacramento) on April 11, 2001, regarding past, present, and future remediation measures for the Iron Mountain Mines site and available water quality data. (Record of conversation in CVRWQCB Upper Sacramento River Metals TMDL project file.)
Sugarek, R. 2002. Telephone conversation between Rick Sugarek (Superfund Project Manager, U.S. Environmental Protection Agency, Region 9, San Francisco) and Michelle Wood (Environmental Scientist, California Regional Water Quality Control Board, Central Valley Region, Sacramento) on January 17, 2002, regarding IMM water quality model assumptions about metal concentrations of Shasta Dam releases. (Record of conversation in CVRWQCB Upper Sacramento River Metals TMDL project file.)
SWRCB. 1968. Resolution No. 68-16: Statement of Policy with Respect to Maintaining High Quality of Waters in California. State Water Resources Control Board (SWRCB) resolution. Sacramento, CA. October 28, 1968.
SWRCB, CDFG, and USBR. 1980. Memorandum of Understanding Among the State Water Resources Control Board, United States Water and Power Resources Service, and Department of Fish and Game to Implement Actions to Protect the Sacramento River System from Heavy Metal Pollution from Spring Creek and Adjacent Watersheds. State Water Resources Control Board (SWRCB), California Department of Fish and Game (CDFG), and U.S. Department of the Interior, U.S. Water and Power Resources Service (USBR). January 16, 1980.
Upper Sacramento River TMDL for Metals April 2002 102
TopoZone. 2001. California 7.5 Minute Topographic Quadrangles, as presented by TopoZone.com (© 2000 Maps a la carte, Inc.). Available: http://www.topozone.com/default.asp. Accessed: May 18, 2001.
USBR. 1992. Long-Term Central Valley Project Operations Criteria and Plan CVP-OCAP. U.S. Bureau of Reclamation, Mid-Pacific Region (USBR). Sacramento, California. October 1992.
USBR. 2001. U.S. Bureau of Reclamation DataWeb: Power Plants, Dams & Reservoirs. U.S. Bureau of Reclamation (USBR). Available: http://dataweb.usbr.gov/. Accessed: May 18, 2001.
USEPA. 1976. Quality Criteria for Water. U.S. Environmental Protection Agency (USEPA). Washington, D.C.
USEPA. 1980. Ambient Water Quality Criteria. Copper, PB 81-117475; Zinc, PB 81-117897; Cadmium, PB 81-117368. U.S. Environmental Protection Agency (USEPA). Washington, D.C.
USEPA. 1996a. U.S. EPA Proposes Plan to Protect Sacramento River. U.S. Environmental Protection Agency (USEPA), Region 9 News Release. San Francisco, CA. May 3, 1996. Available: http://www.epa.gov/region09/. Accessed: March 21, 2001.
USEPA. 1996b. Water Quality Criteria Documents for the Protection of Aquatic life in Ambient Water, 1995 Updates. U.S. Environmental Protection Agency (USEPA), Office of Water, Document EPA-820-B-96-001. September 1996. Available: http://www.epa.gov/clariton/clhtml/pubalpha.html. Accessed: May 9, 2001.
USEPA. 1997a. Mercury Study Report to Congress Vol. 7: Characterization of Human Health and Wildlife Risks from Mercury Exposure in the United States. U.S. Environmental Protection Agency (USEPA), Office of Air Quality Planning & Standards and Office of Research & Development.
USEPA, 1997b. Record of Decision: Iron Mountain Mine, Operable Unit 04, Shasta County, California. U.S. Environmental Protection Agency, Superfund Division (USEPA). ROD ID: EPA/541/R97/132. September 30, 1997.
USEPA. 2000a. Water Quality Standards; Establishment of Numeric Criteria for Priority Toxic Pollutants for the State of California; Rule. U.S. Environmental Protection Agency (USEPA). Code of Federal Regulations, Title 40, Part 131, Section 38. In Federal Register: May 18, 2000 (Volume 65, No. 97), Rules and Regulations, pp. 31681-31719.
USEPA. 2000b. U.S. and State of California Announce Long-Term Settlement for Iron Mountain Mines. U.S. Environmental Protection Agency (USEPA), Region 9 News Release. San Francisco, CA. October 19, 2000. Available: http://www.epa.gov/region09/features/ironmountain.html. Accessed: March 21, 2001.
USEPA. 2001a. Superfund Record of Decision Abstracts: Iron Mountain Mines. U.S. Environmental Protection Agency (USEPA), Office of Emergency Remedial Response. Available: http://www.epa.gov/superfund/sites/rodsites/0901755.htm. Revised: February 5, 2001. Accessed: March 21, 2001.
USEPA. 2001b. Iron Mountain Mines, California (EPA ID#CAD980498612). U.S. Environmental Protection Agency (USEPA), Region 9, Fact Sheet. San Francisco, CA. January 3, 2001. Available: http://www.epa.gov/region09/waste/sfund/npl/siteinfo.htm. Last revised: January 3, 2001. Accessed: March 21, 2001.
USGS. 1964, 1976 & 1979. Orlinda (1964), Shasta Dam (1976) and Whiskeytown (1979) U.S. Geological Survey (USGS) 7.5 Minute Topographic Quadrangles for California, as presented by Horizons Technology, Inc. (1997) Sure! MAPS® RASTER Map Sets, Version 2.1.2.
Upper Sacramento River TMDL for Metals April 2002 103
Wisniewski, Diane. 2001. E-mailed unpublished data from Diane Wisniewski (Chemist, USBR) to Pat Vellines (Engineering Geologist, California Regional Water Quality Control Board, Central Valley Region, Sacramento Office) from March 27 to April 3, 2001, regarding dissolved metals surface water sampling data below Shasta and Keswick Dams.
Woodward, Phil. 2001. E-mail correspondence between Phil Woodward (Senior Engineering Geologist, California Regional Water Quality Control Board, Central Valley Region, Redding Office) and Pat Vellines (Engineering Geologist, California Regional Water Quality Control Board, Central Valley Region, Sacramento Office) on June 9, 2001, regarding Shasta Lake Mines.
CALIFORNIA ENVIRONMENTAL PROTECTION AGENCY
REGIONAL WATER QUALITY CONTROL BOARD CENTRAL VALLEY REGION
Upper Sacramento River TMDL for Cadmium,
Copper & Zinc
Final Report Appendices
April 2002
STA
TE OF CALIFORNIA
RE
GIO
NA
LW
ATER QUALITY CONTRO
LB
OA
RD
★ ★
CENTRALVALLEYREGION

Page intentionally left blank.
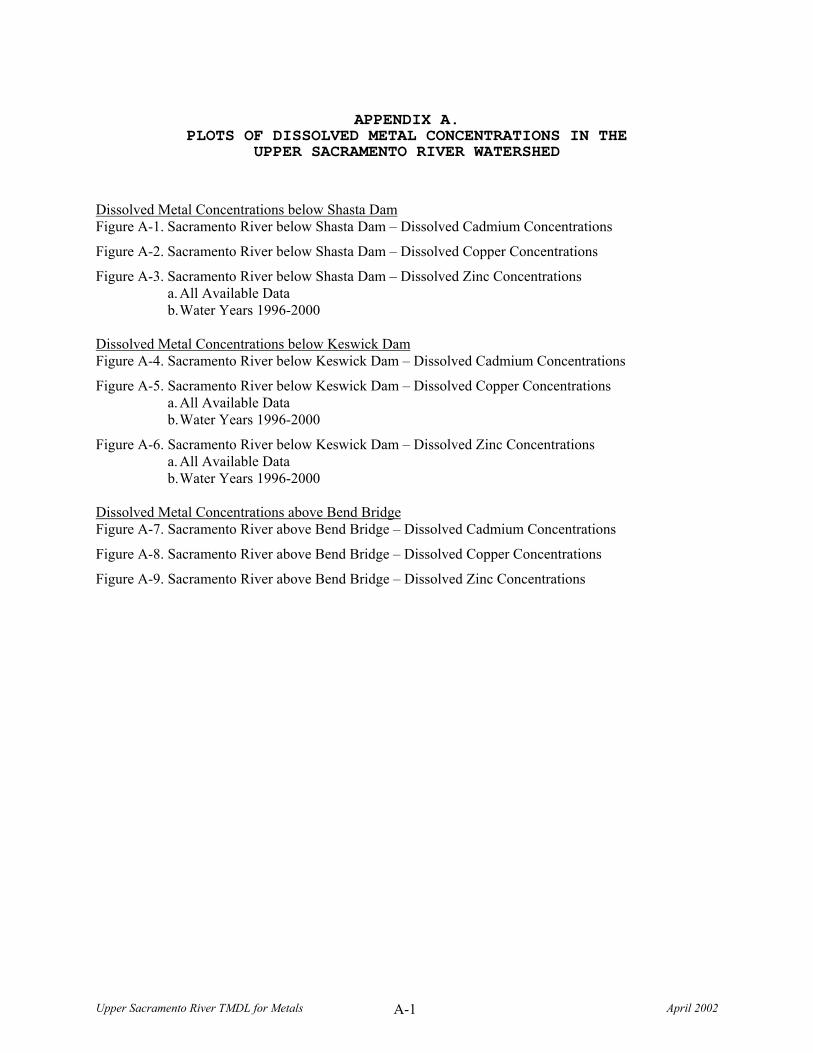
Upper Sacramento River TMDL for Metals April 2002 A-1
APPENDIX A. PLOTS OF DISSOLVED METAL CONCENTRATIONS IN THE
UPPER SACRAMENTO RIVER WATERSHED
Dissolved Metal Concentrations below Shasta Dam Figure A-1. Sacramento River below Shasta Dam – Dissolved Cadmium Concentrations
Figure A-2. Sacramento River below Shasta Dam – Dissolved Copper Concentrations
Figure A-3. Sacramento River below Shasta Dam – Dissolved Zinc Concentrations a. All Available Data b. Water Years 1996-2000
Dissolved Metal Concentrations below Keswick Dam Figure A-4. Sacramento River below Keswick Dam – Dissolved Cadmium Concentrations
Figure A-5. Sacramento River below Keswick Dam – Dissolved Copper Concentrations a. All Available Data b. Water Years 1996-2000
Figure A-6. Sacramento River below Keswick Dam – Dissolved Zinc Concentrations a. All Available Data b. Water Years 1996-2000
Dissolved Metal Concentrations above Bend Bridge Figure A-7. Sacramento River above Bend Bridge – Dissolved Cadmium Concentrations
Figure A-8. Sacramento River above Bend Bridge – Dissolved Copper Concentrations
Figure A-9. Sacramento River above Bend Bridge – Dissolved Zinc Concentrations
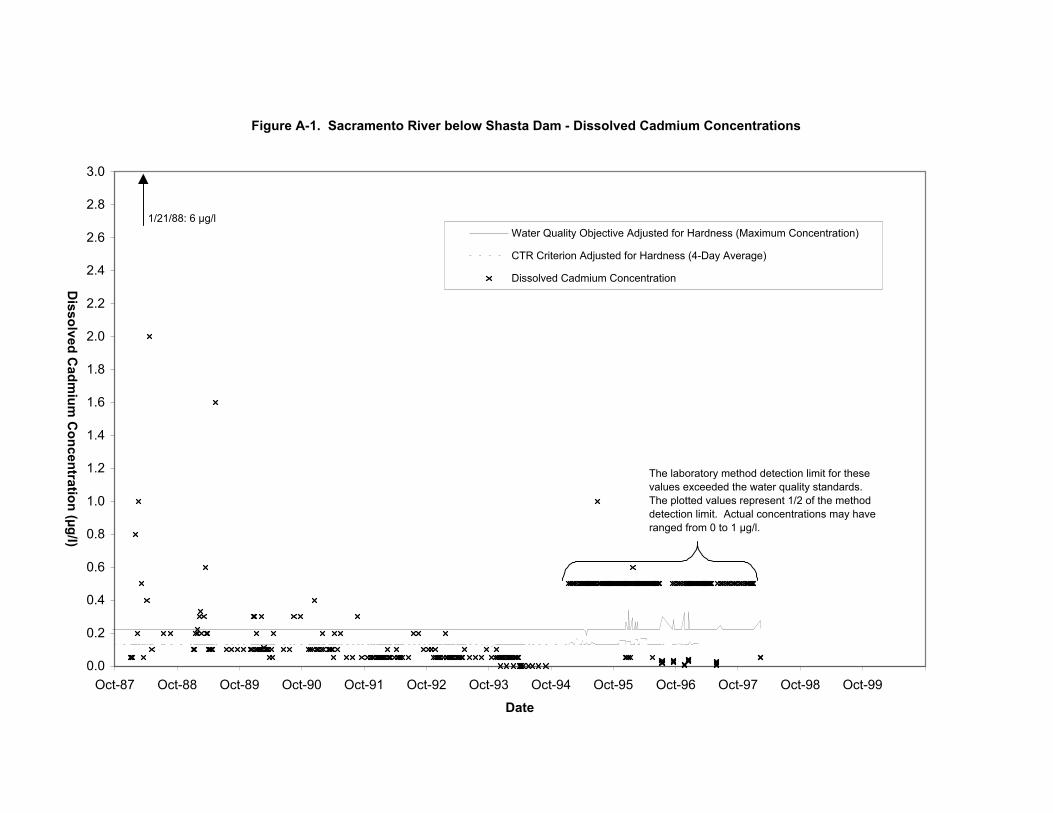
Figure A-1. Sacramento River below Shasta Dam - Dissolved Cadmium Concentrations
1/21/88: 6 µg/l
0.0
0.2
0.4
0.6
0.8
1.0
1.2
1.4
1.6
1.8
2.0
2.2
2.4
2.6
2.8
3.0
Oct-87 Oct-88 Oct-89 Oct-90 Oct-91 Oct-92 Oct-93 Oct-94 Oct-95 Oct-96 Oct-97 Oct-98 Oct-99
Date
Dissolved C
admium
Concentration (µg/l)
Water Quality Objective Adjusted for Hardness (Maximum Concentration)
CTR Criterion Adjusted for Hardness (4-Day Average)
Dissolved Cadmium Concentration
The laboratory method detection limit for these values exceeded the water quality standards. The plotted values represent 1/2 of the method detection limit. Actual concentrations may have ranged from 0 to 1 µg/l.
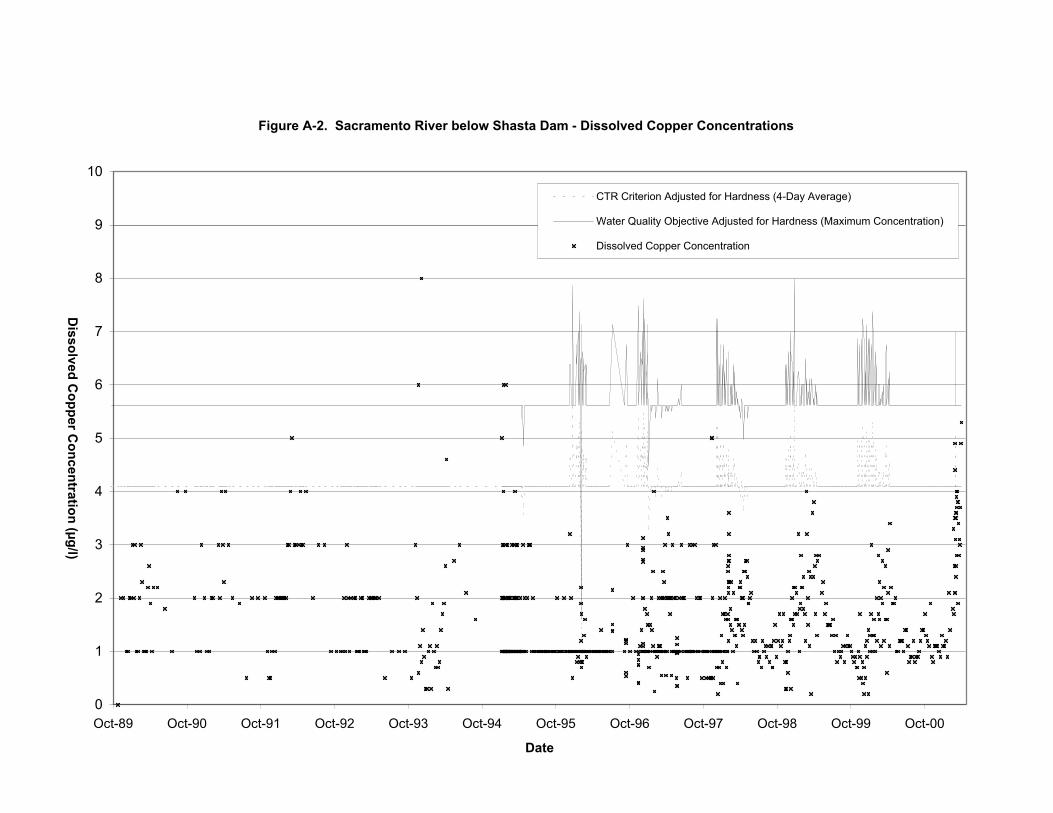
Figure A-2. Sacramento River below Shasta Dam - Dissolved Copper Concentrations
0
1
2
3
4
5
6
7
8
9
10
Oct-89 Oct-90 Oct-91 Oct-92 Oct-93 Oct-94 Oct-95 Oct-96 Oct-97 Oct-98 Oct-99 Oct-00
Date
Dissolved C
opper Concentration (µg/l)
CTR Criterion Adjusted for Hardness (4-Day Average)
Water Quality Objective Adjusted for Hardness (Maximum Concentration)
Dissolved Copper Concentration
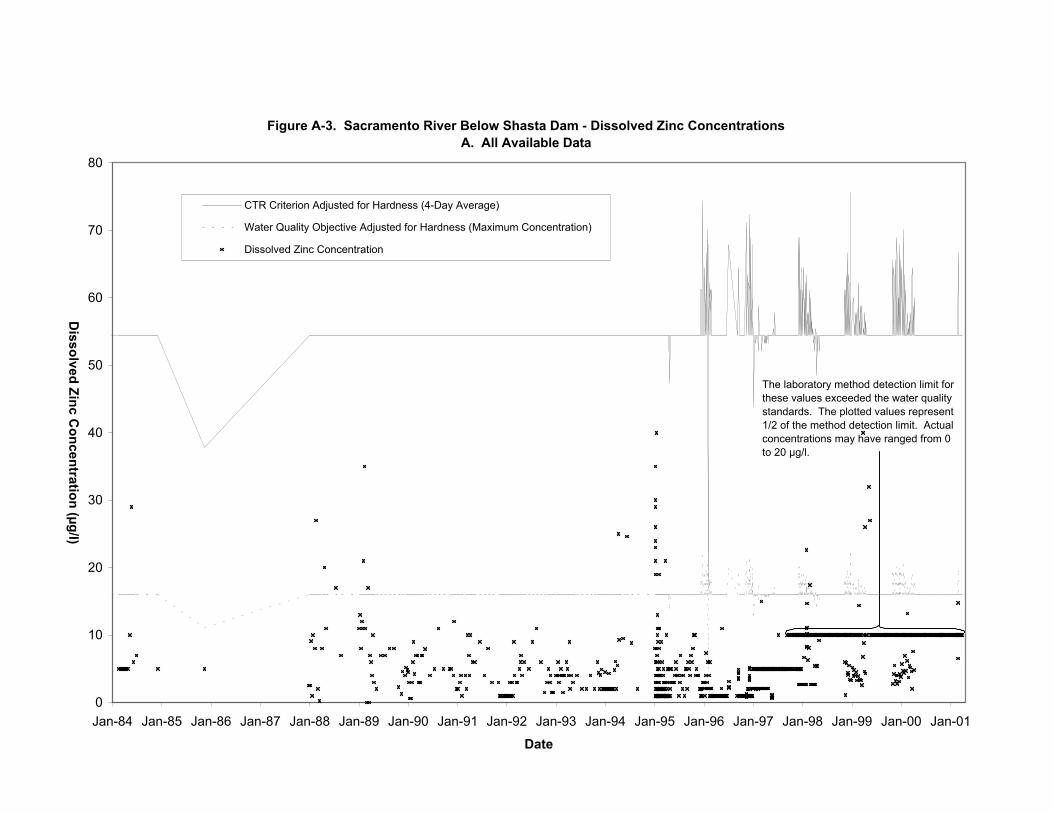
Figure A-3. Sacramento River Below Shasta Dam - Dissolved Zinc ConcentrationsA. All Available Data
0
10
20
30
40
50
60
70
80
Jan-84 Jan-85 Jan-86 Jan-87 Jan-88 Jan-89 Jan-90 Jan-91 Jan-92 Jan-93 Jan-94 Jan-95 Jan-96 Jan-97 Jan-98 Jan-99 Jan-00 Jan-01
Date
Dissolved Zinc C
oncentration (µg/l)
CTR Criterion Adjusted for Hardness (4-Day Average)
Water Quality Objective Adjusted for Hardness (Maximum Concentration)
Dissolved Zinc Concentration
The laboratory method detection limit for these values exceeded the water quality standards. The plotted values represent 1/2 of the method detection limit. Actual concentrations may have ranged from 0 to 20 µg/l.
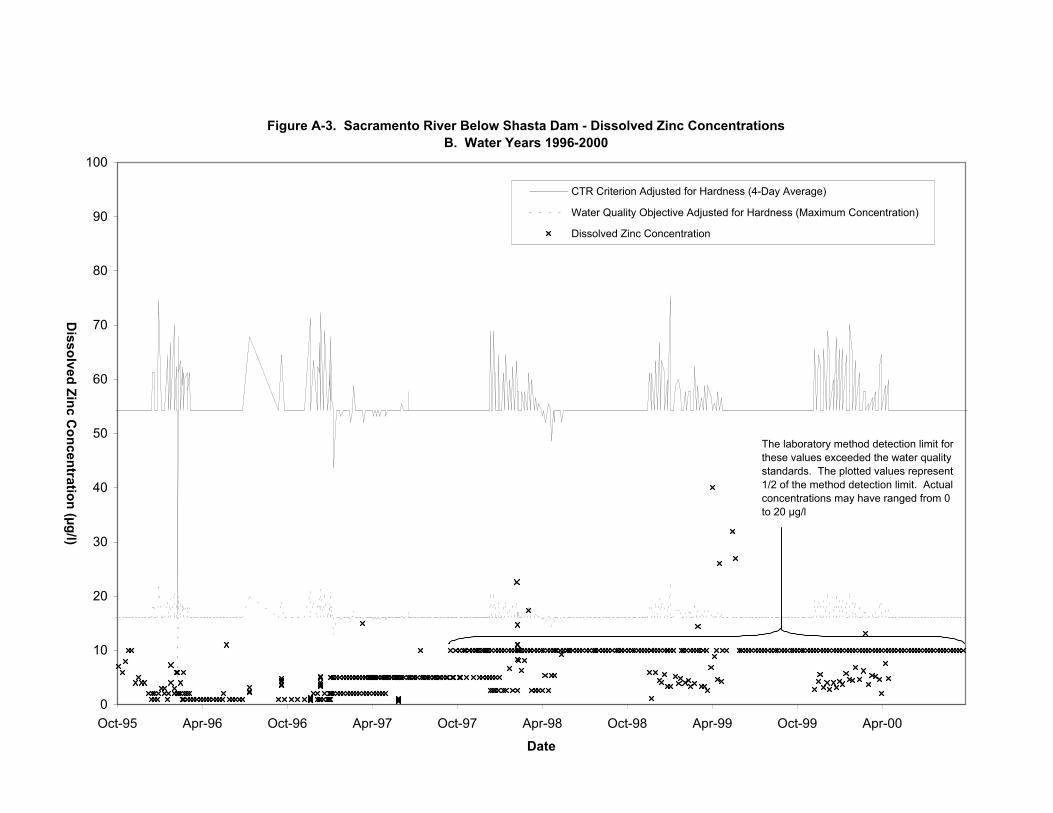
Figure A-3. Sacramento River Below Shasta Dam - Dissolved Zinc ConcentrationsB. Water Years 1996-2000
0
10
20
30
40
50
60
70
80
90
100
Oct-95 Apr-96 Oct-96 Apr-97 Oct-97 Apr-98 Oct-98 Apr-99 Oct-99 Apr-00
Date
Dissolved Zinc C
oncentration (µg/l)
CTR Criterion Adjusted for Hardness (4-Day Average)
Water Quality Objective Adjusted for Hardness (Maximum Concentration)
Dissolved Zinc Concentration
The laboratory method detection limit for these values exceeded the water quality standards. The plotted values represent 1/2 of the method detection limit. Actual concentrations may have ranged from 0 to 20 µg/l
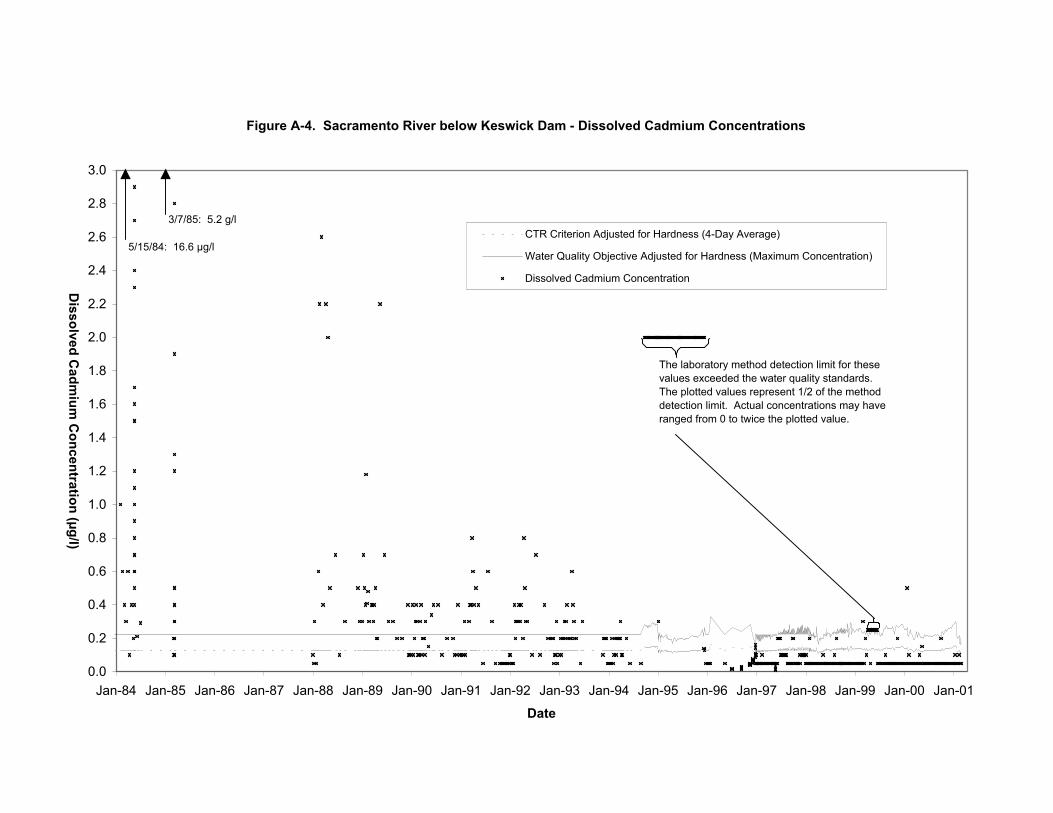
Figure A-4. Sacramento River below Keswick Dam - Dissolved Cadmium Concentrations
0.0
0.2
0.4
0.6
0.8
1.0
1.2
1.4
1.6
1.8
2.0
2.2
2.4
2.6
2.8
3.0
Jan-84 Jan-85 Jan-86 Jan-87 Jan-88 Jan-89 Jan-90 Jan-91 Jan-92 Jan-93 Jan-94 Jan-95 Jan-96 Jan-97 Jan-98 Jan-99 Jan-00 Jan-01
Date
Dissolved C
admium
Concentration (µg/l)
CTR Criterion Adjusted for Hardness (4-Day Average)
Water Quality Objective Adjusted for Hardness (Maximum Concentration)
Dissolved Cadmium Concentration
5/15/84: 16.6 µg/l
3/7/85: 5.2 g/l
The laboratory method detection limit for these values exceeded the water quality standards. The plotted values represent 1/2 of the method detection limit. Actual concentrations may have ranged from 0 to twice the plotted value.
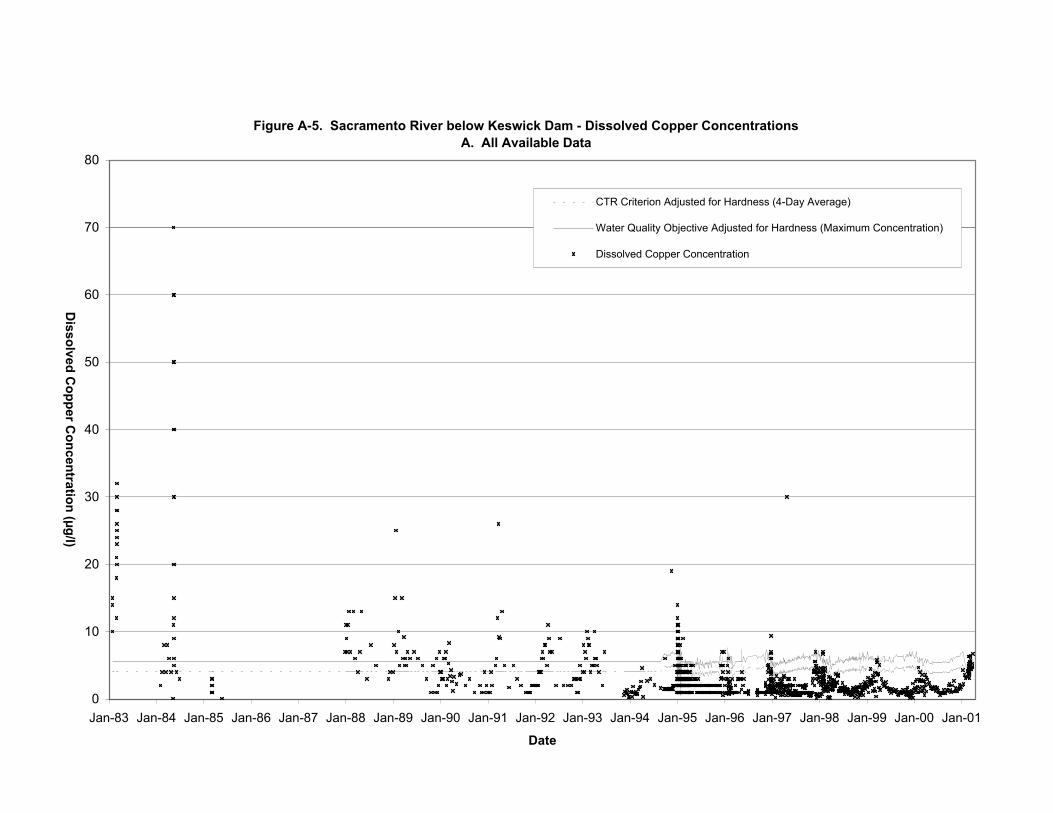
Figure A-5. Sacramento River below Keswick Dam - Dissolved Copper ConcentrationsA. All Available Data
0
10
20
30
40
50
60
70
80
Jan-83 Jan-84 Jan-85 Jan-86 Jan-87 Jan-88 Jan-89 Jan-90 Jan-91 Jan-92 Jan-93 Jan-94 Jan-95 Jan-96 Jan-97 Jan-98 Jan-99 Jan-00 Jan-01
Date
Dissolved C
opper Concentration (µg/l)
CTR Criterion Adjusted for Hardness (4-Day Average)
Water Quality Objective Adjusted for Hardness (Maximum Concentration)
Dissolved Copper Concentration
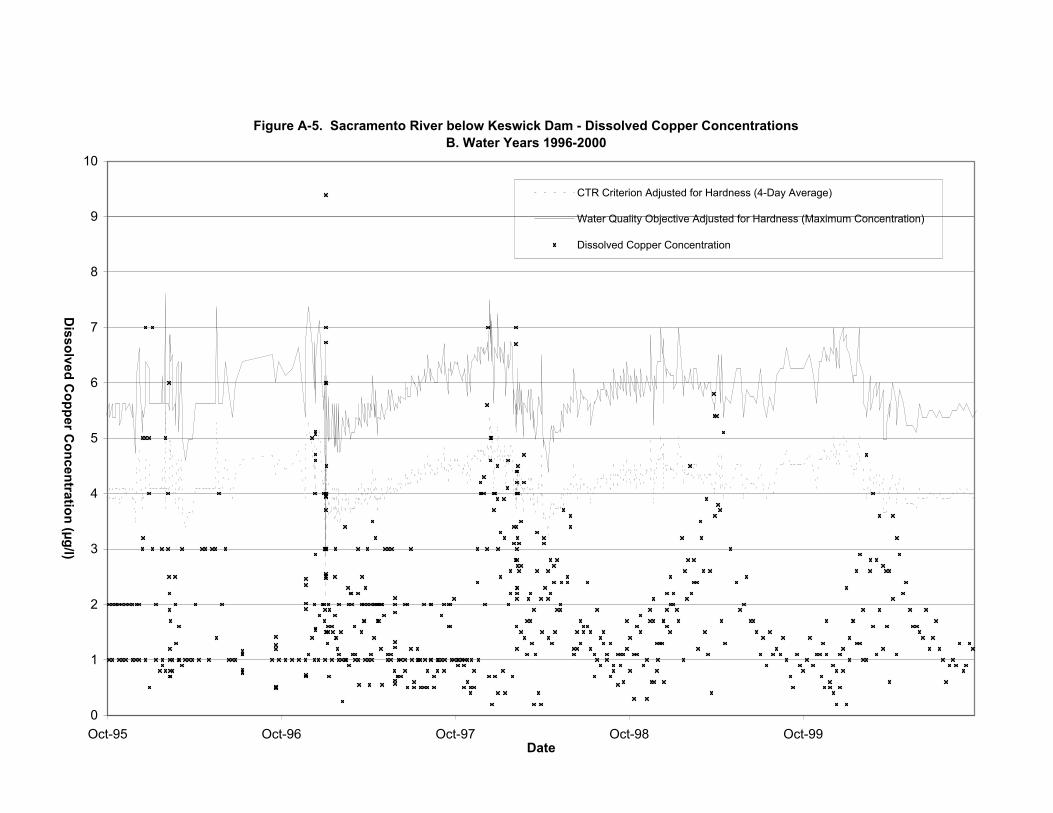
Figure A-5. Sacramento River below Keswick Dam - Dissolved Copper ConcentrationsB. Water Years 1996-2000
0
1
2
3
4
5
6
7
8
9
10
Oct-95 Oct-96 Oct-97 Oct-98 Oct-99Date
Dissolved C
opper Concentration (µg/l)
CTR Criterion Adjusted for Hardness (4-Day Average)
Water Quality Objective Adjusted for Hardness (Maximum Concentration)
Dissolved Copper Concentration
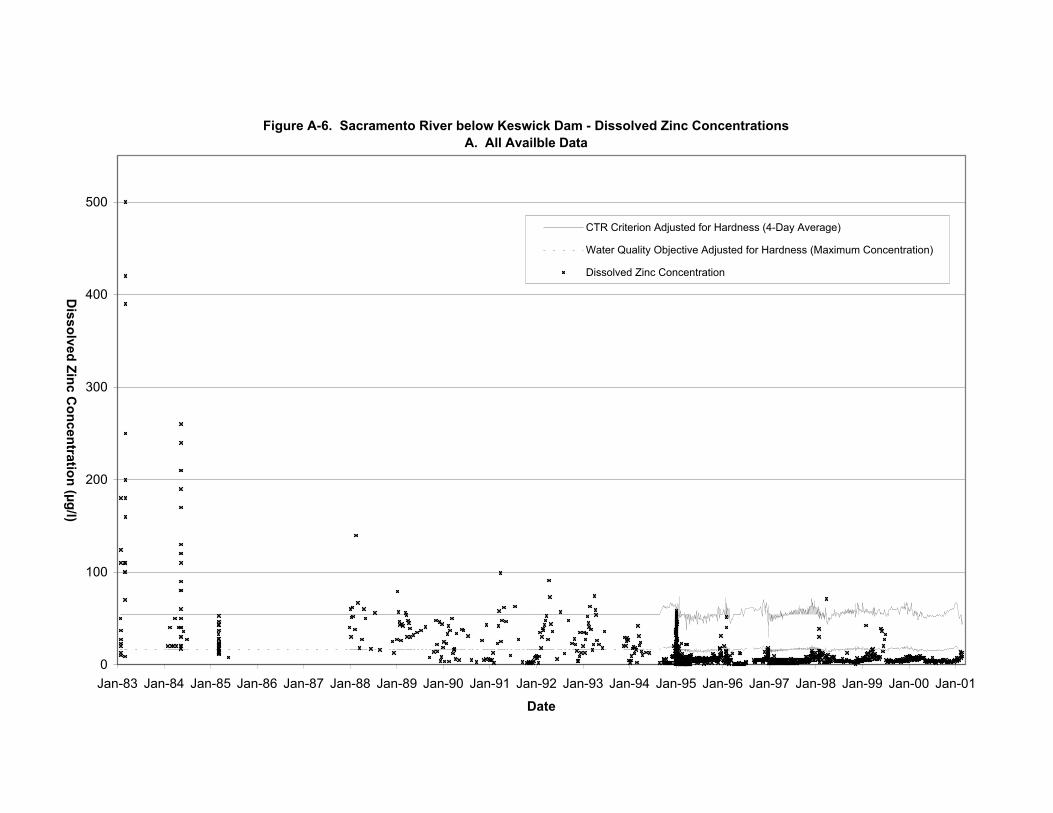
Figure A-6. Sacramento River below Keswick Dam - Dissolved Zinc ConcentrationsA. All Availble Data
0
100
200
300
400
500
Jan-83 Jan-84 Jan-85 Jan-86 Jan-87 Jan-88 Jan-89 Jan-90 Jan-91 Jan-92 Jan-93 Jan-94 Jan-95 Jan-96 Jan-97 Jan-98 Jan-99 Jan-00 Jan-01
Date
Dissolved Zinc C
oncentration (µg/l)
CTR Criterion Adjusted for Hardness (4-Day Average)
Water Quality Objective Adjusted for Hardness (Maximum Concentration)
Dissolved Zinc Concentration
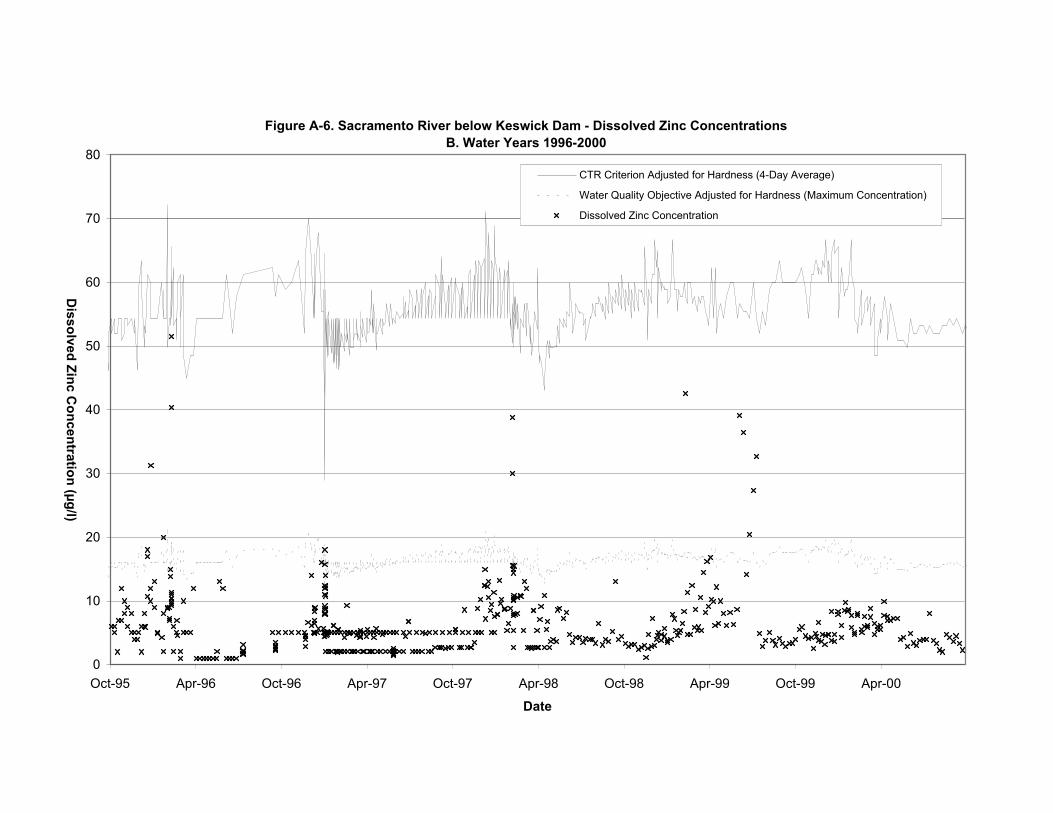
Figure A-6. Sacramento River below Keswick Dam - Dissolved Zinc ConcentrationsB. Water Years 1996-2000
0
10
20
30
40
50
60
70
80
Oct-95 Apr-96 Oct-96 Apr-97 Oct-97 Apr-98 Oct-98 Apr-99 Oct-99 Apr-00
Date
Dissolved Zinc C
oncentration (µg/l)
CTR Criterion Adjusted for Hardness (4-Day Average)
Water Quality Objective Adjusted for Hardness (Maximum Concentration)
Dissolved Zinc Concentration
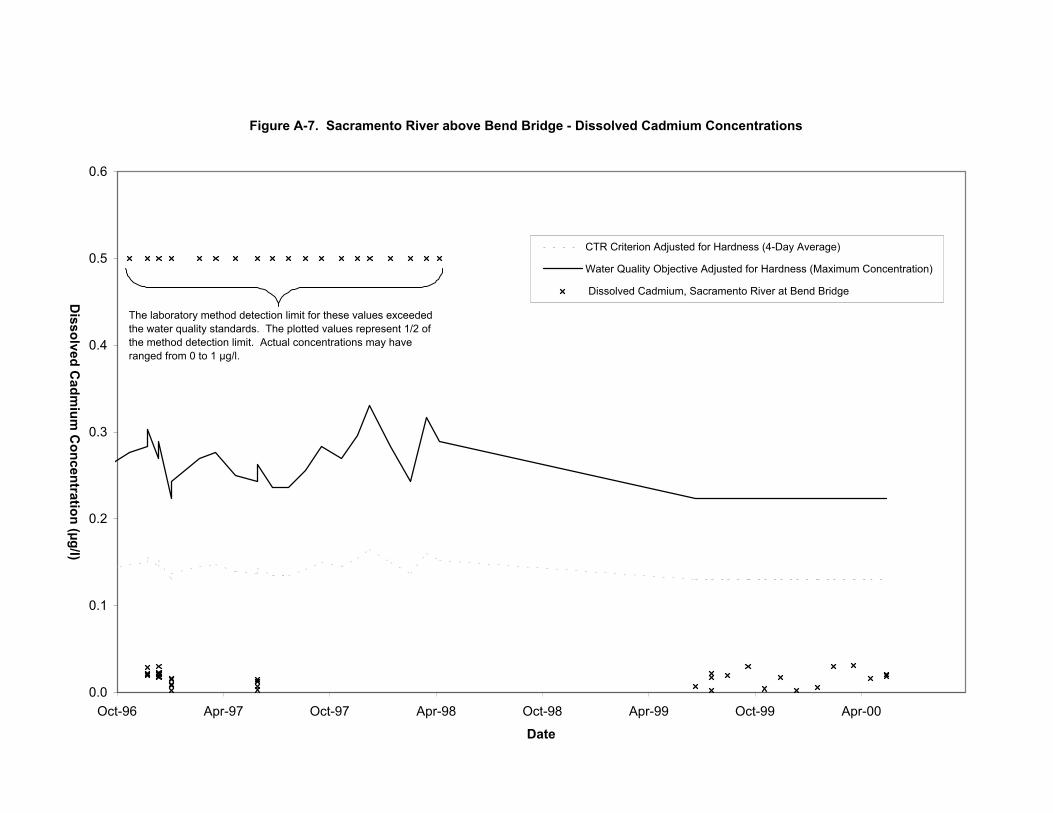
Figure A-7. Sacramento River above Bend Bridge - Dissolved Cadmium Concentrations
0.0
0.1
0.2
0.3
0.4
0.5
0.6
Oct-96 Apr-97 Oct-97 Apr-98 Oct-98 Apr-99 Oct-99 Apr-00
Date
Dissolved C
admium
Concentration (µg/l)
CTR Criterion Adjusted for Hardness (4-Day Average)
Water Quality Objective Adjusted for Hardness (Maximum Concentration)
Dissolved Cadmium, Sacramento River at Bend Bridge
The laboratory method detection limit for these values exceeded the water quality standards. The plotted values represent 1/2 of the method detection limit. Actual concentrations may have ranged from 0 to 1 µg/l.
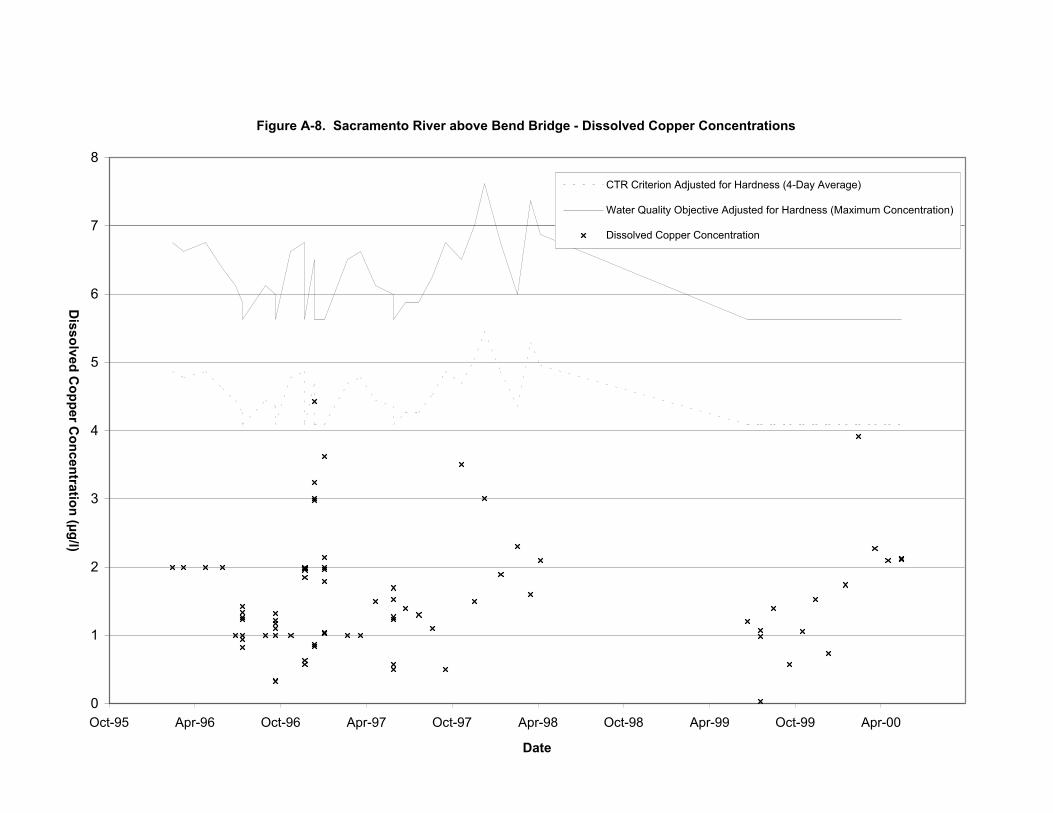
Figure A-8. Sacramento River above Bend Bridge - Dissolved Copper Concentrations
0
1
2
3
4
5
6
7
8
Oct-95 Apr-96 Oct-96 Apr-97 Oct-97 Apr-98 Oct-98 Apr-99 Oct-99 Apr-00
Date
Dissolved C
opper Concentration (µg/l)
CTR Criterion Adjusted for Hardness (4-Day Average)
Water Quality Objective Adjusted for Hardness (Maximum Concentration)
Dissolved Copper Concentration
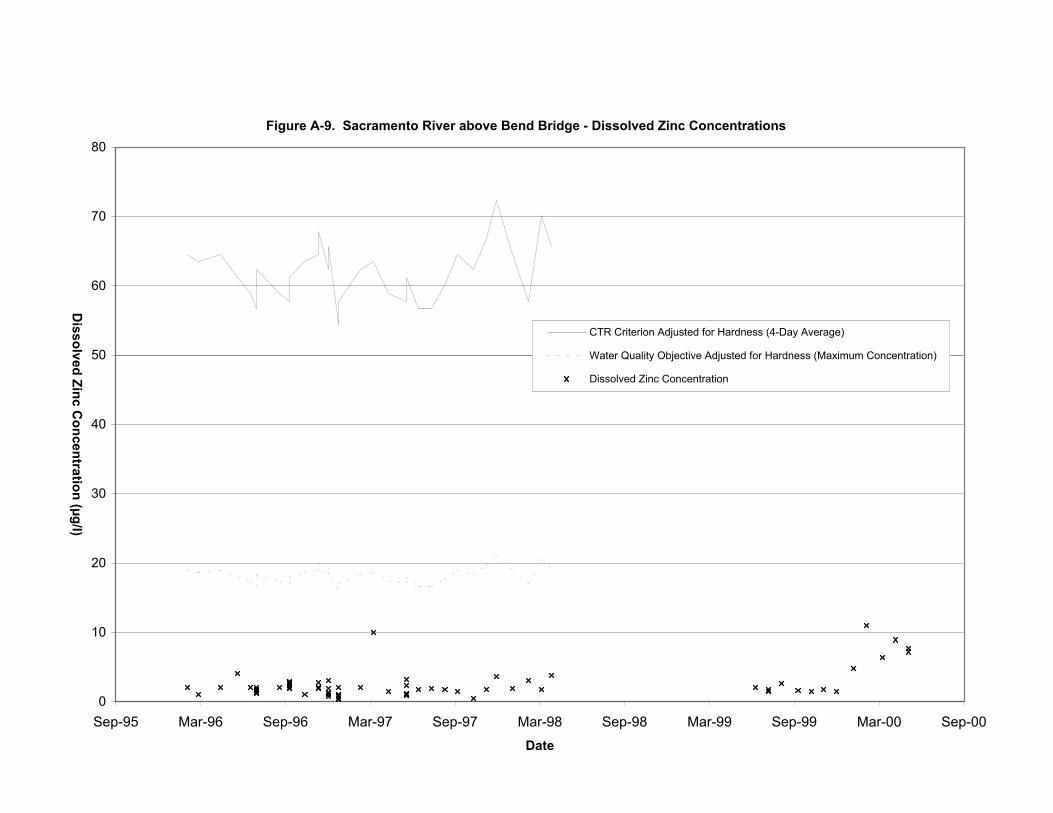
Figure A-9. Sacramento River above Bend Bridge - Dissolved Zinc Concentrations
0
10
20
30
40
50
60
70
80
Sep-95 Mar-96 Sep-96 Mar-97 Sep-97 Mar-98 Sep-98 Mar-99 Sep-99 Mar-00 Sep-00Date
Dissolved Zinc C
oncentration (µg/l)
CTR Criterion Adjusted for Hardness (4-Day Average)
Water Quality Objective Adjusted for Hardness (Maximum Concentration)
Dissolved Zinc Concentration
Upper Sacramento River TMDL for Metals April 2002 B-1
APPENDIX B. HISTORY OF SHASTA LAKE WATERSHED MINES
West Squaw Creek Watershed
Historic mining areas that have contributed metal loads to West Squaw Creek in the past include the Early
Bird Mine, the Shasta King Mine, the Weil portal of the Balaklala Mine, the Upper and Lower Windy
Camp portals of the Balaklala Mine and the Keystone Mine. Mining of these properties ceased in 1928.
As a result of reclamation activities, only the Windy Camp area of the Balaklala Mine and the Keystone
Mine currently contribute significant metal loads to West Squaw Creek (SMI, 1996).
Recent remediation activities for mines in the West Squaw Creek drainage have included installation of
portal seals, diversion of surface water around historic mining areas, a feasibility study for additional
treatment options, pilot studies (including in-situ treatment of mine water), wetlands treatment and waste
rock pile management (SHN, 2001).
Past reclamation activities in place in the West Squaw Creek watershed include the plugging of several
portals including the Weil, Early Bird, Lower Shasta King, Upper Windy Camp and Lower Windy Camp.
Sealing or plugging of portals and mine workings has been accomplished by placing bulkheads in mine
tunnels to prevent the escape of water, thus eventually flooding the mine workings and preventing oxygen
from reaching the mineralized rock. This method of sealing requires that the mine and surrounding area
be geologically sound and able to withstand the hydraulic pressure caused by the water that backs up in
the mine (SMI, 1996). The portal and seep discharges are contributing metals and acidity to water
flowing in the watershed drainages. Implementation by Mining Remedial Recovery Company (MRRC)
of best management practices has been successful (SHN, 2001). To date, six portals with year-round
discharges have been sealed. The sealing has resulted in reduction in copper loading in West Squaw
Creek at the mouth of Shasta Lake by greater than 85%. The remaining portals are not yet sealed due to
inaccessibility or lack of flow data (SHN, 2001).
Other reclamation activities include the recently completed Keystone diversion channel that diverts
surface water runoff from the Keystone area around the Balaklala – Windy Camp area (SMI, 1996).
Upper Sacramento River TMDL for Metals April 2002 B-2
In addition, several sites have surface water diversion structures. Diversion of surface waters around
mine openings and waste rock piles reduces the amount of water in contact with mineralized rock and
hence lowers metals loading to the streams (SMI, 1996).
Some accessible portions of waste dumps have also been capped, or moved and capped. Additional
control of waste rock dumps is limited by physical steepness of the terrain and inability to safely operate
equipment or the lack of terrain that is amenable to location of disposal areas.
Remediation of the MRRC mines in the West Squaw Creek watershed has resulted in significant
improvements to the water quality of the creek and of Shasta Lake in the vicinity of the West Squaw
Creek inflow (SHN, 2001). The pH of water in West Squaw Creek has improved from about 3 to 4 prior
to remediation to a range of 5 to 7 in recent years. As a result of the water quality improvements,
CVRWQCB data indicate that the severity and frequency of reported fish kills in Shasta Lake has
declined steadily and significantly during the past 5 to 10 years (SHN, 2001). Since MRRC assumed
control of the mines in 1991, they have expended approximately $7 million for remedial activities.
Early Bird Mine. The Early Bird Mine is on the south side of West Squaw Creek. The tributary from
the Early Bird Mine area enters West Squaw Creek upstream of the tributaries from the Keystone,
Balaklala and Shasta King Mines. Plugging of the Early Bird Portal and subsequent grouting of leaks
from the plug resulted in a 99% reduction in metals loads from the mine. The upstream and downstream
concentrations of metals are below detection levels, and currently fish are living in the stream above and
below the location where the drainage from the Early Bird Mine enters West Squaw Creek. No additional
reclamation activities are planned for the Early Bird Mine area.
Keystone Mine. The Keystone Mine is upgradient of the Balaklala Mine in the Windy Creek drainage.
Windy Creek is a tributary to West Squaw Creek (SHN, 2001). In 1993, bulkheads were installed on the
main Keystone portal and two higher level portals. After emplacement, the hydraulic head created by the
seals caused surface seeps of AMD to rupture through weak rock behind the bulkhead, with flows up to
100 gpm to the stream. Currently, the pressure behind the main portal averages 50 pounds per square
inch (psi) indicating that the inner workings remain at least partially flooded. As a result, copper and zinc
concentrations in the water within the mine voids have been reduced from historic levels based on the
quality of water samples taken from the portal and mine seeps.
Upper Sacramento River TMDL for Metals April 2002 B-3
In 1999, an in-situ limestone treatment system was initiated to improve the water quality of the water
inside the mine. This treatment was successful in raising the pH level, and copper and zinc
concentrations were reduced in the water within the mine. A second bulkhead was installed temporarily
to further limit the amount of water reaching the surface. MRRC recently completed a wetland treatment
cell (vertical flow pond) to further treat the discharge, reducing the metal loading and acidity from the
Keystone Mine. Residual flows from the existing areas that have received extensive remediation efforts
have demonstrated that the remedies in place are not completely effective in eliminating fish mortality in
the reach of Squaw Creek below Windy Creek. The site is currently regulated by a NPDES Permit and a
Cease and Desist Order.
Balaklala Mine. The Balaklala Mine contains two large ore bodies, the Windy Camp and the Weil.
Operations at the Balaklala Mine ceased in 1928. The Upper and Lower Windy Camp portals are located
in the Windy Camp area. Windy Creek flows directly through the site (SHN, 2001). Reclamation
activities in the Balaklala-Windy Camp area include the plugging of the Upper and Lower Windy Camp
portals and diversion of surface water runoff from the Keystone Mine around the Windy Camp area (SMI,
1996). A collapsed stope in the Windy Camp Mine created openings to the surface that were upgradient
of the Upper and Lower Windy Camp portals (SHN, 2001). Water would infiltrate into the mine from the
ground surface above the mine from Windy Camp Creek (through surface cracks and by fracture flow),
as well as from the creek bed to the west, which receives water-containing AMD from the Keystone Mine
diversion outlet. The result was generation of AMD within the mine from all of these water sources, then
discharges of high volume and poor quality. The Lower Windy Camp portal also produces AMD from
within the workings. The Upper Windy Camp portal emerges from the east side of Windy Camp, some
300 feet from the lower portal. AMD is also produced from the upper portal. The Upper and Lower
Windy Camp portals were sealed in 1984 resulting in an 80% reduction of the metal loading to the West
Squaw Creek (Woodward, 2001).
The Balaklala waste rock pile, comprising approximately 40,000 cubic yards of sulfide containing rock
was located in the valley where Windy Creek historically flowed. Surface water, water from above the
pile, and water from within the mines, flowed over and through the pile, generating AMD and resulting in
a significant additional metal load to the stream. In 1996/97, the pile was consolidated into the open pit
excavated in the upper reaches of the drainage and the stream was channeled over the mining area. The
waste rock was then capped and vegetated. The creek flow was conducted over, rather than into, the pile
through the use of an HDPE-lined channel constructed of gabion baskets arranged in a manner to retard
flow, thereby reducing erosion. During the remediation of the waste rock at this site, a previously
Upper Sacramento River TMDL for Metals April 2002 B-4
unknown small AMD flow was discovered, collected, and directed via pipe to an anoxic drain. Discharge
from the anoxic drain is currently routed to the lower reaches of Windy Creek. MRRC installed some
experimental passive limestone treatment “drains” below the Windy Camp portal; however, high stream
flows destroyed the drains.
The Windy Camp and Keystone areas comprised the largest source of metal loading to West Squaw
Creek as of 1996 (SMI, 1996). Plugging of the Lower Windy Camp portal was only partially successful
in decreasing the metal load from the area. The Balaklala Mine (WC Portal) is currently regulated by a
NPDES Permit and a Cease and Desist Order.
The Weil Portal provided access to the Weil ore body. Two additional portals that accessed the Weil ore
body are also adjacent to the main road to the Balaklala Mine. The Weil portal was sealed in 1982. There
is no significant increase in metals loads observed as the Weil tributary crosses the Weil waste rock piles.
Plugging the Weil Portal was an effective remediation, with 99.9% reduction of metal loads, meeting
NPDES permit requirements. No additional reclamation activities are planned for the Weil portal (SMI,
1986).
Shasta King Mine. The Shasta King Mine workings lie northeast of the Balaklala Mine, across West
Squaw Creek (SHN, 2001). The mine has eight adits, one just above West Squaw Creek and the other
seven located a few hundred feet above West Squaw Creek. Waste dumps from the adits generally extend
from the portals and into the creek. Access to this mine is extremely limited. Reclamation activities at
the Shasta King Mine included plugging of the Lower Shasta King portal in July 1989, with subsequent
grouting of leaks from the plug (SMI, 1996). The principal metal loads from the Shasta King Mine seem
to be generated from the waste rock, which extends to the stream (SHN, 2001). Access to the waste rock
piles is also extremely limited. The Shasta King Mine is currently regulated by a NPDES Permit and a
Cease and Desist Order.
Little Backbone Creek
NPDES permits and a Cease and Desist Order are regulating the Mammoth, Gossen and Sutro Mines.
Remedial work is underway at most sites. Mammoth, Gossen, and Sutro Mines had bulkhead seals
placed in portals to reduce metals discharge. The Golinski Mine, which is located on U.S. Forest Service
property, is regulated by a CVRWQCB Cleanup and Abatement Order. Site evaluation and remediation
for the Golinski Mine were conducted in the summer of 2001; two bulkhead seals were installed in the
Golinski Mine and their effectiveness is being evaluated (Woodward, 2001).
Upper Sacramento River TMDL for Metals April 2002 B-5
Horse Creek and Town Creek
The non-operating Bully Hill and Rising Star Mines discharge (AMD) from several portals, seeps, and
waste rock dumps. The discharge from the Bully Hill Mine enters Town Creek, which flows into Shasta
Lake. Discharges from the Rising Star Mine enter an unnamed tributary to Horse Creek, which also
flows, into Shasta Lake. The discharge from the main portals of the Bully Hill Mine and the Rising Star
Mine are regulated under a NPDES Permit (CVRWQCB, 1997).
Remediation work was conducted at these two mines in 2000, including construction of a road to the
mines, a surface water diversion of Town Creek around the Bully Hill Mine waste rock pile, and a pilot-
scale vertical upflow treatment pond at the discharge of the Rising Star Mine (Woodward, 2001).
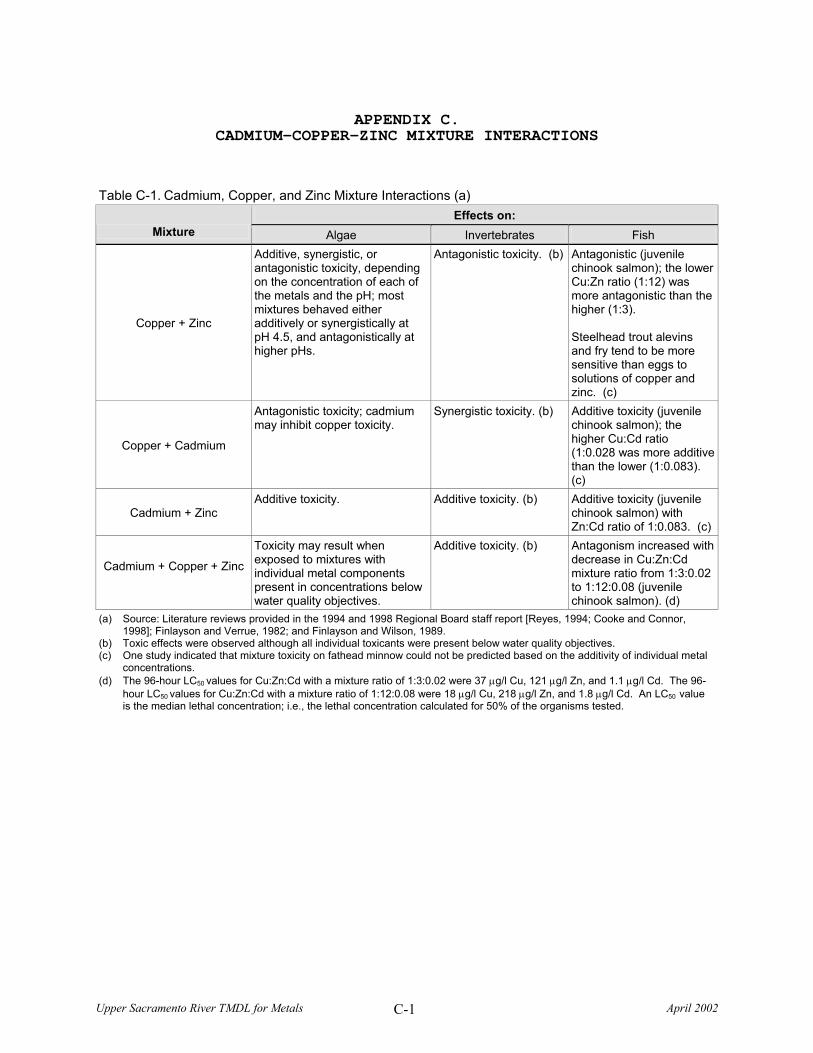
Upper Sacramento River TMDL for Metals April 2002 C-1
APPENDIX C. CADMIUM-COPPER-ZINC MIXTURE INTERACTIONS
Table C-1. Cadmium, Copper, and Zinc Mixture Interactions (a) Effects on:
Mixture Algae Invertebrates Fish
Copper + Zinc
Additive, synergistic, or antagonistic toxicity, depending on the concentration of each of the metals and the pH; most mixtures behaved either additively or synergistically at pH 4.5, and antagonistically at higher pHs.
Antagonistic toxicity. (b) Antagonistic (juvenile chinook salmon); the lower Cu:Zn ratio (1:12) was more antagonistic than the higher (1:3). Steelhead trout alevins and fry tend to be more sensitive than eggs to solutions of copper and zinc. (c)
Copper + Cadmium
Antagonistic toxicity; cadmium may inhibit copper toxicity.
Synergistic toxicity. (b) Additive toxicity (juvenile chinook salmon); the higher Cu:Cd ratio (1:0.028 was more additive than the lower (1:0.083). (c)
Cadmium + Zinc Additive toxicity. Additive toxicity. (b) Additive toxicity (juvenile
chinook salmon) with Zn:Cd ratio of 1:0.083. (c)
Cadmium + Copper + Zinc
Toxicity may result when exposed to mixtures with individual metal components present in concentrations below water quality objectives.
Additive toxicity. (b) Antagonism increased with decrease in Cu:Zn:Cd mixture ratio from 1:3:0.02 to 1:12:0.08 (juvenile chinook salmon). (d)
(a) Source: Literature reviews provided in the 1994 and 1998 Regional Board staff report [Reyes, 1994; Cooke and Connor, 1998]; Finlayson and Verrue, 1982; and Finlayson and Wilson, 1989.
(b) Toxic effects were observed although all individual toxicants were present below water quality objectives. (c) One study indicated that mixture toxicity on fathead minnow could not be predicted based on the additivity of individual metal
concentrations. (d) The 96-hour LC50 values for Cu:Zn:Cd with a mixture ratio of 1:3:0.02 were 37 µg/l Cu, 121 µg/l Zn, and 1.1 µg/l Cd. The 96-
hour LC50 values for Cu:Zn:Cd with a mixture ratio of 1:12:0.08 were 18 µg/l Cu, 218 µg/l Zn, and 1.8 µg/l Cd. An LC50 value is the median lethal concentration; i.e., the lethal concentration calculated for 50% of the organisms tested.
Upper Sacramento River TMDL for Metals April 2002 D-1
APPENDIX D. LOAD CALCULATIONS FOR AFTERTHOUGHT MINE
& MUNICIPAL STORMWATER DISCHARGES
D.1 Load Calculations for Afterthought Mine
Very little metals concentration information exists for runoff from the Afterthought Mine. Afterthought
Mine discharges to Little Cow Creek approximately 23 miles upstream of the Little Cow Creek – upper
Sacramento River confluence, which is approximately 2.5 miles east of Anderson. Seasonal changes in
precipitation result in cyclic changes in the amount of AMD from Afterthought Mine. From late spring to
early fall, little mine water is available to create AMD. However, early rains during fall and winter
provide a flushing action that produces highly concentrated AMD; the distribution of rainfall can cause a
large discharge of AMD during a period of low stream flow (DWR, 1985). Another issue is that the
AMD and Little Cow Creek flows do not mix well, causing the AMD to remain as a plume for a
considerable distance (¼ to ½ mile downstream) (DWR, 1985).
Regional Board staff collected samples from Little Cow Creek at Dersch Road (approximately one mile
upstream of the Little Cow Creek – upper Sacramento River confluence) in April and June 1996
(Alpers et al., 2000). The samples had total metal concentrations of 5.2 and 6 µg/l copper, and 16 and
~170 µg/l zinc, respectively. During the 1970s and 1980s, the California Department of Water Resources
(DWR) compiled a larger data set that included dissolved metal concentrations. DWR collected water
samples from Little Cow Creek 0.05, 0.5, 1.1 and 1.8 miles downstream of the Afterthought Mine (DWR,
1985). DWR collected the samples during multiple sampling events in 1978, 1982, and 1984. DWR
collected Little Cow Creek flow data only during the April, June, and August 1984 sampling events, and
therefore calculated load values for Little Cow Creek flows only for those sampling events. The April
sampling event had the highest flow (56,610 gallons per minute [gpm]) of the different sampling events,
while the August sampling event had the lowest flow (4,598 gpm, a magnitude lower than the April
flow). Table D-1 shows the maximum and minimum daily dissolved metal loads calculated for Little
Cow Creek. To provide a conservative estimate of Afterthought Mine’s metal contribution to the upper
Sacramento River, Regional Board staff used in the source assessment only the maximum values that
DWR calculated. In addition, staff assumed that no dilution or deposition occurs along the twenty-three
mile reach of Little Cow Creek between the mine and the Little Cow Creek-Sacramento River confluence.
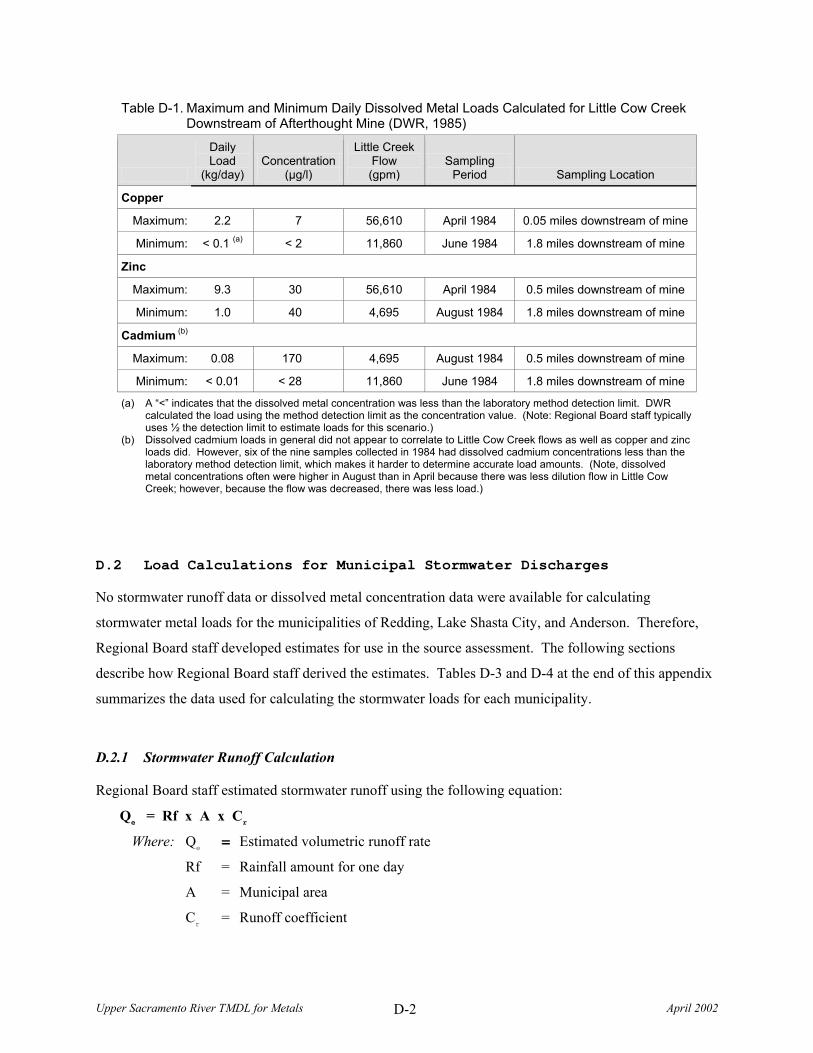
Upper Sacramento River TMDL for Metals April 2002 D-2
Table D-1. Maximum and Minimum Daily Dissolved Metal Loads Calculated for Little Cow Creek Downstream of Afterthought Mine (DWR, 1985)
Daily Load
(kg/day) Concentration
(µg/l)
Little Creek Flow (gpm)
Sampling Period Sampling Location
Copper
Maximum: 2.2 7 56,610 April 1984 0.05 miles downstream of mine
Minimum: < 0.1 (a) < 2 11,860 June 1984 1.8 miles downstream of mine
Zinc
Maximum: 9.3 30 56,610 April 1984 0.5 miles downstream of mine
Minimum: 1.0 40 4,695 August 1984 1.8 miles downstream of mine
Cadmium (b)
Maximum: 0.08 170 4,695 August 1984 0.5 miles downstream of mine
Minimum: < 0.01 < 28 11,860 June 1984 1.8 miles downstream of mine
(a) A “<” indicates that the dissolved metal concentration was less than the laboratory method detection limit. DWR calculated the load using the method detection limit as the concentration value. (Note: Regional Board staff typically uses ½ the detection limit to estimate loads for this scenario.)
(b) Dissolved cadmium loads in general did not appear to correlate to Little Cow Creek flows as well as copper and zinc loads did. However, six of the nine samples collected in 1984 had dissolved cadmium concentrations less than the laboratory method detection limit, which makes it harder to determine accurate load amounts. (Note, dissolved metal concentrations often were higher in August than in April because there was less dilution flow in Little Cow Creek; however, because the flow was decreased, there was less load.)
D.2 Load Calculations for Municipal Stormwater Discharges
No stormwater runoff data or dissolved metal concentration data were available for calculating
stormwater metal loads for the municipalities of Redding, Lake Shasta City, and Anderson. Therefore,
Regional Board staff developed estimates for use in the source assessment. The following sections
describe how Regional Board staff derived the estimates. Tables D-3 and D-4 at the end of this appendix
summarizes the data used for calculating the stormwater loads for each municipality.
D.2.1 Stormwater Runoff Calculation
Regional Board staff estimated stormwater runoff using the following equation:
Qe = Rf x A x C
r
Where: Qe = Estimated volumetric runoff rate
Rf = Rainfall amount for one day
A = Municipal area
Cr = Runoff coefficient
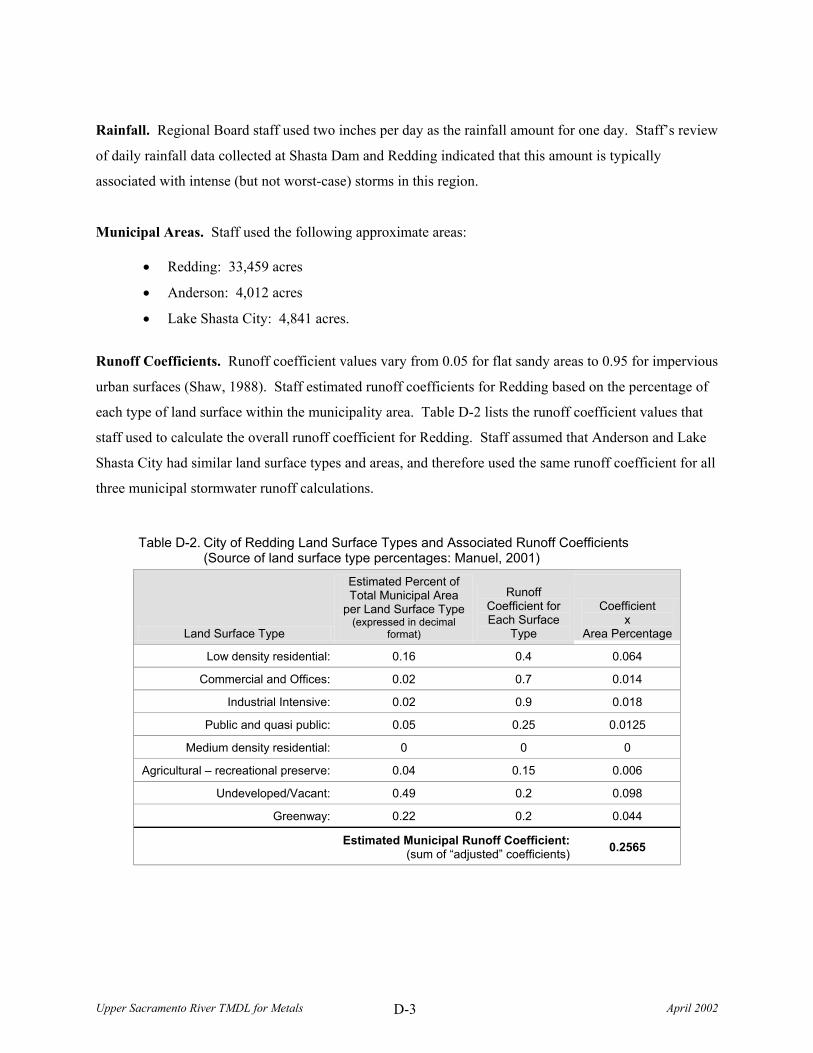
Upper Sacramento River TMDL for Metals April 2002 D-3
Rainfall. Regional Board staff used two inches per day as the rainfall amount for one day. Staff’s review
of daily rainfall data collected at Shasta Dam and Redding indicated that this amount is typically
associated with intense (but not worst-case) storms in this region.
Municipal Areas. Staff used the following approximate areas:
• Redding: 33,459 acres
• Anderson: 4,012 acres
• Lake Shasta City: 4,841 acres.
Runoff Coefficients. Runoff coefficient values vary from 0.05 for flat sandy areas to 0.95 for impervious
urban surfaces (Shaw, 1988). Staff estimated runoff coefficients for Redding based on the percentage of
each type of land surface within the municipality area. Table D-2 lists the runoff coefficient values that
staff used to calculate the overall runoff coefficient for Redding. Staff assumed that Anderson and Lake
Shasta City had similar land surface types and areas, and therefore used the same runoff coefficient for all
three municipal stormwater runoff calculations.
Table D-2. City of Redding Land Surface Types and Associated Runoff Coefficients (Source of land surface type percentages: Manuel, 2001)
Land Surface Type
Estimated Percent of Total Municipal Area
per Land Surface Type (expressed in decimal
format)
Runoff Coefficient for Each Surface
Type
Coefficient x
Area Percentage
Low density residential: 0.16 0.4 0.064
Commercial and Offices: 0.02 0.7 0.014
Industrial Intensive: 0.02 0.9 0.018
Public and quasi public: 0.05 0.25 0.0125
Medium density residential: 0 0 0
Agricultural – recreational preserve: 0.04 0.15 0.006
Undeveloped/Vacant: 0.49 0.2 0.098
Greenway: 0.22 0.2 0.044
Estimated Municipal Runoff Coefficient: (sum of “adjusted” coefficients) 0.2565
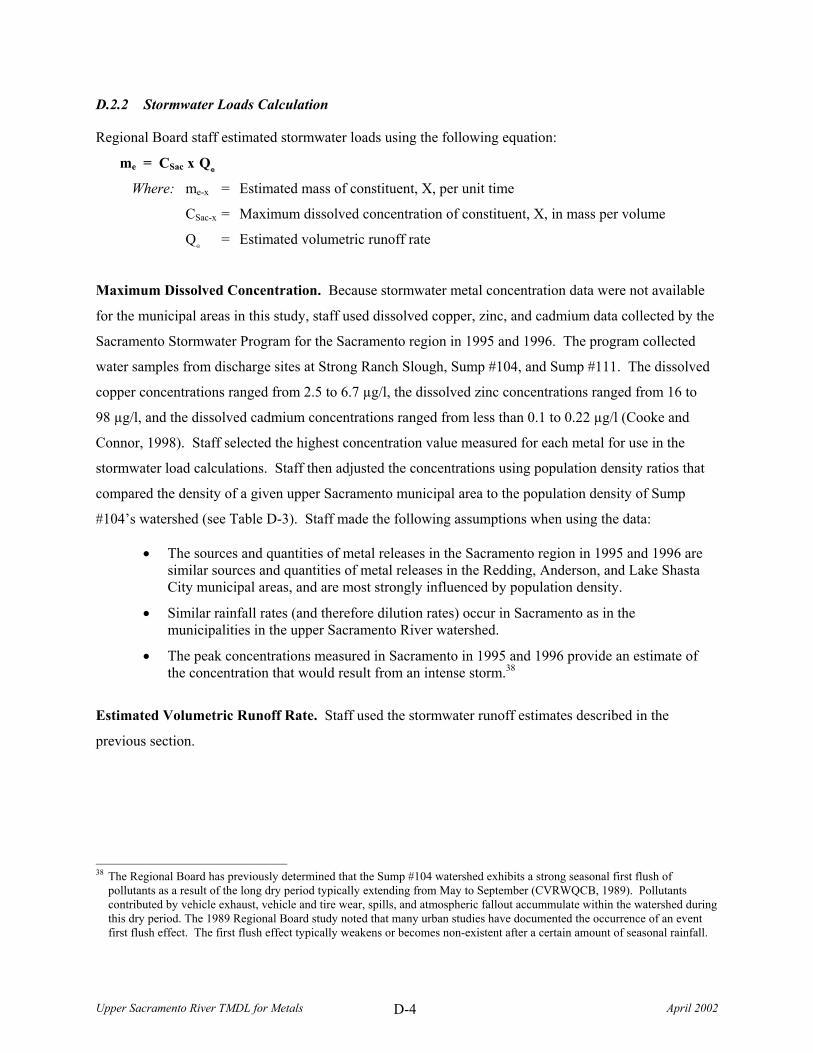
Upper Sacramento River TMDL for Metals April 2002 D-4
D.2.2 Stormwater Loads Calculation
Regional Board staff estimated stormwater loads using the following equation:
me = CSac x Qe
Where: me-x = Estimated mass of constituent, X, per unit time
CSac-x = Maximum dissolved concentration of constituent, X, in mass per volume
Qe = Estimated volumetric runoff rate
Maximum Dissolved Concentration. Because stormwater metal concentration data were not available
for the municipal areas in this study, staff used dissolved copper, zinc, and cadmium data collected by the
Sacramento Stormwater Program for the Sacramento region in 1995 and 1996. The program collected
water samples from discharge sites at Strong Ranch Slough, Sump #104, and Sump #111. The dissolved
copper concentrations ranged from 2.5 to 6.7 µg/l, the dissolved zinc concentrations ranged from 16 to
98 µg/l, and the dissolved cadmium concentrations ranged from less than 0.1 to 0.22 µg/l (Cooke and
Connor, 1998). Staff selected the highest concentration value measured for each metal for use in the
stormwater load calculations. Staff then adjusted the concentrations using population density ratios that
compared the density of a given upper Sacramento municipal area to the population density of Sump
#104’s watershed (see Table D-3). Staff made the following assumptions when using the data:
• The sources and quantities of metal releases in the Sacramento region in 1995 and 1996 are similar sources and quantities of metal releases in the Redding, Anderson, and Lake Shasta City municipal areas, and are most strongly influenced by population density.
• Similar rainfall rates (and therefore dilution rates) occur in Sacramento as in the municipalities in the upper Sacramento River watershed.
• The peak concentrations measured in Sacramento in 1995 and 1996 provide an estimate of the concentration that would result from an intense storm.38
Estimated Volumetric Runoff Rate. Staff used the stormwater runoff estimates described in the
previous section.
38 The Regional Board has previously determined that the Sump #104 watershed exhibits a strong seasonal first flush of
pollutants as a result of the long dry period typically extending from May to September (CVRWQCB, 1989). Pollutants contributed by vehicle exhaust, vehicle and tire wear, spills, and atmospheric fallout accummulate within the watershed during this dry period. The 1989 Regional Board study noted that many urban studies have documented the occurrence of an event first flush effect. The first flush effect typically weakens or becomes non-existent after a certain amount of seasonal rainfall.
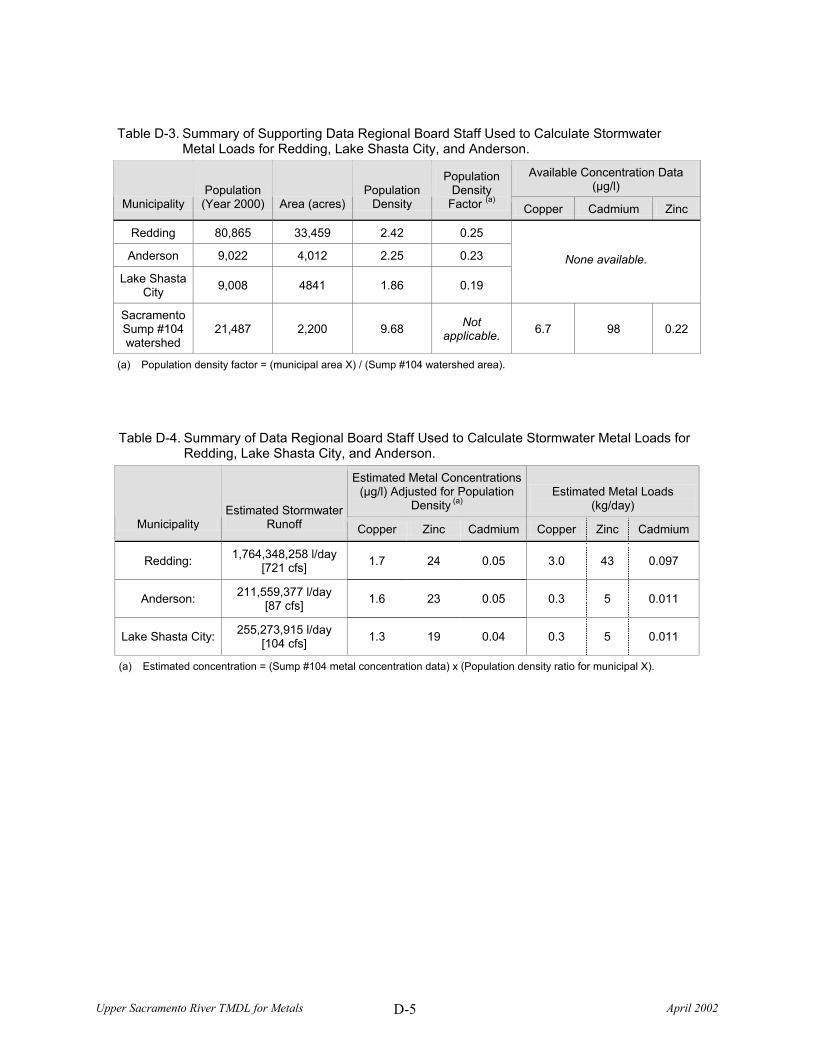
Upper Sacramento River TMDL for Metals April 2002 D-5
Table D-3. Summary of Supporting Data Regional Board Staff Used to Calculate Stormwater Metal Loads for Redding, Lake Shasta City, and Anderson.
Available Concentration Data (µg/l)
Municipality Population (Year 2000) Area (acres)
Population Density
Population Density
Factor (a) Copper Cadmium Zinc
Redding 80,865 33,459 2.42 0.25
Anderson 9,022 4,012 2.25 0.23
Lake Shasta City 9,008 4841 1.86 0.19
None available.
Sacramento Sump #104 watershed
21,487 2,200 9.68 Not applicable. 6.7 98 0.22
(a) Population density factor = (municipal area X) / (Sump #104 watershed area).
Table D-4. Summary of Data Regional Board Staff Used to Calculate Stormwater Metal Loads for Redding, Lake Shasta City, and Anderson.
Estimated Metal Concentrations (µg/l) Adjusted for Population
Density (a) Estimated Metal Loads
(kg/day) Municipality
Estimated Stormwater Runoff Copper Zinc Cadmium Copper Zinc Cadmium
Redding: 1,764,348,258 l/day [721 cfs] 1.7 24 0.05 3.0 43 0.097
Anderson: 211,559,377 l/day [87 cfs] 1.6 23 0.05 0.3 5 0.011
Lake Shasta City: 255,273,915 l/day [104 cfs] 1.3 19 0.04 0.3 5 0.011
(a) Estimated concentration = (Sump #104 metal concentration data) x (Population density ratio for municipal X).
Upper Sacramento River TMDL for Metals April 2002 E-1
APPENDIX E. PLOTS OF DISSOLVED METALS LOADS IN THE
UPPER SACRAMENTO RIVER WATERSHED
Figure E-1. Dissolved Copper Loads for Sources Upstream of Keswick Dam
Figure E-2. Dissolved Zinc Loads for Sources Upstream of Keswick Dam
Figure E-3. Dissolved Cadmium Loads for Sources Upstream of Keswick Dam

Figure E-1. Dissolved Copper Loads for Sources Upstream of Keswick Dam
0
50
100
150
200
250
300
350
400
450
500
Oct-95 Apr-96 Oct-96 Apr-97 Oct-97 Apr-98 Oct-98 Apr-99 Oct-99 Apr-00Date
Dissolved C
opper Load (kg/day)
Spring Creek Power Plant ReleasesSpring Creek Debris Dam ReleasesShasta Dam ReleasesShasta Dam Releases (Estimates)
SCDD Release Loads1/2/97: 1121 kg/day1/3/97: 793 kg/day SCDD Release Loads
2/9/98: 571 kg/day2/10/98: 587 kg/day2/11/98: 551 kg/day2/17/98: 526 kg/day2/24/98: 608 kg/day
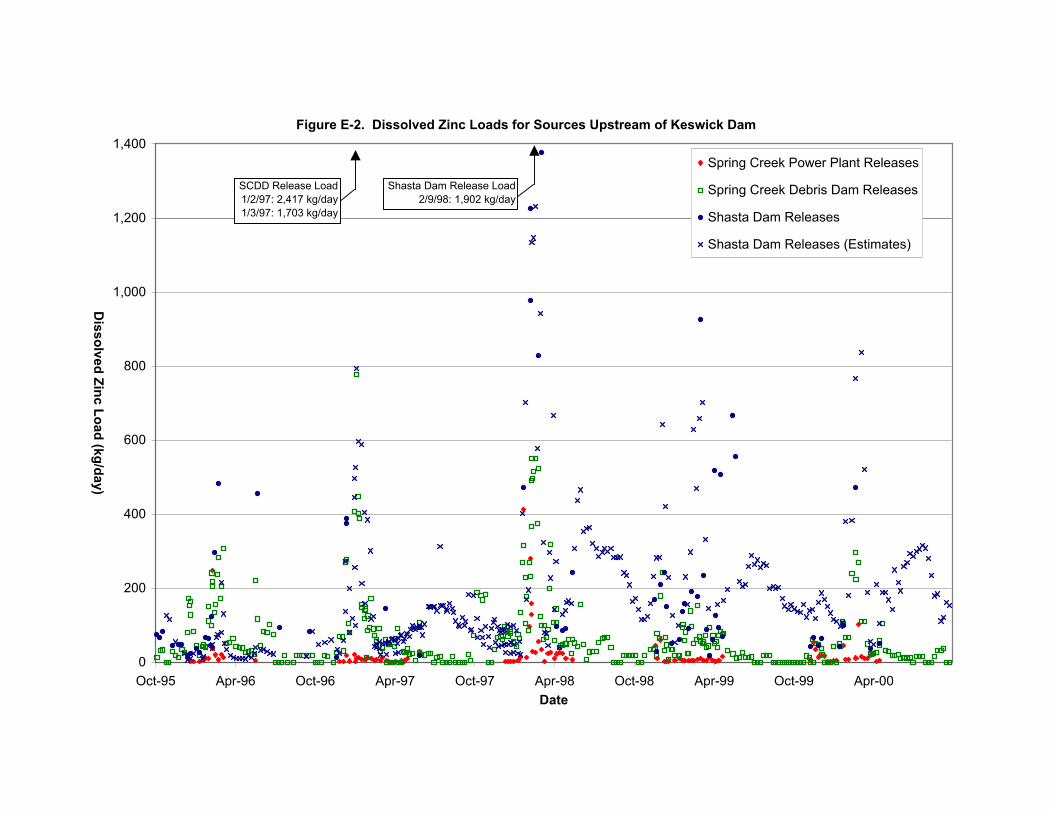
Figure E-2. Dissolved Zinc Loads for Sources Upstream of Keswick Dam
0
200
400
600
800
1,000
1,200
1,400
Oct-95 Apr-96 Oct-96 Apr-97 Oct-97 Apr-98 Oct-98 Apr-99 Oct-99 Apr-00Date
Dissolved Zinc Load (kg/day)
Spring Creek Power Plant Releases
Spring Creek Debris Dam Releases
Shasta Dam Releases
Shasta Dam Releases (Estimates)
Shasta Dam Release Load2/9/98: 1,902 kg/day
SCDD Release Load1/2/97: 2,417 kg/day1/3/97: 1,703 kg/day
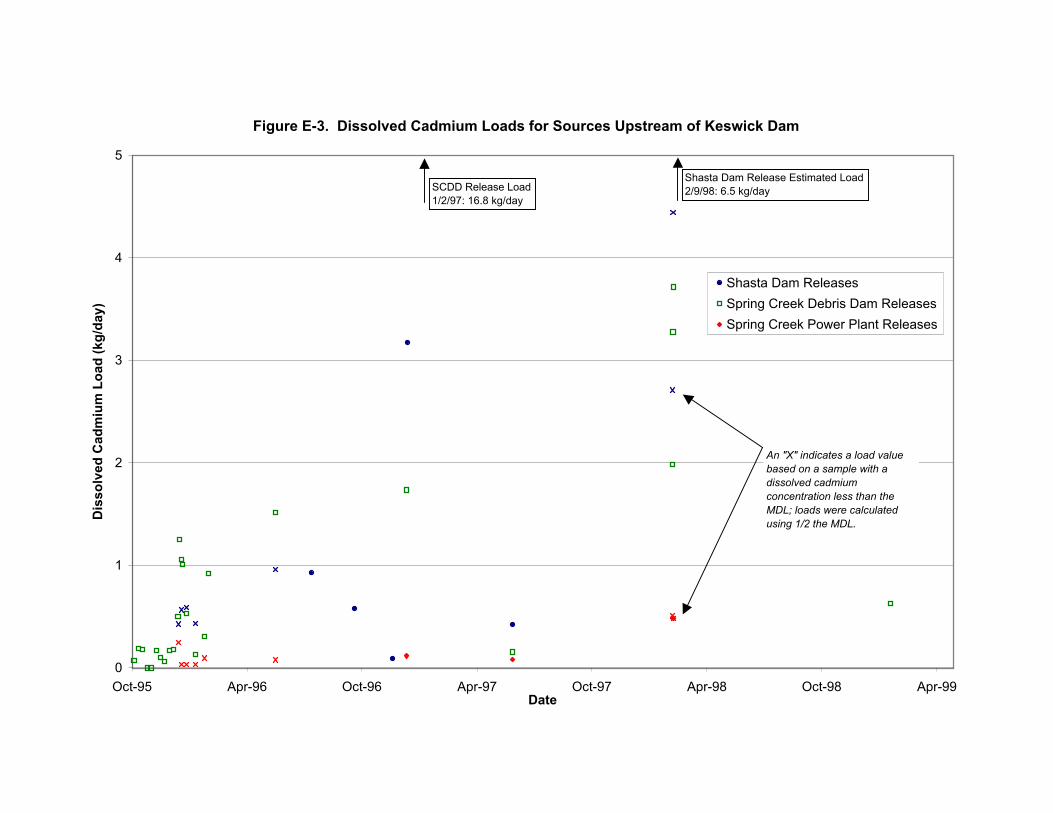
Figure E-3. Dissolved Cadmium Loads for Sources Upstream of Keswick Dam
0
1
2
3
4
5
Oct-95 Apr-96 Oct-96 Apr-97 Oct-97 Apr-98 Oct-98 Apr-99Date
Dis
solv
ed C
adm
ium
Loa
d (k
g/da
y)
Shasta Dam ReleasesSpring Creek Debris Dam ReleasesSpring Creek Power Plant Releases
SCDD Release Load1/2/97: 16.8 kg/day
Shasta Dam Release Estimated Load2/9/98: 6.5 kg/day
An "X" indicates a load value based on a sample with a dissolved cadmium concentration less than the MDL; loads were calculated using 1/2 the MDL.
Upper Sacramento River TMDL for Metals April 2002 F-1
APPENDIX F. DISSOLVED METAL BALANCES AND WATER BALANCES
FOR KESWICK RESERVOIR & SACRAMENTO RIVER BETWEEN KESWICK DAM AND BEND BRIDGE
Figure F-1A. Dissolved Copper & Water Balances for Keswick Reservoir
Figure F-1B. Dissolved Copper & Water Balances for Sacramento River (below Keswick Dam to above Bend Bridge)
Figure F-2A. Dissolved Zinc & Water Balances for Keswick Reservoir
Figure F-2B. Dissolved Zinc & Water Balances for Sacramento River (below Keswick Dam to above Bend Bridge)
Figure F-3A. Dissolved Cadmium & Water Balances for Keswick Reservoir
Figure F-3B. Dissolved Cadmium & Water Balances for Sacramento River (below Keswick Dam to above Bend Bridge)
Table F-1A. Dissolved Copper Mass Balance Calculations for Keswick Reservoir
Table F-1B. Dissolved Copper Mass Balance Calculations for Sacramento River (below Keswick Dam to above Bend Bridge)
Table F-2A. Dissolved Copper Mass Balance Calculations for Keswick Reservoir
Table F-2B. Dissolved Copper Mass Balance Calculations for Sacramento River (below Keswick Dam to above Bend Bridge)
Table F-3A. Dissolved Copper Mass Balance Calculations for Keswick Reservoir
Table F-3B. Dissolved Copper Mass Balance Calculations for Sacramento River (below Keswick Dam to above Bend Bridge)
Table F-4. Dissolved Metal Balances and Water Balances Summary Statistics
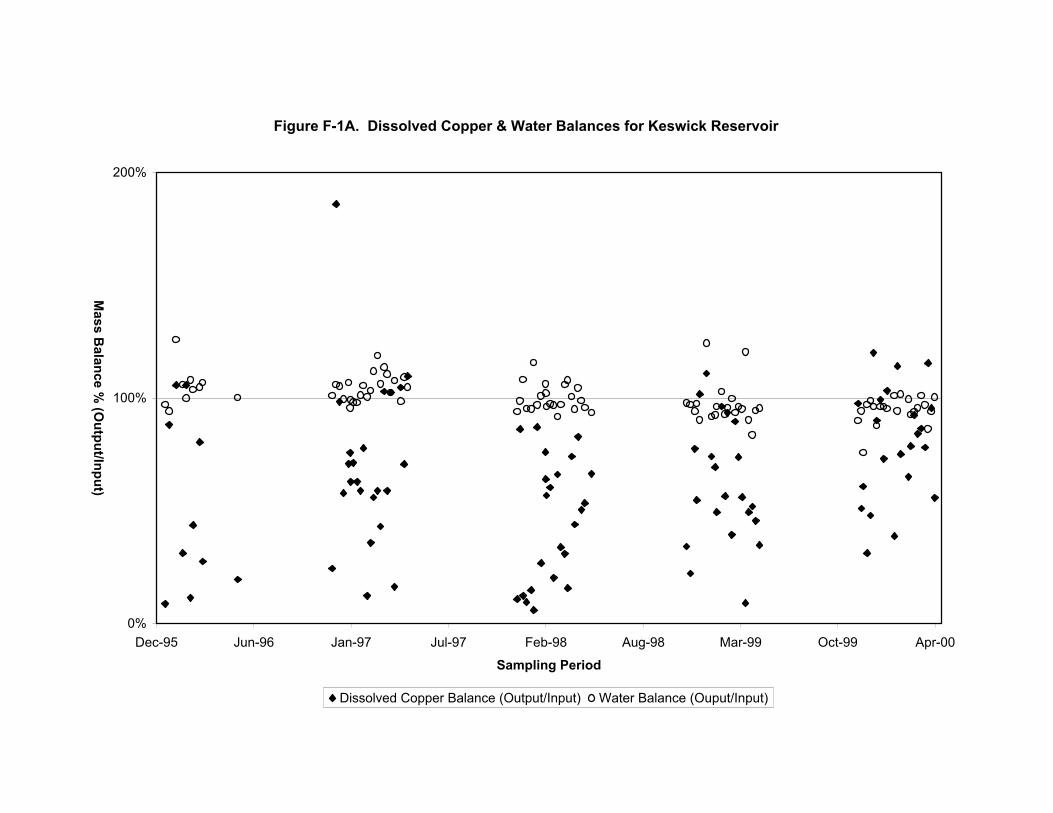
Figure F-1A. Dissolved Copper & Water Balances for Keswick Reservoir
0%
100%
200%
Dec-95 Jun-96 Jan-97 Jul-97 Feb-98 Aug-98 Mar-99 Oct-99 Apr-00
Sampling Period
Mass B
alance % (O
utput/Input)
Dissolved Copper Balance (Output/Input) Water Balance (Ouput/Input)
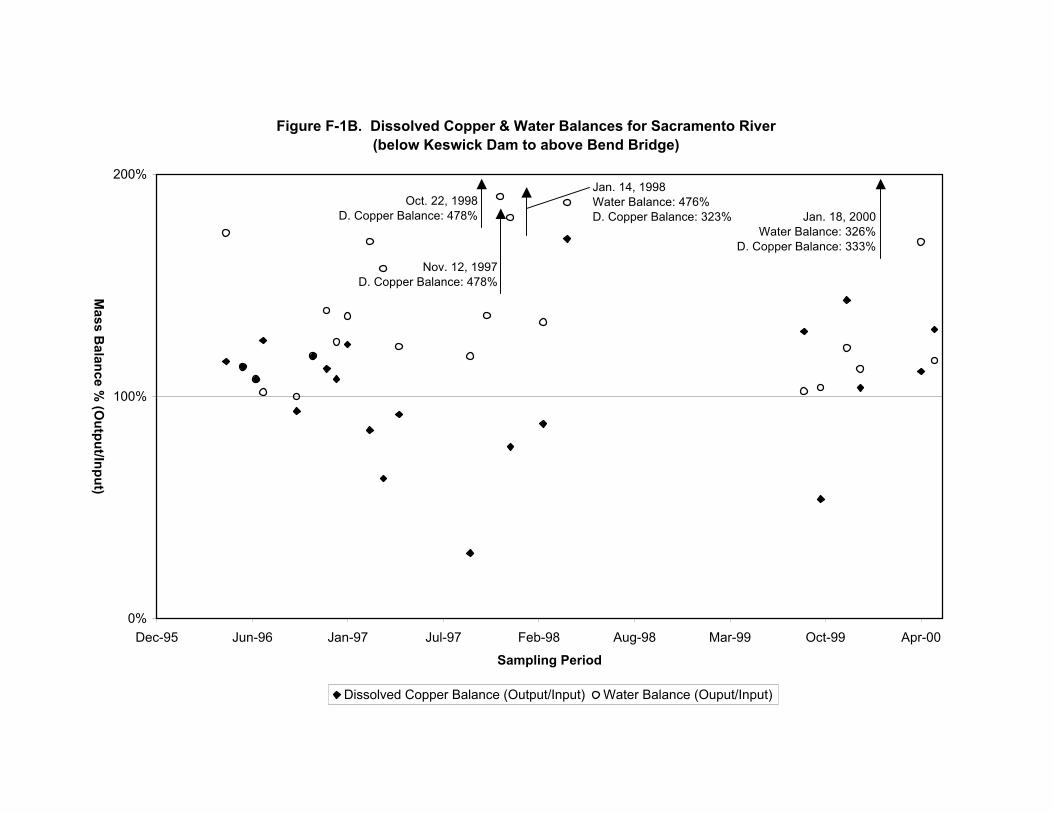
Figure F-1B. Dissolved Copper & Water Balances for Sacramento River(below Keswick Dam to above Bend Bridge)
0%
100%
200%
Dec-95 Jun-96 Jan-97 Jul-97 Feb-98 Aug-98 Mar-99 Oct-99 Apr-00
Sampling Period
Mass B
alance % (O
utput/Input)
Dissolved Copper Balance (Output/Input) Water Balance (Ouput/Input)
Jan. 14, 1998Water Balance: 476%D. Copper Balance: 323% Jan. 18, 2000
Water Balance: 326%D. Copper Balance: 333%
Oct. 22, 1998D. Copper Balance: 478%
Nov. 12, 1997D. Copper Balance: 478%
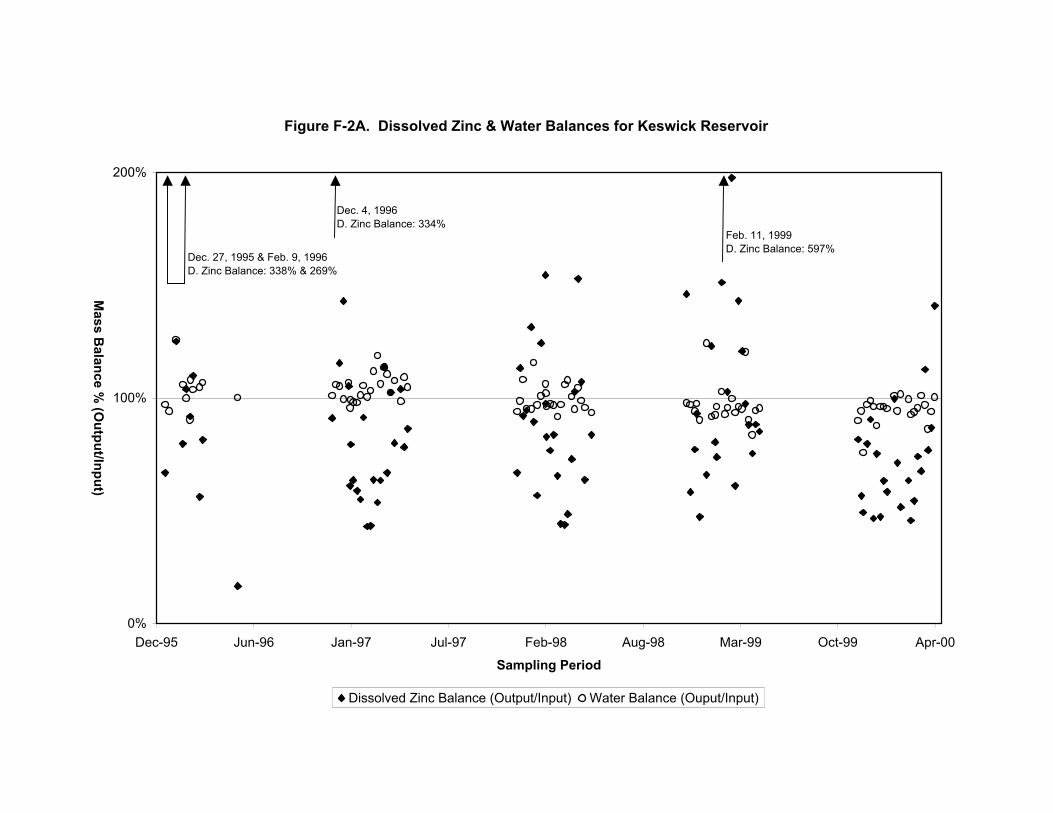
Figure F-2A. Dissolved Zinc & Water Balances for Keswick Reservoir
0%
100%
200%
Dec-95 Jun-96 Jan-97 Jul-97 Feb-98 Aug-98 Mar-99 Oct-99 Apr-00
Sampling Period
Mass B
alance % (O
utput/Input)
Dissolved Zinc Balance (Output/Input) Water Balance (Ouput/Input)
Dec. 4, 1996D. Zinc Balance: 334%
Dec. 27, 1995 & Feb. 9, 1996D. Zinc Balance: 338% & 269%
Feb. 11, 1999D. Zinc Balance: 597%

Figure F-2B. Dissolved Zinc & Water Balances for Sacramento River(below Keswick Dam to above Bend Bridge)
0%
100%
200%
Dec-95 Jun-96 Jan-97 Jul-97 Feb-98 Aug-98 Mar-99 Oct-99 Apr-00
Sampling Period
Mass B
alance % (O
utput/Input)
Dissolved Zinc Balance (Output/Input) Water Balance (Ouput/Input)
Apr. 24, 1996D. Zinc Balance: 347%
Jan. 14, 1998Water Balance: 476%
Mar. 19, 1997D. Zinc Balance: 292%
Jun. 26, 1996D. Zinc Balance: 216%
Jan. 18, 2000Water Balance: 326%
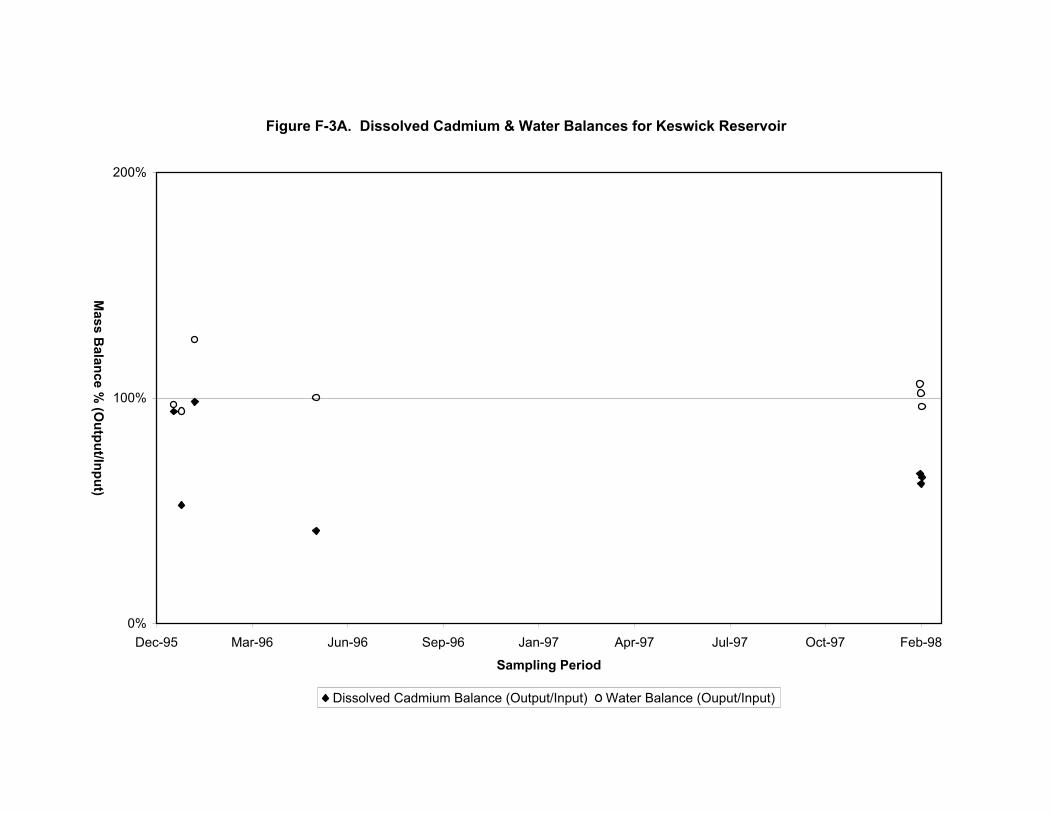
Figure F-3A. Dissolved Cadmium & Water Balances for Keswick Reservoir
0%
100%
200%
Dec-95 Mar-96 Jun-96 Sep-96 Jan-97 Apr-97 Jul-97 Oct-97 Feb-98
Sampling Period
Mass B
alance % (O
utput/Input)
Dissolved Cadmium Balance (Output/Input) Water Balance (Ouput/Input)
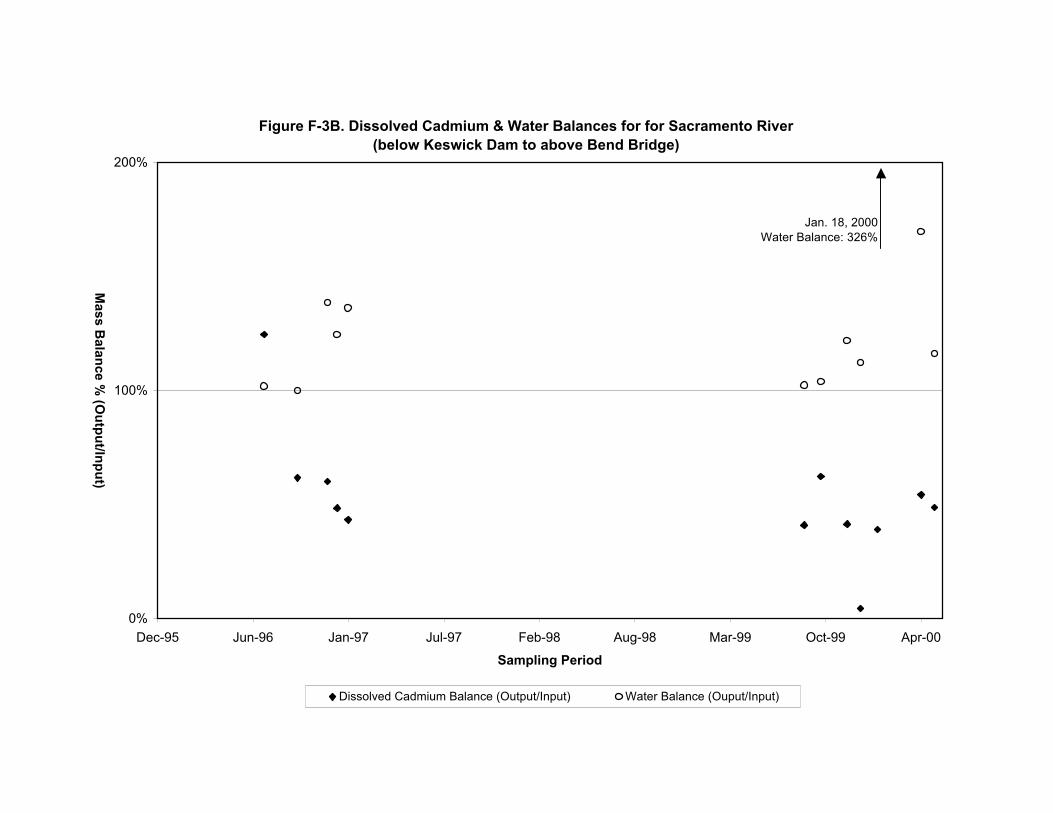
Figure F-3B. Dissolved Cadmium & Water Balances for for Sacramento River(below Keswick Dam to above Bend Bridge)
0%
100%
200%
Dec-95 Jun-96 Jan-97 Jul-97 Feb-98 Aug-98 Mar-99 Oct-99 Apr-00
Sampling Period
Mass B
alance % (O
utput/Input)
Dissolved Cadmium Balance (Output/Input) Water Balance (Ouput/Input)
Jan. 18, 2000Water Balance: 326%
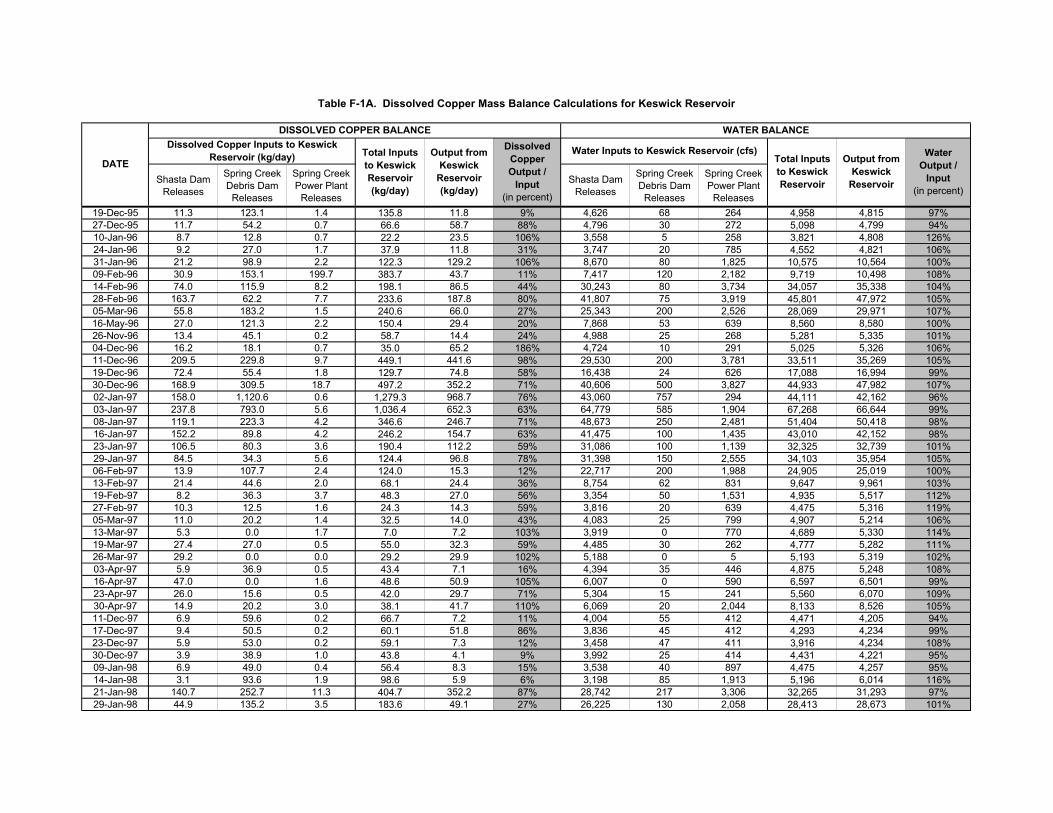
Shasta Dam Releases
Spring Creek Debris Dam
Releases
Spring Creek Power Plant
Releases
Shasta Dam Releases
Spring Creek Debris Dam
Releases
Spring Creek Power Plant
Releases19-Dec-95 11.3 123.1 1.4 135.8 11.8 9% 4,626 68 264 4,958 4,815 97%27-Dec-95 11.7 54.2 0.7 66.6 58.7 88% 4,796 30 272 5,098 4,799 94%10-Jan-96 8.7 12.8 0.7 22.2 23.5 106% 3,558 5 258 3,821 4,808 126%24-Jan-96 9.2 27.0 1.7 37.9 11.8 31% 3,747 20 785 4,552 4,821 106%31-Jan-96 21.2 98.9 2.2 122.3 129.2 106% 8,670 80 1,825 10,575 10,564 100%09-Feb-96 30.9 153.1 199.7 383.7 43.7 11% 7,417 120 2,182 9,719 10,498 108%14-Feb-96 74.0 115.9 8.2 198.1 86.5 44% 30,243 80 3,734 34,057 35,338 104%28-Feb-96 163.7 62.2 7.7 233.6 187.8 80% 41,807 75 3,919 45,801 47,972 105%05-Mar-96 55.8 183.2 1.5 240.6 66.0 27% 25,343 200 2,526 28,069 29,971 107%16-May-96 27.0 121.3 2.2 150.4 29.4 20% 7,868 53 639 8,560 8,580 100%26-Nov-96 13.4 45.1 0.2 58.7 14.4 24% 4,988 25 268 5,281 5,335 101%04-Dec-96 16.2 18.1 0.7 35.0 65.2 186% 4,724 10 291 5,025 5,326 106%11-Dec-96 209.5 229.8 9.7 449.1 441.6 98% 29,530 200 3,781 33,511 35,269 105%19-Dec-96 72.4 55.4 1.8 129.7 74.8 58% 16,438 24 626 17,088 16,994 99%30-Dec-96 168.9 309.5 18.7 497.2 352.2 71% 40,606 500 3,827 44,933 47,982 107%02-Jan-97 158.0 1,120.6 0.6 1,279.3 968.7 76% 43,060 757 294 44,111 42,162 96%03-Jan-97 237.8 793.0 5.6 1,036.4 652.3 63% 64,779 585 1,904 67,268 66,644 99%08-Jan-97 119.1 223.3 4.2 346.6 246.7 71% 48,673 250 2,481 51,404 50,418 98%16-Jan-97 152.2 89.8 4.2 246.2 154.7 63% 41,475 100 1,435 43,010 42,152 98%23-Jan-97 106.5 80.3 3.6 190.4 112.2 59% 31,086 100 1,139 32,325 32,739 101%29-Jan-97 84.5 34.3 5.6 124.4 96.8 78% 31,398 150 2,555 34,103 35,954 105%06-Feb-97 13.9 107.7 2.4 124.0 15.3 12% 22,717 200 1,988 24,905 25,019 100%13-Feb-97 21.4 44.6 2.0 68.1 24.4 36% 8,754 62 831 9,647 9,961 103%19-Feb-97 8.2 36.3 3.7 48.3 27.0 56% 3,354 50 1,531 4,935 5,517 112%27-Feb-97 10.3 12.5 1.6 24.3 14.3 59% 3,816 20 639 4,475 5,316 119%05-Mar-97 11.0 20.2 1.4 32.5 14.0 43% 4,083 25 799 4,907 5,214 106%13-Mar-97 5.3 0.0 1.7 7.0 7.2 103% 3,919 0 770 4,689 5,330 114%19-Mar-97 27.4 27.0 0.5 55.0 32.3 59% 4,485 30 262 4,777 5,282 111%26-Mar-97 29.2 0.0 0.0 29.2 29.9 102% 5,188 0 5 5,193 5,319 102%03-Apr-97 5.9 36.9 0.5 43.4 7.1 16% 4,394 35 446 4,875 5,248 108%16-Apr-97 47.0 0.0 1.6 48.6 50.9 105% 6,007 0 590 6,597 6,501 99%23-Apr-97 26.0 15.6 0.5 42.0 29.7 71% 5,304 15 241 5,560 6,070 109%30-Apr-97 14.9 20.2 3.0 38.1 41.7 110% 6,069 20 2,044 8,133 8,526 105%11-Dec-97 6.9 59.6 0.2 66.7 7.2 11% 4,004 55 412 4,471 4,205 94%17-Dec-97 9.4 50.5 0.2 60.1 51.8 86% 3,836 45 412 4,293 4,234 99%23-Dec-97 5.9 53.0 0.2 59.1 7.3 12% 3,458 47 411 3,916 4,234 108%30-Dec-97 3.9 38.9 1.0 43.8 4.1 9% 3,992 25 414 4,431 4,221 95%09-Jan-98 6.9 49.0 0.4 56.4 8.3 15% 3,538 40 897 4,475 4,257 95%14-Jan-98 3.1 93.6 1.9 98.6 5.9 6% 3,198 85 1,913 5,196 6,014 116%21-Jan-98 140.7 252.7 11.3 404.7 352.2 87% 28,742 217 3,306 32,265 31,293 97%29-Jan-98 44.9 135.2 3.5 183.6 49.1 27% 26,225 130 2,058 28,413 28,673 101%
Output from Keswick
Reservoir (kg/day)
DISSOLVED COPPER BALANCE
DATE
Dissolved Copper Output /
Input(in percent)
Water Output /
Input(in percent)
Table F-1A. Dissolved Copper Mass Balance Calculations for Keswick Reservoir
Water Inputs to Keswick Reservoir (cfs)Total Inputs to Keswick Reservoir
Output from Keswick
Reservoir
WATER BALANCEDissolved Copper Inputs to Keswick
Reservoir (kg/day) Total Inputs to Keswick Reservoir (kg/day)
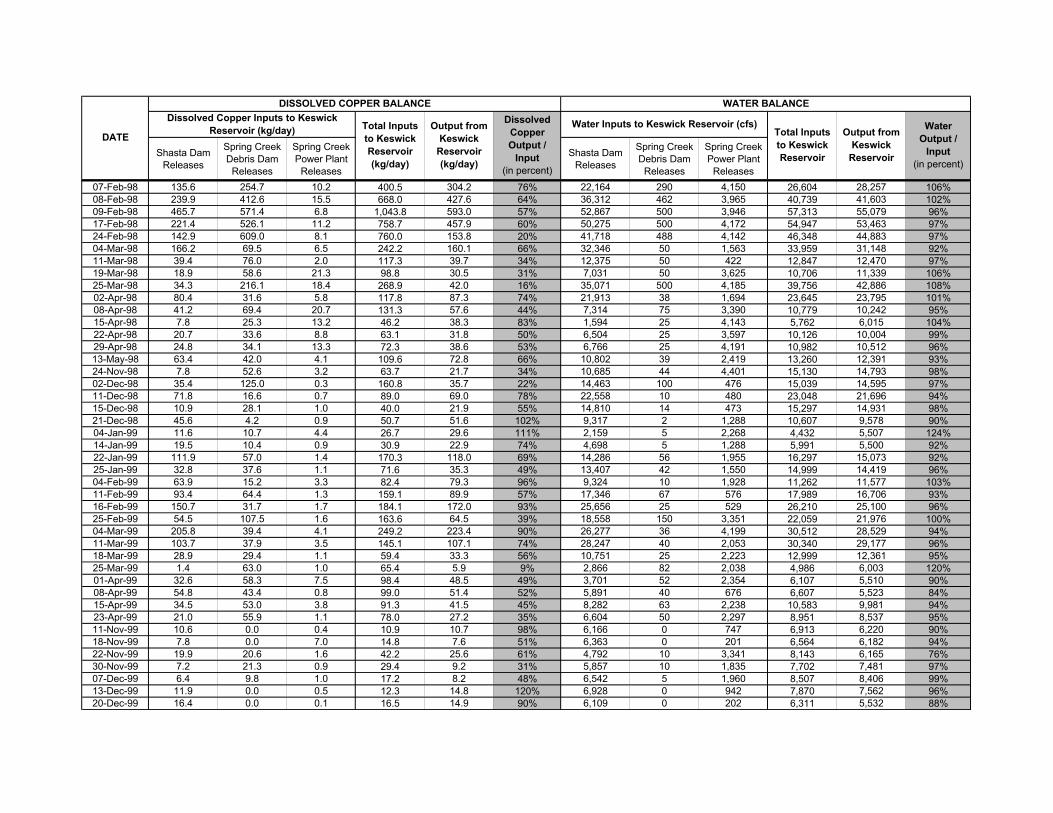
Shasta Dam Releases
Spring Creek Debris Dam
Releases
Spring Creek Power Plant
Releases
Shasta Dam Releases
Spring Creek Debris Dam
Releases
Spring Creek Power Plant
Releases
Output from Keswick
Reservoir (kg/day)
DISSOLVED COPPER BALANCE
DATE
Dissolved Copper Output /
Input(in percent)
Water Output /
Input(in percent)
Water Inputs to Keswick Reservoir (cfs)Total Inputs to Keswick Reservoir
Output from Keswick
Reservoir
WATER BALANCEDissolved Copper Inputs to Keswick
Reservoir (kg/day) Total Inputs to Keswick Reservoir (kg/day)
07-Feb-98 135.6 254.7 10.2 400.5 304.2 76% 22,164 290 4,150 26,604 28,257 106%08-Feb-98 239.9 412.6 15.5 668.0 427.6 64% 36,312 462 3,965 40,739 41,603 102%09-Feb-98 465.7 571.4 6.8 1,043.8 593.0 57% 52,867 500 3,946 57,313 55,079 96%17-Feb-98 221.4 526.1 11.2 758.7 457.9 60% 50,275 500 4,172 54,947 53,463 97%24-Feb-98 142.9 609.0 8.1 760.0 153.8 20% 41,718 488 4,142 46,348 44,883 97%04-Mar-98 166.2 69.5 6.5 242.2 160.1 66% 32,346 50 1,563 33,959 31,148 92%11-Mar-98 39.4 76.0 2.0 117.3 39.7 34% 12,375 50 422 12,847 12,470 97%19-Mar-98 18.9 58.6 21.3 98.8 30.5 31% 7,031 50 3,625 10,706 11,339 106%25-Mar-98 34.3 216.1 18.4 268.9 42.0 16% 35,071 500 4,185 39,756 42,886 108%02-Apr-98 80.4 31.6 5.8 117.8 87.3 74% 21,913 38 1,694 23,645 23,795 101%08-Apr-98 41.2 69.4 20.7 131.3 57.6 44% 7,314 75 3,390 10,779 10,242 95%15-Apr-98 7.8 25.3 13.2 46.2 38.3 83% 1,594 25 4,143 5,762 6,015 104%22-Apr-98 20.7 33.6 8.8 63.1 31.8 50% 6,504 25 3,597 10,126 10,004 99%29-Apr-98 24.8 34.1 13.3 72.3 38.6 53% 6,766 25 4,191 10,982 10,512 96%13-May-98 63.4 42.0 4.1 109.6 72.8 66% 10,802 39 2,419 13,260 12,391 93%24-Nov-98 7.8 52.6 3.2 63.7 21.7 34% 10,685 44 4,401 15,130 14,793 98%02-Dec-98 35.4 125.0 0.3 160.8 35.7 22% 14,463 100 476 15,039 14,595 97%11-Dec-98 71.8 16.6 0.7 89.0 69.0 78% 22,558 10 480 23,048 21,696 94%15-Dec-98 10.9 28.1 1.0 40.0 21.9 55% 14,810 14 473 15,297 14,931 98%21-Dec-98 45.6 4.2 0.9 50.7 51.6 102% 9,317 2 1,288 10,607 9,578 90%04-Jan-99 11.6 10.7 4.4 26.7 29.6 111% 2,159 5 2,268 4,432 5,507 124%14-Jan-99 19.5 10.4 0.9 30.9 22.9 74% 4,698 5 1,288 5,991 5,500 92%22-Jan-99 111.9 57.0 1.4 170.3 118.0 69% 14,286 56 1,955 16,297 15,073 92%25-Jan-99 32.8 37.6 1.1 71.6 35.3 49% 13,407 42 1,550 14,999 14,419 96%04-Feb-99 63.9 15.2 3.3 82.4 79.3 96% 9,324 10 1,928 11,262 11,577 103%11-Feb-99 93.4 64.4 1.3 159.1 89.9 57% 17,346 67 576 17,989 16,706 93%16-Feb-99 150.7 31.7 1.7 184.1 172.0 93% 25,656 25 529 26,210 25,100 96%25-Feb-99 54.5 107.5 1.6 163.6 64.5 39% 18,558 150 3,351 22,059 21,976 100%04-Mar-99 205.8 39.4 4.1 249.2 223.4 90% 26,277 36 4,199 30,512 28,529 94%11-Mar-99 103.7 37.9 3.5 145.1 107.1 74% 28,247 40 2,053 30,340 29,177 96%18-Mar-99 28.9 29.4 1.1 59.4 33.3 56% 10,751 25 2,223 12,999 12,361 95%25-Mar-99 1.4 63.0 1.0 65.4 5.9 9% 2,866 82 2,038 4,986 6,003 120%01-Apr-99 32.6 58.3 7.5 98.4 48.5 49% 3,701 52 2,354 6,107 5,510 90%08-Apr-99 54.8 43.4 0.8 99.0 51.4 52% 5,891 40 676 6,607 5,523 84%15-Apr-99 34.5 53.0 3.8 91.3 41.5 45% 8,282 63 2,238 10,583 9,981 94%23-Apr-99 21.0 55.9 1.1 78.0 27.2 35% 6,604 50 2,297 8,951 8,537 95%11-Nov-99 10.6 0.0 0.4 10.9 10.7 98% 6,166 0 747 6,913 6,220 90%18-Nov-99 7.8 0.0 7.0 14.8 7.6 51% 6,363 0 201 6,564 6,182 94%22-Nov-99 19.9 20.6 1.6 42.2 25.6 61% 4,792 10 3,341 8,143 6,165 76%30-Nov-99 7.2 21.3 0.9 29.4 9.2 31% 5,857 10 1,835 7,702 7,481 97%07-Dec-99 6.4 9.8 1.0 17.2 8.2 48% 6,542 5 1,960 8,507 8,406 99%13-Dec-99 11.9 0.0 0.5 12.3 14.8 120% 6,928 0 942 7,870 7,562 96%20-Dec-99 16.4 0.0 0.1 16.5 14.9 90% 6,109 0 202 6,311 5,532 88%
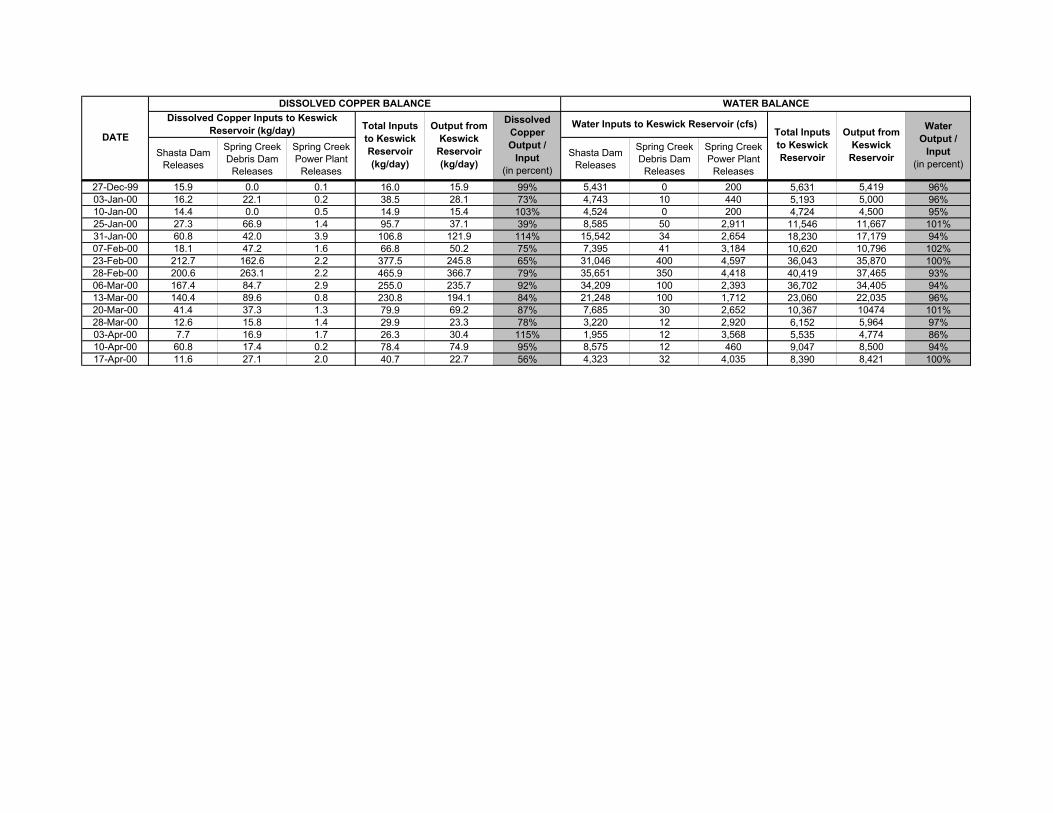
Shasta Dam Releases
Spring Creek Debris Dam
Releases
Spring Creek Power Plant
Releases
Shasta Dam Releases
Spring Creek Debris Dam
Releases
Spring Creek Power Plant
Releases
Output from Keswick
Reservoir (kg/day)
DISSOLVED COPPER BALANCE
DATE
Dissolved Copper Output /
Input(in percent)
Water Output /
Input(in percent)
Water Inputs to Keswick Reservoir (cfs)Total Inputs to Keswick Reservoir
Output from Keswick
Reservoir
WATER BALANCEDissolved Copper Inputs to Keswick
Reservoir (kg/day) Total Inputs to Keswick Reservoir (kg/day)
27-Dec-99 15.9 0.0 0.1 16.0 15.9 99% 5,431 0 200 5,631 5,419 96%03-Jan-00 16.2 22.1 0.2 38.5 28.1 73% 4,743 10 440 5,193 5,000 96%10-Jan-00 14.4 0.0 0.5 14.9 15.4 103% 4,524 0 200 4,724 4,500 95%25-Jan-00 27.3 66.9 1.4 95.7 37.1 39% 8,585 50 2,911 11,546 11,667 101%31-Jan-00 60.8 42.0 3.9 106.8 121.9 114% 15,542 34 2,654 18,230 17,179 94%07-Feb-00 18.1 47.2 1.6 66.8 50.2 75% 7,395 41 3,184 10,620 10,796 102%23-Feb-00 212.7 162.6 2.2 377.5 245.8 65% 31,046 400 4,597 36,043 35,870 100%28-Feb-00 200.6 263.1 2.2 465.9 366.7 79% 35,651 350 4,418 40,419 37,465 93%06-Mar-00 167.4 84.7 2.9 255.0 235.7 92% 34,209 100 2,393 36,702 34,405 94%13-Mar-00 140.4 89.6 0.8 230.8 194.1 84% 21,248 100 1,712 23,060 22,035 96%20-Mar-00 41.4 37.3 1.3 79.9 69.2 87% 7,685 30 2,652 10,367 10474 101%28-Mar-00 12.6 15.8 1.4 29.9 23.3 78% 3,220 12 2,920 6,152 5,964 97%03-Apr-00 7.7 16.9 1.7 26.3 30.4 115% 1,955 12 3,568 5,535 4,774 86%10-Apr-00 60.8 17.4 0.2 78.4 74.9 95% 8,575 12 460 9,047 8,500 94%17-Apr-00 11.6 27.1 2.0 40.7 22.7 56% 4,323 32 4,035 8,390 8,421 100%
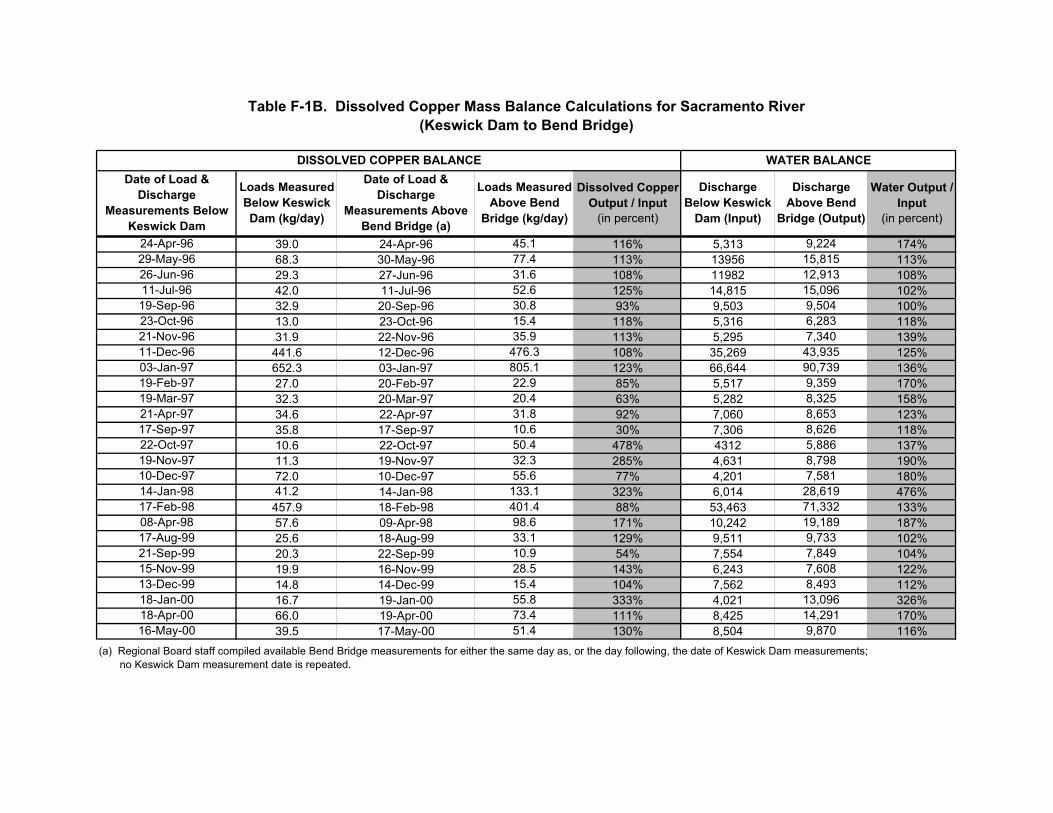
24-Apr-96 39.0 24-Apr-96 45.1 116% 5,313 9,224 174%29-May-96 68.3 30-May-96 77.4 113% 13956 15,815 113%26-Jun-96 29.3 27-Jun-96 31.6 108% 11982 12,913 108%11-Jul-96 42.0 11-Jul-96 52.6 125% 14,815 15,096 102%19-Sep-96 32.9 20-Sep-96 30.8 93% 9,503 9,504 100%23-Oct-96 13.0 23-Oct-96 15.4 118% 5,316 6,283 118%21-Nov-96 31.9 22-Nov-96 35.9 113% 5,295 7,340 139%11-Dec-96 441.6 12-Dec-96 476.3 108% 35,269 43,935 125%03-Jan-97 652.3 03-Jan-97 805.1 123% 66,644 90,739 136%19-Feb-97 27.0 20-Feb-97 22.9 85% 5,517 9,359 170%19-Mar-97 32.3 20-Mar-97 20.4 63% 5,282 8,325 158%21-Apr-97 34.6 22-Apr-97 31.8 92% 7,060 8,653 123%17-Sep-97 35.8 17-Sep-97 10.6 30% 7,306 8,626 118%22-Oct-97 10.6 22-Oct-97 50.4 478% 4312 5,886 137%19-Nov-97 11.3 19-Nov-97 32.3 285% 4,631 8,798 190%10-Dec-97 72.0 10-Dec-97 55.6 77% 4,201 7,581 180%14-Jan-98 41.2 14-Jan-98 133.1 323% 6,014 28,619 476%17-Feb-98 457.9 18-Feb-98 401.4 88% 53,463 71,332 133%08-Apr-98 57.6 09-Apr-98 98.6 171% 10,242 19,189 187%17-Aug-99 25.6 18-Aug-99 33.1 129% 9,511 9,733 102%21-Sep-99 20.3 22-Sep-99 10.9 54% 7,554 7,849 104%15-Nov-99 19.9 16-Nov-99 28.5 143% 6,243 7,608 122%13-Dec-99 14.8 14-Dec-99 15.4 104% 7,562 8,493 112%18-Jan-00 16.7 19-Jan-00 55.8 333% 4,021 13,096 326%18-Apr-00 66.0 19-Apr-00 73.4 111% 8,425 14,291 170%16-May-00 39.5 17-May-00 51.4 130% 8,504 9,870 116%
Table F-1B. Dissolved Copper Mass Balance Calculations for Sacramento River(Keswick Dam to Bend Bridge)
Discharge Below Keswick
Dam (Input)
Discharge Above Bend
Bridge (Output)
WATER BALANCE
Loads Measured Below Keswick Dam (kg/day)
Loads Measured Above Bend
Bridge (kg/day)
(a) Regional Board staff compiled available Bend Bridge measurements for either the same day as, or the day following, the date of Keswick Dam measurements; no Keswick Dam measurement date is repeated.
Dissolved Copper Output / Input
(in percent)
DISSOLVED COPPER BALANCEDate of Load &
Discharge Measurements Below
Keswick Dam
Date of Load & Discharge
Measurements Above Bend Bridge (a)
Water Output / Input
(in percent)
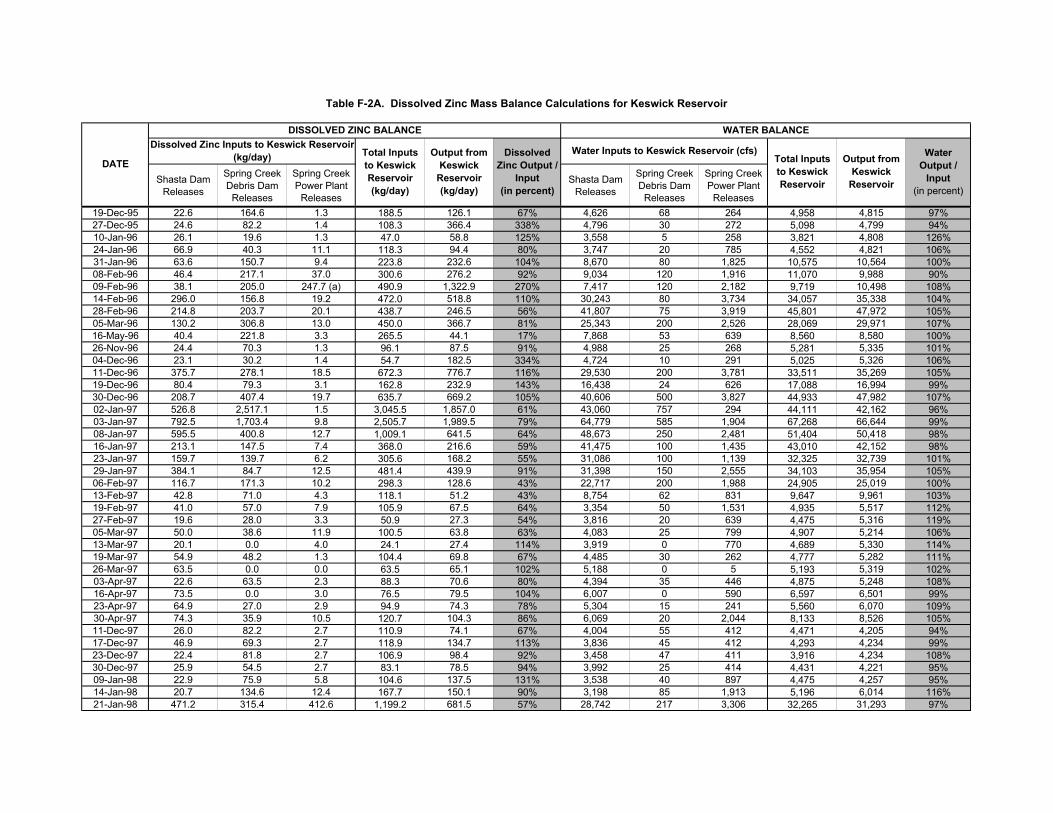
Shasta Dam Releases
Spring Creek Debris Dam
Releases
Spring Creek Power Plant
Releases
Shasta Dam Releases
Spring Creek Debris Dam
Releases
Spring Creek Power Plant
Releases19-Dec-95 22.6 164.6 1.3 188.5 126.1 67% 4,626 68 264 4,958 4,815 97%27-Dec-95 24.6 82.2 1.4 108.3 366.4 338% 4,796 30 272 5,098 4,799 94%10-Jan-96 26.1 19.6 1.3 47.0 58.8 125% 3,558 5 258 3,821 4,808 126%24-Jan-96 66.9 40.3 11.1 118.3 94.4 80% 3,747 20 785 4,552 4,821 106%31-Jan-96 63.6 150.7 9.4 223.8 232.6 104% 8,670 80 1,825 10,575 10,564 100%08-Feb-96 46.4 217.1 37.0 300.6 276.2 92% 9,034 120 1,916 11,070 9,988 90%09-Feb-96 38.1 205.0 247.7 (a) 490.9 1,322.9 270% 7,417 120 2,182 9,719 10,498 108%14-Feb-96 296.0 156.8 19.2 472.0 518.8 110% 30,243 80 3,734 34,057 35,338 104%28-Feb-96 214.8 203.7 20.1 438.7 246.5 56% 41,807 75 3,919 45,801 47,972 105%05-Mar-96 130.2 306.8 13.0 450.0 366.7 81% 25,343 200 2,526 28,069 29,971 107%16-May-96 40.4 221.8 3.3 265.5 44.1 17% 7,868 53 639 8,560 8,580 100%26-Nov-96 24.4 70.3 1.3 96.1 87.5 91% 4,988 25 268 5,281 5,335 101%04-Dec-96 23.1 30.2 1.4 54.7 182.5 334% 4,724 10 291 5,025 5,326 106%11-Dec-96 375.7 278.1 18.5 672.3 776.7 116% 29,530 200 3,781 33,511 35,269 105%19-Dec-96 80.4 79.3 3.1 162.8 232.9 143% 16,438 24 626 17,088 16,994 99%30-Dec-96 208.7 407.4 19.7 635.7 669.2 105% 40,606 500 3,827 44,933 47,982 107%02-Jan-97 526.8 2,517.1 1.5 3,045.5 1,857.0 61% 43,060 757 294 44,111 42,162 96%03-Jan-97 792.5 1,703.4 9.8 2,505.7 1,989.5 79% 64,779 585 1,904 67,268 66,644 99%08-Jan-97 595.5 400.8 12.7 1,009.1 641.5 64% 48,673 250 2,481 51,404 50,418 98%16-Jan-97 213.1 147.5 7.4 368.0 216.6 59% 41,475 100 1,435 43,010 42,152 98%23-Jan-97 159.7 139.7 6.2 305.6 168.2 55% 31,086 100 1,139 32,325 32,739 101%29-Jan-97 384.1 84.7 12.5 481.4 439.9 91% 31,398 150 2,555 34,103 35,954 105%06-Feb-97 116.7 171.3 10.2 298.3 128.6 43% 22,717 200 1,988 24,905 25,019 100%13-Feb-97 42.8 71.0 4.3 118.1 51.2 43% 8,754 62 831 9,647 9,961 103%19-Feb-97 41.0 57.0 7.9 105.9 67.5 64% 3,354 50 1,531 4,935 5,517 112%27-Feb-97 19.6 28.0 3.3 50.9 27.3 54% 3,816 20 639 4,475 5,316 119%05-Mar-97 50.0 38.6 11.9 100.5 63.8 63% 4,083 25 799 4,907 5,214 106%13-Mar-97 20.1 0.0 4.0 24.1 27.4 114% 3,919 0 770 4,689 5,330 114%19-Mar-97 54.9 48.2 1.3 104.4 69.8 67% 4,485 30 262 4,777 5,282 111%26-Mar-97 63.5 0.0 0.0 63.5 65.1 102% 5,188 0 5 5,193 5,319 102%03-Apr-97 22.6 63.5 2.3 88.3 70.6 80% 4,394 35 446 4,875 5,248 108%16-Apr-97 73.5 0.0 3.0 76.5 79.5 104% 6,007 0 590 6,597 6,501 99%23-Apr-97 64.9 27.0 2.9 94.9 74.3 78% 5,304 15 241 5,560 6,070 109%30-Apr-97 74.3 35.9 10.5 120.7 104.3 86% 6,069 20 2,044 8,133 8,526 105%11-Dec-97 26.0 82.2 2.7 110.9 74.1 67% 4,004 55 412 4,471 4,205 94%17-Dec-97 46.9 69.3 2.7 118.9 134.7 113% 3,836 45 412 4,293 4,234 99%23-Dec-97 22.4 81.8 2.7 106.9 98.4 92% 3,458 47 411 3,916 4,234 108%30-Dec-97 25.9 54.5 2.7 83.1 78.5 94% 3,992 25 414 4,431 4,221 95%09-Jan-98 22.9 75.9 5.8 104.6 137.5 131% 3,538 40 897 4,475 4,257 95%14-Jan-98 20.7 134.6 12.4 167.7 150.1 90% 3,198 85 1,913 5,196 6,014 116%21-Jan-98 471.2 315.4 412.6 1,199.2 681.5 57% 28,742 217 3,306 32,265 31,293 97%
Table F-2A. Dissolved Zinc Mass Balance Calculations for Keswick Reservoir
Water Inputs to Keswick Reservoir (cfs)Total Inputs to Keswick Reservoir
Output from Keswick
Reservoir
WATER BALANCEDissolved Zinc Inputs to Keswick Reservoir
(kg/day) Total Inputs to Keswick Reservoir (kg/day)
Output from Keswick
Reservoir (kg/day)
DISSOLVED ZINC BALANCE
DATEDissolved
Zinc Output / Input
(in percent)
Water Output /
Input(in percent)
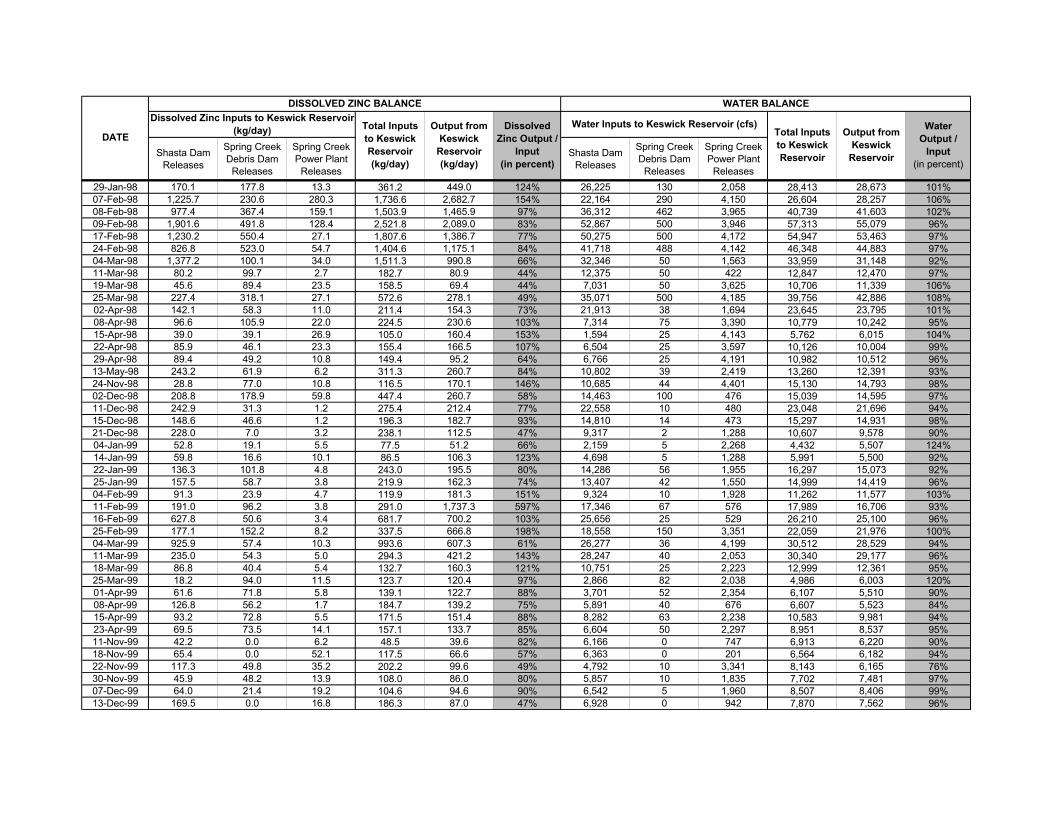
Shasta Dam Releases
Spring Creek Debris Dam
Releases
Spring Creek Power Plant
Releases
Shasta Dam Releases
Spring Creek Debris Dam
Releases
Spring Creek Power Plant
Releases
Water Inputs to Keswick Reservoir (cfs)Total Inputs to Keswick Reservoir
Output from Keswick
Reservoir
WATER BALANCEDissolved Zinc Inputs to Keswick Reservoir
(kg/day) Total Inputs to Keswick Reservoir (kg/day)
Output from Keswick
Reservoir (kg/day)
DISSOLVED ZINC BALANCE
DATEDissolved
Zinc Output / Input
(in percent)
Water Output /
Input(in percent)
29-Jan-98 170.1 177.8 13.3 361.2 449.0 124% 26,225 130 2,058 28,413 28,673 101%07-Feb-98 1,225.7 230.6 280.3 1,736.6 2,682.7 154% 22,164 290 4,150 26,604 28,257 106%08-Feb-98 977.4 367.4 159.1 1,503.9 1,465.9 97% 36,312 462 3,965 40,739 41,603 102%09-Feb-98 1,901.6 491.8 128.4 2,521.8 2,089.0 83% 52,867 500 3,946 57,313 55,079 96%17-Feb-98 1,230.2 550.4 27.1 1,807.6 1,386.7 77% 50,275 500 4,172 54,947 53,463 97%24-Feb-98 826.8 523.0 54.7 1,404.6 1,175.1 84% 41,718 488 4,142 46,348 44,883 97%04-Mar-98 1,377.2 100.1 34.0 1,511.3 990.8 66% 32,346 50 1,563 33,959 31,148 92%11-Mar-98 80.2 99.7 2.7 182.7 80.9 44% 12,375 50 422 12,847 12,470 97%19-Mar-98 45.6 89.4 23.5 158.5 69.4 44% 7,031 50 3,625 10,706 11,339 106%25-Mar-98 227.4 318.1 27.1 572.6 278.1 49% 35,071 500 4,185 39,756 42,886 108%02-Apr-98 142.1 58.3 11.0 211.4 154.3 73% 21,913 38 1,694 23,645 23,795 101%08-Apr-98 96.6 105.9 22.0 224.5 230.6 103% 7,314 75 3,390 10,779 10,242 95%15-Apr-98 39.0 39.1 26.9 105.0 160.4 153% 1,594 25 4,143 5,762 6,015 104%22-Apr-98 85.9 46.1 23.3 155.4 166.5 107% 6,504 25 3,597 10,126 10,004 99%29-Apr-98 89.4 49.2 10.8 149.4 95.2 64% 6,766 25 4,191 10,982 10,512 96%13-May-98 243.2 61.9 6.2 311.3 260.7 84% 10,802 39 2,419 13,260 12,391 93%24-Nov-98 28.8 77.0 10.8 116.5 170.1 146% 10,685 44 4,401 15,130 14,793 98%02-Dec-98 208.8 178.9 59.8 447.4 260.7 58% 14,463 100 476 15,039 14,595 97%11-Dec-98 242.9 31.3 1.2 275.4 212.4 77% 22,558 10 480 23,048 21,696 94%15-Dec-98 148.6 46.6 1.2 196.3 182.7 93% 14,810 14 473 15,297 14,931 98%21-Dec-98 228.0 7.0 3.2 238.1 112.5 47% 9,317 2 1,288 10,607 9,578 90%04-Jan-99 52.8 19.1 5.5 77.5 51.2 66% 2,159 5 2,268 4,432 5,507 124%14-Jan-99 59.8 16.6 10.1 86.5 106.3 123% 4,698 5 1,288 5,991 5,500 92%22-Jan-99 136.3 101.8 4.8 243.0 195.5 80% 14,286 56 1,955 16,297 15,073 92%25-Jan-99 157.5 58.7 3.8 219.9 162.3 74% 13,407 42 1,550 14,999 14,419 96%04-Feb-99 91.3 23.9 4.7 119.9 181.3 151% 9,324 10 1,928 11,262 11,577 103%11-Feb-99 191.0 96.2 3.8 291.0 1,737.3 597% 17,346 67 576 17,989 16,706 93%16-Feb-99 627.8 50.6 3.4 681.7 700.2 103% 25,656 25 529 26,210 25,100 96%25-Feb-99 177.1 152.2 8.2 337.5 666.8 198% 18,558 150 3,351 22,059 21,976 100%04-Mar-99 925.9 57.4 10.3 993.6 607.3 61% 26,277 36 4,199 30,512 28,529 94%11-Mar-99 235.0 54.3 5.0 294.3 421.2 143% 28,247 40 2,053 30,340 29,177 96%18-Mar-99 86.8 40.4 5.4 132.7 160.3 121% 10,751 25 2,223 12,999 12,361 95%25-Mar-99 18.2 94.0 11.5 123.7 120.4 97% 2,866 82 2,038 4,986 6,003 120%01-Apr-99 61.6 71.8 5.8 139.1 122.7 88% 3,701 52 2,354 6,107 5,510 90%08-Apr-99 126.8 56.2 1.7 184.7 139.2 75% 5,891 40 676 6,607 5,523 84%15-Apr-99 93.2 72.8 5.5 171.5 151.4 88% 8,282 63 2,238 10,583 9,981 94%23-Apr-99 69.5 73.5 14.1 157.1 133.7 85% 6,604 50 2,297 8,951 8,537 95%11-Nov-99 42.2 0.0 6.2 48.5 39.6 82% 6,166 0 747 6,913 6,220 90%18-Nov-99 65.4 0.0 52.1 117.5 66.6 57% 6,363 0 201 6,564 6,182 94%22-Nov-99 117.3 49.8 35.2 202.2 99.6 49% 4,792 10 3,341 8,143 6,165 76%30-Nov-99 45.9 48.2 13.9 108.0 86.0 80% 5,857 10 1,835 7,702 7,481 97%07-Dec-99 64.0 21.4 19.2 104.6 94.6 90% 6,542 5 1,960 8,507 8,406 99%13-Dec-99 169.5 0.0 16.8 186.3 87.0 47% 6,928 0 942 7,870 7,562 96%
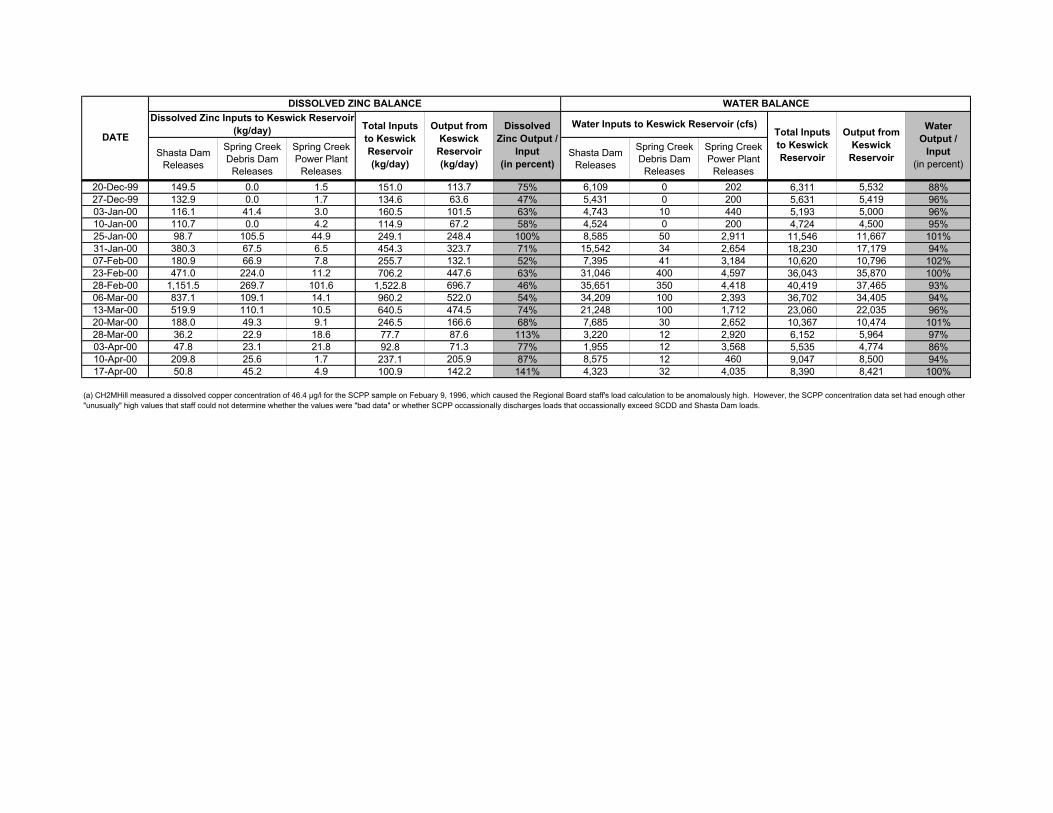
Shasta Dam Releases
Spring Creek Debris Dam
Releases
Spring Creek Power Plant
Releases
Shasta Dam Releases
Spring Creek Debris Dam
Releases
Spring Creek Power Plant
Releases
Water Inputs to Keswick Reservoir (cfs)Total Inputs to Keswick Reservoir
Output from Keswick
Reservoir
WATER BALANCEDissolved Zinc Inputs to Keswick Reservoir
(kg/day) Total Inputs to Keswick Reservoir (kg/day)
Output from Keswick
Reservoir (kg/day)
DISSOLVED ZINC BALANCE
DATEDissolved
Zinc Output / Input
(in percent)
Water Output /
Input(in percent)
20-Dec-99 149.5 0.0 1.5 151.0 113.7 75% 6,109 0 202 6,311 5,532 88%27-Dec-99 132.9 0.0 1.7 134.6 63.6 47% 5,431 0 200 5,631 5,419 96%03-Jan-00 116.1 41.4 3.0 160.5 101.5 63% 4,743 10 440 5,193 5,000 96%10-Jan-00 110.7 0.0 4.2 114.9 67.2 58% 4,524 0 200 4,724 4,500 95%25-Jan-00 98.7 105.5 44.9 249.1 248.4 100% 8,585 50 2,911 11,546 11,667 101%31-Jan-00 380.3 67.5 6.5 454.3 323.7 71% 15,542 34 2,654 18,230 17,179 94%07-Feb-00 180.9 66.9 7.8 255.7 132.1 52% 7,395 41 3,184 10,620 10,796 102%23-Feb-00 471.0 224.0 11.2 706.2 447.6 63% 31,046 400 4,597 36,043 35,870 100%28-Feb-00 1,151.5 269.7 101.6 1,522.8 696.7 46% 35,651 350 4,418 40,419 37,465 93%06-Mar-00 837.1 109.1 14.1 960.2 522.0 54% 34,209 100 2,393 36,702 34,405 94%13-Mar-00 519.9 110.1 10.5 640.5 474.5 74% 21,248 100 1,712 23,060 22,035 96%20-Mar-00 188.0 49.3 9.1 246.5 166.6 68% 7,685 30 2,652 10,367 10,474 101%28-Mar-00 36.2 22.9 18.6 77.7 87.6 113% 3,220 12 2,920 6,152 5,964 97%03-Apr-00 47.8 23.1 21.8 92.8 71.3 77% 1,955 12 3,568 5,535 4,774 86%10-Apr-00 209.8 25.6 1.7 237.1 205.9 87% 8,575 12 460 9,047 8,500 94%17-Apr-00 50.8 45.2 4.9 100.9 142.2 141% 4,323 32 4,035 8,390 8,421 100%
(a) CH2MHill measured a dissolved copper concentration of 46.4 µg/l for the SCPP sample on Febuary 9, 1996, which caused the Regional Board staff's load calculation to be anomalously high. However, the SCPP concentration data set had enough other "unusually" high values that staff could not determine whether the values were "bad data" or whether SCPP occassionally discharges loads that occassionally exceed SCDD and Shasta Dam loads.
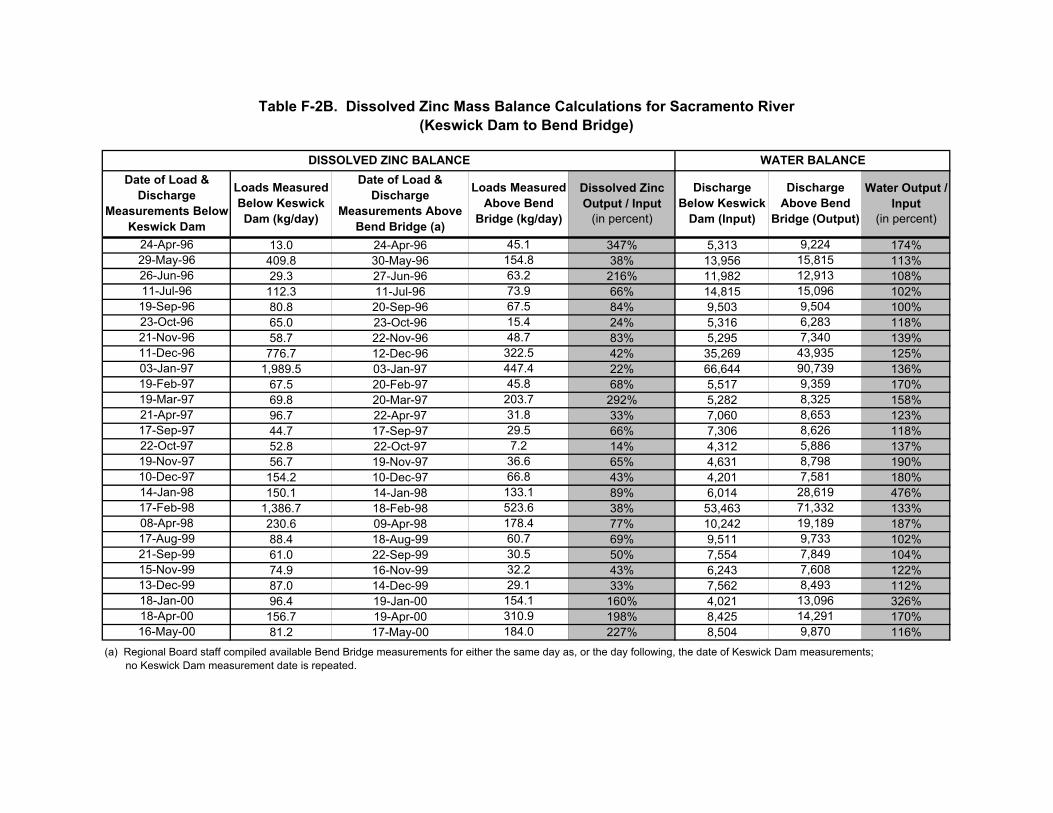
24-Apr-96 13.0 24-Apr-96 45.1 347% 5,313 9,224 174%29-May-96 409.8 30-May-96 154.8 38% 13,956 15,815 113%26-Jun-96 29.3 27-Jun-96 63.2 216% 11,982 12,913 108%11-Jul-96 112.3 11-Jul-96 73.9 66% 14,815 15,096 102%19-Sep-96 80.8 20-Sep-96 67.5 84% 9,503 9,504 100%23-Oct-96 65.0 23-Oct-96 15.4 24% 5,316 6,283 118%21-Nov-96 58.7 22-Nov-96 48.7 83% 5,295 7,340 139%11-Dec-96 776.7 12-Dec-96 322.5 42% 35,269 43,935 125%03-Jan-97 1,989.5 03-Jan-97 447.4 22% 66,644 90,739 136%19-Feb-97 67.5 20-Feb-97 45.8 68% 5,517 9,359 170%19-Mar-97 69.8 20-Mar-97 203.7 292% 5,282 8,325 158%21-Apr-97 96.7 22-Apr-97 31.8 33% 7,060 8,653 123%17-Sep-97 44.7 17-Sep-97 29.5 66% 7,306 8,626 118%22-Oct-97 52.8 22-Oct-97 7.2 14% 4,312 5,886 137%19-Nov-97 56.7 19-Nov-97 36.6 65% 4,631 8,798 190%10-Dec-97 154.2 10-Dec-97 66.8 43% 4,201 7,581 180%14-Jan-98 150.1 14-Jan-98 133.1 89% 6,014 28,619 476%17-Feb-98 1,386.7 18-Feb-98 523.6 38% 53,463 71,332 133%08-Apr-98 230.6 09-Apr-98 178.4 77% 10,242 19,189 187%17-Aug-99 88.4 18-Aug-99 60.7 69% 9,511 9,733 102%21-Sep-99 61.0 22-Sep-99 30.5 50% 7,554 7,849 104%15-Nov-99 74.9 16-Nov-99 32.2 43% 6,243 7,608 122%13-Dec-99 87.0 14-Dec-99 29.1 33% 7,562 8,493 112%18-Jan-00 96.4 19-Jan-00 154.1 160% 4,021 13,096 326%18-Apr-00 156.7 19-Apr-00 310.9 198% 8,425 14,291 170%16-May-00 81.2 17-May-00 184.0 227% 8,504 9,870 116%
(a) Regional Board staff compiled available Bend Bridge measurements for either the same day as, or the day following, the date of Keswick Dam measurements; no Keswick Dam measurement date is repeated.
Dissolved Zinc Output / Input
(in percent)
Water Output / Input
(in percent)
Table F-2B. Dissolved Zinc Mass Balance Calculations for Sacramento River(Keswick Dam to Bend Bridge)
Discharge Below Keswick
Dam (Input)
Discharge Above Bend
Bridge (Output)
WATER BALANCE
Loads Measured Below Keswick Dam (kg/day)
Loads Measured Above Bend
Bridge (kg/day)
DISSOLVED ZINC BALANCEDate of Load &
Discharge Measurements Below
Keswick Dam
Date of Load & Discharge
Measurements Above Bend Bridge (a)
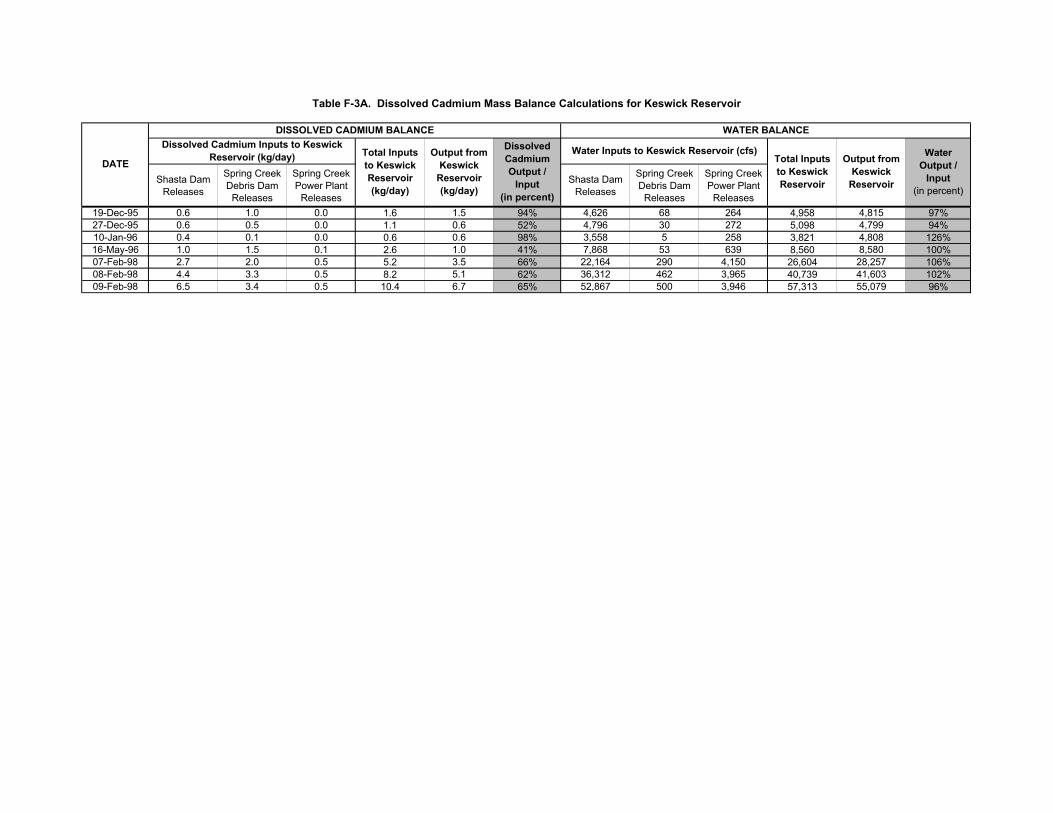
Shasta Dam Releases
Spring Creek Debris Dam
Releases
Spring Creek Power Plant
Releases
Shasta Dam Releases
Spring Creek Debris Dam
Releases
Spring Creek Power Plant
Releases19-Dec-95 0.6 1.0 0.0 1.6 1.5 94% 4,626 68 264 4,958 4,815 97%27-Dec-95 0.6 0.5 0.0 1.1 0.6 52% 4,796 30 272 5,098 4,799 94%10-Jan-96 0.4 0.1 0.0 0.6 0.6 98% 3,558 5 258 3,821 4,808 126%16-May-96 1.0 1.5 0.1 2.6 1.0 41% 7,868 53 639 8,560 8,580 100%07-Feb-98 2.7 2.0 0.5 5.2 3.5 66% 22,164 290 4,150 26,604 28,257 106%08-Feb-98 4.4 3.3 0.5 8.2 5.1 62% 36,312 462 3,965 40,739 41,603 102%09-Feb-98 6.5 3.4 0.5 10.4 6.7 65% 52,867 500 3,946 57,313 55,079 96%
Water Output /
Input(in percent)
Table F-3A. Dissolved Cadmium Mass Balance Calculations for Keswick Reservoir
Water Inputs to Keswick Reservoir (cfs)Total Inputs to Keswick Reservoir
Output from Keswick
Reservoir
WATER BALANCEDissolved Cadmium Inputs to Keswick
Reservoir (kg/day) Total Inputs to Keswick Reservoir (kg/day)
Output from Keswick
Reservoir (kg/day)
DISSOLVED CADMIUM BALANCE
DATE
Dissolved Cadmium Output /
Input(in percent)
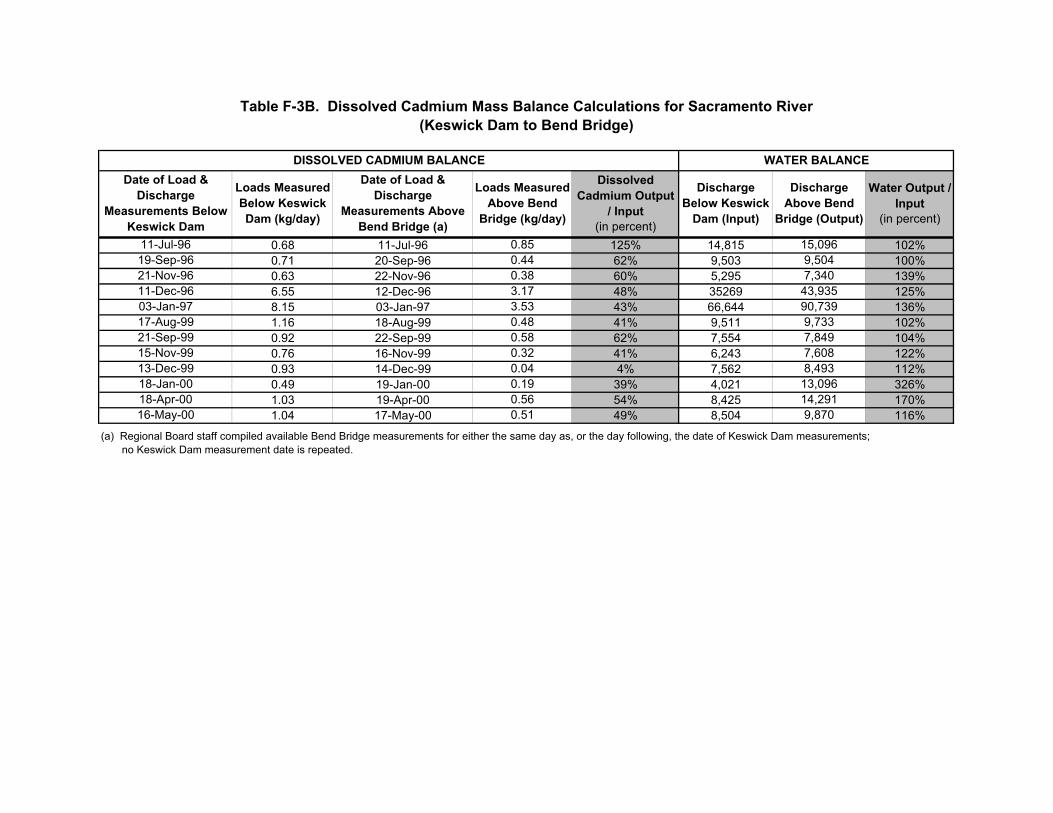
11-Jul-96 0.68 11-Jul-96 0.85 125% 14,815 15,096 102%19-Sep-96 0.71 20-Sep-96 0.44 62% 9,503 9,504 100%21-Nov-96 0.63 22-Nov-96 0.38 60% 5,295 7,340 139%11-Dec-96 6.55 12-Dec-96 3.17 48% 35269 43,935 125%03-Jan-97 8.15 03-Jan-97 3.53 43% 66,644 90,739 136%17-Aug-99 1.16 18-Aug-99 0.48 41% 9,511 9,733 102%21-Sep-99 0.92 22-Sep-99 0.58 62% 7,554 7,849 104%15-Nov-99 0.76 16-Nov-99 0.32 41% 6,243 7,608 122%13-Dec-99 0.93 14-Dec-99 0.04 4% 7,562 8,493 112%18-Jan-00 0.49 19-Jan-00 0.19 39% 4,021 13,096 326%18-Apr-00 1.03 19-Apr-00 0.56 54% 8,425 14,291 170%16-May-00 1.04 17-May-00 0.51 49% 8,504 9,870 116%
(a) Regional Board staff compiled available Bend Bridge measurements for either the same day as, or the day following, the date of Keswick Dam measurements; no Keswick Dam measurement date is repeated.
Dissolved Cadmium Output
/ Input(in percent)
Water Output / Input
(in percent)
Table F-3B. Dissolved Cadmium Mass Balance Calculations for Sacramento River(Keswick Dam to Bend Bridge)
Discharge Below Keswick
Dam (Input)
Discharge Above Bend
Bridge (Output)
WATER BALANCE
Loads Measured Below Keswick Dam (kg/day)
Loads Measured Above Bend
Bridge (kg/day)
DISSOLVED CADMIUM BALANCEDate of Load &
Discharge Measurements Below
Keswick Dam
Date of Load & Discharge
Measurements Above Bend Bridge (a)
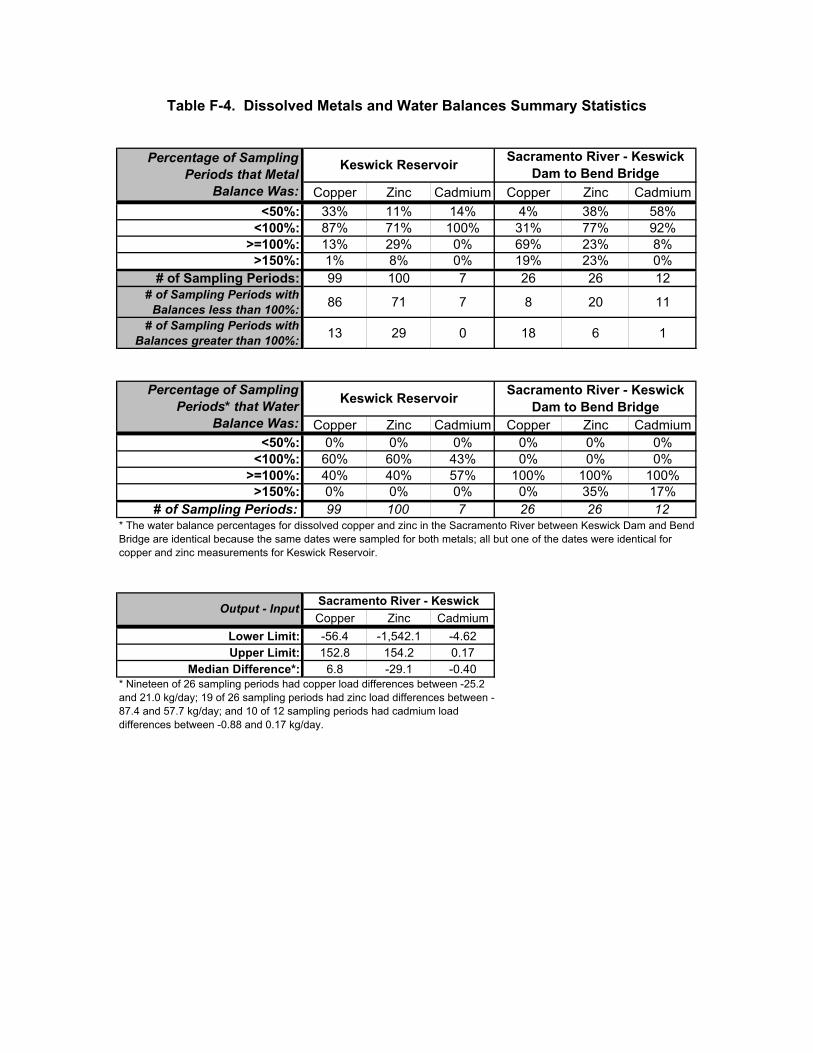
Copper Zinc Cadmium Copper Zinc Cadmium<50%: 33% 11% 14% 4% 38% 58%
<100%: 87% 71% 100% 31% 77% 92%>=100%: 13% 29% 0% 69% 23% 8%
>150%: 1% 8% 0% 19% 23% 0%# of Sampling Periods: 99 100 7 26 26 12
# of Sampling Periods with Balances less than 100%: 86 71 7 8 20 11
# of Sampling Periods with Balances greater than 100%: 13 29 0 18 6 1
Copper Zinc Cadmium Copper Zinc Cadmium<50%: 0% 0% 0% 0% 0% 0%
<100%: 60% 60% 43% 0% 0% 0%>=100%: 40% 40% 57% 100% 100% 100%
>150%: 0% 0% 0% 0% 35% 17%# of Sampling Periods: 99 100 7 26 26 12
Copper Zinc CadmiumLower Limit: -56.4 -1,542.1 -4.62Upper Limit: 152.8 154.2 0.17
Median Difference*: 6.8 -29.1 -0.40
Output - Input Sacramento River - Keswick
* Nineteen of 26 sampling periods had copper load differences between -25.2 and 21.0 kg/day; 19 of 26 sampling periods had zinc load differences between -87.4 and 57.7 kg/day; and 10 of 12 sampling periods had cadmium load differences between -0.88 and 0.17 kg/day.
Percentage of Sampling Periods* that Water
Balance Was:
Keswick Reservoir
* The water balance percentages for dissolved copper and zinc in the Sacramento River between Keswick Dam and Bend Bridge are identical because the same dates were sampled for both metals; all but one of the dates were identical for copper and zinc measurements for Keswick Reservoir.
Sacramento River - Keswick Dam to Bend Bridge
Table F-4. Dissolved Metals and Water Balances Summary Statistics
Keswick Reservoir Sacramento River - Keswick Dam to Bend Bridge
Percentage of Sampling Periods that Metal
Balance Was:
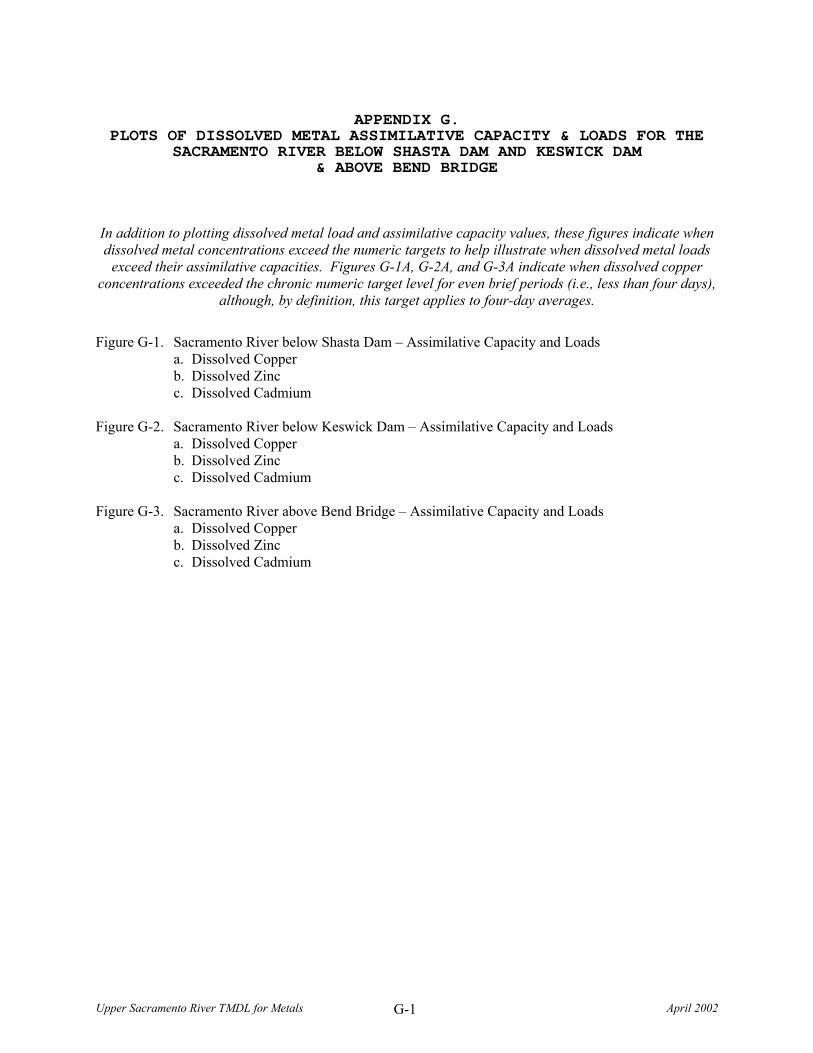
Upper Sacramento River TMDL for Metals April 2002 G-1
APPENDIX G. PLOTS OF DISSOLVED METAL ASSIMILATIVE CAPACITY & LOADS FOR THE
SACRAMENTO RIVER BELOW SHASTA DAM AND KESWICK DAM & ABOVE BEND BRIDGE
In addition to plotting dissolved metal load and assimilative capacity values, these figures indicate when dissolved metal concentrations exceed the numeric targets to help illustrate when dissolved metal loads
exceed their assimilative capacities. Figures G-1A, G-2A, and G-3A indicate when dissolved copper concentrations exceeded the chronic numeric target level for even brief periods (i.e., less than four days),
although, by definition, this target applies to four-day averages.
Figure G-1. Sacramento River below Shasta Dam – Assimilative Capacity and Loads
a. Dissolved Copper b. Dissolved Zinc c. Dissolved Cadmium
Figure G-2. Sacramento River below Keswick Dam – Assimilative Capacity and Loads
a. Dissolved Copper b. Dissolved Zinc c. Dissolved Cadmium
Figure G-3. Sacramento River above Bend Bridge – Assimilative Capacity and Loads
a. Dissolved Copper b. Dissolved Zinc c. Dissolved Cadmium

Figure G-1. Sacramento River below Shasta Dam – Assimilative Capacity, Concentrations, and LoadsA. Dissolved Copper
0
200
400
600
800
1,000
Jan-95
May-95
Sep-95
Jan-96
May-96
Sep-96
Jan-97
May-97
Sep-97
Jan-98
May-98
Sep-98
Jan-99
May-99
Sep-99
Jan-00
May-00
Sep-00
Jan-01
Load (kg/day)
0
1
2
3
4
5
6
Concentration (µg/l)
Maximum Daily Dissolved Copper LoadAssimilative Capacity Based on Acute Numeric Target (5.6 µg/l)Assimilative Capacity Based on Chronic Numeric Target (4.1 µg/l)Maximum Daily Dissolved Copper Concentration - Exceeds chronic numeric target adjusted for hardness (4.1 µg/l, hardness 40 mg/l)Maximum Daily Dissolved Copper Concentration - Exceeds acute numeric target adjusted for hardness (5.6 µg/l, hardness 40 mg/l)
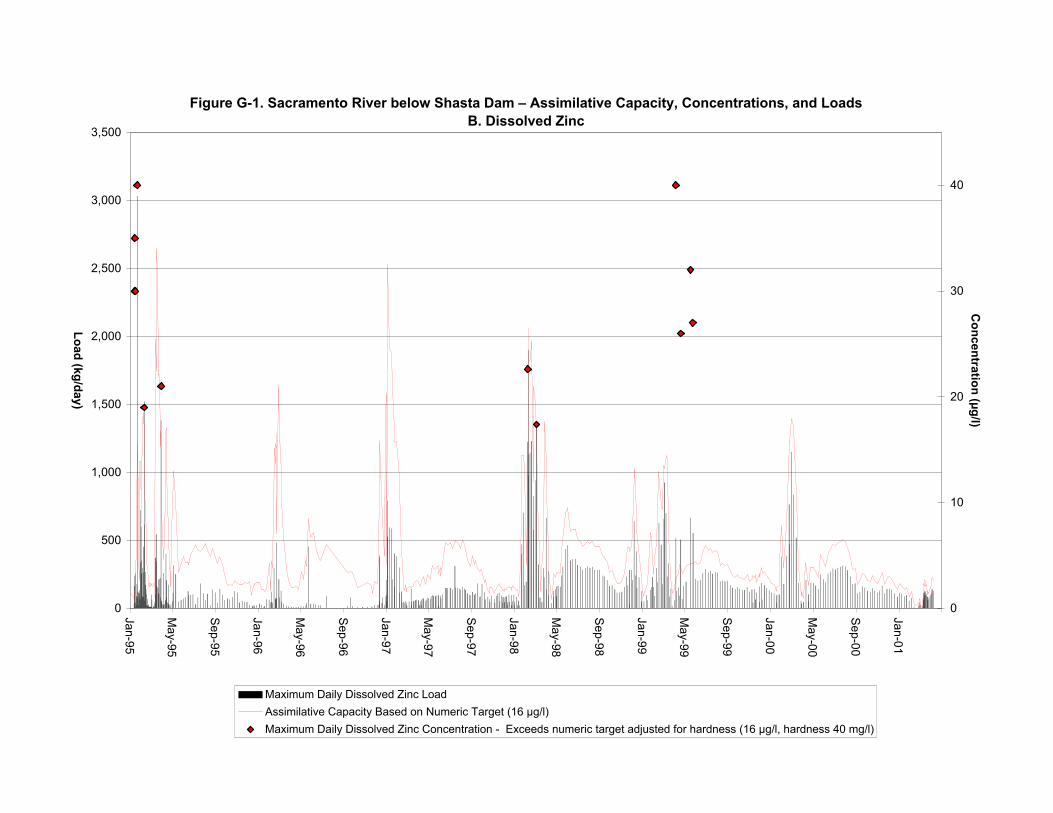
Figure G-1. Sacramento River below Shasta Dam – Assimilative Capacity, Concentrations, and LoadsB. Dissolved Zinc
0
500
1,000
1,500
2,000
2,500
3,000
3,500
Jan-95
May-95
Sep-95
Jan-96
May-96
Sep-96
Jan-97
May-97
Sep-97
Jan-98
May-98
Sep-98
Jan-99
May-99
Sep-99
Jan-00
May-00
Sep-00
Jan-01
Load (kg/day)
0
10
20
30
40
Concentration (µg/l)
Maximum Daily Dissolved Zinc LoadAssimilative Capacity Based on Numeric Target (16 µg/l)Maximum Daily Dissolved Zinc Concentration - Exceeds numeric target adjusted for hardness (16 µg/l, hardness 40 mg/l)
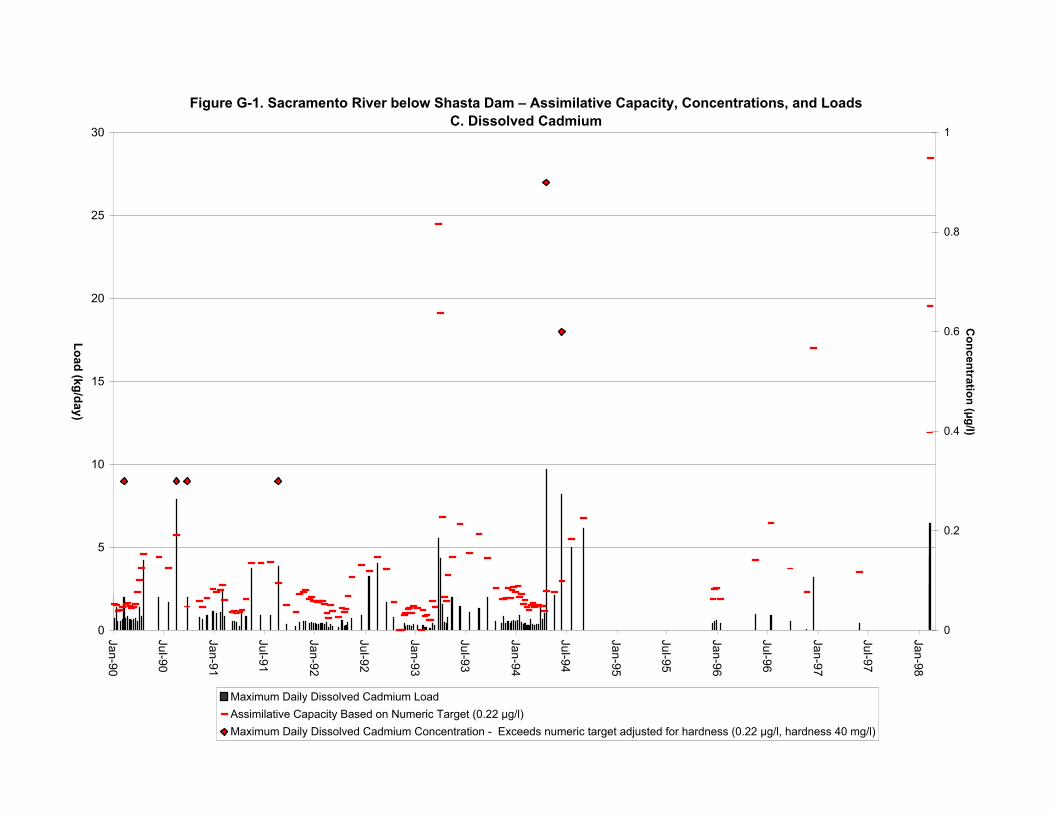
Figure G-1. Sacramento River below Shasta Dam – Assimilative Capacity, Concentrations, and LoadsC. Dissolved Cadmium
0
5
10
15
20
25
30
Jan-90
Jul-90
Jan-91
Jul-91
Jan-92
Jul-92
Jan-93
Jul-93
Jan-94
Jul-94
Jan-95
Jul-95
Jan-96
Jul-96
Jan-97
Jul-97
Jan-98
Load (kg/day)
0
0.2
0.4
0.6
0.8
1
Concentration (µg/l)
Maximum Daily Dissolved Cadmium LoadAssimilative Capacity Based on Numeric Target (0.22 µg/l)Maximum Daily Dissolved Cadmium Concentration - Exceeds numeric target adjusted for hardness (0.22 µg/l, hardness 40 mg/l)
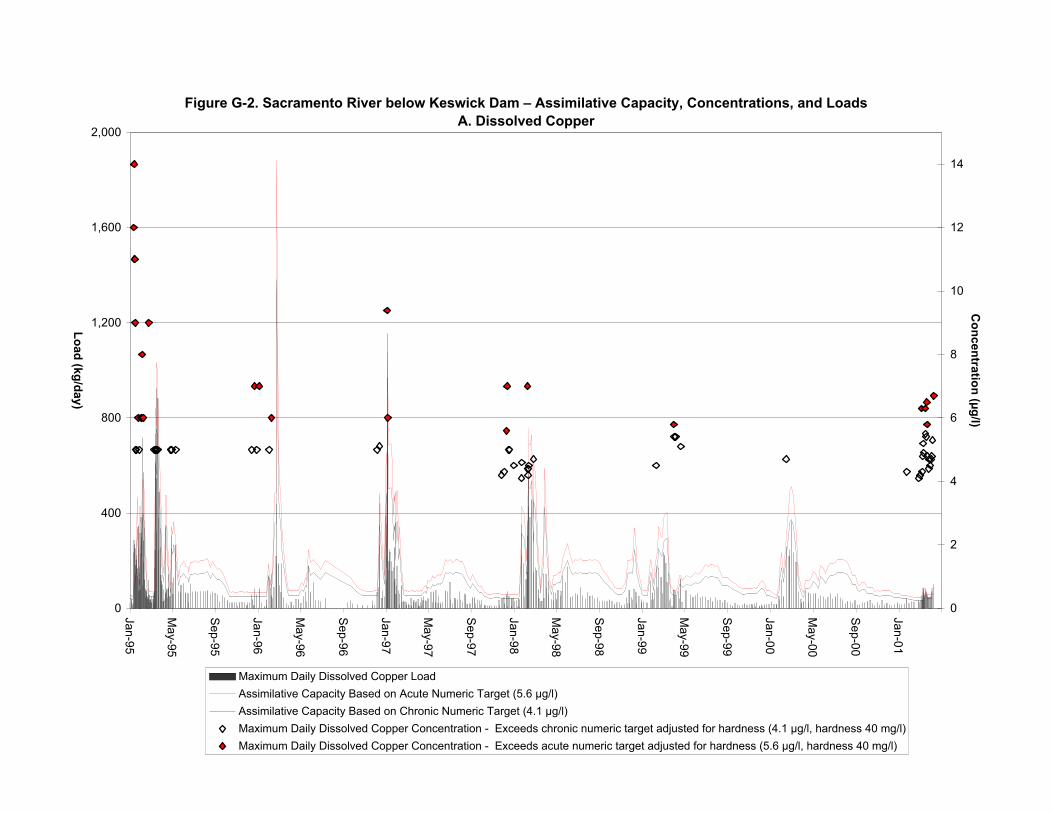
Figure G-2. Sacramento River below Keswick Dam – Assimilative Capacity, Concentrations, and LoadsA. Dissolved Copper
0
400
800
1,200
1,600
2,000
Jan-95
May-95
Sep-95
Jan-96
May-96
Sep-96
Jan-97
May-97
Sep-97
Jan-98
May-98
Sep-98
Jan-99
May-99
Sep-99
Jan-00
May-00
Sep-00
Jan-01
Load (kg/day)
0
2
4
6
8
10
12
14
Concentration (µg/l)
Maximum Daily Dissolved Copper LoadAssimilative Capacity Based on Acute Numeric Target (5.6 µg/l)Assimilative Capacity Based on Chronic Numeric Target (4.1 µg/l)Maximum Daily Dissolved Copper Concentration - Exceeds chronic numeric target adjusted for hardness (4.1 µg/l, hardness 40 mg/l)Maximum Daily Dissolved Copper Concentration - Exceeds acute numeric target adjusted for hardness (5.6 µg/l, hardness 40 mg/l)
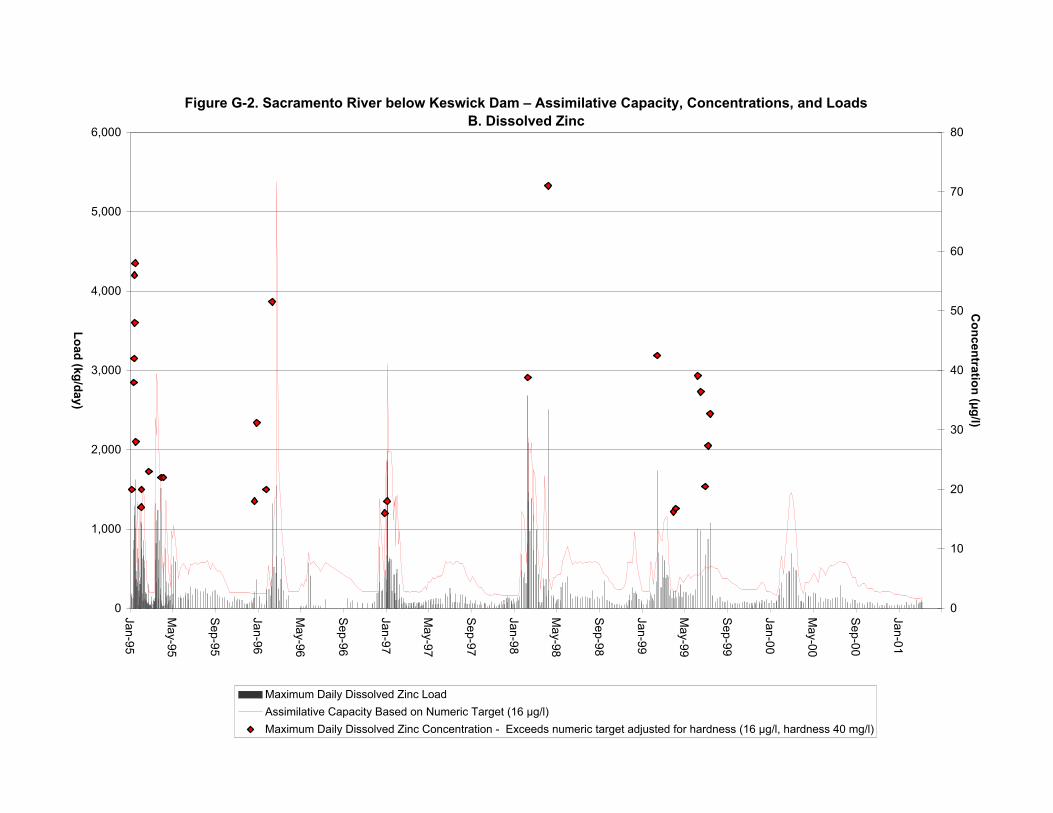
Figure G-2. Sacramento River below Keswick Dam – Assimilative Capacity, Concentrations, and LoadsB. Dissolved Zinc
0
1,000
2,000
3,000
4,000
5,000
6,000
Jan-95
May-95
Sep-95
Jan-96
May-96
Sep-96
Jan-97
May-97
Sep-97
Jan-98
May-98
Sep-98
Jan-99
May-99
Sep-99
Jan-00
May-00
Sep-00
Jan-01
Load (kg/day)
0
10
20
30
40
50
60
70
80
Concentration (µg/l)
Maximum Daily Dissolved Zinc LoadAssimilative Capacity Based on Numeric Target (16 µg/l)Maximum Daily Dissolved Zinc Concentration - Exceeds numeric target adjusted for hardness (16 µg/l, hardness 40 mg/l)
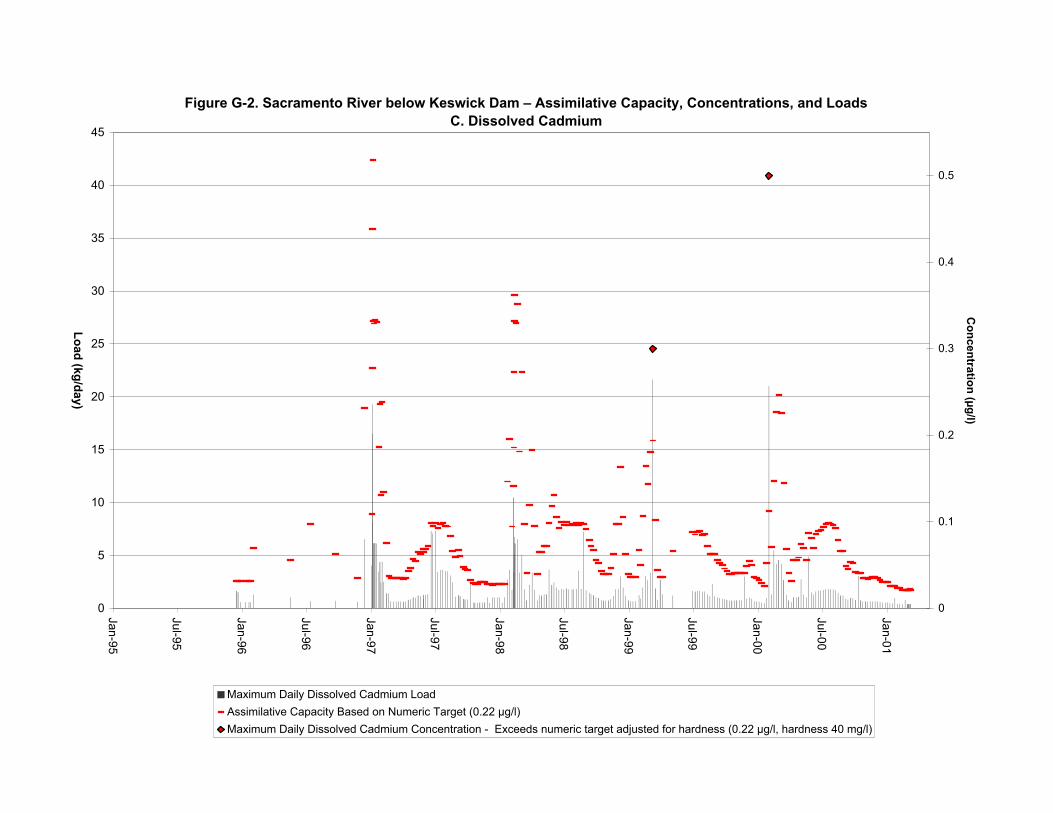
Figure G-2. Sacramento River below Keswick Dam – Assimilative Capacity, Concentrations, and LoadsC. Dissolved Cadmium
0
5
10
15
20
25
30
35
40
45
Jan-95
Jul-95
Jan-96
Jul-96
Jan-97
Jul-97
Jan-98
Jul-98
Jan-99
Jul-99
Jan-00
Jul-00
Jan-01
Load (kg/day)
0
0.1
0.2
0.3
0.4
0.5
Concentration (µg/l)
Maximum Daily Dissolved Cadmium LoadAssimilative Capacity Based on Numeric Target (0.22 µg/l)Maximum Daily Dissolved Cadmium Concentration - Exceeds numeric target adjusted for hardness (0.22 µg/l, hardness 40 mg/l)
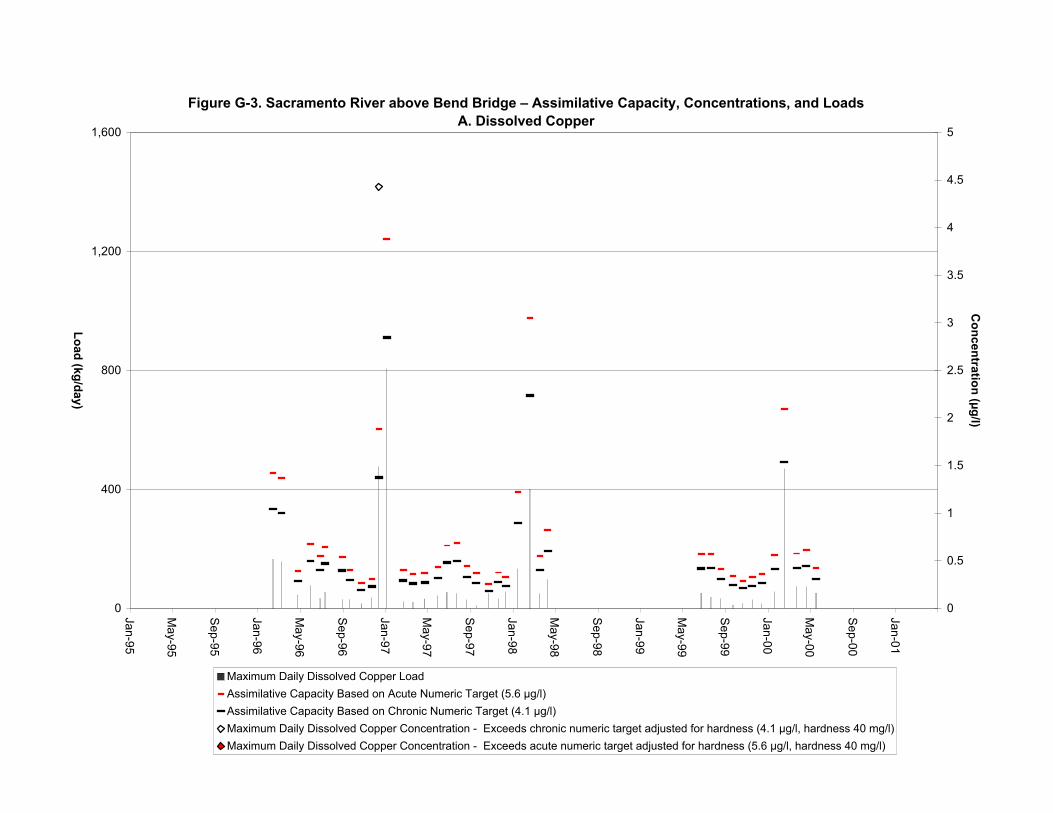
Figure G-3. Sacramento River above Bend Bridge – Assimilative Capacity, Concentrations, and LoadsA. Dissolved Copper
0
400
800
1,200
1,600
Jan-95
May-95
Sep-95
Jan-96
May-96
Sep-96
Jan-97
May-97
Sep-97
Jan-98
May-98
Sep-98
Jan-99
May-99
Sep-99
Jan-00
May-00
Sep-00
Jan-01
Load (kg/day)
0
0.5
1
1.5
2
2.5
3
3.5
4
4.5
5
Concentration (µg/l)
Maximum Daily Dissolved Copper LoadAssimilative Capacity Based on Acute Numeric Target (5.6 µg/l)Assimilative Capacity Based on Chronic Numeric Target (4.1 µg/l)Maximum Daily Dissolved Copper Concentration - Exceeds chronic numeric target adjusted for hardness (4.1 µg/l, hardness 40 mg/l)Maximum Daily Dissolved Copper Concentration - Exceeds acute numeric target adjusted for hardness (5.6 µg/l, hardness 40 mg/l)
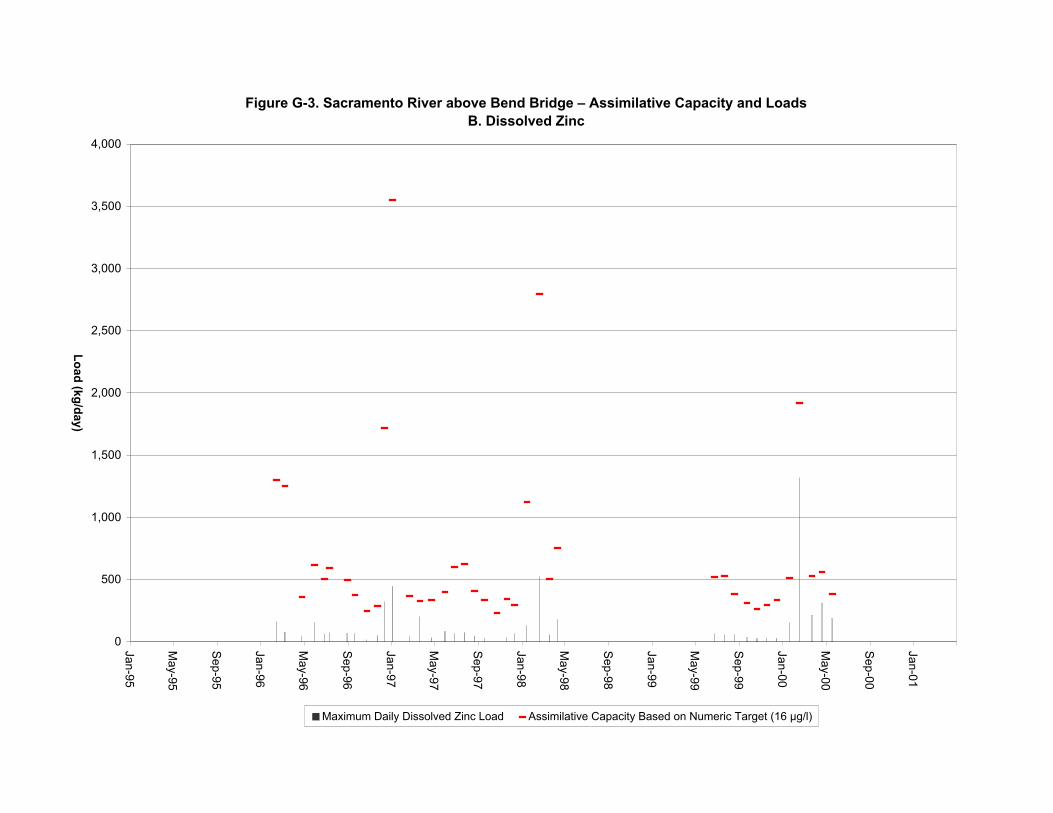
Figure G-3. Sacramento River above Bend Bridge – Assimilative Capacity and LoadsB. Dissolved Zinc
0
500
1,000
1,500
2,000
2,500
3,000
3,500
4,000
Jan-95
May-95
Sep-95
Jan-96
May-96
Sep-96
Jan-97
May-97
Sep-97
Jan-98
May-98
Sep-98
Jan-99
May-99
Sep-99
Jan-00
May-00
Sep-00
Jan-01
Load (kg/day)
Maximum Daily Dissolved Zinc Load Assimilative Capacity Based on Numeric Target (16 µg/l)
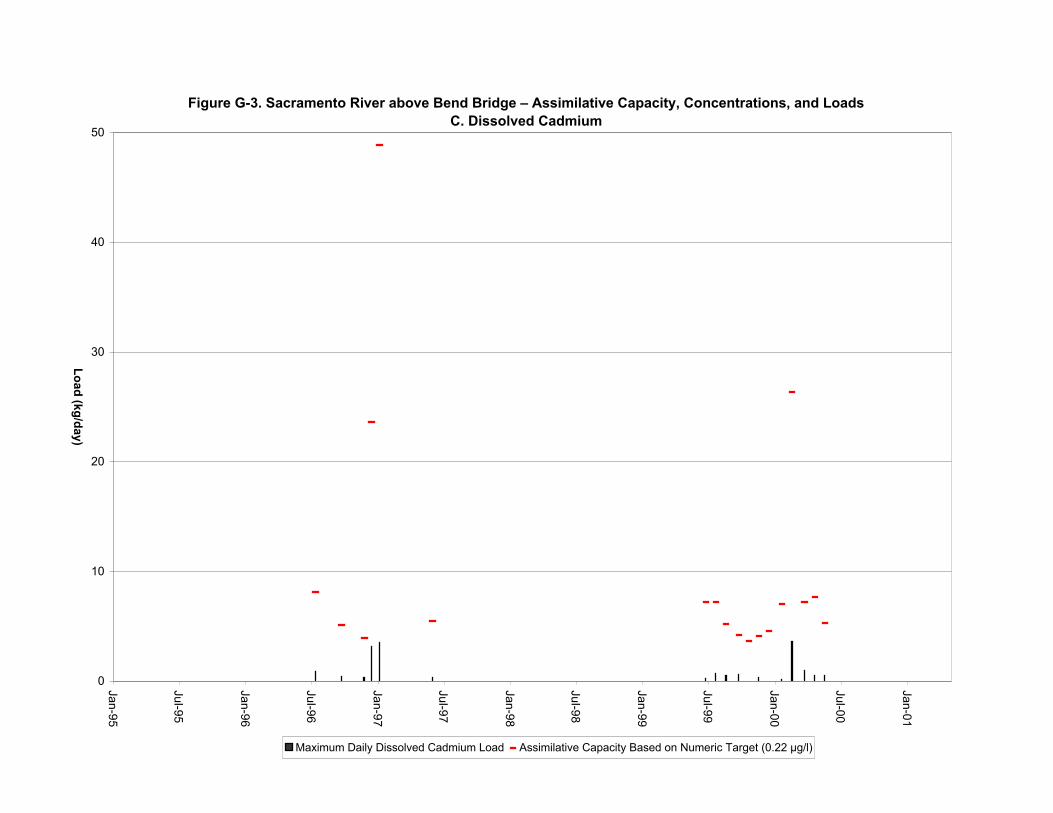
Figure G-3. Sacramento River above Bend Bridge – Assimilative Capacity, Concentrations, and LoadsC. Dissolved Cadmium
0
10
20
30
40
50
Jan-95
Jul-95
Jan-96
Jul-96
Jan-97
Jul-97
Jan-98
Jul-98
Jan-99
Jul-99
Jan-00
Jul-00
Jan-01
Load (kg/day)
Maximum Daily Dissolved Cadmium Load Assimilative Capacity Based on Numeric Target (0.22 µg/l)
Upper Sacramento River TMDL for Metals April 2002 H-1
APPENDIX H. RESPONSES TO COMMENTS RECEIVED ON
THE UPPER SACRAMENTO RIVER TMDL FOR CADMIUM, COPPER & ZINC DRAFT REPORT
The following are Regional Board staff responses to comments received on the Upper Sacramento River
TMDL for Cadmium, Copper and Zinc Draft Report, which was released in September 2001 and
re-released in March 2002. Regional Board staff assigned a number to each comment provided in the
written letters and electronic notes submitted by the individual reviewers (see attached) and cited that
number in the responses below. Where indicated in the responses, Regional Board staff made
corresponding changes to the text of the report. The staff appreciates the efforts and thoughts of all who
submitted comments.
U.S. Environmental Protection Agency (USEPA).
Letter from David Smith (TMDL Team Leader, USEPA Region 9 Water Division) and Richard Sugarek (Remedial Project Manager, USEPA Region 9 Superfund Division) to Patrick Morris (Senior WRC Engineer, Regional Board Sacramento River Mercury TMDL Unit), dated December 18, 2001.
Comments #1, 4, 7, 8, 9a, 12-16: Delineation of Allocations and Assumptions.
Regional Board staff agrees with the USEPA’s comment that the TMDL should more clearly identify the
individual load allocations for the three source categories upstream of Keswick Dam. Staff has made
changes to the text to indicate the assignment of load allocations to the mine sites upstream of Shasta
Dam – with Shasta Dam acting as the point of compliance – in addition to the allocation to the IMM site.
Staff also defined more of the assumptions made about metal loads from Shasta Lake and included in the
Implementation Plan increased monitoring of Shasta Dam releases and other Shasta Lake locations to
determine the sources and variability of dissolved metal concentrations in Shasta Dam (particularly those
that exceed 1.3 µg/l dissolved copper and 3.9 µg/l dissolved zinc). Because of its minor metals input, staff
did not assign allocation to the sources of dissolved metals in Spring Creek Power Plant discharges.
Comments #2, 5, 6 & 7: Iron Mountain Mines Allocation. Regional Board staff agrees with the USEPA’s
comment that the Iron Mountain Mines (IMM) load reduction allocation should be clearly assigned to the
mine itself, and not to the USEPA. Pursuant to the recent settlement between Aventis CropSciences (a
Upper Sacramento River TMDL for Metals April 2002 H-2
former owner and operator of IMM), USEPA and the State, staff has made changes throughout the report
text to indicate that:
1. IMM is responsible for the load reduction allocation.
2. Aventis CropSciences arranged for, among other things, a private contractor to operate and maintain the current IMM remedial actions pursuant to CERCLA (RODs 1-4) over the next 30 years and for payment at year 2030 to fund the clean-up after year 2030.
3. Iron Mountain Mines, Inc. is the current owner.
4. USEPA is the lead oversight agency and the State is the support agency with respect to these clean-up efforts.
Comments #3, 10 & 11: Future Implementation Changes
Regional Board staff updated the “TMDL water management strategy” text throughout the report based
on the revised load reduction allocation for mines upstream of Shasta Dam and USEPA’s comments about
the need for, and technical feasibility of, additional remediation activities to address Boulder Creek AMD
discharges and Keswick Reservoir sediment removal.
Comment #9b: TMDL Review Schedule
Regional Board staff agrees with the USEPA’s comment that it would be appropriate to coordinate the
Regional Board’s periodic TMDL reviews with the USEPA’s 5-Year Reviews for the IMM site. Staff
updated the text to reflect the proposed timing of future TMDL reviews.
U.S. Bureau of Reclamation (USBR). Letter from Frank Michny (Regional Environmental Officer, Mid-Pacific Regional Office) to Patricia Vellines (Engineering Geologist, Regional Board Sacramento River Mercury TMDL Unit), dated November 20, 2001.
Comments #i, iii, vii, 29-30, 32, 40 & 45: Delineation of Allocations and Assumptions
Based on the USBR and USEPA comments, Regional Board staff edited the report text to clearly indicate
that load reduction allocations are assigned to the metal sources (e.g., the mine sites located upstream of
Keswick and Shasta Dams), and not to the USBR and USEPA. Staff has made changes to the text to
indicate the assignment of load allocations to the mine sites upstream of Shasta Dam – with Shasta Dam
acting as the point of compliance – in addition to the allocation to the IMM site. Because the assignment
of load reductions to individual mine sites upstream of Shasta Dam will be part of a separate TMDL,
Regional Board staff assigns the load reduction allocation to Shasta Dam releases; Shasta Dam acts as a
monitoring point for the accumulated loads from all point and nonpoint sources upstream of the dam.
Upper Sacramento River TMDL for Metals April 2002 H-3
Although this TMDL assigns the load reduction allocation to Shasta Dam releases, the metals sources
(e.g., mine owners with USEPA and Regional Board oversight) upstream of the dam are responsible for
the remedial actions required to decrease the loads released from Shasta Dam. In addition, staff revised
the TMDL report so that the Implementation Plan addresses the load reduction allocation for Shasta Dam
releases as part of the remediation activities scheduled during the next five years, rather than incorporate
the load reduction in the margin of safety to be addressed during the next five to ten years. Staff also
defined more of the assumptions made about metal loads from Shasta Lake and included in the
Implementation Plan increased monitoring of Shasta Dam releases and other Shasta Lake locations to
determine the sources and variability of dissolved metal concentrations in Shasta Dam (particularly those
that exceed 1.3 µg/l dissolved copper and 3.9 µg/l dissolved zinc). Because of their minor metals input,
staff did not assign load reduction allocations to the Spring Creek Power Plant discharge and the NPDES-
permitted dischargers downstream of Keswick Dam; however, staff will review new monitoring data and
assign load reductions to NPDES-permitted dischargers as warranted in the years ahead.
Comments #ii, 1-3, 5, 23-24, 26-28, 31, 35-39, 42-44: “Improved” Dam Operations
Regional Board staff edited the text throughout the report to clarify the meaning of the previously used
phrase “improved dam manipulations”. The text now explains that the USBR’s dam operations are
governed by the 1980 MOU, the 1992 Long-Term Central Valley Project Operations Criteria and Plan
(CVP-OCAP), and the 1993 Biological Opinion for the Operation of the Federal Central Valley Project
and the California State Water Project; the phrase “improved dam manipulations” is no longer used in the
text. Staff also updated the text to indicate that after three years of monitoring data have been collected
following the completion of remediation activities at Slickrock Creek, Regional Board staff will work
with the USBR, USEPA, California Department of Fish and Game, and State Water Resources Control
Board to revise the 1980 MOU as needed to ensure maximum efficiency in managing releases from the
SCDD (see next response). In addition, staff edited the text throughout the report to indicate that the
USBR voluntarily targets the Basin Plan objectives.
Comments #iv, vi, 16, 25, 34, 41: TMDL and 1980 MOU Review Schedule
Regional Board staff agrees with the USEPA’s comment that it would be appropriate to coordinate the
Regional Board’s periodic TMDL reviews with the USEPA’s 5-Year Reviews for the IMM site. Staff
updated the text to reflect the proposed timing of future TMDL reviews. In addition, staff updated the
text throughout the report to indicate that after three years of monitoring data have been collected
following the completion of remediation activities at Slickrock Creek, Regional Board staff will work
with the USBR, USEPA, California Department of Fish and Game, and State Water Resources Control
Upper Sacramento River TMDL for Metals April 2002 H-4
Board to (1) determine whether additional remediation activities are required for the Sacramento River
downstream of Keswick Dam to be in compliance with the proposed numeric targets, and (2) revise the
1980 MOU to ensure maximum efficiency in managing releases from the SCDD.
Comment #v: Meeting Basin Plan objectives in the Sacramento River below Keswick Dam.
Regional Board staff updated the text to reflect comments from the USBR. The revised text indicates
that, pending revision of the 1980 MOU, the USBR will continue to operate the SCDD and related
facilities in a reasonable and prudent manner in compliance with operations criteria set forth in the
1980 MOU, 1992 Central Valley Project Operations Criteria and Plan, and 1993 Biological Opinion for
the Operation of the Federal Central Valley Project. After three years of monitoring data have been
collected following the completion of remediation activities at Slickrock Creek, the Regional Board staff
will work with the USBR, USEPA, California Department of Fish and Game, and State Water Resources
Control Board to revise as needed the 1980 MOU to take into account the performance of the USEPA
remedies in RODs 1-4, new technology, and new information (e.g., the Regional Board staff evaluation of
potential sources and variability of dissolved metal concentrations in Shasta Dam releases). The purpose
of any revisions to the 1980 MOU would be to ensure maximum efficiency in managing releases from the
SCDD.
Comments #6, 21: Improvements in fish population declines.
Regional Board staff updated the text to reflect USBR’s comments and clarify the description of the
multiple causes of fish population declines.
Comment #7: Improvements in fish population declines.
Regional Board staff updated the text to clarify the meaning of “changes in regional dam operations”.
Comment #8: Water Quality of the Sacramento River at Bend Bridge.
Regional Board staff updated Section 2.3.3 to include additional information provided by the USBR and
USEPA.
Comments #9 and 11: Instream fishery flow requirements and Endangered Species Act
Regional Board staff updated the text in multiple sections of the report to include instream fishery flow
requirements and the federal and State Endangered Species Acts as factors in USBR water management
strategies.
Upper Sacramento River TMDL for Metals April 2002 H-5
Comments #10: CTR compliance and the strengthening of the Sacramento River fisheries.
Regional Board staff updated the text to indicate that multiple factors – not just compliance with the CTR
and Basin Plan objectives – are required to restore Sacramento River fisheries.
Comments #12: Temperature control device at Shasta Dam.
Regional Board staff updated the text to include a description of the temperature control device.
Comments #13, 20 & 22: Fish kills before and after Shasta Dam construction.
Regional Board staff updated the text in Section 3.3.1 to indicate the multiple effects Shasta and Keswick
Dams have had on downstream water quality and fisheries.
Comments #14: Purposes of Keswick Dam.
Regional Board staff updated the text in Section 3.3.1 to indicate the multiple purposes of Keswick Dam.
Comments #15, 17, 18 & 19: Former name of USBR, Operation of SCPP at Speed No Load, and SCDD
releases.
Regional Board staff updated the text in Section 3.3.1 to indicate that “U.S. Water and Power Resources
Service” is the former name of the USBR and to clarify the descriptions of the “Speed No Load”
operation of SCPP and SCDD releases during non-storm periods.
Comment #22: Coincidence of springtime AMD releases and timing of spawning chinook.
Regional Board staff updated the text to reflect USBR’s comments and clarify the description of the
coincident timing of springtime AMD releases and spawning chinook.
Comment #33: Clarification of “…willful malicious acts”.
Regional Board staff updated the text to indicate that willful malicious acts include acts of terrorism and
illegal dumping.
Comment #46: Clarification of IMM responsible parties.
Regional Board staff updated the main text to refer the reader to existing USEPA documents that provide
comprehensive descriptions of IMM responsible parties, site history, and remediation activities, rather
than attempt to provide a comprehensive review in this report.
Upper Sacramento River TMDL for Metals April 2002 H-6
California Department of Fish & Game (CDFG).
Letter from Donald B. Koch (Regional Manager, CDFG Northern California-North Coast Region) to Gary M. Carleton (Executive Officer, Regional Board – Central Valley Region, Sacramento), dated October 31, 2001.
Comment #1: Table 5-1 corrections and additions.
Regional Board staff updated Table 5-1 to reflect CDFG’s corrections for the Bella Vista Water District
water treatment plant and the Coleman National Fish Hatchery regarding the location of their receiving
waterbody confluences with the Sacramento River. Staff also added the Darrah Springs Hatchery.
Comment #2: Consideration of the availability of dilution water (in addition to pollution control at IMM).
Regional Board staff appreciates the CDFG’s recommendation to examine the impacts of water storage
projects proposed by CALFED when the TMDL is re-evaluated in five years. Staff revised the text
throughout the report to better define the USBR’s criteria for operations and providing dilution water (i.e.,
1980 MOU, the 1992 CVP-OCAP, and the 1993 Biological Opinion). Such an examination will be
conducted in 5 years when Regional Board staff will work with the USBR, USEPA, California
Department of Fish and Game, and State Water Resources Control Board to evaluate and revise the
1980 MOU as needed to ensure maximum efficiency in managing releases from the SCDD.
Sierra Pacific Industries (SPI).
Letter from Scott Leiby (Safety & Environmental Director, Sierra Pacific Industries) to Patricia Vellines (Engineering Geologist, Regional Board Sacramento River Mercury TMDL Unit), dated October 26, 2001.
Comment #1: Additional allocation of loads to industrial dischargers.
Regional Board staff appreciates SPI’s concern that the Regional Board may allocate loads to industrial
dischargers to achieve the proposed numeric targets if the activities scheduled during the first five years
of the TMDL water management strategy do not achieve the targets. In response to this and other similar
comments, Regional Board staff revised the Implementation Plan so that the load reduction allocation for
Shasta Dam releases is addressed by the Implementation Plan for remediation activities scheduled during
the next five years, rather than included in the TMDL as a component of the margin of safety to be
addressed during the next five to ten years. Staff also defined more of the assumptions made about metal
loads from Shasta Lake and included in the Implementation Plan increased monitoring of Shasta Dam
releases and other Shasta Lake locations to determine the sources and variability of dissolved metal
Upper Sacramento River TMDL for Metals April 2002 H-7
concentrations in Shasta Dam. Under the Clean Water Act, the USEPA requires that a TMDL create a
technically feasible and reasonably fair division of the allowable load among sources. In the years ahead,
Regional Board staff will review new data that evaluate the effectiveness of the IMM remedies, and better
define metal loads from Shasta Lake area sources and downstream dischargers. Staff will make every
effort to develop allocate load reductions that are both technically feasible and fair, if additional load
reductions are needed after the IMM and Shasta mines remedies are complete.
City of Redding.
E-mail from Marci Ames (Industrial Waste Analyst, City of Redding Public Works, Field Operations Division) to Patricia Vellines (Engineering Geologist, Regional Board Sacramento River Mercury TMDL Unit), dated November 16, 2001.
Regional Board staff appreciates the City of Redding’s recommendations for NPDES discharger sampling
and analytical methods. This TMDL report does not include the level of detail outlined in the City’s
comments. Staff will incorporate the City’s comments in future monitoring plans as they are developed.
UNITED STATES ENVIRONMENTAL PROTECTION AGENCY REGION IX
75 Hawthorne Street San Francisco, CA 94105
December 18, 2001
SUBJECT: Comments on the Draft TMDL for Cadmium, Copper and Zinc for
the Upper Sacramento River
Thank you for the opportunity to comment on the September 25, 2001 draft report, Upper Sacramento River TMDL for Cadmium, Copper and Zinc, prepared by the Regional Water Quality Control Board (RWQCB), Central Valley Region. We believe that in many respects the draft report is well written, and we support the basic conclusion of the TMDL analysis that currently planned controls at Iron Mountain Mine and mines upstream of Shasta Lake are reasonably likely to result in attainment of applicable water quality standards and the TMDL below Keswick Dam. However, we recommend some revisions in the TMDL to more accurately identify source allocations and control actions. Specifically, the TMDL should be revised to address three key issues: 1. Delineation of Allocations The TMDL should more clearly identify the individual load allocations that together comprise the TMDL. Individual load allocations should be expressed for three source categories - Iron Mountain Mine (IMM), sources above Shasta Dam, and sources that contribute to the Spring Creek Power House metal discharges. It would be appropriate to express these allocations as concentrations at the appropriate points of compliance. 2. Iron Mountain Mine Allocation The Iron Mountain Mine load allocation should be clearly assigned to the mine itself, and not to EPA. EPA does not own and is not legally responsible for discharges from this facility; instead, EPA, in conjunction with the State, has been carrying out and otherwise overseeing remedial actions pursuant to CERCLA. 3. Future Implementation Chances The TMDL implementation provisions should not establish requirements for implementation actions at IMM beyond the 1997 ROD, and the document should not assume EPA will implement additional controls at IMM beyond the scope of the 1997 ROD. We agree with the basic assumption of the TMDL, namely that actions that are planned for the next several years should be sufficient to meet water quality standards below Keswick Dam. We believe it is premature to reach conclusions about the need for, and technical feasibility of, additional
Mr. Patrick Morris Regional Water Quality Control Board Central Valley Region 3443 Routier Road, Suite A Sacramento, CA 95827
controls at IMM to achieve protective water quality standards below Keswick Dam. First; the actions currently underway at IMM need to be implemented and monitored. Second, the RWQCB should develop more information about the effectiveness of the controls on the sources discharging into Lake Shasta under various conditions and the effect that additional controls on those sources will have on loads throughout the Upper Sacramento River system. This information can then be used to allocate loads among sources in this area if additional load reductions are found to be necessary to acheive water quality standards below Keswick Dam. I. Background
The Upper Sacramento River is a managed water system that, among other things, serves critical water supply and environmental needs for the State of California. This highly complex system is controlled largely through the Central Valley Project (CVP), which consists of a series of. reservoirs and other facilities that are operated by the United States Bureau of Reclamation (USBR) to meet a wide range of important public needs, including flood control, environmental protection, power production and water supply project requirements.
A large number of abandoned and inactive mines in the Shasta Mining District discharge significant loads of heavy metals into Lake Shasta and the Sacramento River. There are also background concentrations of heavy metals that occur naturally in these waters. Historically, the presence of the heavy metals.from active and inactive mines have posed unacceptable risks to the ecological resources in this area, including several threatened and endangered species. The presence of these metals also complicates and restricts the operation of the CVP facilities, at times limiting the ability of the CVP to meet its other purposes.
Over the past several decades, the state and federal governments (including EPA, USBR, the California Department of Toxic Substances Control and the Regional Water Quality Control Board, among others) have taken significant steps to address and lessen the impact of the releases from the mines in the Shasta Mining District. The governments have conducted extensive studies of the nature of the discharges to the Sacramento River. These studies indicate that the discharges are highly variable from season to season and year to year. In addition, the water levels in the reservoirs, which are a function in part of the rain pattern of prior years, impacts the ability of the system to operate in .a manner that assures that the metal concentrations remain below levels that pose a risk to aquatic receptors. Extensive efforts by the United States and the State have resulted in the development and refinement of a water quality model (the IMM Water Quality Model) that can be used to predict how these complex patterns will respond to various conditions. The IMM Water Quality model is currently the best tool available for evaluating the potential effectiveness of remedial actions to maintain water concentrations below Keswick Dam at protective
levels. The TMDL Report relies on the IMM Water Quality Model and we support that approach.
In general, the sources of heavy metal loads in the area can be grouped as follows:
A. Iron Mountain Mine (IMM) B. Sources that contribute to the metal loads in Lake Shasta that ultimately flow into Keswick Reservoir, and C. Sources that contribute to the Spring Creek Power House
(SCPH) releases.
Historically, IMM was the largest point source discharger of heavy metals in the area and indeed the country. IMM is currently owned by Iron Mountain Mines, Inc. Pursuant to the Superfund program, EPA has implemented several response actions at IMM that have reduced metal concentrations from IMM by more than 80%. Steps currently underway at IMM by EPA are expected to decrease historical releases by 95%. With the significant decrease in load from IMM, other sources in the area now make up a more significant share of the total metals load. The RWQCB is currently overseeing response actions that are intended to reduce the metal loads from other mines in the Shasta Mining District.
Studies performed by EPA and the State indicate that it is unlikely that the metal discharges from the mines in the Shasta Mining District could be completely controlled. Therefore, any successful strategy for achieving compliance with protective
water quality standards in the Sacramento River must consider most effective means of reducing metal discharges from those sources (both IMM and other sources) and managing the metal discharges that do occur. Given the degree to which all discharges combine to contribute to the metal load in the river, we strongly recommend against overly segmenting the TMDL analysis; rather, the TMDL should ensure that assumptions about various sources (such as the metal loads from lake Shasta) are formally incorporated into the TMDL for the area below Lake Shasta.
the
II. Allocation Holder
Several mines in the Shasta Mining District are currently under clean-up and abatement orders (CAOs) or other orders from the EPA or the RWQCB. EPA is currently the lead agency at IMM' and the RWQCB is currently taking the lead with respect to other sources under the Porter-Cologne Water Quality Control Act and related statutes. We believe that in general it is not appropriate to consider the regulatory agency overseeing the clean-up to be the "allocation holder". Rather, the person who is liable for the clean-up (such as the owner or operator of the mine) or the source should be considered the allocation holder in the TMDL. Therefore, the TMDL should be revised to identify specific allocations for the specific sources of concern (e.g., Iron Mountain Mine and mine sites located in watersheds tributary to Shasta Lake). These allocations should be made for discharge
locations and not to the agencies that are working to remediate these discharges.
To clarify the current situation at IMM, EPA and the State recently entered into a settlement with Aventis CropSciences, the former owner and operator of IMM. Pursuant to that settlement, Aventis CropSciences arranged for, among other things, The IT Corporation to operate and maintain the current IMM remedy (RODs 1-4) over the next thirty years and for a payment at year 2030 to fund the clean-up after year 2030. Currently, EPA is the lead oversight agency and the State is the support agency with respect to these clean-up efforts.
The owner of the mine is Iron Mountain Mines, Inc. (IMMI) and
its President, Mr. T. W. Arman. The United States and the State are still in litigation with IMMI and Mr. Arman.
The current draft of the TMDL report could be misinterpreted to
assign to "the USEPA ... .responsibility for load reductions and maintenance of metal concentrations in the Sacramento River below Keswick Dam to levels below the numeric targets..." (Page 71). The language in the TMDL should be clarified to avoid confusion. While EPA, with support from the State, is currently implementing actions to further reduce the metal loads from IMM, legal responsibility for reducing the heavy metal releases from IMM rests with the liable parties, not the regulatory agencies implementing or overseeing response actions. For similar reasons, we believe that neither the RWQCB nor the USBR should be designated as an allocation holder in the TMDL.
I II. Allocation Strategy,
The RWQCB does not allocate specific loads to specific sources in the draft TMDL report; rather, the report evaluates actions that are anticipated to be implemented over the next several years and concludes that those measures should be sufficient to achieve water quality standards below Keswick Dam. In large part, the analysis relies upon the IMM Water Quality Model, including the assumption that metal loads from Lake Shasta will be at or below 1.5 ppb copper.
We support the RWQCB reliance on the IMM Water Quality Model to express the TMDL allocation for IMM as an integrated set of control practices for each of the sources of heavy metals in the context of the expected operation of the CVP. Among other things, the CVP operations in the Upper Sacramento River system are too complex and too dynamic to allow the RWQCB to be able to set simple load allocations or even seasonal load allocations. The allocation for IMM should be clearly explained in the TMDL document to comprise the expected metals loading levels associated with implementation of the ROD 4 (1997) for IMM, along with references to the supporting modeling analysis that shows why this range of loading levels is expected to result in attainment of the TMDL below Keswick Dam.
In addition, while there is extensive data on certain aspects of the water system, such as the load characteristic's in and around IMM and directly below Shasta Dam and Keswick Dam, there is significantly less data on the loads from individual sources discharging into Lake Shasta under various conditions. Once additional data is developed, it may be useful to present that data in a manner that allows for a meaningful comparison of the relative load from the various sources. For example and as pointed out in the TMDL report, under some conditions sources discharging to Lake Shasta are the dominant source of metals below Keswick Dam. Given the reliance on the IMM Water Quality Model (and the assumptions of that model), we recommend that this group of sources receive a specific load allocation in the TMDL for each metal equal to the metals concentration discharge levels from Lake Shasta as described in the EPA/State modeling analysis and draft TMDL.
We also support a focus on meeting water quality standards
rather than.a simple load allocation because the relationship between total load and dissolved metals is highly complex and variable in this reach of the river. The acute water quality standard for the Upper Sacramento River is stated in terms of dissolved metals as a function of hardness. Significant sitespecific studies support these site-specific water quality standards. For this reason, we believe it is appropriate to focus on meeting water quality standards at various locations, which in turn allows some flexibility in CVP operations as loads shift from source to source over time and under varying flow and hydrologic conditions.
IV. Need for Future Action
We agree with the RWQCB's portrayal of current EPA and State
efforts (those described as Phase 1 in the draft report) to control heavy metal pollution in the Upper Sacramento River, and concur with RWQCB's expectation that these efforts may be sufficient to fully meet protective water quality standards in the Upper Sacramento River.
We believe that the TMDL report should state that the existing remedial efforts are a first phase of actions that may achieve the TMDL. The TMDL report should characterize the associated uncertainty that those steps will be adequate, the efforts that will be undertaken to monitor the effectiveness of these remedial actions, and that if necessary the TMDL will be revised. We believe that it would be appropriate to coordinate RWQCB's periodic TMDL Reviews with EPA's 5-Year Reviews for the IMM site.
The TMDL report goes on to characterize steps that may be taken in Phase 2. Phase 2 activities are those actions that, according to the TMDL report, will be taken if, the Phase 1 activities are not adequate to meet the TMDL. In some places, the document properly describes the future EPA activities at IMM by stating that EPA is currently investigating the sediments in
Keswick Reservoir and the remaining 5% of acid mine drainage at IMM and that those sources may be addressed in the future. However, in other places the document seems to suggest that EPA will in fact remediate the sediments in Keswick Reservoir and the remaining 5$ discharges at IMM.
EPA is committed to performing an effective and protective cleanup at IMM, consistent with CERCLA requirements. However, it is too early in the CERCLA process to determine whether it is necessary or technically practicable to remediate the remaining 5 percent of the historic IMM heavy metal discharges. Consistent with the requirements of CERCLA, EPA will continue to study the feasibility of taking additional actions at the site that could further reduce the IMM heavy metal discharges and to remediate other problem areas at the site. The report should therefore not state that specific additional actions will unequivocally be taken by EPA; rather the document should state the EPA is investigating whether to take actions to address these sources and that actions may be taken in the future depending on the outcome of those studies and other factors.
Similarly, we do not believe it is necessary or appropriate
to speculate at this time about what actions will be taken by others in the future if the Phase 1 activities are not sufficient.
V. Need to consider Other Sources
We agree that the heavy metal discharges from the Iron
Mountain Mine (IMM) Superfund site are a significant metal load and should be one focus of the TMDL for the Upper Sacramento River. However, we believe that it is important to consider the other significant discharges into the Upper Sacramento River, including the discharges from the sources above Shasta Dam and the sources that contribute to the Spring Creek Power House (SCPH) releases.
The IMM Water Quality Model, which models metal sources and
takes into consideration the manner in which the USBR is expected to operate CVP facilities in the future, assumes that sources of heavy metal pollution above Shasta Dam would not result in discharges that exceed 1.5 ppb copper. This is in essence, a load allocation, not a margin of safety, that should be incorporated into the TMDL. The TMDL document appears to treat these upstream metals sites either as background sources or as other nonpoint sources. Federal regulations require inclusion of load allocations for nonpoint sources and background loading sources in TMDLs (see 40 CFR 130.2 and 130.7). As discussed above, because these sources appear to be significant metals loading sources in some circumstances, we strongly recommend inclusion of, a specific load allocation for this group of sources in the TMDL. By addressing this group of sources as a load allocation, the TMDL decision will help facilitate identification of effective controls to address ongoing discharges from these upstream sites. The load allocation for the group of sources
above Shasta Dam could be expressed as the assumed concentration level for each metal , measured below Shasta Dam in Keswick Reservoir. The TMDL should include a monitoring program to evaluate the performance of controls at these sources. If monitoring indicates that the 1.5 ppb copper or other assumptions are not appropriate, then additional remedial actions or controls may be warranted at the metal sources above Shasta Dam. VI. Other Issues
The TMDL report in some instances suggests that abandoned mines are not point sources. While the facts of a given case may indicate that portions of an inactive or abandoned mine may be an area source, in general our experience is that inactive or abandoned mines are a collection of point sources. * * * *
Thank you for your consideration of these comments. Please do not hesitate to contact Debra Denton at (916) 341-5520 or Rick Sugarek at (415) 972-3151 if you have any questions or comments on these issues.
United States Department of the Interior BUREAU OF RECLAMATION
Mid-Pacific Regional Office
2800 Cottage Way
Sacramento, California 95825-1898
IN REPLY
REFER TO:
MP-150 ENV-5.00
Ms. Patricia Vellines Regional Water Quality Control Board Central Valley Region 3443 Routier Road, Suite A Sacramento, CA 95827
Subject: Comments on the Upper Sacramento River, Total Maximum Daily Load (TMDL) for Cadmium, Copper and Zinc
Dear Ms. Vellines:
Thank you for the opportunity to. comment on the Regional Water Quality Control Board, Central Valley Region, (Regional Board) draft staff report Upper Sacramento River TMDL for Cadmium, Copper and Zinc (Draft Report). The Bureau of Reclamation (Reclamation) makes these comments based on this document and on many years participation in the Iron Mountain Mines (IMM) redemediation process. General Comments The Draft Report places the burden for meeting the Upper Sacramento River TMDL for cadmium, copper and zinc squarely on the shoulders of Reclamation and the Environmental Protection Agency (EPA)., Reclamation believes this is an arbitrary and inequitable allocation of responsibility for meeting the TMDL. Moreover; this allocation of responsibility is inconsistent with the agreement reached as part of the IMM Superfund Site remedial process and settlement. Finally, Reclamation believes that the Margin of Safety included in the Draft Report is inaccurate and inconsistent with the TMDL process. The Draft Report states that the Regional Board's strategy for irhplementing the TMDL will be to require "improved" dam operations by Reclamation and to require EPA and responsible parties to undertake proposed remediation activities. Additionally, the Regional Board will impose monitoring responsibilities on the National Pollutant Discharge Elimination System (NPDES) dischargers. Essentially, it appears that the entire strategy is to acknowledge remediation activities ongoing and/or proposed by EPA and responsible parties, and then to place the burden to meet the TMDL entirely on Reclamation through dam operations. This is clearly an inequitable and arbitrary allocation of the burden to meet the TMDL. Reclamation is not a responsible party., nor is it a discharger. Reclamation has always
2
In response, Reclamation received from Keith Takata, Director of EPA's Superfund Division, a letter dated May 3, 2000, which states:
Moreover, Reclamation, along with the other parties to the 1980 Memorandum of Understanding (1980 MOU), agreed to not address the issue of altering Reclamation's operations until two years after the remediation activities at Slickrock Creek are completed. The purposed this agreement is to allow. time to evaluate how the remedial activities improve pollutant levels before trying to adjust Reclamation's operations. Reclamation held a firm position during the IMM settlement negotiations that Reclamation was not at any time, now or in the future, to be held legally responsible for meeting Basin Plan or other standards for copper, cadmium or zinc in the Sacramento River below Keswick Dam. This position was stated in draft letters provided to both State and EPA settlement attorneys.
In the preamble to EPA's Final Rule revising the regulatory requirements for TMDLs under the Clean Water Act, EPA has articulated that allowable load should be divided among sources in a reasonably fair manner. "EPA believes the allocation methodology should create a technically feasible and reasonably fair division of the allowable load among sources." Revisions to the Water Quality Planning and Management Regulation and Revisions to the National Pollutant Program in Support of Revision tot the Water Quality Planning and Management Regulation, 65 Fed. Reg. 43586, 43620, July 13, 2000. While this rule has not yet been implemented, the preamble provides guidance for implementing the program. This guidance indicates that EPA believes States should consider fairness in allocating loads among sources. To allow responsible parties and point sources to continue to contribute an unregulated amount of load to the system while holding Reclamation responsible for meeting the TMDL does not comport with considerations of fairness.
assisted with control of the acid mine drainage from IMM and other sources. However, Reclamation has no legal responsibility for the acid mine drainage.
"I also wanted to take this opportunity to reaffirm some points of common understanding with respect to this site. As we have discussed on numerous occasions, EPA has never identified the USBR as a liable party under CERCLA in connection with the Iron Mountain site. Without intending to suggest that such liability exists in the first instance, we believe the USBR's operation of the Spring Creek Debris Dam and related facilities in a reasonable and prudent manner appears to satisfy all obligations, if any existed in the first instance, of USBR under CERCLA. I also want to reaffirm our position that, based on available information, it is not our intent to look to the USBR to perform additional response actions under CERCLA, in the event that the CERCLA response action fails to achieve water quality standards at all times. For example, EPA understands that, despite prudent operation and maintenance of the Spring Creek Debris Dam and related facilities, exceedances of the State Basin Plan Standards (SBPS) below Keswick Dam may occur on an infrequent basis, for example due to unusual hydrologic conditions or remedy failure, and that USBR will not be considered to be responsible for those exceedances."
3
During a February 4, 1998, meeting among Reclamation, Regional Board, California Department of Fish and Game (DFG), and EPA agency representatives and counsel, held to discuss revising the 1980 MOU, it was agreed that rushing in to such a discussion of Reclamation's operations would not allow for the evaluation of EPA's ongoing and future remedial activities and the impact on water quality. Meeting attendees recognized that Reclamation is not responsible for exceedances of Basin Plan Standards, and that revising the 1980 MOU should wait until the IMM remedy is complete and can be evaluated. Similarly, it is premature to rush to establish TMDLs in the upper Sacramento River at this time. The TMDL process allows the State to determine maximum loads for impaired waters and then allocate that load among the sources. The Draft Report instead seems to set the maximum load and then use Reclamation's operations as the tool to reach the load target (along with remediation activities). If that isn't successful, then the Regional Board will use Part 2 of the process to figure out which dischargers and responsible parties are actually responsible for exceeding the TMDL. Until that time, the loads attributable to dischargers and responsible parties are to be considered as part of the margin of safety for implementation of the TMDL. The only clear reason for including these loads in the margin of safety is because the Regional Board lacks the data to attribute loads to these sources. The Regional Board should make some attempt to collect data from all sources of cadmium, copper and zinc before establishing a TMDL rather than attributing the maximum load to Reclamation operations. Please see the attached for specific comments pertaining to your Draft Report. Thank you again for the opportunity to comment on the Draft Report. If you would like to discuss these comments, please contact Michelle Prowse at (916) 978-5036.
Sincerely,
Enclosure
cc: Mr: Rick Sugarek U.S. Environmental Protection Agency, Region 9 75 Hawthorne Street San Francisco, CA 94105
Specific Comments 1. Page ii under 1 "...improved U.S. Bureau of Reclamation manipulation of dam flows..." The ward 'continued' should replace `improved' and `coordination' should replace `manipulation.' Reclamation strenuously objects to a TMDL program based on improved operations of Reclamation facilities. Reclamation has operated under the 1980 MOU, but also notes that in recent years Reclamation has operated to meet the more stringent Basin Plan standards. It is not clearly defined what the expectations are for the "improved dam operations" for the next five years. If this constitutes a continuation of current practices and level of effort, that would generally be acceptable to Reclamation. However, if this TMDL strategy contemplates modifying the way Reclamation operates, Reclamation would have to participate in the operational review. Any change in operation will have an impact on Reclamation's ability to meet authorized project purposes and would require further evaluation. Reclamation operates in accordance with an Operations Criteria and Plan and to a Biological Opinion based on that Plan, as well as to flood control requirements, water rights permits, and other project purposes. Revised operations could have impacts on endangered species, on flood control operations, and on water deliveries. The effects of the "improved operations". are documented in the Draft Report. One of the goals as stated in the Draft Report is to incorporate the "improved operations" into an updated MOU. Reclamation's concern is that the incorporation of the "improved operations" in an MOU would limit the operational flexibility that has allowed "improved operations." If an updated MOU contains additional operational definitions, constraints and requirements, the operational flexibility that is the basis for improvements made to date may be lost, defeating the purpose of incorporating it into an MOU. EPA's IMM water quality model, which analyzes the expected effectiveness of the IMM remedy on meeting water quality objectives and thus protecting the Sacramento River ecosystem, relies on Reclamation projections of future Central Valley Project (CVP) operations (through the PROSIM model) to meet environmental/societal needs and an analysis of the historic CVP operational performance. EPA's remedy and modeling analysis did not rely on "improvement" of Reclamation CVP operations. Reclamation will continue to coordinate actions with EPA's IMM remedy. Reclamation has agreed to renegotiate the 1980 MOU, that describes Reclamation's voluntary operational commitments with respect to the continuing IMM discharges, once the Slickrock Creek remedy has been implemented and its effectiveness evaluated. Reclamation will continue to make voluntary improvements to CVP operations when feasible within the overall constraints and commitments of CVP operations in the Upper Sacramento River, and within the capabilities of Reclamation's resources. 2. Page ii, Part 1 b "...improve dam operations..." See comment #l.
1
2. Page iii Part 1 f "...in combination with USBR dam operations..," See comment #1. 4. Page 1 "The Regional Board first listed the upper Sacramento River as impaired by cadmium, copper, and zinc in -the 1987-89 listing cycle, although impairments in this section of river were documented in numerous reports dating back to the 1950s.
" The report appears to imply that Cd, Cu, and Zn are the limiting factors for the river not being fully utilized as a warm and cold-water habitat. If this is the intent, these statements neglect other impacts on the Sacramento River fishery, including development in the area, river temperature problems, fish passage, agricultural drainage; Delta export impacts, and ocean harvest. 5. Page 2, paragraph under bullets "...improved dam operations..." See comment #1. 6. Page 4 Part 2.2 "...elevated levels of cadmium, copper, and zinc have contributed to a steady decline in the fisheries population in the Sacramento River." Reclamation agrees that elevated concentrations of copper, cadmium and zinc have dramatically contributed to a decline in the Sacramento River fishery populations. But, several other factors, such as loss of spawning gravels, elevated river temperatures, diversions, and commercial and sport fishing practices, among others, also contributed to the decline and perhaps should be mentioned here. With implementation of EPA's IMM remedial actions, and Reclamation's implementation of several major programs such as installing the temperature control device on Shasta Dam and several measures undertaken pursuant to the ESA Biological Opinion, the declining fish populations have significantly improved. 7. Page 5 Part 2.3.1 2nd to last paragraph "...and from changes in regional dam operations that improved dilution of AMD." It is unclear what this document considers to be "changes in dam operations" during this period. Specific improvement should be noted in the Draft Report. Reclamation actions over the past ten years primarily reflect ongoing implementation of the 1980 MOU. Releases of water from Shasta Dam to dilute acid mine drainage (AMD) were made when possible, consistent with the 1980 MOU, due to the ongoing drought from 1987 through 1993. Additional requirements were imposed on CVP operations by the ESA Biological Opinion to minimize slugging of sediments from the Spring Creek Arm of Keswick Reservoir (SCAKR.). Many other requirements of the Biological Opinion benefited the fishery, most notably management of the CVP to control river temperatures. 8. Page 6 Part 2.3.3 "This lack of exceedances results primarily from the dilution effect of tributary inputs between Keswick Dam and Red Bluff... °'
2
Historic/recent data in EPA's data base indicate that when AMD spills occur from the Spring Creek Debris Dam (SCDD), exceedances of the protective water quality standards can occur near Keswick Dam and downstream, even as far as the Bend Bridge. In general, data collection efforts have not focused on the downstream areas and only limited data are therefore available. At some point downstream, diluting inflows become sufficient to result in compliance with the protective water quality criteria. In general, available data indicate that when the SCDD is controlling the release of IMM AMD into the Sacramento River, California Toxics Rule (CTR) requirements are complied with at Keswick Dam and downstream. 9. Page 9 (last paragraph) "The dams and diversions manipulate surface water flows to provide irrigation water, hydroelectric power, flood control, recreation, and potable water, as well as maintenance of navigation flows and conservation of fish in the Sacramento River Sacramento- San Joaquin Delta from intrusion of saline ocean water (NOAA, 1989; USBR, 2001). The U.S. Bureau of Reclamation (USBR) and other agencies determine the amount of water allocated to irrigation, urban, environmental needs, and other uses in part by reservoir storage." When discussing Reclamation's use of the Sacramento River flow, the report should note the instream fishery flow requirements. 10. Page 12 Part 3.1.3 "Therefore, if the upper Sacramento River stocks were stronger, the commercial fishery would have a larger allowable catch." There are many factors that could cause a decline, one of which being a natural ebb in the flow of life. There are many factors between Red Bluff and the ocean also that could cause the decline. One example: aquatic pests and control (one being copper-based herbicides) - taken from http://www.dbw.ca.gov/ "Effects of Control Methods on the Egeria densa "Community" Key Findings/Recommendations: Data on treatment efficacy, collected at three trial locations, suggest that the chemical Sonar was the least effective in reducing Egeria densa biomass. At two sites, Owl Harbor and Sandmound Slough, the copper-based herbicide, Komeen was the most effective control method. At one site within White Slough, mechanical harvesting produced the best results whsle at another site within White Slough, Reward was most effective. Compliance with protective water quality standards is only one element of a fishery restoration plan meant to re-establish the strength and numbers of the Sacramento River fishery. Many other elements of the plan are also currently being implemented, including river flow regulation, temperature control, fish passage improvements and the current restrictions on ocean fishing that are mentioned. CTR compliance alone would not allow the governments to remove current restrictions on ocean fishing. 11. Page 16 Part 3.3 "...and to provide for other environmental needs..."
3
The Endangered Species Act (ESA) is an example of this. 12. Page 17 (1 st paragraph) "...the powerhouse outlet is at the mid-level of the dam..." This does not include the operation of the temperature control device. It should be noted that although the penstock inlet is at the mid-level of the dam, actual withdrawals from the reservoir could be from various elevations from the temperature control device. The elevation is determined by temperature operations for the Chinook salmon in the Sacramento River; typically higher elevations in the spring, moving lower through the summer into the fall. 13. Page 18 Part 3.3.1 "Major fish kills in the upper Sacramento River were documented soon after the dam was constructed (NOAA, 1989)." The Sacramento River fishery was clearly impacted prior to the construction of the dams on the Sacramento River. The construction of Shasta Dam effectively served to improve the water quality of the Sacramento River above IMM from near lethal concentrations of 15 ppb copper to concentrations of less than 2 ppb. The dams also improved the general year round conditions in the Sacramento River and the fishery increased several fold. However, the fishery was no longer able to migrate/escape past copper and zinc pollution discharging from IMM, but was confined below Keswick Dam after 1950. As a result, the earlier smaller fish kills and sublethal events became more massive when IMM pollution discharged uncontrolled into a controlled Sacramento River system and on top of a fishery confined below Keswick Dam. The construction of the SCDD mitigated the massive fish kills, but the SCDD spilled on an average of every two to three years causing numerous events where emerging fry were killed. 14. Page 18 Part 3.3.1 "The USBR constructed the dam to act as a buffer for extreme fluctuations in discharges from Shasta Dam, while also producing electricity (NOAA, 1989)." In addition, Keswick Dam controls the runoff from an additional 45 square miles of drainage area below Shasta Dam and acts as a buffer for fluctuations in discharges from Spring Creek Power Plant (SCPP). Also note that flood protection is only one of several project purposes of the CVP. 15. Page 19 1980 MOU section "...United States Water and Power Resources Service [a division of USBR]_" [a Division of USBR] should be replaced with [former agency name of USBR] - this was Reclamation's name for a few years in the 1980's. 16. Page 20 Table 3-2 (c) "...but has not updated the MOU itself."
Reclamation has agreed to work with the State agencies and the EPA to appropriately revise the 1980 MOU after EPA's Slickrock Creek remedial actions are completed and in place brig
4
enough to allow for data collection and an evaluation of the effectiveness of the remedy and measurement of the improvement to the waters discharging from this watershed. In the interim, Reclamation is informally working with the State and the EPA to operate CVP facilities to meet the protective Basin Plan standards in a manner consistent with Reclamation 's operational responsibilities, constraints and commitments.
17. Page 20 1st sentence, last paragraph "The USBR also manages SCPP operations to minimize mobilization of contaminated sediments and metal precipitates (Rae, 1998)."
When Reclamation makes a release from SCDD, a minimum flow of 250 cfs is maintained from SCPP to minimize mobilization of contaminated sediments and metal precipitates in the SCAKR. A release of only 250 cfs from SCPP does provide power generation, but is very inefficient arid equates to a loss of peak power production. Under normal operating conditions, Reclamation does not run SCPP at "Speed No Load" while SCDD releases are made. If releases are made from SCDD but SCPP has not operated recently and power generation is scheduled, the units at the SCPP generally will be run at Speed No Load for several hours before they begin generating. Reclamation also curtails authorized operations of the Keswick Reservoir elevations, at a loss of peak power production; to prevent mobilizing the SCAKR sediments. 18. Page 21 top paragraph "The SCDD releases some contaminated water into the SCAKR on a continuous basis." In general, the SCDD releases contaminated water into the SCAKR on a continuous basis. It is primarily "conjunctively operated" with the SCPP, i.e. releasing only when the SCPP is on, but SCPP may not be generating at all times while the SCDD is releasing water. When there is water in Spring Creek reservoir, the gates of the SCDD can be closed, but there is minor leakage. When the reservoir is empty or near empty, there is essentially no release. 19. Page 21 top paragraph "Because flows in the Sacramento River poorly flush the SCAKR, contaminants tend to accumulate to high concentrations in the SCAKR. Intermittent discharges from the SCPP can then rapidly flush these accumulations of contaminated water and precipitates into the main stem of the river (NOAA, 1989). If SCDD is releasing flows when the USBR has not scheduled the SCPP for operation, the USBR may operate the SCPP at "Speed No Load" during the releases or for several hours before generation begins. Running at Speed No Load requites that small amounts of water be run through the SCPP, which provides some flushing of the SCAKR so that a buildup of precipitates does not occur. This helps to minimize any "slugging" of sediments into the Sacramento River when the SCPP does come online."
When Reclamation makes a release from SCDD, a minimum flow of 250 cfs is maintained from SCPP to minimize mobilization of contaminated sediments and metal precipitates in SCAKR. A release of only 250 cfs from SCPP does provide power generation, but is very inefficient and equates to a loss of peals power production. Under normal operating conditions, Reclamation does not run SCPP at "Speed No Load" while SCDD releases are made. If releases are made
5
from SCDD but SCPP has not operated recently and power generation is scheduled, the units at the SCPP generally will be run at Speed No Load for several hours before they begin generating. The 250 cfs gentle "flushing" flow reduces the risk for the AMD to collect in the SCAKR and potentially flow out as an unregulated pulse. 20. Page 26 Part 4.3.1 "Deaths of fish were common in water below Keswick Dam during the mid-20th century (NOAA, 1989; Cooke and Corner, 1998)." There were also fish kills prior to the mid-20th century. DFG performed river toxicity testing in the late 1930's: Prior to the construction of Shasta. Dam, the Sacramento River was a muddy, polluted river that had near lethal concentrations of copper above IMM and lethal concentrations of copper below IMM. There are no data, however; the dead fish were washed down the river. 21. Page 26 Part 4.3.2 "The spawning population of Chinook salmon and steelhead trout in the upper Sacramento River has declined steadily since the 1960s, apparently because of metal contamination from the Iron Mountain Mines sites. 11" The footnote 11 should be incorporated into this paragraph to show the larger picture. Again, there are many factors between Red Bluff and the ocean that have likely contributed to declines. As noted earlier, the use of copper-based herbicides in the delta is an example. There are a number of factors that lead to the decline of the Sacramento River fishery. IMM is an important factor, but it is one of several factors. 22. Page 27 Part 4.3.2 "In addition, springtime releases of AMD coincide with spawning." Most AMD releases would occur in the early winter and fall and any spring releases would be more likely to be diluted with the higher springtime release from Keswick. 23. Page 32 top of page Part 5.3 "...and from changes in regional dam operations that improved dilution of AMD." . This could read "...and from Reclamation's dilution of AMD with Shasta Dam flows, when feasible." Sometimes Shasta water is too high in metals to use as dilution, or cannot be released due to downstream flooding or other operational constraints. See comment #1. 24. Page 58 Part 6.4 "...combined with improved USBR dam operations..." See comment #1. 25. Page 58 Part 6.4 "...and an updated agreement between USBR and State Board..." Reclamation has agreed to work with the State agencies and the EPA to appropriately revise the 1980 MOU after EPA's Slickrock Creels remedial actions are completed and in place long
enough to allow for data collection and an evaluation of the effectiveness of the remedy and measurement of the improvement to the waters discharging from this watershed. In the interim, Reclamation is informally working with the State and EPA to operate CVP facilities to meet the protective Basin Plan standards in a manner consistent with Reclamation's operational responsibilities, constraints and commitments. 26. Page 68 part 8.2 "If the upper Sacramento River behaved as a natural watershed system, Regional Board staff would assign individual load or wasteload allocations to each of the dissolved metal sources. However, the USBR's manipulation of releases from Shasta Dam, SCDD, and SCPP typically control dissolved metal concentrations measured below Keswick Dam. To prevent future exceedances of numeric targets below Keswick Dam, any load reduction allocation has to address the complicated relationship between the timing of discharges from the different metal sources (e.g., discharges resulting from intense storm runoff) and the USBR's control of Shasta Dam, SCDD, and SCPP releases." Suggest replacing "manipulation of releases from" to "operation of." Reclamation agrees that the TMDL must consider the complex operations of CVP facilities in setting load allocations to sources of the pollution, in the same manner that EPA considered them in assessing the effectiveness of the proposed IMM remedies. However, Reclamation is not responsible for the sources of the pollution addressed in this TMDL.
27. Page 71 1 st paragraph "...in combination with improved dam manipulations..." See comment #1.
28. Page 71 2nd paragraph "...with improved USBR dam operations..."
See comment #l.
29. Page 71 3rd paragraph "As a result, Regional Board staff assigns the USEPA and USBR joint responsibility for load reductions and maintenance of metal concentrations in the Sacramento River below Keswick Dam to levels below the numeric targets." Reclamation strenuously objects to this inappropriate assignment of responsibility. Reclamation is not responsible for the metal load reductions. Reclamation has voluntarily operated CVP facilities to minimize the impacts of AMD on the Sacramento River, and has agreed to work with the State and EPA to revise the 1980 MOU when it is appropriate to do so. However, Reclamation took an adamant position during IMM settlement negotiations that Reclamation was hopeful of lessening the burden of IMM-related operations at SCDD and Keswick Dam, and did not anticipate making onerous efforts to improve operations. The parties involved in that settlement, including the EPA and the Regional Board, understand that settlement of the IMM litigation meant accepting the risk of future exceedances of the Basin Plan standards.
30. Page 72 Part 8.3 "At this time, Regional Board staff does not assign allocations for point (e.g., treatment plants and other permitted dischargers) and nonpoint sources (e.g., Afterthought
7
Mine) downstream of Keswick Dam for this TMDL for three reasons: 1. As described in Chapter 5 (Source Assessment), discharges from Keswick Dam account for the majority of dissolved cadmium, copper, and zinc loads measured in the upper Sacramento River above Bend Bridge. Reductions in metals loads in Keswick Dam releases resulting from remediations at the IMM site, in combination with improved USBR dam release manipulations and remediation activities at mines in the Shasta Lake area, are expected to reduce dissolved metal loads and concentrations measured in the Sacramento River between Keswick Dam and Bend Bridge." It is Reclamation's position that downstream dischargers should be issued allocations as well as sources in the Shasta Lake watershed. Reclamation is not a source of the pollution. Reclamation believes that the sources of the pollution above Shasta Dam must be considered in setting the TMDL for the river below Keswick Dam. The Draft Report itself indicates that at times these sources provide a dominant load to the river. EPA's remedy assumed that the Shasta Dam releases would provide abase load of 2 ppb copper or less. If the TMDL assignment allows releases from these mines that result in 4 ppb copper, for example, the IMM remedy would be seriously impaired. 31. Page 72 Part 8.3 "...improved USBR dam release manipulations..." See comment #1. 32. Page- 72 Part 8.3 (bottom paragraph) "As described in Chapter 10, Regional Board staff will require dischargers to monitor for dissolved metals." Does this mean that dischargers are required to sample for metals, but at the same time have no load allocations to meet? 33. Page 74 Part 9.2 "...willful malicious acts." Unclear as to what is meant by this. Does this refer to acts of terrorism or illegal dumping? Examples would be helpful. 34. Page 75 (last paragraph) "However, the 1980 MOU is out of date." Reclamation has agreed to work with the State agencies and the EPA to appropriately revise the 1980 MOU after EPA's Slickrock Creek remedial actions are completed and in place long enough to allow for data collection and an evaluation of the effectiveness of the remedy and measurement of the improvement to the waters discharging from this watershed. In the interim, Reclamation is informally working with the State and EPA to operate CVP facilities to meet the protective Basin Plan standards in a manner consistent with Reclamation's operational responsibilities, constraints and commitments.
35. Page 76 #1 "...improved U.S. Bureau of Reclamation (USBR) manipulation of dam flows..."
8
See comment #l. 36. Page 76 #1 "The USEPA Superfund Program's water quality modeling indicated that the proposed remediation activities at the IMM site -in coordination with current site remediation activities and improved U.S. Bureau of Reclamation (USBR) manipulation of dam flows - would control more than 95% of total IMM site releases and substantially decrease the frequency of numeric target exceedances below Keswick Dam." See comment #1. 37. EPA's modeling analysis relied on Reclamation's projected flows (through the PROSIM model) and not on special releases of dilution water. PROSIM is a monthly planning model and may not be an appropriate tool to determine operational flexibility. SCDD can fill and spill in a few days and a monthly time-step model cannot capture the capability of the CVP to operate to such events. It also does not accurately model current CVP operational requirements. PROSIM is no longer the appropriate tool for use in analyzing Reclamation operations, improved or otherwise. 38. Page 76 Part 1(b) "Within the next five years, the USBR will improve dam operations to help eliminate the frequency of numeric target exceedances below Keswick Dam. In addition, Regional Board staff will work with the USBR, California Department of Fish and Game, and State Water Resources Control Board to update the USBR dam operations memorandum of understanding established in 198Q." See comment #1. It is unclear what improvements to dam operations are expected. Reclamation has agreed to work with the State agencies and the EPA to appropriately revise the 1980 MOU after EPA's Slickrock Creek remedial actions are completed and in place long enough to allow for data collection and an evaluation of the effectiveness of the remedy and measurement of the improvement to the waters discharging from this watershed. Reclamation will to the extent possible continue its current operations strategy for targeting the Basin Plan standards and minimizing the mobil ization of SCAKR sediments. However, Reclamation has stated, and as noted in the General Comment section of this letter, has received agreement from the other parties to the IMM settlements including the EPA and State agencies, that Reclamation is not now or at any time in the future to be held legally responsible for meeting Basin Plan or other standards for copper, cadmium or zinc in the Sacramento River. Reclamation made it abundantly clear during settlement negotiations that remedial activities at IMM should ultimately allow Reclamation to reduce its voluntary burden of meeting Basin Plan standards below Keswick.
9
39. Page 76 Part 1(f) "...in combination with USBR dam operations..." See comment #l . Three years following EPA's completion of Slickrock Creek remedial actions is an appropriate time to review the 1980 MOU. Reclamation notes that (f) appropriately does not say "improved dam operations." It would be even more appropriate to say "in combination with Reclamation's current level of dam operations." 40. Page 76 Part 1(f) "...staff will evaluate dissolved metal loads contributed by NPDES dischargers downstream of Keswick Dam." Please clarify the above, with reference to Page 72 Part 8.3: "At this time, Regional Board. staff does not assign allocations for point (e.g., treatment plants and other permitted dischargers) and nonpoint sources (e.g., Afterthought Mine) downstream of Keswick Dam..." Does this mean they must collect samples but are not required to meet loads? What if they exceed toxic limits? 41. Page 80 Part 10.2 "As noted in previous chapters, the 1980 MOU between the USBR, SWRCB, and CDFG is no longer adequate for the following reasons:" As stated in Section 10.2, Reclamation has, in recent years, voluntarily targeted the more stringent Basin Plan standards, and does also voluntarily coordinate operations of the SCPP and SCDD to minimize mobilization of the SCAKR sediments. Reclamation agrees that the 1980 MOU should be revised, but as discussed during IMM settlement negotiations and as agreed to among Reclamation, the Regional Board and DFG, the appropriate time to revise the 1980 MOU is after EPA's Slickrock Creek remedial actions are completed and in place long enough to allow for data collection and an evaluation of the effectiveness of the remedy and measurement of the improvement to the waters discharging from this watershed. In the interim, Reclamation continues to informally, and voluntarily, work with the State and the EPA to operate the CVP facilities to meet the protective Basin Plan standards in a manner consistent with Reclamation's other operational responsibilities and commitments. Reclamation has targeted the 5.6 ppb (assuming 40 mg/1 hardness) level for copper below Keswick, and Reclamation has met this objective but for a few instances. Figure 2-1 shows the copper concentrations compiled from all data received from various sources. (Printed in color, it is much easier to see.) The upper red line is the Basin Plan objective. There are relatively few times that this was exceeded except during spring 2001. See footnote 27 from page 62. Reclamation has stated, and as noted in the General Comment section of this letter, has received agreement from the other parties to the IMM settlement, including the EPA and State agencies, that Reclamation is not now or at any time in the future to be held legally responsible for meeting Basin Plan or other standards for copper, cadmium or zinc in the Sacramento River. Therefore,
10
Reclamation strenuously objects to tile notion that the 1980 MOU be updated "to ensure compliance with this TMDL." Reclamation will resist any such language (such as "compliance" that suggests Reclamation's operations, as they relate to reducing mining pollution, are anything but voluntary in nature. 42. Page 80 Part 10.2 "However, in recent years, USER staff has attempted to target the more stringent Basin Plan water quality objectives for dissolved concentrations for the upper Sacramento River in addition to the 1980 MOU objectives, and consulted with other federal and state agencies to improve dam operations to meet the requirements of various agencies." This should be reworded: However, in recent years, USBR staff has targeted the more stringent Basin Plan...1980 MOU objectives. 43. Page 80 Part 10.2 "...and consulted with other federal and state agencies to improve dam operations to meet the requirements of various agencies." USBR staff consult with other federal and state agencies in order to improve SCDD operations and target the Basin Plan standards when CVP operations allow. See comment #1. 44. Page 80 Part 10.2 "In addition, the USBR has developed an operations strategy for the SCPP to minimize mobilization of contaminated sediments and metal precipitates, and will improve SCDD, Shasta. dam, and SCPP operations based on past experience, the USEPA's water quality modeling results, and the effectiveness of USEPA's remediation activities at the IMM site." Reclamation will to the extent possible continue its current operations strategy for targeting the Basin Plan standards and minimizing the mobilization of SCAKR sediments. However, Reclamation has stated, and as noted in the General Comment section of this letter, has received agreement from the other parties to the IMM settlement, including the EPA and State agencies, that Reclamation is not now or at any time in the future to be held legally responsible-for meeting Basin Plan or other standards for copper, cadmium or zinc in the Sacramento River. Reclamation made it abundantly clear during settlement negotiations that remedial activities at IMM should ultimately allow Reclamation to reduce its voluntary burden of meeting Basin Plan standards below Keswick. 45. Page 81 Part 10.5 "Regional Board staff will review the monitoring data collected by the USBR, City of Redding, USEPA, and the CVRWQCB (under NPDES/Cease and Desist Orders)..."
11
Reclamation does not monitor the Sacramento River under any permit or order, but rather under voluntary agreement with the 1980 MOU. Reclamation expects that the frequency of monitoring may be reduced in the future due to ongoing remedial actions at IMM. Reclamation agrees that ongoing remediation activities may allow the proposed numeric targets to be met. However, if dissolved metal concentrations still exceed criteria at the end of Part 2 of the TMDL effort, Reclamation will support Regional Board staff in their effort to work with the EPA to develop additional remediation activities, but these activities will not be Reclamation's responsibility. 46. Page B-7 "...and the PRPs are currently designing the Slickrock..." Stouffer Management Company (SMC) designed the Slickrock Creek Retention Reservoir on behalf of Rhone-Poulenc. CH2M Hill is constructing the Slickrock Creek Retention Reservoir pursuant to that design for EPA. .
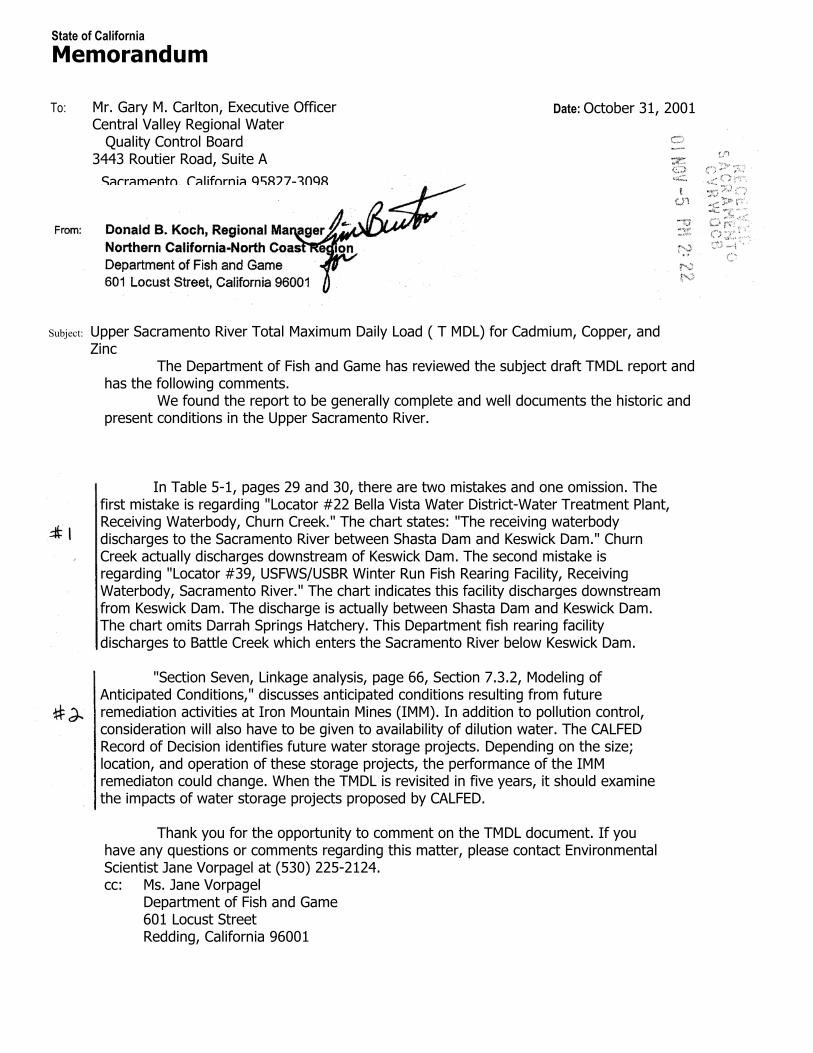
State of California Memorandum
To: Mr. Gary M. Carlton, Executive Officer Central Valley Regional Water Quality Control Board 3443 Routier Road, Suite A
Date: October 31, 2001
Sacramento, California 95827-3098
Subject: Upper Sacramento River Total Maximum Daily Load ( T MDL) for Cadmium, Copper, and Zinc
The Department of Fish and Game has reviewed the subject draft TMDL report and has the following comments.
We found the report to be generally complete and well documents the historic and present conditions in the Upper Sacramento River.
In Table 5-1, pages 29 and 30, there are two mistakes and one omission. The first mistake is regarding "Locator #22 Bella Vista Water District-Water Treatment Plant, Receiving Waterbody, Churn Creek." The chart states: "The receiving waterbody discharges to the Sacramento River between Shasta Dam and Keswick Dam." Churn Creek actually discharges downstream of Keswick Dam. The second mistake is regarding "Locator #39, USFWS/USBR Winter Run Fish Rearing Facility, Receiving Waterbody, Sacramento River." The chart indicates this facility discharges downstream from Keswick Dam. The discharge is actually between Shasta Dam and Keswick Dam. The chart omits Darrah Springs Hatchery. This Department fish rearing facility discharges to Battle Creek which enters the Sacramento River below Keswick Dam.
"Section Seven, Linkage analysis, page 66, Section 7.3.2, Modeling of
Anticipated Conditions," discusses anticipated conditions resulting from future remediation activities at Iron Mountain Mines (IMM). In addition to pollution control, consideration will also have to be given to availability of dilution water. The CALFED Record of Decision identifies future water storage projects. Depending on the size; location, and operation of these storage projects, the performance of the IMM remediaton could change. When the TMDL is revisited in five years, it should examine the impacts of water storage projects proposed by CALFED.
Thank you for the opportunity to comment on the TMDL document. If you
have any questions or comments regarding this matter, please contact Environmental Scientist Jane Vorpagel at (530) 225-2124. cc: Ms. Jane Vorpagel Department of Fish and Game 601 Locust Street Redding, California 96001
26 October 2001
Ms. Patricia Vellines Engineering Geologist Sacramento TMDL Unit California Regional Water Quality Control Board, Central Valley Region 3443 Routier Road, Suite A Sacramento, California 95827-3003 Subject: Comments on the Upper Sacramento River Total Maximum Daily Load (TMDL) for Cadmium, Copper, and Zinc Dear Ms. Vellines:
Sierra Pacific Industries (SPI) has reviewed the draft staff report, Upper Sacramento River TMDL for Cadmium, Copper and Zinc (Draft Report), issued by the Central Valley Regional Water Quality Control Board (Regional Board). and is responding to your request for comments dated 3 October 2001. SRI currently discharges storm water to the upper Sacramento River, downstream of the Keswick Dam, under a general storm water permit. In general, SPI agrees with the Draft Report, but has some concerns regarding the Implementation Plan. SPI agrees that impairment of the upper Sacramento River between Keswick Dam and Cottonwood Creek is primarily the result of discharges of acid mine drainage (AMD) above the Keswick Dam. The Draft Report indicates that releases from the Keswick Dam contribute 80 percent or more of the dissolved cadmium, copper, and zinc in the upper Sacramento River. Because remediation activities are scheduled for the Iron Mountain Mine and other mine sites that are anticipated to significantly decrease AMD-contaminated discharges, SPI agrees that a two-part TMDL Implementation Plan is appropriate. However, SPI is concerned that the Implementation Plan does not address whether additional activities may be required, if the activities scheduled during the first part of the TMDL strategy do not result in compliance with the proposed numeric targets for the upper Sacramento River. Specifically, SPI is concerned that the Regional Board may allocate inappropriate loads to industrial dischargers to achieve the proposed numeric targets, even though the industrial dischargers do not contribute significantly to the concentrations of dissolved cadmium, copper, and zinc in the upper Sacramento River.
We appreciate the opportunity to comment on the Draft Report. Please contact Scott Leiby at (530) 378-8282 if you have any questions or wish to .discuss SPI's comments.
Ms. Patricia Vellines California Regional Water Quality Control Board, Central Valley Region 26 October 2001 Page 2 ‘ Very truly yours,
SIERRA PACIFIC INDUSTRIES
cc: Paul Emmen, SPI
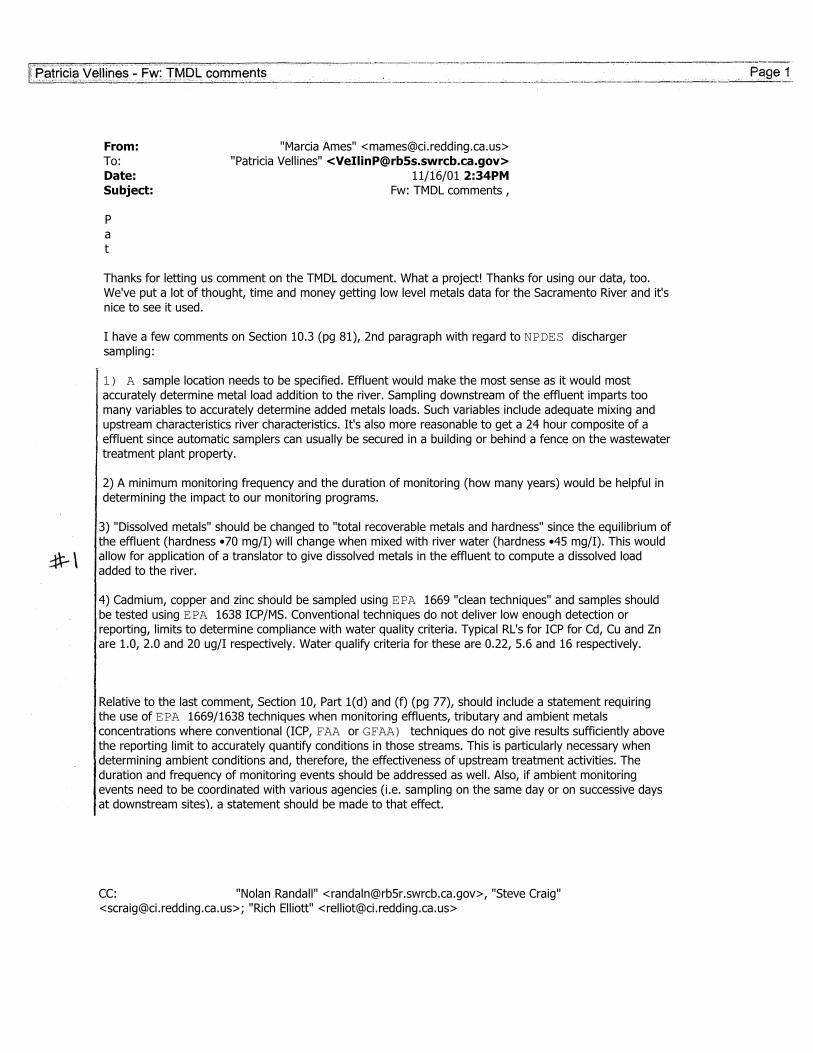
From: "Marcia Ames" <[email protected]> To: "Patricia Vellines" <[email protected]> Date: 11/16/01 2:34PM Subject: Fw: TMDL comments , Pat Thanks for letting us comment on the TMDL document. What a project! Thanks for using our data, too. We've put a lot of thought, time and money getting low level metals data for the Sacramento River and it's nice to see it used. I have a few comments on Section 10.3 (pg 81), 2nd paragraph with regard to NPDES discharger sampling: 1) A sample location needs to be specified. Effluent would make the most sense as it would most accurately determine metal load addition to the river. Sampling downstream of the effluent imparts too many variables to accurately determine added metals loads. Such variables include adequate mixing and upstream characteristics river characteristics. It's also more reasonable to get a 24 hour composite of a effluent since automatic samplers can usually be secured in a building or behind a fence on the wastewater treatment plant property. 2) A minimum monitoring frequency and the duration of monitoring (how many years) would be helpful in determining the impact to our monitoring programs.
3) "Dissolved metals" should be changed to "total recoverable metals and hardness" since the equilibrium of the effluent (hardness •70 mg/I) will change when mixed with river water (hardness •45 mg/I). This would allow for application of a translator to give dissolved metals in the effluent to compute a dissolved load added to the river. 4) Cadmium, copper and zinc should be sampled using EPA 1669 "clean techniques" and samples should be tested using EPA 1638 ICP/MS. Conventional techniques do not deliver low enough detection or reporting, limits to determine compliance with water quality criteria. Typical RL's for ICP for Cd, Cu and Zn are 1.0, 2.0 and 20 ug/I respectively. Water qualify criteria for these are 0.22, 5.6 and 16 respectively. Relative to the last comment, Section 10, Part 1(d) and (f) (pg 77), should include a statement requiring the use of EPA 1669/1638 techniques when monitoring effluents, tributary and ambient metals concentrations where conventional (ICP, FAA or GFAA) techniques do not give results sufficiently above the reporting limit to accurately quantify conditions in those streams. This is particularly necessary when determining ambient conditions and, therefore, the effectiveness of upstream treatment activities. The duration and frequency of monitoring events should be addressed as well. Also, if ambient monitoring events need to be coordinated with various agencies (i.e. sampling on the same day or on successive days at downstream sites), a statement should be made to that effect.
CC: "Nolan Randall" <[email protected]>, "Steve Craig" <[email protected]>; "Rich Elliott" <[email protected]>