Embed Size (px)
Citation preview

Alaska Department of Environmental Conservation 410 Willoughby Avenue, Suite 303
P.O. Box 111800 Juneau, Alaska 99801
Total Maximum Daily Load (TMDL) to Address the Sediment and Interstitial Dissolved Oxygen
Impairments in Jordan Creek, Alaska
Final
September 2009


Final TMDL for Sediment and Interstitial Dissolved Oxygen in Jordan Creek, Alaska September 2009
-i-
Contents
Executive Summary ................................................................................................................................... iii
1. Overview ......................................................................................................................................... 1 1.1. Watershed Location ...................................................................................................................... 2 1.2. Land Use/Land Cover ................................................................................................................... 5 1.3. Population ..................................................................................................................................... 8 1.4. Climate.......................................................................................................................................... 8 1.5. Local Hydrology ........................................................................................................................... 9 1.6. Biological Resources .................................................................................................................. 10
2. Water Quality Standards and TMDL Targets ............................................................................. 12 2.1. Applicable Water Quality Standards .......................................................................................... 12 2.2. Designated Use Impacts ............................................................................................................. 13 2.3. TMDL Targets ............................................................................................................................ 15
3. Data Inventory and Analysis ....................................................................................................... 16 3.1. Previous Studies ......................................................................................................................... 16
3.1.1. USGS Baseline Study and Routine Monitoring ................................................................ 16 3.1.2. UAS Mendenhall Watershed Study .................................................................................. 19 3.1.3. UAS Jordan Creek Watershed Study ................................................................................ 19 3.1.4. UAS Jordan Creek Watershed Supplemental Study ......................................................... 20
3.2. Data Analysis .............................................................................................................................. 20 3.2.1. Total Suspended Solids ..................................................................................................... 23 3.2.2. Interstitial Dissolved Oxygen Samples ............................................................................. 25 3.2.3. Sediment Substrate ........................................................................................................... 27
3.3. Impairment Conditions ............................................................................................................... 29
4. Potential Sources ......................................................................................................................... 32 4.1. Point Sources .............................................................................................................................. 32 4.2. Nonpoint Sources ....................................................................................................................... 32
4.2.1. Sediment ........................................................................................................................... 32 4.2.2. Dissolved Oxygen ............................................................................................................. 33
4.3. Load Estimates for Potential Sources of Sediment to Jordan Creek .......................................... 34 4.3.1. Urban Runoff .................................................................................................................... 34 4.3.2. Winter Road Maintenance ................................................................................................ 36 4.3.3. Snow Dumps ..................................................................................................................... 36 4.3.4. East Valley Reservoir Tributary ....................................................................................... 37 4.3.5. Other Sources .................................................................................................................... 38
5. Analytical Approach .................................................................................................................... 41 5.1. Sediment Transport and Budgets ................................................................................................ 43 5.2. Allowable Daily Load Estimates ................................................................................................ 45 5.3. Existing Daily Load Estimates ................................................................................................... 46
6. TMDL ............................................................................................................................................. 49 6.1. Wasteload Allocation ................................................................................................................. 51 6.2. Load Allocation .......................................................................................................................... 51 6.3. Future Sources ............................................................................................................................ 51 6.4. Margin of Safety ......................................................................................................................... 51 6.5. Seasonal Variation and Critical Conditions ................................................................................ 51 6.6. Daily Load .................................................................................................................................. 51
7. Implementation and Monitoring ................................................................................................. 52 7.1. Implementation Activities .......................................................................................................... 52 7.2. Connections to Hydrology and TMDL ....................................................................................... 53 7.3. Monitoring Needs ....................................................................................................................... 54
8. References .................................................................................................................................... 55

Final TMDL for Sediment and Interstitial Dissolved Oxygen in Jordan Creek, Alaska September 2009
-ii-
Figures
Figure 1-1. Location of the Jordan Creek watershed and surrounding area. ............................................... 3 Figure 1-2. Location of the Jordan Creek watershed. .................................................................................. 4 Figure 1-3. Land use and land cover in the Jordan Creek watershed (2001). .............................................. 6 Figure 1-4. Aerial photos of the Jordan Creek watershed (2006). ............................................................... 7 Figure 1-5. Monthly average precipitation and temperatures at Juneau International Airport. ................... 8 Figure 1-6. Mean monthly hydrograph at USGS station 15052475 - Jordan Creek at Egan Drive. .......... 10 Figure 2-1. Fine sediment accumulation at three sites in Jordan Creek based on 2007 sieve data. ........... 14 Figure 2-2. Relationship between sediment inputs, outputs, and siltation of interstitial gravels. .............. 15 Figure 3-1. All water quality sample stations in the Jordan Creek watershed. .......................................... 18 Figure 3-2. Jordan Creek sample stations representing combined datasets. .............................................. 22 Figure 3-3. All available TSS concentrations collected at the Jordan Creek combined data sites. ........... 23 Figure 3-4. TSS concentrations vs. flow at the Egan Drive sampling station (JC-B). ............................... 24 Figure 3-5. TSS samples and continuous flows at Egan Drive. ................................................................. 25 Figure 3-6. Available interstitial DO concentrations and applicable water quality criterion. .................... 26 Figure 3-7. Grain size accumulation for 2007 sieve samples. ................................................................... 28 Figure 3-8. Flow duration curve for Jordan Creek. .................................................................................... 29 Figure 3-9. Water quality duration curve analysis for Jordan Creek. ........................................................ 31 Figure 3-10. Load duration curve analysis for Jordan Creek. .................................................................... 31 Figure 4-1. Snow dump adjacent to Jordan Creek. .................................................................................... 37 Figure 4-2. EVR tributary above Jordan Creek. ........................................................................................ 38 Figure 4-3. Damage in upper Jordan Creek due to illegal off-road vehicle use. ....................................... 40 Figure 5-1. Relationship of interstitial DO to fine sediment and storm water. .......................................... 42 Figure 5-2. Suspended sediment rating curve for Jordan Creek. ............................................................... 43 Figure 5-3. Jordan Creek load duration curve using sediment rating curve. ............................................. 45 Figure 5-4. Fraction analysis of storm flow relative to total flow in Jordan Creek. .................................. 47 Figure 5-5. Storm flow duration curve for Jordan Creek. .......................................................................... 47 Figure 5-6. Jordan Creek source input loads compared to transport capacity. .......................................... 48 Figure 6-1. Suspended sediment loading capacity for Jordan Creek. ........................................................ 50
Tables
Table 1-1. Jordan Creek 2008 303(d) Listing Details .................................................................................. 2 Table 1-2. Land Use and Land Cover of the Jordan Creek Watershed (2001) ............................................ 5 Table 2-1. Alaska Water Quality Standards for Dissolved Gas and Sediment .......................................... 12 Table 3-1. Summary of Available Surface Water Quality Data for Jordan Creek ..................................... 17 Table 3-2. USGS Water Quality Sampling Stations .................................................................................. 19 Table 3-3. UAS 2003-2004 Water Quality Sampling Stations .................................................................. 19 Table 3-4. UAS 2005-2006 Water Quality Sampling Stations .................................................................. 20 Table 3-5. Stations Representing Combined Datasets for Jordan Creek ................................................... 21 Table 3-6. Summary of TSS Concentrations in Jordan Creek ................................................................... 23 Table 3-7. Summary of Available Interstitial DO Data for Jordan Creek ................................................. 25 Table 3-8. Interstitial DO Results for the 2008 Jordan Creek Study ......................................................... 27 Table 4-1. Parameters Used to Calculate Runoff for Estimation of Urban Sediment Source Loads ......... 35 Table 4-2. Sediment Source Load Estimates for Urban Runoff in the Jordan Creek Watershed .............. 35 Table 5-1. Summary of TMDL Analysis for Jordan Creek ....................................................................... 42 Table 5-2. Rapid Sediment Budget for Jordan Creek ................................................................................ 44 Table 6-1. Jordan Creek Sediment TMDL Summary ................................................................................ 50 Table 7-1. Sediment Reduction Actions Identified in JCWRMP .............................................................. 53 Table 7-2. Implementation Opportunities Highlighted using a Duration Curve Framework .................... 54

Final TMDL for Sediment and Interstitial Dissolved Oxygen in Jordan Creek, Alaska September 2009
-iii-
Total Maximum Daily Load for
Sediment in the Waters
of Jordan Creek in Juneau, Alaska
TMDL AT A GLANCE:
Water Quality-limited? Yes
Hydrologic Unit Code: 19020301
Criteria of Concern: Sediment and Interstitial Dissolved Oxygen
Designated Uses Affected: Aquatic life use
Major Source(s): Urban runoff
High
Flows
Moist
Conditions
Mid-range
Flows
Dry
Conditions Low Flows
Loading Capacity (pounds/day): 764 41 5.0 0.45 –
Load Allocation (pounds/day): 535 29 4.5 0.40 –
Wasteload Allocation (pounds/day): n/a n/a n/a n/a n/a
Future Sources (pounds/day): 153 8 – – –
Margin of Safety (10%) (pounds/day): 76 4 0.5 0.05 –
Executive Summary
Jordan Creek drains about 3 square miles within the City and Borough of Juneau (CBJ), flowing through
the eastern edge of the Mendenhall Valley, just south of the Mendenhall Glacier. The State of Alaska
first included Jordan Creek (Alaska ID Number 10301-004) on its 303(d) list of impaired waterbodies in
1998 for sediment, debris, and dissolved oxygen (DO). The residue (debris) listing was removed as a
residue TMDL was completed and approved for Jordan Creek in May 2005. The sediment and DO
impairments were also included on the 2004, 2006, and 2008 303(d) lists. Expected pollutant sources
noted on the 303(d) list are land development and road runoff. Other expected sources include snow
dumps and winter road maintenance.
A Total Maximum Daily Load (TMDL) is established in this document to meet the requirements of
Section 303(d)(1)(C) of the Clean Water Act and the U.S. Environmental Protection Agency’s (EPA)
implementing regulations (40 CFR Part 130), which require the establishment of a TMDL for the
achievement of water quality standards when a waterbody is water quality-limited. A TMDL is
composed of the sum of individual waste load allocations (WLAs) for point sources and load allocations
(LAs) for nonpoint sources and natural background loads. In addition, the TMDL must include a margin
of safety (MOS), either implicitly or explicitly, that accounts for the uncertainty in the relationship
between pollutant loads and the quality of the receiving waterbody. A TMDL represents the amount of a
pollutant the waterbody can assimilate while maintaining compliance with applicable water quality
standards.

Final TMDL for Sediment and Interstitial Dissolved Oxygen in Jordan Creek, Alaska September 2009
-iv-
Sources expected to be contributing sediment to Jordan Creek include:
Low density residential areas adjacent to Jordan Creek
Medium to high density residential areas (e.g., Thunder Mountain Trailer Park)
Commercial areas below Egan Drive
Roads (particularly sediment from winter sanding)
Snow dumps
ATV trails
Localized erosion along the East Valley Reservoir (EVR) tributary adjacent to CBJ water tower
road
This document presents the TMDL to address sediment and DO impairments in Jordan Creek. The listing
for DO is associated with low interstitial DO concentrations found in the streambed, not within the water
column. It is thought the accumulation of fine sediment in stream gravels is the main cause of low
interstitial DO concentrations in Jordan Creek. Excess sediment embeds spawning gravels, creating a
physical impediment to fish reproduction and decreasing interstitial DO concentrations. Because newly
emerged fry occupy the interstitial spaces in optimal stream substrates, large inputs of sediment may also
reduce stream carrying capacity by reducing available refuge (Bjornn and Reiser, 1991). Therefore, the
TMDL is established for sediment to address both the sediment and interstitial DO impairments.
To calculate a TMDL, it is necessary to identify a TMDL target as a link between sediment loads and the
resulting impact on criteria and designated uses to calculate the loading capacity and necessary load
reductions. The intent of this TMDL is to ensure that the accumulation of fine sediment is not causing
violations of Alaska’s water quality criteria for DO or sediment. Accumulation of fine sediment occurs
when the amount of fine sediment entering Jordan Creek is greater than the amount leaving it. Therefore,
to ensure that sediment is transported out of Jordan Creek rather than settling out of the water column and
accumulating in the stream bed, the TMDL targets and loading capacity for sediment are calculated based
on the transport capacity of the creek, rather than as a specific sediment concentration or static loading
rate.
To control the accumulation of fine sediment in Jordan Creek, the loading capacity (i.e., the TMDL) for
fine sediment cannot be greater than the stream’s ability to transport sediment from the creek. Therefore,
the loading capacity is calculated as equal to the ability of the stream to export sediment. That is, the
allowable amount of sediment to be input to the stream is equal to the amount of sediment that the stream
can transport out, allowing minimal settling and accumulation of fine sediment. Because the transport
capacity of the stream varies with flow; the loading capacity for Jordan Creek is calculated as a function
of flow.
Available sediment and flow data for Jordan Creek were used to develop a rating curve relating sediment
export to unit area flow. The regression equation representing the relationship established in the sediment
rating curve can be used with Jordan Creek flow data to calculate loading capacity as a function of flow.
Each daily average unit area flow can be substituted into the regression equation to calculate a
corresponding daily unit area load (i.e., loading rate). The equation is as follows:
LR = 0.0004 * Qua 3.166
where
LR = suspended sediment loading rate in pounds per acre per day
Qua = unit area flow in cubic feet per (cfs) second per square mile

Final TMDL for Sediment and Interstitial Dissolved Oxygen in Jordan Creek, Alaska September 2009
-v-
The daily unit area load can then be multiplied by the corresponding drainage area to determine the load
at that point. This load estimate identifies the amount of sediment that can be transported from that point
each day.
While loading capacities can be calculated for individual flows, the TMDL establishes loading capacity
targets for each flow duration interval to target necessary load reductions. These loading capacities are
calculated using the median unit area flow for each of five flow zones—high flows, moist conditions,
mid-range flows, dry conditions and low flows. The flow zones are depicted in Figure ES-1 and
associated loading capacities are presented in Table ES-1. Because there are no permitted point sources in
the Jordan Creek watershed, the entire loading capacity is allocated to the load allocation for nonpoint
sources (minus a 10 percent margin of safety). While there are no known industrial facilities in the Jordan
Creek watershed currently covered by the multi-sector general permit (MSGP) for stormwater, it is
possible that future permitted stormwater sources could affect sediment loading in the watershed.
Therefore, a portion of the loading capacity has been allocated for future sources.
Table ES-1. Jordan Creek Sediment TMDL Summary
TMDL Summary
Loads expressed as (pounds/day)1
High Moist Mid-Range Dry Low
Loading Capacity 764 41 5.0 0.45 –
Load Allocation 535 29 4.5 0.40 –
Wasteload Allocation n/a n/a n/a n/a n/a
Future Sources 153 8 – – –
Margin of Safety 76 4 0.5 0.05 –
Figure ES-1. Suspended sediment loading capacity in Jordan Creek.
A unique loading capacity for each duration curve zone allows the TMDL to reflect major watershed
processes indicative of different flows. In-stream channel processes tend to dominate the sediment

Final TMDL for Sediment and Interstitial Dissolved Oxygen in Jordan Creek, Alaska September 2009
-vi-
regime at high flows, while sediment delivered from surface erosion may be of greater concern under
moist conditions. A separate loading capacity for each zone allows the TMDL to guide implementation
efforts uniquely associated with these conditions. The use of a discrete loading capacity for each zone
also acknowledges the variability and uncertainty inherent in natural systems. The framework provides a
focus for identifying targets that reflect expected patterns.
The implementation of controls to meet the Jordan Creek TMDL and ultimately water quality standards
will likely be guided by recommendations identified in the Jordan Creek Watershed Recovery and
Management Plan (JCWRMP). The JCWRMP (NRCS, 2006) was initiated to address water quality
problems in Jordan Creek and identifies a number of activities that, if implemented, will reduce sediment
delivery to Jordan Creek. These activities include:
Erosion control
Snow storage and removal
Riparian management and streambank stabilization
Education and outreach
In addition, the Juneau Watershed Partnership and CBJ have conducted an alternatives analysis to
examine options to address legacy sediment problems associated with the EVR tributary. Conceptual
remedies are being considered for restoring flood conveyance and enhancing aquatic/riparian habitats
along Jordan Creek and for slowing the rate of sediment delivery from the EVR tributary and the growth
of the sediment fan.

Final TMDL for Sediment and Interstitial Dissolved Oxygen in Jordan Creek, Alaska September 2009
-1-
1. Overview
Section 303(d)(1)(C) of the Clean Water Act and the U.S. Environmental Protection Agency’s (EPA)
implementing regulations (40 CFR Part 130) require establishment of a Total Maximum Daily Load
(TMDL) for the achievement of state water quality standards when a waterbody is water quality-limited.
A TMDL identifies the amount of pollution control needed to maintain compliance with standards; it also
includes an appropriate margin of safety. The focus of the TMDL is reduction of pollutant inputs to a
level (or “load”) that fully supports the designated uses of a given waterbody. The mechanisms used to
address water quality problems after the TMDL is developed can include a combination of best
management practices (BMPs) and/or effluent limits and monitoring required through National Pollutant
Discharge Elimination System permits.
The State of Alaska first included Jordan Creek (Alaska ID Number 10301-004) on its §303(d) list of
impaired waterbodies in 1998 for sediment, debris, and dissolved oxygen (DO). The residue (debris)
listing was removed because Alaska Department of Environmental Conservation (ADEC) developed a
TMDL for residues in Jordan Creek, which EPA approved on June 10, 2005. The sediment and DO
impairments were also included on the 2004, 2006, and 2008 303(d) lists. The expected pollutant sources
causing the impairments in Jordan Creek include land development-induced erosion, road runoff, and
snow removal practices. The §303(d) listing, as reported in the 2008 Integrated Report, is displayed in
Table 1-1. Alaska’s Final 2008 Integrated Water Quality Monitoring Report states:
“Jordan Creek was Section 303(d) listed in 1998 for non-attainment of the Sediment, Residues
and Dissolved Gas standards for sediment, debris, and low dissolved oxygen (DO). Coho salmon
have dropped from an average of 250 adult returns to 54 in 1996 and 18 in 1997. It was one of
the most productive small streams in Juneau and Southeast Alaska for coho salmon but has
experienced a rapid decline. There are serious sediment problems in the stream with poor
survival of salmon eggs and low oxygen readings in the substrate that are in violation of water
quality standards. The stream is largely spring fed and cannot transport large volumes of
sediment like higher gradient systems. The headwaters of the stream are manipulated with ditches
replacing more productive habitat and with ponds filled in. There is an observed problem with
iron floc that was not present 10 years ago; however there is no hard iron data that might
document iron exceedances. The stream corridor is under rapid development and the lower
section of the creek regularly goes dry. Macroinvertebrate bioassessment sampling shows the
stream has low diversity and experienced declines over the 1994 to 1996 period. The University
of Alaska-Southeast has secured grant funds to identify potential pollutant sources in the
watershed. A suite of water quality parameters and pollutants including sediment, pH, DO, and
turbidity were sampled between August 2005 and June 2006. Findings are summarized in the
report: ―Watershed Protection and Recovery for Jordan Creek, Juneau, AK (Nagorski, Hood,
Hoferkamp, Neal & Hudson , July 2006). Results will be used to assess the effectiveness of
current pollution control practices, identify sources, and provide information to establish TMDLs
for Jordan Creek. A TMDL was developed and approved by EPA for residues on Jordan Creek
and is dated May 2005. Since Jordan Creek has an approved TMDL for residues Jordan Creek is
removed from the Section 303(d) and moved to Category 4a for residues. Jordan Creek remains
Category 5/Section 303(d) listed for dissolved gas and sediment.”
This document presents the TMDL to address sediment and DO impairments in Jordan Creek and
discusses watershed characteristics, available data for Jordan Creek, likely pollutant sources, and the
approach used to develop TMDLs and resulting allocations. The impaired DO listing for Jordan Creek is
associated with low interstitial DO concentrations found in the streambed, not within the water column. It
is thought that the accumulation of fine sediment in stream gravels is the main cause of low interstitial
DO concentrations in Jordan Creek (Hudson, 2008,). Therefore, the TMDL is established for sediment to
address both the sediment and interstitial DO impairments.

Final TMDL for Sediment and Interstitial Dissolved Oxygen in Jordan Creek, Alaska September 2009
-2-
Table 1-1. Jordan Creek 2008 303(d) Listing Details
Region Category Alaska ID Number
Water-body Location
Area of Concern
Water Quality
Standard Pollutant
Parameters Pollutant Sources
South East
Category 5 Section 303(d) listed
10301-004
Jordan Creek
Juneau 3 miles from tide-water up-stream
Sediment, Dissolved Gas
Sediment, Low Dissolved Oxygen
Land Development, Road Runoff
The following sections summarize general background information on the Jordan Creek watershed, as
presented in previously generated studies. The Jordan Creek watershed is relatively well documented and
has several reports that have been completed by the ADEC, the Natural Resources Conservation Service
(NRCS), the United States Geological Survey (USGS), and the University of Alaska Southeast (UAS).
ADEC developed a TMDL for residues in Jordan Creek, which EPA approved on June 10, 2005.
1.1. Watershed Location
Jordan Creek drains about 3 square miles within the City and Borough of Juneau (CBJ) flowing through
the eastern edge of the Mendenhall Valley, just south of the Mendenhall Glacier. The watershed makes
up a small portion of the Lynn Canal 8-digit HUC (19010301) and is situated towards the northern end of
the Southeast Alaska panhandle (Figure 1-1). Primarily fed by surface runoff and groundwater discharge,
Jordan Creek flows from the forested western slopes of Thunder Mountain (north and east), to the
Gastineau Channel (south) draining primarily rural, forested land until it reaches Egan Drive (Figure 1-2).
From Egan Drive to its confluence with the Gastineau Channel, Jordan Creek flows through higher
concentrations of urban development including parking lots, road crossings, office complexes, and a
section of the Juneau International Airport property. Once Jordan Creek meets the runway at the airport,
it is diverted into a large diameter culvert where it flows beneath the runway and out into a wetland/tidal
flats area before meeting the Gastineau Channel near Fritz Cove (ADEC, 2005).
The Jordan Creek watershed lies primarily within the Tongass National Forest. Despite flowing adjacent
to one of the most densely populated areas of Juneau, limited local development is expected in the near
future due to the lack of easily developed land (ADEC, 2005). The eastern banks of the upper and middle
segments of Jordan Creek flow adjacent to muskeg (swampy or boggy areas formed by the accumulation
of moss, leave, and decaying organic material similar to peat) and spruce forest. To the west of the
channel (straddling the Duck Creek/Jordan Creek watershed boundary) lies mostly spruce forest with
pockets of housing developments and apartment complexes (USGS, 2004). These developed areas to the
west are small portions of residential Juneau. A majority of the contributing watershed area lies to the
east of the channel and drains the steep western face of Thunder Mountain. These slopes are covered in
spruce forests and are primarily undeveloped, with the exceptions of Si’it Tuan housing development,
Thunder Mountain Trailer Park, and the Coho Park housing development.

Final TMDL for Sediment and Interstitial Dissolved Oxygen in Jordan Creek, Alaska September 2009
-3-
Figure 1-1. Location of the Jordan Creek watershed and surrounding area.

Final TMDL for Sediment and Interstitial Dissolved Oxygen in Jordan Creek, Alaska September 2009
-4-
Figure 1-2. Location of the Jordan Creek watershed.

Final TMDL for Sediment and Interstitial Dissolved Oxygen in Jordan Creek, Alaska September 2009
-5-
1.2. Land Use/Land Cover
The land use/land cover for the Jordan Creek watershed was extracted from the National Land Cover Data
(NLCD) 2001 landcover database. NLCD 2001 is a Landsat-based land cover database with 21 classes of
land cover, percent tree canopy, and percent urban imperviousness at 30-meter cell resolution. The
resulting land use and land cover characteristics of the Jordan Creek watershed are summarized in Table
1-2 and displayed in Figure 1-3. Figure 1-4 displays aerial photos from 2006 of the Jordan Creek
watershed.
The table and the figures indicate that forested areas (deciduous, evergreen, and mixed forest together) are
the dominant land cover class in the watershed, accounting for nearly 70 percent of the total watershed
area. The forested areas cover most of the watershed north of Egan Drive as these portions are the steep
slopes of Thunder Mountain to the east. Most of these upland areas are owned and managed by the
Tongass National Forest (NRCS, 2006). Pockets of dwarf scrub and shrub/scrub exist in the higher
elevations, and together these land cover types make up less than 10 percent of the watershed area. Near
the mouth and confluence with the Gastineau Channel, there are small, low lying areas of woody and
emergent herbaceous wetlands through which Jordan Creek flows.
Developed land combined (open space, low, medium, and high intensity) accounts for about 20 percent of
the Jordan Creek watershed. A majority of the developed land in the Jordan Creek watershed lies south
of Egan Drive, and some smaller developed areas exist in the western portions of the watershed. There
are 14 culverts and bridges in the lower segment of Jordan Creek, downstream of Egan Drive (USGS,
2006). Rapid development has occurred in the Mendenhall Valley over the last century (NRCS, 2006).
Table 1-2. Land Use and Land Cover of the Jordan Creek Watershed (2001)
Land Cover / Land Use Area
(acres) Area
(square miles) Percent of Watershed
Perennial Ice, Snow 0.64 0.001 0.04%
Developed, Open Space 20.48 0.032 1.06%
Developed, Low Intensity 225.92 0.353 11.78%
Developed, Medium Intensity 67.84 0.106 3.55%
Developed, High Intensity 64.64 0.101 3.37%
Barren Land (Rock/Sand/Clay) 16.64 0.026 0.87%
Deciduous Forest 58.88 0.092 3.07%
Evergreen Forest 1,200.00 1.875 62.48%
Mixed Forest 76.80 0.120 4.01%
Dwarf Scrub 5.12 0.008 0.28%
Shrub/Scrub 158.72 0.248 8.26%
Woody Wetlands 3.20 0.005 0.16%
Emergent Herbaceous Wetlands 20.48 0.032 1.07%
Total 1,919.36 2.999 100.00%

Final TMDL for Sediment and Interstitial Dissolved Oxygen in Jordan Creek, Alaska September 2009
-6-
Figure 1-3. Land use and land cover in the Jordan Creek watershed (2001).

Final TMDL for Sediment and Interstitial Dissolved Oxygen in Jordan Creek, Alaska September 2009
-7-
Figure 1-4. Aerial photos of the Jordan Creek watershed (2006).

Final TMDL for Sediment and Interstitial Dissolved Oxygen in Jordan Creek, Alaska September 2009
-8-
1.3. Population
Based on 2000 census data, the population of the CBJ is 30,711. The U.S. Census Bureau estimates a
2006 population of 30,737 which is an estimated population increase of 0.1 percent from 2000 to 2006.
Jordan Creek drains portions of the most densely populated area of Juneau, the Mendenhall Valley, which
has an estimated population of roughly 13,000. About 4,364 people reside within the Jordan Creek
watershed (ADEC, 2005).
1.4. Climate
Jordan Creek is located in the maritime zone, characterized by moderate temperatures, significant
precipitation and generally cool, wet conditions year round. Juneau International Airport has historical
weather data from September 1949 to December 2006 and has an average annual temperature of 46F,
average annual precipitation of 56 inches, and an average annual total snowfall of 87 inches. Frequent
warming trends influenced by the maritime climate contribute to freeze-thaw conditions throughout the
winter. The upper portion of the Mendenhall Valley (near the Jordan Creek headwaters) tends to have
slightly less precipitation and somewhat cooler winter temperatures than the airport area (ADEC, 2005).
Summer temperatures average around 55F. Autumn begins in early September and ends in late October
with temperatures falling in September and snowfalls increasing in November. Winter (meaning the
period with average temperatures below freezing) lasts from November to early April, with the coldest
temperatures typically occurring in January. Winter temperatures average around 28F. Spring begins in
late April with moderate precipitation and increasing temperatures. Figure 1-5 presents a summary of
monthly averages for rainfall, snowfall, and temperature at the Juneau International Airport (National
Weather Service Station 504100), based on the period of record at the station from September 1949 to
December 2006.
0
5
10
15
20
25
Jan Feb Mar Apr May Jun Jul Aug Sep Oct Nov Dec
Month
Avera
ge M
on
thly
Pre
cip
itati
on
(in
)
0
10
20
30
40
50
60
70
Avera
ge M
on
thly
Max T
em
pera
ture
(F
)
Precipitation
SnowfallTemperature
Figure 1-5. Monthly average precipitation and temperatures at Juneau International Airport.
Final TMDL for Sediment and Interstitial Dissolved Oxygen in Jordan Creek, Alaska September 2009
-9-
1.5. Local Hydrology
The hydrology of Jordan Creek has changed significantly with the retreat of the Mendenhall Glacier
between the years of 1750 and 1900. Prior to its retreat, the meltwater of the Mendenhall Glacier fed
Jordan Creek (and Duck Creek) making up a large portion of its flow volume (NRCS, 2006). As the
glacier retreated into the Mendenhall Lake basin, the overflow from the lake created the Mendenhall
River and Jordan Creek became a smaller stream fed primarily by groundwater and surface runoff
(ADEC, 2005) from the steep slopes of Thunder Mountain (USGS, 2006).
Today, Jordan Creek is primarily fed by rainfall, snowmelt, and shallow groundwater resulting in flashy
flows that respond and recover from precipitation events relatively quickly (Nagorski et al., 2006).
Flooding periodically occurs in Jordan Creek flowing over roads and encroaching on streamside
properties and structures (USGS, 2006). Several segments of Jordan Creek and its tributaries have been
channelized or relocated to facilitate commercial development, and these projects influence both the
hydrology and fish habitat quality of the streams (NRCS, 2006).
In addition to the loss of flow from the glacial meltwater, natural dry weather periods make water quantity
a significant issue in Jordan Creek. Upper (upstream of Amalga Drive) and lower (near the Yandukin
Footbridge) segments of Jordan Creek have areas where the stream goes completely dry in late winter and
spring (Nagorski et al., 2006). In the late winter months, Jordan Creek can become disconnected pockets
of snow and ice with little or no flow. Late winter/early spring typically displays the lowest monthly
precipitation and during these low flow periods Jordan Creek derives a majority of its flow from shallow
groundwater (USGS, 2004; Nagorski et al., 2006). Loss of flow is a major concern for anadromous and
other resident fish that utilize Jordan Creek as habitat for spawning, egg incubation, and rearing (Nagorski
et al., 2006).
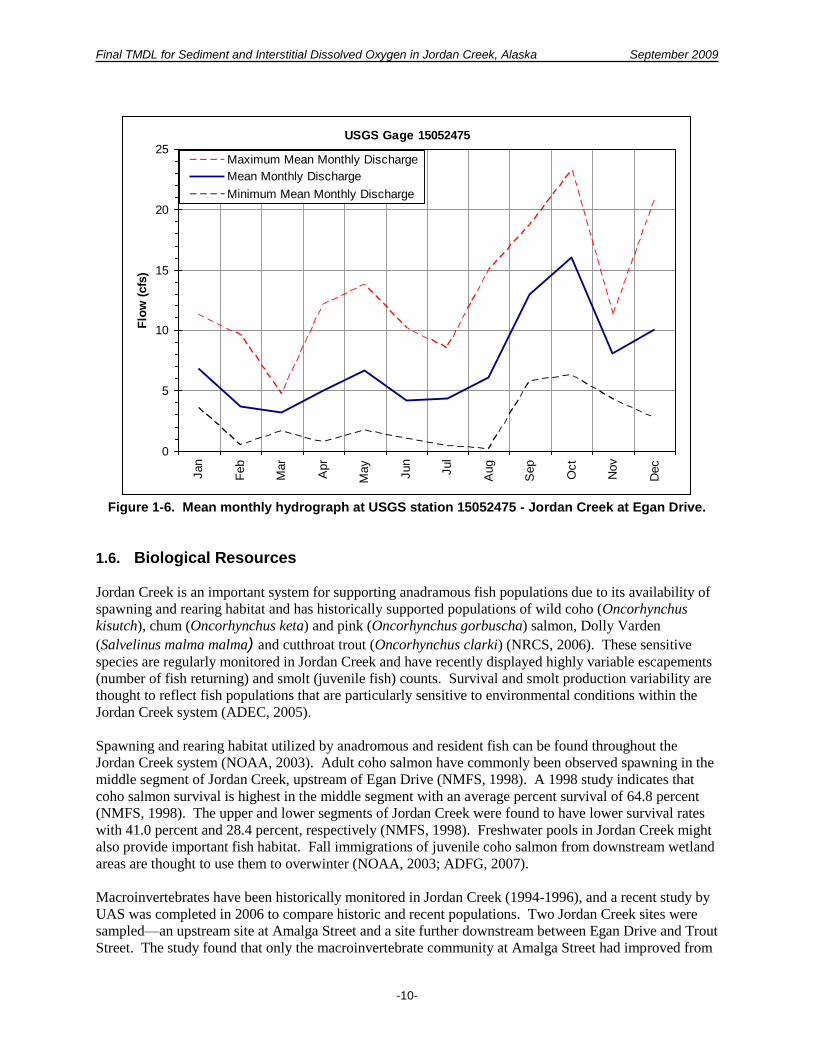
The one USGS gage station located on Jordan Creek (Gage # 15052475) has discharge data available
from May 1997 to September 2004. This gage was decommissioned in October of 2004. The mean,
maximum, and minimum mean monthly flows for Jordan Creek at Egan Drive (Gage # 15052475) are
provided in Figure 1-6. The lowest flow periods typically occur between mid-February and early April.
Flows increase as regional storms develop in the fall, bringing heavy precipitation to southeastern Alaska
(USGS, 2004).
Additional discharge information has been collected along Jordan Creek, as part of a USGS study (USGS,
2004) and also during a UAS study (Nagorski et al., 2006), both of which were investigating baseline
conditions in Jordan Creek. These flows are helpful for investigating discharge characteristics at different
sites along the mainstem, but insufficient data are available to produce additional hydrographs.
Final TMDL for Sediment and Interstitial Dissolved Oxygen in Jordan Creek, Alaska September 2009
-10-
USGS Gage 15052475
0
5
10
15
20
25
Jan
Feb
Mar
Apr
May
Jun
Jul
Aug
Sep
Oct
Nov
Dec
Flo
w (
cfs
)
Maximum Mean Monthly Discharge
Mean Monthly Discharge
Minimum Mean Monthly Discharge
Figure 1-6. Mean monthly hydrograph at USGS station 15052475 - Jordan Creek at Egan Drive.
1.6. Biological Resources
Jordan Creek is an important system for supporting anadramous fish populations due to its availability of
spawning and rearing habitat and has historically supported populations of wild coho (Oncorhynchus
kisutch), chum (Oncorhynchus keta) and pink (Oncorhynchus gorbuscha) salmon, Dolly Varden
(Salvelinus malma malma) and cutthroat trout (Oncorhynchus clarki) (NRCS, 2006). These sensitive
species are regularly monitored in Jordan Creek and have recently displayed highly variable escapements
(number of fish returning) and smolt (juvenile fish) counts. Survival and smolt production variability are
thought to reflect fish populations that are particularly sensitive to environmental conditions within the
Jordan Creek system (ADEC, 2005).
Spawning and rearing habitat utilized by anadromous and resident fish can be found throughout the
Jordan Creek system (NOAA, 2003). Adult coho salmon have commonly been observed spawning in the
middle segment of Jordan Creek, upstream of Egan Drive (NMFS, 1998). A 1998 study indicates that
coho salmon survival is highest in the middle segment with an average percent survival of 64.8 percent
(NMFS, 1998). The upper and lower segments of Jordan Creek were found to have lower survival rates
with 41.0 percent and 28.4 percent, respectively (NMFS, 1998). Freshwater pools in Jordan Creek might
also provide important fish habitat. Fall immigrations of juvenile coho salmon from downstream wetland
areas are thought to use them to overwinter (NOAA, 2003; ADFG, 2007).
Macroinvertebrates have been historically monitored in Jordan Creek (1994-1996), and a recent study by
UAS was completed in 2006 to compare historic and recent populations. Two Jordan Creek sites were
sampled—an upstream site at Amalga Street and a site further downstream between Egan Drive and Trout
Street. The study found that only the macroinvertebrate community at Amalga Street had improved from

Final TMDL for Sediment and Interstitial Dissolved Oxygen in Jordan Creek, Alaska September 2009
-11-
the original survey completed in 1995 with increased EPT (Ephemeroptera-Plecoptera-Trichoptera, or
mayflies-stoneflies-caddisflies) taxa diversity and a more balanced species composition (Nagorski et al.,
2006). Despite the improvement at that site, the EPT taxa richness was found to be much lower than
other unimpaired streams in the region, and most of the taxa found at this site are known to be tolerant of
excessive sediment loads. The downstream site near Egan Drive displayed a dramatic decline in
macroinvertebrate community health from 1995 to 2006. Taxa found in 1995 reflected a system with
fast-flowing riffle habitats, cobble and boulder substrates, low sediment loads, and generally good water
quality. The taxa collected in 2006 were indicative of poor water quality, high sediment loads, and
homogenized substrates (Nagorski et al., 2006).

Final TMDL for Sediment and Interstitial Dissolved Oxygen in Jordan Creek, Alaska September 2009
-12-
2. Water Quality Standards and TMDL Targets
Water quality standards designate the “uses” to be protected (e.g., water supply, recreation, aquatic life)
and the “criteria” for their protection (e.g., how much of a pollutant can be present in a waterbody without
impairing its designated uses). TMDLs are developed to meet applicable water quality standards, which
can be expressed as either numeric or narrative criteria needed to support designated beneficial uses. The
TMDL targets identify quantitative goals or endpoints, which equate to attainment of the water quality
standards. The TMDL target can be equivalent to a numeric water quality criterion where one exists, or it
can represent a quantitative interpretation of a narrative criterion.
This section reviews the applicable water quality standards and discusses the identification of appropriate
TMDL targets for calculation of the sediment TMDL to address sediment and DO impairments in Jordan
Creek.
2.1. Applicable Water Quality Standards
Title 18, Chapter 70 of the Alaska Administrative Code (ACC) establishes water quality standards for
waters of the state, which includes the designated uses to be protected and the water quality criteria
necessary to protect the uses. Designated uses established in the State of Alaska Water Quality Standards
(18 AAC 70) for fresh waters of the state include (A) water supply, (B) water recreation, and (C) growth
and propagation of fish, shellfish, other aquatic life, and wildlife, and are applicable to all fresh waters,
unless specifically exempted. The interstitial DO and sediment water quality standards for each use and
applicable to Jordan Creek are presented in Table 2-1.
Table 2-1. Alaska Water Quality Standards for Dissolved Gas and Sediment
Pollutant Water Use Criteria
(3) Dissolved Gas Fresh water uses
(C) Growth and Propagation of Fish, Shellfish, Other Aquatic Life, and Wildlife
In no case may DO be less than 5 mg/l to a depth of 20 cm in the interstitial waters of gravel used by anadromous or resident fish for spawning (see note 1 below). For waters not used by anadromous or resident fish, DO must be greater than or equal to 5 mg/l. In no case may DO be greater than 17 mg/l. The concentration of total dissolved gas may not exceed 110% of saturation at any point of sample collection.
(9) Sediment Fresh water uses
(A) Water Supply (i) drinking, culinary, food processing
No measurable increase in concentration of settleable solids above natural conditions, as measured by the volumetric Imhoff cone method.
(A) Water Supply (ii) agriculture, including irrigation and stock watering
For sprinkler irrigation, water must be free of particles of 0.074 mm or coarser. For irrigation or water spreading, may not exceed 200 mg/l for an extended period of time.
(A) Water Supply (iii) aquaculture
No imposed loads that will interfere with established water supply treatment levels.
(A) Water Supply (iv) industrial
Same as (9)(A)(iii).
(B) Water Recreation (i) contact recreation
Same as (9)(A)(i).
(B) Water Recreation (ii) secondary recreation
May pose hazards to incidental human contactor cause interference with the use.
(C) Growth and Propagation of Fish, Shellfish, Other Aquatic Life, and Wildlife
The percent accumulation of fine sediment in the range of 0.1 mm to 4.0 mm in the gravel bed of waters used by anadromous or resident fish for spawning may not be increased more than 5% by weight above natural conditions

Final TMDL for Sediment and Interstitial Dissolved Oxygen in Jordan Creek, Alaska September 2009
-13-
(as shown by grain size accumulation graph). In no case may the 0.1 mm to 4.0 mm fine sediment range in those gravel beds exceed a maximum of 30% by weight (as shown by grain size accumulation graph) (see notes 2 and 3 below). In all other surface waters no sediment loads (suspended or deposited) that can cause adverse effects on aquatic animal or plant life, their reproduction or habitat may be present.
1. Wherever criteria for DO are provided in this chapter, DO concentrations in interstitial waters of gravel beds will
be measured using the technique found in Variations in the Dissolved Oxygen Content of Intragravel Water in Four
Spawning Streams of Southeastern Alaska, by William J. McNeil, United States Department of the Interior, United
States Fish and Wildlife Service, Special Scientific Report - Fisheries No. 402, February 1962, adopted by reference.
2. Wherever criteria for fine sediments are provided in this chapter, fine sediments must be sampled by the method
described in An Improved Technique for Freeze Sampling Streambed Sediments, by William J. Walkotten, United
States Department of Agriculture, United States Forest Service, Forest Service Research Note PNW-281, October
1976, adopted by reference, or by the technique found in Success of Pink Salmon Spawning Relative to Size of
Spawning Bed Materials, by William J. McNeil and W.H. Ahnell, United States Department of the Interior, United
States Fish and Wildlife Service, Special Scientific Report - Fisheries No. 469, January 1964, pages 1 - 3, adopted
by reference.
3. Wherever criteria for fine sediments are provided in this chapter, percent accumulation of fine sediments will be
measured by the technique found in the Manual on Test Sieving Methods, Guidelines for Establishing Sieve Analysis
Procedures, by the American Society for Testing and Materials (ASTM), STP 447A, 1972 edition.
2.2. Designated Use Impacts
Data suggest that Jordan Creek may not support its designated uses for growth and propagation of fish,
shellfish, other aquatic life, and wildlife due to sediment input that results in exceedances of water quality
criteria for interstitial DO. Excess sediment embeds spawning gravels, creating a physical impediment to
fish reproduction and decreasing interstitial DO concentrations. Because newly emerged fry occupy the
interstitial spaces in optimal stream substrates, large inputs of sediment may also reduce stream carrying
capacity by reducing available refuge (Bjornn and Reiser, 1991).
Researchers in the United Kingdom (UK) studied oxygen availability within the salmonid incubation
environment (Greig, et.al., 2004). Parameters examined include interstitial DO concentration, interstitial
flow velocity, and oxygen flux. These indicators provide a measure of the quality of spawning and
incubation habitat. In particular, these studies looked at the effects of fine sediment on intergravel (or
hyporheic) oxygen flux and salmonid incubation success. Field data indicated that oxygen flux from
hyporheic flow is influenced by fine sediment accumulation that affects gravel permeability and,
subsequently, the rate of passage of oxygenated water through incubation areas. This research supports
the findings of Jordan Creek studies, which conclude that accumulation of fine sediment has a direct
effect on reducing interstitial DO concentrations.
Alaska’s water quality standards include criteria for fine sediment accumulation that are intended to
protect aquatic life uses, particularly salmonid spawning and rearing. The criteria state that:
“The percent accumulation of fine sediment in the range of 0.1 mm to 4.0 mm in the gravel bed of waters
used by anadromous or resident fish for spawning may not be increased more than 5% by weight above
natural conditions (shown by grain size accumulation graph). In no case may the 0.1 mm to 4.0 mm fine
sediment range in those gravel beds exceed a maximum of 30% by weight. In all other surface waters no
sediment loads (suspended or deposited) that can cause adverse effects on aquatic animal or plant life,
their reproduction or habitat may be present”.
Limited data collected in Jordan Creek indicate that the fine sediment accumulation criteria are not being
met. Figure 2-1 depicts particle size data collected in Jordan Creek in 2007 relative to the cumulative

Final TMDL for Sediment and Interstitial Dissolved Oxygen in Jordan Creek, Alaska September 2009
-14-
frequency criteria. The vertical line reflects the size threshold that defines fine sediment in Alaska’s
criteria (specifically 4mm), while the bold horizontal line indicates the maximum limit of 30 percent. As
shown in the figure, the maximum of 30 percent fine sediment by weight was exceeded at all three Jordan
Creek sites. The Jordan Creek sites are located within 500 feet downstream of the East Valley Reservoir
(EVR) tributary.
The high fine sediment accumulation in Jordan Creek observed at the sites shown in Figure 2-1 affects
gravel permeability. This in turn contributes to the inability of the stream to replenish interstitial DO.
Fine sediment accumulation data were not collected at other sites where interstitial DO was monitored.
However, qualitative observations of the streambed in most reaches studied in 2008 indicated the reaches
were dominated by sand and silt or by gravel that was highly embedded with sand (Hudson, 2008).
Based on the connection between fine sediment accumulation and oxygen flux, a TMDL target is
established for sediment to represent attainment of water quality criteria for both sediment and interstitial
DO.
0
10
20
30
40
50
60
70
80
90
100
0.01 0.10 1.00 10.00 100.00
Particle Size (mm)
Perc
en
t P
assin
g b
y W
eig
ht
Jordan Creek BAR
Jordan Creek BED 1
Jordan Creek BED 2
30% Target
4m
m u
pp
er
lim
it
Figure 2-1. Fine sediment accumulation at three sites in Jordan Creek based on 2007 sieve data.

Final TMDL for Sediment and Interstitial Dissolved Oxygen in Jordan Creek, Alaska September 2009
-15-
2.3. TMDL Targets
The TMDL target is a quantitative endpoint used to determine the loading capacity and necessary load
reductions and represents attainment of applicable water quality standards. The intent of this TMDL is to
ensure that the accumulation of fine sediment is not causing violations of Alaska’s water quality criteria
for DO or sediment. Accumulation of fine sediment occurs when the amount of fine sediment entering
Jordan Creek is greater than the amount leaving it (Figure 2-2). Therefore, to ensure that sediment is
transported out of Jordan Creek rather than settling out of the water column and accumulating in the
stream bed, the TMDL targets and loading capacity for sediment will be calculated based on the transport
capacity of the creek, rather than as a specific sediment concentration or static loading rate.
Figure 2-2. Relationship between sediment inputs, outputs, and siltation of interstitial gravels.

Final TMDL for Sediment and Interstitial Dissolved Oxygen in Jordan Creek, Alaska September 2009
-16-
3. Data Inventory and Analysis
Available water quality and watershed information was reviewed to gain a better understanding of the
conditions affecting impairments in Jordan Creek. This section summarizes the studies that have been
conducted in Jordan Creek and presents the sediment- and DO-related data collected for each. Data
include in-stream TSS and DO concentrations, interstitial DO concentrations, and bottom sediment
characteristics.
While Jordan Creek is relatively well studied for southeastern Alaska streams, the limited data represent
varying locations, frequency, water quality parameters, and time spans. Because of these issues, four
main sites have been selected for data analysis that represent the most consistently and thoroughly
sampled stations in Jordan Creek. Where sampling events occurred at overlapping stations, the data were
combined to produce one dataset for each of the four sample stations.
3.1. Previous Studies
There have been three key monitoring efforts to determine baseline characteristics in Jordan Creek.
These monitoring projects resulted in water quality data from 1997 to 2006 in the upper, middle, and
lower segments of Jordan Creek. Figure 3-1 displays the locations of all sample sites in Jordan Creek and
the subsections that follow detail each study. An additional study was also completed by UAS in 2007-
2008 to supplement the historic data for Jordan Creek. Table 3-1 summarizes all of the available
sediment-related surface water quality data for Jordan Creek and its tributaries.
3.1.1. USGS Baseline Study and Routine Monitoring
The USGS (in cooperation with the Juneau International Airport, CBJ, and ADEC) collected water
quality samples as part of a study to evaluate baseline conditions in Jordan Creek (USGS, 2004). The
goal of the study was to document the water quality, streamflow, and physical habitat characteristics in
Jordan Creek because of its importance to anadromous fish populations. Water quality parameters
sampled included field parameters (discharge, stream width, temperature, and conductivity), DO, major
ions, dissolved solids, nutrients, trace elements, and suspended sediment concentration.
The USGS report was completed in 2004, with a majority of the water quality samples collected in 1997-
1999. Six stations were sampled on the Jordan Creek mainstem and several small tributaries for this
study (Table 3-2 and Figure 3-1). Water quality sampling focused on major ions and dissolved nutrient
concentrations.
In addition to the 2004 study, USGS has also sampled three other sites in the Jordan Creek watershed
over the years, as shown in Figure 3-1 and Table 3-2. The parameters, number of samples analyzed, and
data availability varies by station. Water quality data were not available for the 15052425 (Jordan Creek
Trib at Thunder Mt Trailer Park near Auke Bay) and 15052484 (Jordan Creek at Juneau Airport near
Auke Bay) sites and are limited for the 15052435 tributary site at Valley Street.

Final TMDL for Sediment and Interstitial Dissolved Oxygen in Jordan Creek, Alaska September 2009
-17-
Table 3-1. Summary of Available Surface Water Quality Data for Jordan Creek
Station Start Date End Date Number of TSS Samples*
USGS Baseline Study and Routine Monitoring, 1997-2002
15052430 9/1/98 8/4/99 0
15052435 5/2/99 8/4/99 0
15052450 7/14/97 12/28/99 8
15052465 5/2/99 8/4/99 0
15052475 7/14/97 9/23/05 5
15052480 5/2/99 8/5/99 1
15052483 5/2/99 6/17/02 0
UAS Mendenhall Watershed Study, 2003-2004
JC-1 12/23/03 6/12/04 13
JC-2 12/23/03 6/12/04 13
JC-3 12/23/03 6/12/04 13
JC-4 1/15/04 6/12/04 11
UAS Jordan Creek Watershed Study, 2005-2006
JC-A 8/2/05 6/30/06 18
JC-B 8/2/05 6/30/06 19
JC-C 8/2/05 6/30/06 16
UAS Jordan Creek Watershed Supplemental Study, 2008
JC-A 11/13/07 6/8/08 25
JC-B 11/13/07 6/8/08 26
JC-C 11/13/07 6/8/08 25
*For USGS sampling sites, the number of samples displayed in this column represents the number of suspended
sediment concentrations collected at each site.

Final TMDL for Sediment and Interstitial Dissolved Oxygen in Jordan Creek, Alaska September 2009
-18-
Figure 3-1. All water quality sample stations in the Jordan Creek watershed.

Final TMDL for Sediment and Interstitial Dissolved Oxygen in Jordan Creek, Alaska September 2009
-19-
Table 3-2. USGS Water Quality Sampling Stations
Site
USGS Station Number Station Name
Drainage Area (square miles)
Miles Upstream from Mouth
Jordan Creek Segment
1 15052425 Jordan Creek Trib at Thunder Mt Trailer Park near Auke Bay
-- -- Upper
2* 15052430 Jordan Creek below Thunder Mt Trailer Park near Auke Bay
0.8 3.4 Upper
3 15052435 Jordan Creek Trib at Valley Street near Auke Bay
-- -- Upper
4* 15052450 Jordan Creek at Amalga Street near Auke Bay
1.1 3.1 Upper
5* 15052465 Jordan Creek at Nancy Street near Auke Bay
2.3 2.0 Middle
6* 15052475 Jordan Creek below Egan Drive near Auke Bay
2.6 1.5 Middle
7* 15052480 Jordan Creek near Auke Bay 2.7 0.9 Lower
8* 15052483 Jordan Creek above Yandukin Avenue near Auke Bay
-- 0.5 Lower
9 15052484 Jordan Creek at Juneau Airport near Auke Bay
3.0 0.4 Lower
*Indicates that this USGS sample site was a part of the 2004 baseline conditions study.
3.1.2. UAS Mendenhall Watershed Study
The UAS conducted a study through an Alaska Clean Water Actions (ACWA) grant (AWCA 05-010) to
evaluate the effects of ongoing development in the Mendenhall Watershed, focusing on Duck Creek and
Jordan Creek (Hood et al., 2005). Water quality samples were obtained at four sites on Jordan Creek
every two weeks from December 2003 to June 2004 (Table 3-3 and Figure 3-1). Water quality
parameters sampled include field parameters (temperature, conductivity, pH and DO) as well as turbidity
and TSS. Three of the 2003-2004 UAS sites correspond with previously sampled USGS sites.
Table 3-3. UAS 2003-2004 Water Quality Sampling Stations
UAS Sample Site ID
Corresponding USGS Station Number Station Name
Jordan Creek Segment
JC-1 15052450 Jordan Creek at Amalga Street Upper
JC-2 N/A Jordan Creek at Jennifer Drive Upper
JC-3 15052475 Jordan Creek at Egan Drive Middle
JC-4 15052483 Jordan Creek at Airport, upstream fish weir Lower
3.1.3. UAS Jordan Creek Watershed Study
As part of an AWCA grant, UAS performed water quality sampling at three sites on Jordan Creek every
two weeks from August 2005 to June 2006, as shown in Table 3-4 and Figure 3-1 (Nagorski et al., 2006).
Water quality parameters sampled include field parameters (temperature, conductivity, pH and DO),
turbidity, TSS, cations, anions, and interstitial DO. Bioassessments were also conducted in May 2006 to
determine the changes in macroinvertebrate communities from historic (1995) sampling events. The

Final TMDL for Sediment and Interstitial Dissolved Oxygen in Jordan Creek, Alaska September 2009
-20-
overall goal of the sampling project was to further characterize Jordan Creek’s water quality and
macroinvertebrate community conditions and to compare the results to historic data. All three of the
2005-2006 UAS sites correspond to USGS sites that were sampled previously, as well as three of the
2003-2004 UAS sample sites.
Table 3-4. UAS 2005-2006 Water Quality Sampling Stations
UAS Sample Site
ID
Corresponding USGS Station
Number Station Name
Drainage Area (square
miles)
Miles upstream
from Mouth Jordan Creek
Segment
JC-A 15052450 Jordan Creek at Amalga Street 1.1 3.1 Upper
JC-B 15052475 Jordan Creek below Egan Drive, Near Super 8 Motel
2.6 1.5 Middle
JC-C 15052483 Jordan Creek at the Yandukin Footbridge
-- 0.5 Lower
3.1.4. UAS Jordan Creek Watershed Supplemental Study
Additional TSS and turbidity data were collected by UAS in 2007/2008 at three sites along Jordan Creek
as part of an ADEC ACWA grant (Nagorski, 2008). To add to existing data and to maintain consistent
sampling stations, three previously sites (JC-A, JC-B, and JC-C) were sampled from November 2007 to
June 2008. The JC-A site is upstream, closest to the headwaters of Jordan Creek on the western flank of
Thunder Mountain, at the bridge crossing at Amalga Drive. JC-B is located immediately downstream of
the Egan Drive crossing, near the site of the USGS stream gage (also near the Super 8 motel). JC-C is
located at the edge of the Juneau International Airport property, just upstream of the Alaska Department
of Fish and Game fish weir.
3.2. Data Analysis
Sample site locations were confirmed for each study listed above and common sampling sites were noted
between studies. All of the data sources with overlapping stations and sufficient data were combined to
generate a final data set. The four resulting mainstem Jordan Creek sites are discussed below. These sites
correspond to the most recent sampling completed by UAS in 2005-2006 and 2007-2008, plus one
additional site at Jennifer Drive that was only sampled in 2003-2004. The station names from the 2005-
2006 sampling by UAS will be used for the three corresponding sites for consistency, and the additional
Jennifer Drive site will be named JC-D. Table 3-5 summaries the following stations with combined
datasets:
JC-A: Jordan Creek at Amalga Street
JC-B: Jordan Creek downstream of Egan Drive
JC-C: Jordan Creek above Yandukin Avenue
JC-D: Jordan Creek at Jennifer Drive
Figure 3-2 displays the location of these four sample stations and Table 3-5 summarizes the location and
period of record for each.

Final TMDL for Sediment and Interstitial Dissolved Oxygen in Jordan Creek, Alaska September 2009
-21-
Table 3-5. Stations Representing Combined Datasets for Jordan Creek
Combined Site Corresponding UAS Sites Corresponding USGS Sites
Period of Record for Combined Dataset
JC-A JC-1 and JC-A 15052450 7/14/1997 – 6/8/2008
JC-B JC-3 and JC-B 15052475 7/14/1997 – 6/8/2008
JC-C JC-4 and JC-C 15052483 5/2/1999 – 6/8/2008
JC-D JC-2 N/A 12/23/2003 – 6/12/2004

Final TMDL for Sediment and Interstitial Dissolved Oxygen in Jordan Creek, Alaska September 2009
-22-
Figure 3-2. Jordan Creek sample stations representing combined datasets.

Final TMDL for Sediment and Interstitial Dissolved Oxygen in Jordan Creek, Alaska September 2009
-23-
3.2.1. Total Suspended Solids
A total of 176 TSS concentrations were collected at the four mainstem sample stations. Figure 3-3
displays all TSS concentrations collected in Jordan Creek and Table 3-6 provides a summary of the
available TSS data.
Table 3-6. Summary of TSS Concentrations in Jordan Creek
Site Location Number of Samples
TSS Concentration (mg/L)
Maximum Minimum Average
JC-A At Amalga St. 54 11.0 0.0 1.5
JC-D At Jennifer Dr. 13 7.9 0.2 2.0
JC-B At Egan Dr. 57 11.5 0.0 2.2
JC-C At Yandukin Dr. 52 45.0 0.1 3.5
All Sites Combined 176 45.0 0.0 2.4
0.01
0.1
1
10
100
Jul-03
Nov-0
3
Mar-
04
Jul-04
Nov-0
4
Mar-
05
Jul-05
Nov-0
5
Mar-
06
Jul-06
Nov-0
6
Mar-
07
Jul-07
Nov-0
7
Mar-
08
Jul-08
Nov-0
8
Sample Date
To
tal
Su
sp
en
ded
So
lid
s (
mg
/l)
JC-AJC-BJC-CJC-D
Figure 3-3. All available TSS concentrations collected at the Jordan Creek combined data sites.
TSS concentrations range from 0.0 mg/l to a maximum of 45.0 mg/l in Jordan Creek. The overall average
for all sites is 2.4 mg/l. The maximum TSS concentration of 45.0 mg/l was obtained at the Yandukin
Drive site in mid-November 2007, likely coinciding with the increase in precipitation that is typical of
late fall (USGS, 2004; Nagorski et al., 2006). All sites appear to display similar ranges and average TSS
values, though the Yandukin Drive site appears to have slightly higher values than the other sites. The
dataset available for Jordan Creek appears to be limited to only lower flow periods that may not represent
the full range of actual TSS conditions.

Final TMDL for Sediment and Interstitial Dissolved Oxygen in Jordan Creek, Alaska September 2009
-24-
While it would be helpful to investigate the relationship between flow and TSS data, the available flow
data for Jordan Creek does not cover all sampling events because the USGS gage was decommissioned in
October of 2004. However, there are 27 TSS samples that were collected while the gage was collecting
average daily flows at the JC-B site. The concentrations and matching available flows at Egan Drive are
displayed below in Figure 3-4.
This figure shows a weak correlation between the daily average flows and TSS concentrations, likely
because the sampling was mostly completed during relatively low flow events. Peak flow values range
from 46 to 149 cfs at the USGS gage on Jordan Creek and the maximum flow value matching the TSS
data is 35 cfs. As previously mentioned, sampling during these high flow events is limited and the
available TSS data likely do not represent the full range of TSS concentrations that occur in Jordan Creek.
Figure 3-5 displays the TSS concentrations that were collected while the USGS flow gage was still in
operation at Egan Drive. The TSS samples were all collected during the 2003-2004 UAS sampling event.
TSS concentrations of over 1 mg/l appear to occur during increased flow at this station.
TSS vs. Flow at Egan Drive
y = 1.9571x + 5.3242
R2 = 0.2563
0
5
10
15
20
25
30
35
40
0 2 4 6 8 10 12
TSS (mg/l)
Flo
w (
cfs
)
Figure 3-4. TSS concentrations vs. flow at the Egan Drive sampling station (JC-B).

Final TMDL for Sediment and Interstitial Dissolved Oxygen in Jordan Creek, Alaska September 2009
-25-
TSS vs. Flow at Egan Drive
USGS Station 15052475
0
5
10
15
20
25
30
35
40
Dec-03 Jan-04 Feb-04 Mar-04 Apr-04 May-04 Jun-04
Flo
w (
cfs
)
0
1
2
3
4
5
6
7
8
9
10
TS
S (
mg
/l)
Flow
TSS
Figure 3-5. TSS samples and continuous flows at Egan Drive.
3.2.2. Interstitial Dissolved Oxygen Samples
Interstitial DO readings were collected at 10 evenly spaced stand pipes above site JC-A in the upper
segment of Jordan Creek. The 10 stand pipes were evenly spaced across a 1 km reach of Jordan Creek
and were sampled nine times each from 5/15/2006 to 7/8/2006 (Nagorski et al., 2006). On each sampling
date, surface water DO readings were also collected. Interstitial and surface water DO data are presented
in Table 3-7, with concentrations measured below the water quality criterion of 5 mg/l provided in bold
text.
Table 3-7. Summary of Available Interstitial DO Data for Jordan Creek
Stand Pipe # Date Samples Obtained- All Values in mg/l
5/15/06 5/20/06 5/30/06 6/6/06 6/13/06 6/21/06 6/24/06 6/27/06 7/8/06
1 7.3 7.1 6.2 6.1 6.4 6.5 6.1 6.1 7.2
2 6.4 6.4 6.2 6.4 6.6 6.1 6.8 6.7 6.5
3 5.6 6.1 6.1 5.7 5.9 6.2 5.8 5.6 5.8
4 4.2 9.8 4.0 4.4 4.9 5.8 5.7 5.7 5.5
5 1.7 1.6 2.4 4.2 5.0 5.8 5.8 6.4 5.7
6 8.9 9.8 10.2 6.6 9.1 9.6 9.5 9.1 9.1
7 6.6 8.9 7.4 7.1 7.6 7.1 6.4 6.1 5.3
8 8.1 8.2 8.8 8.4 8.7 7.9 N/A 7.7 6.7
9 5.8 6.5 7.2 6.9 6.7 7.1 6.9 6.7 6.9
10 5.9 7.0 7.5 7.4 7.3 6.8 6.8 6.4 5.8
Surface Water Reading 10.0 9.7 10.4 9.8 9.4 9.6 8.8 9.1 9.1

Final TMDL for Sediment and Interstitial Dissolved Oxygen in Jordan Creek, Alaska September 2009
-26-
Figure 3-6 displays the interstitial DO concentrations collected at the 10 standpipes as well as the surface
water DO concentrations collected adjacent to the standpipes. Most of the interstitial DO samples meet or
exceed the water quality criterion of 5 mg/l. However, four of the nine samples collected in pipe 5 and
four of the nine collected in pipe 4 display DO concentrations below the 5 mg/l criterion. These
exceedances appear to be limited to the mid-May to mid-June sampling events and are unique to these
two stand pipe locations. The lowest concentration collected at the other eight stand pipes is 5.6 mg/l and
all other DO concentrations are well above the water quality criterion.
0
2
4
6
8
10
12
5/9
/06
5/1
6/0
6
5/2
3/0
6
5/3
0/0
6
6/6
/06
6/1
3/0
6
6/2
0/0
6
6/2
7/0
6
7/4
/06
Sample Date
Inte
rsti
tia
l D
O (
mg
/L)
Pipe 1
Pipe 2
Pipe 3
Pipe 4
Pipe 5
Pipe 6
Pipe 7
Pipe 8
Pipe 9
Pipe 10
Surface Water
WQC
Figure 3-6. Available interstitial DO concentrations and applicable water quality criterion.
To supplement the existing sediment and interstitial DO data, ADEC collected additional samples after
the initial data analyses were performed (Hudson 2008). Interstitial DO concentrations were obtained at
six sites along Jordan Creek on July 16-17, 2008 (Table 3-8). Flow conditions during the study were
noted as “moderate.” Interstitial DO was measured in PVC pipes that were installed vertically in the
streambed. Three pipes spaced 2-10 m apart were installed at each site in the main channel of Jordan
Creek. To further understand the interactions between the surface and groundwater, the vertical hydraulic
gradient (e.g., downwelling, upwelling) was assessed in each sampling pipe.
Table 3-8 displays the interstitial data for the supplemental Jordan Creek study. DO values (mg/L) in
bold note the 7 of 18 samples that are below the Alaska water quality standard of 5 mg/L for interstitial
DO. “NA” indicates an absence of interstitial water in the sampling pipe.

Final TMDL for Sediment and Interstitial Dissolved Oxygen in Jordan Creek, Alaska September 2009
-27-
Table 3-8. Interstitial DO Results for the 2008 Jordan Creek Study
Site Date DO (mg/L) DO (% satur.) Surface-Groundwater Interaction
Valley Blvd.
column
7/16/08
8.6 70.3
pipe 1 a 5.0 40.2 upwelling
pipe 2 5.0 39.5 upwelling
pipe 3 3.8 29.6 neutral
Amalga St.
column
7/17/08
10.0 80.5
pipe 1 0.3 2.4 neutral
pipe 2 0.1 1.0 upwelling
pipe 3 b 7.2 58.0 neutral
Jennifer Dr.
column
7/16/08
9.4 76.6
pipe 1 c 4.3 38.0 not determined
pipe 2 2.6 21.5 not determined
pipe 3 a 9.6 78.3 not determined
Nancy St.
column
7/16/08
11.4 94.5
pipe 1 c 0.2 1.8 neutral
pipe 2 a 0.1 1.1 neutral
pipe 3 NA NA pipe dry
Egan Dr.
column
7/17/08
10.8 90.4
pipe 1 b 10.8 91.2 downwelling
pipe 2 NA NA pipe dry
pipe 3 NA NA pipe dry
Teal St.
column
7/17/08
11.5 96.5
pipe 1 b 11.6 97.5 downwelling
pipe 2 a 11.5 96.8 downwelling
pipe 3 11.3 95.7 downwelling a pipe sampled for invertebrates b pipe installed in a gravel mound at the tail-out of a scour pool c pipe installed on an exposed gravel bar
3.2.3. Sediment Substrate
A detailed sediment analysis was recently completed to determine the impacts of the EVR tributary on
Jordan Creek (Inter-Fluve, 2008). Erosion associated with the CBJ water tower construction has resulted
in this tributary becoming a major source of sediment loading for Jordan Creek. This study collected
several sediment samples from gravel bars and the streambed in Jordan Creek (just downstream of the JC-

Final TMDL for Sediment and Interstitial Dissolved Oxygen in Jordan Creek, Alaska September 2009
-28-
D sample site at Jennifer Drive, adjacent to Rainbow Row) and the EVR tributary. The dataset includes
weight retained and percent of sample passing through a variety of sieve sizes (from 1 inch to 0.075 mm),
allowing for comparison to the following ADEC water quality criterion:
“In no case may the 0.1 mm to 4.0 mm fine sediment range in those gravel beds exceed a
maximum of 30% by weight (as shown by grain size accumulation graph).”
A grain size accumulation graph for three Jordan Creek samples (one at a gravel bar and two in the
streambed) and two EVR tributary samples (one bed sample and one bar sample) is provided in Figure
3-7.
0
10
20
30
40
50
60
70
80
90
100
0.01 0.10 1.00 10.00 100.00
Particle Size (mm)
Perc
en
t P
assin
g b
y W
eig
ht
Jordan Creek BAR
Jordan Creek BED 1
Jordan Creek BED 2
EVR Tributary BED
EVR Tributary BAR
WQ Criterion Range
Figure 3-7. Grain size accumulation for 2007 sieve samples.
This figure shows that the percent accumulation of 0.1 to 4 mm particle sizes in Jordan Creek streambed
and gravel bar samples. All but one are well above the water quality criterion of 30 percent by weight.
The three Jordan Creek samples range from about 77 to 80 percent by weight, displaying the limited
ability of Jordan Creek to transport heavy sediment loads downstream of the tributary (ADEC, 2006;
NOAA, 2003). On the other hand, the samples for EVR tributary show an accumulation range of about
30 to 43 percent by weight. The higher gradient tributary appears to have a greater ability to transport the
heavy sediment load than the mainstem of Jordan Creek.
The EVR study (Inter-Fluve, 2008) indicates that a plume of sediment downstream of the EVR tributary
has formed in Jordan Creek that spans over 600 feet of the mainstem. This extreme sediment deposition
has caused the stream bed of Jordan Creek to be raised by 2 to 2.5 feet downstream of the tributary (Inter-
Fluve, 2008). There are no TSS data corresponding to the times and locations of the sieve sampling,
prohibiting the evaluation of any relationships between the two parameters.

Final TMDL for Sediment and Interstitial Dissolved Oxygen in Jordan Creek, Alaska September 2009
-29-
3.3. Impairment Conditions
An important aspect in development of a framework to address problems associated with sediment is to
understand the timing of delivery and transport mechanisms. Duration curve analysis provides a
hydrology-based context for examining and interpreting water quality data, allowing consideration of the
full range of flows.
Flow duration curves enable consideration of the inherent variability associated with stream hydrology
and its effect on water quality. Duration curves describe the percentage of time during which specified
flows are equaled or exceeded (Leopold, 1994). Flow duration analysis looks at the cumulative frequency
of historic flow data over a specified period. Duration analysis results in a curve that relates flow values
to the percent of time those values have been met or exceeded. Low flows are exceeded a majority of the
time, whereas floods are exceeded infrequently.
Duration curves provide the benefit of considering the full range of flow conditions. Development of a
flow duration curve is based on daily average stream discharge data. A typical curve runs from high
flows to low flows along the x-axis, as illustrated in Figure 3-8 for Jordan Creek. As an example, the
highlighted flow duration interval of 60 percent is associated with a stream discharge of 3.5 cfs, meaning
that 60 percent of all observed stream discharge values equal or exceed 3.5 cfs.
Figure 3-8. Flow duration curve for Jordan Creek.
Flow duration curve intervals can be grouped into several broad categories or zones. These zones provide
additional insight about conditions and patterns associated with the impairment. A common way to look
at the duration curve is by dividing it into five zones, as illustrated in Figure 3-8: one representing high
flows (0-10%), another for moist conditions (10-40%), one covering mid-range flows (40-60%), another
for dry conditions (60-90%), and one representing low flows (90-100%). This particular approach places
the midpoints of the moist, mid-range, and dry zones at the 25th, 50th, and 75th percentiles respectively

Final TMDL for Sediment and Interstitial Dissolved Oxygen in Jordan Creek, Alaska September 2009
-30-
(i.e., the quartiles). The high zone is centered at the 5th percentile, while the low zone is centered at the
95th percentile.
Duration curves offer a technique for presenting water quality data, which characterizes concerns and
describes patterns associated with impairments. Ambient monitoring data, taken with some measure or
estimate of flow at the time of sampling, can be used to develop water quality duration curves. Using the
relative percent exceedance from the flow duration curve that corresponds to the stream discharge at the
time the sample was taken, the water quality value can be plotted in a duration curve format. By
displaying ambient water quality data and the daily average flow on the date of the sample (expressed as a
flow duration curve interval), a pattern develops.
A water quality duration curve analysis (Figure 3-9) was developed using Jordan Creek data collected by
the USGS and UAS. The intent of this analysis is to look at patterns between flow conditions and
indicators of in-stream sediment. Because of limited data collected across all flow conditions, both
suspended sediment concentration (SSC) and total suspended solids (TSS) are utilized. Specifically, TSS
data were not collected during the very high flow events (i.e., those flows that occur less than two percent
of the time). It is during these very high events that there is sufficient energy in Jordan Creek to mobilize
and transport accumulated sediment. Because the USGS collected SSC data during these very high flow
events, the information was merged with TSS concentrations to provide a more complete picture of
sediment across the range of flows.
As indicated in Figure 3-9, in-stream sediment concentrations increase significantly in the high flow zone
(i.e., the upper 10 percent of all daily average flows, particularly in the upper 2 percent). Another
interesting observation is the slightly elevated concentrations under dry conditions in the winter months.
One possible explanation is the potential for TSS contributions from snow piles placed close to Jordan
Creek. Under above freezing conditions, the melt from snow storage near the stream could add TSS
without increasing Jordan Creek flows significantly.
SSC and TSS data included in Figure 3-9 were converted to observed daily loads (pounds/day) using
daily flows measured on the corresponding sample date. These loads are presented in Figure 3-10 to
evaluate observed loading under different flow conditions. When looking at the water quality monitoring
data in terms of loads, the in-stream sediment increase is even more dramatic in the high flow zone
(Figure 3-10). This provides a clear indication that sediment delivery and transport mechanisms exert the
greatest effect on Jordan Creek under high flow conditions.

Final TMDL for Sediment and Interstitial Dissolved Oxygen in Jordan Creek, Alaska September 2009
-31-
Figure 3-9. Water quality duration curve analysis for Jordan Creek.
Figure 3-10. Load duration curve analysis for Jordan Creek.
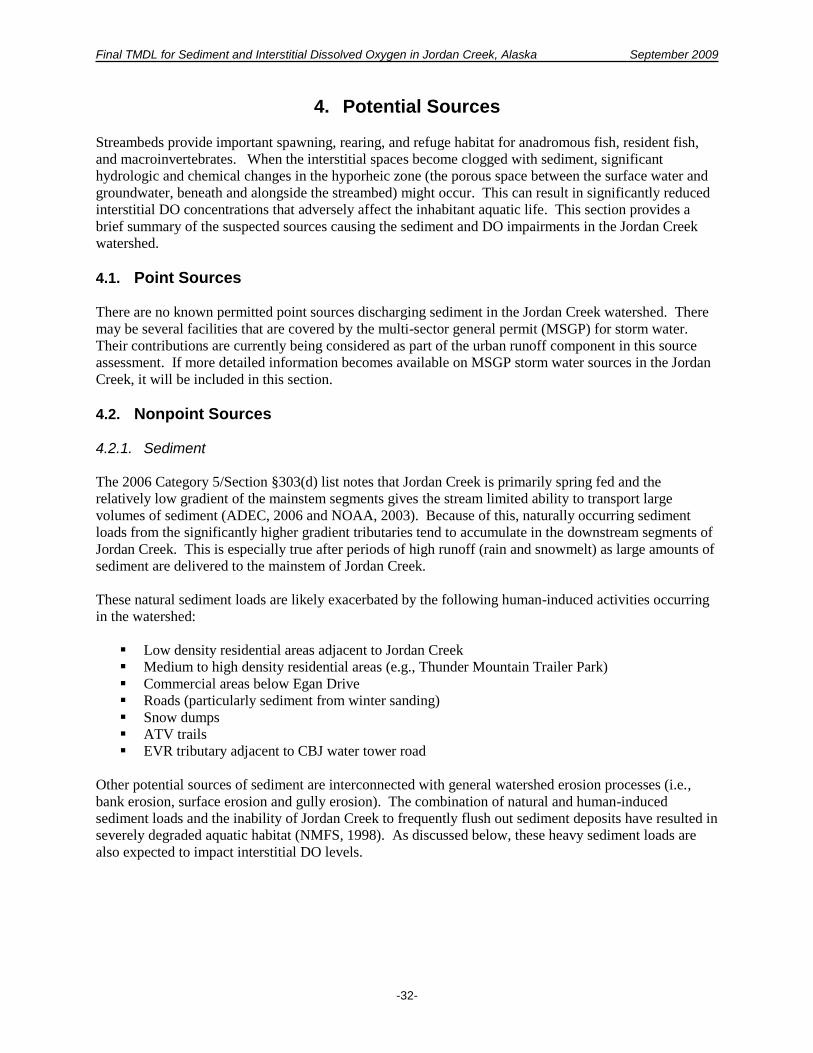
Final TMDL for Sediment and Interstitial Dissolved Oxygen in Jordan Creek, Alaska September 2009
-32-
4. Potential Sources
Streambeds provide important spawning, rearing, and refuge habitat for anadromous fish, resident fish,
and macroinvertebrates. When the interstitial spaces become clogged with sediment, significant
hydrologic and chemical changes in the hyporheic zone (the porous space between the surface water and
groundwater, beneath and alongside the streambed) might occur. This can result in significantly reduced
interstitial DO concentrations that adversely affect the inhabitant aquatic life. This section provides a
brief summary of the suspected sources causing the sediment and DO impairments in the Jordan Creek
watershed.
4.1. Point Sources
There are no known permitted point sources discharging sediment in the Jordan Creek watershed. There
may be several facilities that are covered by the multi-sector general permit (MSGP) for storm water.
Their contributions are currently being considered as part of the urban runoff component in this source
assessment. If more detailed information becomes available on MSGP storm water sources in the Jordan
Creek, it will be included in this section.
4.2. Nonpoint Sources
4.2.1. Sediment
The 2006 Category 5/Section §303(d) list notes that Jordan Creek is primarily spring fed and the
relatively low gradient of the mainstem segments gives the stream limited ability to transport large
volumes of sediment (ADEC, 2006 and NOAA, 2003). Because of this, naturally occurring sediment
loads from the significantly higher gradient tributaries tend to accumulate in the downstream segments of
Jordan Creek. This is especially true after periods of high runoff (rain and snowmelt) as large amounts of
sediment are delivered to the mainstem of Jordan Creek.
These natural sediment loads are likely exacerbated by the following human-induced activities occurring
in the watershed:
Low density residential areas adjacent to Jordan Creek
Medium to high density residential areas (e.g., Thunder Mountain Trailer Park)
Commercial areas below Egan Drive
Roads (particularly sediment from winter sanding)
Snow dumps
ATV trails
EVR tributary adjacent to CBJ water tower road
Other potential sources of sediment are interconnected with general watershed erosion processes (i.e.,
bank erosion, surface erosion and gully erosion). The combination of natural and human-induced
sediment loads and the inability of Jordan Creek to frequently flush out sediment deposits have resulted in
severely degraded aquatic habitat (NMFS, 1998). As discussed below, these heavy sediment loads are
also expected to impact interstitial DO levels.

Final TMDL for Sediment and Interstitial Dissolved Oxygen in Jordan Creek, Alaska September 2009
-33-
4.2.2. Dissolved Oxygen
The DO impairments displayed in the 2006 Category 5/Section §303(d) list are the result of low
interstitial DO readings in violation of water quality standards (ADEC, 2006). As a result, the
impairments to be addressed by this TMDL are focused on interstitial DO concentrations, not water
column DO concentrations. The interstitial DO concentrations below water quality standards in Jordan
Creek are thought to be caused by excess sediment loading, low water velocity, groundwater inputs that
are low in oxygen, and an oxygen-demanding iron flocculate seen in portions of the creek (Savell, 2006;
Freeman, March 2008).
Iron flocculate is produced by an oxygen demanding reaction that occurs when water rich with dissolved
iron is exposed to oxygen. The resulting rust-colored precipitate can blanket streambeds and adversely
impact aquatic life. The most significant human-caused iron flocculate issues appear to be limited to a
small tributary in the upper reaches of Jordan Creek downstream of the old MPM gravel pit discharge
(CBJ, 2002). Dissolved iron might also be entering Jordan Creek in areas of anoxic groundwater
upwelling as seen in the neighboring Duck Creek watershed (ADEC, 2001). However, the minimal
sampling and qualitative data that are available for iron flocculate in Jordan Creek indicate that these
issues are confined to small areas of the watershed.
Sedimentation issues are widespread and well documented in Jordan Creek (NMFS, 1998; Inter-Fluve,
2008; NRCS, 2006). It is suspected that sedimentation might be a main limiting factor for interstitial DO
concentrations in Jordan Creek (NRCS, 2006). Excessive sediment loads that settle out of suspension
smother streambeds and clog the interstitial spaces of streambeds (NMFS, 1998; NRCS, 2006). This
reduces intragravel flow in the hyporheic zone- where shallow groundwater and surface water typically
mix and percolate slowly through the interstitial spaces. When the surface to groundwater exchange is
limited, the infiltration of higher DO concentration surface water is minimized resulting in lowered DO
concentrations in the interstitial spaces (ADEC, 1995; Quinn, 2005; NRCS, 2006; Grieg et al., 2007).
While there are no sample stations at which both interstitial DO concentrations and sediment samples
were obtained, the example below details some of the most severe sediment issues in Jordan Creek as
well as several of the stream’s natural features. These descriptions are provided to help illustrate Jordan
Creek’s sensitivity to excessive sediment loads, as well as the likely influence on interstitial DO
concentrations.
The interstitial DO data obtained near Amalga Street (Figure 3-6) indicate that eight sample
concentrations were below the 5 mg/l criterion (Nagorski et al., 2006). Downstream from this site,
adjacent to Jennifer Drive and Rainbow Row, sediment samples were collected from two streambed
locations as part of a hydrologic and geomorphic analysis of Jordan Creek (Inter-Fluve, 2008). The
ADEC water quality criterion for sediment states that “In no case may the 0.1 mm to 4.0 mm fine sediment
range in those [waters used by anadromous or resident fish for spawning] gravel beds exceed a maximum
of 30% by weight.” Results from the two streambed samples showed that about 82 percent of the total
sample weight was within the fine sediment range, which is well above the criterion maximum. The
report also states that the segment of Jordan Creek downstream of the EVR has been inundated with a 640
foot-long plume of sediment that has raised portions of the stream bed 2 to 2.5 feet (Inter-Fluve, 2008).
The combination of high gradient tributaries draining the steep slopes of Thunder Mountain, a
significantly lower gradient mainstem, periods of low (or in some cases no) flows, and the shallow,
unstable soils of the watershed further compound the sediment issues in Jordan Creek (NRCS, 2006).
These features result in a system that is limited in its natural ability to transport sediment and that is
highly sensitive to sediment inputs (Inter-Fluve, 2008; Nagorski et al., 2006; NRCS, 2006; NOAA, 2003).
This stagnant sediment load is clogging interstitial spaces and likely blocking surface to ground water
exchanges and affecting interstitial DO concentrations.

Final TMDL for Sediment and Interstitial Dissolved Oxygen in Jordan Creek, Alaska September 2009
-34-
4.3. Load Estimates for Potential Sources of Sediment to Jordan Creek
Because the highest concentrations and loads occur under high flow conditions, storm water clearly plays
a major role as a delivery mechanism for fine sediment to Jordan Creek. Most of the sediment supply that
enters streams is generated by erosion processes including:
Bank erosion
Surface erosion (including accumulated sediment from impervious surfaces)
Gully erosion
Bank erosion is driven by channel stability, discharge volumes, tributary sediment loads from alluvial
fans, and stream velocities. Surface and gully erosion result from excess water runoff. Because erosion
and hydrology are connected, the timing of delivery and transport mechanisms is an extremely important
consideration. The following sections provide information on potential source areas and their relationship
to each of the major erosion processes that affect Jordan Creek.
Data to determine exact sediment source loads to Jordan Creek is extremely limited. However, available
information can be used to provide estimates of the relative contributions from major source categories.
These include:
Low density residential areas adjacent to Jordan Creek
Medium to high density residential areas (e.g., Thunder Mountain Trailer Park)
Commercial areas below Egan Drive
Roads (particularly sediment from winter sanding)
Snow dumps
ATV trails
EVR tributary adjacent to CBJ water tower road
Other potential sources of sediment are interconnected with general watershed erosion processes (i.e.,
bank erosion, surface erosion and gully erosion).
4.3.1. Urban Runoff
A logical starting point is to look at source categories associated with urban runoff. Included in this
estimate are residential and commercial areas. The Simple Method is an approach to develop load
estimates based on local climate and land use information. The Simple Method was developed by the
Center for Watershed Protection (CWP) as a tool for rapid assessment of watershed treatment options
needed to address stormwater-related problems (Schueler, 1987). The technique requires little
information, which includes annual precipitation coupled with estimates of impervious cover and
stormwater runoff concentrations. Load estimates are the product of annual runoff volume and pollutant
concentration using the following set of equations:
L = 0.227 * R * C
where:
L = Annual loading rate (pounds per acre per year)
R = Annual runoff (inches per year)
C = Pollutant concentration (mg/L)
0.227 = A conversion factor (constant; [(lb*L)/(in*acre*mg)])

Final TMDL for Sediment and Interstitial Dissolved Oxygen in Jordan Creek, Alaska September 2009
-35-
The Simple Method calculates annual runoff as a product of annual runoff volume and a runoff
coefficient (Rv). Runoff volume is calculated as:
R = P * Pj * Rv
where:
P = Annual rainfall (inches)
Pj = Fraction of annual rainfall events that produce runoff
Rv = Runoff coefficient
The Simple Method runoff coefficient is based on impervious cover in the watershed, calculated as:
Rv = 0.05 + (0.9 * Ia)
where:
Ia = Impervious fraction
Table 4-1 summarizes the information needed to calculate runoff volume (R) for the three “urban” land
uses in Jordan Creek watershed, as identified in Table 1-2 in the characterization section. The percent of
impervious area by land use type is based on default values in Simple Method documentation (Caraco,
2001). Annual rainfall in the Simple Method applied to Jordan Creek used data reported from the Juneau
International Airport. From September 1949 to December 2006, the average annual precipitation was 56
inches. The fraction of annual rainfall events that produce runoff (Pj) is 0.9—the value typically used by
CWP.
Table 4-1. Parameters Used to Calculate Runoff for Estimation of Urban Sediment Source Loads
Land Use Ia – Percent Imperviousa
Rv – Runoff Coefficient
P – Annual Rainfall
(in)
Pj – Fraction of Rainfall
Producing Runoff R – Runoff
(in/yr)
Low density residential 28% 0.302 56 0.9 15.2
Medium - high density residential 33% 0.347 56 0.9 17.5
Commercial (developed, high intensity) 72% 0.698 56 0.9 35.2 aBased on Caraco (2001)
Table 4-2 summarizes the calculation of unit area load estimates for the three urban land use categories
using the Simple Method approach. Sediment concentrations associated with urban runoff are based on
literature values (Caraco, 2001). It should be noted that these are event mean concentrations.
Table 4-2. Sediment Source Load Estimates for Urban Runoff in the Jordan Creek Watershed
Land Use Size
(acres) Conversion
factor
R – Runoff (in/yr)
C – Concentration (mg/L)a
L – Unit Area Load
(lbs/acre/year)
Low density residential 225.92 0.227 15.2 100 346
Medium - high density residential 67.84 0.227 17.5 100 397
Commercial (developed, high intensity) 64.64 0.227 35.2 100 799 aBased on Caraco (2001)
For comparative purposes, grab samples for turbidity were collected from a ditch draining to Jordan
Creek in the commercial area below Egan Drive during an August 2008 storm. Results ranged from 125
to 176 NTUs. Although no turbidity / TSS relationship has been developed for this site, the data does
provide a frame of reference when considering urban runoff as a sediment source in the Jordan Creek

Final TMDL for Sediment and Interstitial Dissolved Oxygen in Jordan Creek, Alaska September 2009
-36-
watershed. As new information becomes available, the Simple Method provides a framework for
revising sediment load estimates that result from urban runoff in Jordan Creek.
4.3.2. Winter Road Maintenance
Another major source of sediment to Jordan Creek is winter sanding of road surfaces and commercial
parking lots. The volume and location of sand applied to surfaces used for vehicular traffic have a high
potential to deliver sediment to Jordan Creek. This activity generally occurs from November through
February. Major points of concern are where roads cross the stream where sediment can be delivered to
Jordan Creek either during the road sanding or through subsequent runoff. These areas occur primarily in
the high density commercial area below Egan Drive. While estimates were already calculated for urban
runoff, it is assumed that winter road maintenance would not be captured in that estimate. Winter road
sanding is a geographic-specific source that is not typically captured in national literature values for urban
runoff and sources. For this reason, separate estimates are made for sediment loading from winter road
sanding, in addition to those for general urban runoff.
The Duck Creek turbidity TMDL compiled data on winter road maintenance in the Mendenhall Valley
(USEPA, 1999a). This information can be used to provide an estimate for sediment loads to Jordan Creek
associated with road sanding. The Duck Creek technical analysis estimated that 111 tons of sand, silt, and
clay are applied to for winter road maintenance. Of the 111 tons of material applied, 78.5 tons are
available for delivery to the creek (or 173 pounds per acre per year). The Duck Creek TMDL indicated
that this estimate may be conservative (e.g., higher than the actual amount). However, the majority of the
watershed area in Duck Creek is residential. Sediment loads from winter sanding in commercial locations
may actually be greater due to the higher level of paved surfaces per unit area. However, without
additional information, it is assumed that the estimates for Duck Creek are appropriate for estimating
loads from winter road maintenance in the Jordan Creek TMDL.
In summary, the annual load estimate delivered to Jordan Creek resulting from winter road maintenance
assumes a unit area fine sediment load of 173 pounds per acre per year. This is based on information
compiled from the Duck Creek turbidity TMDL. This unit area load is multiplied by the size of the
commercial area in the Jordan Creek watershed (e.g., 64.6 acres), which represents the portion of drainage
where road sanding is most likely to occur. The total resultant estimated load is 5.6 tons per year.
Because 10 percent of this is assumed attributed to snow dumps (see discussion in Section 4.3.3), the
annual load from winter road maintenance in Jordan Creek watershed is 156 pounds per acre per year, or
5.0 tons per year.
4.3.3. Snow Dumps
The practice of plowing snow from roadways and parking lots to centralized storage sites can provide a
chronic source of sediment (Figure 4-1). This becomes a water quality problem when located in close
proximity to Jordan Creek, where sediment can be delivered to the stream through snowmelt.
Information on the amount of snow and fine sediment content in snow dumps located in the Jordan Creek
watershed is not available. However, the Duck Creek turbidity TMDL assumed that 10 percent of the
winter road maintenance material is stored in snow dumps close enough to be directly delivered during
snowmelt (or 17.3 pounds per acre per year). The same rationale employed for winter road maintenance
in Jordan Creek is used to derive an estimated load for snow dumps (based on the Duck Creek turbidity
TMDL assumption). The resultant estimated load is 0.6 tons per year.

Final TMDL for Sediment and Interstitial Dissolved Oxygen in Jordan Creek, Alaska September 2009
-37-
Figure 4-1. Snow dump adjacent to Jordan Creek.
4.3.4. East Valley Reservoir Tributary
The EVR was built in 1985 by CBJ. An access road was constructed to the tank from the end of Amalga
Drive. The access road runs along the EVR tributary, crossing at two locations. An unintended
consequence of the road is channelized flow and sediment that ultimately discharged into Jordan Creek
following a fall 1998 flood. This event resulted in about 280 linear feet of Jordan Creek’s east flood plain
becoming entirely covered with alluvial fan sediments from the EVR tributary (Figure 4-2).
The Juneau Watershed Partnership (JWP) commissioned a study by Inter-Fluve in 2007 to examine
sediment from the EVR tributary and its effect on Jordan Creek. Localized erosion within the EVR
tributary drainage has been estimated at approximately 5,000 cubic yards. However, without additional
monitoring data, the amount actually delivered to Jordan Creek is unknown. At present, the major extent
of that effect appears to be limited to the immediate area below the confluence of the EVR tributary with
Jordan Creek. In particular, a sediment wedge has been created that has aggraded the streambed and
contributing to bank erosion in Jordan Creek.
The sediment wedge represents a significant volume of fine sediment that is already in Jordan Creek. At
high flows, a portion of that fine sediment is mobilized and moved to the lower reaches. A quick review
of sediment data collected from several streams in southeast Alaska suggests that unit area loads at high
flows in Jordan Creek are noticeably higher. For purposes of this analysis, half the suspended sediment
load in Jordan Creek is assumed to originate from the EVR tributary sediment wedge based on the
cursory data review.

Final TMDL for Sediment and Interstitial Dissolved Oxygen in Jordan Creek, Alaska September 2009
-38-
Figure 4-2. EVR tributary above Jordan Creek.
4.3.5. Other Sources
Other sources such as bank erosion and gully erosion could be contributing sediment to Jordan Creek.
However, the loads generated by these sources are expected to be relatively low compared to the
previously discussed sources (e.g., urban runoff, snow dumps, etc.). In addition, data are not available to
make confident estimates of the sediment loads associated with these sources. Therefore, this section
provides a general discussion of these “other” sources but does not include load estimates for use in the
TMDL analysis.
Bank Erosion and Channel Movement
Confronted by more frequent and severe floods, stream channels must respond. They typically increase
their cross-sectional area to accommodate the higher flows. This is done either through widening of the
stream banks, down cutting of the stream bed, or frequently both. This phase of channel instability, in
turn, triggers a cycle of stream bank erosion and habitat degradation.
In the case of Jordan Creek, problems with bank erosion and channel movement are most pronounced in
the vicinity of the EVR tributary. Sediment deposition forming the fan has continued to encroach into the
Jordan Creek flood plain and stream channel. The alluvial fan has created a sediment wedge and plume
along 640 feet of Jordan Creek that has raised the stream bed by up to 2 to 2.5 feet and pushed the stream
towards the west bank. This stream bed aggradation has increased upstream water surface elevations.
Stream channel and flood plain habitats have been covered by sediment deposits in the reach of Jordan
Creek.
The Inter-Fluve report indicated that Jordan Creek is not capable of passing sediments delivered by the
EVR tributary (Inter-Fluve, 2008). The report recommends that:
“in considering stream rehabilitation it will be necessary to physically remove sediments from
the channel and flood plain and physically create an appropriate geomorphic form and

Final TMDL for Sediment and Interstitial Dissolved Oxygen in Jordan Creek, Alaska September 2009
-39-
aquatic/riparian habitats. To provide a sustainable solution to the degree possible it will be
necessary to manage sediments along the EVR Tributary to slow or stop growth of the fan in
order to limit the degree of alluvial fan encroachment into Jordan Creek.”
In summary, erosion from the EVR tributary has an effect on the sediment regime of Jordan Creek.
Restoration is needed to address the long-term effects of sediment from the EVR tributary on Jordan
Creek.
Surface Erosion
Excessive water runoff across a watershed can lead to detachment of soil particles. If the runoff volume
is high enough and soils are exposed, surface erosion occurs. Surface erosion rates are affected by several
factors including:
soil type
hill slope
vegetative condition
land use / land cover
rainfall intensity
Runoff following rain events can be one of the most significant transport mechanisms of sediment and
other nonpoint source pollutants. Precipitation is obviously the driving mechanism responsible for storm
flows and associated surface runoff. Many of the sources in the Jordan Creek watershed that result from
surface erosion have been discussed, specifically urban runoff, sediment from winter road maintenance,
and snow dumps.
Gully Erosion
Gullies are relatively steep-sided watercourses, which experience ephemeral flows during heavy or
extended rainfall. Gully erosion is caused when runoff concentrates and flows at a velocity sufficient to
detach and transport soil particles. Widening of gully sides subsequently occurs by slumping and mass
movement. Runoff may also enter a gully from the sides, causing secondary gullies or branching. Like
surface erosion, sediment from gullied areas is delivered to stream systems during high flow conditions.
Gully formation may be triggered by land use changes, such as vegetation removal or by construction of
new commercial / residential areas.
With respect to Jordan Creek, ATV trails are the most likely activity in the watershed that can cause gully
formation. The report Jordan Creek Watershed Recovery and Management Plan prepared by the USDA
– Natural Resources Conservation Service (NRCS) cited damage caused by illegal off-road vehicle users
in upper Jordan Creek (Figure 4-3). Situations like those shown in Figure 4-3, can trigger gully formation
resulting in sediment delivery during rain and snowmelt events.
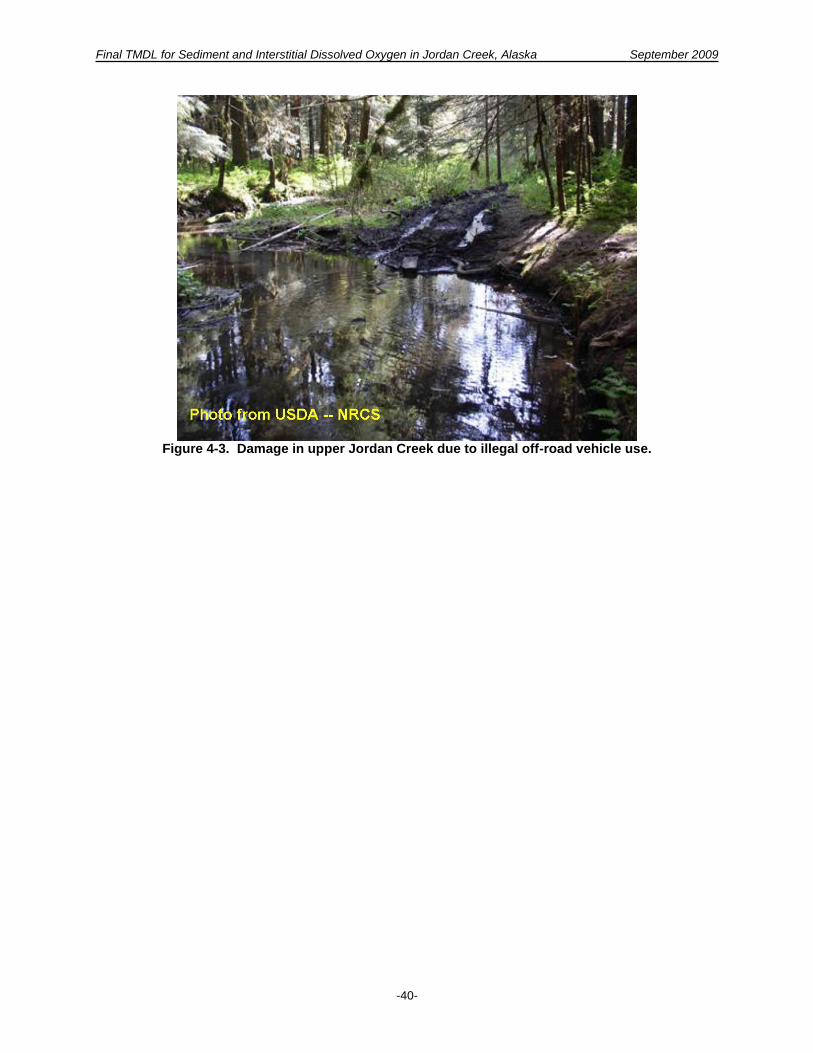
Final TMDL for Sediment and Interstitial Dissolved Oxygen in Jordan Creek, Alaska September 2009
-40-
Figure 4-3. Damage in upper Jordan Creek due to illegal off-road vehicle use.
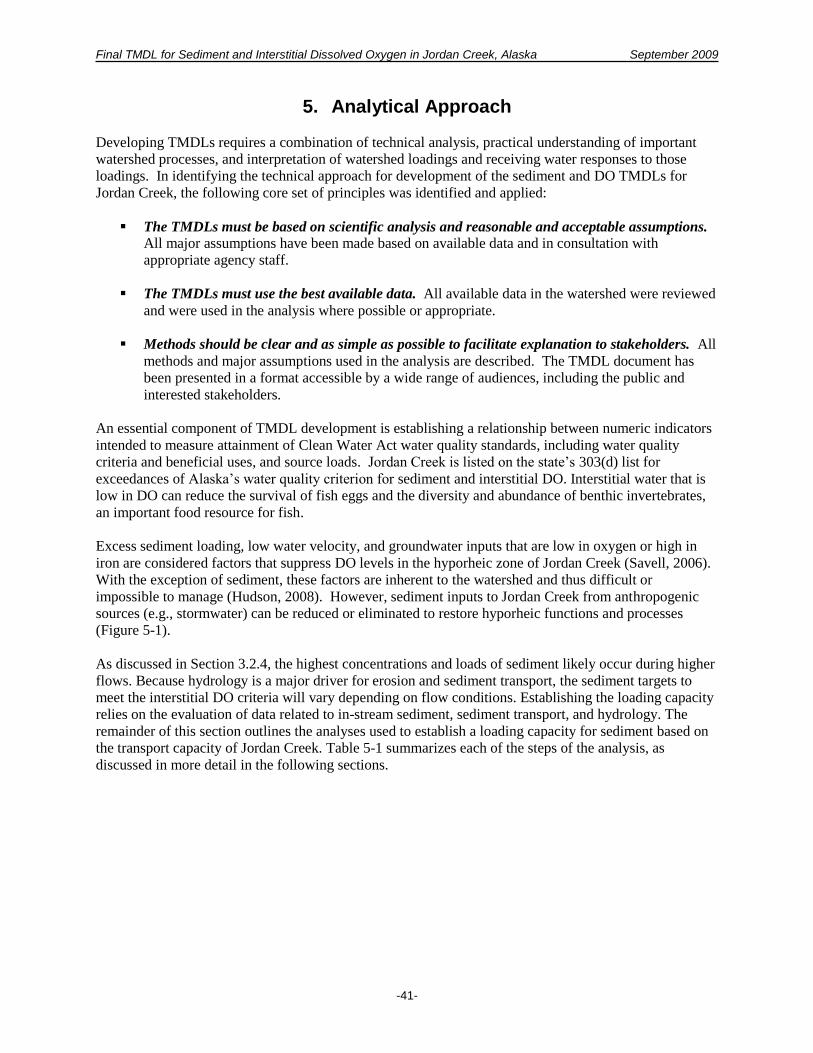
Final TMDL for Sediment and Interstitial Dissolved Oxygen in Jordan Creek, Alaska September 2009
-41-
5. Analytical Approach Developing TMDLs requires a combination of technical analysis, practical understanding of important
watershed processes, and interpretation of watershed loadings and receiving water responses to those
loadings. In identifying the technical approach for development of the sediment and DO TMDLs for
Jordan Creek, the following core set of principles was identified and applied:
The TMDLs must be based on scientific analysis and reasonable and acceptable assumptions.
All major assumptions have been made based on available data and in consultation with
appropriate agency staff.
The TMDLs must use the best available data. All available data in the watershed were reviewed
and were used in the analysis where possible or appropriate.
Methods should be clear and as simple as possible to facilitate explanation to stakeholders. All
methods and major assumptions used in the analysis are described. The TMDL document has
been presented in a format accessible by a wide range of audiences, including the public and
interested stakeholders.
An essential component of TMDL development is establishing a relationship between numeric indicators
intended to measure attainment of Clean Water Act water quality standards, including water quality
criteria and beneficial uses, and source loads. Jordan Creek is listed on the state’s 303(d) list for
exceedances of Alaska’s water quality criterion for sediment and interstitial DO. Interstitial water that is
low in DO can reduce the survival of fish eggs and the diversity and abundance of benthic invertebrates,
an important food resource for fish.
Excess sediment loading, low water velocity, and groundwater inputs that are low in oxygen or high in
iron are considered factors that suppress DO levels in the hyporheic zone of Jordan Creek (Savell, 2006).
With the exception of sediment, these factors are inherent to the watershed and thus difficult or
impossible to manage (Hudson, 2008). However, sediment inputs to Jordan Creek from anthropogenic
sources (e.g., stormwater) can be reduced or eliminated to restore hyporheic functions and processes
(Figure 5-1).
As discussed in Section 3.2.4, the highest concentrations and loads of sediment likely occur during higher
flows. Because hydrology is a major driver for erosion and sediment transport, the sediment targets to
meet the interstitial DO criteria will vary depending on flow conditions. Establishing the loading capacity
relies on the evaluation of data related to in-stream sediment, sediment transport, and hydrology. The
remainder of this section outlines the analyses used to establish a loading capacity for sediment based on
the transport capacity of Jordan Creek. Table 5-1 summarizes each of the steps of the analysis, as
discussed in more detail in the following sections.

Final TMDL for Sediment and Interstitial Dissolved Oxygen in Jordan Creek, Alaska September 2009
-42-
Figure 5-1. Relationship of interstitial DO to fine sediment and storm water.
Table 5-1. Summary of TMDL Analysis for Jordan Creek
Step in TMDL Analysis Summary of Steps and Calculations
Calculation of Annual Existing Loads (Sections 4.3 and 5.1)
Uses the Simple Method to calculate annual loads from developed land uses (e.g., commercial, residential)
Uses assumptions from nearby TMDL to calculate annual loads from site-specific sources (e.g., snow removal practices)
Calculation of Annual Allowable Load (Section 5.1)
Calculates annual allowable incoming sediment load based on transport capacity and annual sediment yield of the creek
Uses sediment rating curve established using observed data to relate daily unit area load (lbs/acre/day) to unit area flow (cfs/mi2)
With flow duration record and relationship established in sediment rating curve, calculates annual sediment yield
Compares annual sediment yield with annual existing loads; confirms likely deposition of sediment due to a greater incoming sediment load than the stream can transport
Calculation of Daily Allowable Loads (Section 5.2, presented as Loading Capacity in Section 6)
Uses relationship established in sediment rating curve with flow record to calculate a series of allowable daily loads give the total watershed size
Plots allowable daily loads as a function of flow in a load duration curve
Calculation of Daily Existing Loads (Section 5.3)
Uses hydrograph separation to identify portion of flow contributed through surface runoff to isolate storm flows that contribute watershed loads
Uses distribution of storm flows to distribute annual existing loads into a series of daily loads; uses portion of total storm flow on any given day to identify portion of annual load delivered on that day
Plots existing daily loads with daily allowable loads to illustrate that existing loads are greater than transport capacity, especially under high flows
The Protocol for Developing Sediment TMDLs (USEPA, 1999b) indicates the appropriateness of using
empirical relationships between stream flow and sediment, known as rating curves. Sediment rating
curves can characterize sediment supply and transport capacity in response to hydrologic processes.
Figure 5-2 illustrates development of a rating curve based on Jordan Creek suspended sediment
concentration (SSC) data. SSC data were used because corresponding flow data were available, and data

Final TMDL for Sediment and Interstitial Dissolved Oxygen in Jordan Creek, Alaska September 2009
-43-
were available across a range of flow conditions. Observed SSC data were multiplied by corresponding
flows and divided by the corresponding drainage area of the monitoring site to calculate unit area loads
(lbs/acre/year). These unit area loads were then plotted against corresponding unit flow rates, as shown in
Figure 5-2, to evaluate the relationship between flow and suspended sediment loads. The figure indicates
a direct correlation between flow and unit area suspended sediment loads.
5.1. Sediment Transport and Budgets
Rating curves that describe the relationship between flow and sediment can be used to estimate the annual
suspended sediment transport from the watershed—that amount of sediment that is delivered out of the
watershed. The following equation representing the relationship established in Figure 5-2 can be used to
calculate the sediment transport for the Jordan Creek watershed:
SSL = 0.0004 * QUA 3.1666
where:
SSL = Suspended sediment loading rate (pounds / acre per day)
QUA = Unit area flow (cfs / square mile)
The coefficients in the equation are based on a regression using the SSC and flow data (3.1666 is the
slope of the regression line, while 0.0004 is the intercept). The equation can then be used to calculate the
sediment transport for Jordan Creek based on a known flow and corresponding unit area flow. For
example, assuming Jordan Creek has a mean daily flow of 71.4 cfs on a particular day, the corresponding
unit area flow for that day is 23.8 cfs/mi2, based on the Jordan Creek watershed area of 3 mi2. Therefore,
using the above equation, the estimated suspended sediment transport from the Jordan Creek watershed is
9.14 lbs/acre/day for that particular day.
Figure 5-2. Suspended sediment rating curve for Jordan Creek.

Final TMDL for Sediment and Interstitial Dissolved Oxygen in Jordan Creek, Alaska September 2009
-44-
Daily average flows vary over the course of a year (e.g., 71.4 cfs is close to the highest that might occur
in Jordan Creek). The flow duration curve can be used to account for this variation by developing a
record of daily average flows for a typical year. Each daily average flow can then be used with the above
equation to estimate the sediment transport for that day. The resultant 365 values (one for each day) are
then summed to calculate the annual sediment transport. For Jordan Creek, the estimated sediment
transport is 40 pounds per acre per year. This equates to 38.4 tons/yr (based on a watershed of 1,920
acres). This provides an estimate of the amount of fine sediment leaving Jordan Creek. An estimate of
sediment transport also enables construction of a rapid sediment budget, which can be used to compare
the amount of fine sediment entering Jordan Creek to that leaving the watershed.
A sediment budget is an accounting of the sources and deposition of sediment as it travels from its point
of origin to its eventual exit from the watershed. Although sediment budgets may require long-term
measurements, rapid sediment budgets can also be constructed using estimates at a level adequate for
most management needs (Reid and Dunne, 1996). In terms of Jordan Creek, a greater amount of
sediment entering the systems than the amount transported out of the watershed provides an indication
that fine sediment accumulation is occurring. A continued amount of fine sediment accumulation over
time will contribute to interstitial DO problems by reducing hyporheic flow, as discussed earlier.
Table 5-2 summarizes load estimates described earlier, multiplying unit area values by corresponding
land use size for urban runoff sources. Source load estimates for winter road maintenance and snow
dumps are based on the size of the commercial area in the watershed. This assumption is based on the
limited connectivity of roads to Jordan Creek above Egan Drive.
Table 5-2. Rapid Sediment Budget for Jordan Creek
Source Area Size (acres) Unit Area Load (lbs/acre/year) Input (tons/year)
Low density residential 225.9 346 39.0
Medium - high density residential 67.8 397 13.5
Commercial 64.6 799 25.8
Winter road maintenance 64.6 155.7 5.0
Snow dumps 64.6 17.3 0.6
EVR tributary --- --- 19.2
Sum of All Source Inputs 103.1
Table 5-2 provides annual load estimates for urban runoff (low density residential, medium – high density
residential, commercial), winter road maintenance, and snow dumps, calculated using loading rates
estimated in Section 4.3. These values, which represent fine sediment input to Jordan Creek, total 106
tons/yr. This exceeds the sediment yield (e.g., the amount transported from the watershed) of 38.4 tons/yr.
The estimates, while based on a number of assumptions, indicate that fine sediment from these sources
alone have a high potential for accumulating in Jordan Creek.
The information presented in Table 5-2 is expressed as annual loads. It identifies the approximate
magnitude of potential contributions for major sources of fine sediment to Jordan Creek based on a long-
term average timeframe. The last step in the linkage analysis is to convert these long-term averages to
daily load estimates. Clean Water Act §303(d) requires that TMDLs be expressed as daily loads, and this
enables developing a connection between the assimilative capacity (expressed as a total cumulative
value), source loads and sediment yield (expressed as annual average values), and the actual TMDL
(expressed as a daily value).

Final TMDL for Sediment and Interstitial Dissolved Oxygen in Jordan Creek, Alaska September 2009
-45-
Developing a framework that accounts for multiple averaging periods also provides a way to achieve both
long-term program objectives and focus implementation efforts. For example, in Jordan Creek, sediment
problems appear to be the result of storm water related delivery mechanisms that occur largely under very
high flow conditions.
5.2. Allowable Daily Load Estimates
Technical documents are available that describe methods to develop daily load expressions. One
approach builds on existing information to develop a daily load dataset. The regression equation derived
from the sediment rating curve provides an empirical approach that can be used with Jordan Creek flow
data. Each daily average unit area flow can be substituted into the regression equation in Figure 5-2 to
calculate a corresponding daily unit area load (i.e., Load = 0.0004 * Flow 3.166). Two points that illustrate
this calculation are shown in Figure 5-2. In one case, a unit area flow of 23.8 cfs per square mile was
used in the regression equation. The resultant sediment yield at the flow is 9.14 pounds / acre per day.
The second case used a unit area flow of 3.5 cfs per square mile. This results in a sediment yield of 0.02
pounds per acre per day.
The daily unit area load can then be multiplied by the drainage area to determine the load at that point.
For purposes of this analysis, the most downstream point assessed is at the Juneau airport; a drainage area
of 3.0 square miles (or 1,920 acres). This load estimate identifies the amount of sediment that can be
transported from that point each day. Because it is a function of stream discharge, the information can be
summarized using a load duration curve as shown in Figure 5-3. Figure 5-3 describes the capacity of
Jordan Creek to transport sediment out of the watershed in terms of flow conditions. This load duration
curve provides a framework to examine daily source load estimates across the range of different flow
regimes. The same two flow values used in Figure 5-2 are used to depict calculation results (23.8 cfs per
square mile corresponds to a flow duration interval of 0.27 percent, while 3.5 cfs per square mile
corresponds to a flow duration interval of 25 percent).
Figure 5-3. Jordan Creek load duration curve using sediment rating curve.

Final TMDL for Sediment and Interstitial Dissolved Oxygen in Jordan Creek, Alaska September 2009
-46-
5.3. Existing Daily Load Estimates
The next step is to develop daily estimates of source loads. Source inputs under different flow regimes
can then be compared to the transport capacity under the same stream discharge rates. Conditions where
source inputs exceed the transport capacity provide an indication of those circumstances when sediment
accumulation is most likely to occur. In addition to providing daily load estimates that satisfy TMDL
requirements, this information can also be used to help guide implementation efforts.
Basic hydrology can also be used to develop daily source load estimates. The majority of sediment loads
from urban runoff, winter road maintenance, and snow dumps are associated with surface runoff. Rainfall
/ runoff models, such as HSPF, SWAT, or SWMM, are generally used to provide detailed estimates of the
timing and magnitude of storm flows. However, these can also be very rigorous and time-consuming
approaches.
The utility of duration curves has been discussed relative to identifying flow related water quality
patterns. Development of duration curves requires the analysis of hydrologic information. For this
reason, an alternative method can use the stream flow data to examine general watershed runoff patterns.
Hydrograph analysis has proven to be a useful technique for a variety of water-resource investigations.
Streamflow hydrographs can be separated into baseflow and surface-runoff components using a computer
program called HYSEP (Sloto and Crouse, 1996). The base-flow component is traditionally associated
with groundwater discharge and the surface-runoff component with precipitation that enters the stream as
overland flow.
Information from hydrograph separation can be displayed as a fraction analysis using duration curve
intervals to examine the percentage (or fraction) of total flow that consists of base flow and storm flow.
Figure 5-4 presents the fraction of streamflow that is contributed by stormflow (as percent of total flow)
calculated using hydrograph separation on Jordan Creek data, grouped by duration curve zone.
Hydrograph separation calculated separate fractions representing input from surface runoff and input from
baseflow for each recorded daily flow in Jordan Creek. Therefore, Figure 5-4 shows the range of the
calculated fraction of daily contributions from surface runoff for all of the recorded daily flows included
in each of the five flow zones (e.g., high flows, moist conditions, etc.) This illustrates the potential effect
that storm flows might exert across the range of flow conditions. In the case of Figure 5-4, surface runoff
has its greatest effect on Jordan Creek during high flow conditions (median value of 30 percent).
Correspondingly, sediment delivered to stream systems as a result of surface erosion will also be greatest
during high flows.
Hydrograph separation can be used to develop a flow duration curve for surface runoff (e.g., a storm flow
duration curve). The storm flow duration curve for Jordan Creek is shown in Figure 5-5, which has been
derived using hydrograph separation with flow data from the USGS gage. Because the curve represents
only that portion of flow coming from stormwater runoff and not those from groundwater (i.e., baseflow),
only the higher flows are evident on the curve. For example, at the 40 percent flow interval, the observed
flow is 6.1 cfs or 2.35 cfs/mi2 (as shown in Figure 3-8). Therefore, as shown in the storm flow duration
curve in Figure 5-5, at the 40 percent flow interval, surface flow accounts for 0.231 cfs/mi2 while the
remaining 2.1 cfs/mi2 is contributed through baseflow and interflow.
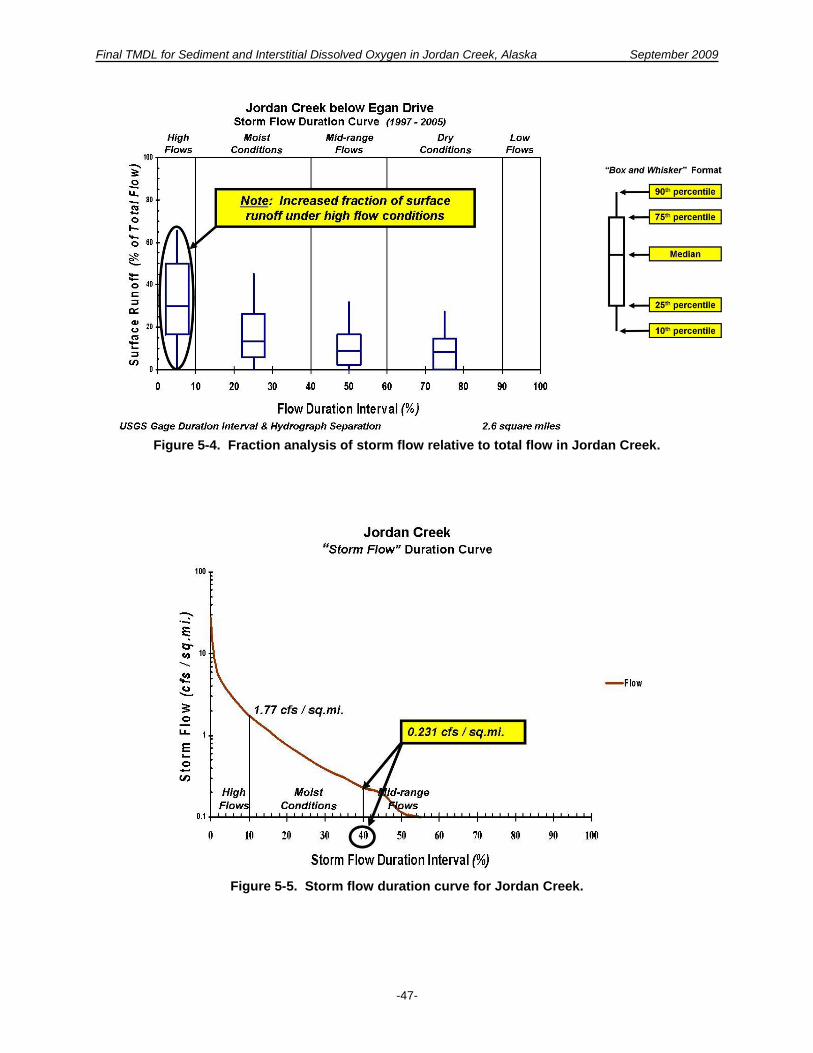
Final TMDL for Sediment and Interstitial Dissolved Oxygen in Jordan Creek, Alaska September 2009
-47-
Figure 5-4. Fraction analysis of storm flow relative to total flow in Jordan Creek.
Figure 5-5. Storm flow duration curve for Jordan Creek.

Final TMDL for Sediment and Interstitial Dissolved Oxygen in Jordan Creek, Alaska September 2009
-48-
As shown in the sediment rating curve (Figure 5-2), there is a strong correlation between the flow volume
and the amount of sediment moved in the stream (r2 = 0.9444). It is assumed that the same approximate
relationship exists between the volume of surface runoff and the amount of sediment delivered through
surface erosion. In other words, more surface runoff (or storm flow) is expected to move a greater
amount of fine sediment into Jordan Creek. Thus, Figure 5-5 provides an indicator of the relative volume
of a runoff event. For example, an event associated with a storm flow duration interval of 10 will deliver
7.7 times the volume of water as an event associated with a storm flow duration interval of 40 (e.g., 1.77
cfs/mi2 divided by 0.231 cfs/mi2 equals 7.7).
Annual source estimates were calculated using the unit area loads representing the major sources in the
watershed (e.g., urban runoff from commercial and residential areas, winter road maintenance, snow
dump runoff) as shown previously in Table 5-2. Daily source load estimates can be derived, in part, by
apportioning the annual load based on the relative volume of water associated with a storm flow duration
interval. A larger amount of storm water volume will also have a greater ability to move sediment
(similar to the principles behind a sediment rating curve). Thus, a second part of apportioning the annual
load to daily loads should reflect a sediment rating curve relationship.
With daily source estimates developed, the sum of these input loads to Jordan Creek can be compared to
its transport capacity. These are shown in Figure 5-6. As can be seen, there is a definite range that source
input loads exceed the transport capacity, most notably under high flow conditions. This is not surprising,
as it corresponds to situations where sediment associated with surface runoff events (e.g., urban
stormwater) logically have the greatest effect on receiving streams.
Figure 5-6. Jordan Creek source input loads compared to transport capacity.

Final TMDL for Sediment and Interstitial Dissolved Oxygen in Jordan Creek, Alaska September 2009
-49-
6. TMDL
A TMDL represents the total amount of a pollutant that can be assimilated by a receiving water while still
achieving water quality standards. A TMDL is composed of the sum of individual waste load allocations
(WLAs) for point sources and load allocations (LAs) for nonpoint sources and natural background loads.
In addition, the TMDL must include a margin of safety (MOS), either implicitly or explicitly, that
accounts for the uncertainty in the relationship between pollutant loads and the quality of the receiving
waterbody. Conceptually, this definition is denoted by the equation
TMDL = Σ WLAs + Σ LAs + MOS
The TMDL for Jordan Creek developed to address both the sediment and DO (interstitial) listings is
expressed as an allowable sediment load to the stream. Controlling the amount of sediment input to the
creek will control the amount that is accumulated as fine sediment in the stream bed, reducing interstitial
DO and reducing the quality of aquatic habitat.
Much of the mainstem of Jordan Creek is a narrow, low gradient flood plain channel, which implies that it
is extremely sensitive to sediment input. In addition, the stream energy is not normally great enough to
mobilize accumulated sediment (Savell, 2006). As a result, sediment transport is a major determinant in
identifying a loading capacity for Jordan Creek. To control the accumulation of fine sediment in Jordan
Creek, the loading capacity (i.e., the TMDL) for fine sediment cannot be greater than the stream’s ability
to transport sediment from the creek. Therefore, the loading capacity is calculated as equal to the
sediment yield of the stream. That is, the allowable amount of sediment to be input to the stream is that
amount of sediment that the stream can transport out. Therefore, the stream basically carries out whatever
sediment is added to the stream, allowing minimal settling and accumulation of fine sediment. As shown
in previous sections, the transport capacity of the stream varies with flow; therefore the loading capacity
for Jordan Creek is calculated based on flow condition.
The sediment rating curve described in the linkage analysis provides a measure of that transport in
Jordan Creek as a function of flow conditions. Because the sediment rating curve provides a measure
that addresses water quality concerns in Jordan Creek, loading capacity targets for each flow duration
interval can be calculated based on the regression equation shown in Figure 5-2. In-stream loads for SSC,
expressed as pounds/acre per day, are calculated using:
SSL = 0.0004 * QUA 3.1666
where:
SSL = Suspended sediment loading rate (pounds / acre per day)
QUA = Unit area flow (cfs / square mile)
The loading capacity for the Jordan Creek is shown in Figure 6-1. It is derived directly from the sediment
rating curve and the duration curve using the unit area flow to load calculation described above across the
range of all daily average flows. The resulting allowable loading rates (pounds/acre per day) were then
multiplied by the size of the Jordan Creek watershed (1,920 acres) to calculate the loading capacity.
While the entire load duration curve can be used as the loading capacity to identify unique loading
capacities for each flow value, a representative loading capacity for each flow zone is identified,
calculated using the median flow for each zone, consistent with EPA guidance (USEPA 2007). This
allows for easier interpretation of TMDL goals and provides a general magnitude of allowable loads as
well as needed reductions for the different flow zones. A unique loading capacity for each duration curve
zone allows the TMDL to reflect major watershed processes indicative of different flows. Table 6-1

Final TMDL for Sediment and Interstitial Dissolved Oxygen in Jordan Creek, Alaska September 2009
-50-
presents the loading capacity for each flow zone, as shown in Figure 6-1. In-stream channel processes
tend to dominate the sediment regime at high flows, while sediment delivered from surface erosion may
be of greater concern under moist conditions. A separate loading capacity for each zone allows the TMDL
to guide implementation efforts uniquely associated with these conditions. The use of a discrete loading
capacity for each zone also acknowledges the variability and uncertainty inherent in natural systems. The
framework provides a focus for identifying targets that reflect expected patterns.
Table 6-1. Jordan Creek Sediment TMDL Summary
TMDL Summary
Loads expressed as (pounds/day)1
High Moist Mid-Range Dry Low
Loading Capacity 764 41 5.0 0.45 –
Load Allocation 535 29 4.5 0.40 –
Wasteload Allocation n/a n/a n/a n/a n/a
Future Sources 153 8 – – –
Margin of Safety 76 4 0.5 0.05 – 1 Loading capacity for each flow zone is calculated using the median flow for the respective zone, as follows:
5th percentile: 8.85 cfs / square mile 25th percentile: 3.50 cfs / square mile 50th percentile: 1.81 cfs / square mile 75th percentile: 0.85 cfs / square mile 95th percentile: 0.18 cfs / square mile
Figure 6-1. Suspended sediment loading capacity for Jordan Creek.

Final TMDL for Sediment and Interstitial Dissolved Oxygen in Jordan Creek, Alaska September 2009
-51-
6.1. Wasteload Allocation
The wasteload allocation is the portion of the TMDL that is allocated to point sources. There are no
permitted point source discharges into Jordan Creek. Therefore, the wasteload allocation for sediment in
Jordan Creek is zero.
6.2. Load Allocation
Because there are no permitted sources of sediment to Jordan Creek, the entire loading capacity (minus
the MOS, as shown in Table 6-1) is assigned to the load allocation for nonpoint sources.
6.3. Future Sources
While there are no existing known facilities that are covered under the Multi-Sector General Permit or the
Construction General Permit, there is the possibility of future coverage in the Jordan Creek watershed.
Therefore, a portion of the loading capacity has been allocated for use for future sources. It is assumed
that any future permitted construction or industrial activities would occur in the developed portions of the
watershed. Because developed land represents approximately 20 percent of the watershed area, 20 percent
of the loading capacity was allocated to future sources. This is done for the “high” and “moist” flow
zones, assuming the future sources would be permitted stormwater.
6.4. Margin of Safety
The MOS accounts for any uncertainty concerning the relationship between pollutant loading and
receiving water quality. The MOS can be implicit (e.g., incorporated into the TMDL analysis through
conservative assumptions) or explicit (e.g., expressed in the TMDL as a portion of the loading) or a
combination of both. For the Jordan Creek TMDL, the MOS was included explicitly as 10 percent of the
loading capacity.
6.5. Seasonal Variation and Critical Conditions
EPA regulations require that TMDLs be developed for critical conditions and consider seasonal
variations. The TMDL analysis for Jordan Creek inherently considers both seasonal variation and critical
conditions by establishing allocations for various flow conditions. Flow varies by season and is also
typically a defining factor in critical conditions (e.g., low flows versus high flows). Therefore, using the
load duration approach and establishing flow-variable allowable loads adequately considers critical
conditions and seasonal variation.
6.6. Daily Load
To meet the requirement that TMDLs be expressed as daily loads, the load duration curve established for
Jordan Creek and presented in Table 6-1 can be used to represent dynamic, flow-variable allowable daily
loads. The allowable daily load for a given day is determined by the flow measured on the respective day
and is calculated using the following equation:
SSL = 0.0004 * QUA 3.1666
Where QUA equals the unit area flow (cfs / square mile), which can be calculated by dividing the
measured flow by the corresponding drainage area at the measurement site.

Final TMDL for Sediment and Interstitial Dissolved Oxygen in Jordan Creek, Alaska September 2009
-52-
7. Implementation and Monitoring
Implementation planning typically identifies feasible and cost effective management measures capable of
reducing pollutant loads to required levels. It is a key part of the water quality management process.
TMDLs and implementation planning often work together in that TMDLs can provide the ability to
support development of information-based, water quality management strategies.
The intent of implementation planning is to provide information to local stakeholders regarding the
selection of cost-effective best management practices (BMPs). Monitoring is an important element of
implementation planning because it produces data needed to refine management strategies. Monitoring
data often enables the overall water quality management process to incorporate adaptive management
concepts.
7.1. Implementation Activities
The Jordan Creek Watershed Recovery and Management Plan (JCWRMP) was initiated to address water
quality problems in Jordan Creek (USDA – NRCS, 2006). The report identifies a number of activities
that, if implemented, will reduce sediment delivery to Jordan Creek. These activities include:
Erosion control
Snow storage and removal
Riparian management
Education and outreach
Goal 1 of the JCWRMP identifies actions that specifically address sediment problems in Jordan Creek,
which are summarized in Table 7-1. In identifying these goals the JCWRMP evaluated the watershed
characteristics, major sources and activities, and priorities for restoration. Therefore, this report presents
the JCWRMP options and does not identify additional implementation activities. Recognizing that
objectives and action items are often interrelated, the JCWRMP intentionally did not prioritize the
activities. The JCWRMP also recognized that projects addressing specific resource concerns are most
often initiated opportunistically, when funding, time, agency and / or local government policies and
community initiate are favorable.

Final TMDL for Sediment and Interstitial Dissolved Oxygen in Jordan Creek, Alaska September 2009
-53-
Table 7-1. Sediment Reduction Actions Identified in JCWRMP
Action Description
Objective 1. Prevent and reduce erosion
1.1 Discourage motorized recreation in the upper Jordan Creek corridor by eliminating / blocking access points, posting signs, regular public outreach, and establishing an acceptable riding area.
1.2 Enforce regulations that address riparian and stream disturbance.
1.3 Require and encourage best management practices that control off-site migration of sediment during land-disturbing activities.
1.4 Stabilize the road, tank pad, and streambanks associated with the CBJ water storage facility on the main Jordan Creek tributary.
1.5 Rehabilitate disturbed streambanks, riparian areas, floodplains, and uplands.
Objective 2. Maintain and improve riparian areas
2.1 Educate the public about stream stewardship and the importance of maintaining riparian buffers for fish streams.
2.2 Maintain riparian buffers by not granting streamside setback variances.
2.3 Enforce regulations where disturbance has occurred.
2.4 Reestablish riparian corridors where possible.
Objective 3. Improve snow removal and storage practices
3.1 Develop a city-wide snow management plan that includes best management practices for snow plowing and storage, and an education and outreach component for contractors, residents, business owners, and both state and local government crews involved in snow management.
3.2 Establish snow storage areas that includes measures to prevent offsite transport of sediment (e.g., sediment traps, silt fencing) or retain melt water onsite.
7.2. Connections to Hydrology and TMDL
A major advantage of the duration curve framework is the ability to provide meaningful connections
between allocations and implementation efforts. Because the flow duration interval (FDI) serves as a
general indicator of hydrologic condition (i.e., wet versus dry and to what degree), allocations and
reduction targets can be linked to source areas, delivery mechanisms, and the appropriate set of
management practices. The actions identified in Table 7-1 are all aimed at reducing sediment delivery
that occurs under high flow and moist conditions.
For example, erosion control BMPs that prevent off-site migration of storm water are targeted specifically
to preventing delivery of sediment during runoff events. The TMDL analysis demonstrated that this is
most likely to occur in Jordan Creek under high flow and moist conditions. The same rationale applies to
implementation activities designed to reduce the effect sediment delivered to Jordan Creek that result
from winter road sanding and snow dumps. Riparian buffers provide filtering of sediment in surface
runoff before the water enters Jordan Creek; again targeted towards high flow and moist conditions.
The connection between the duration curve framework and development of management strategies is
illustrated in Table 7-2. Potential implementation opportunities are identified, which could be most
effective under each of the different flow zones. For instance, the benefit of erosion control projects that
reduce delivery of sediment will be more pronounced under high flow and moist conditions associated
with storm events. Thus, the use of duration curves enables a framework that can help guide
implementation efforts to address water quality concerns, particularly when ambient monitoring data is
available for pattern analysis of existing conditions.

Final TMDL for Sediment and Interstitial Dissolved Oxygen in Jordan Creek, Alaska September 2009
-54-
Table 7-2. Implementation Opportunities Highlighted using a Duration Curve Framework
TMDL Summary
Loads expressed as (pounds / day)
High Moist Mid-Range Dry Low
Loading Capacity1 764 41 5 0.5 ----
Estimated Current Load2 2,052 59 4 0.2 ----
Reduction Estimate 63% 31% 0% 0% 0%
Implementation Opportunities
Streambank Stabilization
Winter Road Maintenance & Snow Dump Sediment Reduction
Erosion Control Program
Riparian Buffer Protection
Notes: 1. Expressed as a daily load; represents the upper range of conditions needed to attain and maintain applicable water quality standards
2. Based on rapid sediment budget analysis discussed in Section 5 and calculated using median flow for the corresponding flow zone.
7.3. Monitoring Needs
The duration curve framework in the TMDL technical analysis confirms the importance of
implementation activities described in the JCWRMP. In addition, the TMDL highlights data needs that
would help refine future analyses, as well as support adaptive management of implementation efforts.
The application of the duration curve framework to express basic TMDL components allows water
quality monitoring information to be used in a way, which characterizes concerns and describes patterns
associated with impairments. The extended use of monitoring information can highlight opportunities for
enhanced targeting, not only in implementation planning, but also in field investigation efforts.
Several recent studies on Jordan Creek (Nagorski, 2008; Hudson, 2008) have highlighted the need for
additional types of data, such as flow monitoring. Development of the TMDL has also identified certain
types of data that would be valuable in terms of guiding implementation efforts and documenting progress
towards meeting water quality standards. These categories include:
Flow monitoring
Monitoring of fine sediment accumulation
More real time water quality monitoring (see recommendations included in Nagorski [2008])
Continued monitoring of interstitial DO
Inventory of storm water delivery points to Jordan Creek
Monitoring of priority storm water delivery points to Jordan Creek

Final TMDL for Sediment and Interstitial Dissolved Oxygen in Jordan Creek, Alaska September 2009
-55-
8. References
ADEC. 18 AAC 70 Water Quality Standards as amended through March 23, 2006. Alaska Department of
Environmental Conservation.
ADEC. 2006. Alaska’s FINAL 2006 Integrated Water Quality Monitoring and Assessment Report. Alaska
Department of Environmental Conservation, Anchorage, Alaska.
ADEC. 2005. Total Maximum Daily Load (TMDL) for Residue in the Waters of Jordan Creek in Juneau,
Alaska. Alaska Department of Environmental Conservation, Juneau, Alaska.
ADEC. 2001. Total Maximum Daily Loads (TMDLs) for Dissolved Oxygen and Iron in the Waters of
Duck Creek in Mendenhall Valley, Alaska. Alaska Department of Environmental Conservation,
Juneau, Alaska.
ADEC. 1995. Total Maximum Daily Load for Sediment and Turbidity with Consideration of Habitat
Modification in the Waters of Lemon Creek, Alaska. Alaska Department of Environmental
Conservation, Juneau, Alaska. September 1995.
ADFG. 2007. Coho Salmon and Smolt Production, Adult Harvest, and Escapement from Jordan and
Duck Creeks, Southeast Alaska, 2002-2003. Alaska Department of Fish and Game, Division of
Sport Fish and Commercial Fisheries.
Bjornn, T.C. and D.W. Reiser. 1991. Habitat Requirements of Salmonids in Streams. In: Meehan, W.R.
Influences of Forest and Rangeland Management on Salmonid Fishes and Their Habitats.
American Fisheries Society Special Publication 19. American Fisheries Society, Bethesda,
Maryland.
Caraco, D. 2001. The Watershed Treatment Model -- Version 3.0. Center for Watershed Protection,
Ellicott City, Maryland.
CBJ (City and Borough of Juneau). 2002. Waterbody Assessment for Jordan Creek, Juneau, Alaska.
Prepared for the City and Borough of Juneau by Carson Dorn, Inc.
Freeman, Joran. March 2008. Personal communication. Alaska Department of Environmental
Conservation, Juneau, Alaska.
Grieg, S.M., D.A. Sear, and P.A. Carling. 2007. A Review of Factors Influencing the Availability of
Dissolved Oxygen to Incubating Salmonid Embryos. Hydrological Processes. 21(3), 323-334.
Greig, S.M, D.A. Sear, P.A. Carling, and L. Whitcombe. 2004. Impact of Fine Sediment Accumulation on
the Flux of Oxygenated Water Through Gravel Riverbeds: A Process-Based Approach to Identifying
Fine Sediment Load Thresholds. In Lewis, D. and L. Gairns: Agriculture and the Environment,
Water Framework Directive and Agriculture, Proceedings of the SAC and SEPA Biennial
Conference. Edinburgh, Scotland.
Hood, E., L. Hoferkamp, and J. Hudson. 2005. Mendenhall Watershed Protection and Recovery. Alaska
Department of Environmental Conservation, Nonpoint Source Pollution Program, ACWA NPS
Water Quality Grant. Project # ACWA 05-010.

Final TMDL for Sediment and Interstitial Dissolved Oxygen in Jordan Creek, Alaska September 2009
-56-
Hudson, J. 2008. Interstitial Dissolved Oxygen in Jordan Creek, Juneau, Alaska. Prepared for the
Juneau Watershed Partnership by Aquatics Alaska, Juneau, Alaska.
Inter-Fluve, Inc. 2008. Hydrologic and Geomorphic Evaluation & Alternatives Analysi- For stream
rehabilitation for East Valley Reservoir tributary alluvial fan on Jordan Creek, Juneau, Alaska.
Prepared for the Juneau Watershed Partnership.
Leopold, L.B. 1994. A View of the River. Harvard University Press. Cambridge, Massachusetts.
Nagorski, S. 2008. Watershed Protection and Recovery for Jordan Creek, Juneau, Alaska- FY 2008
Final Report. Alaska Department of Environmental Conservation Nonpoint Source Pollution
Program ACWA NPS Water Quality Grant.
Nagorski, S. and L. Hoferkamp. 2007. Watershed Protection and Recovery for Jordan Creek, Juneau,
Alaska. Prepared for the Alaska Department of Environmental Conservation by University of
Alaska Southeast, Juneau, Alaska.
Nagorski, S., E. Hood, L. Hoferkamp, E. Neal, and J. Hudson. 2006. Watershed Protection and Recovery
for Jordan Creek, Juneau, AK. July 2006. Alaska Department of Environmental Conservation,
Nonpoint Source Pollution Program, ACWA NPS Water Quality Grant. Project # ACWA-06-10.
NMFS. 1998. Monitoring of Salmonid Egg Incubation in Mendenhall Valley Streams. Preliminary report
to the Duck Creek Advisory Group. National Marine Fisheries Service, Auke Bay Laboratory,
Alaska.
NOAA. 2003. Operational Plan: Production of Coho Salmon in Jordan and Duck Creeks, Northern
Southeast Alaska. National Oceanic and Atmospheric Association Special (NOAA) Study.
NRCS. 2006. Jordan Creek Watershed Recovery and Management Plan. U.S. Department of Agriculture,
Natural Resources Conservation Service, Juneau Field Office, Juneau, Alaska.
Quinn, T.P. 2005. The Behavior and Ecology of Pacific Salmon and Trout. University of Washington
Press. 391p.
Reid, L.M. and T. Dunne. 1996. “Rapid Evaluation of Sediment Budgets”. CATENA VERLAG GMBH,
35447. Reiskirchen, Germany.
Savell, S.L. 2006. Jordan Creek Watershed Recovery and Management Plan. U.S. Department of
Agriculture, Natural Resources Conservation Service, Juneau Field Office, Juneau, Alaska.
Schueler, T.S. 1987. The Simple Method in controlling urban runoff: a practical manual for planning and
designing urban BMPs. Prepared for Washington Metropolitan Water Resources Planning Board.
Metropolitan Washington Council of Governments, Washington, D.C. 275 pp.
Sloto, R.A. and Crouse, M.Y. 1996. HYSEP: A Computer Program for Streamflow Hydrograph
Separation and Analysis. Water Resources Investigations Report 96-4040. U.S. Geological
Survey, Lemoyne, Pennsylvania.
U.S. Environmental Protection Agency. 2007. An Approach for Using Load Duration Curves in the
Development of TMDLs. EPA 841-B-07-006. U.S. Environmental Protection Agency, Office of
Water, Washington, DC.

Final TMDL for Sediment and Interstitial Dissolved Oxygen in Jordan Creek, Alaska September 2009
-57-
U.S. Environmental Protection Agency. 1999a. Total Maximum Daily Load for Turbidity in the Waters of
Duck Creek in Mendenhall Valley, Alaska. U.S. Environmental Protection Agency, Region 10,
Seattle, WA.
U.S. Environmental Protection Agency. 1999b. Protocol for Developing Sediment TMDLs - First Edition.
EPA 841-B-99-004. U.S. Environmental Protection Agency, Office of Water, Washington, DC.
USGS. 2006. Hydrology and Flood Profiles of Duck Creek and Jordan Creek Downstream of Egan
Drive, Juneau, Alaska. United States Geological Survey.
USGS. 2004. Baseline Characteristics of Jordan Creek, Juneau, Alaska. Host, R.H. and E.G. Neal.
United States Geological Survey. Open-File Report 2004-1220.