Embed Size (px)
Citation preview
Update on OrganizationalDevelopment Issues
Presented By: Patrick Thomson, Director of HumanResources and Organizational Development
and
Joanne Kelly, Co-Ordinator of OrganizationalDevelopment, Safety and Wellness
Date: October 25th, 2006
! Setting the stage for Organizational Renewal:
- Six years ago CGS formed after amalgamation of8 municipalities and 5 Library Boards into one (1)Employer, with a reduction of 58 Managementstaff.
- In 2004 Council retained Berkeley ConsultingGroup to undertake an organization review.
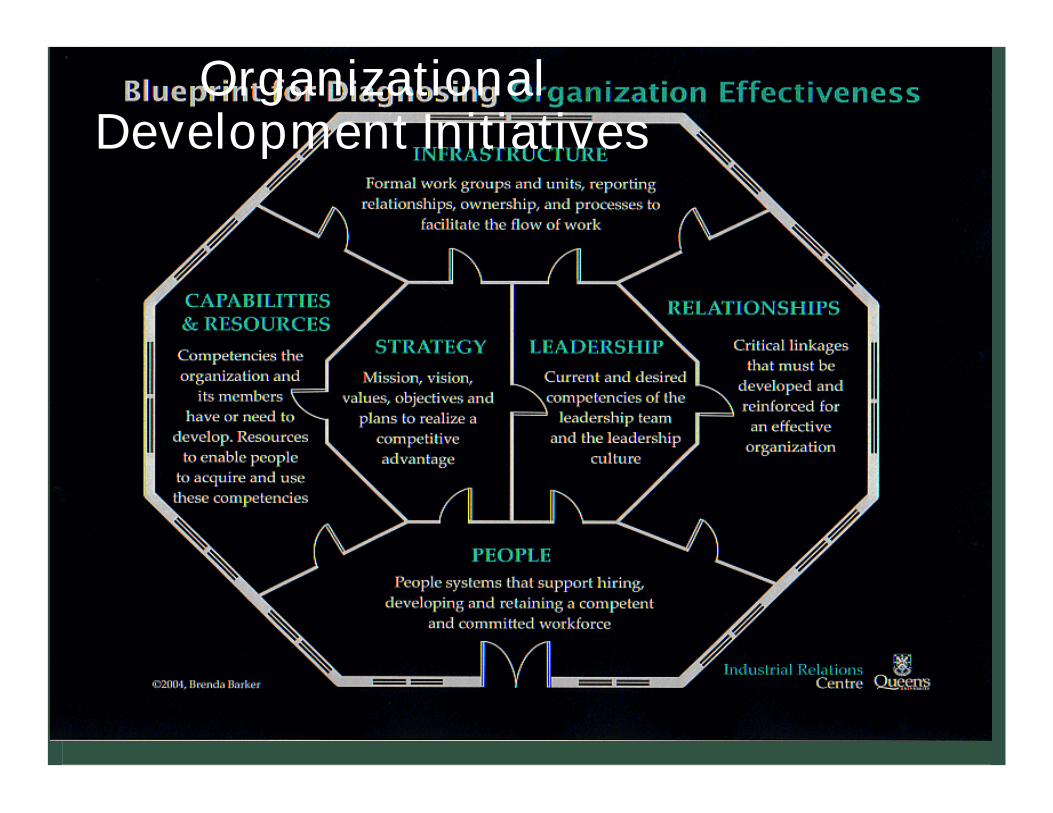
OrganizationalDevelopment Initiatives
! 2005 Organizational“Blueprint"represented the nextstep toward building an organization that is morestrategic, accountable and innovative.
! New management structure makes it possible forCity staff at all levels to deliver high-quality servicesand assist Council with its vision for our City.
! New organizational structure will be fullyimplemented by 2007.
OrganizationalDevelopment Initiatives
! The Blueprint of 2005 will achieve $1.9 M in savings(reduction of 20 staff, reduction in tiers).
! Blueprint asks everyone to do more with less, but weneed to change way of doing business for it to beeffective.
OrganizationalDevelopment Initiatives

! On Organizational Development, the BerkeleyReport highlighted:
- Need for resources in HR/OD to move fromemphasizing control processes (Labour Relationsand Compliance) to enhancing organizationaleffectiveness.
- Need to invest in Organizational Development,especially Training and Succession Planning.
OrganizationalDevelopment Initiatives
! - With the revised structure in place,“theannualizedsavings of $2 -$2.5M… about half of which shouldbe invested in an upgraded human resourcescapability”.
! Genesis for this Report to Council (per Resolution2006-515) staff directed to come forward withrecommendations on how best to achieve theOrganizational Development goals.
OrganizationalDevelopment Initiatives
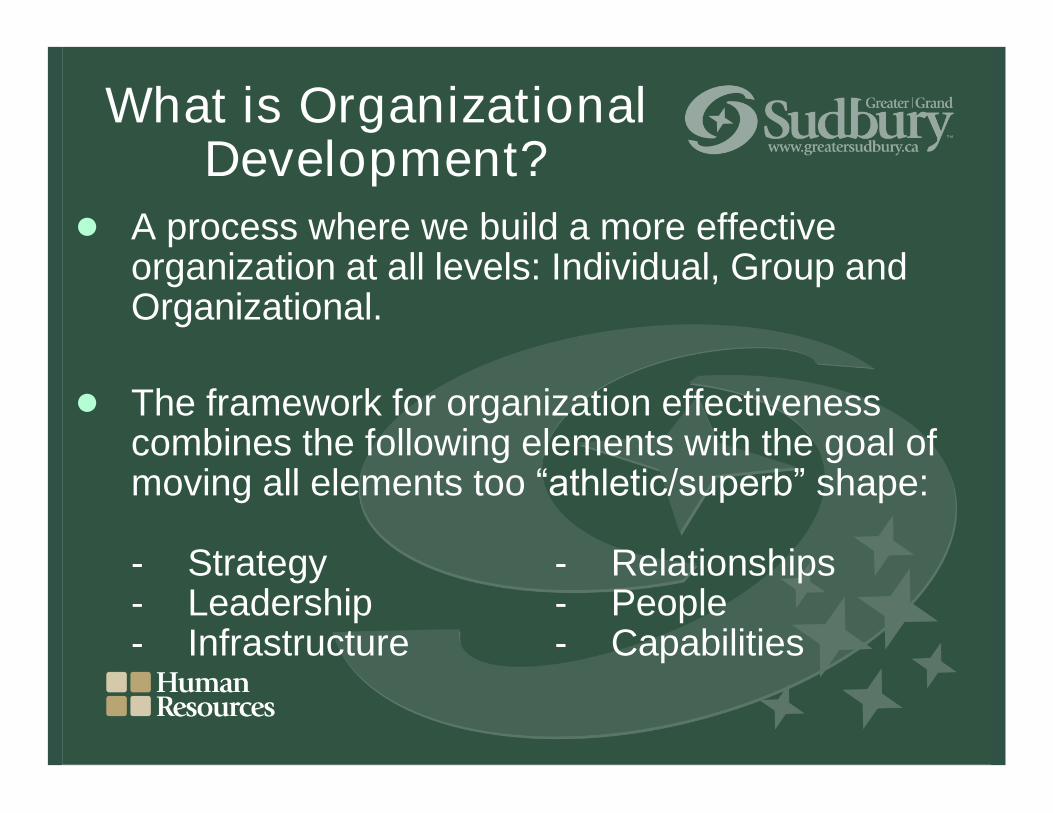
! A process where we build a more effectiveorganization at all levels: Individual, Group andOrganizational.
! The framework for organization effectivenesscombines the following elements with the goal ofmoving all elements too“athletic/superb”shape:
- Strategy - Relationships- Leadership - People- Infrastructure - Capabilities
What is OrganizationalDevelopment?
OrganizationalDevelopment Initiatives
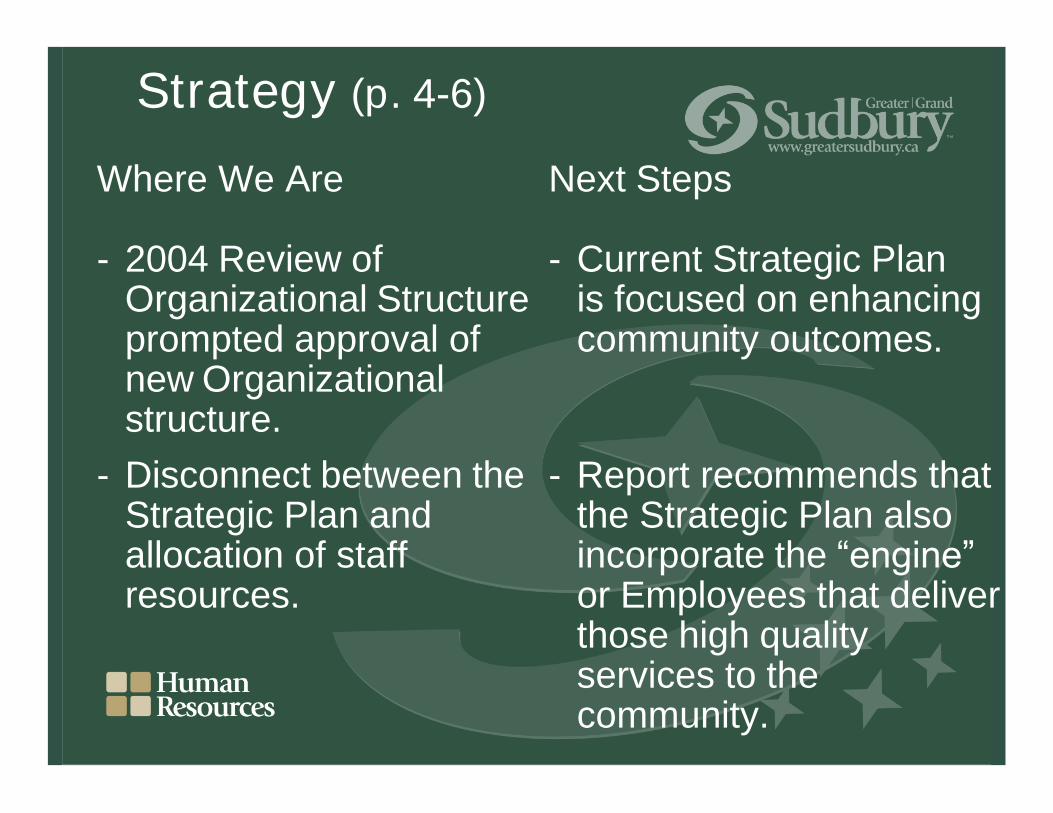
Where We Are Next Steps
- 2004 Review of - Current Strategic PlanOrganizational Structure is focused on enhancingprompted approval of community outcomes.new Organizationalstructure.
- Disconnect between the - Report recommends thatStrategic Plan and the Strategic Plan alsoallocation of staff incorporate the“engine”resources. or Employees that deliver
those high qualityservices to thecommunity.
Strategy (p. 4-6)
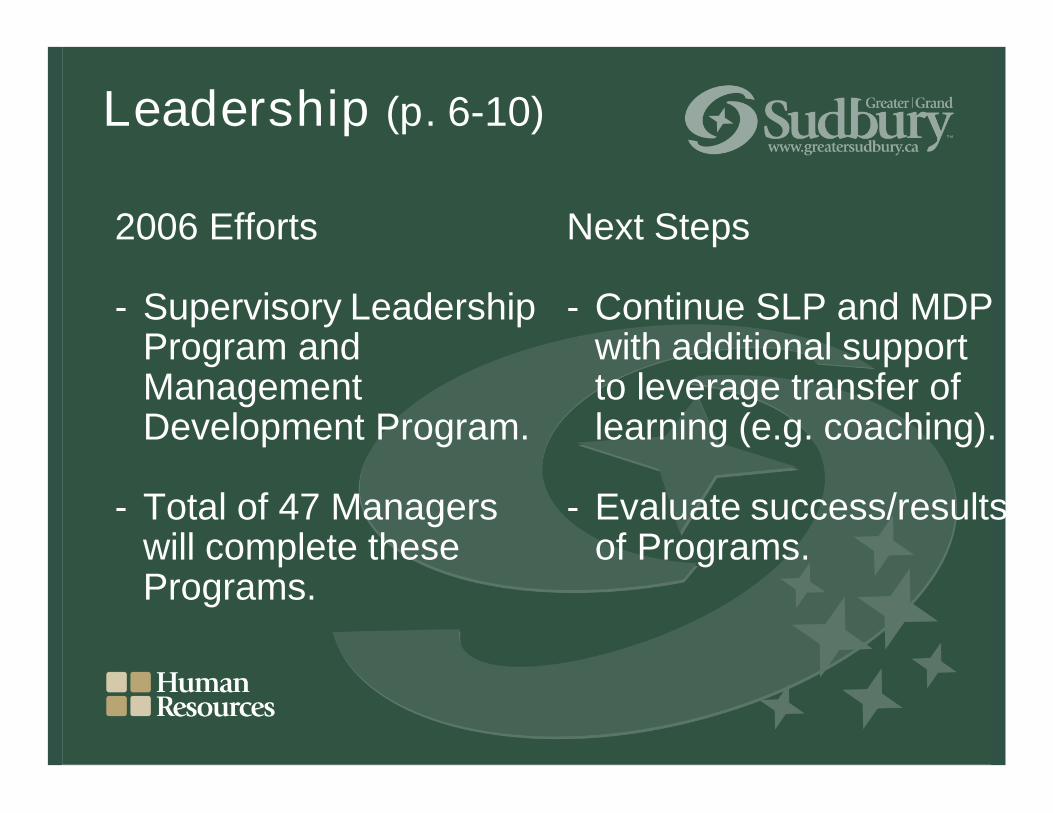
2006 Efforts Next Steps
- Supervisory Leadership - Continue SLP and MDPProgram and with additional supportManagement to leverage transfer ofDevelopment Program. learning (e.g. coaching).
- Total of 47 Managers - Evaluate success/resultswill complete these of Programs.Programs.
Leadership (p. 6-10)
2006 Efforts Next Steps
- Preliminary work on - Develop competencycritical leadership model.competencies andreview of“Dowe have - Use assessment tools todevelopmental initiatives have targettedto create and retain the development plans forleadershiptalent?”. current and future
leaders.
Leadership (p. 6-10)
2006 Efforts Next Steps
- Blueprint implementation - Develop map forwithout clear authority authority andand accountability accountability withframework. work to be done to
align businessprocesses to the map.
- Roles have not beenclarified or processeschanged to reflect newstructure.
Infrastructure (p. 10)
2006 Efforts Next Steps
- Management offsite - Continue managementmeetings to: off-site meetings with- foster increased dedicated funds for
understanding of outside facilitator/Corporate/ trainer to foster theDevelopmental importance of internalobjectives. relationships.
- discuss corporate priorities.
- address Work-Life balance issues.
Relationships (p. 10-11)
Where We Are Next Steps
- Paper driven Recruitment - Move forward withsystem with need for eRecruitadditional resources within implementation.HR to support recruitmentefforts. - Allocate additional
resources to further- Recognition that labour enhance ability to
market is increasingly fill upcomingcompetitive for some vacancies.classifications.
People-Recruitment andSelection (p. 12-14)
Where We Are Next Steps
- Focus on Legislative - Enhance ability toCompliance - by end of achieve goals and2006, 3 of 6 Pay Equity deal with increasingPlans will be posted. pressures from
changes in labour- Recognized need to market.
increase efforts to achievecompensation goals (attract,retain and motivate).
People-Compensation andRetention (p. 14-15)
Where We Are Next Steps
- New Management - Expand use of MPDR.Performance DevelopmentProgram (MPDR) in place - Enhance process forfor top 3 tiers. support/coaching and- Increased goal feedback mechanism
congruence. for Unionized workforcecompetencies. with development and
- Personal and rollout of EmployeeProfessional Performance andDevelopment Planning. Development Review
System.
People-PerformanceImprovement (p. 15-17)
2006 Efforts Next Steps
- Implemented Action - Make a long termItems from 2003 investment to continueWellness Survey: efforts toward workplace
wellness and allow for- Wellness Cards. longitudinal studies to- YMCA Discount. ensure/monitor return on- Wellness Fairs investment.- In-services on
numerous topics.
People-EmployeeWellness (p. 17-18)
Where We Are
- Demographic Profile: estimate that 25% of totalpopulation will be eligible to retire within the next 5 to10 years.
- Approximately 35% of Management Group will beeligible to retire within 10 years.
People-SuccessionPlanning (p. 18-26)
P e rc e n ta g e o fMa n a g e me n tGro u p E lig ib le to R e tire Ov e rth e
N e xt1 0Y e a rs
0%
5 0%
People-SuccessionPlanning (p. 18-26)
Where We Are Continued- Review of Key Positions identified within the top 3
tiers of the organization: 8 key positions wherethere is a potential Succession Issue (within 3 to 6years).
- During Succession Planning meetings with SMT, anumber of other positions (both Union and NonUnion) identified as posing significant successionissues in the next 3 to 6 years. The list spannedapproximately 24 classifications and 90 staff.
People-SuccessionPlanning
Next Steps- Pre-hiring.- Post-Retirement Re-hiring/Contract Employment.- Phased Retirement.- Leadership developmental opportunities/
Secondments.- Job Sharing.- Leverage opportunities with external organizations.- Long-term strategies for hard to recruit positions.
People-SuccessionPlanning
2006 Efforts Next Steps
- Launching of Training - Continue to enhanceCalendar with training capabilities of staffinitiatives to develop or through expansion ofenhance the competency training opportunitiesof Employees. offered through the
Training Calendar.
People-SuccessionPlanning
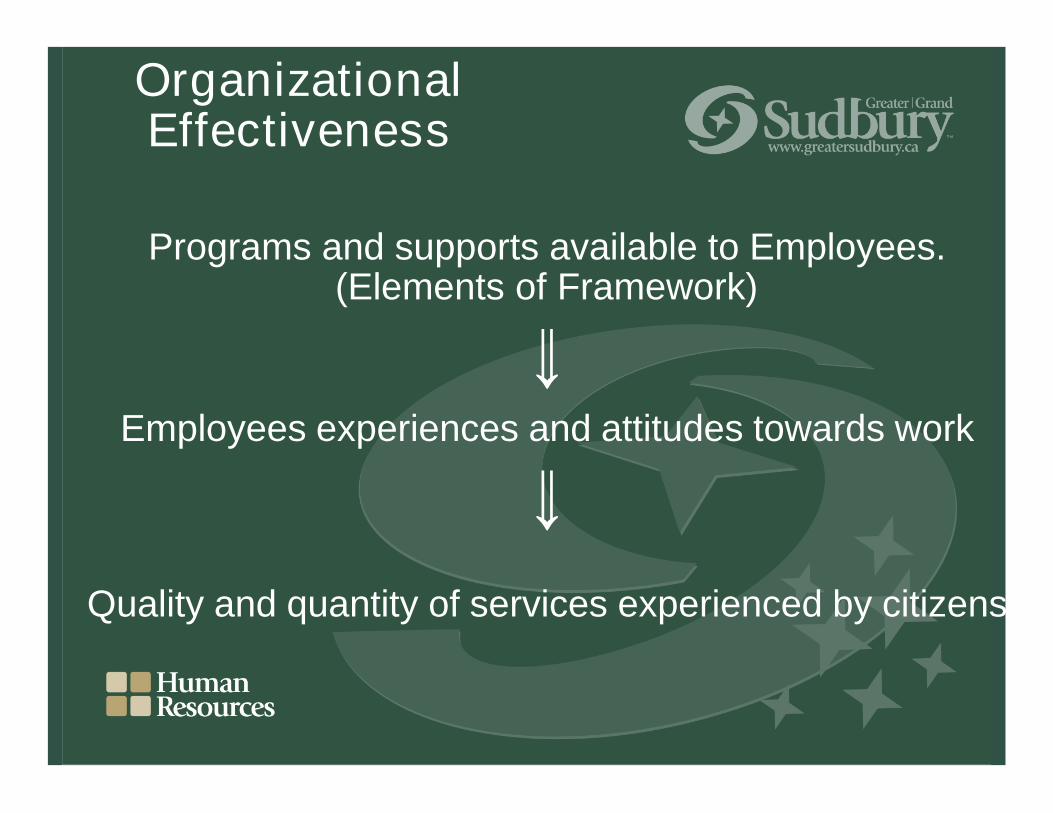
Programs and supports available to Employees.(Elements of Framework)
Employees experiences and attitudes towards work
Quality and quantity of services experienced by citizens
OrganizationalEffectiveness
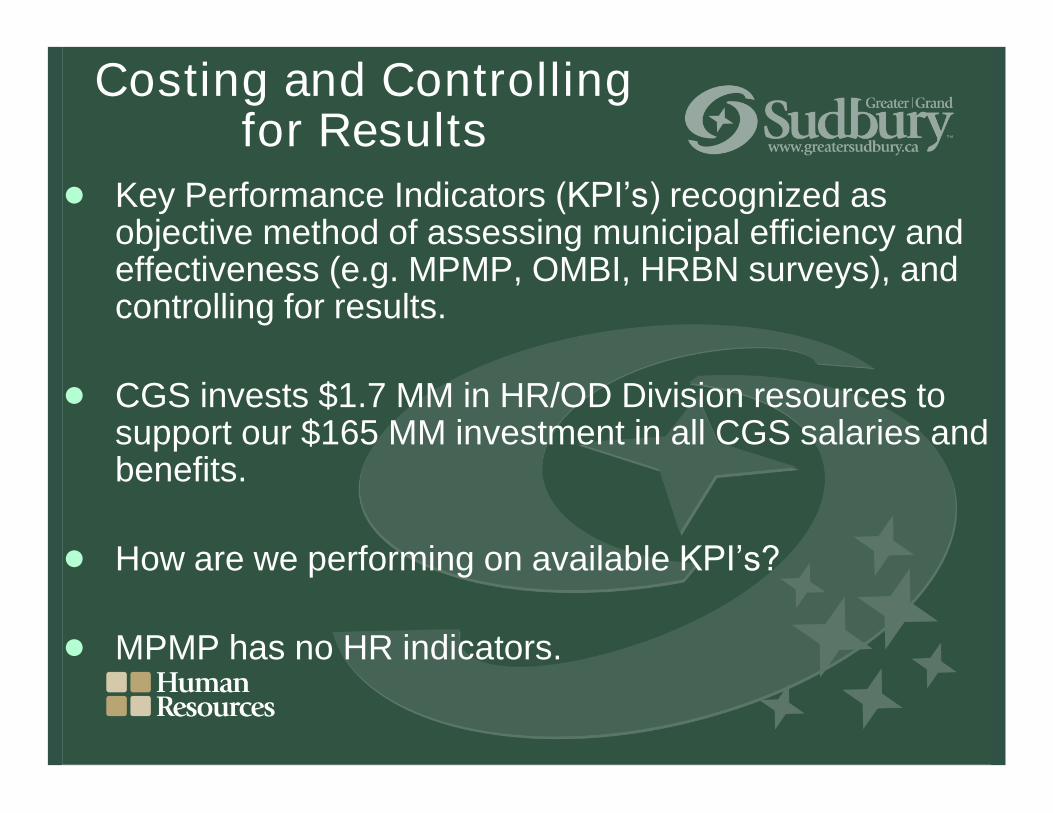
! Key Performance Indicators(KPI’s)recognized asobjective method of assessing municipal efficiency andeffectiveness (e.g. MPMP, OMBI, HRBN surveys), andcontrolling for results.
! CGS invests $1.7 MM in HR/OD Division resources tosupport our $165 MM investment in all CGS salaries andbenefits.
! How are we performing on availableKPI’s?
! MPMP has no HR indicators.
Costing and Controllingfor Results
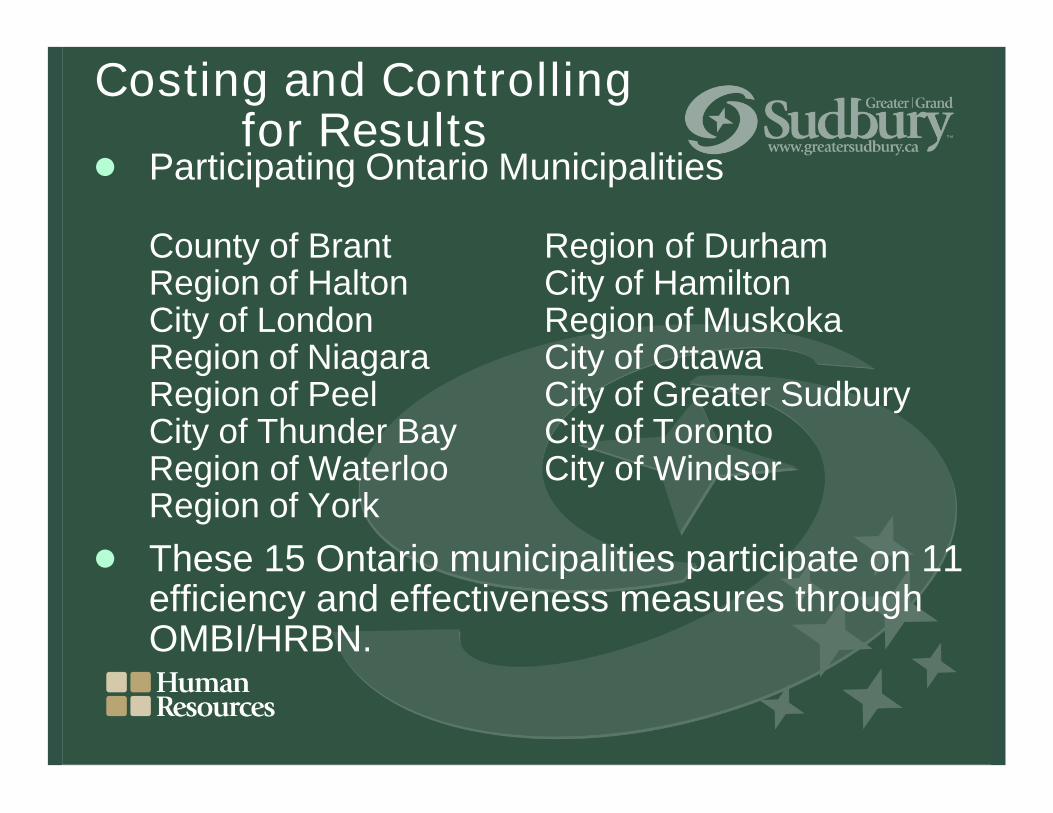
! Participating Ontario Municipalities
County of Brant Region of DurhamRegion of Halton City of HamiltonCity of London Region of MuskokaRegion of Niagara City of OttawaRegion of Peel City of Greater SudburyCity of Thunder Bay City of TorontoRegion of Waterloo City of WindsorRegion of York
! These 15 Ontario municipalities participate on 11efficiency and effectiveness measures throughOMBI/HRBN.
Costing and Controllingfor Results
! OMBI participants had agreed to not release theresults of other participating municipalities into thepublic domain (hence their concealment on thefollowing charts).
! Here’sa sample of CGS’ relative performance:
Costing and Controllingfor Results
Costing and Controllingfor Results
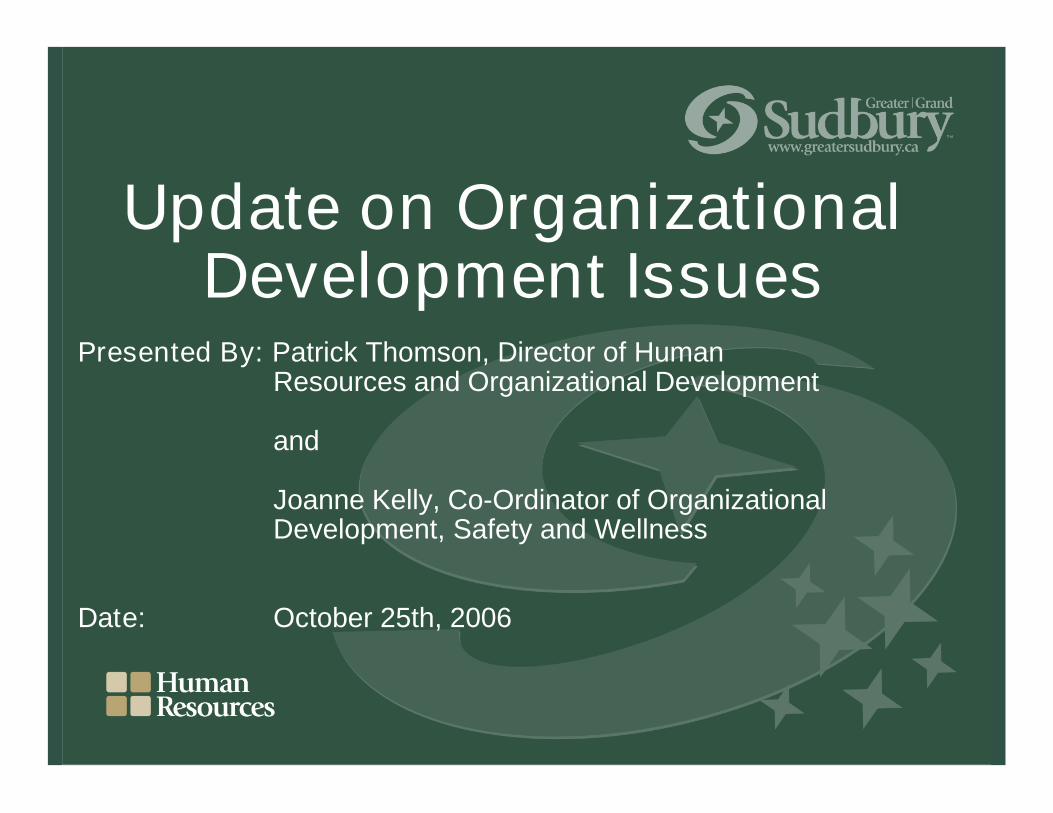
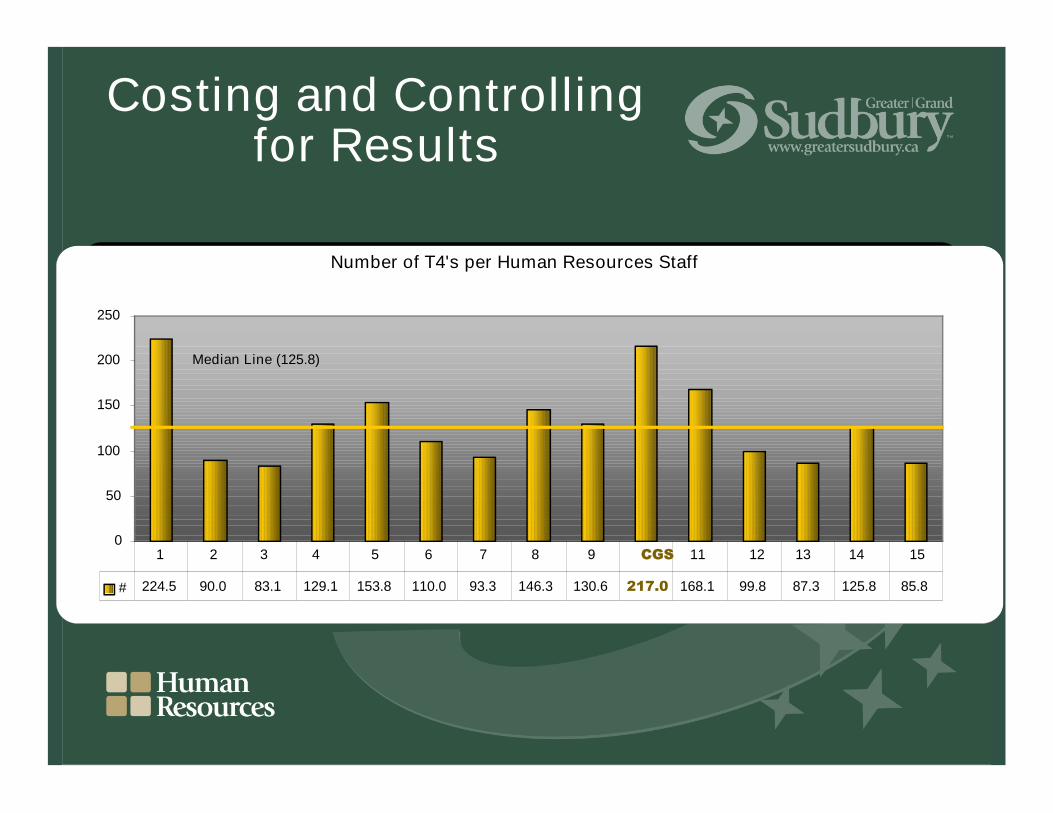
Number of T4's per Human Resources Staff
0
50
100
150
200
250
# 224.5 90.0 83.1 129.1 153.8 110.0 93.3 146.3 130.6 217.0 168.1 99.8 87.3 125.8 85.8
1 2 3 4 5 6 7 8 9 CGS 11 12 13 14 15
Median Line (125.8)
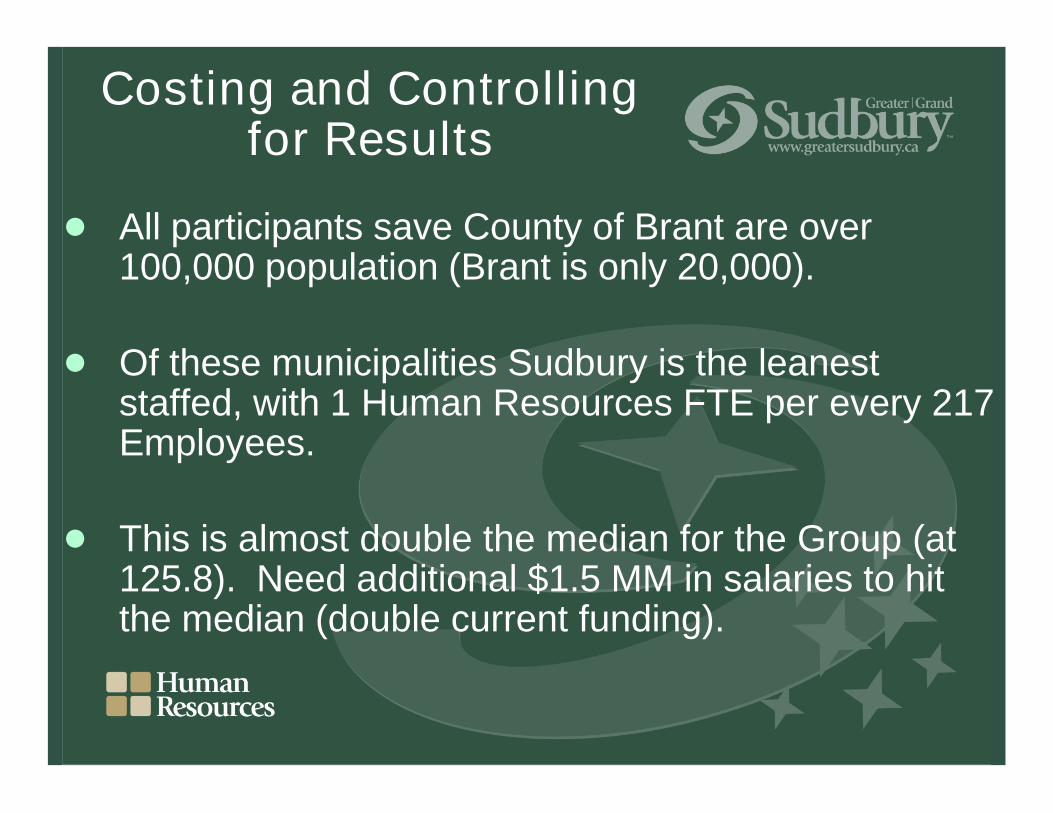
! All participants save County of Brant are over100,000 population (Brant is only 20,000).
! Of these municipalities Sudbury is the leaneststaffed, with 1 Human Resources FTE per every 217Employees.
! This is almost double the median for the Group (at125.8). Need additional $1.5 MM in salaries to hitthe median (double current funding).
Costing and Controllingfor Results
! We are efficient, but are we effective?
! A sample of effectiveness measures:
Costing and Controllingfor Results
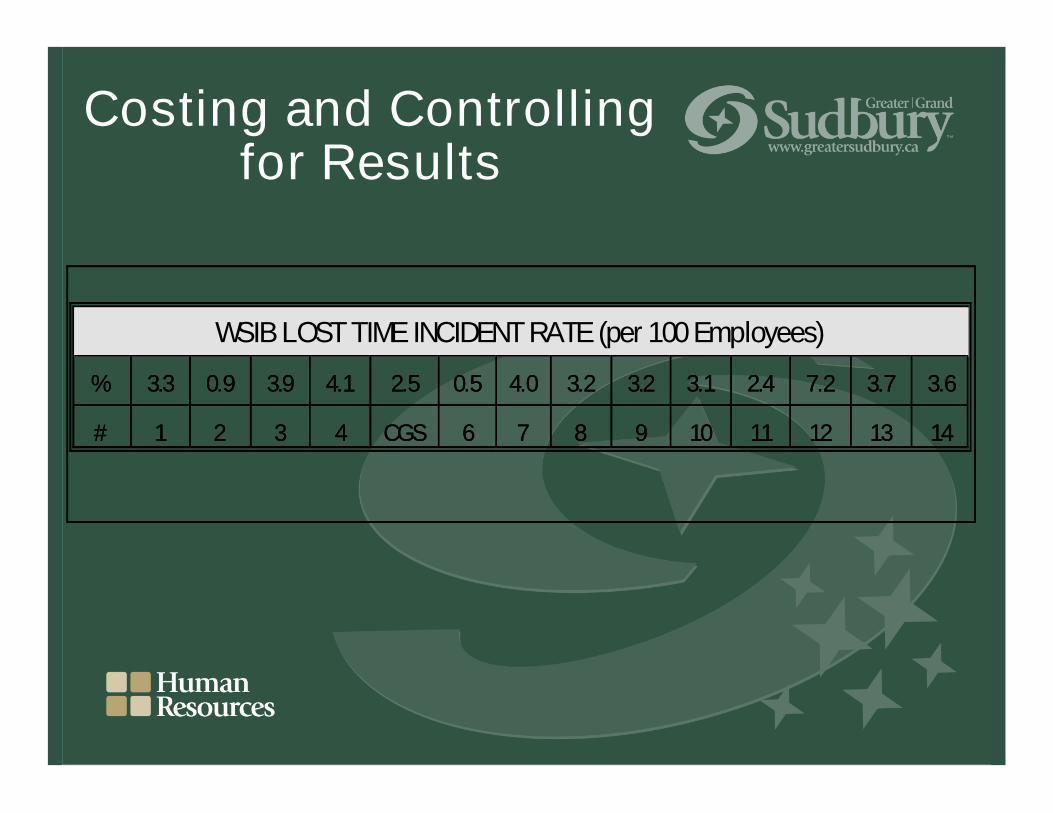
WSIBLOSTTIMEINCIDENTRATE(per100Employees)
% 3.3 0.9 3.9 4.1 2.5 0.5 4.0 3.2 3.2 3.1 2.4 7.2 3.7 3.6
# 1 2 3 4 CGS 6 7 8 9 10 11 12 13 14
WSIBLOSTTIMEINCIDENTRATE(per100Employees)
% 3.3 0.9 3.9 4.1 2.5 0.5 4.0 3.2 3.2 3.1 2.4 7.2 3.7 3.6
# 1 2 3 4 CGS 6 7 8 9 10 11 12 13 14
Costing and Controllingfor Results
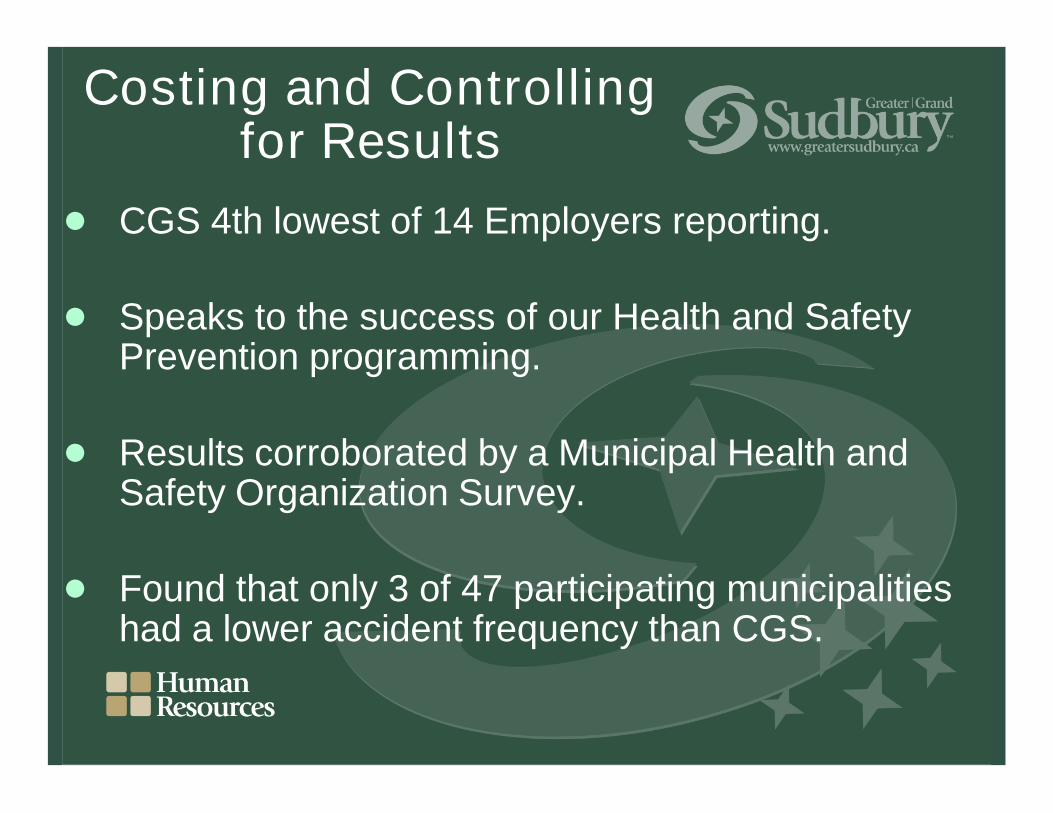
! CGS 4th lowest of 14 Employers reporting.
! Speaks to the success of our Health and SafetyPrevention programming.
! Results corroborated by a Municipal Health andSafety Organization Survey.
! Found that only 3 of 47 participating municipalitieshad a lower accident frequency than CGS.
Costing and Controllingfor Results
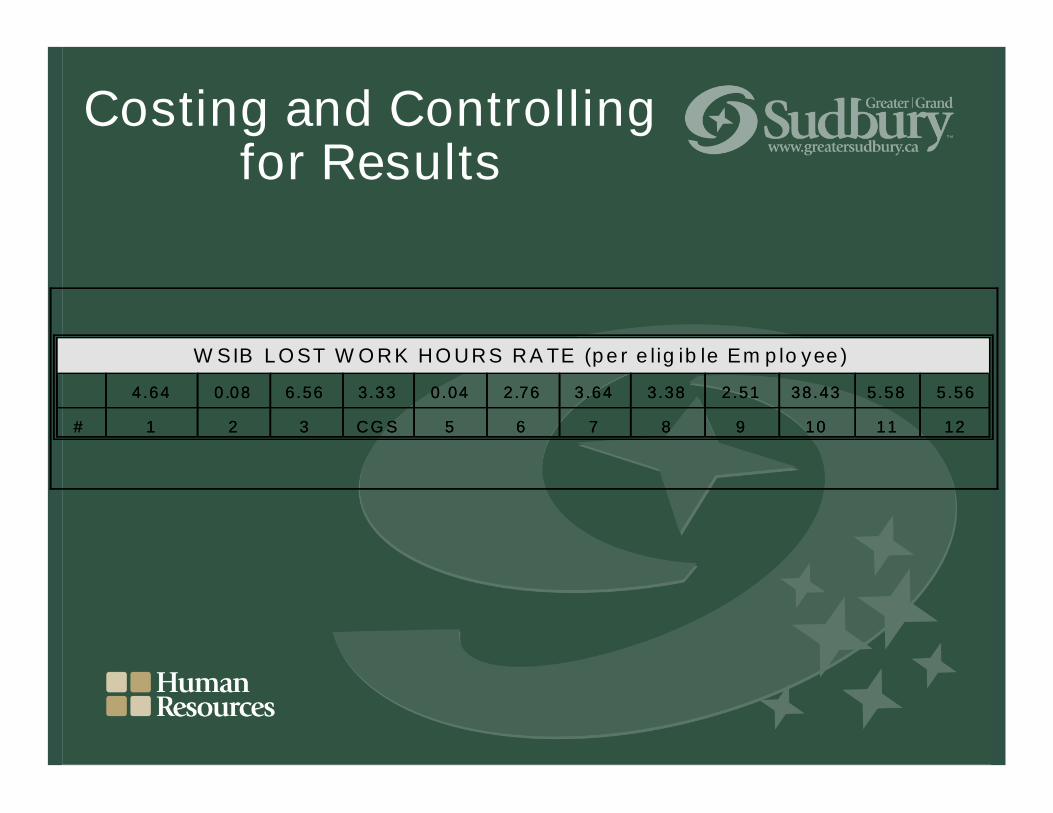
W SIB LO ST W O RK HO URS RATE (pe r e lig ib le Em plo yee )
4.64 0 .08 6.56 3.33 0.04 2.76 3 .64 3.38 2.51 38.43 5.58 5.56
# 1 2 3 C G S 5 6 7 8 9 10 11 12
W SIB LO ST W O RK HO URS RATE (pe r e lig ib le Em plo yee )
4.64 0 .08 6.56 3.33 0.04 2.76 3 .64 3.38 2.51 38.43 5.58 5.56
# 1 2 3 C G S 5 6 7 8 9 10 11 12
Costing and Controllingfor Results
! Measures Municipal success at getting Employeesinjured at work back to work.
! CGS ranks 5th of 12 Municipal Employers reporting,with ½ the average number of days lost.
Costing and Controllingfor Results
! Suggests that CGS's efforts to return disabledEmployees to work quickly, is meeting with success.
! If we had average performance on this indicator, itwould equate to an additional 1,124 days off, orapproximately $260,000 in additional lostproductivity.
Costing and Controllingfor Results
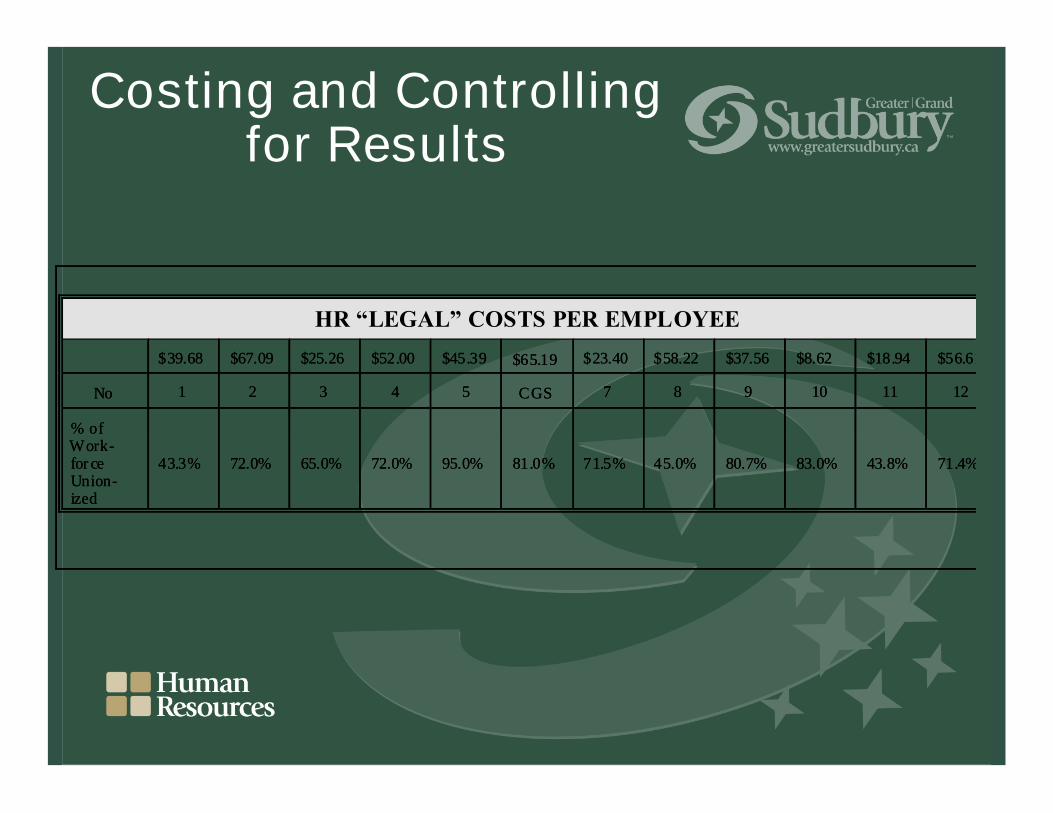
HR “LEGAL” COSTS PER EMPLOYEE
$39.68 $67.09 $25.26 $52.00 $45.39 $65.19 $23.40 $58.22 $37.56 $8.62 $18.94 $56.61
No 1 2 3 4 5 CGS 7 8 9 10 11 12
% ofWork-forceUnion-ized
43.3% 72.0% 65.0% 72.0% 95.0% 81.0% 71.5% 45.0% 80.7% 83.0% 43.8% 71.4%
HR “LEGAL” COSTS PER EMPLOYEE
$39.68 $67.09 $25.26 $52.00 $45.39 $65.19 $23.40 $58.22 $37.56 $8.62 $18.94 $56.61
No 1 2 3 4 5 CGS 7 8 9 10 11 12
% ofWork-forceUnion-ized
43.3% 72.0% 65.0% 72.0% 95.0% 81.0% 71.5% 45.0% 80.7% 83.0% 43.8% 71.4%
Costing and Controllingfor Results

! CGS is above average on this indicator (municipalaverage spent $44.77 per Employee on legal costs).
! Legal costs have reduced consistently year overyear: $303,000. in 2003, $241,000. in 2004,$168,000. in 2005 (per above), year end estimate in2006 $150,000.
Costing and Controllingfor Results
! Note that legal expenses are in direct correlation todegree of Unionization (only Ottawa and York havea higher degree of Unionized Employees thanSudbury - at 80%).
Costing and Controllingfor Results

! Other indicators show similar results.
! Bottom line: CGS either performing well orimproving on all indicators where we have placedemphasis/resources (Legal Compliance, LabourRelations, Health and Safety).
Costing and Controllingfor Results

! Will only continue to improve in areas outlined in thisreport with additional investment.
- 2003 Organizational Culture Employee Survey.- 2004 Berkeley Interview Findings.- 2006 NQI Cross-Sectional Survey.
! All these surveys suggest urgent need forinvestment in Organizational Development (i.e. ourEmployees are telling us there is a problem).
Costing and Controllingfor Results
! Report includes allocation of the OD budget tomeasure OD performance indicators to furthercontrol for results.
Costing and Controllingfor Results
Costing and Controllingfor Results
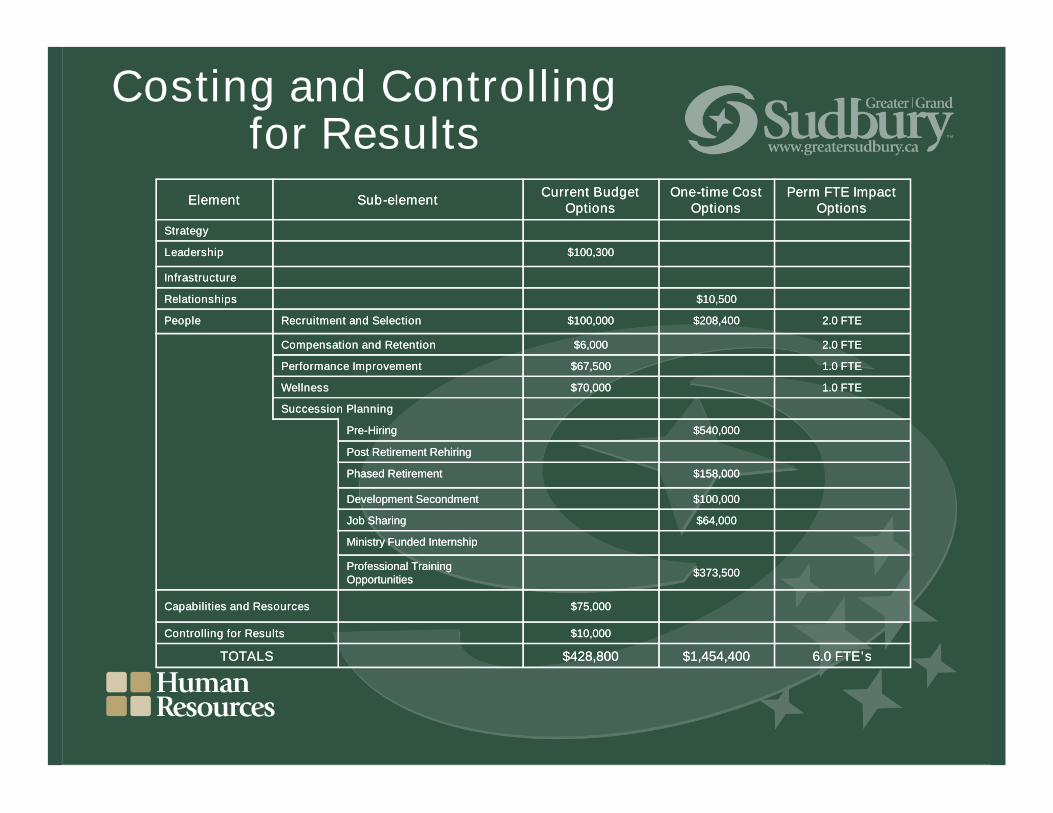
$75,000Capabilities and Resources
$540,000Pre-Hiring
Phased Retirement
$10,000Controlling for Results
6.0 FTE's$1,454,400$428,800TOTALS
$373,500Professional TrainingOpportunities
Ministry Funded Internship
$64,000Job Sharing
$100,000Development Secondment
$158,000
Post Retirement Rehiring
Succession Planning
1.0 FTE$70,000Wellness
1.0 FTE$67,500Performance Improvement
2.0 FTE$6,000Compensation and Retention
2.0 FTE$208,400$100,000Recruitment and SelectionPeople
$10,500Relationships
Infrastructure
$100,300Leadership
Strategy
One-time CostOptions
Perm FTE ImpactOptions
Current BudgetOptions
Sub-elementElement

! A Staff request for reinvestment of $500,000 of the$1.9 MM savings from Blueprint, as recommendedby Berkeley, will be brought forward as a 2007Current budget option
! Reinvestment housed in the HR/OD Division,allocated in priority sequence as determined by theSMT.
! This Report recommends allocation of the $260,000received for the first Kashechewan evacuation asinterim step.
Costing and Controllingfor Results
! This re-investment is key to the 2nd phase of theOrganizational Transformation, post amalgamation.
! Reinvestment required to ensure all organizationalelements supporting Employees are in“shape”tomeet the stated Municipal goals of providing qualitymunicipal services at reasonable cost.
Costing and Controllingfor Results
! Critical nature of the reinvestment recognized byBerkeley:
“Makeno mistake; these changes are only a start,and much more needs to be done. Effectivemanagerial leadership, a supportive politicalleadership, and a motivated capable workforce, arecritical to delivering value added services tocitizens.”
Costing and Controllingfor Results